Embed Size (px)
Citation preview

UV-VIS Spectroscopy - Chemical Analysis
Chemical Analysis Solutions Unit
S i R S PhDSonia R. Sousa PhDMarketing Manager - Spectroscopy21 January 2009
Group/Presentation TitleAgilent Restricted
Month ##, 200XPage 1

Topics
• Basic UV-VIS Theory
UV VIS history and product offerings• UV-VIS history and product offerings
• key Instrumental parameters
• Method development
• Sample handling and measurements
• Questions and answers
Group/Presentation TitleAgilent Restricted
Month ##, 200XPage 2

THEORYTHEORY
Group/Presentation TitleAgilent Restricted
Month ##, 200XPage 3

Theory – UV-VIS
The wavelength and amount of light that a compound absorbs depends on its molecular structure and the concentration of the compound used.
Concentration dependencefollows Beer’s Law
A=εbcA = -log T
A εbcA = is absorbance (no units, since A = log(P0 / P )ε = the molar absorbtivity with units of L mol-1 cm-1
b = the path length of the sample (typically in cm)
Io = incident light intensityI = Intensity of light transmitted through solution
T= transmittance
Group/Presentation TitleAgilent Restricted
p g p ( yp y )c = the concentration of the compound in solution mol L-1
through solution

Electronic Excitation by UV-VIS Spectroscopy

Energy Scale in UV-VIS Spectroscopy
Ref Fundamental of Molecular Spectroscopy (C N Banwell)
Group/Presentation TitleAgilent Restricted
Month ##, 200XPage 6
Ref. Fundamental of Molecular Spectroscopy (C. N. Banwell)
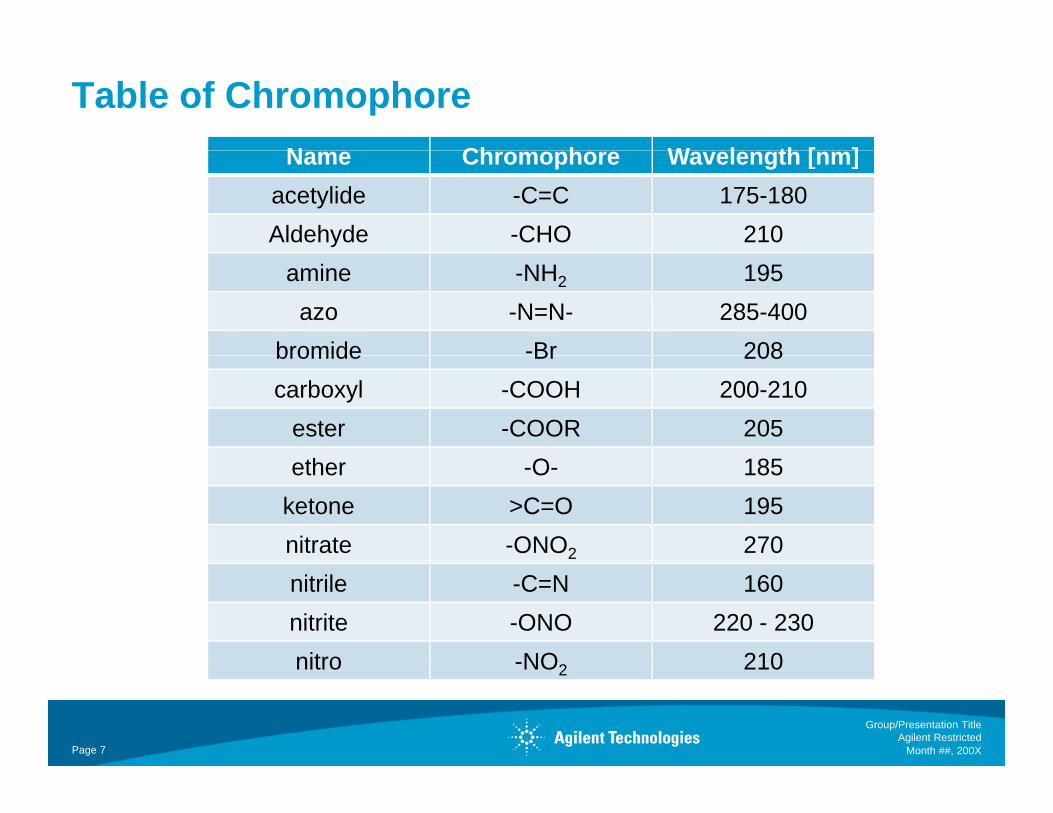
Table of ChromophoreN Ch h W l th [ ]Name Chromophore Wavelength [nm]
acetylide -C=C 175-180Aldehyde -CHO 210
amine -NH2 195azo -N=N- 285-400
bromide -Br 208bromide Br 208carboxyl -COOH 200-210
ester -COOR 205O 18ether -O- 185
ketone >C=O 195nitrate -ONO2 270nitrile -C=N 160nitrite -ONO 220 - 230nitro -NO 210
Group/Presentation TitleAgilent Restricted
Month ##, 200XPage 7
nitro -NO2 210

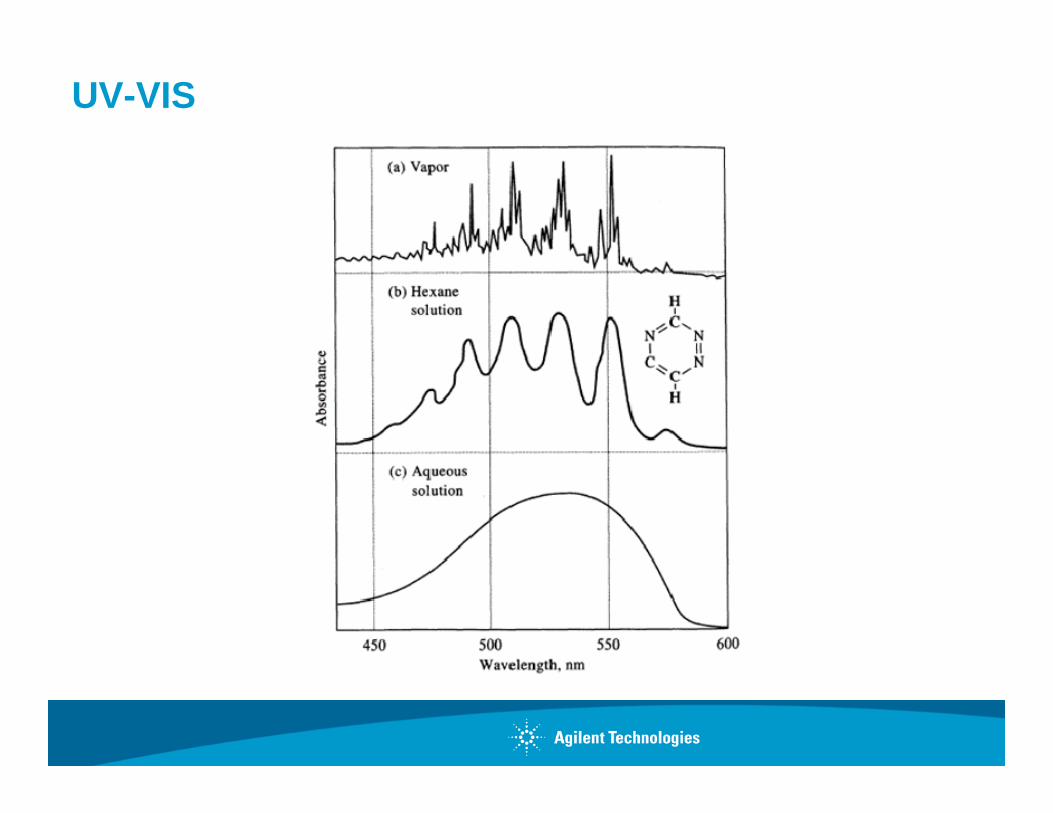
UV-VIS
Naphthalene Anthracene Pyrene

Conjugated Carbonyl Compounds
UV-VIS

HISTORY AND PRODUCTHISTORY AND PRODUCT OFFERINGS
Group/Presentation TitleAgilent Restricted
Month ##, 200XPage 11
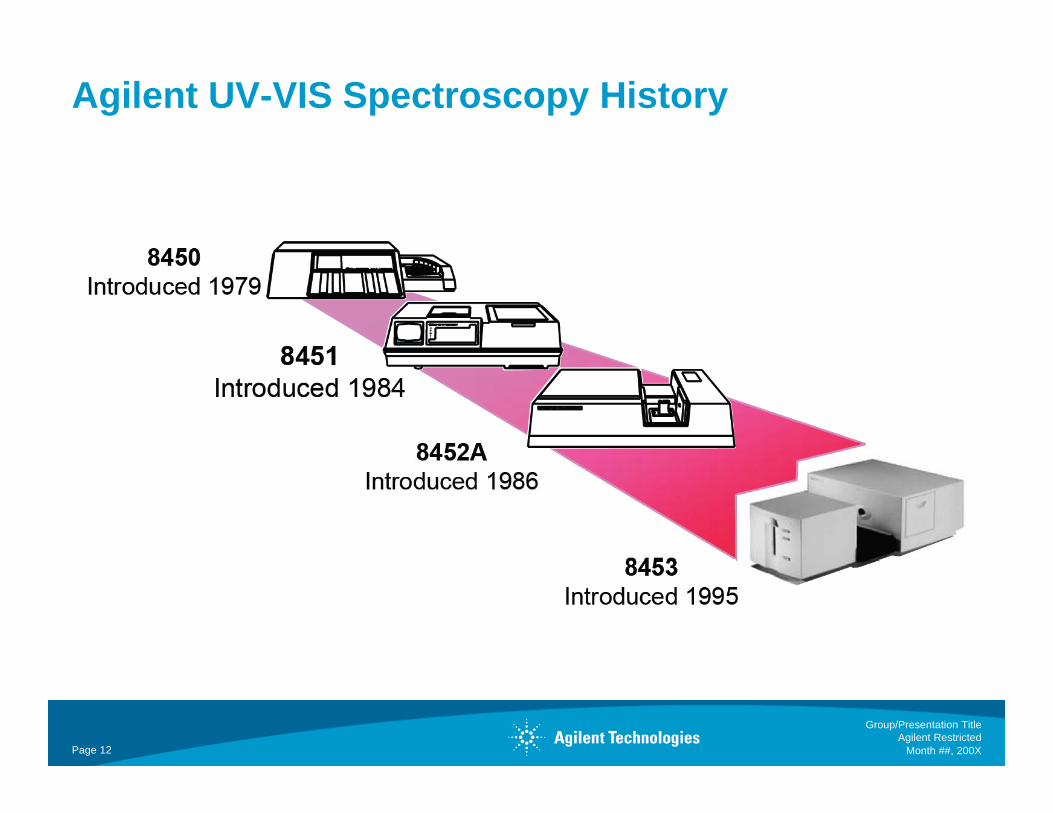
Agilent UV-VIS Spectroscopy History
Group/Presentation TitleAgilent Restricted
Month ##, 200XPage 12

Product Offerings and Solutions
• Hardware and Software
Accessories• Accessories
• Fully test systems
• Compliance services for IQ/OQ/PV
• Supplies
G1120A Multicelltransport
89090A Tempco
Group/Presentation TitleAgilent Restricted
Month ##, 200XPage 13
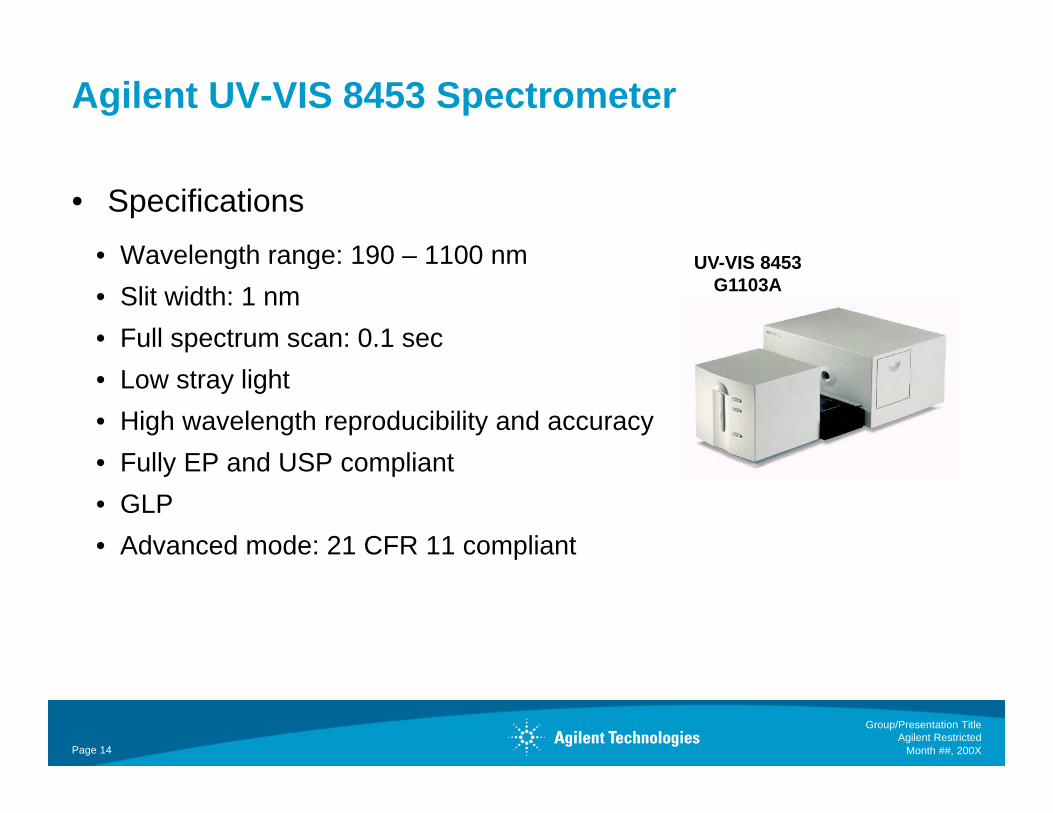
Agilent UV-VIS 8453 Spectrometer
• Specifications• Wavelength range: 190 1100 nm• Wavelength range: 190 – 1100 nm• Slit width: 1 nm• Full spectrum scan: 0.1 sec
UV-VIS 8453G1103A
• Low stray light • High wavelength reproducibility and accuracy
Fully EP and USP compliant• Fully EP and USP compliant• GLP• Advanced mode: 21 CFR 11 compliant
Group/Presentation TitleAgilent Restricted
Month ##, 200XPage 14

Spectrometer Instrument DesignDual Beam Spectrometerp
Diode Array SpectrometerDiode Array Spectrometer
Group/Presentation TitleAgilent Restricted
Month ##, 200XPage 15
Conventional single beam spectrometer
Diode Array Advantages
• Simple mechanical and optical design
Open sample area• Open sample area
• Fixed arrangement of grating and detectors
• Fast acquisition of complete spectra
• Statistics
Group/Presentation TitleAgilent Restricted
Month ##, 200XPage 16

Open Sample Area
Reverse Optics
Room light cannot reach detector• Room light cannot reach detector• Narrow “acceptance angle” after sample• Geometry of spectrograph• Geometry of spectrograph
• Easy and convenient access• Better productivityBetter productivity• Less error prone
• Easy installation of acessories
Group/Presentation TitleAgilent Restricted
Month ##, 200XPage 17

ChemStation Software Mode Structure
Group/Presentation TitleAgilent Restricted
Month ##, 200XPage 18
Common Features to all Applications
• Universal data structure
• Common basic features for • Instrument control• Accessory configuration and handling• Method handling• Raw data storage, retrieval and export
Diff t i d f d t d lt• Different view modes for raw data and results• Graphical window• Table window• Table window
• New: Access to Agilent OpenLab Enterprise Content Management (ECM)
Group/Presentation TitleAgilent Restricted
Month ##, 200XPage 19

Solution for General Purpose
Group/Presentation TitleAgilent Restricted
Month ##, 200XPage 20
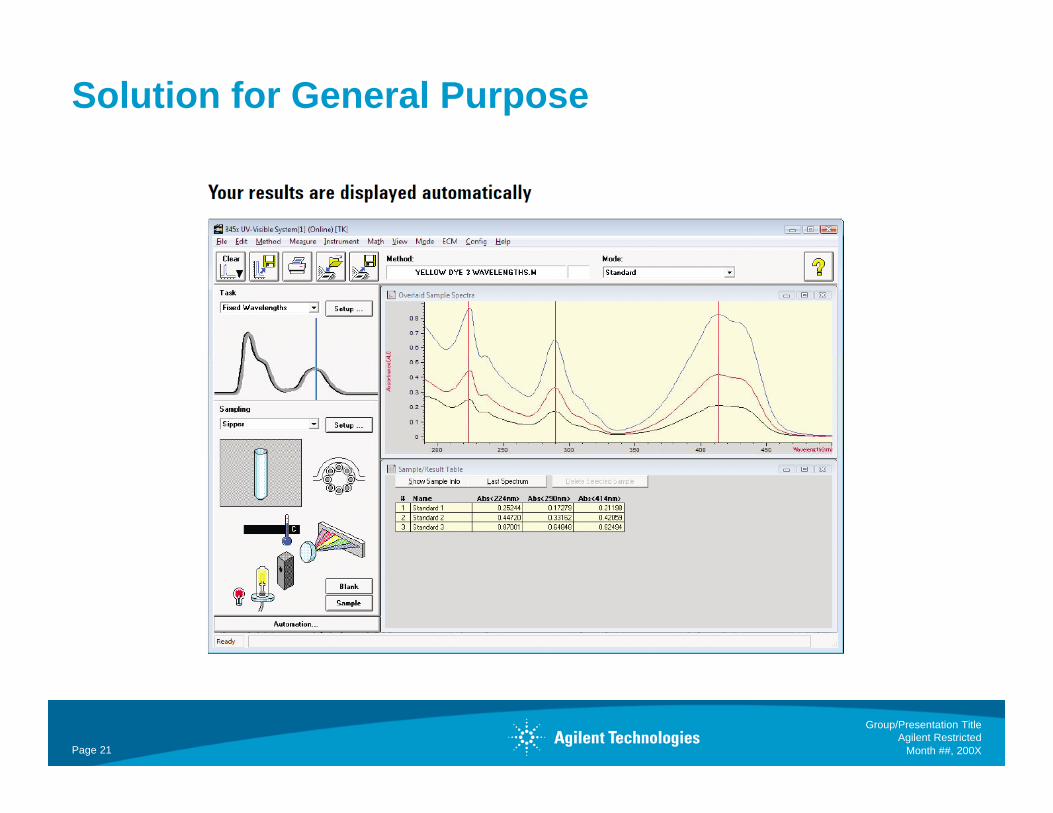
Solution for General Purpose
Group/Presentation TitleAgilent Restricted
Month ##, 200XPage 21

General Purpose SW - Key Features
• Graphical User Interface (GUI) with integrated status display
Includes all common application tasks• Includes all common application tasks
• Single dialog box for method setup
• Easy automation
• One page report
• Verification and diagnostics
• Execute advances method capabilityp y
Group/Presentation TitleAgilent Restricted
Month ##, 200XPage 22
Solution for Research and Development
Group/Presentation TitleAgilent Restricted
Month ##, 200XPage 23
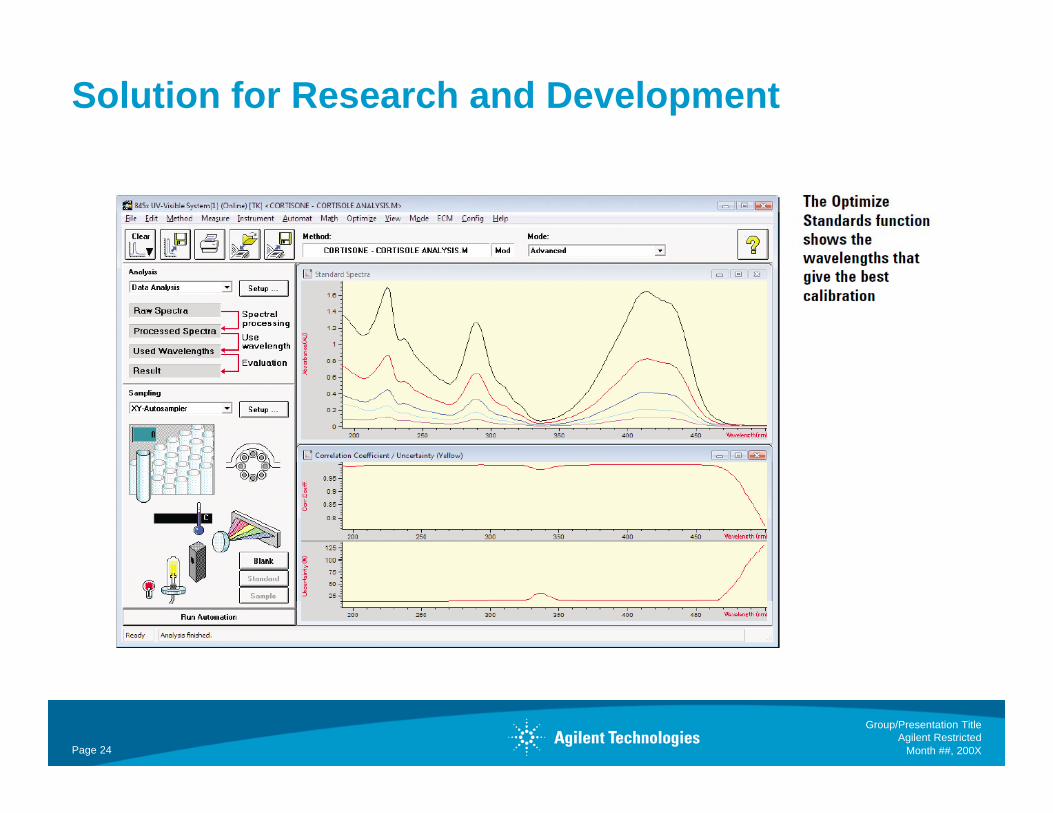
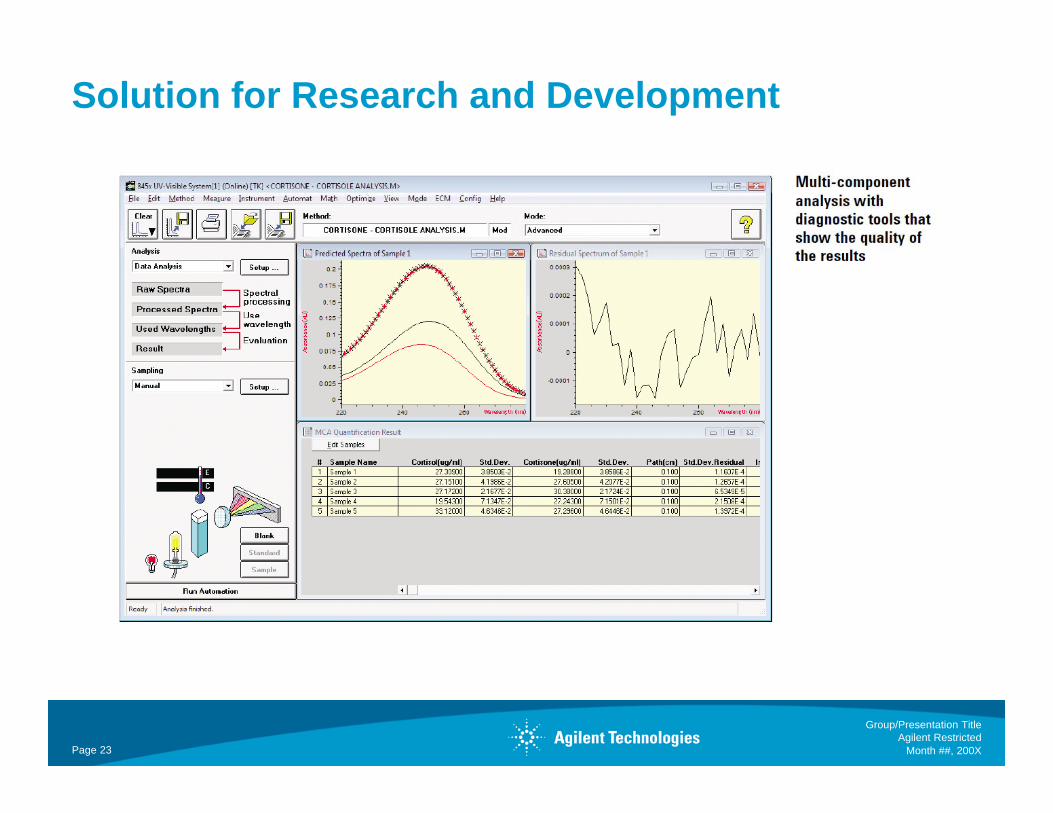
Solution for Research and Development
Group/Presentation TitleAgilent Restricted
Month ##, 200XPage 24

Advanced SW – Key Features
• Flexible method setup
• Time based measurements• Time based measurements
• Multiple data analysis- confirmation analysis
• Single components analysis SCA and multi components analysis MCASingle components analysis SCA and multi components analysis MCA
• Automation
• Sophisticated interactive mathematical functions
• Sophisticated results statics
• Customization – macro programming
• Customer report generator
Group/Presentation TitleAgilent Restricted
Month ##, 200XPage 25

KEY INSTRUMENTALKEY INSTRUMENTAL PARAMETERS
Group/Presentation TitleAgilent Restricted
Month ##, 200XPage 26

Key Instrumental Parameters
• Spectral Resolution
Wavelength accuracy and precision• Wavelength accuracy and precision
• Photometric accuracy and precision• Stray light• Noise • DriftDrift
Group/Presentation TitleAgilent Restricted
Month ##, 200XPage 27
Key Instrumental Parameters
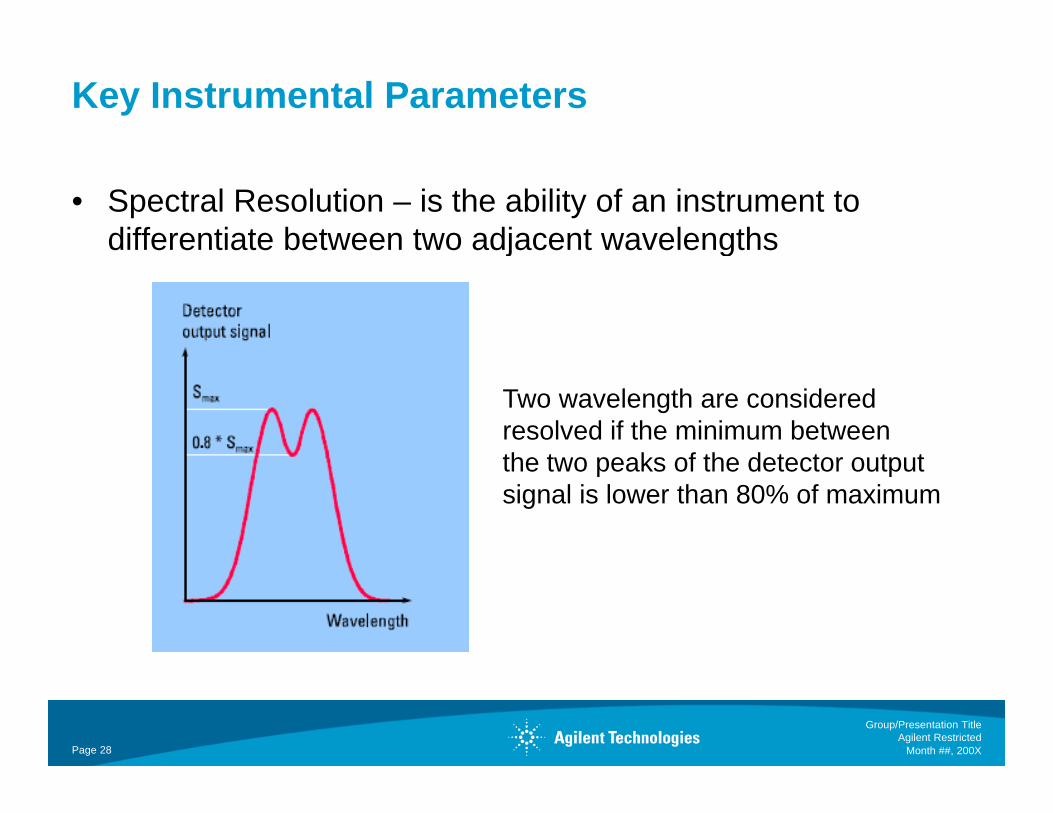
• Spectral Resolution – is the ability of an instrument to differentiate between two adjacent wavelengthsj g
Two wavelength are consideredresolved if the minimum betweenthe two peaks of the detector outputthe two peaks of the detector output signal is lower than 80% of maximum
Group/Presentation TitleAgilent Restricted
Month ##, 200XPage 28

Key Instrumental Parameters
• Wavelength accuracy and precision – important for the comparison of measurements made on different instrumentsp
Group/Presentation TitleAgilent Restricted
Month ##, 200XPage 29

Key Instrumental Parameters
• Photometric accuracy and precision• Stray light – is defined as detected light of any wavelength that lies
t id th b d idth f th l t d l thoutside the bandwidth of the selected wavelength• Stray light causes a negative bias in instrument response and eventually is the
limiting factor for the absorbance, and thereby concentration, that can be measuredmeasured
Group/Presentation TitleAgilent Restricted
Month ##, 200XPage 30

Key Instrumental Parameters
• Photometric accuracy and precision• Noise – affects the precision of the measurement, for a single
t i t d d i llmeasurement, may introduced error in accuracy as well.
Averaging of data pointsreduce noise
The total error at any absorbance is the Sum of the errors due to stray light and noise ( h t i d l t i i )
Group/Presentation TitleAgilent Restricted
Month ##, 200XPage 31
(photon noise and electronic noise)

Key Instrumental Parameters
• Photometric accuracy and precision• Drift normally results from variations in lamp intensity between the• Drift – normally results from variations in lamp intensity between the
measurements. Change in the instrument electronics also can cause drift.
Group/Presentation TitleAgilent Restricted
Month ##, 200XPage 32

METHOD DEVELOPMENTMETHOD DEVELOPMENT
Group/Presentation TitleAgilent Restricted
Month ##, 200XPage 33
Method Development
• Linearity
Accuracy• Accuracy
• Precision
• Sensitivity
• Range
• Selectivity
Group/Presentation TitleAgilent Restricted
Month ##, 200XPage 34

Method Development
• Linearity – is the ability of the method to produce test results that are proportional, either directly or by a well-defined mathematically transformation to the concentration of analytemathematically transformation, to the concentration of analytein sample within a given range.
Group/Presentation TitleAgilent Restricted
Month ##, 200XPage 35

Method Development
• Accuracy – is the degree of agreement between an individual test result generated by the method and the true valueg y
Group/Presentation TitleAgilent Restricted
Month ##, 200XPage 36

Method Development
• Precision – is the agreement among individual test results when the procedure is applied repeatelly to multiple samplingp pp p y p p g
Group/Presentation TitleAgilent Restricted
Month ##, 200XPage 37

Method Development
• Sensitivity – response obtained by a given analyte
Group/Presentation TitleAgilent Restricted
Month ##, 200XPage 38

Method Development
• Selectivity – the ability of a method to quantify accurately and specifically the analyte or analytes in the presence of other p y y y pcompounds
Group/Presentation TitleAgilent Restricted
Month ##, 200XPage 39

SAMPLE HANDLING ANDSAMPLE HANDLING AND MEASUREMENTS
Group/Presentation TitleAgilent Restricted
Month ##, 200XPage 40

Sample Handling and Measurement
• Cell• Material type and care• Material, type, and care
• Choice of solvent• Effect of solvent concentration pH and temperature• Effect of solvent, concentration, pH, and temperature
• Sample• Type strong or week absorbance interferenceType, strong or week absorbance, interference
Group/Presentation TitleAgilent Restricted
Month ##, 200XPage 41

Cell Material
Group/Presentation TitleAgilent Restricted
Month ##, 200XPage 42

Summary
• Advantage of diode array spectrometer• Fast spectral acquisition• Fast spectral acquisition• The full spectra can be used for error correction
• Background modeling• Derivative spectroscopy
• Simultaneous wavelength measurement• SensitivitySensitivity• Reliability
Group/Presentation TitleAgilent Restricted
Month ##, 200XPage 43

Acknowledgement
Thomas Klink Agilent Technologies• Thomas Klink – Agilent Technologies
• Tony Owens – Agilent Technologies
Fundamental of UV-VIS spectroscopy – Primer and WorkbookAgilent technologies
Group/Presentation TitleAgilent Restricted
Month ##, 200XPage 44

Group/Presentation TitleAgilent Restricted
Month ##, 200XPage 45