Embed Size (px)
Citation preview

Use of Process Safety Performance Indicators in TOTAL Refining & Chemicals
D. Roosendans

TOTAL Refining & Chemicals
2 Use of Process Safety Performance Indicators in TOTAL Refining & Chemicals Antwerpen, 22 January 2015
TOTAL Refining & Chemicals
3 Use of Process Safety Performance Indicators in TOTAL Refining & Chemicals Antwerpen, 22 January 2015
Nr Site Country
1 TOTAL Petrochemicals Antwerpen Belgium
2 Appryl (Lavera) France
3 Feluy Belgium
4 El Prat Spain
5 Ravenna Italy
6 Kralupy Czech republic
7 Plateforme de Normandie France
8 TOTAL Olefins Antwerpen Belgium
9 Antwerp Refinery Belgium
10 NaphtaChimie (Lavera) France
11 La Mede Refinery France
12 Feyzin Refinery France
13 TOTAL Petrochemicals Carling France
14 Leuna Refinery Germany
15 Donges Refinery France
16 Grandpuits Refinery France
17 Etablissement Flandres France
18 Lindsey Oil Refinery UK
19 Zeeland Refinery TheNetherlands
20 TRTF France
21 Port Arthur Refinery US
22 Bayport US
23 La Porte US
24 Houston Central Services US
25 Carville US
26 Samsung TOTAL Petrochemicals DAESAN Korea
27 Dongguan China
28 Samsung construction project Korea
29 Foshan China
30 Ningbo China
31 Singaport Singapore
32 TRTG France
o 220 sites worldwide
o Major sites

Safety Indicators in TOTAL RC
4 Use of Process Safety Performance Indicators in TOTAL Refining & Chemicals Antwerpen, 22 January 2015

Safety Performance Indicators in TOTAL RC
5
o HSE performance indicators
Leading Indicators
Lagging Indicators
Monthly follow-up of these indicators
o Leading indicators
Number of failures of safety critical systems encountered during inspection, testing or operations
Number of reported substandard conditions/acts
Ratio of reported substandard conditions/acts per employee
Degree of realization of tests of safety critical systems
Number of out of date implementation of works following recommendations of inspection service
Number of excursions of safe operating window
Number of permit violations related to air emissions
Number of permit violations related to water emissions
Use of Process Safety Performance Indicators in TOTAL Refining & Chemicals Antwerpen, 22 January 2015

Safety Performance Indicators in TOTAL RC
6
o Occupational Safety Lagging Indicators
Total Recordable Injury Rate (own employees + contractors)
Total LossTime Injury Rate (own employees + contractors)
TOTAL number of injuries (with and without loss time cases)
o Process Safety Lagging Indicators
Number of LOPC of hazardous products (Tier1 + Tier2, API754)
Number of fires and explosions
Process Safety Event Rate (Tier 1) (using API754 classification)
Process Safety Event Rate (Tier 2) (using API754 classification)
Use of Process Safety Performance Indicators in TOTAL Refining & Chemicals Antwerpen, 22 January 2015
Focus of this presentation !
LOPC
7
o A loss of primary containment (LOPC) = accidental, sudden and uncontrolled loss of combustible, flammable, explosive, corrosive, toxic products or products dangerous to the environment whatever steps are taken to confine or collect them or to protect the environment.
o The materials to which this indicator relates are those identified in API 754.
o Examples:
Leaks or releases of liquid and/or gas hydrocarbons or flammable or toxic materials occurring on site from a closed circuit:
• Either directly into the atmosphere (Ex: burst of a pipe, of a seal, rupture of pump seals)
• Or in a collection network (drain network or gutters).
• Or in a secondary containment (storage tank, service station separator).
Opening of pressure relief valves (PRV) to the atmosphere giving way either to liquid carry over, or to discharge to a potential unsafe location, or to a shelter in place or to a public protective measure (road closure)
Break of rupture disks
Use of Process Safety Performance Indicators in TOTAL Refining & Chemicals Antwerpen, 22 January 2015

Thresholds for reporting
8
o Values in kg/h o The thresholds in Kg/h are corresponding to the quantity released in any one hour period
Use of Process Safety Performance Indicators in TOTAL Refining & Chemicals Antwerpen, 22 January 2015

Benchmark with CONCAWE data
9 Use of Process Safety Performance Indicators in TOTAL Refining & Chemicals Antwerpen, 22 January 2015
CONCAWE
10
o Benchmark study in 2013 was performed by CONCAWE on safety performance of European refineries
o The study represents about 99% of European refining capacity
Occupational safety : 39 sites included in benchmark Process Safety : 33 sites included in benchmark
Use of Process Safety Performance Indicators in TOTAL Refining & Chemicals Antwerpen, 22 January 2015

2014
11 Use of Process Safety Performance Indicators in TOTAL Refining & Chemicals Antwerpen, 22 January 2015
0.43
1.25
1.68
0.41
1.52
1.93
0.0 0.5 1.0 1.5 2.0 2.5
Tier 1
Tier 2
Tier 1+Tier 2
Rate (per million hours)
TOTAL Refining 2014
CONCAWE 2013

Benchmark with AFPM data
12 Use of Process Safety Performance Indicators in TOTAL Refining & Chemicals Antwerpen, 22 January 2015

AFPM Benchmark
13
o Process Safety Events (PSE) survey based on information collected per ANSI/API Recommended Practice 754
o 113 refining facilities (representing 96.4% of the total US operable refining capacity) participated in the survey
o 123 petrochemical facilities participated in the survey
Use of Process Safety Performance Indicators in TOTAL Refining & Chemicals Antwerpen, 22 January 2015
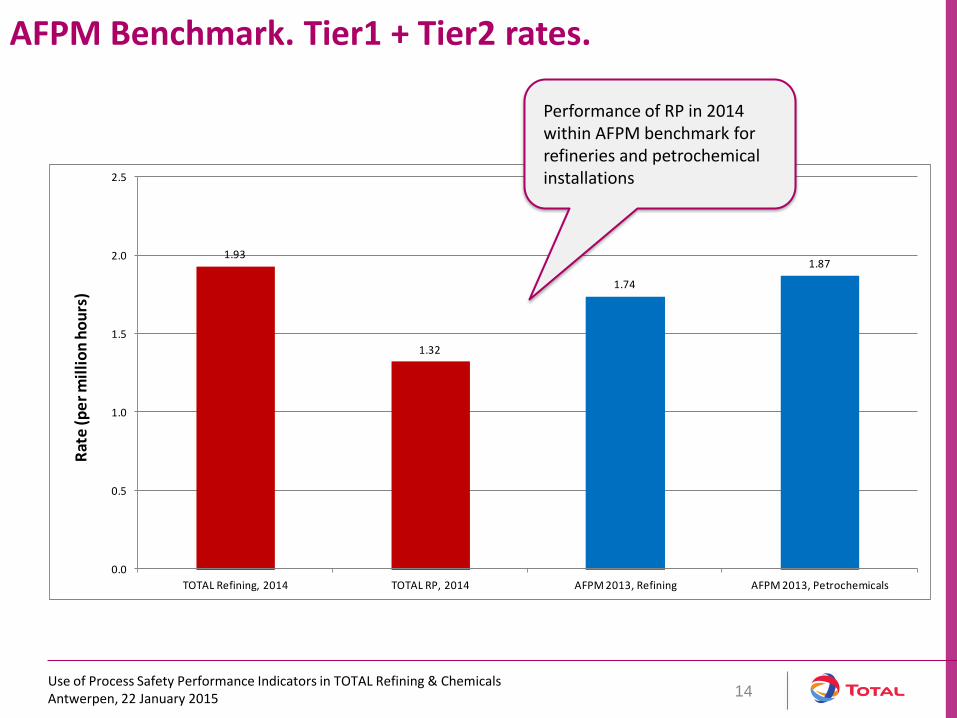
1.93
1.32
1.74
1.87
0.0
0.5
1.0
1.5
2.0
2.5
TOTAL Refining, 2014 TOTAL RP, 2014 AFPM 2013, Refining AFPM 2013, Petrochemicals
Rat
e (p
er
mil
lio
n h
ou
rs)
14
AFPM Benchmark. Tier1 + Tier2 rates.
Performance of RP in 2014 within AFPM benchmark for refineries and petrochemical installations
Use of Process Safety Performance Indicators in TOTAL Refining & Chemicals Antwerpen, 22 January 2015

Benchmark with GBG/API data
15 Use of Process Safety Performance Indicators in TOTAL Refining & Chemicals Antwerpen, 22 January 2015

Benchmarking with GBG data (2012)
16
A - Mechanical failure 1 - Fixed Equipment Inspection
Technical cause (sudden failure) (failure while operating within design enveloppe) 2 - Equipment Reliability
3 - Design
B - Process failure 4 - Change Management
(failure because of operation out of design enveloppe) 5 - Operating Limits
Organisational cause (inadequate operation) C - Inadequate operation preparation 6 - Procedures
7 - Risk Assessment
8 - Safe Work Practices
D -Inadequate practices 9 - Work Monitoring
10 - Communication
Human related cause
E - Other human related cause 11 - Knowledge and Skills
12 - Human Factors
Other F - Other 13 -Other
Classification of accident causes according to API & GBG
Use of Process Safety Performance Indicators in TOTAL Refining & Chemicals Antwerpen, 22 January 2015

29.7 29.3
24.722.9
45.747.8
0.0
10.0
20.0
30.0
40.0
50.0
60.0
GBG 2012, Tier 1 TOTAL RC, LOPC ( 2012-2014)
Pe
rce
nt
Technical causes
Organisational causes
Human related causes
Benchmarking with GBG data
17
GBG data : Refining Industry 2012 (6 Majors) Analysis of 70 LOPC events
TOTAL RC data : Analysis of 57 LOPC HiPo events (excl. fires/explosions) in 2012-2014
Profile of LOPC events in TOTAL RC is similar to the profile of LOPC events in GBG
Use of Process Safety Performance Indicators in TOTAL Refining & Chemicals Antwerpen, 22 January 2015

Benchmarking with GBG data, evolution 2012-> 2014
18
29.7
23.7
30.9 31.4
24.726.3
20.6
23.5
45.7
50.048.5
45.1
0.0
10.0
20.0
30.0
40.0
50.0
60.0
GBG 2012, Tier 1 TOTAL RC 2012, LOPC TOTAL RC 2013, LOPC TOTAL RC 2014, LOPC
Pe
rce
nt
Technical causes
Organisational causes
Human related causes
Most LOPC are related to organizational issues and human factors issues
Use of Process Safety Performance Indicators in TOTAL Refining & Chemicals Antwerpen, 22 January 2015

2.5
11.5
8.3
1.9
5.1
7.0
15.9
14.6
10.2
2.5
8.3
12.1
5.0
9.0
9.0
2.0
0.0
7.0
13.0
10.0
12.0
2.0
5.0
12.0
0 2 4 6 8 10 12 14 16 18
Fixed Equipment Inspection
Equipment Reliability
Design
Change Management
Operating Limits
Procedures
Risk Assessment
Safe Work Practices
Work Monitoring
Communication
Knowledge and Skills
Human Factors
Percent
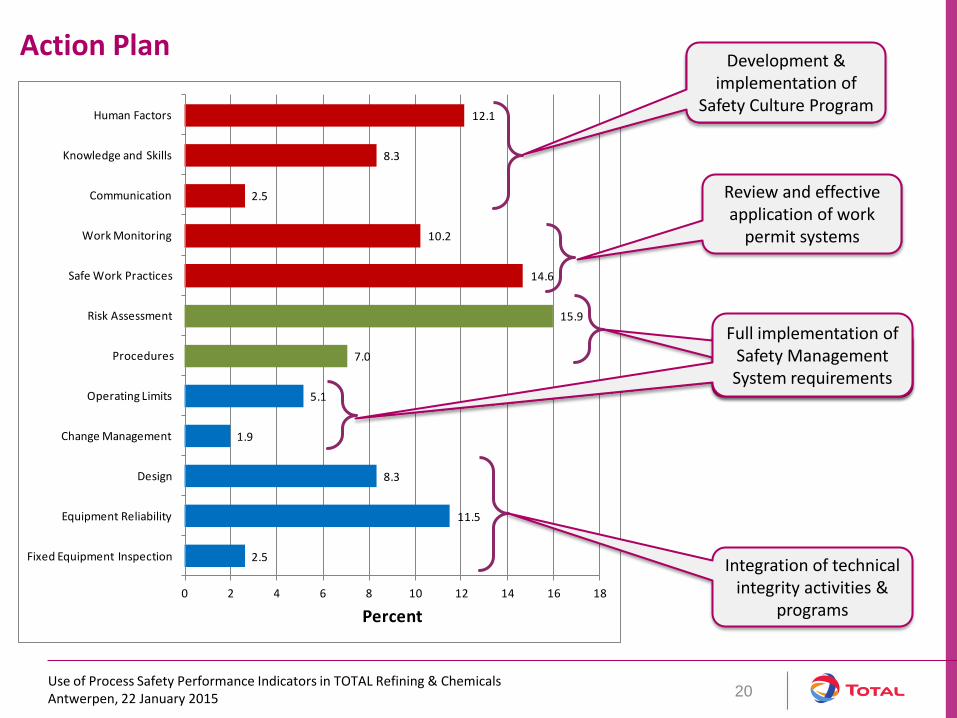
Analysis of TOTAL RC data (LOPC, 2012-2014)
19
Human related
Organization
Technical
GBG 2012 data
50% of all LOPC are related to: • Knowledge & skills • Safe work practices • Supervision • Risk assessment
Use of Process Safety Performance Indicators in TOTAL Refining & Chemicals Antwerpen, 22 January 2015
2.5
11.5
8.3
1.9
5.1
7.0
15.9
14.6
10.2
2.5
8.3
12.1
0 2 4 6 8 10 12 14 16 18
Fixed Equipment Inspection
Equipment Reliability
Design
Change Management
Operating Limits
Procedures
Risk Assessment
Safe Work Practices
Work Monitoring
Communication
Knowledge and Skills
Human Factors
Percent
Action Plan
20
Development & implementation of
Safety Culture Program
Review and effective application of work
permit systems
Full implementation of RC Maestro requirements
Integration of technical integrity activities &
programs
Full implementation of Safety Management System requirements
Use of Process Safety Performance Indicators in TOTAL Refining & Chemicals Antwerpen, 22 January 2015

21 Use of Process Safety Performance Indicators in TOTAL Refining & Chemicals Antwerpen, 22 January 2015