Embed Size (px)
Citation preview

Process Safety Performance Indicators for the Refining and Petrochemical Industries
ANSI/API RECOMMENDED PRACTICE 754 FIRST EDITION, APRIL 2010


Process Safety Performance Indicators for the Refining and Petrochemical Industries
Downstream Segment
ANSI/API RECOMMENDED PRACTICE 754 FIRST EDITION, APRIL 2010

Special Notes
API publications necessarily address problems of a general nature. With respect to particular circumstances, local, state, and federal laws and regulations should be reviewed.
Neither API nor any of API's employees, subcontractors, consultants, committees, or other assignees make any warranty or representation, either express or implied, with respect to the accuracy, completeness, or usefulness of the information contained herein, or assume any liability or responsibility for any use, or the results of such use, of any information or process disclosed in this publication. Neither API nor any of API's employees, subcontractors, consultants, or other assignees represent that use of this publication would not infringe upon privately owned rights.
API publications may be used by anyone desiring to do so. Every effort has been made by the Institute to assure the accuracy and reliability of the data contained in them; however, the Institute makes no representation, warranty, or guarantee in connection with this publication and hereby expressly disclaims any liability or responsibility for loss or damage resulting from its use or for the violation of any authorities having jurisdiction with which this publication may conflict.
API publications are published to facilitate the broad availability of proven, sound engineering and operating practices. These publications are not intended to obviate the need for applying sound engineering judgment regarding when and where these publications should be utilized. The formulation and publication of API publications is not intended in any way to inhibit anyone from using any other practices.
Any manufacturer marking equipment or materials in conformance with the marking requirements of an API standard is solely responsible for complying with all the applicable requirements of that standard. API does not represent, warrant, or guarantee that such products do in fact conform to the applicable API standard.
All rights reserved. No part of this work may be reproduced, translated, stored in a retrieval system, or transmitted by any means, electronic, mechanical, photocopying, recording, or otherwise, without prior written permission from the publisher. Contact the
Publisher, API Publishing Services, 1220 L Street, NW, Washington, DC 20005.
Copyright © 2010 American Petroleum Institute
Foreword
The purpose of this recommended practice (RP) is to identify leading and lagging indicators in the refining and petrochemical industries for nationwide public reporting as well as indicators for use at individual facilities including methods for the development and use of performance indicators. A comprehensive leading and lagging indicators program provides useful information for driving improvement and when acted upon contributes to reducing risks of major hazards (e.g. by identifying the underlying causes and taking action to prevent recurrence). This RP may augment a Company’s existing practices and procedures.
This RP cannot and does not preempt any federal, state, or local laws regulating process safety. Therefore, nothing contained in this document is intended to alter or determine a Company’s compliance responsibilities set forth in the Occupational Safety and Health Act of 1970 and/or the OSHA standards themselves, or any other legal or regulatory requirement concerning process safety. The use of the term or concept “process safety” in this document is independent of and may in fact be broader than the term or concept “process safety” contained in OSHA regulatory requirements, or as the term may be used in other legal or regulatory contexts. In the event of conflict between this recommended practice and any OSHA or other legal requirements, the OSHA or other legal requirements should be fully implemented.
Nothing contained in any API publication is to be construed as granting any right, by implication or otherwise, for the manufacture, sale, or use of any method, apparatus, or product covered by letters patent. Neither should anything contained in the publication be construed as insuring anyone against liability for infringement of letters patent.
Shall: As used in a recommended practice, “shall” denotes a minimum requirement in order to conform to the RP.
Should: As used in a recommended practice, “should” denotes a recommendation or that which is advised but not required in order to conform to the RP.
This document was produced under API standardization procedures that ensure appropriate notification and participation in the developmental process and is designated as an API standard. Questions concerning the interpretation of the content of this publication or comments and questions concerning the procedures under which this publication was developed should be directed in writing to the Director of Standards, American Petroleum Institute, 1220 L Street, NW, Washington, DC 20005. Requests for permission to reproduce or translate all or any part of the material published herein should also be addressed to the director.
Generally, API recommended practices are reviewed and revised, reaffirmed, or withdrawn at least every five years. A one-time extension of up to two years may be added to this review cycle. Status of the publication can be ascertained from the API Standards Department, telephone (202) 682-8000. A catalog of API publications and materials is published annually by API, 1220 L Street, NW, Washington, DC 20005.
Suggested revisions are invited and should be submitted to the Standards Department, API, 1220 L Street, NW, Washington, DC 20005, [email protected].
iii


Contents
Page
1 Scope . . . . . . . . . . . . . . . . . . . . . . . . . . . . . . . . . . . . . . . . . . . . . . . . . . . . . . . . . . . . . . . . . . . . . . . . . . . . . . . . . . 11.1 General . . . . . . . . . . . . . . . . . . . . . . . . . . . . . . . . . . . . . . . . . . . . . . . . . . . . . . . . . . . . . . . . . . . . . . . . . . . . . . . . . 11.2 Applicability . . . . . . . . . . . . . . . . . . . . . . . . . . . . . . . . . . . . . . . . . . . . . . . . . . . . . . . . . . . . . . . . . . . . . . . . . . . . 11.3 Guiding Principles. . . . . . . . . . . . . . . . . . . . . . . . . . . . . . . . . . . . . . . . . . . . . . . . . . . . . . . . . . . . . . . . . . . . . . . . 21.4 Introduction . . . . . . . . . . . . . . . . . . . . . . . . . . . . . . . . . . . . . . . . . . . . . . . . . . . . . . . . . . . . . . . . . . . . . . . . . . . . . 2
2 Normative References. . . . . . . . . . . . . . . . . . . . . . . . . . . . . . . . . . . . . . . . . . . . . . . . . . . . . . . . . . . . . . . . . . . . . 3
3 Terms, Definitions, Acronyms, and Abbreviations . . . . . . . . . . . . . . . . . . . . . . . . . . . . . . . . . . . . . . . . . . . . . 33.1 Terms and Definitions . . . . . . . . . . . . . . . . . . . . . . . . . . . . . . . . . . . . . . . . . . . . . . . . . . . . . . . . . . . . . . . . . . . . . 33.2 Acronyms and Abbreviations . . . . . . . . . . . . . . . . . . . . . . . . . . . . . . . . . . . . . . . . . . . . . . . . . . . . . . . . . . . . . . 7
4 Leading and Lagging Performance Indicators. . . . . . . . . . . . . . . . . . . . . . . . . . . . . . . . . . . . . . . . . . . . . . . . . 7
5 Tier 1 Performance Indicator—Process Safety Event (T-1 PSE) . . . . . . . . . . . . . . . . . . . . . . . . . . . . . . . . . . 85.1 Tier 1 Indicator Purpose . . . . . . . . . . . . . . . . . . . . . . . . . . . . . . . . . . . . . . . . . . . . . . . . . . . . . . . . . . . . . . . . . . . 85.2 Tier 1 Indicator Definition and Consequences. . . . . . . . . . . . . . . . . . . . . . . . . . . . . . . . . . . . . . . . . . . . . . . . . 85.3 Calculation of Tier 1 PSE Rate . . . . . . . . . . . . . . . . . . . . . . . . . . . . . . . . . . . . . . . . . . . . . . . . . . . . . . . . . . . . . . 95.4 Optional Tier 1 PSE Severity Rate . . . . . . . . . . . . . . . . . . . . . . . . . . . . . . . . . . . . . . . . . . . . . . . . . . . . . . . . . . . 9
6 Tier 2 Performance Indicator—Process Safety Events (T-2 PSE) . . . . . . . . . . . . . . . . . . . . . . . . . . . . . . . . 116.1 Tier 2 Indicator Purpose . . . . . . . . . . . . . . . . . . . . . . . . . . . . . . . . . . . . . . . . . . . . . . . . . . . . . . . . . . . . . . . . . . 116.2 Tier 2 Indicator Definition and Consequences. . . . . . . . . . . . . . . . . . . . . . . . . . . . . . . . . . . . . . . . . . . . . . . . 116.3 Calculation of Tier 2 PSE Rate . . . . . . . . . . . . . . . . . . . . . . . . . . . . . . . . . . . . . . . . . . . . . . . . . . . . . . . . . . . . . 11
7 Tier 3 Performance Indicators—Challenges to Safety Systems . . . . . . . . . . . . . . . . . . . . . . . . . . . . . . . . . 137.1 Purpose of Indicator . . . . . . . . . . . . . . . . . . . . . . . . . . . . . . . . . . . . . . . . . . . . . . . . . . . . . . . . . . . . . . . . . . . . . 137.2 Examples of Tier 3 PSEs. . . . . . . . . . . . . . . . . . . . . . . . . . . . . . . . . . . . . . . . . . . . . . . . . . . . . . . . . . . . . . . . . . 13
8 Tier 4 Performance Indicators—Operating Discipline & Management System Performance . . . . . . . . . 168.1 Purpose of Indicator . . . . . . . . . . . . . . . . . . . . . . . . . . . . . . . . . . . . . . . . . . . . . . . . . . . . . . . . . . . . . . . . . . . . . 168.2 Examples of Tier 4 Indicators . . . . . . . . . . . . . . . . . . . . . . . . . . . . . . . . . . . . . . . . . . . . . . . . . . . . . . . . . . . . . 16
9 Guidelines for Selection of Process Safety Indicators . . . . . . . . . . . . . . . . . . . . . . . . . . . . . . . . . . . . . . . . . 179.1 General . . . . . . . . . . . . . . . . . . . . . . . . . . . . . . . . . . . . . . . . . . . . . . . . . . . . . . . . . . . . . . . . . . . . . . . . . . . . . . . . 179.2 Purpose of Indicators . . . . . . . . . . . . . . . . . . . . . . . . . . . . . . . . . . . . . . . . . . . . . . . . . . . . . . . . . . . . . . . . . . . . 189.3 Lagging versus Leading Indicators. . . . . . . . . . . . . . . . . . . . . . . . . . . . . . . . . . . . . . . . . . . . . . . . . . . . . . . . . 189.4 Characteristics of Effective Indicators . . . . . . . . . . . . . . . . . . . . . . . . . . . . . . . . . . . . . . . . . . . . . . . . . . . . . . 189.5 Selection of Indicators . . . . . . . . . . . . . . . . . . . . . . . . . . . . . . . . . . . . . . . . . . . . . . . . . . . . . . . . . . . . . . . . . . . 19
10 Reporting Performance Indicators . . . . . . . . . . . . . . . . . . . . . . . . . . . . . . . . . . . . . . . . . . . . . . . . . . . . . . . . . 1910.1 Format and Forum. . . . . . . . . . . . . . . . . . . . . . . . . . . . . . . . . . . . . . . . . . . . . . . . . . . . . . . . . . . . . . . . . . . . . . . 1910.2 Transparency . . . . . . . . . . . . . . . . . . . . . . . . . . . . . . . . . . . . . . . . . . . . . . . . . . . . . . . . . . . . . . . . . . . . . . . . . . . 1910.3 Stakeholder . . . . . . . . . . . . . . . . . . . . . . . . . . . . . . . . . . . . . . . . . . . . . . . . . . . . . . . . . . . . . . . . . . . . . . . . . . . . 2010.4 PSE Data Capture . . . . . . . . . . . . . . . . . . . . . . . . . . . . . . . . . . . . . . . . . . . . . . . . . . . . . . . . . . . . . . . . . . . . . . . 21
Annex A (informative) Examples . . . . . . . . . . . . . . . . . . . . . . . . . . . . . . . . . . . . . . . . . . . . . . . . . . . . . . . . . . . . . . . . 26
Annex B (informative) Listing of Chemicals Sorted by Threshold Quantity. . . . . . . . . . . . . . . . . . . . . . . . . . . . . 34
Annex C (informative) Decision Logic Tree . . . . . . . . . . . . . . . . . . . . . . . . . . . . . . . . . . . . . . . . . . . . . . . . . . . . . . . 37
Bibliography . . . . . . . . . . . . . . . . . . . . . . . . . . . . . . . . . . . . . . . . . . . . . . . . . . . . . . . . . . . . . . . . . . . . . . . . . . . . . . . . 38
v

Page
Figures1 “Swiss Cheese (Static) Model” and “Spinning Disk (Dynamic) Model” . . . . . . . . . . . . . . . . . . . . . . . . . . . . 22 Process Safety Indicator Pyramid . . . . . . . . . . . . . . . . . . . . . . . . . . . . . . . . . . . . . . . . . . . . . . . . . . . . . . . . . . . 83 Example of Safe Operating Limit for Tank Level . . . . . . . . . . . . . . . . . . . . . . . . . . . . . . . . . . . . . . . . . . . . . . 14B.1 Inhalation Toxicity: Packing Group and Hazard Zones. . . . . . . . . . . . . . . . . . . . . . . . . . . . . . . . . . . . . . . . . 36
Tables1 Tier 1 Material Release Threshold Quantities . . . . . . . . . . . . . . . . . . . . . . . . . . . . . . . . . . . . . . . . . . . . . . . . 102 Tier 2 Material Release Threshold Quantities . . . . . . . . . . . . . . . . . . . . . . . . . . . . . . . . . . . . . . . . . . . . . . . . 123 Stakeholder Report Information . . . . . . . . . . . . . . . . . . . . . . . . . . . . . . . . . . . . . . . . . . . . . . . . . . . . . . . . . . . 20
vi

Notes to First Edition
The purpose of this RP is to identify leading and lagging process safety performance indicators in the refining and petrochemical industries for nationwide public reporting as well as indicators for use at individual facilities including methods for the development and use of performance indicators. A comprehensive leading and lagging indicators program provides useful information for driving improvement and when acted upon, contributes to reducing risks of major hazards (e.g. by identifying the underlying causes and taking action to prevent recurrence).
In developing this document, the drafting committee focused solely on indicators of process safety performance versus indicators of health, personal safety or environmental performance. Each is important and each should have its own performance indicators as part of a comprehensive and robust facility Health, Safety and Environmental program. Process safety hazards can result in major accidents involving the release of potentially dangerous materials. Process safety incidents can have catastrophic effects such as multiple injuries and fatalities, as well as substantial economic, property, and environmental damage; and can affect workers inside the facility and members of the public who reside or work nearby.
In developing this recommended practice, numerous issues including process safety indicator definitions, chemical release thresholds, data capture, statistical validity, and public reporting were considered. As it relates to chemical release threshold quantities (TQs), it is desirable to aggregate chemicals or mixtures into groupings of similar relative risks. The drafting committee chose to utilize the US DOT version of the United Nations Dangerous Goods (UNDG) hazard classification system for these groupings. A number of alternative approaches were considered (e.g. GHS, NFPA, IDLH, and ERPG), yet the DOT version of UNDG was determined to be most appropriate given that this system was unique in the treatment of toxic chemicals in terms of both relative toxicity and relative volatility to produce a more accurate ranking of relative process safety hazards.
The committee leveraged the work of others in developing this recommended practice and benefited from the lessons learned from implementation of the concepts, definitions and reporting mechanisms associated with these earlier works. These works include the following.
— American Petroleum Institute: “API Guide to Report Process Safety Incidents, Version 1.2”, Washington, D.C. 2008. [1]
— Center for Chemical Process Safety: “Process Safety Leading and Lagging Metrics”, American Institute of Chemical Engineers, New York, 2008. [4]
— UK Health and Safety Executive: “Step-by-Step Guide to Developing Process Safety Performance Indicators, HSG254”, Sudbury, Suffolk, UK, 2006. [9]
It is anticipated that this RP will yield process safety performance improvement; however, the actual results can only be determined through its use.
Due to the entirely new nature of this RP, it is anticipated that the first revision cycle will commence after two complete years of data collection. While a revision may address any aspect of the RP, the first revision will specifically evaluate beginning transparent public reporting of Tier 1 and Tier 2 process safety indicators. Public reporting of Tier 1 and Tier 2 data may not occur for the first few years while the recommended practice is being implemented and the quality of the data is being validated.
vii


Process Safety Performance Indicators for theRefining and Petrochemical Industries
1 Scope
1.1 General
This recommended practice (RP) identifies leading and lagging process safety indicators useful for driving performance improvement. As a framework for measuring activity, status or performance, this document classifies process safety indicators into four tiers of leading and lagging indicators. Tiers 1 and 2 are suitable for nationwide public reporting and Tiers 3 and 4 are intended for internal use at individual sites. Guidance on methods for development and use of performance indicators is also provided.
1.2 Applicability 1
This RP was developed for the refining and petrochemical industries, but may also be applicable to other industries with operating systems and processes where loss of containment has the potential to cause harm. Applicability is not limited to those facilities covered by the OSHA Process Safety Management Standard, 29 CFR 1910.119 or similar national and international regulations.
At colocated facilities (e.g. industrial park), this recommended practice applies individually to the companies that own and operate the processes and not to the site as a whole.
Events associated with the following activities fall outside the scope of this RP and shall not be included in data collection or reporting efforts:
a) releases from pipeline transfer operations occurring outside the process or storage facility fence line;
b) marine transport operations, except when the vessel is connected to the process for the purposes of feedstock or product transfer;
c) truck or rail operations, except when the truck or rail car is connected to the process for the purposes of feedstock or product transfer, or if the truck or rail car is being used for on site storage;
d) vacuum truck operations, except on-site truck loading or discharging operations, or use of the vacuum truck transfer pump;
e) routine emissions that are allowable under permit or regulation;
f) office, shop and warehouse building events (e.g. office fires, spills, personnel injury or illness, etc.);
g) personal safety events (e.g. slips, trips, falls) that are not directly associated with on-site response to a loss of primary containment (LOPC) event;
h) LOPC events from ancillary equipment not connected to the process (e.g. small sample containers);
i) quality assurance (QA), quality control (QC) and research and development (R&D) laboratories (pilot plants are included);
j) retail service stations; and
k) on-site fueling operations of mobile and stationary equipment (e.g. pick-up trucks, diesel generators, and heavy equipment).
1 At joint venture sites and tolling operations, the Company should encourage the joint venture or tolling operation to consider applying this RP.
1

2 API RECOMMENDED PRACTICE 754
1.3 Guiding Principles
Performance indicators identified in this recommended practice are based on the following guiding principles.
— Indicators should drive process safety performance improvement and learning.
— Indicators should be relatively easy to implement and easily understood by all stakeholders (e.g. workers and the public).
— Indicators should be statistically valid at one or more of the following levels: industry, Company, and site. Statistical validity requires a consistent definition, a minimum data set size, a normalization factor, and a relatively consistent reporting pool.
— Indicators should be appropriate for industry, Company, or site level benchmarking.
1.4 Introduction
Process safety incidents are rarely caused by a single catastrophic failure, but rather by multiple events or failures that coincide. This relationship between simultaneous or sequential failures of multiple systems was originally proposed by British psychologist James T. Reason [8] in 1990 and is illustrated by the “Swiss Cheese Model.” In the Swiss Cheese Model, hazards are contained by multiple protective barriers each of which may have weaknesses or “holes.” When the holes align, the hazard is released resulting in the potential for harm.
Christopher A. Hart in 2003 [5] represented Reason’s model as a set of spinning disks with variable size holes. This representation suggests that the relationship between the hazard and the barriers is dynamic, with the size and type of weakness in each barrier constantly changing, and the alignment of the holes constantly shifting.
Figure 1 depicts both models. In both models, barriers can be active, passive, or administrative/procedural. Holes can be latent, incipient, or actively opened by people.
Figure 1—“Swiss Cheese (Static) Model” and “Spinning Disk (Dynamic) Model”
• Hazards are contained by multiple protective barriers.• Barriers may have weaknesses or “holes”.• When holes align, the hazard passes through the barriers resulting
in the potential for harm.• Barriers may be physically engineered containment or behavioral
controls dependent upon people.• Holes can be latent, incipient or actively opened by people.
Swiss Cheese (Static) Model Spinning Disk (Dynamic) Model
Protective “Barriers”
“Weaknesses”or “Holes”
Protective Barriers “Weaknesses” or “Holes”
Hazard
Hazard
HazardHarmHarm

PROCESS SAFETY PERFORMANCE INDICATORS FOR THE REFINING AND PETROCHEMICAL INDUSTRIES 3
2 Normative References
The following referenced documents are indispensable for the application of this document. For dated references, only the edition cited applies. For undated references, the latest edition of the referenced document (including any amendments) applies.
ANSI/API Standard 521/ISO 23251, Guide for Pressure-relieving and Depressuring Systems. [2]
AiChE, Center for Chemical Process Safety 2, Process Safety Leading and Lagging Metrics, Appendix B: Additional Information Regarding UN Dangerous Goods Classification and Listing of Chemicals, 2008. [4]
UNECE 3, ECE/TRANS/202, Vol. I and II (“ADR 2009”), European Agreement Concerning the International Carriage of Dangerous Goods by Road (ADR). [10]
U.S. DOT 4, 49 CFR, Part 172, Subpart B—Table of Hazardous Materials and Special Provisions. [13]
3 Terms, Definitions, Acronyms, and Abbreviations
3.1 Terms and Definitions
For the purposes of this recommended practice, the following definitions apply.
3.1.1 acids/bases, moderate Substances with pH ≥ 1 and < 2, or pH > 11.5 and ≤ 12.5, or more precisely, substances that cause full thickness destruction of intact skin tissue within an observation period up to 14 days starting after the exposure time of 60 minutes or less, but greater than three minutes, consistent with Globally Harmonized System of Classification and Labeling of Chemicals (GHS) Skin Corrosion Category 1B. [11]
3.1.2 acids/bases, strong Substances with pH < 1 or > 12.5, or more precisely, substances that cause full thickness destruction of intact skin tissue within an observation period up to 60 minutes starting after the exposure time of three minutes or less, consistent with GHS Skin Corrosion Category 1A. [11]
3.1.3 CompanyWhen designated with a capital C or “the Company”, refers to the operating Company in the refining and petrochemical industries, its divisions, or its consolidated affiliates.
3.1.4 containment, primaryA tank, vessel, pipe, truck, rail car, or equipment intended to serve as the primary container or used for processing or transfer of material.
3.1.5 containment, secondaryExists to contain or control a release from primary containment. Secondary containment systems include, but are not limited to tank dikes, curbing around process equipment, drainage collection systems, the outer wall of double walled tanks, etc.
2 American Institute of Chemical Engineers, Center for Chemical Process Safety, 3 Park Avenue, 19th Floor, New York, New York 10016, www.aiche.org/ccps.
3 United Nations Economic Commission for Europe, Information Service, Palais des Nations, CH-1211 Geneva 10, Switzerland, www.unece.org.
4 U.S. Department of Transportation,1200 New Jersey Ave, SE, Washington, D.C. 20590, www.dot.gov.

4 API RECOMMENDED PRACTICE 754
3.1.6 contractor and subcontractorAny individual not on the Company payroll, whose exposure hours, injuries, and illnesses occur on site.
3.1.7 days away from work injuryWork-related injuries that result in the employee being away from work for at least one calendar day after the day of the injury as determined by a physician or other licensed health professional. This is an abridged version of the definition used to report days away from work injuries for OSHA. [12]
3.1.8 deflagration ventAn opening in a vessel or duct that prevents failure of the vessel or duct due to overpressure. The opening is covered by a pressure-relieving cover (e.g. rupture disk, explosion disk, or hatch).
3.1.9 destructive deviceA flare, scrubber, incinerator, quench drum, or other similar device used to mitigate the potential consequences of a PRD release.
3.1.10 direct costCost of repairs or replacement, cleanup, material disposal, environmental remediation and emergency response. Direct cost does not include indirect costs, such as business opportunity, business interruption and feedstock/product losses, loss of profits due to equipment outages, costs of obtaining or operating temporary facilities, or costs of obtaining replacement products to meet customer demand. Direct cost does not include the cost of the failed component leading to LOPC, if the component is not further damaged by the fire or explosion.
3.1.11 employeeAny individual on the Company payroll whose exposure hours, injuries, and illnesses are routinely tracked by the Company. Individuals not on the Company payroll, but providing services under direct company supervision are also included (e.g. government sponsored interns, secondees, etc.).
3.1.12 explosionA release of energy that causes a pressure discontinuity or blast wave (e.g. detonations, deflagrations, and rapid releases of high pressure caused by rupture of equipment or piping).
3.1.13 facilityThe buildings, containers or equipment that contain a process.
3.1.14 fireAny combustion resulting from a LOPC, regardless of the presence of flame. This includes smoldering, charring, smoking, singeing, scorching, carbonizing, or the evidence that any of these have occurred.
3.1.15 flammable gasAny material that is a gas at 35 °C (95 °F) or less and 101.3 kPa (14.7 psi) of pressure and is ignitable when in a mixture of 13 % or less by volume with air, or has a flammable range of at least 12 % as measured at 101.3 kPa (14.7 psi).

PROCESS SAFETY PERFORMANCE INDICATORS FOR THE REFINING AND PETROCHEMICAL INDUSTRIES 5
3.1.16 hospital admissionFormal acceptance by a hospital or other inpatient health care facility of a patient who is to be provided with room, board, and medical service in an area of the hospital or facility where patients generally reside at least overnight. Treatment in the hospital emergency room or an overnight stay in the emergency room would not by itself qualify as a “hospital admission.”
3.1.17 loss of primary containmentLOPCAn unplanned or uncontrolled release of any material from primary containment, including non-toxic and non-flammable materials (e.g. steam, hot condensate, nitrogen, compressed CO2 or compressed air).
3.1.18 major constructionLarge scale investments with specific, one-time project organizations created for design, engineering, and construction of new or significant expansion to existing process facilities.
3.1.19 materialSubstance with the potential to cause harm due to its chemical (e.g. flammable, toxic, corrosive, reactive, asphyxiate) or physical (e.g. thermal, pressure) properties.
3.1.20 office buildingBuildings intended to house office workers (e.g. administrative or engineering building, affiliate office complex, etc.).
3.1.21 officially declaredA declaration by a recognized community official (e.g. fire, police, civil defense, emergency management) or delegate (e.g. Company official) authorized to order the community action (e.g. shelter-in-place, evacuation).
3.1.22 pressure relief devicePRDA device designed to open and relieve excess pressure (e.g. safety valve, thermal relief, rupture disk, rupture pin, deflagration vent, pressure/vacuum vents, etc.).
3.1.23 processProduction, distribution, storage, utilities, or pilot plant facilities used in the manufacture of petrochemical and petroleum refining products. This includes process equipment (e.g. reactors, vessels, piping, furnaces, boilers, pumps, compressors, exchangers, cooling towers, refrigeration systems, etc.), storage tanks, ancillary support areas (e.g. boiler houses and waste water treatment plants), on-site remediation facilities, and distribution piping under control of the Company.
3.1.24 process safetyA disciplined framework for managing the integrity of hazardous operating systems and processes by applying good design principles, engineering, and operating and maintenance practices.

6 API RECOMMENDED PRACTICE 754
3.1.25 process safety event PSEAn unplanned or uncontrolled LOPC of any material including non-toxic and non-flammable materials (e.g. steam, hot condensate, nitrogen, compressed CO2 or compressed air) from a process, or an undesired event or condition that, under slightly different circumstances, could have resulted in a LOPC of a material.
3.1.26 public receptorsOffsite residences, institutions (e.g. schools, hospitals), industrial, commercial, and office buildings, parks or recreational areas where members of the public could potentially be exposed to toxic concentrations, radiant heat, or overpressure, as a result of a LOPC.
3.1.27 recordable injuryA work-related injury that results in any of the following: death, days away from work, restricted work or transfer to another job, medical treatment beyond first aid, loss of consciousness, or a significant injury diagnosed by a physician or other licensed health professional. This is an abridged version of the definition used to report days away from work injuries for OSHA. [12]
3.1.28 third-partyAny individual other than an employee, contractor or subcontractor of the Company [e.g., visitors, non-contracted delivery drivers (e.g. UPS, U.S. Mail, Federal Express), residents, etc.].
3.1.29 tolling operationA company with specialized equipment that processes raw materials or semi-finished goods for another company.
3.1.30 total work hoursTotal employee, contractor, and subcontractor hours worked minus the hours associated with major construction projects. This is the same number typically used to calculate occupational injury and illness rates.
3.1.31 United Nations Dangerous Goods UNDGA classification system used to evaluate the potential hazards of various chemicals when released, which is used by most international countries as part of the product labeling or shipping information [10]. In the United States, these hazard categories are defined in U.S. Department of Transportation (DOT) regulations 49 CFR 173.2a [14], and listed in 49 CFR 172, Subpart B. [13]
3.1.32 unsafe locationAn atmospheric pressure relief device discharge point or downstream destructive device (e.g. flare, scrubber) discharge point that results in a potential hazard, such as the formation of flammable mixtures at grade level or on elevated work structures, presence of toxic or corrosive materials at grade or on elevated work structures, or ignition of relief streams at the point of emission as specified in API 521 Section 6.3.4.3. [2]

PROCESS SAFETY PERFORMANCE INDICATORS FOR THE REFINING AND PETROCHEMICAL INDUSTRIES 7
3.2 Acronyms and Abbreviations
For the purposes of this publication, the following acronyms and abbreviations apply.
ACC American Chemistry CouncilAPI American Petroleum InstituteCCPS Center for Chemical Process SafetyDOT U.S. Department of TransportationGHS Globally Harmonized System of Classification and Labeling of ChemicalsLOPC loss of primary containmentMOC management of changeNAICS North American Industry Classification SystemNOS not otherwise specifiedNPRA National Petrochemical & Refiners AssociationOSHA U.S. Occupational Safety & Health AdministrationPRD pressure relief devicePSE process safety eventPSSR pre start-up safety reviewPV pressure/vacuumSIS safety instrumented systemSOL safe operating limitSV safety valveTIH toxic inhalation hazardUK PIA United Kingdom Petroleum Industry AssociationUK HSE United Kingdom Health & Safety ExecutiveUNDG United Nations Dangerous Goods UNECE United Nations Economic Commission for Europe
4 Leading and Lagging Performance Indicators
In 1931, H.W. Heinrich [6] introduced the now-familiar accident pyramid based upon his experience in the insurance industry. The accident pyramid represents two key concepts. One is that safety accidents can be placed on a scale representing the level of consequence, and the second is that many precursor incidents occurred with lesser consequences for each accident that occurred with greater consequences. Heinrich’s model represents a predictive relationship between lower and higher consequence personal safety events.
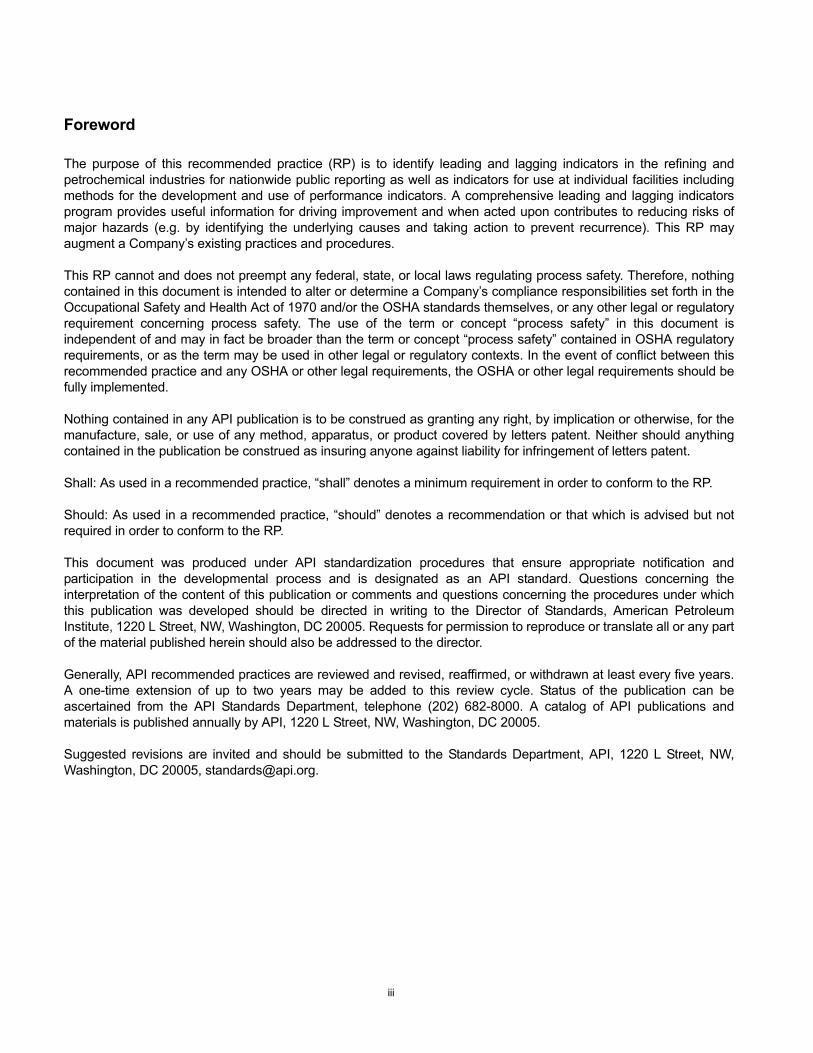
It is believed that a similar predictive relationship exists between lower and higher consequence events that relate to process safety. Indicators that are predictive are considered leading indicators and may be used to identify a weakness that can be corrected before a higher consequence event occurs. Figure 2 depicts a process safety pyramid with four classifications or tiers. The tiers of the pyramid represent a continuum of leading and lagging process safety indicators. Tier 1 is the most lagging and Tier 4 is the most leading.
Since the difference between a loss of primary containment event resulting in a Tier 1 or Tier 2 consequence is often due to time of day, wind direction, absence of people, etc., it is important that Companies adopt appropriate indicators to measure challenges to the barrier system in Tier 3 and precursor events and barrier system weaknesses in Tier 4.
8 API RECOMMENDED PRACTICE 754
5 Tier 1 Performance Indicator—Process Safety Event (T-1 PSE)
5.1 Tier 1 Indicator Purpose
The count of Tier 1 process safety events is the most lagging performance indicator and represents incidents with greater consequence resulting from actual losses of containment due to weaknesses in the barriers. When used in conjunction with lower tier indicators, it can provide a company with an assessment of its process safety performance.
5.2 Tier 1 Indicator Definition and Consequences
A Tier 1 Process Safety Event (T-1 PSE) is a loss of primary containment (LOPC) with the greatest consequence as defined by this RP. A T-1 PSE is an unplanned or uncontrolled release of any material, including non-toxic and non-flammable materials (e.g. steam, hot condensate, nitrogen, compressed CO2 or compressed air), from a process that results in one or more of the consequences listed below:
NOTE Non-toxic and non-flammable materials (e.g., steam, hot water, nitrogen, compressed CO2 or compressed air) have no threshold quantities and are only included in this definition as a result of their potential to result in one of the other consequences.
— an employee, contractor or subcontractor “days away from work” injury and/or fatality;
— a hospital admission and/or fatality of a third-party;
— an officially declared community evacuation or community shelter-in-place;
— a fire or explosion resulting in greater than or equal to $25,000 of direct cost to the Company;
Figure 2—Process Safety Indicator Pyramid
Tier 1
Tier 2
Tier 3
Tier 4Operating Discipline & Management System
Performance Indicators
LeadingIndicators
LaggingIndicators
LOPC Events ofGreater Consequence
LOPC Events ofLesser Consequence
Challenges to Safety Systems
Tier 1
Tier 2
Tier 3
Tier 4Operating Discipline & Management System
Performance Indicators
LeadingIndicators
LaggingIndicators
LOPC Events ofGreater Consequence
LOPC Events ofLesser Consequence
Challenges to Safety Systems

PROCESS SAFETY PERFORMANCE INDICATORS FOR THE REFINING AND PETROCHEMICAL INDUSTRIES 9
— a pressure relief device (PRD) discharge to atmosphere whether directly or via a downstream destructive devicethat results in one or more of the following four consequences:
— liquid carryover;
— discharge to a potentially unsafe location;
— an on-site shelter-in-place;
— public protective measures (e.g. road closure);
and a PRD discharge quantity greater than the threshold quantities in Table 1 in any one-hour period; or
— a release of material greater than the threshold quantities described in Table 1 in any one-hour period.
5.3 Calculation of Tier 1 PSE Rate
The Tier 1 PSE Rate shall be calculated as follows:
Tier 1 PSE Rate = (Total Tier 1 PSE Count / Total Work Hours) × 200,000
NOTE Total work hours includes employees and contractors (see definition 3.1, Terms and Definitions).
5.4 Optional Tier 1 PSE Severity Rate
Severity rates, whether Company-defined or industry association-defined, can provide additional useful informationabout Tier 1 PSEs that may help drive improvement. As an example, CCPS has published a methodology forcalculating severity rate for Tier 1 PSEs. [4]

10 API RECOMMENDED PRACTICE 754
Table 1—Tier 1 Material Release Threshold Quantities
Threshold Release Category
Material Hazard Classification a,c,dThreshold Quantity
(outdoor release)
Threshold Quantity
(indoorb release)1 TIH Zone A Materials 5 kg (11 lb) 2.5 kg (5.5 lb)
2 TIH Zone B Materials 25 kg (55 lb) 12.5 kg (27.5 lb)
3 TIH Zone C Materials 100 kg (220 lb) 50 kg (110 lb)
4 TIH Zone D Materials 200 kg (440 lb) 100 kg (220 lb)
5
Flammable Gases
or
Liquids with Initial Boiling Point ≤ 35 °C (95 °F) and Flash Point < 23 °C (73 °F)
or
Other Packing Group I Materials excluding strong acids/bases
500 kg (1100 lb) 250 kg (550 lb)
6
Liquids with Initial Boiling Point > 35 °C (95 °F) and Flash Point < 23 °C (73°F)
or
Other Packing Group II Materials excluding moderate acids/bases
1000 kg (2200 lb)
or
7 bbl
500 kg (1100 lb)
or
3.5 bbl
7
Liquids with Flash Point ≥ 23 °C (73 °F) and ≤ 60 °C (140 °F)
or
Liquids with Flash Point > 60 °C (140 °F) released at a temperature at or above Flash Point
or
strong acids/bases
or
Other Packing Group III Materials
2000 kg (4400 lb)
or
14 bbl
1000 kg (2200 lb)
or
7 bbl
It is recognized that threshold quantities given in kg and lb or in lb and bbl are not exactly equivalent. Companies should select one of the pair and use it consistently for all recordkeeping activities.a Many materials exhibit more than one hazard. Correct placement in Hazard Zone or Packing Group shall follow the rules of DOT 49 CFR
173.2a [14] or UN Recommendations on the Transportation of Dangerous Goods, Section 2 [10]. See Annex B.
b A structure composed of four complete (floor to ceiling) walls, floor, and roof.
c For solutions not listed on the UNDG, the anhydrous component shall determine the TIH zone or Packing Group classification. The threshold quantity of the solution shall be back calculated based on the threshold quantity of the dry component weight.
d For mixtures where the UNDG classification is unknown, the fraction of threshold quantity release for each component may be calculated. If the sum of the fractions is equal to or greater than 100 %, the mixture exceeds the threshold quantity. Where there are clear and independent toxic and flammable consequences associated with the mixture, the toxic and flammable hazards are calculated independently. See Annex A, Examples 28, 29, and 30.
PROCESS SAFETY PERFORMANCE INDICATORS FOR THE REFINING AND PETROCHEMICAL INDUSTRIES 11
6 Tier 2 Performance Indicator—Process Safety Events (T-2 PSE)
6.1 Tier 2 Indicator Purpose
The count of Tier 2 process safety events represents LOPC events with a lesser consequence. Tier 2 PSEs, eventhose that have been contained by secondary systems, indicate barrier system weaknesses that may be potentialprecursors of future, more significant incidents. In that sense, Tier 2 PSEs can provide a company with opportunitiesfor learning and improvement of its process safety performance.
6.2 Tier 2 Indicator Definition and Consequences
A Tier 2 Process Safety Event (T-2 PSE) is a LOPC with lesser consequence. A T-2 PSE is an unplanned oruncontrolled release of any material, including non-toxic and non-flammable materials (e.g. steam, hot condensate,nitrogen, compressed CO2 or compressed air), from a process that results in one or more of the consequences listedbelow and is not reported in Tier 1:
NOTE Non-toxic and non-flammable materials (e.g. steam, hot water, nitrogen, compressed CO2 or compressed air) have nothreshold quantities and are only included in this definition as a result of their potential to result in one of the other consequences.
— an employee, contractor or subcontractor recordable injury;
— a fire or explosion resulting in greater than or equal to $2,500 of direct cost to the Company;
— a pressure relief device (PRD) discharge to atmosphere whether directly or via a downstream destructive devicethat results in one or more of the following four consequences:
— liquid carryover;
— discharge to a potentially unsafe location;
— an on-site shelter-in-place;
— public protective measures (e.g. road closure);
and a PRD discharge quantity greater than the threshold quantity in Table 2 in any one-hour period; or
— a release of material greater than the threshold quantities described in Table 2 in any one-hour period.
6.3 Calculation of Tier 2 PSE Rate
The Tier 2 PSE rate shall be calculated as follows:
Tier 2 PSE Rate = (Total Tier 2 PSE Count / Total Work Hours) × 200,000
NOTE Total work hours includes employees and contractors (see definition 3.1, Terms and Definitions).

12 API RECOMMENDED PRACTICE 754
Table 2—Tier 2 Material Release Threshold Quantities
Threshold Release Category
Material Hazard Classification a,c,dThreshold Quantity
(outdoor release)
Threshold Quantity
(indoorb release)
1 TIH Zone A Materials 0.5 kg (1.1 lb) 0.25 kg (0.55 lb)
2 TIH Zone B Materials 2.5 kg (5.5 lb) 1.2 kg (2.8 lb)
3 TIH Zone C Materials 10 kg (22 lb) 5 kg (11 lb)
4 TIH Zone D Materials 20 kg (44 lb) 10 kg (22 lb)
5
Flammable Gases
or
Liquids with Initial Boiling Point ≤ 35 °C (95 °F) and Flash Point < 23 °C (73 °F)
or
Other Packing Group I Materials excluding strong acids/bases
50 kg (110 lb) 25 kg (55 lb)
6
Liquids with a Initial Boiling Point > 35 °C (95 °F) and Flash Point < 60 °C (140 °F)
or
Liquids with Flash Point > 60 °C (140 °F) released at or above Flash Point;
or
Other Packing Group II and III Materials excluding moderate acids/bases
or
Strong acids and bases
100 kg (220 lb)
or
1 bbl
50 kg (110 lb)
or
0.5 bbl
7
Liquids with Flash Point > 60 °C (140 °F) released at a temperature below Flash Point
or
Moderate acids/bases
1000 kg (2200 lb)
or
10 bbl
500 kg (1100 lb)
or
5 bbl
In order to simplify determination of reporting thresholds for Tier 2, Categories 6 and 7 in Tier 1 have been combined into one category in Tier 2 (Category 6). The simplification is intended to provide less complicated requirements for those events with lesser consequences.
It is recognized that threshold quantities given in kg and lb or in lb and bbl are not exactly equivalent. Companies should select one of the pair and use it consistently for all recordkeeping activities.
a Many materials exhibit more than one hazard. Correct placement in Hazard Zone or Packing Group shall follow the rules of DOT 49 CFR173.2a [14] or UN Recommendations on the Transportation of Dangerous Goods, Section 2 [10]. See Annex B.
b A structure composed of four complete (floor to ceiling) walls, floor and roof.
c For solutions not listed on the UNDG, the anhydrous component shall determine the TIH zone or Packing Group classification. The threshold quantity of the solution shall be back calculated based on the threshold quantity of the dry component weight.
d For mixtures where the UNDG classification is unknown, the fraction of threshold quantity release for each component may be calculated. If the sum of the fractions is equal to or greater than 100 %, the mixture exceeds the threshold quantity. Where there are clear and independent toxic and flammable consequences associated with the mixture, the toxic and flammable hazards are calculated independently. See Annex A, Examples 28, 29, and 30.

PROCESS SAFETY PERFORMANCE INDICATORS FOR THE REFINING AND PETROCHEMICAL INDUSTRIES 13
7 Tier 3 Performance Indicators—Challenges to Safety Systems
7.1 Purpose of Indicator
A Tier 3 PSE typically represents a challenge to the barrier system that progressed along the path to harm, but is stopped short of a Tier 1 or Tier 2 LOPC consequence. Indicators at this level provide an additional opportunity to identify and correct weaknesses within the barrier system.
Tier 3 indicators are intended for internal Company use and can be used for local (site) public reporting. A Company may use all or some of the example indicators below:
— safe operating limit excursions;
— primary containment inspection or testing results outside acceptable limits;
— demands on safety systems;
— other LOPCs.
or identify others that are meaningful to its operations.
A Company shall develop and use Tier 3 Indicators.
7.2 Examples of Tier 3 PSEs
7.2.1 Safe Operating Limit Excursions
7.2.1.1 Indicator Definition
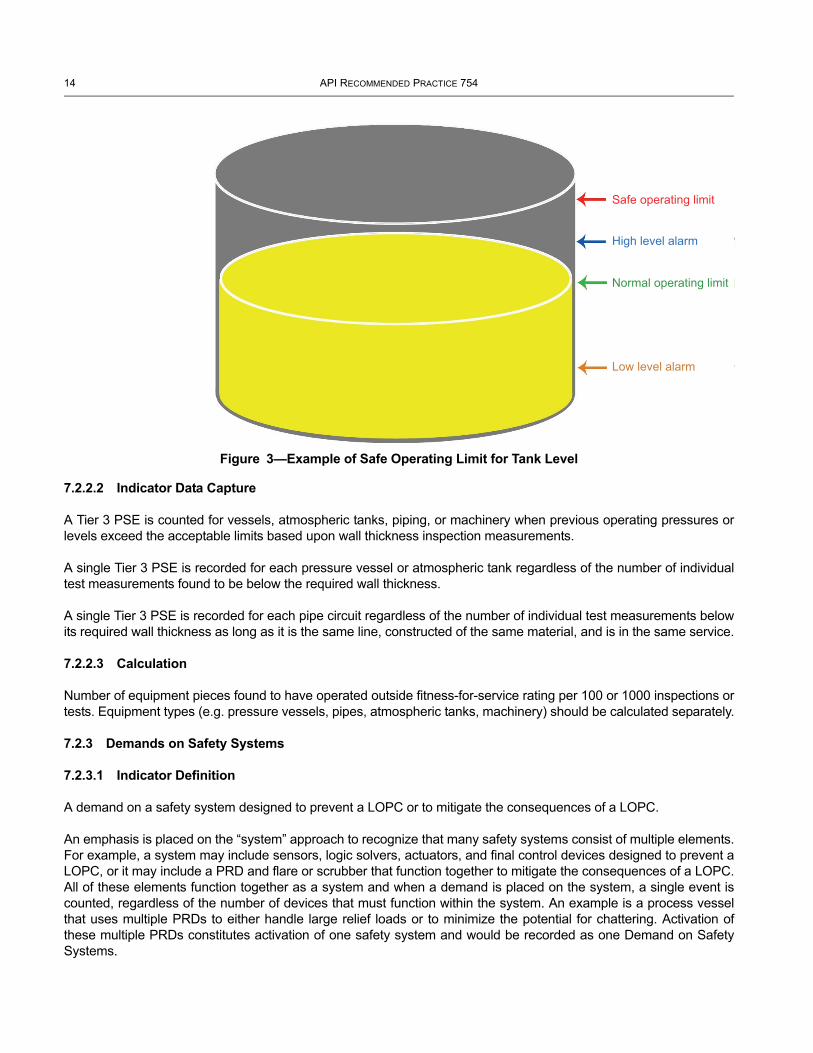
A process parameter deviation that exceeds the safe operating limit (SOL) applicable to the phase of operation. Different operating phases (e.g. regeneration or steps in a batch process) may have different SOLs for the same equipment. Figure 3 depicts the relationship between normal operating limits, high/low alarm limits, and the SOL. Exceeding the SOL represents the point beyond which troubleshooting ends and pre-determined action occurs to return the process to a known safe state. The predetermined action may range from manually executed operating procedures to a fully automated safety instrumented system.
7.2.1.2 Indicator Data Capture
A Tier 3 PSE is counted for each SOL excursion that occurred in a specified time period.
A Company may want to record the duration of individual SOL excursions and may even calculate the total duration of all SOL excursions.
A single initiating event may result in multiple SOL excursions (e.g. site-wide failure of a utility) and each excursion should be counted as a separate Tier 3 PSE. A process condition that hovers near the SOL value may result in multiple excursions. These excursions should be counted as a single Tier 3 PSE.
7.2.2 Primary Containment Inspection or Testing Results Outside Acceptable Limits
7.2.2.1 Indicator Definition
An inspection or test finding that indicates primary containment equipment has been operated outside acceptable limits. These findings typically trigger an action, such as replacement-in-kind, repairs to restore fitness-for-service, replacement with other materials, increased inspection or testing, or de-rating of process equipment.
14 API RECOMMENDED PRACTICE 754
7.2.2.2 Indicator Data Capture
A Tier 3 PSE is counted for vessels, atmospheric tanks, piping, or machinery when previous operating pressures or levels exceed the acceptable limits based upon wall thickness inspection measurements.
A single Tier 3 PSE is recorded for each pressure vessel or atmospheric tank regardless of the number of individual test measurements found to be below the required wall thickness.
A single Tier 3 PSE is recorded for each pipe circuit regardless of the number of individual test measurements below its required wall thickness as long as it is the same line, constructed of the same material, and is in the same service.
7.2.2.3 Calculation
Number of equipment pieces found to have operated outside fitness-for-service rating per 100 or 1000 inspections or tests. Equipment types (e.g. pressure vessels, pipes, atmospheric tanks, machinery) should be calculated separately.
7.2.3 Demands on Safety Systems
7.2.3.1 Indicator Definition
A demand on a safety system designed to prevent a LOPC or to mitigate the consequences of a LOPC.
An emphasis is placed on the “system” approach to recognize that many safety systems consist of multiple elements. For example, a system may include sensors, logic solvers, actuators, and final control devices designed to prevent a LOPC, or it may include a PRD and flare or scrubber that function together to mitigate the consequences of a LOPC. All of these elements function together as a system and when a demand is placed on the system, a single event is counted, regardless of the number of devices that must function within the system. An example is a process vessel that uses multiple PRDs to either handle large relief loads or to minimize the potential for chattering. Activation of these multiple PRDs constitutes activation of one safety system and would be recorded as one Demand on Safety Systems.
Figure 3—Example of Safe Operating Limit for Tank Level
Safe operating limit
High level alarm
Normal operating limit
Low level alarm

PROCESS SAFETY PERFORMANCE INDICATORS FOR THE REFINING AND PETROCHEMICAL INDUSTRIES 15
7.2.3.2 Indicator Data Capture
A Tier 3 PSE is counted for each Demand on Safety Systems event when one of the following occurs:
1) activation of a safety instrumented system;
2) activation of a mechanical shutdown system;
3) activation of a PRD not counted as Tier 1 or Tier 2, regardless of the phase of operation (e.g. start-up, shutdown, normal, temporary, emergency shutdown, regeneration, batch mode).
A demand resulting from intentional activation of the safety system during periodic device testing, or manual activation as a part of the normal shutdown process is excluded.
7.2.3.2.1 Activation of a Safety Instrumented System
A safety instrumented system (SIS) is considered to have been activated when called upon to function by a valid signal regardless of whether or not the SIS responds. A single initiating event may result in multiple SIS activations (e.g. site-wide power failure) with each SIS activation being counted separately. Inadvertent or intentional activation during maintenance activities should not be counted as a Tier 3 PSE, but may be counted in Tier 4.
SIS activation that is configured for equipment protection with no related LOPC protection should not be counted as a Tier 3 PSE.
7.2.3.2.2 Activation of Mechanical Shutdown System
A mechanical shutdown system is considered to have been activated when called upon to function by a valid signal, regardless of whether or not the mechanical shutdown system responds. Inadvertent or intentional activation during maintenance activities should not be counted as a Tier 3 PSE, but may be counted in Tier 4.
Mechanical shutdown system activation that is configured for equipment protection with no related LOPC protection should not be counted as a Tier 3 PSE.
7.2.3.2.3 Activation of Pressure Relief Device (PRD) Not Counted as Tier 1 or Tier 2
A PRD is considered to have been activated when the system pressure reaches the device set point whether or not the PRD performs as designed. A single initiating event may result in activation of multiple PRDs (e.g. site-wide power failure) with each PRD activation being counted separately. Multiple PRDs that function as a system (e.g. to either handle large relief loads or to minimize the potential for chattering, Safety Valve (SV) and rupture disk combinations) are to be counted as a single device. Activation of PRDs to be counted as Tier 3 PSEs includes the following:
— Safety Valve (SV)—If activation is known it should be counted. Exclude times when the SV lifts early or leaks when the pressure is below the SV set point.
— Rupture Disc—Count each time the disc is replaced excluding regularly scheduled preventive maintenance.
— Rupture Pin Device—Count each time a pin is replaced excluding regularly scheduled preventive maintenance.
— Deflagration Vent—Count each time the vent must be re-seated excluding regularly scheduled preventive maintenance.
— Pressure/Vacuum (PV) Vents (e.g. on tanks)—Count only events in which the PV vent fails to function. This is typically indicated by damage to the tank.
16 API RECOMMENDED PRACTICE 754
7.2.3.3 Calculation
The count of Demands on Safety Systems is typically segregated by system type (e.g. SIS, PRD, and Mechanical Trip). Some Companies may find that a rate of demands per safety system type provides a more useful indicator than a simple count. Tier 3 Demands on Safety Systems may be subcategorized as follows:
— number of SIS activations;
— number of mechanical trip activations;
— number of Tier 3 PRDs directly to atmosphere;
— number of Tier 3 PRDs to atmosphere via a downstream destructive device.
7.2.4 Other LOPC Events
Companies may find it useful to collect information on LOPC incidents with a consequence less than Tier 2 PSEs (e.g. any fire or explosion, small releases). Companies that choose to collect this information will need to establish consequence thresholds meaningful to its operations and meaningful to its process safety goals. Consequences should reflect potential process safety hazards rather than health (e.g. personnel exposure limits) or environmental (e.g. fugitive emissions) hazards.
7.2.4.1 Indicator Definition
LOPC events not counted as Tier 1 or Tier 2 PSEs.
7.2.4.2 Indicator Data Capture
Count of other LOPCs defined by site determined categories.
8 Tier 4 Performance Indicators—Operating Discipline & Management System Performance
The example indicators presented in this section represent a starting point for the thought process that must take place within each Company and at each facility. Tier 4 performance indicators must reflect facility-specific barrier systems, facility-specific performance objectives, and the maturity of any existing performance indicators. The thought process for creating appropriate and useful performance indicators is given in Section 9.
8.1 Purpose of Indicator
Tier 4 indicators typically represent performance of individual components of the barrier system and are comprised of operating discipline and management system performance. Indicators at this level provide an opportunity to identify and correct isolated system weaknesses. Tier 4 indicators are indicative of process safety system weaknesses that may contribute to future Tier 1 or Tier 2 PSEs. In that sense, Tier 4 indicators may identify opportunities for both learning and systems improvement. Tier 4 indicators are intended for internal Company use and for local (site) reporting.
A Company shall develop and use Tier 4 performance indicators. A Company may use all or some of the example indicator topics below, or identify others that are meaningful to its operations.
8.2 Examples of Tier 4 Indicators
The choice of Tier 4 performance indicators should be limited to the meaningful few that are representative of the barrier systems in place at a particular facility. The indicators should be those with the highest predictive ability and

PROCESS SAFETY PERFORMANCE INDICATORS FOR THE REFINING AND PETROCHEMICAL INDUSTRIES 17
those that provide actionable information. The following list of operating discipline and management system performance indicators may be considered:
1) Process Hazard Evaluations Completion—Schedule of process area retrospective and revalidation hazard evaluations completed on time by fully qualified teams.
2) Process Safety Action Item Closure—Percentage and/or number of past-due process safety actions. This may include items from incident investigations, hazard evaluations or compliance audits.
3) Training Completed on Schedule—Percentage of process safety required training sessions completed with skills verification.
4) Procedures Current and Accurate—Percent of process safety required operations and maintenance procedures reviewed or revised as scheduled.
5) Work Permit Compliance—Percent of sampled work permits that met all requirements. This may include permit to enter, hot work, general work, lockout/tagout, etc.
6) Safety Critical Equipment Inspection—Percent of inspections of safety critical equipment completed on time. This may include pressure vessels, storage tanks, piping systems, pressure relief devices, pumps, instruments, control systems, interlocks and emergency shutdown systems, mitigation systems, and emergency response equipment.
7) Safety Critical Equipment Deficiency Management—Response to safety critical inspection findings (e.g. non-functional PRDs and SISs). This may include proper approvals for continued safe operations, sufficient interim safeguards, and timeliness of repairs, replacement, or rerate.
8) Management of Change (MOC) and Pre Start-up Safety Review (PSSR) Compliance—Percent of sampled MOCs and PSSRs that met all requirements and quality standards.
9) Completion of Emergency Response Drills—Percentage of emergency response drills completed as scheduled.
10) Fatigue Risk Management—Key measures of fatigue risk management systems may include: percentage of overtime, number of open shifts, number of extended shifts, number of consecutive shifts worked, number of exceptions, etc.
9 Guidelines for Selection of Process Safety Indicators
9.1 General
This section provides a high-level overview of some key aspects of process safety indicator selection and development. A more complete treatment of this topic can be found in references such as:
— Center for Chemical Process Safety, Guidelines for Process Safety Metrics, American Institute of Chemical Engineers, New York, 2009; [3]
— UK Health and Safety Executive (HSE), “Step-By-Step Guide to Developing Process Safety Performance Indicators, HSG254,” Sudbury, Suffolk, UK, 2006; [9]
— Hopkins, Andrew, “Thinking About Process Safety Indicators,” Working Paper 53, Paper prepared for the Oil and Gas Industry Conference, Manchester, UK, 2007. [7]
18 API RECOMMENDED PRACTICE 754
9.2 Purpose of Indicators
The purpose of process safety indicators is to identify events or conditions that could ultimately lead to higher level consequences. Indicators provide a means to measure activity, status, or performance against requirements and goals. Monitoring and analyzing performance enables Companies to take corrective action as needed. Properly defined and understood indicators can give Companies confidence that the right things are being managed and tracked.
Selection of indicators is important since some indicators may not provide the needed insights to ensure desired performance. Poorly selected or poorly crafted indicators can result in knowledge gaps or may result in unwarranted confidence. More than one indicator and more than one type of indicator are needed to monitor the different dimensions of process safety operating discipline and management system performance.
9.3 Lagging versus Leading Indicators
Lagging indicators tend to be outcome-oriented and retrospective; they describe events that have already occurred and may indicate potential recurring problems and may include fires, releases, and explosions.
Leading indicators tend to be forward-looking and indicate the performance of the key work processes, operating discipline, or protective barriers that prevent incidents. They are designed to give an indication of potential problems or deterioration in key safety systems early enough that corrective actions may be taken.
The differentiation or classification of indicators as lagging or leading is not important. The important point is to capture information that can be acted upon to correct a situation, to identify lessons learned, and communicate this knowledge.
9.4 Characteristics of Effective Indicators
Credible and useful indicators exhibit certain characteristics or meet certain criteria:
— Reliable: They are measurable using an objective or unbiased scale. To be measurable, an indicator needs to be specific and discrete.
— Repeatable: Similar conditions will produce similar results and different trained personnel measuring the same event or data point will obtain the same result.
— Consistent: The units and definitions are consistent across the Company. This is particularly important when indicators from one area of the company will be compared with those of another.
— Independent of Outside Influences: The indicator leads to correct conclusions and is independent of pressure to achieve a specific outcome.
— Relevant: The indicator is relevant to the operating discipline or management system being measured; they have a purpose and lead to actionable response when outside the desired range.
— Comparable: The indicator is comparable with other similar indicators. Comparability may be over time, across a company, or across an industry.
— Meaningful: The indicator includes sufficient data to measure positive or negative change.
— Appropriate for the Intended Audience: The data and indicators reported will vary depending upon the needs of a given audience. Information for senior management and public reporting usually contains aggregated or normalized data and trends, and is provided on a periodic basis (e.g. quarterly or annually). Information for employees and employee representatives is usually more detailed and is reported more frequently.

PROCESS SAFETY PERFORMANCE INDICATORS FOR THE REFINING AND PETROCHEMICAL INDUSTRIES 19
— Timely: The indicator provides information when needed based upon the purpose of the indicator and the needs of the intended audience.
— Easy to Use: Indicators that are hard to measure or derive are less likely to be measured or less likely to be measured correctly.
— Auditable: Indicators should be auditable to ensure they meet the above expectations.
9.5 Selection of Indicators
There are various ways to identify the critical few indicators that can be used to drive process safety performance improvement.
— Use process hazard evaluation and risk assessment findings to identify potential high impact events and the process safety barriers intended to prevent such incidents.
— What can go wrong?
— What are the consequences?
— What is the likelihood?
— Which are the most critical barriers?
— How vulnerable are the barriers to rapid deterioration?
— Use incident investigation and analysis findings to identify process safety barrier failures that contributed to incidents.
— Use shared external learnings to determine what others have successfully used.
Involving employees and employee representatives, process safety professionals, and engineers in the identification process can yield a more complete picture of process safety performance that will aid in indicators selection. Selecting appropriate indicators using unbiased and broad-based input will lead to a high-performing program.
10 Reporting Performance Indicators
10.1 Format and Forum
The purpose of data collection, data analysis, and reporting is to facilitate learning and improvement. The format and forum for reporting data varies depending upon the target audience. Local reporting to employees and employee representatives, community groups and emergency management officials may occur in small group formats where details can be shared and dialog facilitated. Nationwide public reporting for the purpose of trending over time and comparison may occur through industry trade groups.
10.2 Transparency
Companies should have a philosophy of openness and transparency to satisfactorily demonstrate ongoing process safety performance to employees and employee representatives, community groups, government agencies and other key stakeholders. Openness and transparency build credibility among stakeholders and the public at large.
Transparency and self-disclosure require a trust among those reporting and all interested and affected parties that data will be used in good faith to promote performance improvement and learning and not for “disciplinary action” or litigation.

20 API RECOMMENDED PRACTICE 754
10.3 Stakeholder
10.3.1 Broad Access (Nationwide) Public Reporting
Annually, each Company shall publicly report Tier 1 and Tier 2 PSE information specified in Table 3. It should also include other appropriate information based upon the data capture specified in 10.4. The information should be continuously available for at least five years.
Reporting may be directly from an individual company or through industry trade groups, government agencies or other means. Options for public reporting include:
a) Company Specific Reports or Web Sites—When reporting information directly to the public or to other interested parties, Companies may make PSE information readily available on a publicly accessible web site, or as a written report provided upon request by any interested party.
b) Industry Association or Professional Society Reports or Web Sites—API, ACC, NPRA, CCPS, UKPIA, or other petroleum or petrochemical industry associations may collect and report Tier 1 and Tier 2 PSE information. These reports may be in the form of publicly accessible web sites, or as written reports provided upon request by any interested party. The advantage of association or society reporting is that it allows interested parties to view information in one place and enables benchmarking of performance.
c) Government Agency or Other Organizations—Local, state, or national government agencies, or other organizations may elect to establish reporting web sites.
10.3.2 Local (Site) Public Reporting
Each Company’s site should determine the appropriate methods to communicate PSE information to its employees and employee representatives, the local community, and emergency management officials.
Annually, each Company’s site shall report a summary of its site-specific Tier 1, 2, 3, and 4 PSE information to its employees and employee representatives. Unattended, remote-operated or single-manned facilities are exempt from this requirement.
Annually, each Company’s site shall make available a summary of site-specific Tier 1 and 2 PSE information and can report site-specific Tier 3 and 4 PSE information to the local community and emergency management officials along with information regarding measures taken to improve performance. This includes any communities that could reasonably be affected by a LOPC event. Remote sites where the worst potential-case LOPC cannot impact any public receptors are exempt from this requirement.
Table 3—Stakeholder Report Information
Industry Company
Tier 1PSE Count X See Note
PSE Rate X X
Tier 2PSE Count X See Note
PSE Rate X X
NOTE Comparisons among companies and industries are only statistically valid on a rate basis; therefore, Company PSE counts are not reported publicly.

PROCESS SAFETY PERFORMANCE INDICATORS FOR THE REFINING AND PETROCHEMICAL INDUSTRIES 21
10.4 PSE Data Capture
10.4.1 Site Information
The following information shall be captured for each site:
a) type of facility (NAICS or equivalent international code);
b) corporate name;
c) company name (if different);
d) site location/name (country, state/province, city, site name);
e) site identifier(s) (unique number(s) assigned by data collection groups);
f) total work hours:
1) total hours worked by employees, and
2) total hours worked by contractors and subcontractors.
10.4.2 Tier 1 PSE Information
The following information shall be captured for each Tier 1 PSE:
a) site identifier;
b) Tier 1 PSE consequences/triggers,
each Tier 1 PSE will have one or more of the following consequences (check all that apply)5:
1) an employee, contractor, or subcontractor “days away from work” injury and/or fatality:
i) number of employee days away from work injuries,
ii) number of employee fatalities,
iii) number of contractor or subcontractors days away from work injuries,
iv) number of contractor or subcontractor fatalities;
2) a third party (non-employees/contractor, community members) hospital admission and/or fatality:
i) number of third-party hospital admissions,
ii) number of third-party fatalities;
3) an officially declared community evacuation or community shelter-in-place;
5 Since a Tier 1 Process Safety Event can result in one or more consequences, the total count of consequences will be equal to or greater than the total count of Tier 1 PSEs.

22 API RECOMMENDED PRACTICE 754
4) a fire or explosion causing $25,000 or more in direct cost:
i) fire,
ii) explosion;
5) a pressure relief device discharge to atmosphere whether directly or via a downstream destructive device(check one):
i) PRD directly to atmosphere,
ii) PRD to atmosphere via a downstream destructive device;
that results in one or more of the following four consequences (check all that apply):
i) contained liquid carryover,
ii) discharged to an unsafe location,
iii) resulted in an on-site shelter-in-place,
iv) resulted in public protective measures (e.g., road closure);
and a PRD discharge quantity greater than the threshold quantities in Table 1 in any one-hour period.
6) an acute release of flammable, toxic, or corrosive chemicals from primary containment (check one):
i) Tier 1 (Table 1) Threshold Release Category 1,
ii) Tier 1 (Table 1) Threshold Release Category 2,
iii) Tier 1 (Table 1) Threshold Release Category 3,
iv) Tier 1 (Table 1) Threshold Release Category 4,
v) Tier 1 (Table 1) Threshold Release Category 5,
vi) Tier 1 (Table 1) Threshold Release Category 6,
vii) Tier 1 (Table 1) Threshold Release Category 7.
release location (check one):
i) outdoor release,
ii) indoor release.
10.4.3 Tier 2 PSE Information
The following information shall be captured for each Tier 2 PSE:
a) site identifier;
b) Tier 2 PSE consequences/triggers,

PROCESS SAFETY PERFORMANCE INDICATORS FOR THE REFINING AND PETROCHEMICAL INDUSTRIES 23
each Tier 2 PSE will have one or more of the following consequences (check all that apply)6:
1) an employee, contractor, or subcontractor recordable injury:
i) number of employee recordable injuries,
ii) number of contractor or subcontractor recordable injuries;
2) a fire or explosion causing $2,500 or more in direct cost:
i) fire,
ii) explosion;
3) a pressure relief device discharge to atmosphere whether directly or via a downstream destructive device(check one):
i) PRD directly to atmosphere,
ii) PRD to atmosphere via a downstream destructive device;
that results in one or more of the following four consequences (check all that apply):
i) contained liquid carryover,
ii) discharged to an unsafe location,
iii) resulted in an on-site shelter-in-place,
iv) resulted in public protective measures (e.g. road closure);
and a PRD discharge quantity greater than the threshold quantities in Table 2 in any one-hour period;
4) an acute release of flammable, combustible, toxic, or corrosive chemicals from primary containment(check one):
i) Tier 2 (Table 2) Threshold Release Category 1,
ii) Tier 2 (Table 2) Threshold Release Category 2,
iii) Tier 2 (Table 2) Threshold Release Category 3,
iv) Tier 2 (Table 2) Threshold Release Category 4,
v) Tier 2 (Table 2) Threshold Release Category 5,
vi) Tier 2 (Table 2) Threshold Release Category 6,
vii)Tier 2 (Table 2) Threshold Release Category 7.
release location (check one):
i) outdoor release,
ii) indoor release.
6 Since a Tier 2 Process Safety Event can result in one or more consequences, the total count of consequences will be equal toor greater than the total count of Tier 2 PSEs.

24 API RECOMMENDED PRACTICE 754
10.4.4 PSE Related Information
The following information is useful in data analysis and shall be captured for each Tier 1 and Tier 2 PSE.
a) Type of process:
1) Refining Processes (check one):
i) HF alkylation,
ii) sulfuric alkylation
iii) bitumen/resid/asphalt,
iv) calcining,
v) coking,
vi) crude,
vii) desulfurization,
viii) fcc,
ix) gas treating (H2S absorbers and amine systems),
x) hydrogen,
xi) hydrotreating/hydrocracking,
xii) isom,
xiii) marine/jetty,
xiv) reforming,
xv) sulfur recovery,
xvi) tank farm/offsites,
xvii) utilities/steam plant/cogeneration,
xviii) vapor recovery/light ends,
xix) wastewater,
xx) other;
2) Petrochemical and Other Processes—not an appropriate aggregation due to the wide variety of petrochemical and other processes.
b) Date and time of event.
c) Mode of operation (check one):
i) start-up,
ii) planned shutdown,
iii) emergency shutdown,

PROCESS SAFETY PERFORMANCE INDICATORS FOR THE REFINING AND PETROCHEMICAL INDUSTRIES 25
iv) normal,
v) upset,
vi) turnaround,
vii) routine maintenance,
viii) temporary,
ix) other.
d) Point of release (check one):
i) pump,
ii) compressor,
iii) blower/fan,
iv) pressure vessel (drum, tower, pressurized storage),
v) filter/coalescer,
vi) furnace,
vii) boiler,
viii) heat exchanger,
ix) cooling tower,
x) piping system (piping, gaskets, site glasses, expansion joints, tubing, valves),
xi) reactor,
xii) atmospheric tank,
xiii) flare/relief system,
xiv) other.
e) Type of material released (check one):
i) flammable,
ii) combustible,
iii) toxic,
iv) corrosive,
v) utilities (e.g. air, water, steam, nitrogen, etc.)
vi) other.
f) Comments.
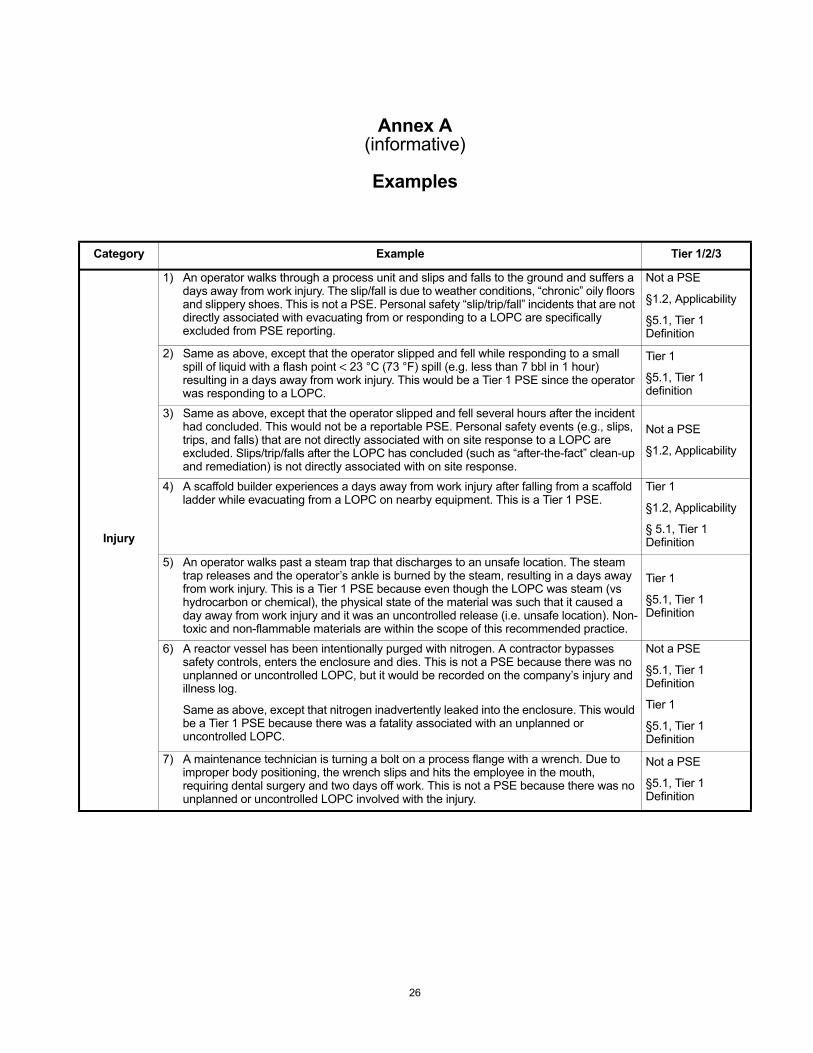
Annex A(informative)
Examples
Category Example Tier 1/2/3
Injury
1) An operator walks through a process unit and slips and falls to the ground and suffers a days away from work injury. The slip/fall is due to weather conditions, “chronic” oily floors and slippery shoes. This is not a PSE. Personal safety “slip/trip/fall” incidents that are not directly associated with evacuating from or responding to a LOPC are specifically excluded from PSE reporting.
Not a PSE
§1.2, Applicability
§5.1, Tier 1 Definition
2) Same as above, except that the operator slipped and fell while responding to a small spill of liquid with a flash point < 23 °C (73 °F) spill (e.g. less than 7 bbl in 1 hour) resulting in a days away from work injury. This would be a Tier 1 PSE since the operator was responding to a LOPC.
Tier 1
§5.1, Tier 1 definition
3) Same as above, except that the operator slipped and fell several hours after the incident had concluded. This would not be a reportable PSE. Personal safety events (e.g., slips, trips, and falls) that are not directly associated with on site response to a LOPC are excluded. Slips/trip/falls after the LOPC has concluded (such as “after-the-fact” clean-up and remediation) is not directly associated with on site response.
Not a PSE
§1.2, Applicability
4) A scaffold builder experiences a days away from work injury after falling from a scaffold ladder while evacuating from a LOPC on nearby equipment. This is a Tier 1 PSE.
Tier 1
§1.2, Applicability
§ 5.1, Tier 1 Definition
5) An operator walks past a steam trap that discharges to an unsafe location. The steam trap releases and the operator’s ankle is burned by the steam, resulting in a days away from work injury. This is a Tier 1 PSE because even though the LOPC was steam (vs hydrocarbon or chemical), the physical state of the material was such that it caused a day away from work injury and it was an uncontrolled release (i.e. unsafe location). Non-toxic and non-flammable materials are within the scope of this recommended practice.
Tier 1
§5.1, Tier 1 Definition
6) A reactor vessel has been intentionally purged with nitrogen. A contractor bypasses safety controls, enters the enclosure and dies. This is not a PSE because there was no unplanned or uncontrolled LOPC, but it would be recorded on the company’s injury and illness log.
Same as above, except that nitrogen inadvertently leaked into the enclosure. This would be a Tier 1 PSE because there was a fatality associated with an unplanned or uncontrolled LOPC.
Not a PSE
§5.1, Tier 1 Definition
Tier 1
§5.1, Tier 1 Definition
7) A maintenance technician is turning a bolt on a process flange with a wrench. Due to improper body positioning, the wrench slips and hits the employee in the mouth, requiring dental surgery and two days off work. This is not a PSE because there was no unplanned or uncontrolled LOPC involved with the injury.
Not a PSE
§5.1, Tier 1 Definition
26

PROCESS SAFETY PERFORMANCE INDICATORS FOR THE REFINING AND PETROCHEMICAL INDUSTRIES 27
Fire or
Explosion
8) A scaffold board is placed near a high pressure steam pipe and subsequently begins to burn, but is quickly extinguished with no further damage. The investigation finds that the board had been contaminated by some oil, but there is no indication of an oil leak in the area. This is not a PSE since there was no unplanned or uncontrolled LOPC.
Not a PSE
§5.1, Tier 1 definition
§6.2, Tier 2 definition
9) An internal deflagration in a vessel causes equipment damage > $25,000, but there was no loss of containment. While this is a serious process event and should be investigated as such, it does not meet the definition of a PSE because there was no LOPC involved. Rare or unique events with actual serious consequences that do not meet the strict definition of a Tier 1 or 2 PSE, may be classified and reported at a Company’s discretion.
Not a PSE
§5.1, Tier 1 Definition
10) An electrical fire impacts the operation of the process resulting in an acute release of 4,000 lb of toluene. This is a Tier 1 PSE since the LOPC exceeds the 2200 lb reporting threshold for toluene.
Tier 1
§5.1, Table 1
11) An electrical fire, loss of electricity, or any other loss of utility may occur that causes a plant shutdown and possibly incidental equipment damage greater than $25,000 (e.g. damage to reactors or equipment due to inadequate shutdown), but since it does not create a LOPC release it is not a PSE.
Not a PSE
§5.1, Tier 1 Definition
12) A pump lube oil system fire from a leak causes damage greater than $25,000, but does not create a LOPC greater than the threshold quantity or cause a fatality or serious injury. This is a Tier 1 PSE since the damage was greater than $25,000.
Tier 1
§5.1, Tier 1 Definition
13) A forklift truck delivering materials inside a process unit knocks off a bleeder valve leading to the release of isopentane and a subsequent vapor cloud explosion with asset damage greater than $25,000. This is a Tier 1 PSE since an unplanned or uncontrolled LOPC resulted in a fire or explosion causing greater than $25,000 damage.
Tier 1
§5.1, Tier 1 Definition
14) There is a boiler fire at the Main Office complex, and direct cost damages totaled $75,000. The incident is not a PSE since office building events are specifically excluded.
Not a PSE
§1.2, Applicability
15) Hydrocarbon fumes migrate into the QA/QC laboratory located within the facility and results in a fire with $5000 damage. The source of the hydrocarbon fumes is the oily water sewer system. This incident is a Tier 2 PSE since the LOPC was from the process and resulted in a Tier 2 consequence (a fire which results in a direct cost greater than $2500).
Tier 2
§6.2, Tier 2 Definition
Category Example Tier 1/2/3

28 API RECOMMENDED PRACTICE 754
Loss of Primary
Containment
(LOPC)
16) Ten bbl of gasoline (1400 kg, 3100 lb) leak from piping onto concrete and the gasoline doesn't reach soil or water. Site personnel estimate that the leak occurred within one hour. This is a Tier 1 PSE because there was a LOPC of 7 bbl (1,000 kg, 2200 lb) or more of liquid with a flash point < 23 °C (73 °F) in any one-hour period.
If the spill had been less than 2200 lb, but equal to or greater than 250 lb (1 bbl), it would be a Tier 2 PSE.
Tier 1 §5.1, Tier 1 Definition and Table 1
Tier 2 §6.2, Table 2
17) A faulty tank gauge results in the overfilling of a product tank containing liquid with a flash point < 23 °C (73 °F). Approximately 50 bbl (7000 kg, 15,500 lb) of liquid overflows into the tank’s diked area. This incident is a Tier 1 PSE since it is a release of 2200 lb or more within any one-hour period, regardless of secondary containment.
If the spill had been < 2200 lb, but equal to or greater than 220 lb (1 bbl), it would be a Tier 2 PSE.
Tier 1 §5.1, Tier 1 Definition and Table 1
Tier 2 §6.2, Table 2
18) A maintenance contractor opens a process valve and gets sprayed with less than the Tier 1 or Tier 2 TQ of sulfuric acid resulting in a severe burn and days away from work injury. This is a Tier 1 PSE because it is an unplanned or uncontrolled LOPC that resulted in a days away from work injury.
If this incident had resulted in a recordable injury, it would be a Tier 2 PSE.
Tier 1 §5.1, Tier 1 Definition
Tier 2 §6.2, Tier 2 Definition
19) An operator opens a quality control sample point to collect a routine sample of product and material splashes on him. The operator runs to a safety shower leaving the sample point open and a Tier 2 threshold quantity is released. This is a Tier 2 PSE since the release of a threshold quantity was unplanned or uncontrolled.
Same as above, however, the operator catches the sample, blocks in the sample point and later drops and breaks the sample container resulting in exposure and injury from the sample contents. This is not a PSE because the LOPC is from a piece of ancillary equipment not connected to a process.
Tier 2 §6.2, Tier 2 Definition
Not a PSE §1.2, Applicability
20) A bleeder valve is left open after a plant turnaround. On start-up, an estimated 15 bbl of fuel oil, a liquid with a flashpoint above 60 °C (140 °F), is released at 38 °C (100 °F) (below its flashpoint) onto the ground within an hour and into the plant’s drainage system before the bleeder is found and closed. This is a Tier 2 PSE.
Same as above, except the release temperature is above the flashpoint; thus, it would be a Tier 1 PSE.
Tier 2 §6.2, Table 2
Tier 1 §5.1, Table 1
21) There is a loss of burner flame in a fired heater resulting in a fuel rich environment and subsequent explosion in the fire box with greater than $25,000 in damages to the internals of the heater. There was no release outside of the fire box. This would be a Tier 1 PSE since after the flameout the continuing flow of fuel gas is now an uncontrolled release. The intent is for combustion of the fuel gas at the burner and not for fuel gas to be contained in the fire box.
If this same incident had resulted in less than $25,000 in damages, but greater than $2500 in damages, it would be a Tier 2 PSE since there was an explosion resulting in greater than $2500 in damages.
Tier 1 §5.1, Definition
Tier 2 §6.2, Tier 2 Definition
22) There is a tube rupture in a fired heater causing a fire (contained in the heater) resulting in greater than $25,000 in damages to the heater internals (beyond that of replacing the failed tube). The tube failure is a loss of primary containment of the process fluid and combined with the additional damages greater than $25,000 makes this a Tier 1 PSE.
Same as above, except the operator detects the tube cracking with only a small flame from the tube and subsequently shuts down the heater with no resultant damage from the tube flame. This would not be a Tier 1 or Tier 2 PSE since the LOPC did not result in any of the defined consequences. A company may choose to record this as a Tier 3 “Other LOPC Event.”
Tier 1 §5.1, Definition
Tier 3
Category Example Tier 1/2/3
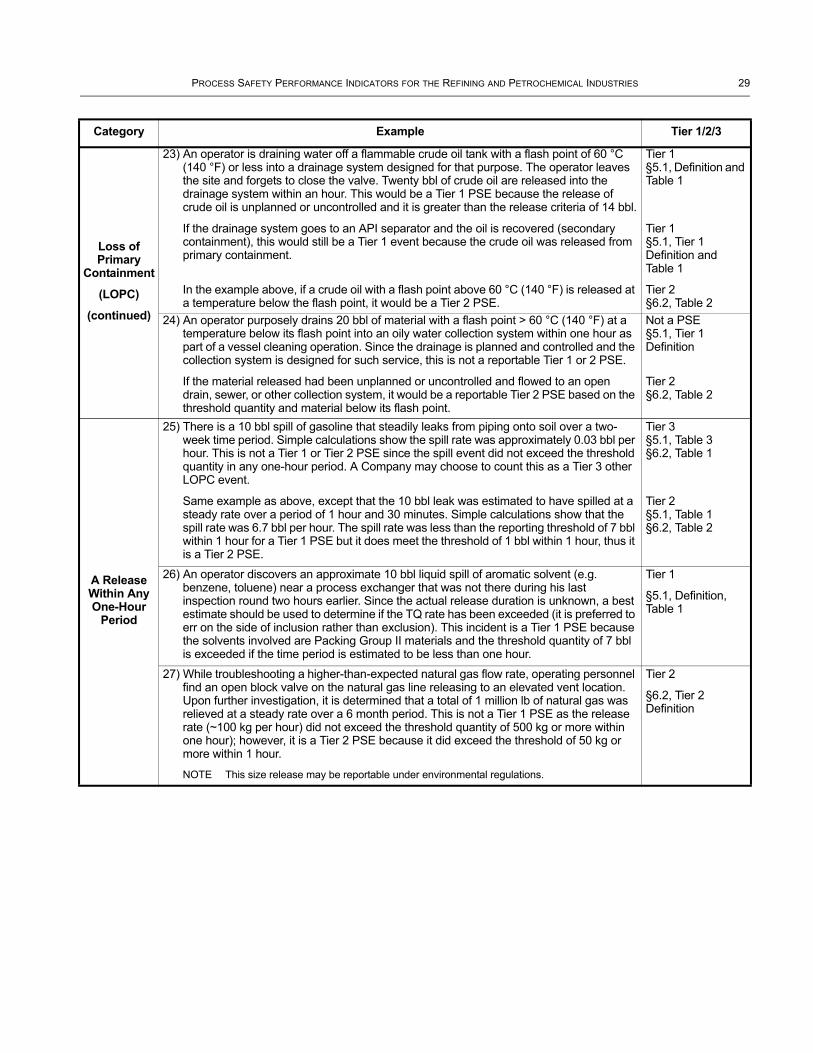
PROCESS SAFETY PERFORMANCE INDICATORS FOR THE REFINING AND PETROCHEMICAL INDUSTRIES 29
Loss of Primary
Containment
(LOPC)
(continued)
23) An operator is draining water off a flammable crude oil tank with a flash point of 60 °C (140 °F) or less into a drainage system designed for that purpose. The operator leaves the site and forgets to close the valve. Twenty bbl of crude oil are released into the drainage system within an hour. This would be a Tier 1 PSE because the release of crude oil is unplanned or uncontrolled and it is greater than the release criteria of 14 bbl.
If the drainage system goes to an API separator and the oil is recovered (secondary containment), this would still be a Tier 1 event because the crude oil was released from primary containment.
In the example above, if a crude oil with a flash point above 60 °C (140 °F) is released at a temperature below the flash point, it would be a Tier 2 PSE.
Tier 1 §5.1, Definition and Table 1
Tier 1 §5.1, Tier 1 Definition and Table 1
Tier 2 §6.2, Table 2
24) An operator purposely drains 20 bbl of material with a flash point > 60 °C (140 °F) at a temperature below its flash point into an oily water collection system within one hour as part of a vessel cleaning operation. Since the drainage is planned and controlled and the collection system is designed for such service, this is not a reportable Tier 1 or 2 PSE.
If the material released had been unplanned or uncontrolled and flowed to an open drain, sewer, or other collection system, it would be a reportable Tier 2 PSE based on the threshold quantity and material below its flash point.
Not a PSE §5.1, Tier 1 Definition
Tier 2 §6.2, Table 2
A Release Within Any One-Hour
Period
25) There is a 10 bbl spill of gasoline that steadily leaks from piping onto soil over a two-week time period. Simple calculations show the spill rate was approximately 0.03 bbl per hour. This is not a Tier 1 or Tier 2 PSE since the spill event did not exceed the threshold quantity in any one-hour period. A Company may choose to count this as a Tier 3 other LOPC event.
Same example as above, except that the 10 bbl leak was estimated to have spilled at a steady rate over a period of 1 hour and 30 minutes. Simple calculations show that the spill rate was 6.7 bbl per hour. The spill rate was less than the reporting threshold of 7 bbl within 1 hour for a Tier 1 PSE but it does meet the threshold of 1 bbl within 1 hour, thus it is a Tier 2 PSE.
Tier 3 §5.1, Table 3 §6.2, Table 1
Tier 2 §5.1, Table 1 §6.2, Table 2
26) An operator discovers an approximate 10 bbl liquid spill of aromatic solvent (e.g. benzene, toluene) near a process exchanger that was not there during his last inspection round two hours earlier. Since the actual release duration is unknown, a best estimate should be used to determine if the TQ rate has been exceeded (it is preferred to err on the side of inclusion rather than exclusion). This incident is a Tier 1 PSE because the solvents involved are Packing Group II materials and the threshold quantity of 7 bbl is exceeded if the time period is estimated to be less than one hour.
Tier 1
§5.1, Definition, Table 1
27) While troubleshooting a higher-than-expected natural gas flow rate, operating personnel find an open block valve on the natural gas line releasing to an elevated vent location. Upon further investigation, it is determined that a total of 1 million lb of natural gas was relieved at a steady rate over a 6 month period. This is not a Tier 1 PSE as the release rate (~100 kg per hour) did not exceed the threshold quantity of 500 kg or more within one hour); however, it is a Tier 2 PSE because it did exceed the threshold of 50 kg or more within 1 hour.
NOTE This size release may be reportable under environmental regulations.
Tier 2
§6.2, Tier 2 Definition
Category Example Tier 1/2/3

30 API RECOMMENDED PRACTICE 754
Mixtures
28) A pipe fitting in a specialty chemicals plant fails, releasing 4000 lb of a mixture of 30 % formaldehyde, 45 % methanol, and 25 % water in less than one hour. This mixture is not classified by the UN Dangerous Goods/U.S. DOT protocols; therefore, the threshold quantity mixture calculation is applied. The pure component reporting threshold of formaldehyde is 4400 lb and methanol is 2200 lb.
Component wt. % Release Qty PSE TQ % of TQ (lb) (lb)
Formaldehyde 30 % 1200 4400 27.3 %
Methanol 45 % 1800 2200 81.8 %
Water 25 % 1000 n/a 0 %
109.1 %
This release is a Tier 1 PSE since the cumulative percentage exceeds 100 % even though the individual components do not exceed their individual threshold quantities.
NOTE This is an alternative shortcut approach and can give more or less conservative results. A more precise approach is to use the rules of DOT 49 CFR 173.2a [14] or UN Recommendations on the Transportation of Dangerous Goods, Section 2 [10].
Tier 1
§5.1, Table 1, Footnote d
29) A leak on a high pressure hydrochloric acid line results in a spill of 1900 lb of hydrochloric acid. Flash calculations indicate that greater than 220 lb of hydrogen chloride would be released as a vapor. The 1900 lb release of hydrochloric acid is not a reportable Tier 1 PSE since this liquid is categorized as a “Packing Group II” corrosive liquid with a 2200 lb reporting threshold. However, since the liquid flashed or was sprayed out as an aerosol, producing more than 220 lb of hydrogen chloride, the event would be a reportable Tier 1 PSE due to exceeding the 100 kg (~220 lb) or more of toxic chemical within 1 hour.
Tier 1
§5.1, Definition
30) A pipe containing CO2 and 10,000 vppm H2S (1 % by volume) leaks and 7000 kg (15,400 lb) of the gas is released within an hour. Calculations show that the release involved about 55 kg (121 lb) of H2S (TIH Zone B chemical). The release is a Tier 1 PSE because it exceeded the threshold quantity.
If the H2S concentration is 50 vppm, then the calculated release quantity would be 0.3 kg of H2S. The release would not be a Tier 1 or Tier 2 PSE since this amount is below the 25 kg (55 lb) and 2.5 kg (5.5 lb) thresholds for H2S. A company may choose to count this as a Tier 3 other LOPC.
Tier 1 §5.1, Table 1
Tier 3
Pressure Relief Device
31) There is a unit upset and the PRD opens to an atmospheric vent that has been designed per API 521 for that scenario, resulting in a release of 300 lb of propane to the atmosphere with no adverse consequences. Although the release exceeded the Tier 2 threshold quantity, because it did not result in one of the defined negative consequences, it is not a Tier 2 PSE. A company may choose to count this as a Tier 3 event since it is an activation of a PRD that was not counted in Tier 1 or 2.
Same as above, but there was an on-site shelter-in-place. This is not a Tier 1 PSE because it did not exceed the threshold quantity requirement. This is a Tier 2 PSE because it both exceeded the threshold quantity and resulted in one of the defined negative consequences.
Tier 3
Tier 2
§6.2, Tier 2 Definition
32) A chlorine vessel has a PRD that was identified in a recent PHA to be undersized. In the process of making a transfer, the vessel overpressures. A release of 60 pounds of chlorine gas (TIH Zone B material) occurs through this PRD to a safe location over a period of 25 minutes. This would not be a Tier 1 or Tier 2 PSE, regardless of the HAZOP finding, so long as it did not result in a liquid carryover, on-site shelter-in-place, public protective measure or other indication of discharge to an unsafe location. A company may count this as a Tier 3 PSE since it was an atmospheric release from a PRD.
Tier 3
§5.1, Definition and Table 1
§6.2, Definition and Table 2
33) There is a unit upset and the PRD fails to open, resulting in overpressure of the equipment and a 10-minute release of 2000 lb of butane (Packing Group I) from a leaking flange before it can be blocked in. This is a Tier 1 PSE.
Tier 1
§5.1, Definition and Table 1
Category Example Tier 1/2/3

PROCESS SAFETY PERFORMANCE INDICATORS FOR THE REFINING AND PETROCHEMICAL INDUSTRIES 31
Company Premises
PSEs with Multiple
Outcomes
Pipelines
34) A pipeline leaks and releases 2000 lb of flammable vapor above ground within one hour; however, the release occurred in a remote location within the site. This is a Tier 1 PSE since the release occurred within the process or storage areas of the site (“remoteness” is not a consideration) and it exceeds a Tier 1 threshold quantity.
Tier 1
§5.1, Definition and Table 1
35) A pipeline leaks and releases 2000 lb of flammable vapor above ground within 1 hour. A public road bisects the main facility and its marine docks. This pipeline originates in the facility and goes to the docks. The leak site happens to be off the site’s property in the short segment of piping that runs over the public road. Although the leak technically occurs off-site, this is a Tier 1 PSE since the facility owns and operates the entire segment of pipeline.
Tier 1
§1.2, Applicability
§5.1, Definition and Table 1
36) A third-party truck loaded with a flammable product is traveling on Company premises and experiences a leak and subsequent fire and property damages of $75,000 (direct costs). The incident would not be a Tier 1 or Tier 2 PSE because truck incidents are excluded, except when they are connected to the process for the purposes of feedstock or product transfer.
Same as above except, the third party truck is parked and being used for temporary on-site storage. This would be a Tier 1 PSE since the applicability exclusion does not include the use of trucks or railcars for on site storage.
Not a PSE §1.2, Applicability
Tier 1 1.2 Applicability
37) There is a 200 bbl spill of liquid with a flash point < 23 °C (73 °F) that ignites and results in damages to other equipment, a toxic gas release above the reporting threshold, along with three days away from work injuries and one fatality. This is a Tier 1 PSE. The site would record a single event with multiple consequences (e.g., one fatality, three day away from work injuries, fire, and threshold quantity of liquid with a flash point < 23 °C (73 °F) and toxic gas).
Tier 1
§5.1, Definition
38) An underground pipeline operated by the facility leaks and releases 1000 bbl of diesel (flash point > 60 °C (140 °F)) at a temperature below its flash point within the facility over a period of three days (13.9 bbl/hr). The spill results in contaminated soil that is subsequently remediated. This is a Tier 2 PSE since the leak rate was greater than the Tier 2 threshold quantity.
Tier 2
§6.2, Table 2
39) A DOT covered pipeline that is owned, operated, and maintained by Company A crosses through Company B’s property. The DOT covered line has a 1500 lb release within an hour from primary containment of flammable gas and causes a fire resulting in greater than $25,000 damage to Company A’s equipment. This is not a PSE for Company B since the pipeline is not owned, operated or maintained by Company B. This would be a transportation incident for Company A.
Not a PSE
§1.2, Applicability
Marine Transport
40) A Company operated Marine Transport Vessel that had just disconnected from the process has an onboard 14 bbl spill of material with a flash point > 60 °C (140 °F) released at a temperature below its flash point. The event is not a PSE since Marine Transport Vessel incidents are specifically excluded, except when the vessel is connected to the process for the purposes of feedstock or product transfer.
If the marine transport vessel was still connected to the process when the spill occurred, it would be a Tier 2 PSE.
Not a PSE §1.2, Applicability
Tier 2 §1.2, Applicability §6.2, Tier 2 Definition and Table 2
41) A third-party barge is being pushed by a tug and hits the Company dock. A barge compartment is breached and releases 50 bbl of diesel to the water. The event is not a PSE since the barge was not connected to the process for the purpose of feedstock or product transfer.
Not a PSE
§1.2, Applicability
Category Example Tier 1/2/3
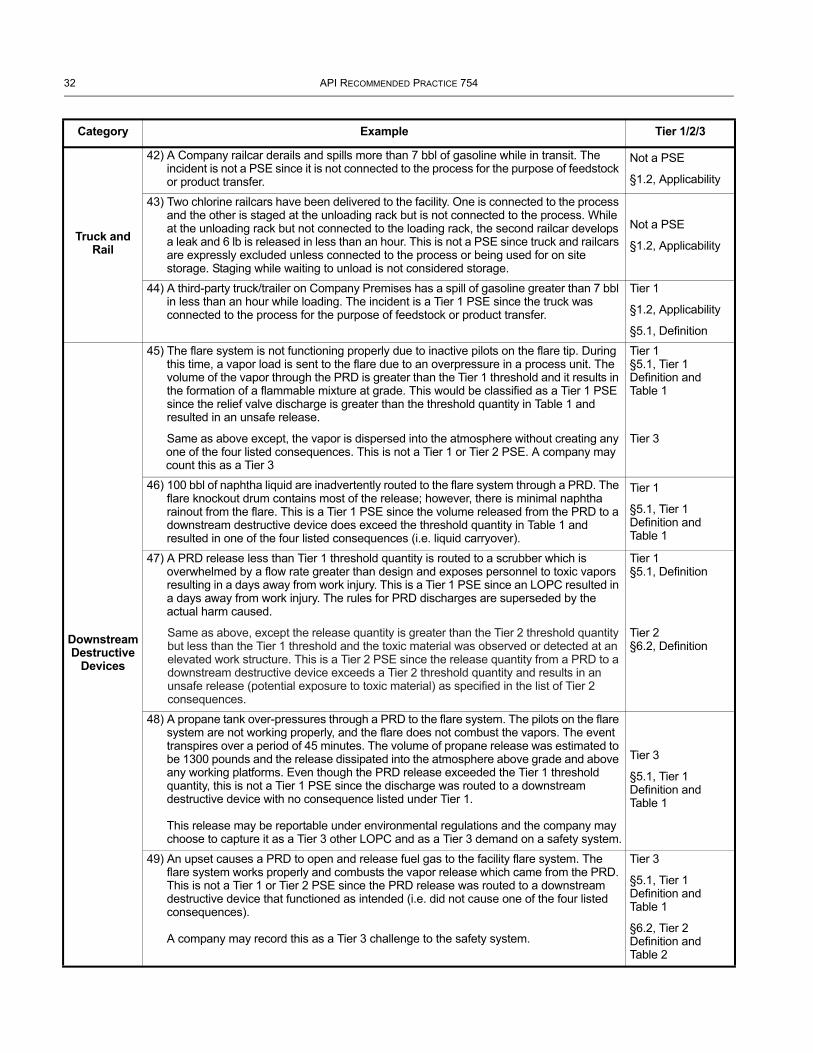
32 API RECOMMENDED PRACTICE 754
Truck and Rail
42) A Company railcar derails and spills more than 7 bbl of gasoline while in transit. The incident is not a PSE since it is not connected to the process for the purpose of feedstock or product transfer.
Not a PSE
§1.2, Applicability
43) Two chlorine railcars have been delivered to the facility. One is connected to the process and the other is staged at the unloading rack but is not connected to the process. While at the unloading rack but not connected to the loading rack, the second railcar develops a leak and 6 lb is released in less than an hour. This is not a PSE since truck and railcars are expressly excluded unless connected to the process or being used for on site storage. Staging while waiting to unload is not considered storage.
Not a PSE
§1.2, Applicability
44) A third-party truck/trailer on Company Premises has a spill of gasoline greater than 7 bbl in less than an hour while loading. The incident is a Tier 1 PSE since the truck was connected to the process for the purpose of feedstock or product transfer.
Tier 1
§1.2, Applicability
§5.1, Definition
Downstream Destructive
Devices
45) The flare system is not functioning properly due to inactive pilots on the flare tip. During this time, a vapor load is sent to the flare due to an overpressure in a process unit. The volume of the vapor through the PRD is greater than the Tier 1 threshold and it results in the formation of a flammable mixture at grade. This would be classified as a Tier 1 PSE since the relief valve discharge is greater than the threshold quantity in Table 1 and resulted in an unsafe release.
Same as above except, the vapor is dispersed into the atmosphere without creating any one of the four listed consequences. This is not a Tier 1 or Tier 2 PSE. A company may count this as a Tier 3
Tier 1 §5.1, Tier 1 Definition and Table 1
Tier 3
46) 100 bbl of naphtha liquid are inadvertently routed to the flare system through a PRD. The flare knockout drum contains most of the release; however, there is minimal naphtha rainout from the flare. This is a Tier 1 PSE since the volume released from the PRD to a downstream destructive device does exceed the threshold quantity in Table 1 and resulted in one of the four listed consequences (i.e. liquid carryover).
Tier 1
§5.1, Tier 1 Definition and Table 1
47) A PRD release less than Tier 1 threshold quantity is routed to a scrubber which is overwhelmed by a flow rate greater than design and exposes personnel to toxic vapors resulting in a days away from work injury. This is a Tier 1 PSE since an LOPC resulted in a days away from work injury. The rules for PRD discharges are superseded by the actual harm caused.
Same as above, except the release quantity is greater than the Tier 2 threshold quantity but less than the Tier 1 threshold and the toxic material was observed or detected at an elevated work structure. This is a Tier 2 PSE since the release quantity from a PRD to a downstream destructive device exceeds a Tier 2 threshold quantity and results in an unsafe release (potential exposure to toxic material) as specified in the list of Tier 2 consequences.
Tier 1 §5.1, Definition
Tier 2 §6.2, Definition
48) A propane tank over-pressures through a PRD to the flare system. The pilots on the flare system are not working properly, and the flare does not combust the vapors. The event transpires over a period of 45 minutes. The volume of propane release was estimated to be 1300 pounds and the release dissipated into the atmosphere above grade and above any working platforms. Even though the PRD release exceeded the Tier 1 threshold quantity, this is not a Tier 1 PSE since the discharge was routed to a downstream destructive device with no consequence listed under Tier 1. This release may be reportable under environmental regulations and the company may choose to capture it as a Tier 3 other LOPC and as a Tier 3 demand on a safety system.
Tier 3
§5.1, Tier 1 Definition and Table 1
49) An upset causes a PRD to open and release fuel gas to the facility flare system. The flare system works properly and combusts the vapor release which came from the PRD. This is not a Tier 1 or Tier 2 PSE since the PRD release was routed to a downstream destructive device that functioned as intended (i.e. did not cause one of the four listed consequences). A company may record this as a Tier 3 challenge to the safety system.
Tier 3
§5.1, Tier 1 Definition and Table 1
§6.2, Tier 2 Definition and Table 2
Category Example Tier 1/2/3
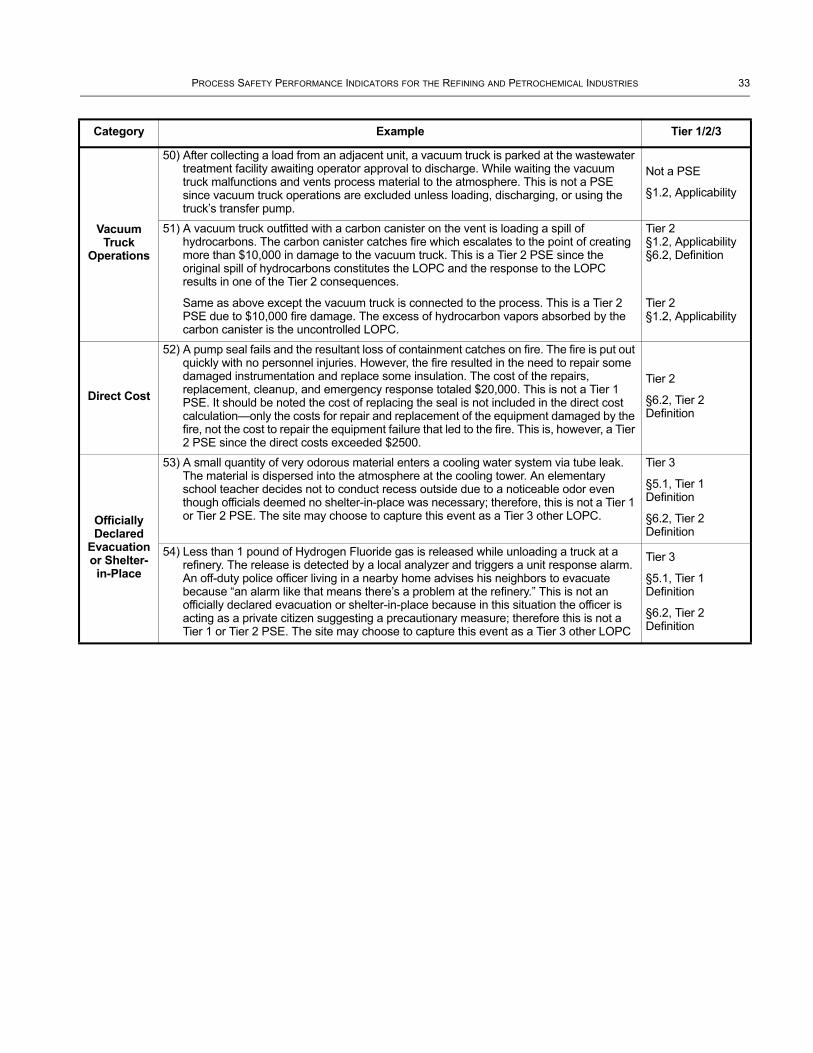
PROCESS SAFETY PERFORMANCE INDICATORS FOR THE REFINING AND PETROCHEMICAL INDUSTRIES 33
Vacuum Truck
Operations
50) After collecting a load from an adjacent unit, a vacuum truck is parked at the wastewater treatment facility awaiting operator approval to discharge. While waiting the vacuum truck malfunctions and vents process material to the atmosphere. This is not a PSE since vacuum truck operations are excluded unless loading, discharging, or using the truck’s transfer pump.
Not a PSE
§1.2, Applicability
51) A vacuum truck outfitted with a carbon canister on the vent is loading a spill of hydrocarbons. The carbon canister catches fire which escalates to the point of creating more than $10,000 in damage to the vacuum truck. This is a Tier 2 PSE since the original spill of hydrocarbons constitutes the LOPC and the response to the LOPC results in one of the Tier 2 consequences.
Same as above except the vacuum truck is connected to the process. This is a Tier 2 PSE due to $10,000 fire damage. The excess of hydrocarbon vapors absorbed by the carbon canister is the uncontrolled LOPC.
Tier 2 §1.2, Applicability §6.2, Definition
Tier 2 §1.2, Applicability
Direct Cost
52) A pump seal fails and the resultant loss of containment catches on fire. The fire is put out quickly with no personnel injuries. However, the fire resulted in the need to repair some damaged instrumentation and replace some insulation. The cost of the repairs, replacement, cleanup, and emergency response totaled $20,000. This is not a Tier 1 PSE. It should be noted the cost of replacing the seal is not included in the direct cost calculation—only the costs for repair and replacement of the equipment damaged by the fire, not the cost to repair the equipment failure that led to the fire. This is, however, a Tier 2 PSE since the direct costs exceeded $2500.
Tier 2
§6.2, Tier 2 Definition
Officially Declared
Evacuation or Shelter-
in-Place
53) A small quantity of very odorous material enters a cooling water system via tube leak. The material is dispersed into the atmosphere at the cooling tower. An elementary school teacher decides not to conduct recess outside due to a noticeable odor even though officials deemed no shelter-in-place was necessary; therefore, this is not a Tier 1 or Tier 2 PSE. The site may choose to capture this event as a Tier 3 other LOPC.
Tier 3
§5.1, Tier 1 Definition
§6.2, Tier 2 Definition
54) Less than 1 pound of Hydrogen Fluoride gas is released while unloading a truck at a refinery. The release is detected by a local analyzer and triggers a unit response alarm. An off-duty police officer living in a nearby home advises his neighbors to evacuate because “an alarm like that means there’s a problem at the refinery.” This is not an officially declared evacuation or shelter-in-place because in this situation the officer is acting as a private citizen suggesting a precautionary measure; therefore this is not a Tier 1 or Tier 2 PSE. The site may choose to capture this event as a Tier 3 other LOPC
Tier 3
§5.1, Tier 1 Definition
§6.2, Tier 2 Definition
Category Example Tier 1/2/3

Annex B(informative)
Listing of Chemicals Sorted by Threshold Quantity (Based on UN Dangerous Goods Hazard Class or Grouping)
As part of its efforts to develop an industry lagging metric, the CCPS created a comprehensive list of chemicals with associated release threshold quantities that has been adopted for this recommended practice. A copy of the list of chemicals can be found on the CCPS web site.
CCPS web site:
Step 1: http://www.aiche.org/ccps/knowledgebase/measurement.aspx
Step 2: download the Process Safety Incident Evaluation Tool
Step 3: search “Chemical List and View Chemical Details
Additional information regarding the UN Dangerous Goods Classification System can be found at the following web sites:
UNECE web site:
http://www.unece.org/trans/danger/publi/adr/adr2007/07ContentsE.html
The PDF Dangerous Goods list complete with UN numbers:
http://www.unece.org/trans/danger/publi/adr/adr2007/English/03-2%20E_tabA.pdf
Alphabetical cross reference:
http://www.unece.org/trans/danger/publi/adr/adr2007/English/03-3%20E_alphablist.pdf
The following discussion, extracted from the CCPS [4] leading and lagging metrics document, provides the thought process used to assign the Packing Groups, Hazard Zones, and threshold quantities for flammable and toxic materials.
Flammable Materials:
UNDG Criteria
2.2.3.1.3 Hazard Grouping Based on Flammability
Packing Group Flash Point (Closed-Cup) Initial Boiling Point
I — ≤ 35 °C (95 °F)
II < 23 °C (73 °F) > 35 °C (95 °F)
III ≥ 23 °C (73 °F) ≤ 60 °C (140 °F) > 35 °C (95 °F)
34

PROCESS SAFETY PERFORMANCE INDICATORS FOR THE REFINING AND PETROCHEMICAL INDUSTRIES 35
Toxic Vapors:
TIH Hazard Zones A, B, C and D per U.S. DOT regulations [13]
NOTE UNDG definitions do not include these definitions, but the following do align with definitions in the UN GHS definitions.
Toxic Liquids:
The packing group and hazard zone assignments for liquids based on inhalation of vapors shall be in accordance with the following table (also see Figure B.1):
Additional Clarifications Regarding UN Dangerous Goods Lists and Exceptions
The CCPS Committee, working in conjunction with representatives of several chemical and petroleum trade associations and process safety consortia, selected the UNDG criteria for differentiating chemicals into a few threshold quantity categories since this approach:
— was comprehensive;
— aligned with the new Globally Harmonized System of Classification and Labeling of Chemicals (GHS) [11]; and
— resulted in excellent differentiation of hundreds of chemicals into a few groupings that aligned well with perceived risk when toxicity, flammability, and volatility were considered.
Hazard Zone Inhalation Toxicity
A LC50 less than or equal to 200 ppm
B LC50 greater than 200 ppm and less than or equal to 1000 ppm
C LC50 greater than 1000 ppm and less than or equal to 3000 ppm
D LC50 greater than 3000 ppm or less than or equal to 5000 ppm
Packing Group Oral ToxicityLD50 (mg/kg)
Dermal ToxicityLD50 (mg/kg)
Inhalation Toxicity by Dusts and Mists
LC50 (mg/L)
I ≤ 5.0 ≤ 50 ≤ 0.2
II > 5.0 and ≤ 50 > 50 and ≤ 200 > 0.2 and ≤ 2.0
III > 50 and ≤ 300 > 200 and ≤ 1,000 > 2.0 and ≤ 4.0
Packing Group Vapor Concentration and Toxicity
I (Hazard Zone A) V ≥ 500 LC505 and LC505≤ 200 mL/M3
I (Hazard Zone B) V ≥ 10 LC50; LC505≤ 1000 mL/m3; and the criteria for Packing Group I, Hazard Zone A are not met
II V ≥ LC50; LC505≤ 3000 mL/m3; and the criteria for Packing Group I, are not met
III V ≥ 0.2 LC50; LC500≤ 5000 mL/m3; and the criteria for Packing Groups I and II, are not met
NOTE V is the saturated vapor concentration in air of the material in mL/m3 at 20 °C and standard atmospheric pressure.

36 API RECOMMENDED PRACTICE 754
However, the UNDG list does contain a few materials that are either:
— not of general concern from a petrochemical process safety perspective (e.g. cotton);
— described as a generic category with the associated label “not otherwise specified” (NOS) which may require further evaluation to assign to a specific chemical (e.g. “Amines, liquid, corrosive, NOS”, or “Hydrocarbons, liquid, NOS.”).
Furthermore, there are many low hazard materials that are excluded (e.g. solid polyethylene pellets) and are not the subject of this recommended practice. However, it may not be apparent to the user if those chemicals are intentionally excluded or if covered under the generic categories described above.
Overall, the benefits of this expanded list of chemicals considered in the CCPS Lagging Metric due to the UNDG list outweigh the negatives of potential initial complexity in training or interpretation of these definitions. However, it is likely that initially there will need to be interpretations or exceptions for some specific chemicals listed in the UNDG list. To maintain the consistency in reporting between companies or trade groups, it is recommended that communication and collaboration between the trade groups continue with regard to any interpretations or exceptions needed to facilitate consistent and efficient reporting of the process safety performance indicators. If trade groups mutually agree to exclude specific chemicals from the metric, or apply other implementation guidelines, they are encouraged to communicate their decision to CCPS. CCPS can collect and post those agreed exceptions on the web site.
Figure B.1—Inhalation Toxicity: Packing Group and Hazard Zones
10,000
1,000
100
10
0 10
LC50
ml/m
3
Volatility ml/m3100
Packin
g Grou
p III
Packin
g Grou
p II
Packin
g Grou
p I
Hazard
Zone B
Packin
g Grou
p I
Hazard
Zone A
Packin
g Grou
p III
Packin
g Grou
p II
Packin
g Grou
p I
Hazard
Zone B
Packin
g Grou
p I
Hazard
Zone A
1,000 10,000 100,000 1,000,000
Hazard Zone A
Hazard Zone B
Hazard Zone C
Hazard Zone D
Division 2.3 GassesDivision 6.1 Liquids
Inhalation Toxicity: Packing Group and Hazard Zones

Annex C(informative)
Decision Logic Tree
Anun
plan
ned
orun
cont
rolle
dre
leas
eof
any
mat
eria
l,in
clud
ing
non-
toxi
can
dno
n-fla
mm
able
mat
eria
ls(e
.g.,
stea
m,h
otco
nden
sate
,nitr
ogen
,co
mpr
esse
dC
O2,
orco
mpr
esse
dai
r)fro
ma
proc
ess
that
resu
ltsin
one
orm
ore
ofth
eco
nseq
uenc
eslis
ted
belo
w:
Afir
eor
expl
osio
nre
sulti
ngin
grea
tert
han
oreq
ualt
o$2
5,00
0of
dire
ctco
stto
the
Com
pany
Anem
ploy
ee,c
ontra
ctor
orsu
bcon
tract
or“d
ays
away
from
wor
k”in
jury
and/
orfa
talit
y;or
Aho
spita
ladm
issi
onan
d/or
fata
lity
ofa
third
-pa
rty
Anof
ficia
llyde
clar
edco
mm
unity
evac
uatio
nor
com
mun
itysh
elte
r-in-
plac
e
Not
aTi
er1
orTi
er2
PSE
Tier
1PS
E
YES
NO
NO
NO
YES
Apr
essu
rere
liefd
evic
e(P
RD
)dis
char
geto
atm
osph
ere
whe
ther
dire
ctly
orvi
aa
dow
nstre
amde
stru
ctiv
ede
vice
that
resu
ltsin
one
orm
ore
ofth
efo
llow
ing
four
cons
eque
nces
:•
liqui
dca
rryov
er;o
r•
disc
harg
eto
apo
tent
ially
unsa
felo
catio
n;or
•an
on-s
itesh
elte
r-in-
plac
e;or
•pu
blic
prot
ectiv
em
easu
res
(e.g
.,ro
adcl
osur
e);
and
aPR
Ddi
scha
rge
quan
tity
grea
tert
han
the
thre
shol
dqu
antit
ies
Tabl
e1
Are
leas
eof
mat
eria
lgre
ater
than
the
thre
shol
dqu
antit
ies
desc
ribed
inTa
ble
1in
any
one-
hour
perio
d
NO
NO
Anem
ploy
ee,c
ontra
ctor
,ors
ubco
ntra
ctor
reco
rdab
lein
jury
Afir
eor
expl
osio
nre
sulti
ngin
grea
tert
han
oreq
ualt
o$2
,500
ofdi
rect
cost
toth
eC
ompa
ny
Tier
2PS
E
NO
NO
YES
Are
leas
eof
mat
eria
lgre
ater
than
the
thre
shol
dqu
antit
ies
desc
ribed
inTa
ble
2in
any
one-
hour
perio
d
NO
Apr
essu
rere
liefd
evic
e(P
RD
)dis
char
geto
atm
osph
ere
whe
ther
dire
ctly
orvi
aa
dow
nstre
amde
stru
ctiv
ede
vice
that
resu
ltsin
one
orm
ore
ofth
efo
llow
ing
four
cons
eque
nces
:•
liqui
dca
rryov
er;o
r•
disc
harg
eto
apo
tent
ially
unsa
felo
catio
n;or
•an
on-s
itesh
elte
r-in-
plac
e;or
•pu
blic
prot
ectiv
em
easu
res
(e.g
.,ro
adcl
osur
e);
and
aPR
Ddi
scha
rge
quan
tity
grea
tert
han
the
thre
shol
dqu
antit
ies
Tabl
e2
AC
ompa
nym
aych
oose
tore
cord
aTi
er3
othe
rLO
PC
NO
NO
37

Bibliography
The following documents are directly referenced in this recommended practice.
[1] API, API Guide to Report Process Safety Incidents, Version 1.2, Washington, D.C., 2008.
[2] American Petroleum Institute, ANSI/API Standard 521/ISO 23251, Guide for Pressure-relieving and Depressuring Systems.
[3] Center for Chemical Process Safety, Guidelines for Process Safety Metrics, American Institute of Chemical Engineers, New York, 2009.
[4] Center for Chemical Process Safety, “Process Safety Leading and Lagging Metrics,” American Institute of Chemical Engineers, New York, 2008. http://www.aiche.org/uploadedFiles/CCPS/Metrics/CCPS_metrics%205.16.08.pdf
[5] Hart, C., “Stuck on a Plateau: A Common Problem,” Workshop Paper, paper prepared for the National Academy of Engineering Program Office Accident Precursors Project, Washington, D.C., 2003.
[6] Heinrich, H.W., Industrial Accident Prevention, New York, McGraw-Hill, 1931.
[7] Hopkins, Andrew, “Thinking About Process Safety Indicators,” Working Paper 53, Paper prepared for the Oil and Gas Industry Conference, Manchester, UK, 2007.
[8] Reason, J. T., “The Contribution of Latent Human Failures to the Breakdown of Complex Systems,” Philosophical Transactions of the Royal Society (London), series B.327:475-484, 1990.
[9] UK Health and Safety Executive (HSE), Step-By-Step Guide to Developing Process Safety Performance Indicators, HSG254, Sudbury, Suffolk, UK, 2006.
[10] United Nations Economic Commission for Europe (UNECE), ECE/TRANS/202, Vol. I and II (“ADR 2009”), European Agreement Concerning the International Carriage of Dangerous Goods by Road (ADR), 2009. http://www.unece.org/trans/danger/publi/adr/adr2009/09ContentsE.html
[11] United National Globally Harmonized System of Classification and Labelling of Chemicals (GHS), 1st Edition, New York and Geneva, 2003. http://www.unece.org/trans/danger/publi/ghs/ghs_rev00/00files_e.html
[12] U.S. Department of Labor, Occupational Safety and Health Administration, OSHA Recordkeeping Handbook: The Regulation and Related Interpretations for Recording and Reporting Occupational Injuries and Illnesses, OSHA 3245-01R, 2005. http://www.osha.gov/recordkeeping/index.html
[13] U.S. Department of Transportation, 49 CFR, Part 172, Subpart B—Table of Hazardous Materials and Special Provisions. http://ecfr.gpoaccess.gov/cgi/t/text/text-idx?c=ecfr&sid=73c1ea0778f58fada88522c6d1ef6eb3&rgn=div6&view=text&node=49:2.1.1.3.7.2&idno=49
[14] U.S. Department of Transportation, 49 CFR 173.2a—Classification of a Material Having More Than One Hazard. http://edocket.access.gpo.gov/cfr_2006/octqtr/49cfr173.2a.htm
38
PROCESS SAFETY PERFORMANCE INDICATORS FOR THE REFINING AND PETROCHEMICAL INDUSTRIES 39
Further Reading
The following documents are not directly referenced in this document but provide a useful source of relevant information.
[A] Baker, J.A. et al., “The Report of the BP U.S. Refineries Independent Safety Review Panel,” January 2007 http://www.bp.com/liveassets/bp_internet/globalbp/globalbp_uk_english/SP/STAGING/local_assets/assets/pdfs/Baker_panel_report.pdf
[B] Broadribb, Michael P. et al, “Cheddar or Swiss? How Strong Are Your Barriers? (One Company’s Experience with Process Safety Metrics),” presentation at CCPS 5th Global Congress on Process Safety, Tampa, FL, April 26-30, 2009.
[C] Center for Chemical Process Safety, American Institution of Chemical Engineers, Guidelines for Risk Based Process Safety, New York, 2007.
[D] Nuclear Energy Institute (NEI), NEI 99-02 Revision 5, Regulatory Assessment Performance Indicator Guideline, Washington, D.C., 2007.
[E] Organization for Economic Coordination and Development (OECD), Guidance on Safety Performance Indicators Related to Chemical Accident Prevention, Preparedness and Response for Industry (2nd ed. 2008), OECD Environment, Health and Safety Publications, Series on Chemical Accidents No. 19, Paris, 2008.
[F] U.S. Chemical Safety and Hazard Investigation Board, Investigation Report No. 2005-04-I-TX, “Refinery Explosion and Fire,” BP, Texas City, March 2005.


Invoice To (� Check here if same as “Ship To”)
Name:
Title:
Company:
Department:
Address:
City: State/Province:
Zip/Postal Code: Country:
Telephone:
Fax:
Email:
� Payment Enclosed � P.O. No. (Enclose Copy)
� Charge My IHS Account No.
� VISA � MasterCard � American Express� Diners Club � Discover
Credit Card No.:
Print Name (As It Appears on Card):
Expiration Date:
Signature:
Quantity Title Total
Subtotal
Applicable Sales Tax (see below)
Rush Shipping Fee (see below)
Shipping and Handling (see below)
Total (in U.S. Dollars)
� To be placed on Standing Order for future editions of thispublication, place a check mark in the SO column and sign here:
Date:
SO� Unit Price
� API Member (Check if Yes)
Ship To (UPS will not deliver to a P.O. Box)Name:
Title:
Company:
Department:
Address:
City: State/Province:
Zip/Postal Code: Country:
Telephone:
Fax:
Email:
Mail Orders – Payment by check or money order in U.S. dollars is required except for established accounts. State and local taxes, $10 processing fee, and 5% shipping must beadded. Send mail orders to: API Publications, IHS, 15 Inverness Way East, c/o Retail Sales, Englewood, CO 80112-5776, USA.Purchase Orders – Purchase orders are accepted from established accounts. Invoice will include actual freight cost, a $10 processing fee, plus state and local taxes.Telephone Orders – If ordering by telephone, a $10 processing fee and actual freight costs will be added to the order.Sales Tax – All U.S. purchases must include applicable state and local sales tax. Customers claiming tax-exempt status must provide IHS with a copy of their exemption certificate.Shipping (U.S. Orders) – Orders shipped within the U.S. are sent via traceable means. Most orders are shipped the same day. Subscription updates are sent by First-Class Mail.Other options, including next-day service, air service, and fax transmission are available at additional cost. Call 1-800-854-7179 for more information.
Shipping (International Orders) – Standard international shipping is by air express courier service. Subscription updates are sent by World Mail. Normal delivery is 3-4 days from shipping date.
Rush Shipping Fee – Next Day Delivery orders charge is $20 in addition to the carrier charges. Next Day Delivery orders must be placed by 2:00 p.m. MST to ensure overnight delivery.Returns – All returns must be pre-approved by calling the IHS Customer Service Department at 1-800-624-3974 for information and assistance. There may be a 15% restockingfee. Special order items, electronic documents, and age-dated materials are non-returnable.
Pricing and availability subject to change without notice.
2010 PUBLICATIONS ORDER FORM
Effective January 1, 2010. API Members receive a 30% discount where applicable. The member discount does not apply to purchases madefor the purpose of resale or for incorporation into commercial products, training courses, workshops, or other commercial enterprises.
Ordering Information Online: www.api.org/pubsPhone: 1-800-854-7179 (Toll-free in the U.S. and Canada) | (+1) 303-397-7956 (Local and International)Fax: (+1) 303-397-2740

THERE’S MOREWHERE THIS CAME FROM.
API Monogram® Licensing ProgramSales: (+1) 713-964-2662Service: (+1) 202-962-4791Fax: (+1) 202-682-8070Email: [email protected]: www.api.org/monogram
API Quality Registrar (APIQR®)• ISO 9001•ISO/TS 29001•ISO 14001•OHSAS 18001•API Spec Q1® •API QualityPlus®•Dual Registration Sales: (+1) 713-964-2662Service: (+1) 202-962-4791Fax: (+1) 202-682-8070Email: [email protected]: www.api.org/apiqr
API Individual Certification Programs (ICP®) Sales: (+1) 713-964-2662Service: (+1) 202-682-8064Fax: (+1) 202-682-8348Email: [email protected]: www.api.org/icp
API Engine Oil Licensing andCertification System (EOLCS)Sales: (+1) 713-964-2662Service: (+1) 202-682-8516Fax: (+1) 202-962-4739Email: [email protected]: www.api.org/eolcs
API Training Provider Certification Program (API TPCP™) Sales: (+1) 713-964-2662Service: (+1) 202-682-8075Fax: (+1) 202-682-8070Email: [email protected]: www.api.org/tpcp
API Perforator Design Registration ProgramSales: (+1) 713-964-2662Service: (+1) 202-682-8490Fax: (+1) 202-682-8070Email: [email protected]: www.api.org/perforators
API Credit Exchange (ACE™)Service: (+1) 202-682-8192Fax: (+1) 202-682-8070Email: [email protected]: www.api.org/ace
API Diesel Exhaust Fluid Certification Program Phone: (+1) 202-682-8516Fax: (+1) 202-962-4739Email: [email protected]: www.apidef.org
API WorkSafe™Sales: (+1) 713-964-2662 Service: (+1) 202-682-8469Fax: (+1) 202-682-8348Email: [email protected]: www.api.org/worksafe
API-UPhone: (+1) 202-682-8053Fax: (+1) 202-682-8070Email: [email protected]: www.api-u.org
API Data™Phone: (+1) 202-682-8499Fax: (+1) 202-962-4730Email: [email protected]: www.APIDataNow.org
API Publications Online: www.api.org/pubsPhone: 1-800-854-7179
(Toll-free: U.S./Canada)(+1) 303-397-7956 (Local/International)
Fax: (+1) 303-397-2740
API Standards Phone: (+1) 202-682-8148Fax: (+1) 202-962-4797Email: standards.orgWeb: www.api.org/standards
Request a Quotation:www.api.org/quote

Product No. K75401