Embed Size (px)
Citation preview
U.S. International Trade Commission
Address all communications toSecretary to the Commission
United States International Trade CommissionWashington, DC 20436
COMMISSIONERS
Jennifer A. Hillman, Vice ChairmanDeanna Tanner Okun, Chairman
Marcia E. MillerStephen Koplan
Robert A. RogowskyDirector of Operations
Robert B. KoopmanDirector of Economics
U.S. International Trade CommissionWashington, DC 20436
Publication 3603 June 2003
www.usitc.gov
U.S.-Singapore Free Trade Agreement:Potential Economywide andSelected Sectoral Effects
Investigation No. TA-2104-6

This report was principally prepared by
Country and Regional Analysis DivisionArona M. Butcher, Chief
Arona M. Butcher, Project Leader
Soamiely Andriamananjara, Michael Barry, Nannette Christ, Kyle Johnson,Diane Manifold, and Marinos Tsigas
Office of the General CounselWilliam W. Gearhart
Office of IndustriesHeidi Colby-Oizumi, Industries Coordinator
Laura Bloodgood, Queena Fan, Lisa Ferens, Eric Forden, Christopher Johnson, Dennis Luther,Christopher Melly, Michael Nunes, and Cynthia Trainor
Office of Tariff Affairs and Trade AgreementsJanis Summers
Supporting assistance was provided by:Patricia M. Thomas

i
PREFACE
On February 28, 2003, the United States International Trade Commission (theCommission) instituted investigation No. TA-2104-6, U.S.-Singapore Free TradeAgreement: Potential Economywide and Selected Sectoral Effects. The investigation,conducted under section 2104(f) of the Trade Act of 2002, was in response to a requestfrom the United States Trade Representative (see Appendix A).
The purpose of this investigation is to advise the President and the Congress as to thepotential effects of the U.S.-Singapore free trade agreement (FTA). In particular,section 2104(f)(2) of the Trade Act provides that the Commission is to submit to thePresident and the Congress (not later than 90 calendar days after the President entersinto the agreement) a report providing an assessment of the likely impact of theagreement on the United States economy as a whole and on specific U.S. industrysectors and the interests of U.S. consumers. Section 2104(f)(3) also provides that theCommission, in preparing its assessment, review available economic assessmentsregarding any substantially equivalent proposed agreement and discuss areas ofconsensus and divergence between the various analyses and conclusions, includingthose of the Commission regarding the agreement.
The Commission solicited public comment for this investigation by publishing a notice inthe Federal Register of March 21, 2003 (see Appendix B) and holding a public hearingon April 24, 2003 (see Appendix C for the hearing Calender). Interested party viewsare summarized in Chapter 9 of this study.


iii
TABLE OF CONTENTS
PagePreface i. . . . . . . . . . . . . . . . . . . . . . . . . . . . . . . . . . . . . . . . . . . . . . . . . . . . . .Executive Summary ix. . . . . . . . . . . . . . . . . . . . . . . . . . . . . . . . . . . . . . . . . . . . .Chapter 1. Introduction 1. . . . . . . . . . . . . . . . . . . . . . . . . . . . . . . . . . . . . . . . . .
Purpose of the report 1. . . . . . . . . . . . . . . . . . . . . . . . . . . . . . . . . . . . . . .Scope of the report 2. . . . . . . . . . . . . . . . . . . . . . . . . . . . . . . . . . . . . . . .Approach of the report 2. . . . . . . . . . . . . . . . . . . . . . . . . . . . . . . . . . . . .Organization of the report 4. . . . . . . . . . . . . . . . . . . . . . . . . . . . . . . . . . .
Chapter 2. Overview of the U.S.-Singapore FTA 5. . . . . . . . . . . . . . . . . . . . . . .Scope of chapter 5. . . . . . . . . . . . . . . . . . . . . . . . . . . . . . . . . . . . . . . . . .Brief summary of treaty provisions 5. . . . . . . . . . . . . . . . . . . . . . . . . . . . .
Introduction 5. . . . . . . . . . . . . . . . . . . . . . . . . . . . . . . . . . . . . . . . . . . .Summary of tariff commitments 6. . . . . . . . . . . . . . . . . . . . . . . . . . . . .
Chapter-by-chapter review 6. . . . . . . . . . . . . . . . . . . . . . . . . . . . .Chapter 1: Establishment and Definitions 6. . . . . . . . . . . . . . . .Chapter 2: National Treatment and Market Access 7. . . . . . .Chapter 3: Rules of Origin 8. . . . . . . . . . . . . . . . . . . . . . . . . .Chapter 4: Customs Administration 10. . . . . . . . . . . . . . . . . . . .Chapter 5: Textiles and Apparel 10. . . . . . . . . . . . . . . . . . . . . .Chapter 6: Technical Barriers to Trade 11. . . . . . . . . . . . . . . . .Chapter 7: Safeguards 11. . . . . . . . . . . . . . . . . . . . . . . . . . . . .Chapter 8: Cross-Border Trade in Services 11. . . . . . . . . . . . . .Chapter 9: Telecommunications 12. . . . . . . . . . . . . . . . . . . . . .Chapter 10: Financial Services 12. . . . . . . . . . . . . . . . . . . . . . .Chapter 11: Temporary Entry of Business Persons 13. . . . . . . . .Chapter 12: Anticompetitive Business Conduct, Designated
Monopolies, and Government Enterprises 13. . . . . . . . . . . . .Chapter 13: Government Procurement 14. . . . . . . . . . . . . . . . .Chapter 14: Electronic Commerce 14. . . . . . . . . . . . . . . . . . . . .Chapter 15: Investment 14. . . . . . . . . . . . . . . . . . . . . . . . . . . . .Chapter 16: Intellectual Property Rights 15. . . . . . . . . . . . . . . . .Chapter 17: Labor 16. . . . . . . . . . . . . . . . . . . . . . . . . . . . . . . . .Chapter 18: Environment 16. . . . . . . . . . . . . . . . . . . . . . . . . . . .Chapter 19: Transparency 17. . . . . . . . . . . . . . . . . . . . . . . . . . .Chapter 20: Administrative and Dispute Settlement 17. . . . . . . .Chapter 21: General and Final Provisions 18. . . . . . . . . . . . . . .
iv
TABLE OF CONTENTS-Continued
PageChapter 3: Overview of Singapore’s Economy, Trade,
and Investment Patterns 19. . . . . . . . . . . . . . . . . . . . . . . . . . . . . . . . . . . . . . . .Introduction 19. . . . . . . . . . . . . . . . . . . . . . . . . . . . . . . . . . . . . . . . . . . . . .
Singapore’s economy 19. . . . . . . . . . . . . . . . . . . . . . . . . . . . . . . . . . . . .Major industries 21. . . . . . . . . . . . . . . . . . . . . . . . . . . . . . . . . . . . . .Singapore’s trade pattern 23. . . . . . . . . . . . . . . . . . . . . . . . . . . . . .Trade flows with the United States 23. . . . . . . . . . . . . . . . . . . . . . . .
Services trade 25. . . . . . . . . . . . . . . . . . . . . . . . . . . . . . . . . . . . . . . . . . . .Investment relationship with the United States 31. . . . . . . . . . . . . . .
Investment patterns 31. . . . . . . . . . . . . . . . . . . . . . . . . . . . . . . . . . . . . . .Regional and economic cooperation 32. . . . . . . . . . . . . . . . . . . . . . . . . . .
Multilateral cooperation 32. . . . . . . . . . . . . . . . . . . . . . . . . . . . . . . . . . .Bilateral cooperation 34. . . . . . . . . . . . . . . . . . . . . . . . . . . . . . . . . . . . .
Chapter 4: Review of Literature 37. . . . . . . . . . . . . . . . . . . . . . . . . . . . . . . . . . .Introduction 37. . . . . . . . . . . . . . . . . . . . . . . . . . . . . . . . . . . . . . . . . . . . . .General effects of trade agreements 37. . . . . . . . . . . . . . . . . . . . . . . . . . .
Static effects: Trade creation and Trade diversion 37. . . . . . . . . . . . . . .Static effects: Terms of trade 38. . . . . . . . . . . . . . . . . . . . . . . . . . . . . . .Scale effects 38. . . . . . . . . . . . . . . . . . . . . . . . . . . . . . . . . . . . . . . . . . . .Political effects 39. . . . . . . . . . . . . . . . . . . . . . . . . . . . . . . . . . . . . . . . . .
Impact on the United States of U.S.-Singapore FTA 40. . . . . . . . . . . . . . . .Impact on the United States of other actual or potential
Singapore FTAs 43. . . . . . . . . . . . . . . . . . . . . . . . . . . . . . . . . . . . . . . . .Comparison of economic welfare impacts 49. . . . . . . . . . . . . . . . . . . . . . .
Chapter 5: Impact of Eliminating Tariffs 53. . . . . . . . . . . . . . . . . . . . . . . . . . . . .Introduction 53. . . . . . . . . . . . . . . . . . . . . . . . . . . . . . . . . . . . . . . . . . . . . .Summary of findings 53. . . . . . . . . . . . . . . . . . . . . . . . . . . . . . . . . . . . . . .General equilibrium analysis 54. . . . . . . . . . . . . . . . . . . . . . . . . . . . . . . . .
Database and aggregation 54. . . . . . . . . . . . . . . . . . . . . . . . . . . . . . . .Simulation design 55. . . . . . . . . . . . . . . . . . . . . . . . . . . . . . . . . . . . . . . .
Projected baseline 57. . . . . . . . . . . . . . . . . . . . . . . . . . . . . . . . . . . .Policy experiment 58. . . . . . . . . . . . . . . . . . . . . . . . . . . . . . . . . . . . .
Simulation results 60. . . . . . . . . . . . . . . . . . . . . . . . . . . . . . . . . . . . . . . .Trade volumes 61. . . . . . . . . . . . . . . . . . . . . . . . . . . . . . . . . . . . . . .Domestic production 64. . . . . . . . . . . . . . . . . . . . . . . . . . . . . . . . . .Prices paid by consumers 66. . . . . . . . . . . . . . . . . . . . . . . . . . . . . .Economic welfare and gross domestic product 67. . . . . . . . . . . . . .
Chapter 6: Impact of a U.S.-Singapore FTA on selected sectors 69. . . . . . . . . . .Textiles and apparel 69. . . . . . . . . . . . . . . . . . . . . . . . . . . . . . . . . . . . . . .
Overview 69. . . . . . . . . . . . . . . . . . . . . . . . . . . . . . . . . . . . . . . . . . . . . .U.S. industry 70. . . . . . . . . . . . . . . . . . . . . . . . . . . . . . . . . . . . . . . .
v
TABLE OF CONTENTS-ContinuedPage
Chapter 6: Impact of a U.S.-Singapore FTA of selected sectors–ContinuedIndustry in Singapore 71. . . . . . . . . . . . . . . . . . . . . . . . . . . . . . . . .Potential impact on U.S. imports 72. . . . . . . . . . . . . . . . . . . . . . . . .Potential impact on U.S. exports 74. . . . . . . . . . . . . . . . . . . . . . . . .
Express delivery services 75. . . . . . . . . . . . . . . . . . . . . . . . . . . . . . . . . . . .Overview 75. . . . . . . . . . . . . . . . . . . . . . . . . . . . . . . . . . . . . . . . . . . . . .
U.S. industry 75. . . . . . . . . . . . . . . . . . . . . . . . . . . . . . . . . . . . . . . .Industry in Singapore 76. . . . . . . . . . . . . . . . . . . . . . . . . . . . . . . . .
Potential impact on U.S. imports 76. . . . . . . . . . . . . . . . . . . . . . . . . . . . .Potential impact on U.S. exports 77. . . . . . . . . . . . . . . . . . . . . . . . . . . . .
Financial services 78. . . . . . . . . . . . . . . . . . . . . . . . . . . . . . . . . . . . . . . . . .Overview 78. . . . . . . . . . . . . . . . . . . . . . . . . . . . . . . . . . . . . . . . . . . . . .
U.S. industry 78. . . . . . . . . . . . . . . . . . . . . . . . . . . . . . . . . . . . . . . .Industry in Singapore 79. . . . . . . . . . . . . . . . . . . . . . . . . . . . . . . . .
Potential impact on U.S. imports 79. . . . . . . . . . . . . . . . . . . . . . . . . . . . .Potential impact on U.S. exports 80. . . . . . . . . . . . . . . . . . . . . . . . . . . . .
Professional services 82. . . . . . . . . . . . . . . . . . . . . . . . . . . . . . . . . . . . . . .Overview 82. . . . . . . . . . . . . . . . . . . . . . . . . . . . . . . . . . . . . . . . . . .U.S. industry 82. . . . . . . . . . . . . . . . . . . . . . . . . . . . . . . . . . . . . . . .Industry in Singapore 83. . . . . . . . . . . . . . . . . . . . . . . . . . . . . . . . .
Potential impact on U.S. imports 84. . . . . . . . . . . . . . . . . . . . . . . . . . . . .Potential impact on U.S. exports 84. . . . . . . . . . . . . . . . . . . . . . . . . . . . .
Telecommunications services 87. . . . . . . . . . . . . . . . . . . . . . . . . . . . . . . . .Overview 87. . . . . . . . . . . . . . . . . . . . . . . . . . . . . . . . . . . . . . . . . . . . . .
U.S. industry 87. . . . . . . . . . . . . . . . . . . . . . . . . . . . . . . . . . . . . . . .Industry in Singapore 88. . . . . . . . . . . . . . . . . . . . . . . . . . . . . . . . .
Potential impact on U.S. imports 88. . . . . . . . . . . . . . . . . . . . . . . . . . . . .Potential impact on U.S. exports 89. . . . . . . . . . . . . . . . . . . . . . . . . . . . .
Chapter 7: Impact of a U.S.-Singapore FTA on Intellectual Property Rights 91. .Current conditions of IPR protection in Singapore 91. . . . . . . . . . . . . . . . .Major IPR provisions of the U.S.-Singapore FTA 95. . . . . . . . . . . . . . . . . . .
Copyrights 95. . . . . . . . . . . . . . . . . . . . . . . . . . . . . . . . . . . . . . . . . . . . .Trademarks 97. . . . . . . . . . . . . . . . . . . . . . . . . . . . . . . . . . . . . . . . . . . .Patents and trade secrets 98. . . . . . . . . . . . . . . . . . . . . . . . . . . . . . . . . .Enforcement 98. . . . . . . . . . . . . . . . . . . . . . . . . . . . . . . . . . . . . . . . . . . .
Potential effects 99. . . . . . . . . . . . . . . . . . . . . . . . . . . . . . . . . . . . . . . . . . .Chapter 8: Impact of a U.S.-Singapore FTA on Investment 101. . . . . . . . . . . . . .
U.S.-Singapore investment 101. . . . . . . . . . . . . . . . . . . . . . . . . . . . . . . . . . .Major investment provisions of the U.S.-Singapore FTA 103. . . . . . . . . . . . .
Dispute settlement 106. . . . . . . . . . . . . . . . . . . . . . . . . . . . . . . . . . . . . . . .

vi
TABLE OF CONTENTS-Continued
PageChapter 8: Impact of a U.S.-Singapore FTA on Investment–Continued
Nonconforming measures 107. . . . . . . . . . . . . . . . . . . . . . . . . . . . . . . . .Potential effects 110. . . . . . . . . . . . . . . . . . . . . . . . . . . . . . . . . . . . . . . . . . .
Chapter 9: Summary of Views of Interested Parties 113. . . . . . . . . . . . . . . . . . . .Air Courier Conference of America 113. . . . . . . . . . . . . . . . . . . . . . . . . . .American Council of Life Insurers, American
Insurance Association, and Financial ServicesCoordinating Council 114. . . . . . . . . . . . . . . . . . . . . . . . . . . . . . . . . . . . .
American Dehydrated Onion and Garlic Association 114. . . . . . . . . . . . . .American Federation of Labor and Congress of Industrial
Organizations 115. . . . . . . . . . . . . . . . . . . . . . . . . . . . . . . . . . . . . . . . . .The Boeing Company 116. . . . . . . . . . . . . . . . . . . . . . . . . . . . . . . . . . . . . . .Citigroup 117. . . . . . . . . . . . . . . . . . . . . . . . . . . . . . . . . . . . . . . . . . . . . . . .Direct Selling Association 117. . . . . . . . . . . . . . . . . . . . . . . . . . . . . . . . . . . .Discovery Communications, Inc. 118. . . . . . . . . . . . . . . . . . . . . . . . . . . . . . .Electronic Industries Alliance 119. . . . . . . . . . . . . . . . . . . . . . . . . . . . . . . . .Entertainment Industry Coalition for Free Trade 119. . . . . . . . . . . . . . . . . . .General Electric Company 120. . . . . . . . . . . . . . . . . . . . . . . . . . . . . . . . . . .Government of Singapore 121. . . . . . . . . . . . . . . . . . . . . . . . . . . . . . . . . . .International Intellectual Property Alliance 122. . . . . . . . . . . . . . . . . . . . . . .Investment Company Institute 122. . . . . . . . . . . . . . . . . . . . . . . . . . . . . . . . .Leather Industries of America, Inc. 123. . . . . . . . . . . . . . . . . . . . . . . . . . . . .Pharmaceutical Research and Manufacturers of America 124. . . . . . . . . . .Securities Industry Association 125. . . . . . . . . . . . . . . . . . . . . . . . . . . . . . . .Semiconductor Industry Association 125. . . . . . . . . . . . . . . . . . . . . . . . . . . .Telecommunications Industry Association 126. . . . . . . . . . . . . . . . . . . . . . . .Tile Council of America, Inc. 127. . . . . . . . . . . . . . . . . . . . . . . . . . . . . . . . . .United Parcel Service 127. . . . . . . . . . . . . . . . . . . . . . . . . . . . . . . . . . . . . . .U.S. Chamber of Commerce 128. . . . . . . . . . . . . . . . . . . . . . . . . . . . . . . . .U.S.-Singapore FTA Business Coalition 128. . . . . . . . . . . . . . . . . . . . . . . . . .Wal-Mart Stores, Inc. 129. . . . . . . . . . . . . . . . . . . . . . . . . . . . . . . . . . . . . . .
AppendixesA. Request Letter A-1. . . . . . . . . . . . . . . . . . . . . . . . . . . . . . . . . . . . . . . . . . . . .B. Federal Register notice B-1. . . . . . . . . . . . . . . . . . . . . . . . . . . . . . . . . . . . . .C. Hearing Participants C-1. . . . . . . . . . . . . . . . . . . . . . . . . . . . . . . . . . . . . . . .D. Technical appendix D-1. . . . . . . . . . . . . . . . . . . . . . . . . . . . . . . . . . . . . . . .
FiguresES-1. U.S. merchandise trade with Singapore: Imports, exports, and trade
balance xiii. . . . . . . . . . . . . . . . . . . . . . . . . . . . . . . . . . . . . . . . . . . . . . .ES-2. U.S. exports to Singapore, 2002 xiii. . . . . . . . . . . . . . . . . . . . . . . . . . . . . .ES-3. U.S. imports from Singapore, 2002 xiv. . . . . . . . . . . . . . . . . . . . . . . . . . . .ES-4. U.S. direct investment in Singapore, by industry sector, 2001 xiv. . . . . . . .

vii
TABLE OF CONTENTS-Continued
PageFigures-ContinuedES-5. Range of estimated impacts of tariff reductions on U.S. imports
and exports from the U.S.-Singapore FTA, 2016 xviii. . . . . . . . . . . . . . . .3-1. Singapore: GDP by sector, 2002 22. . . . . . . . . . . . . . . . . . . . . . . . . . . . . .3-2. Singapore: GDP by industry, 2002 22. . . . . . . . . . . . . . . . . . . . . . . . . . . .3-3. U.S. merchandise trade with Singapore: Imports, exports,
trade balance 25. . . . . . . . . . . . . . . . . . . . . . . . . . . . . . . . . . . . . . . . . .4-1. Estimated economic welfare impact of USITC and selected studies,
(%GDP or GNP) 51. . . . . . . . . . . . . . . . . . . . . . . . . . . . . . . . . . . . . . . . .5-1. U.S. exports to Singapore (1997 = 100) 56. . . . . . . . . . . . . . . . . . . . . . . . .5-2. U.S. imports from Singapore (1997 = 100) 57. . . . . . . . . . . . . . . . . . . . . .7-1. U.S. royalties and license fees from Singapore, by value,
and as a percent of total U.S. royalties and license feesfrom the world, 1997-2001 92. . . . . . . . . . . . . . . . . . . . . . . . . . . . . . . .
8-1. U.S. direct investment with Singapore, 1997-2001 102. . . . . . . . . . . . . . . . .8-2. U.S. direct investment in Singapore, by industry sector, 2001 103. . . . . . . .
TablesES-1. Selected economic literature, methodology and model assumptions xvi. . .3-1. Singapore: GDP growth by industry, 1998-2002 21. . . . . . . . . . . . . . . . .3-2. Singapore: Trade with the world, 1998-2002 23. . . . . . . . . . . . . . . . . . . .3-3. Singapore: Domestic exports, re-exports, and total exports, 2002 24. . . .3-4. Singapore: Imports by commodity, 2002 24. . . . . . . . . . . . . . . . . . . . . . .3-5. U.S. imports for consumption from Singapore, by 1-digit SITC
classification, 1998-2002 26. . . . . . . . . . . . . . . . . . . . . . . . . . . . . . . . . .3-6. U.S. imports for consumption from Singapore, top 25 import
categories by 2-digit SITC classification, 1998-2002 27. . . . . . . . . . . . .3-7. U.S. domestic exports to Singapore, by 1-digit SITC
classification, 1998-2002 28. . . . . . . . . . . . . . . . . . . . . . . . . . . . . . . . . .3-8. U.S. domestic exports to Singapore, top 25 export categories
by 2-digit SITC classification, 1998-2002 29. . . . . . . . . . . . . . . . . . . . . .3-9. U.S. cross-border services trade with Singapore, 2001 30. . . . . . . . . . . . .3-10. Foreign direct investment flows between the United States and
Singapore, 2001 32. . . . . . . . . . . . . . . . . . . . . . . . . . . . . . . . . . . . . . . .4-1. Quantifiable FTA effects 40. . . . . . . . . . . . . . . . . . . . . . . . . . . . . . . . . . . . .4-2. Sectoral employment effects for the United States of the
U.S.-Singapore FTA, estimates by Brown et al. 43. . . . . . . . . . . . . . . . . .4-3. Impact on U.S. net capital outflows, estimates by Centre for
International Economics 45. . . . . . . . . . . . . . . . . . . . . . . . . . . . . . . . . . .4-4. Welfare effects of Japan-Singapore FTA: Equivalent variation
in 2020, estimates by Hertel et al. 45. . . . . . . . . . . . . . . . . . . . . . . . . . .4-5. Effect of Japan-Singapore FTA on U.S. macroeconomic indicators
in 2020, estimates by Hertel et al. 47. . . . . . . . . . . . . . . . . . . . . . . . . . .
viii
TABLE OF CONTENTS-ContinuedPage
Tables–Continued4-6. Impact on the United States of actual or potential agreements
involving Singapore, estimates by Scollay and Gilbert 48. . . . . . . . . . . .4-7. Welfare impact on the United States of actual or potential
agreements involving Singapore, estimates by Brown et al. 48. . . . . . . .5-1. GTAP database: Commodity aggregation 56. . . . . . . . . . . . . . . . . . . . . .5-2. Tariffs and tariff equivalents for the United States and
Singapore, 2004 59. . . . . . . . . . . . . . . . . . . . . . . . . . . . . . . . . . . . . . .5-3. U.S. schedule for tariff liberalization 60. . . . . . . . . . . . . . . . . . . . . . . . . . .5-4. Effects on U.S. exports, 2016 (relative to baseline) 62. . . . . . . . . . . . . . . . .5-5. Effects on U.S. imports, 2016 (relative to baseline) 63. . . . . . . . . . . . . . . . .5-6. Effects on sectoral output in the United States, 2016
(relative to baseline) 65. . . . . . . . . . . . . . . . . . . . . . . . . . . . . . . . . . . . . .5-7. Effects on demand for labor, by commodity, 2016
(relative to baseline) 65. . . . . . . . . . . . . . . . . . . . . . . . . . . . . . . . . . . . . .5-8. Effects on real rate of return on primary factors in the
United States, 2016 (relative to baseline) 66. . . . . . . . . . . . . . . . . . . . .5-9. Effects on prices paid by U.S. consumers, by commodity, 2016
(relative to baseline) 67. . . . . . . . . . . . . . . . . . . . . . . . . . . . . . . . . . . . . .8-1. Industry sectors included in annex 8A or annex 8B reservations of the
U.S.-Singapore FTA 108. . . . . . . . . . . . . . . . . . . . . . . . . . . . . . . . . . . . . .D-1. Commodity and regional aggregation D-4. . . . . . . . . . . . . . . . . . . . . . . . . .D-2. Effects on U.S. exports, 2004-16 (relative to baseline) D-7. . . . . . . . . . . . . .D-3. Effects on U.S. imports, 2004-16 (relative to baseline) D-8. . . . . . . . . . . . . .D-4. Effects on sectoral output in the United States, 2004-16
(relative to baseline) D-9. . . . . . . . . . . . . . . . . . . . . . . . . . . . . . . . . . . . . .

OMB No.: 3117--0188
06/03
ITC READER SATISFACTION SURVEYU.S.-Singapore Free Trade Agreement:
Potential Economywide and Selected Sectoral Effects
The U.S. International Trade Commission (USITC) is interested in your voluntary com-ments (burden less than 10 minutes) to help assess the value and quality of our reports, and to assistin improving future products. Please return survey by facsimile (202-205-2340) or by mail to theUSITC, or visit the USITC Internet home page(http://reportweb.usitc.gov/reader_survey/readersurvey.html) to electronically submit a Web version ofthe survey.
(Please print; responses below not for attribution):
Your name and title:
Organization (if applicable):
Which format is most useful to you? - CD-ROM - Hardcopy - USITC Internet site
Circle your assessment of each factor below: SA = strongly agree, A = agree, N = no opinion,D = disagree, or SD = strongly disagree.
Value of this report:" Statistical data are useful SA A N D SD. . . . . . . . . . . . . . . . . . . . . . . . . . . . . ." Other non-numerical facts are useful SA A N D SD. . . . . . . . . . . . . . . . . . ." Analysis augments statistical data/other facts SA A N D SD. . . . . . . . . . . ." Relevant topic(s)/subject matter SA A N D SD. . . . . . . . . . . . . . . . . . . . . . . ." Primary or leading source of information on this subject SA A N D SD. .
Quality of this report:" Clearly written SA A N D SD. . . . . . . . . . . . . . . . . . . . . . . . . . . . . . . . . . . . . . ." Key issues are addressed SA A N D SD. . . . . . . . . . . . . . . . . . . . . . . . . . . . . . ." Charts and graphs aid understanding SA A N D SD. . . . . . . . . . . . . . . . . . ." References cite pertinent sources SA A N D SD. . . . . . . . . . . . . . . . . . . . . . .
Other preferred source of information on this subject:
Specify chapters, sections, or topics in report that are most useful:
Identify any type of additional information that should have been included in report:
Suggestions for improving report:
Please update your mailing and electronic addresses below (voluntary)-
Mailing address:
City, state, and zip code:
E-mail address:
UNITED STATESINTERNATIONAL TRADE COMMISSION
WASHINGTON, DC 20436
OFFICIAL BUSINESSPENALTY FOR PRIVATE, USE $300
FOLD
NO POSTAGENECESSARYIF MAILEDIN THE
UNITED STATES
BUSINESS REPLY MAILFIRST CLASS PERMIT NO. 12840 WASHINGTON, DC
POSTAGE WILL BE PAID BY ADDRESSEE
U.S INTERNATIONAL TRADE COMMISSION500 E STREET, SW.WASHINGTON, DC 20277--2840
ATTN:OFFICE OF ECONOMICSU.S.-Singapore Free Trade Agreement: PotentialEconomywide and Selected Sectoral Effects
ix
EXECUTIVE SUMMARY
On January 21, 2003, the U.S. International Trade Commission (Commission)received a letter from the Office of the United States Trade Representative (USTR)requesting that the Commission prepare a report in accordance with section 2104(f) ofthe Trade Act of 2002, to assess the likely impact of the U.S.-Singapore Free TradeAgreement (FTA) on the United States economy as a whole, on specific industrysectors, and on the interests of U.S. consumers.1 Section 2104(f)(3) also provides thatthe Commission, in preparing its assessment, review available economic assessmentsregarding any substantially equivalent proposed agreement and discuss areas ofconsensus and divergence between the various analyses and conclusions, includingthose of the Commission regarding the agreement.
Principal Findings
The United States and Singapore both have open trade regimes. The United States hasrelatively low tariffs while Singapore already has virtually no tariffs (i.e., six tariff lines,which cover only certain products containing alcohol). Both countries also have openinvestment regimes and good protections in place for intellectual property rights. TheFTA’s most important benefits are not related to the reciprocal tariff elimination asmuch as the agreement’s non-tariff provisions, and thus the effects are not easilyquantified or observed. Among the hardest-to-quantify results of the FTA are those thatmight be described as effects on the general business climate between the UnitedStates and Singapore. The FTA provides specific obligations in important areas such asintellectual property, services, investment, temporary entry of businesspersons, andtelecommunications. Because the agreement will secure these obligations, U.S.companies may be more likely to use Singapore as their base for expanded Asianoperations. In addition, this agreement may serve as a positive model for negotiationswith other trading partners because it includes bilateral commitments in a wide rangeof non-tariff areas not covered in earlier trade agreements.
1 On Jan. 15, 2003, USTR announced that the United States and Singapore had successfullyconcluded negotiations for the FTA (negotiations began in November 2000). On Jan. 29, 2003,President Bush signed a letter notifying Congress of the intent to enter into the FTA; the letter was receivedby Congress on Jan. 30, 2003, starting the countdown for when the FTA could be signed. On Feb. 28,2003, USTR received reports from 31 trade advisory groups commenting on the proposedU.S.-Singapore FTA. On Mar. 7, 2003, the text of the FTA was made available to the general public.President Bush and Singapore Prime Minister Chok Tong Goh signed the FTA on May 6, 2003. Office ofthe U.S. Trade Representative, “USTR Resources: Singapore Free Trade Agreement,” found athttp://www.ustr.gov/new/fta/singapore.htm, retrieved May 12, 2003.
x
The economywide effects on U.S. trade, production, and economic welfare of the FTAtariff reductions alone are likely to be negligible to very small. This is not an unexpectedfinding given the open trade relationship, small trade and bilateral investment flowsrelative to U.S. trade and investment worldwide, and Singapore’s small economyrelative to that of the United States. This finding was based on a quantitative analysisthat focused only on the impact of tariff removal, and did not account for theelimination or reduction of the non-tariff barriers (NTBs) related to such areas asservices and investment, and better enforcement of intellectual property rights (IPR).While the economic impact of the reduction of NTBs may be significant, economic datagenerally are not available for NTBs and quantitative analysis for the most part isunable to reflect the full impact of their reduction. The economic literature reviewed forthis report also generally estimates that U.S. economic welfare is not likely to besignificantly changed by the elimination of tariffs in a U.S.-Singapore FTA.
At the sectoral level, some sectors of the U.S. economy likely will experience increasedimport competition from Singapore, while other sectors likely will experienceincreased export opportunities in Singapore. However, any such increases would befrom a very small base, given Singapore’s small economy and small market size, andthus have a minimal impact on production, prices, or employment in correspondingU.S. sectors. Based on a quantitative analysis of the staged tariff removal, impactsfollowing implementation of the tariff removals under the FTA in 2016 most likelywould be greater for U.S. exports of vegetables, fruits, and nuts; meats; and otherprocessed foods. For U.S. imports, impacts most likely would be greater for electronicequipment and other machinery and equipment. U.S. imports of textiles, apparel, andleather products are not likely to increase significantly due to rules of originrequirements.
The Commission analysis also suggests that the effects of removing NTBs related toservices, IPR, and investment under the U.S.-Singapore FTA will have little impact onrelated U.S. sectors due to the relatively few trade barriers between the United Statesand Singapore. Nonetheless, certain provisions in the FTA may foster trade facilitationin service industries. For example, removal of certain restrictive regulatory barriersmay lead to increased U.S. exports in certain specific segments of the insuranceindustry, as well as greater sales by U.S. bank affiliates and affiliates of U.S. assetmanagement firms in Singapore. The FTA sets out high standards for protection andenforcement for copyrights and other intellectual property and may lead to increasedrevenues for certain U.S. industries dependent on IPR. The United States andSingapore already have a strong investment relationship with high standards for thetreatment of foreign investors.
United States-Singapore Free Trade Agreement
The FTA will, after the transitional period for staged duty reductions for goodsotherwise subject to duty, provide for duty-free trade in originating goods between the
xi
two countries.2 While most U.S.-origin goods already enter Singapore free undercolumn 1 general duty rates, often referred to as NTR or MFN duties, Singapore’sexports to the United States are subject to an average ad valorem equivalent duty rateof 1.17 percent. Immediately upon implementation of the agreement, Singapore willeliminate all remaining duties, while the United States will remove duties on 80 percentof goods, with remaining tariffs phased out over the next 12 years. Moreover,originating agricultural products of Singapore that are now subject to U.S. tariff-ratequotas eventually would be eligible to enter free of duty in unlimited quantities.However, because the FTA’s rules of origin on goods containing non-party inputs arebased on specified changes in tariff classification, it is difficult to predict whatpercentage of present or future trade would be considered eligible for the FTA’s tariffbenefits.
In addition to providing the schedules of tariff elimination and rules of origin for tradein goods, the agreement contains bilateral commitments in a wide range of non-tariffareas. It provides specific obligations in such areas as intellectual property, services,investment, temporary entry of businesspersons, and telecommunications, amongothers. For instance, the intellectual property provisions require Singapore to adoptstronger protections for copyrights, trademarks, patents, and trade secrets, andstrengthen its IPR enforcement. The commitments pertaining to service industries liftmany of Singapore’s remaining restrictive regulatory barriers in place against U.S.service providers, particularly in the area of financial services, while investmentprovisions largely address and solidify the disciplines considered essential for stablebusiness exchange, increased investment, and economic growth.
In certain areas the agreement also establishes its dispute settlement provisions as theprimary basis for dealing with issues arising under the FTA. These include issuesrelating to trade in goods and the application of concessions under the FTA; rules oforigin matters under the FTA; customs adminstrative issues; e-commerce provisions ofFTA; and investment issues related to FTA. In other areas such as safeguards, labor,environment, services, and technical barriers to trade, it provides that disputesettlement be conducted under the provisions of WTO agreements. In a few areas,such as express delivery services, the FTA breaks new ground by distinguishing theseservices and providing certain changes intended to expedite customs procedures. Inother areas, such as standards, the FTA promotes greater transparency. Two keyareas dealt with in side agreements in the North American Free Trade Agreementwere included as specific chapters–namely, labor standards and the environment.
For covered investments, each party must extend national and most-favored-nationtreatment to investors of the other party and observe customary international law in allrespects. Expropriation can occur only for a public purpose, must be
2 References in this section to chapters and articles are made to the cited provisions found at UnitedStates Trade Representative, “USTR Resources: Singapore Free Trade Agreement, Final Text of FreeTrade Agreement” found at http://www.ustr.gov/new/fta/Singapore/final.htm, retrieved May 12,2003.
xii
nondiscriminatory, and must result in payment of prompt, adequate compensation inaccordance with due process of law. Further, the parties must allow all capitaltransfers relating to covered investments to be made freely and without delay; noperformance requirements or preferences for goods produced or sold in a party’sterritory can be imposed. Nor can the parties link the volume or value of imports to thevolume or value of exports or to the amount of foreign exchange associated with suchinvestment. Dispute settlement and specific rules on capital transfers are included.
U.S.- Singapore Trade Flows and Investment Relationship
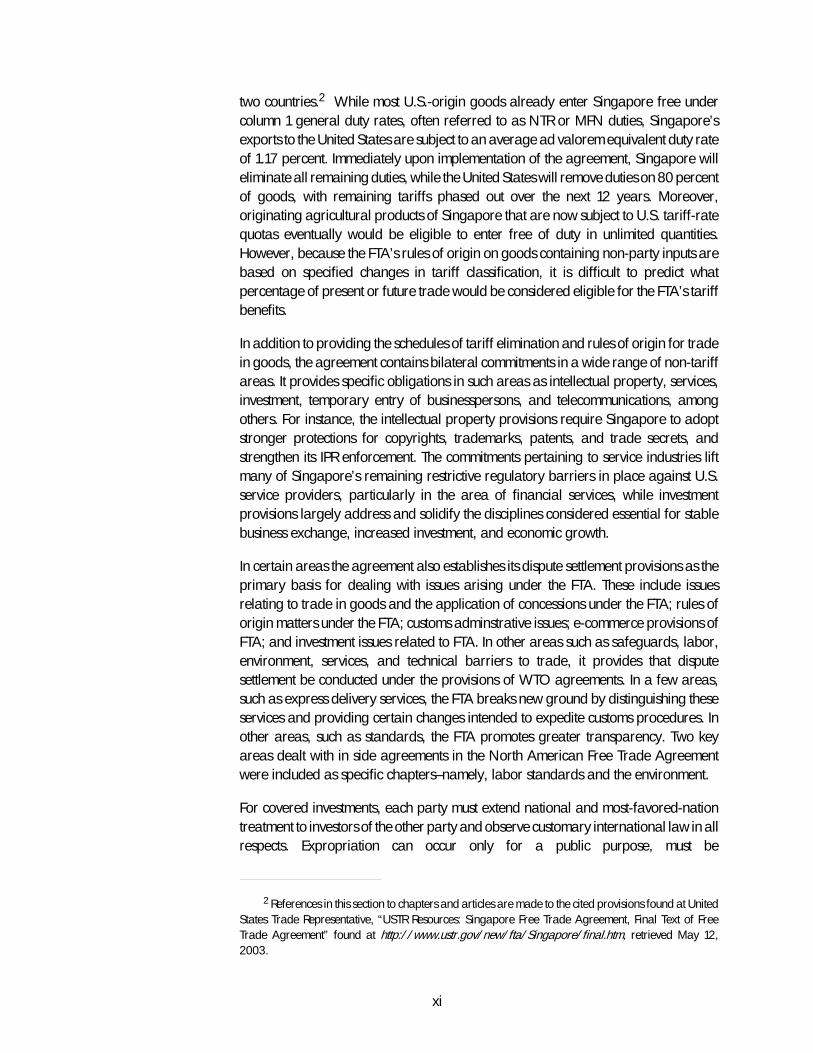
Singapore is less than 1 percent the size of the U.S. economy. Singapore has an openeconomy, with very few applied tariffs and an investment regime that activelypromotes foreign inflow of both human and financial capital. In 2002, Singapore wasthe 12th largest U.S. trading partner in terms of total trade. Following years of U.S.trade deficits with Singapore, the United States registered a bilateral merchandisetrade surplus of $0.9 billion in 2001 and $0.6 billion in 2002. In 2002, U.S. domesticmerchandise exports to Singapore measured $14.7 billion, while U.S. imports forconsumption from Singapore measured $14.1 billion (figure ES-1).
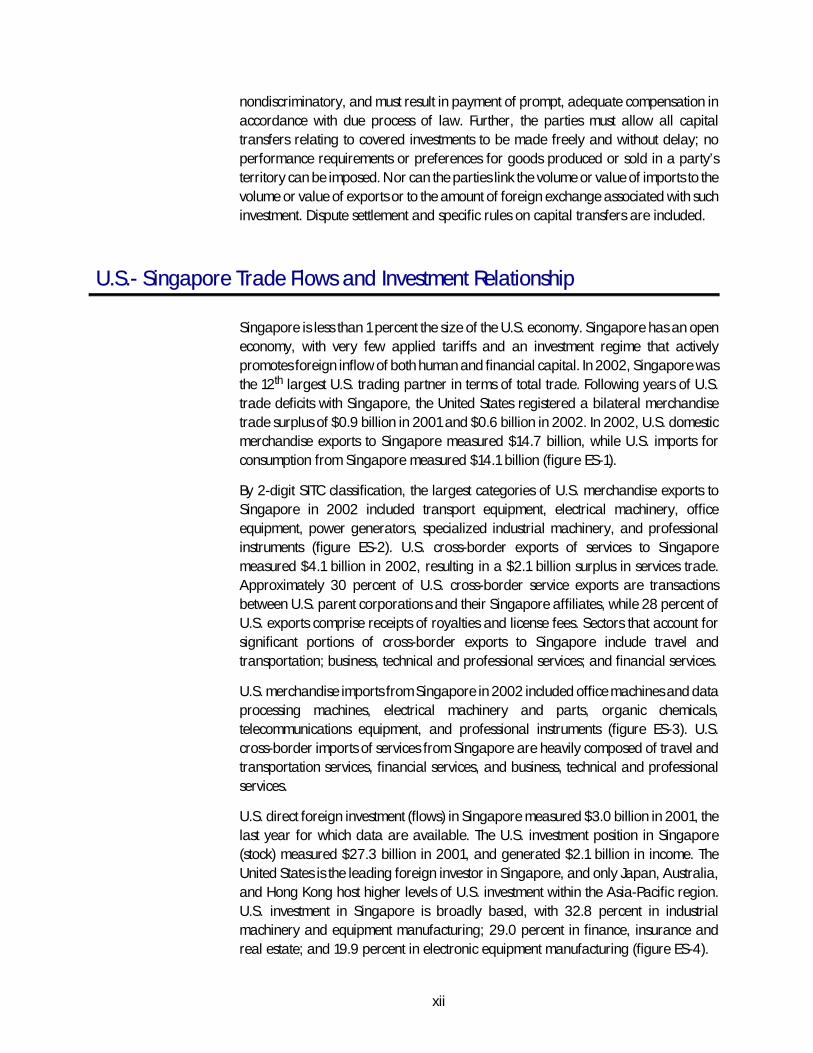
By 2-digit SITC classification, the largest categories of U.S. merchandise exports toSingapore in 2002 included transport equipment, electrical machinery, officeequipment, power generators, specialized industrial machinery, and professionalinstruments (figure ES-2). U.S. cross-border exports of services to Singaporemeasured $4.1 billion in 2002, resulting in a $2.1 billion surplus in services trade.Approximately 30 percent of U.S. cross-border service exports are transactionsbetween U.S. parent corporations and their Singapore affiliates, while 28 percent ofU.S. exports comprise receipts of royalties and license fees. Sectors that account forsignificant portions of cross-border exports to Singapore include travel andtransportation; business, technical and professional services; and financial services.
U.S. merchandise imports from Singapore in 2002 included office machines and dataprocessing machines, electrical machinery and parts, organic chemicals,telecommunications equipment, and professional instruments (figure ES-3). U.S.cross-border imports of services from Singapore are heavily composed of travel andtransportation services, financial services, and business, technical and professionalservices.
U.S. direct foreign investment (flows) in Singapore measured $3.0 billion in 2001, thelast year for which data are available. The U.S. investment position in Singapore(stock) measured $27.3 billion in 2001, and generated $2.1 billion in income. TheUnited States is the leading foreign investor in Singapore, and only Japan, Australia,and Hong Kong host higher levels of U.S. investment within the Asia-Pacific region.U.S. investment in Singapore is broadly based, with 32.8 percent in industrialmachinery and equipment manufacturing; 29.0 percent in finance, insurance andreal estate; and 19.9 percent in electronic equipment manufacturing (figure ES-4).
xiii
����������������������������
����������������������������
���������������������
������������������
������������������
������ ������
-10000
-5000
0
5000
10000
15000
20000
25000
1996 1997 1998 1999 2000 2001 2002
Source: U.S. Department of Commerce.
������������������������������������������������������������������������������������������������������������������������������������������������������������������������������������������������������������������������������������������������������������������������������������������������������������������������������������������������������������������������������������������������������������������������������������������������������������������������������������������������������������������������������������������������������������������������������������������������������������������������������������������������������������������������������������������������������������������������������������������������������������������������������������������������������������������������������������������������������������������������������������������������������������������������������������������������������������������������������������������������������������������������������������������������������������������������������������������������������������������������������������������������������������������������������������������������������������������������������������������������������������������������������������������������������������������������������������������������������������������������������������������������������������������������������������������������������������������������������������������������������������������������������������������������������������������������������������������������������������������������������������������������������������������������������������������������������������������������������������������������������������������������������������������������������������������������������������������������������������������������������������������������������������������������������������������������������������������������������������������������������������������������������
Imports
Balance
Figure ES-1U.S. merchandise trade with Singapore: Imports, exports, and tradebalance
Million dollars
Exports
Figure ES-2U.S. exports to Singapore, 2002
Other 38.7%
Transport equipment 19.4%
Electrical machinery 16%
Office and data processing machines7.8%
Source: U.S. Department of Commerce.
Power generating machinery 6.3%Specialized machinery 6.1%
Professional instruments 5.8%

xiv
Figure ES-3U.S. imports from Singapore, 2002
Other 13.2%
Professional instruments 3.9%
Electrical machinery 11.7%
Office and data processing machines54.2%
Source: U.S. Department of Commerce.
Special transactionsnot classified 6.5%
Organic chemicals 5.5%
Telecommunicationequipment 5.0%
Figure ES-4U.S. direct investment in Singapore, by industry sector, 2001
Finance, insurance, andreal estate1 25.9%
Industrial machinery andequipment 29.2%
Wholesale trade 5.1%
Electronic and otherelectric equipment 17.7%
1 Excludes depository institutions.Source: U.S. Department of Commerce, Bureau of Economic Analysis, Survey of CurrentBusiness, Sept. 2002, p. 77.
Petroleum 7.0%
Other services 4.1%
Other 10.8%
xv
Review of Literature
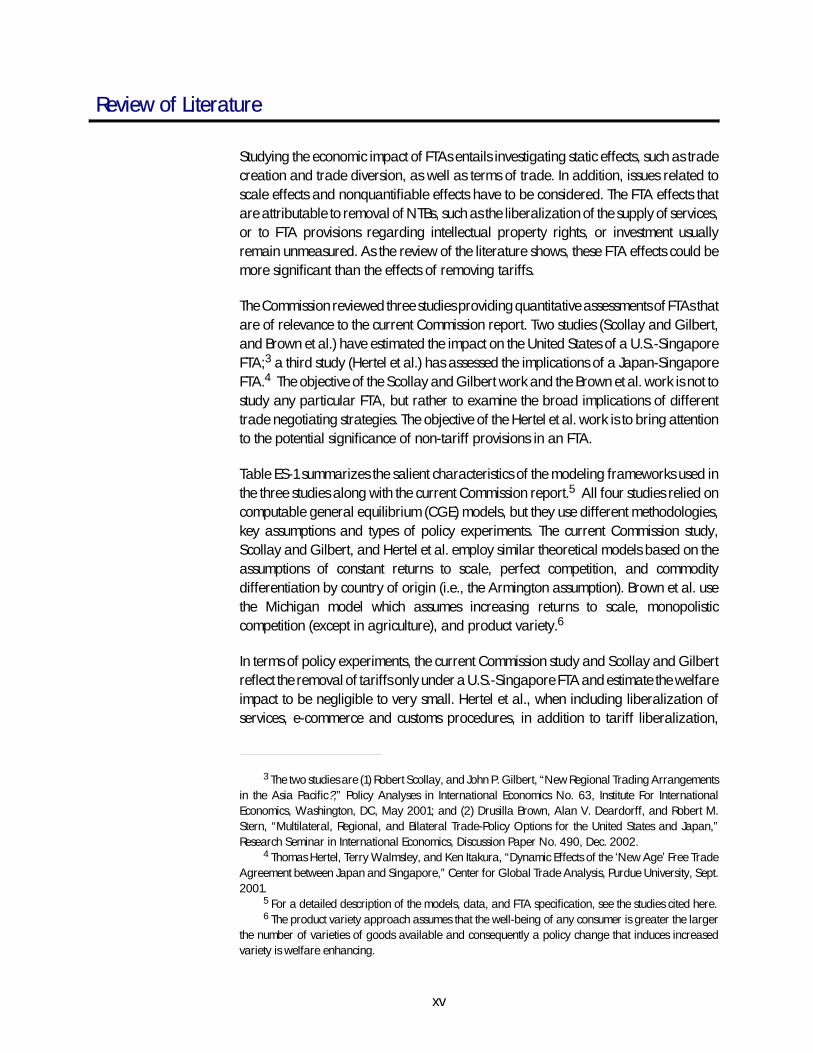
Studying the economic impact of FTAs entails investigating static effects, such as tradecreation and trade diversion, as well as terms of trade. In addition, issues related toscale effects and nonquantifiable effects have to be considered. The FTA effects thatare attributable to removal of NTBs, such as the liberalization of the supply of services,or to FTA provisions regarding intellectual property rights, or investment usuallyremain unmeasured. As the review of the literature shows, these FTA effects could bemore significant than the effects of removing tariffs.
The Commission reviewed three studies providing quantitative assessments of FTAs thatare of relevance to the current Commission report. Two studies (Scollay and Gilbert,and Brown et al.) have estimated the impact on the United States of a U.S.-SingaporeFTA;3 a third study (Hertel et al.) has assessed the implications of a Japan-SingaporeFTA.4 The objective of the Scollay and Gilbert work and the Brown et al. work is not tostudy any particular FTA, but rather to examine the broad implications of differenttrade negotiating strategies. The objective of the Hertel et al. work is to bring attentionto the potential significance of non-tariff provisions in an FTA.
Table ES-1 summarizes the salient characteristics of the modeling frameworks used inthe three studies along with the current Commission report.5 All four studies relied oncomputable general equilibrium (CGE) models, but they use different methodologies,key assumptions and types of policy experiments. The current Commission study,Scollay and Gilbert, and Hertel et al. employ similar theoretical models based on theassumptions of constant returns to scale, perfect competition, and commoditydifferentiation by country of origin (i.e., the Armington assumption). Brown et al. usethe Michigan model which assumes increasing returns to scale, monopolisticcompetition (except in agriculture), and product variety.6
In terms of policy experiments, the current Commission study and Scollay and Gilbertreflect the removal of tariffs only under a U.S.-Singapore FTA and estimate the welfareimpact to be negligible to very small. Hertel et al., when including liberalization ofservices, e-commerce and customs procedures, in addition to tariff liberalization,
3 The two studies are (1) Robert Scollay, and John P. Gilbert, “New Regional Trading Arrangementsin the Asia Pacific?,” Policy Analyses in International Economics No. 63, Institute For InternationalEconomics, Washington, DC, May 2001; and (2) Drusilla Brown, Alan V. Deardorff, and Robert M.Stern, “Multilateral, Regional, and Bilateral Trade-Policy Options for the United States and Japan,”Research Seminar in International Economics, Discussion Paper No. 490, Dec. 2002.
4 Thomas Hertel, Terry Walmsley, and Ken Itakura, “Dynamic Effects of the ‘New Age’ Free TradeAgreement between Japan and Singapore,” Center for Global Trade Analysis, Purdue University, Sept.2001.
5 For a detailed description of the models, data, and FTA specification, see the studies cited here.6 The product variety approach assumes that the well-being of any consumer is greater the larger
the number of varieties of goods available and consequently a policy change that induces increasedvariety is welfare enhancing.
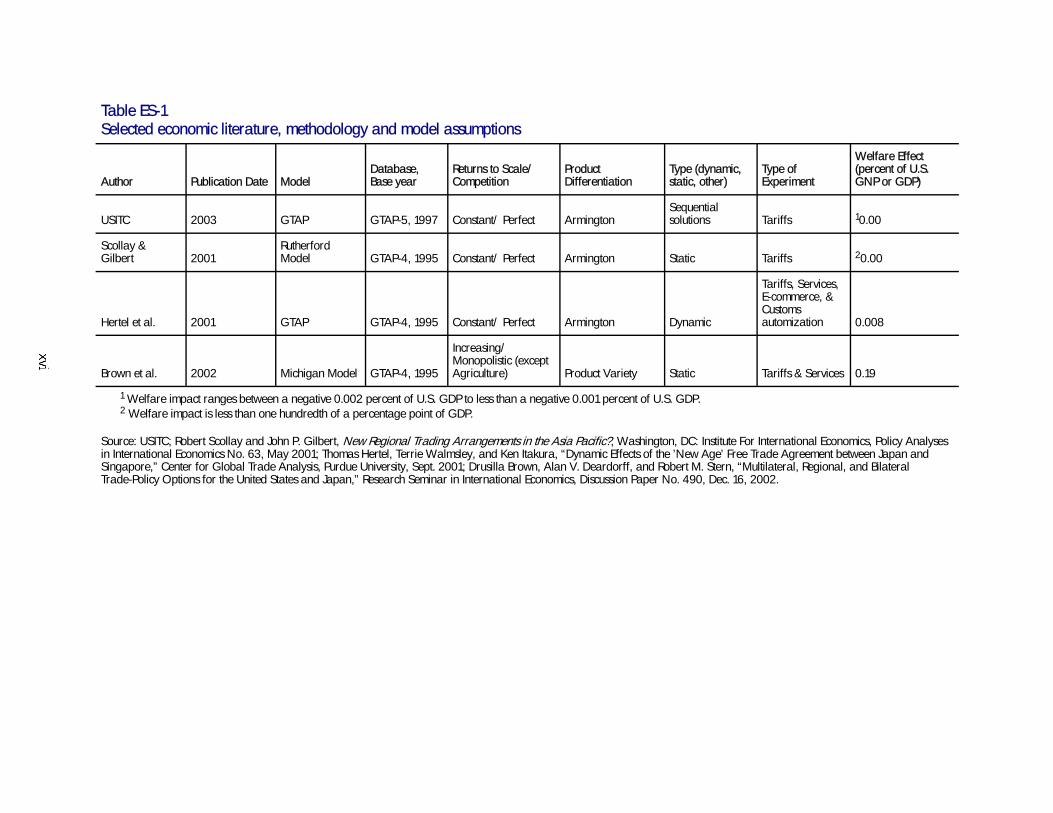
Table ES-1Selected economic literature, methodology and model assumptions
Author Publication Date ModelDatabase,Base year
Returns to Scale/Competition
ProductDifferentiation
Type (dynamic,static, other)
Type ofExperiment
Welfare Effect(percent of U.S.GNP or GDP)
USITC 2003 GTAP GTAP-5, 1997 Constant/ Perfect ArmingtonSequentialsolutions Tariffs 10.00
Scollay &Gilbert 2001
RutherfordModel GTAP-4, 1995 Constant/ Perfect Armington Static Tariffs 20.00
Hertel et al. 2001 GTAP GTAP-4, 1995 Constant/ Perfect Armington Dynamic
Tariffs, Services,E-commerce, &Customsautomization 0.008
Brown et al. 2002 Michigan Model GTAP-4, 1995
Increasing/Monopolistic (exceptAgriculture) Product Variety Static Tariffs & Services 0.19
1 Welfare impact ranges between a negative 0.002 percent of U.S. GDP to less than a negative 0.001 percent of U.S. GDP.2 Welfare impact is less than one hundredth of a percentage point of GDP.
Source: USITC; Robert Scollay and John P. Gilbert, New Regional Trading Arrangements in the Asia Pacific?, Washington, DC: Institute For International Economics, Policy Analysesin International Economics No. 63, May 2001; Thomas Hertel, Terrie Walmsley, and Ken Itakura, “Dynamic Effects of the ’New Age’ Free Trade Agreement between Japan andSingapore,” Center for Global Trade Analysis, Purdue University, Sept. 2001; Drusilla Brown, Alan V. Deardorff, and Robert M. Stern, “Multilateral, Regional, and BilateralTrade-Policy Options for the United States and Japan,” Research Seminar in International Economics, Discussion Paper No. 490, Dec. 16, 2002.
xvii
estimate the welfare impact to be small. Brown et al. derive larger welfare resultsmeasuring tariff and service liberalization with differing assumptions regardingreturns to scale, competition, and product differentiation.
In summary, the current Commission study reaches similar conclusions regarding thewelfare impact of tariff removal under a U.S.-Singapore FTA as Scollay and Gilbertdo; and the Hertel et al. and Brown et al. studies illustrate that the magnitude of thepotential economic impact of an FTA depends on the degree to which non-tariffaspects of an FTA can be quantified.7
Impact of U.S.-Singapore FTA Tariff Cuts on the U.S.Economy and Selected Sectors in 2016The Commission used a CGE model and its corresponding data to estimate the possibleeffects of a U.S.-Singapore FTA on a number of economic measures. The model used inthis study allowed the Commission to assess the likely effects of a multiple stagephase-in of tariff cuts, and to include an explicit time dimension in the assessment. Asmentioned above, the estimated impacts reflect only the tariff cuts and removal of thetariff-rate quotas for food and agricultural products as lack of necessary dataprecluded the estimation of removal of investment restrictions, stronger enforcement ofintellectual property rights, or the easing of customs procedures. In addition, in thecase of the services sector, the agreement does not contain any substantialliberalization that could be captured analytically in this general equilibrium analysis.
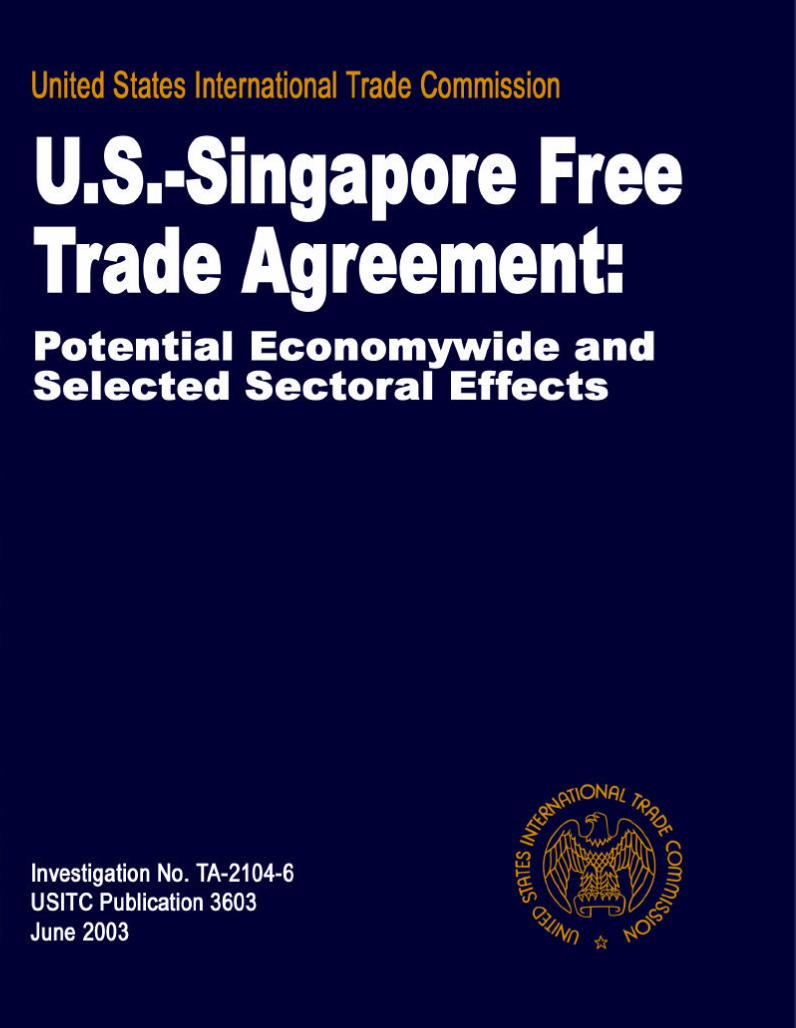
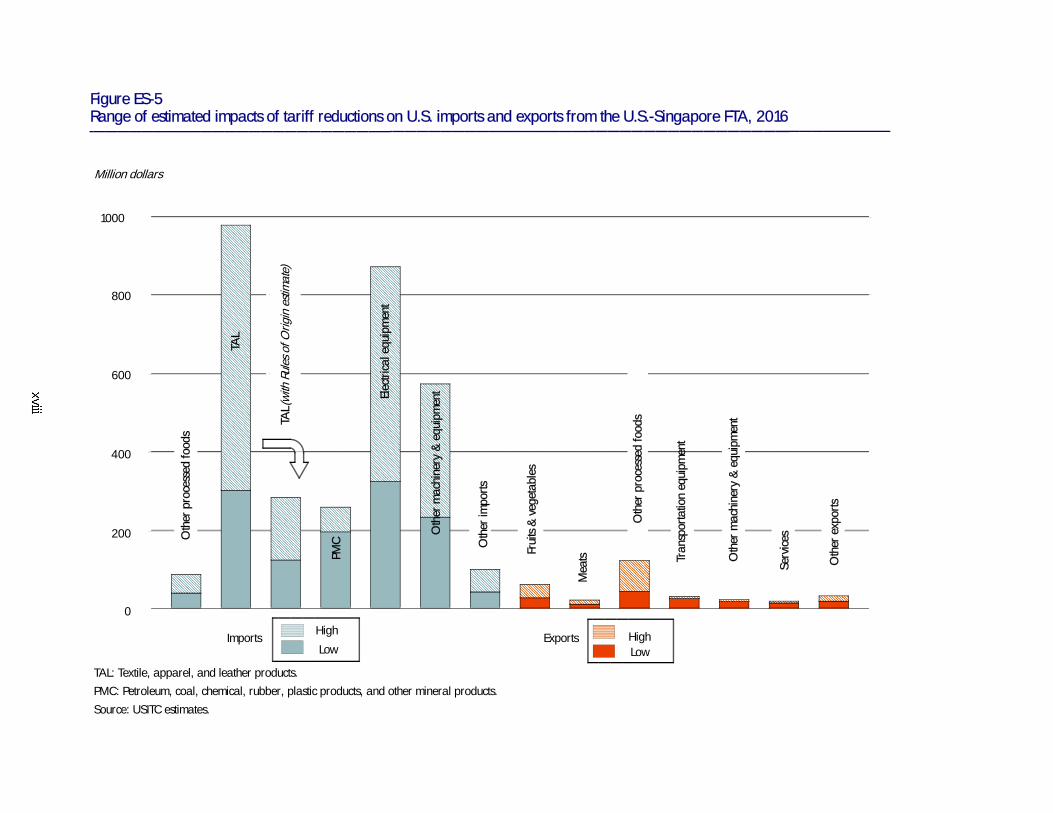
In order to estimate the impact of the full phase-in of tariff cuts by 2016, the Commissionconducted a series of simulations using different assumptions regarding (i) the relativegrowth of the U.S. economy8 and, (ii) the economies’ responsiveness to changes intrade policies.9 Figure ES-5 summarizes trade impacts in ranges, due to those diferentassumptions, for selected sectors. Figure ES-5 shows not only that the FTA will have asmall impact on U.S. exports to Singapore, but that the range of this impact is also verysmall, with the exception of other processed foods exports. The latter exports are likelyto increase by $40 million to $120 million. Figure ES-5 shows that FTA impacts onimports from Singapore are somewhat larger than those for exports for some sectors.Imports of electrical equipment are likely to increase by $320 million to $870 million. Inthe case of textiles, apparel and leather products imports, when the FTA simulation
7 For a further discussion of the Commission analysis see ch. 5, “Impact of Eliminating Tariffs.”Further discussion of the three studies reviewed by the Commission is presented in ch. 4, “Review ofLiterature.”
8 The Commission varied annual U.S. growth rates for the period 2004-16 from 20 percent lowerthan the standard World Bank projection to 20 percent higher.
9 In the GTAP model, the responsiveness to trade policy changes is captured by the Armingtonelasticities of substitution. The default values for these elasticities are based on reviews of the econometricliterature. In this study, the Commission considered a range of the elasticities. For a discussion of theArmington assumption and parameters in the CGE model used in this report, see Chapters 2 and 4 inHertel, T. W., editor, Global Trade Analysis: Modeling and Applications, Cambridge University Press,1997.
��������������������� ���������
��������������������������������������� ������ ������ ������
���������
���������������������������
��������������������������������������������������������������������������������������������������������� ��������������������������������������������������������������������������������������������������������������������������������������������������������������������������������������������������������������� ��������������������������
� ���������������������������������������������������
������������ ���������������������
���������������������������������������������������������������������������������������������������������������������������������������������������������������������������������������������������������������������������������������������������������������
���������������������������������������������������������������������������������������������������������������������������������������������������������������
������������������������������
Figure ES-5Range of estimated impacts of tariff reductions on U.S. imports and exports from the U.S.-Singapore FTA, 2016
Million dollars
TAL: Textile, apparel, and leather products.
PMC: Petroleum, coal, chemical, rubber, plastic products, and other mineral products.
Source: USITC estimates.
������������������������������������������������������������������������������������������������������������������������������������������������������������������������������������������������������������������������������������������������������������������������������������������������������������������������������������������������������������������������������������������������������������������������������������������������������������������������������������������������������������������������������������������������������������������������������������������������������������������������������������������������������������������������������������������������������������������������������������������������������������������������������������������������������������������������������������������������������������������������������������������������������������������������������������������������������������������������������������������������������������������������������������������������������������������������������������������������������������������������������������������������������������������������������������������������������������������������������������������������������������������������������������������������������������������������������������������������������������������������������������������������������������������������������������������������������������������������������������������������������������������������������������������������������������������������������������������������������������������������������������������������������������������������������������������������������Imports
1000
800
600
400
200
0
TAL
(with
Rule
sofO
rigin
estim
ate)
PMC
TAL
Elec
trica
lequ
ipm
ent
Oth
erm
achi
nery
&eq
uipm
ent
Oth
erim
ports
Oth
erpr
oces
sed
food
s
Frui
ts&
vege
tabl
es
Mea
ts
Oth
erpr
oces
sed
food
s
Tran
spor
tatio
neq
uipm
ent
Oth
erm
achi
nery
&eq
uipm
ent
Serv
ices
Oth
erex
ports
�������������������������������������������������������������������������������������������������������������������������������������������������������������������������������������������������������������������������������������������������������������������������������������������������������������������������������������������������������������������������������������������������������������������������������������������������������������������������������������������������������������������������������������������������������������������������������������������������������������������������������������������������������������������������������������������������������������������������������������������������������������������������������������������������������������������������������������������������������������������������������������������������������������������������������������������������������������������������������������������������������������������������������������������������������������������������������������������������������������������������������������������������������������������������������������������������������������������������������������������������������������������������������������������������������������������������������������������������������������������������������������������������������������������������� HighHigh
LowExports
Low
xix
does not explicitly account for rules of origin requirements, these sector imports areestimated to increase by $300 million to $970 million. As shown in figure ES-5, whenthe FTA’s rules of origin requirements are explicitly considered, U.S. imports of textiles,apparel, and leather products are estimated to increase by $120 million to $280million, limiting the effects of the FTA for this sector.
Preferential trade liberalization due to tariff elimination has a minimal impact on U.S.production. The textiles, apparel, and leather products sector–the most affectedsector–is estimated to shrink by about 0.05 percent in the United States. U.S. output ofvegetables and fruits is projected to increase by about 0.05 percent.
The small estimated sectoral impacts suggest that the effects of tariff removals underthe U.S.-Singapore FTA on U.S. economic welfare and gross domestic product (GDP)would be negligible to very small.10 Welfare analysis confirms that followingimplementation of the tariff removals under the FTA in 2016, when bilateral tradewould be fully liberalized, the welfare impact for the United States would rangebetween a negative 0.002 percent of U.S. GDP to less than a negative 0.001 percent ofU.S. GDP.
This is not an unexpected finding given the open trade relationship, small trade andbilateral investment flows relative to U.S. trade and investment worldwide, andSingapore’s small economy relative to that of the United States. The United Statessecured improved rules in a wide range of areas such as intellectual property, services,investment, temporary entry of businesspersons, and telecommunications. Withregard to tariff elimination, however, because Singapore has so few tariffs, U.S.exports to Singapore will not change materially as a result of tariff elimination. U.S.imports from Singapore, on the other hand, are expected to rise very slightly in thoselimited areas where the United States is eliminating significant tariffs.11
Impact of U.S.-Singapore FTA on Selected NTBs: AQualitative AssessmentQualitative analysis of the effects of the FTA suggests that the agreement will have littleimpact in the short to medium term because of liberalization with respect to trade inservices, enhanced investment, and IPR protection. Nonetheless, certain provisions inthe FTA may foster trade facilitation in service industries. The provisions in the FTA with
10 In this particular analysis, the term negligible refers to an absolute change of less than 0.001percent of U.S. GDP.
11 Singapore’s imports into the United States are subject to an average ad valorem equivalent dutyrate of 1.17 percent, while most U.S.-origin goods already enter Singapore free (subject to an average advalorem equivalent duty rate of 0.07 percent. Immediately upon implementation of the agreement,Singapore will eliminate all remaining duties, while the United States will remove duties on 80 percent ofgoods, with remaining tariffs phased out over the next 12 years.

xx
respect to financial services and professional services remove certain restrictiveregulatory barriers and may lead to increased U.S. exports in certain specificsegments of the insurance industry, as well as greater sales by U.S. bank affiliates andaffiliates of U.S. asset management firms in Singapore. In contrast, the removal oflimitations on the operation of certain professional services, such as the relaxation oflocal ownership restrictions for U.S. architectural and engineering firms and therecognition of law degrees granted by certain U.S. law schools for the purposes ofqualifying for the Singapore bar, are not likely to result in a measurable increase inU.S. exports of professional services. While the FTA is not likely to affect trade inexpress delivery services, the FTA is ground-breaking in its inclusion of expressdelivery services in a free trade agreement. Similarly, the telecommunications sector isprominent in terms of bilateral trade and is notably distinct in the FTA. However, giventhe current openness of the telecommunications industries in both countries, the FTA isnot likely to result in significantly increased bilateral trade in this sector.
Singapore generally is viewed as having comparatively strong IPR protection. The FTAsets out high standards for protection and enforcement for copyrights and otherintellectual property and may lead to increased revenues for certain U.S. industriesdependent on IPR. The intellectual property provisions of the FTA address many of themost significant concerns the U.S. industry has expressed regarding the IPR regime inSingapore. In general, the IPR provisions of the FTA go further than the WTOAgreement on Trade-Related Aspects of Intellectual Property Rights (TRIPs). Nationaltreatment provisions are broad, permit no exceptions, and extend to “any benefitsderived” from the “protection and enjoyment” of intellectual property of any kind.
The United States and Singapore already have relatively open investment regimes andare key investors in each other’s economies. The investment provisions of the FTA gowell beyond those of any other agreement to which both parties are signatories andtherefore represent a major expansion of bilateral investment obligations. Theseprovisions largely encompass those long identified by the U.S. business community asbeing fundamental protections necessary to create a stable business environment andthereby encourage investment and promote economic growth.
Interested Party ViewsIn general, interested party views in this investigation of the FTA are positive. Themajority of interested parties that testified before the Commission or submittedstatements for the record praised the text and provisions of the FTA, particularly thosegroups or companies involved in the services sector. Most parties also see the FTA assetting an important precedent for future bilateral, regional, or multiregional tradenegotiations and potential FTAs with other nations. Specifically, interested partiesindicated that the commitments in the FTA provide for enhanced market access,promote a stable business environment for service providers, facilitate bilateral tradein services, and offer a high degree of IPR protection for firms. With some exceptions,representatives of the manufacturing and commodity goods sectors praised the FTA
xxi
and felt that implementation of the agreement will improve commercial trade andprovide for strong IPR protection for U.S. manufacturers. Dissenting views includeconcerns about rules of origin, import sensitive industries, and possible U.S.employment losses.12
12 A summary of written submissions is included in chapter 9.

1
CHAPTER 1Introduction
Purpose of the Report
This report assesses the likely impact of the U.S.-Singapore Free Trade Agreement(FTA) on the United States economy as a whole as well as on specific industry sectorsand the interests of U.S. consumers. The United States International Trade Commission(the Commission) initiated work on this investigation under Section 2104(f) of the TradeAct of 2002, following receipt of a letter on January 21, 2003 from the United StatesTrade Representative (USTR).1
As specified in section 2104(f)(2)-(3) of the Trade Act, the Commission shall submit tothe President and the Congress (not later than 90 calendar days after the Presidententers into the agreement2) a report including:
- an assessment of the likely impact of the agreement on the United Stateseconomy as a whole and on specific industry sectors, including the impact theagreement will have on the gross domestic product, exports and imports,aggregate employment and employment opportunities, the production,employment, and competitive position of industries likely to be significantlyaffected by the agreement, and the interests of the United States consumers;and
- a review of available economic assessments regarding the agreement,including literature regarding any substantially equivalent proposedagreement, and shall provide in its assessment a description of the analysesused and conclusions drawn in such literature and a discussion of areas ofconsensus and divergence between the various analyses and conclusions,including those of the Commission regarding the agreement.
1 A copy of the request letter appears in appendix A of this report and a copy of the Federal Registernotice appears in appendix B.
2 On Jan. 15, 2003, USTR announced that the United States and Singapore had successfullyconcluded negotiations for the U.S.-Singapore FTA (negotiations began in November 2000). On Jan. 29,2003, President Bush signed a letter notifying Congress of the intent to enter into the U.S.-Singapore FTA;the letter was received by Congress on Jan. 30, 2003, starting the countdown for when the agreementcould be signed. On Feb. 28, 2003, USTR received reports from 31 trade advisory groups commenting onthe proposed U.S.-Singapore FTA. On March 7, 2003, the text of the U.S.-Singapore FTA was madeavailable to the general public. President Bush and Singapore Prime Minister Chok Tong Goh signed theU.S.-Singapore FTA on May 6, 2003. United States Trade Representative (USTR), “USTR Resources:Singapore Free Trade Agreement,” found at http://www.ustr.gov/new/fta/singapore.htm, retrievedMay 12, 2003.
2
Scope of the Report
This report provides background information on Singapore’s economy. Thediscussion includes a macroeconomic and sectoral overview of Singapore’s economy,an analysis of Singapore’s merchandise trade flows with the United States and othercountries, a discussion of trade in services with the United States, and Singapore’sinvestment relationship with the United States and other countries. A summary of theU.S.-Singapore FTA also is provided.
The quantitative analysis focuses on the impact of tariff removal and does not accountfor the elimination or reduction of nontariff barriers related to such areas as servicesand investment, and better enforcement of intellectual property rights. The report alsoprovides additional qualitative analysis of the potential impact of the U.S.-SingaporeFTA on certain product and service sectors including textiles and apparel, expressdelivery services, financial services, professional services, and telecommunicationsservices. Sectors were chosen for review based on 1) a comprehensive examination ofthe provisions of the U.S.-Singapore FTA, and the apparent liberalization of sectoraltrade in terms of tariff and other nontariff measures, 2) bilateral sectoral trade flowsbetween the United States and Singapore and global trade patterns between thesecountries and the rest of the world, and 3) input from Commission industry analystsand industry sources. The qualitative analysis includes a description of certain keyprovisions of the FTA applicable to each sector and an assessment of the potentialimpact on U.S. imports, U.S. exports, and U.S. industry as a whole. Qualitativeanalysis is also provided regarding the potential trade and economic effects ofchanges in the investment and intellectual property regimes under the U.S.-SingaporeFTA. The specific provisions related to these disciplines are briefly summarized and thedegree to which they improve current conditions in each country and the specific effectthey may have on investment, trade, and the U.S. economy is discussed.
Approach of the Report
The literature review for this investigation includes a survey of analyses of the economiceffects of a U.S.-Singapore FTA as well as the effects on the United States of actual orpotential FTAs of which Singapore is a member. The economic literature reviewed wasdrawn from relevant academic, public sector, and private sector institutions.Information for this investigation also was obtained from the public hearing held onApril 24, 2003 and from public submissions in response to the Federal Register notice.
A multicountry model with economywide coverage of merchandise and service sectors(a global computable general equilibrium (CGE) model) is employed in this study. Thismodel is the Global Trade Analysis Project (GTAP) model, which is described morefully in appendix D. It was used to estimate the likely trade and economic impact of theremoval of tariff barriers as a result of a U.S.-Singapore FTA for 22 aggregated

3
sectors. The commodity aggregation adopted here identifies sectors that haverelatively high domestic-world price gaps due to tariffs and tariff-rate quotas (TRQs) (9food and agriculture sectors) and relatively large trade flows (9 manufacturingsectors).3 In terms of regional coverage, the analysis includes the United States andSingapore along with 11 other countries or regions.
The GTAP database, which represents the global economy in 1997, was adjusted toreflect expected economic conditions in 2004, the year the Commission estimates theU.S.-Singapore FTA to enter into force. The adjusted database reflects the UruguayRound Agreement implementation as well as Singapore’s bilateral and multilateralFTAs (e.g., Australia, New Zealand, Japan, and the Association of South East AsianNations Free Trade Area (AFTA)) with other countries. A baseline was then establishedby simulating changes that are likely to occur from 2004 to 2016 independent of theFTA. The impacts of the U.S.-Singapore FTA were then simulated by phasing in the FTAover the 2004-2016 period at intervals of four years. In particular, the CGE model wassimulated sequentially to approximate a dynamic process in which the world’seconomies change over time. To build the projected baseline, data for populationgrowth, capital growth, and gross domestic product (GDP) growth from the WorldBank4 were applied to the model to describe economic conditions in 2004, 2008,2012, and 2016. The impacts of the FTA were then simulated with respect to thebaseline by gradually removing relevant tariffs and price gaps due to TRQs. Due to thelack of necessary data, the estimation of the potential trade and economic impact of aU.S.-Singapore FTA on services, as well as the impact on the United States of changesin Singapore’s IPR regime and changes in the rules concerning foreign directinvestment, was not possible. In addition, a series of simulations were conducted todetermine the sensitivity of impacts to selected model assumptions and parameters (forexample, the parameters that determine the flexibility of bilateral trade patterns). Theanalysis and discussion of FTA impacts were based on the ranges obtained from thesensitivity analysis.
Data for the study, obtained from a public hearing, written submissions in response toFederal Register notice,5 government publications and treaties, and interviews withgovernment and industry contacts, were used to analyze the trade and economiceffects of the elimination of barriers to trade in services, the changes in IPR regime, and
3 Specifically, the sectoral specification is the following: fishing; forestry; coal, oil, gas, andminerals; grains; sugar crops; fruits, vegetables, and nuts; other crops; livestock farming; dairy products;meat products; sugar manufacturing; other processed food and tobacco products; textiles, apparel, andleather products; petroleum, mineral, and chemical products; ferrous metals and products; nonferrousmetals; wood products; transportation equipment; electronic equipment; machinery; othermanufactures; and services.
4 World Bank forecasts communication from GTAP staff, July 2002.5 See Appendix B containing Federal Register notice.
4
changes in the rules governing foreign direct investment. Other data sources used inthis report include the U.S. Department of State’s Bureau of Economic and BusinessAffairs, U.S. Department of Commerce, International Monetary Fund (IMF), andWorld Trade Organization (WTO).
Organization of the Report
Chapter 2 provides an overview of the U.S.-Singapore FTA. Chapter 3 provides anoverview of the Singapore economy for the most recent five years with respect to thestructure of the economy as well as economic variables such as GDP. It also providesinformation on Singapore’s merchandise trade flows, the current composition of itsmerchandise trade by sector and markets, trade in services, regional and economiccooperation, and the investment relationship with the United States and the world.Chapter 4 provides a literature review related to the U.S.-Singapore FTA. Chapter 5provides a quantitative analysis of the potential trade and economywide and sectoralimpacts on the United States of a fully implemented tariff elimination in theU.S.-Singapore FTA. Chapter 6 provides a qualitative assessment of the potentialimpact of the U.S.-Singapore FTA on selected sectors. Chapter 7 provides a survey ofthe intellectual property provisions of the U.S.-Singapore FTA and provides aqualitative assessment of the potential impact on the United States. Chapter 8 providesa survey of the investment provisions of the U.S.-Singapore FTA as well as a qualitativeassessment of the potential impact of the U.S.-Singapore FTA on selected sectors.Chapter 9 summarizes hearing testimony and written submissions.
5
CHAPTER 2Overview of the U.S.-Singapore FTA
Scope of Chapter
This chapter provides a chapter-by-chapter summary of the agreement text,1 as signedby the parties on May 6, 2003.2 Its particular focus is on market access, primarily thetariff commitments and rules of origin and their implications for this analysis. Thenontariff provisions of the agreement are discussed in greater detail in subsequentchapters of the report. It should be noted that this summation of commitments is not anofficial interpretation by the U.S. Government of any part of the text of the agreement,and that the language of the FTA itself conveys the commitments of the parties.
Brief Summary of Treaty Provisions
IntroductionThe text of the agreement with Singapore is largely modeled upon the North AmericanFree Trade Agreement (NAFTA) and uses some of the NAFTA language verbatim,such as some of the framework establishing agricultural tariff-rate quotas.3 The FTAalso includes commitments to observe certain WTO agreement obligations
1 References in this section to chapters and articles are made to the cited provisions found at USTR,http://www.ustr.gov/new/fta/Singapore/final.htm, as signed May 6, 2003.
2 To date, the United States has implemented free trade agreements with Israel, Canada, Mexico,and Jordan. Such agreements establish preferential regimes to accord a precise range of tariff and tradebenefits to particular goods or services of mutual benefit or interest to the parties, and thus are notintended to cover every possible product or commercial situation (as is the case with a multilateralagreement). Each free trade agreement contains schedules of concessions, rules of origin, and otherlegal provisions tailored in scope to apply to qualifying trade between the parties. Commitments onservices, investment, intellectual property, free movement of business persons, and similar matters arealso included, insofar as they apply to trade between the parties.
3 In a tariff-rate quota (TRQ), two rate lines are minimally required, with one according a lower dutyrate to imports up to a specified trigger quantity, and a second one according higher duty rates to all othershipments. It should be noted that an importer may choose to enter a shipment under either rate line untilthe trigger quantity mandating higher duty rates is filled, depending on unit values and quality of thegood in question and whether they vary by country or date of entry. In the Uruguay Round, as of Jan. 1,1995, TRQs replaced prior absolute quotas imposed under section 22 of the Agricultural Adjustment Act(7 U.S.C. 624) or other measures. The over-TRQ duty rate is intended to be economically prohibitive, thusrestricting imports to the in-quota or trigger quantity.
6
between the parties; these bilateral obligations would exist separately even if the WTOagreement provision on the corresponding matter was eliminated or somehow ceasedto apply. Other FTA provisions relate solely to U.S. trade relations with Singapore or toprovisions of Singapore law that the United States wishes to change, and chieflycomprise obligations being assumed by Singapore rather than by the United States.Some portions of the agreement–such as those dealing with intellectual propertyrights–are significant and will be described in greater detail below. Other issues intrade relations between the parties are discussed outside the scope of this chapter.
Summary of Tariff CommitmentsUnder article 2.2 of the agreement and the related annexed schedules of concessions,Singapore would immediately eliminate its own duties on eligible U.S. exports, whilethe United States would implement a more complex schedule of concessions involvingseveral categories of staged duty elimination on goods originating in Singapore.Many goods produced in Singapore would be guaranteed existing duty-free access orgain immediate duty-free access; sensitive agricultural products would be subject totariff-rate quotas; important apparel categories (mainly those goods of cotton or ofman-made fibers) would receive reduced rates up to stated tariff preference levels; afew named rate lines have stated commitments separate from the staging categories;and other products would receive staged duty reductions over 4, 8, or 10 years.Acceleration of scheduled reductions could be considered upon a request by eitherparty. Thus, at the end of the 10-year maximum duty staging period, all U.S. duties andtariff-rate quotas on originating goods entered with appropriate documentationwould be eliminated.
These tariff benefits will be given only to “originating goods” under the terms and rulesof the agreement–namely, those comprising inputs only from the two parties orcontaining only de minimis third-country content, and those complying with rules oforigin based largely on stated changes in tariff classification from foreign inputs tofinished goods. Thus, not every “product of” a party or good shipped from one party tothe other would receive preferential tariff treatment, even at the end of the transitionperiod. Because of the complexity of the rules, and the need to know input sourcing andprocessing patterns for every product, FTA rules of origin are difficult to analyze, asdiscussed below.
Chapter-by-chapter review4
Chapter 1: Establishment and DefinitionsThe parties agree by means of this pact to set up a free trade area that is consistent withthe GATT, reaffirm that existing bilateral rights and obligations
4 References to chapters and articles in this section are to the corresponding provisions of theagreement text.
7
continue to apply, and restate that nothing in the free trade agreement is to be read asaltering any legal obligation under another international pact. Various definitions arealso set forth, among them an important definition with respect to the United States thatdeals with the territory of each party to which the free trade agreement will apply. Forthe United States, it includes the customs territory of the United States, U.S. and PuertoRican foreign trade zones, and its undersea international economic zone,5 but not theinsular possessions subject to HTS general note 3(a)(iv) and not any area of outerspace. For Singapore, the definition is a more standard one under international lawand includes all territory under its sovereign control, whether land or sea or air.
Chapter 2: National Treatment and Market AccessChapter 2 sets forth rules and obligations relating to trade in goods. Most of theprovisions on national treatment and market access are similar in legal form to thecorresponding provisions of other, broader agreements but apply only bilaterally, sothat the obligations do not extend to other countries and so that the benefits apply onlyto originating goods of the parties. The prohibition on export taxes does not changeU.S. domestic law as such taxes are prohibited by the Constitution. Other provisionsare similar to those of the NAFTA and deal with temporary importations, speedyrelease of goods, transshipment of goods, repaired/altered goods, and relatedissues. For example, no duties are allowed on the reentry of a good that has beenrepaired or altered in the other party, regardless of the good’s origin. However, article2.7, barring the imposition of prohibitions or restrictions on importing and exporting ofgoods, is not found in NAFTA, given that multilateral discipline on this subject matterwas first dealt with specifically in the GATT 1994 and the Agreement on Textiles andClothing (ATC); prohibitions or restrictions that would be allowed under theseagreements concerning trade with nonparties are to be allowed under this FTA. Theso-called customs user fee is barred for originating goods, and Singapore agrees tomake changes in its excise taxes and to allow the importation of “chewing gum withtherapeutic value.” Under article 2.14(b), antidumping or countervailing duties are tobe allowed if “applied pursuant to a Party’s domestic law.”
As set forth in annex 2A, the United States’ controls on the export of logs are allowed tocontinue, as are certain provisions of the Merchant Marine Act, the Passenger VesselAct, and section 12108 of title 46 of the U.S. Code, and any actions authorized by theWTO Dispute Settlement Body.
For the United States, the base duty rates are the 2002 column 1-general rates of duty,and rates are to be rounded down to the nearest 0.1 percent or to the nearest 0.1 cent.The text will also contain U.S. general notes and textile tariff preference levels. ForSingapore, base rates are the 2002 column 6 full rates of duty (the rates extended toWTO members).
5 The coastal waters under U.S. legal control presumably fall within “customs territory” for freetrade agreement purposes.

8
The following U.S. duty staging categories are established for different classes ofgoods, by HTS rate line: (1) immediate duty-free entry, (2) four equal annual stages oftariff reduction, (3) eight equal annual reduction stages, (4) ten equal annualreduction stages, (5) continuation of previous duty-free entry, (6) textile goods withtariff-preference levels (TPLs) under article 2.12 (apparel of cotton or man-madefibers),6 (7) duty-free entry without bond, and (8) goods of named headings of HTSchapter 98 subject to particular duty rates until January 1 in year 10 and after that freeof duty. Certain agricultural TPLs are also established, as shown in the general notes tothe U.S. schedule of concessions (annex 2B).
Chapter 3: Rules of OriginThe duty benefits of the FTA will apply to goods originating in Singapore or the UnitedStates, unless otherwise provided. Such goods are those wholly obtained or producedentirely in one or both parties, or those meeting the requirements of the origin rules inthe related annex 3A, or those expressly described in the chapter. Thus, as with theNAFTA, goods that contain only inputs attributable to the parties would be consideredeligible without regard to tariff shifts or other criteria, and the complex rules of theannex apply to those that contain nonparty-sourced inputs. Certain goods listed inannex 3B (labeled as the “integrated sourcing initiative”) are considered to beoriginating materials for purposes of meeting annex 3A requirements; also, underarticle 3.3, goods containing de minimis foreign content that does not undergo therequisite tariff shifts (limited in the aggregate for all such materials to 10 percent of theadjusted value of most goods) can also qualify as originating, though their value is stillcounted as “non-originating” when a regional value content test applies under annex3A. A limited number of exceptions–all in the agricultural sector and relating primarilyto sensitive commodities covered by U. S. tariff-rate quotas (such as dairy or sugarproducts)–are not allowed access to the de minimis exemption. A 7 percent de minimislimit applies to fibers or yarns incorporated in textile or apparel goods of section XI ofthe tariff schedule, and elastomeric yarns must be wholly formed in the territory of aparty for a good containing them to be deemed to meet the rules of origin. Underannex 3C, certain recovered or remanufactured goods can be treated as originatingin the country where they were recovered or remanufactured.
Various other articles set forth additional origin standards. Under article 3.4, anoriginating material of one party that is used in the other to make a good shall beconsidered to meet the rules of origin in the latter party. Also, a good involvingproduction in both parties will be considered to originate unless it fails to meet specifictests of this chapter. Article 3.5 sets forth the rules and formulas for computing regionalvalue content, with two types of computations: the build-down method and the build-upmethod. Article 3.6 provides the rules for valuing materials and the adjustments thatcan be made to producer costs. Under article 3.7, a good that originates will not be
6 Annex 2D sets forth the agreed conversion factors for covered apparel articles, to charge importsof goods of different types and size ranges.
9
disqualified because its accessories, spare parts, or tools delivered with it do notoriginate, if the latter are in customary quantities, invoiced with the good, and the goodstill meets any regional value test (treating the accessories, parts, or tools asnon-originating). The treatment of fungible materials is covered in a flexible manner inarticle 3.8, so that either physical segregation or inventory management (averaging,LIFO or FIFO) can be used to track them. Articles 3.9 and 3.10 deal with packagingmaterials and containers, which are generally to be disregarded in terms of theirorigin. Under article 3.11, indirect materials are treated as originating and valuedunder a producer’s accounting records. A more restrictive provision is contained inarticle 3.12–namely, that a good that undergoes subsequent production or otheroperations outside the parties will not be considered originating, other than minorloading or preservation operations. Thus, goods in general must be shipped directlyand without change from one party to the other in order to qualify for benefits.
Section B of the chapter deals with the verification and documentation of origin neededunder the agreement. In essence, an importer can claim FTA benefits if he knows thegood qualifies or if information in his possession so indicates, and he can be requiredto submit statements to establish qualification if asked by customs authorities. With suchclaims, the parties agree to give benefits to goods covered by such claims unless theylearn the goods do not qualify, and agree not to punish importers who act in good faithor who correct the entry documents and pay necessary duties in one year or a longerperiod set by a party. Records must be kept for five years after entry to establish theorigin of goods, under article 3.15. Verification (based on requests for information,visits, and other methods) is governed by article 3.16. Special provisions in article 3.17treat as originating apparel of HTS chapter 61 or 62 that is both cut (or knit to shape)and sewn or otherwise assembled in one or both parties from a fabric or yarn of anyorigin that was designated as of November 15, 2002 by a U.S. authority as beingunavailable in commercial quantities for purposes of HTS subheadings 9819.11.24 or9820.11.27 (relevant to two other tariff preference programs, pursuant to the AfricanGrowth and Opportunity Act and the Caribbean Basin Trade Partnership Act).
Section C deals with consultation and modifications to ensure a uniform and consistentapplication of the origin rules and also to keep them current and make agreedadjustments in the future. This procedure is likewise undertaken under the NAFTA, andresults in occasional changes in rules (sometimes as a result of Harmonized Systemclassification or tariff changes).
Section D contains definitions, which again are relatively standard and comparable tothe NAFTA. Last, section E deals with the application and interpretation of the rules,stating that they are based on the Harmonized System and that costs and values are tobe recorded based upon generally accepted accounting principles in the territory ofthe party concerned.
Annex 3A contains product-specific rules written on the basis of pertinent HSheadings, subheadings, split headings, or split subheadings (based largely on thedraft harmonized rules of origin being developed under the WTO Agreement on Rulesof Origin [ROO]). The notes provide that the most specific rule prevails over more

10
general ones, so that if a split subheading rule exists and the good meets it that goodwill be deemed originating. The annex then contains the heading-by-heading tariffshift and subsidiary rules, which determine the extent to which any shipment undereach provision can qualify for the FTA duty rate. It is not possible to identify the scope ofbenefits delineated by individual rules without specific knowledge of the industries ineach party and their sources of inputs, and without regard to tariff nomenclature andclassification.
Chapter 4: Customs AdministrationThis chapter deals with customs administration, including such subjects as publicationand notification (article 4.1), administration in a uniform/impartial/reasonablemanner (article 4.2), advance rulings available to importers in either party (article4.3), review and appeal (article 4.4), customs cooperation (article 4.5), confidentiality(article 4.6), penalties (4.7), release and security (4.8), risk analysis/targeting (4.9),and new commitments on efficient customs clearance procedures for expressshipments (4.10). These provisions are similar in general to those in the NAFTA and theWTO agreement cited above. Of interest is article 4.9.1, which requires each party toemploy risk management systems (including profiling and other methods of detectinghigh-risk goods, including those where transshipment or fraud is more common orthose with inherent security issues such as weapons).
Chapter 5: Textiles and ApparelThis chapter involves provisions on “cooperation in the prevention ofcircumvention”–and it imposes obligations on the “Government of Singapore tomonitor trade and ensure compliance. Of note are the provisions of article 5.2 dealingwith the prevention of textile/apparel transshipment, which involve prescribedrecord-keeping criteria on goods made under outward processing arrangements.Specific provisions deal with monitoring, including record-keeping rules andprocedures related to free trade zones (article 5.3), and cooperation and enforcementmatters such as site visits (article 5.4). The parties are obliged to share information(article 5.6) and Singapore must take steps to deal with all violations. Under article 5.5,if either party thinks that the other is not complying with the terms of the agreement withrespect to textiles and apparel, it can request consultations, and the United States canapply quotas to Singapore-made goods or revoke preferential benefits for particularfirms or products. None of these textile-related provisions can enter into force untildomestic laws required to apply them are in place. Specific provisions onconfidentiality (article 5.7) and consultations (article 5.8) are included for these goods.
There are also provisions in article 5.9 for “bilateral textile and apparel safeguardactions,” under which duty reductions can be suspended or the most-favored-nationduty rate can be applied, or other action can be taken, to deal with injury or actualthreat of injury. Such actions can continue for not more than two years, though atwo-year extension can be implemented if the injurious situation continues. Theseprovisions will continue over the ten-year transition period relating to this product
11
sector; only one such safeguard can be applied to a product during that period.Definitions applicable to this sector only are set forth in article 5.11.
Two textile-related matters should be noted: Singapore apparel meeting a “yarnforward” test will receive immediate duty-free entry, under provisions of chapter 2 and3; and an initial tariff preference level for apparel containing non-FTA cotton andman-made fibers of 25 million square meter equivalents shall apply. The TPL ceilingwould be phased out over eight years and most other tariffs on textile and apparelimports over five years.
Chapter 6: Technical Barriers to TradeThis chapter covers technical barriers to trade, including sanitary and phytosanitarymeasures, and is intended to conform to the WTO agreement on the same subject. Itrests on enhanced cooperation and consultations and a phasing out of certain currentbarriers in the area of conformity assessments. A working group on medical productsand their regulation is established under annex 6A.
Chapter 7: SafeguardsUnder article 7.1, a party can impose a bilateral safeguard measure (by suspendingstaging or increasing a duty rate, not to exceed the MFN level) when imports of anoriginating good of the other party at a reduced duty rate or without duty constitute asubstantial cause of serious injury or threat thereof to a domestic industry producing alike or directly competitive product. Notification of the other party and of the WTO isrequired, and parties must cooperate in investigating such situations. A safeguard canbe imposed for up to two years, with one two-year extension, and only one safeguardcan ever be imposed on a particular originating good, under article 7.2. The partiesmust progressively liberalize such measures and then, at the end of relief, return therate of duty to the level that would have applied without the safeguard. Provisionalmeasures (article 7.3) and compensation (article 7.4) are allowed. Article 7.5authorizes the exclusion of originating goods of a party when the other party imposesglobal safeguard measures, and each party retains all rights and obligations of theWTO Agreement on Safeguards.
Chapter 8: Cross-Border Trade in ServicesThis chapter deals with cross-border trade in services and investment. Significantly, themeasures covered by the agreement include those by national and subnationalgovernments and also by nongovernment service suppliers of a party, but notmeasures dealing with financial services, air services in most cases, governmentprocurement, subsidies, and grants. No obligation of employment is created, and theprovisions do not apply to “services supplied in the exercise of governmental authority”(noncommercial and noncompetitive services). National and most-favored-nationtreatment on covered services are guaranteed, with other provisions likewise similar tothose of the WTO General Agreement on Trade in Services (GATS) and the NAFTA;

12
regulation of services must proceed under the agreed rules of articles 8.3 and 8.5 (thelatter on market access). Article 8.8 covers domestic regulation of covered services.
Among the rules in this chapter is the prohibition on any limit on the number of servicesuppliers, value, operations, or output. The parties cannot require a local presence,under article 8.6; certain nonconforming measures are allowed under article 8.7; andreservations are contained in annexes 8A and 8B. Article 8.9 on recognition ispermissive rather than mandatory, and provides for MFN treatment where a nonpartyis accorded recognition relating to a covered service. Article 8.10 allows transfers andpayments of funds resulting from covered services. Under articles 8.10 and 8.11, aparty can deny benefits of the agreement where a service supplier meets certainconditions (such as bankruptcy or criminal conduct) or has non-party ownership orcontrol or does not conduct substantial business activities in the other party. Article 8.12provides that regulations shall be developed and applied in a transparent manner.Article 8.13 requires regular meetings on the obligations of this chapter and matters ofmutual interest. Annex 8C covers professional services and temporary licensing in amanner aimed at encouraging additional opportunities for covered persons in eachparty.
Chapter 9: TelecommunicationsThe two parties agree to ensure that enterprises of the other party will have access toand use of any public telecommunications transport network and service offered in itsterritory or across its borders. Such enterprises shall be permitted to provide services toindividual or multiple users; connect leased or owned circuits with publiccommunication networks; purchase or lease equipment; use public communicationtransport networks; and have access to network elements on a unbundled basis. Eachparty’s telecommunications regulatory body shall determine which network elementsto make available in accordance with national law. The parties must ensure that majorsuppliers in its territory provide interconnection for suppliers of the other party undernondiscriminatory terms, at any technically feasible point, in a timely fashion and of noless favorable quality than that provided by such major supplier for its own services.The agreement applies to submarine cable systems and landing stations wherecovered by national laws and regulations. Each party is to make licensing criteria,procedures, terms and conditions, and normal time frames publicly available. Eachparty must also ensure that its national telecommunications regulatory body maintainsappropriate procedures and authority to enforce domestic measures relating to theobligations set out in this chapter and provide for dispute resolution.
Chapter 10: Financial ServicesUnder this chapter, each party will accord national treatment andmost-favored-nation treatment to investors of the other party and provide marketaccess for financial institutions without limitations on the number of financialinstitutions, value of transactions, number of service operations or number of personsemployed. Cross-border trade in financial services must be allowed, and financial
13
institutions of one party must be able to provide new financial services in the otherparty that would be permitted to the latter’s own institutions without additionallegislative action. Neither party is required to furnish or allow access to informationrelated to individual customers or confidential information the disclosure of whichwould impede law enforcement, be contrary to the public interest or prejudicelegitimate commercial concerns. A party may not require financial institutions of theother party to hire individuals of a particular nationality or require more than a simplemajority of the board of directors to be nationals or residents of the party. Provisionsare made for nonconforming measures and exceptions. The parties agree thattransparent regulations and policies are important and shall publish in advanceregulations of general application and maintain or establish mechanisms to respondto inquiries from interested persons. Consultations and dispute resolution are to bedealt with under chapter 20 of the agreement, with individual investor disputescovered by chapter 15 (on investment). There are also provisions on limitations andconditions and a list of nonconforming measures. Annex 10A sets the scope ofcoverage of the chapter to insurance, banking, and other financial services, includingU.S. limitations related to state banking requirements. Annex 10B enumerates theparties’ reservations and other matters, while annex 10C lists specific commitmentsincluding more detailed statements on most-favored-nation treatment for banks inspecific areas. Annex 10D sets up a financial services committee to administer thechapter. Under section B of annex 10B, Singapore states that “qualifying full bankprivileges” are limited to six foreign banks and that no new full bank licenses will begranted to foreign banks; other provisions set forth limited commitments with respect towholesale banks (which do not deal with ordinary persons), offshore banks, merchantbanks, finance companies, money-changing and remittance networks, fundmanagers, and automated teller machines.
Chapter 11: Temporary Entry of Business PersonsEach party would be obliged to grant temporary entry for up to 90 days and underexpedited and transparent procedures to business persons of the other party who areotherwise qualified for entry under applicable domestic measures relating to publichealth and safety and national security. They must maintain or establish points ofcontact or other mechanisms to respond to interested persons regarding regulations.Dispute settlement provisions related to this process are provided. Annexes to thechapter deal with various categories of business visitors and professionals.
Chapter 12: Anticompetitive Business Conduct, Designated Monopolies, andGovernment EnterprisesEach party would be required to adopt or maintain measures to proscribeanticompetitive business conduct and take appropriate action with respect to suchconduct. Each party must establish or maintain an authority responsible for theenforcement of such measures. The enforcement policy may not discriminate on thebasis of the nationality of the subjects of the proceedings and must provide due processand procedures for review. A party may designate a monopoly or establish or

14
maintain a government enterprise. The Government of Singapore will be obliged tocontinue reducing, with a goal of substantially eliminating, its aggregate ownershipand other interests in entities organized under the laws of Singapore. The agreementprovides for transparency, information requests, and consultations.
Chapter 13: Government ProcurementThe parties reaffirm their commitments under the WTO Agreement on GovernmentProcurement (GPA) and confirm their desire to apply the APEC Non-Binding Principleson Government Procurement to all government procurement that is outside the scopeof the GPA. Except as provided for in the annexes, the Agreement does not covernoncontractual agreements or any form of governmental assistance not specificallycovered under the schedules attached to this chapter. These scheduled procurementcommitments extend coverage beyond previously agreed levels applicable underprior trade agreements in that they include some government owned or controlledentities. Annexes list covered entities, goods, and services to which the FTA will applyand deal with procurement threshold rules.
Chapter 14: Electronic CommerceUnder this chapter, a party cannot apply customs duties or other duties, fees, orcharges on or in connection with the importation or exportation of digital products byelectronic transmission. Thus, these products are effectively to be accorded protectionsthat likewise apply to goods in trade. The imported value of imported carrier media willbe determined by the cost of the medium alone without regard to the value of the digitalproducts stored on the carrier medium. A party likewise cannot accord less favorabletreatment to some digital products than it accords to other like digital products on thebasis of the nationality of the author, performer, producer, developer, or distributor ofthe products or the grounds that the digital products were created, stored, transmitted,or published outside its territory.
Chapter 15: InvestmentEach party would be required to accord to investors of the other party and coveredinvestments treatment no less favorable than that it accords to its own investors andinvestments; i.e., national and most favored nation treatment. Treatment must be inaccordance with customary international law, including fair and equitable treatmentand full protection and security. Expropriation shall be only for a public purpose, andmust be nondiscriminatory and occur upon payment of prompt, adequatecompensation in accordance with due process of law. Each party must permit alltransfers relating to a covered investment to be made freely and without delay. Neitherparty may impose or enforce performance requirements to export a given level orpercentage of goods; achieve a given level or percentage of domestic content;purchase, use, or accord preference to goods produced or sold in its territory; relatethe volume or value of imports to the volume or value of exports or to the amount of

15
foreign exchange associated with such investment; transfer a technology orproprietary knowledge to someone within its territory; or control distribution from itsterritory. Neither party may require that the senior management of an enterprise ofthat party nor a majority of the board of directors be of a particular nationality. In theevent of an investment dispute the claimant and respondent should initially seek toresolve the dispute by consultation and negotiation, which may include the use ofnonbinding third party procedures. Investment disputes may be submitted toarbitration if other efforts to resolve them fail, under rules of this chapter (with athree-year “statute of limitations” on initiating action). Annexes provide rules ontransfers, performance requirements, and service of documents.
Chapter 16: Intellectual Property RightsThe parties agree to give effect to articles 1 through 6 of the Joint RecommendationConcerning Provisions on the Protection of Well-Known Marks (1999) adopted by theAssembly of the Paris Union for the Protection of Industrial Property and the GeneralAssembly of the World Intellectual Property Organization (WIPO) and the TrademarkLaw Treaty. 7 Each party will ratify or accede to the Brussels Convention Relating to theDistribution of Programme-Carrying Signals Transmitted by Satellite, the InternationalConvention for the Protection of New Varieties of Plants (1991), the WIPO CopyrightTreaty (1996), the WIPO Performances and Phonograms Treaty (1996), and thePatent Cooperation Treaty (1984). Each party will make best efforts to ratify or accedeto the Hague Agreement Concerning the International Deposit of Industrial Designs(1999) and the Protocol relating to the Madrid Agreement Concerning theInternational Registration of Marks (1989).
Trademarks shall include service marks, collective marks, and certification marks andmay include geographical marks. The owner of a registered mark shall have theexclusive right to prevent third parties not having the owner’s consent from usingidentical or similar signs where such use would result in a likelihood of confusion, withlimited exceptions such as fair use of descriptive terms. Domain names on the internetare covered by the Government Advisory Process of the Internet Corporation forAssigned Names and Numbers (ICANN) and ICANN’s dispute resolution process.
Specific provisions of the Berne Convention are cited for the protection of copyrightsand related rights. Authors, performers, and producers have exclusive rights toauthorize or prohibit all reproductions and all communications to the public of theirworks. The term of protection of a work shall be not less than the life of the author and70 years after the author’s death or not less than 70 years from the end of the calendaryear of the first authorized publication of the work, if the term in not based on the life ofa natural person. The knowing circumvention of effective technological measures toprotect works, and trafficking in devices intended to circumvent such measures shallresult in criminal and civil liability. Certain noninfringing good faith activities are
7 Singapore shall not be obligated to give effect to articles 6 and 7 of the Trademark Law Treaty.
16
exempt from sanctions. Removing or altering rights management information ortrafficking in works from which the rights management information has been removedor altered shall result in criminal and civil liability.
Encrypted program-carrying satellite signals are protected by criminal and civilsanctions. Each party shall make patents available and exclude inventions frompatentability only as defined in articles 27.2 and 27.3 of the TRIPS Agreement. Patentowners shall have the right to assign, license, and transfer the patent by succession.Limited exceptions granted by the parties may not unreasonably conflict or prejudicethe legitimate rights of the owner.
Laws and regulations pertaining to the enforcement of intellectual property rights shallbe published and made publicly available. Each party shall publicize information onits efforts to provide effective enforcement. In civil, administrative, and criminalproceedings each party shall provide for a presumption that the natural person orentity indicated as the author is the designated rights holder. In civil judicialproceedings, the rights holder may request destruction of goods that have been foundto be pirated or bear counterfeit marks, except in exceptional cases. Judicialauthorities shall have the authority to order the infringer to identify third partiesinvolved in the production or distribution of the infringing goods or services and mayfine or imprison persons who fail to abide by valid court orders.
Each party is obliged to provide appropriate criminal procedures and penalties atleast to cases of willful trademark counterfeiting or copyright or related rights piracyon a commercial scale. Parties must provide legal incentives for service providers tocooperate with rights holders and limitations on liability.
Chapter 17: LaborThe parties reaffirm their obligations as members of the International LaborOrganization and shall strive to ensure that their respective domestic laws areconsistent with international standards and will strive to enforce these laws and toimprove those standards. While the apparent scope of the chapter is general in nature,article 17.2 states that the obligation of a party under the agreement relates to theeffective enforcement of those standards, “through a sustained or recurring course ofaction or inaction,” insofar as they deal with trade with the other party. Collectivebargaining, organization of workers, and minimum wages are among the matterscovered. Annex 17A sets up a joint labor cooperation mechanism.
Chapter 18: EnvironmentEach party will ensure that its environmental protection laws provide for high levels ofprotection and strive to improve those laws, provide appropriate and effectiveremedies and sanctions for violations of environmental protection laws insofar as theyaffect bilateral trade, and provide opportunities for public participation. The partiesagree to pursue cooperative environmental activities and provide for environmental
17
consultations. The parties are obliged under article 18.3 to ensure that persons have“appropriate and effective rights of access to remedies, in accordance with its laws,”and that these may include judicial action for damages or mandatory relief. Theparties likewise commit to monitoring sources of pollution and to acting to deal with it;however, it is recognized in article 18.2 that the parties retain discretion in investigationand enforcement and that “it is inappropriate to encourage trade or investment byweakening or reducing the protections afforded in domestic environmental laws.”
Chapter 19: TransparencyThe subject of this chapter is the hard-to-define concept of “transparency” andgenerally provides the structural rules that will govern the application of theagreement, starting with the official contact points in each government and continuingthrough the administrative rulings process and appeals therefrom. Interested personsare to be given the right to know about actual or future measures in the two membercountries and to comment on them. In most other cases, nongovernmental entitiesgiven rights to obtain access or relief under the text are intended to be those directlyaffected by actions, rulings, measures, or proceedings under the agreement. Suchentities are to have access to administrative tribunals and to review and appealtherefrom. On the U.S. side, such rights already exist, as importers can protest adverserulings by U.S. Government entities and pursue review and appeal under generallyapplicable domestic laws; the inclusion of specific provisions in this chapter ensurescomparable access in Singapore.
Chapter 20: Administrative and Dispute SettlementThe chapter first sets up a Joint Committee to “supervise the proper implementation” ofthe FTA and review its “general functioning”; it also authorizes the Joint Committee “toreview the trade relationship between the Parties.” The USTR and Singapore’s Ministerof Trade and Industry, or their respective designees, are to chair the committee,comprising government officials of the parties. The chapter includes provisionsgoverning the meetings and powers of the committee, and it provides for theestablishment of panels to consider disputes. Consultations concerning any matter thatmight affect the operation of the FTA are also authorized. In terms of benefits of the FTAand whether they may be nullified or impaired, the chapter applies to any measuredeemed inconsistent with FTA obligations, any failure of a party to carry out such anobligation, or benefits a party “could reasonably have expected to accrue to it” (not topersons or firms per se) under the tariff concessions, rules of origin, services, and IPRchapters. Following consultations, the Joint Committee can attempt to resolve covereddisputes; matters can also be referred to the WTO or other fora available to bothparties. Panels may be established under the FTA to deal with disputes not resolved bythe Joint Committee within sixty days. Once a panel constituted under the chapter hassupplied its final report, the parties are obliged to agree on the resolution of the disputein question in a manner “which normally shall conform with the determinations andrecommendations, if any, of the panel.” Upon an appropriate panel finding, a partymay suspend a level of benefits having an equivalent effect to the disputed measure or
18
enter into negotiations to obtain monetary compensation; article 20.6 containsprocedures for such talks. Certain matters concerning failure to enforce domesticlabor laws and failure to enforce domestic environmental laws would be governed byarticle 20.7. In such situations “an annual monetary assessment” set in U.S. dollars canbe imposed on the violating party; the upward limit on such assessments remains to beestablished. The chapter also contains provisions directing compliance reviews (article20.8) and five-year reviews under the agreement (article 20.9). Last, article 20.11states that “neither Party may provide for a right of action under its domestic lawagainst the other Party on the ground that a measure of the other Party is inconsistentwith this Agreement.” Thus, mechanisms available under the FTA at the governmentallevel are intended to serve as the means of obtaining redress, instead of private actionsat law.
Chapter 21: General and Final ProvisionsGeneral provisions on balance of payments, general exceptions, essential security,taxation, disclosure of information, and corruption are set forth in this chapter, alongwith the mechanisms for acceding to the agreement and putting it into force and anarticle on the legal significance of annexes. Under article 21.6, if both parties agree,any country or group of countries may accede to the agreement. Under article 21.9,the FTA would enter into force 60 days after the exchange of written notifications thatall respective internal arrangements have been fulfilled, unless otherwise agreed.
Side letters on five subject areas are being made available on such subjects as legalservices, telecommunications divestment, and intellectual property enforcement; thesigners have exchanged letters on nine other matters as of May 6, 2003, on subjectssuch as expropriation, customary international law, and the possibility of a bilateralappellate mechanism.
19
CHAPTER 3Overview of Singapore’s Economy, Trade, andInvestment Patterns
Introduction1
In 2002, Singapore was the 12th largest U.S. trading partner in terms of total trade.Singapore is an open economy, with very few applied tariffs and an investment regimethat actively promotes foreign inflow of both human and financial capital. Singapore isan active member of the WTO, a leading force in the Association of Southeast AsianNations (ASEAN), and has recently signed separate bilateral free trade agreementswith the United States, Japan, and Australia. Following years of U.S. trade deficits withSingapore, the United States registered a bilateral merchandise trade surplus of $0.9billion in 2001 and $0.6 billion in 2002. In 2002, U.S. domestic exports to Singaporemeasured $14.7 billion, while U.S. imports for consumption from Singapore measured$14.1 billion. U.S. direct foreign investment (flows) in Singapore measured $3.0 billionin 2001, the last year for which data are available. The U.S. investment position inSingapore (stock) measured $27.3 billion in 2001, and generated $2.1 billion inincome.2 U.S. investment is concentrated largely in manufacturing—notablyelectronics, industrial chemicals and petroleum, and the financial sectors.
The four main sections of this chapter will discuss: (1) an overview of the Singaporeeconomy, (2) Singapore’s patterns of trade, (3) a discussion of regional andinternational economic cooperation in Singapore, and (4) Singapore’s investmentrelationship with the United States and other countries. Most of the data discussed inthis chapter cover the period 1998-2002.
Singapore’s EconomySingapore is a city-state with a population of 3.9 million (of which 700,000 or 18percent are foreigners, mainly migrant workers and professionals), and is locatednext to one of the world’s major shipping lanes. With long-standing policies designedto promote open trade and investment, Singapore has overcome its land, labor, andresource constraints, and has become one of the world’s most successful open trading
1 Unless otherwise specified, exports in this chapter refer to domestic exports, and imports refer toimports for consumption.
2 U.S. Department of Commerce, Bureau of Economic Analysis (BEA), “U.S. Direct InvestmentAbroad: Detail for Historical-Cost Position and Related Capital and Income Flows,” 2001.
20
and investment regimes. Although the gross domestic product (GDP) growth ratedecelerated to 0.3 percent in 1998 due to the Asian economic crisis, average growthover the past decade has been about 7 percent. The World Bank reports thatSingapore has the fifth highest per capita gross national product (GNP)3 in purchasingpower parity terms. Singapore actively promotes trade liberalization in the regionthrough the 10-member-country ASEAN4 and the 21-member-country Asian PacificEconomic Cooperation (APEC).5 The APEC Secretariat is located in Singapore.Singapore is a founding member of the WTO, and hosted the first WTO Ministerial inDecember 1996.6
Singapore has a very industrialized economy. Manufacturing is the most importantsector, followed by wholesale and retail trade, financial services, and businessservices. Agriculture constitutes a very small part of gross output. The economy is alsovery dependent on the manufacture and sale of electronics. Singapore is the world’sleading producer of disk drives, and continues to invest heavily in wafer-fabricationfacilities. Singapore has benefitted from enormous foreign exchange earnings in theelectronics sector. Global demand for electronics products decreased substantially in2001, and Singapore’s GDP followed–from 9.4 percent growth in 2000 to more thana 2.4 percent contraction in 2001.
The Singapore economy depends on international trade and an open investmentregime. Because of Singapore’s size, openness, geographic location, and port
3 GNP measures the total value of goods and services produced using factors of production ownedby citizens of Singapore, regardless of the location of production. GDP measures the total value of goodsand services produced within the borders of Singapore, regardless of the ownership of the factors ofproduction. Purchasing power parity allows comparison of consumer incomes quoted in two differentcurrencies. Instead of using an official exchange rate to convert foreign currencies to dollars, purchasingpower parity conversions use a computed exchange rate which assumes one U.S. dollar will buy the sameamount of goods and services in the United States as it could in the foreign country.
4 The founders of the ASEAN envisioned it as eventually bringing together all the countries ofSoutheast Asia and getting them to cooperate in securing the region’s peace, stability and development.At the time the region was in tumult as several countries were struggling for national survival orindependence. Thus, only five countries: Indonesia, Malaysia, the Philippines, Singapore andThailand-signed the ASEAN Declaration of Aug. 8, 1967. Thirty-two years later—on April 30,1999-ASEAN encompassed all 10 countries of Southeast Asia by admitting Cambodia. Members ofASEAN include Brunei Darussalam, Cambodia, Indonesia, Laos, Malaysia, Myanmar, Philippines,Singapore, Thailand, and Vietnam . Besides the ten ASEAN countries, the ASEAN Regional Forum (ARF)membership includes the 10 dialogue partners of ASEAN (Australia, Canada, China, the EuropeanUnion, India, Japan, Republic of Korea, New Zealand, Russia and the United States), Papua NewGuinea, Mongolia, and the Democratic People’s Republic of Korea, which participated in ARF for the firsttime on July 27, 2000. Found at Internet address http://www.asean.or.id/, retrieved Dec. 26, 2000.
5 The Asia-Pacific Economic Cooperation (APEC) was established in 1989 in response to the growinginterdependence among Asia-Pacific economies. Begun as an informal dialogue group, APEC has sincebecome the primary regional vehicle for promoting open trade and practical economic cooperation. Itsgoal is to advance Asia-Pacific economic dynamism and sense of community. Today, APEC’s 21 membereconomies have a combined gross domestic product of over US$18 trillion in 1999 and account for 43.85percent of global trade. Members of APEC include Australia, Brunei Darussalam, Canada, Chile, China(PRC), Hong Kong, Indonesia, Japan, Korea, Malaysia, Mexico, New Zealand, Papua New Guinea,Peru, Philippines, Russia, Singapore, Chinese Taipei, Thailand, United States, and Vietnam. Found atInternet address http://apecsec.org, retrieved Dec. 18, 2000.
6 U.S. Department of State, Bureau of Economic and Business Affairs, 1999 Country Reports onEconomic Policy and Trade Practices, March 2000.

21
facilities, it serves as a regional trading center through which goods are traded amongits Asian neighbors and the West. With such significant trade volumes passing throughSingapore, re-exports account for almost half of total exports for the island state, andthe total value of trade in goods (exports plus imports) totals almost three times thevalue of domestic output. Singapore’s industrial base is dominated by foreignmultinationals and a few large domestic firms with government connections. Small andmedium-sized enterprises (SMEs) play only a minor role, though the governmentmaintains efforts to develop them.
The economy suffered a recession following the 1997-1998 Asian financial crisis. Thesubsequent recovery was the result, in part, of government attempts to reduce businesscosts. However, the sudden downturn in world trade since 2001 has given Singapore anew economic challenge and an even deeper recession. The government hasincreased its spending and is formulating ways to restructure the economy. One of themethods discussed is to encourage more innovation and diversify the economytowards modern service and consumer-focused industries. The governmentemphasizes the development of higher value-added activities and a more“knowledge-based” economy. Protected sectors, such as financial services, are beingliberalized in an effort to increase overall efficiency, and the government has signedseveral trade and investment agreements with its trading partners in an effort toimprove market access and increase investment in Singapore.
Following the sharp downturn in 2001, the Singapore economy has experienced asubstantial recovery. Several sectors continued to experience contraction (includingconstruction, agriculture, and financial services), but overall the economy grew by 2.2percent in 2002 (table 3-1).
Major IndustriesAs shown in figure 3-1, almost two-thirds of Singapore’s 2002 GDP is in the servicesector. Goods producing industries constituted another 31.8 percent of GDP, while
Table 3-1Singapore: GDP growth by industry, 1998-2002
(Annual percent change)1998 1999 2000 2001 2002
Manufacturing . . . . . . . . . . . . . . . . . . . . . . . . . . -0.6 13.0 15.1 -11.5 8.3Construction . . . . . . . . . . . . . . . . . . . . . . . . . . . . 4.4 -9.0 -1.8 -3.2 -10.8Utilities . . . . . . . . . . . . . . . . . . . . . . . . . . . . . . . . . 4.9 3.3 7.4 1.7 4.3Agriculture, Fishing, and Quarrying . . . . . . . . . . -6.9 -1.8 -4.9 -5.9 -6.0Wholesale and Retail Trade . . . . . . . . . . . . . . . . -4.1 6.5 14.8 -3.3 2.7Hotels and Restaurants . . . . . . . . . . . . . . . . . . . . -3.5 3.6 8.2 -2.2 -2.9Transport and Communications . . . . . . . . . . . . . 5.5 7.0 7.6 2.6 5.0Financial Services . . . . . . . . . . . . . . . . . . . . . . . . -8.1 5.2 2.1 3.7 -4.8Business Services . . . . . . . . . . . . . . . . . . . . . . . . . 5.1 2.9 6.3 3.1 0.4Other Services . . . . . . . . . . . . . . . . . . . . . . . . . . . 4.1 7.2 7.3 6.0 4.5
Total Gross Domestic Product . . . . . . . . . . . . . 0.4 6.4 9.4 -2.4 2.2
Source: Singapore Department of Statistics, www.singstat.gov.sg.

22
agriculture and other outputs made up 0.1 percent and 4.0 percent, respectively. Thelargest service industries are business services, wholesale and retail trade, transportand communications, and financial services (figure 3-2). Major manufacturingindustries include electronics, oil drilling equipment, petroleum refining, rubberprocessing and rubber products, processed food and beverages, ship repair, entrepôttrade, and biotechnology.
Figure 3-1Singapore: GDP by sector, 2002
Other (4.0%)
Services (64.1%)Goods producingindustries (31.8%)
Source: Singapore Department of Statistics, www.singstat.gov.sg.
0 5000 10000 15000 20000 25000
Other services
Business services
Financial services
Transport and communications
Hotels and restaurants
Wholesale and retail trade
Manufacturing
Construction
Million dollars
Figure 3-2Singapore: GDP by industry, 2002
Utilities
Agriculture, fishing, and quarrying
Source: Singapore Department of Statistics, www.singstat.gov.sg.
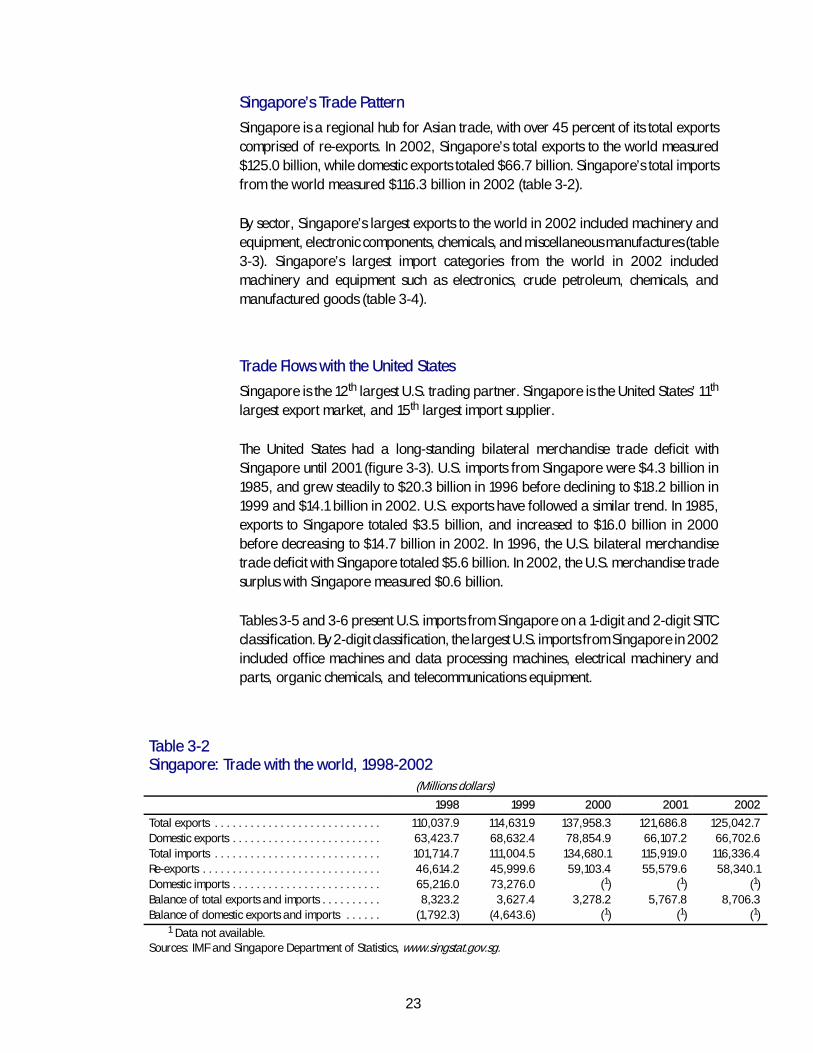
23
Singapore’s Trade Pattern
Singapore is a regional hub for Asian trade, with over 45 percent of its total exportscomprised of re-exports. In 2002, Singapore’s total exports to the world measured$125.0 billion, while domestic exports totaled $66.7 billion. Singapore’s total importsfrom the world measured $116.3 billion in 2002 (table 3-2).
By sector, Singapore’s largest exports to the world in 2002 included machinery andequipment, electronic components, chemicals, and miscellaneous manufactures (table3-3). Singapore’s largest import categories from the world in 2002 includedmachinery and equipment such as electronics, crude petroleum, chemicals, andmanufactured goods (table 3-4).
Trade Flows with the United States
Singapore is the 12th largest U.S. trading partner. Singapore is the United States’ 11th
largest export market, and 15th largest import supplier.
The United States had a long-standing bilateral merchandise trade deficit withSingapore until 2001 (figure 3-3). U.S. imports from Singapore were $4.3 billion in1985, and grew steadily to $20.3 billion in 1996 before declining to $18.2 billion in1999 and $14.1 billion in 2002. U.S. exports have followed a similar trend. In 1985,exports to Singapore totaled $3.5 billion, and increased to $16.0 billion in 2000before decreasing to $14.7 billion in 2002. In 1996, the U.S. bilateral merchandisetrade deficit with Singapore totaled $5.6 billion. In 2002, the U.S. merchandise tradesurplus with Singapore measured $0.6 billion.
Tables 3-5 and 3-6 present U.S. imports from Singapore on a 1-digit and 2-digit SITCclassification. By 2-digit classification, the largest U.S. imports from Singapore in 2002included office machines and data processing machines, electrical machinery andparts, organic chemicals, and telecommunications equipment.
Table 3-2Singapore: Trade with the world, 1998-2002
(Millions dollars)1998 1999 2000 2001 2002
Total exports . . . . . . . . . . . . . . . . . . . . . . . . . . . . 110,037.9 114,631.9 137,958.3 121,686.8 125,042.7Domestic exports . . . . . . . . . . . . . . . . . . . . . . . . . 63,423.7 68,632.4 78,854.9 66,107.2 66,702.6Total imports . . . . . . . . . . . . . . . . . . . . . . . . . . . . 101,714.7 111,004.5 134,680.1 115,919.0 116,336.4Re-exports . . . . . . . . . . . . . . . . . . . . . . . . . . . . . . 46,614.2 45,999.6 59,103.4 55,579.6 58,340.1Domestic imports . . . . . . . . . . . . . . . . . . . . . . . . . 65,216.0 73,276.0 (1) (1) (1)Balance of total exports and imports . . . . . . . . . . 8,323.2 3,627.4 3,278.2 5,767.8 8,706.3Balance of domestic exports and imports . . . . . . (1,792.3) (4,643.6) (1) (1) (1)
1 Data not available.Sources: IMF and Singapore Department of Statistics, www.singstat.gov.sg.

24
Table 3-3Singapore: Domestic exports, re-exports, and total exports, 2002
(Million dollars)Commodity Domestic Exports Re-Exports Total Exports
Total . . . . . . . . . . . . . . . . . . . . . . . . . 66,702.6 58,340.1 125,042.7Mineral Fuels . . . . . . . . . . . . . . . . . . 11,649.1 1,335.8 12,984.9Non-oil . . . . . . . . . . . . . . . . . . . . . . . 55,053.6 57,004.2 112,057.8
Food . . . . . . . . . . . . . . . . . . . . . . . 865.4 757.1 1,622.5Beverages and Tobacco . . . . . . . . 130.2 865.4 995.5Crude Materials . . . . . . . . . . . . . . 319.2 514.0 833.2Animal and Vegetable Oils . . . . . . 181.2 42.2 223.4Chemicals . . . . . . . . . . . . . . . . . . . 8,535.2 3,090.2 11,625.4Manufactured Goods . . . . . . . . . . 1,914.2 2,987.1 4,901.3
Veneer and Plywood . . . . . . . . . 4.7 36.4 41.1Textile, Yarn, and Fabrics . . . . . 269.3 329.4 598.7Iron and Steel . . . . . . . . . . . . . . 167.4 400.3 567.7
Other Manufactures . . . . . . . . . . . 1,472.7 2,221.0 3,693.8Machinery and Equipment . . . . 37,165.0 42,315.8 79,480.8
Electronic Machinery, OfficeMachines, and OtherComponents . . . . . . . . . . . . . 35,389.4 38,082.3 73,471.7
Industrial Machines . . . . . . . . . . 643.0 1,469.7 2,112.7Radio and Televison Receivers . . 952.0 1,711.7 2,663.7Electronic Components . . . . . . . 9,513.9 20,971.6 30,485.4Motor Vehicles . . . . . . . . . . . . . 0.0 910.3 910.3Ships and Oil Rigs . . . . . . . . . . . 180.7 141.7 322.5
Miscellaneous Manufactures . . . . . 5,441.1 5,206.8 10,647.9Other . . . . . . . . . . . . . . . . . . . . . . 502.0 1,225.8 1,727.9
Sources: Singapore Department of Statistics, www.singstat.gov.sg.
Table 3-4Singapore: Imports by commodity, 2002
(Million dollars)Commodity Imports
Mineral Fuels . . . . . . . . . . . . . . . . . . . . . . . . . . . . . . . . . . . . . . . . . . . . . . . . . . 15,663.2Crude Petroleum . . . . . . . . . . . . . . . . . . . . . . . . . . . . . . . . . . . . . . . . . . . . . . 7,603.8
Non-oil . . . . . . . . . . . . . . . . . . . . . . . . . . . . . . . . . . . . . . . . . . . . . . . . . . . . . . . 104,297.6Food . . . . . . . . . . . . . . . . . . . . . . . . . . . . . . . . . . . . . . . . . . . . . . . . . . . . . . . 3,055.7Beverages and Tobacco . . . . . . . . . . . . . . . . . . . . . . . . . . . . . . . . . . . . . . . . . 999.0Crude Materials . . . . . . . . . . . . . . . . . . . . . . . . . . . . . . . . . . . . . . . . . . . . . . 765.6Animal and Vegetable Oils . . . . . . . . . . . . . . . . . . . . . . . . . . . . . . . . . . . . . . 241.1Chemicals . . . . . . . . . . . . . . . . . . . . . . . . . . . . . . . . . . . . . . . . . . . . . . . . . . . 7,480.6Manufactured Goods . . . . . . . . . . . . . . . . . . . . . . . . . . . . . . . . . . . . . . . . . . 8,840.1
Paper and Paperboard . . . . . . . . . . . . . . . . . . . . . . . . . . . . . . . . . . . . . . . 460.9Textile, Yarn, and Fabrics . . . . . . . . . . . . . . . . . . . . . . . . . . . . . . . . . . . . . 706.8Iron and Steel . . . . . . . . . . . . . . . . . . . . . . . . . . . . . . . . . . . . . . . . . . . . . . 1,641.6
Machinery and Equipment . . . . . . . . . . . . . . . . . . . . . . . . . . . . . . . . . . . . . . 70,620.2Power Generators . . . . . . . . . . . . . . . . . . . . . . . . . . . . . . . . . . . . . . . . . . . . . 1,485.2
Industrial Machines . . . . . . . . . . . . . . . . . . . . . . . . . . . . . . . . . . . . . . . . . . 2,995.9Radio and Televison Receivers . . . . . . . . . . . . . . . . . . . . . . . . . . . . . . . . . . 2,092.8Electronic Generators . . . . . . . . . . . . . . . . . . . . . . . . . . . . . . . . . . . . . . . . 4,919.1Electronic Components . . . . . . . . . . . . . . . . . . . . . . . . . . . . . . . . . . . . . . . 25,864.6Motor Vehicles . . . . . . . . . . . . . . . . . . . . . . . . . . . . . . . . . . . . . . . . . . . . . 2,171.5Aircraft and vessels . . . . . . . . . . . . . . . . . . . . . . . . . . . . . . . . . . . . . . . . . . 3,494.8
Miscellaneous Manufactures . . . . . . . . . . . . . . . . . . . . . . . . . . . . . . . . . . . . . 10,579.3Miscellaneous . . . . . . . . . . . . . . . . . . . . . . . . . . . . . . . . . . . . . . . . . . . . . . . . 1,715.8
Total . . . . . . . . . . . . . . . . . . . . . . . . . . . . . . . . . . . . . . . . . . . . . . . . . . . . . 119,960.8
Sources: Singapore Department of Statistics, www.singstat.gov.sg.
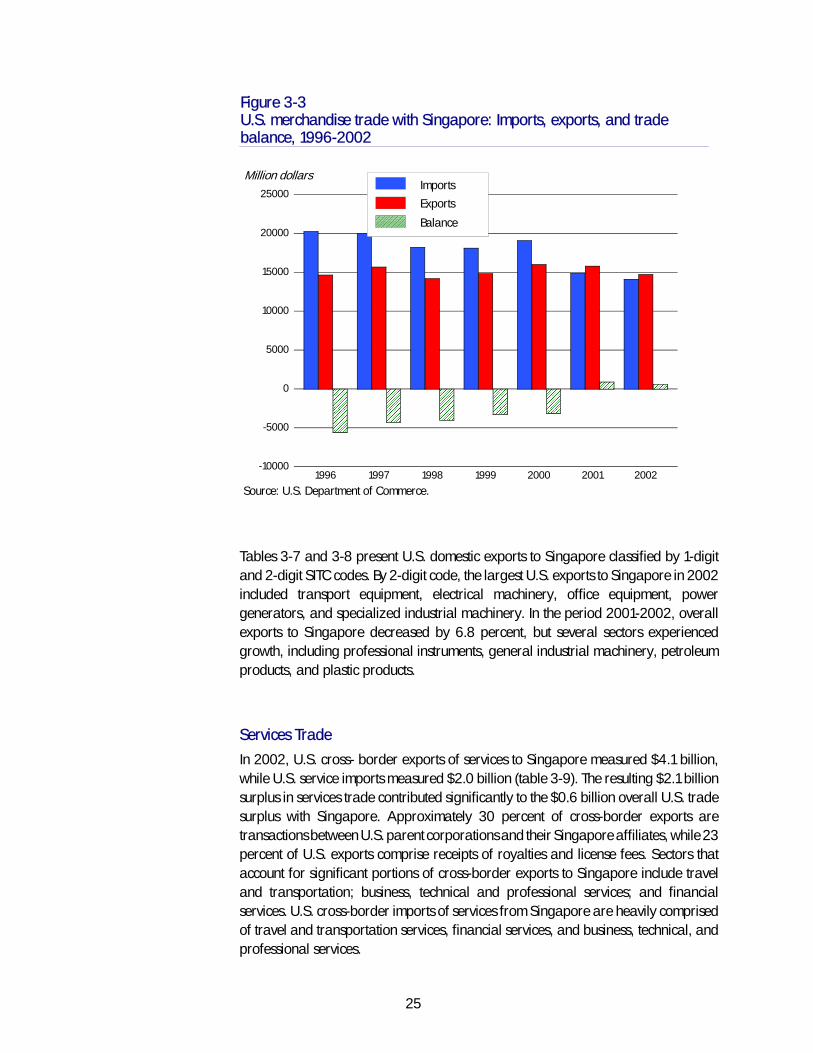
25
������������������������
������������������
������������������
������������������
���������������������
������� �������
-10000
-5000
0
5000
10000
15000
20000
25000
1996 1997 1998 1999 2000 2001 2002
Source: U.S. Department of Commerce.
������������������������������������������������������������������������������������������������������������������������������������������������������������������������������������������������������������������������������������������������������������������������������������������������������������������������������������������������������������������������������������������������������������������������������������������������������������������������������������������������������������������������������������������������������������������������������������������������������������������������������������������������������������������������������������������������������������������������������������������������������������������������������������������������������������������������������������������������������������������������������������������������������������������������������������������������������������������������������������������������������������������������������������������������������������������������������������������������������������������������������������������������������������������������������������������������������������������������������������������������������������������������������������������������������������������������������������������������������������������������������������������������������������������������������������������������������������������������������������������������������������������������������������������������������������������������������������������������������������������������������������������������������������������������������������������������������������������������������������������������������������������������������������������������������������������������������������������������������������������������������������
Imports
Balance
Figure 3-3U.S. merchandise trade with Singapore: Imports, exports, and tradebalance, 1996-2002
Million dollars
Exports
Tables 3-7 and 3-8 present U.S. domestic exports to Singapore classified by 1-digitand 2-digit SITC codes. By 2-digit code, the largest U.S. exports to Singapore in 2002included transport equipment, electrical machinery, office equipment, powergenerators, and specialized industrial machinery. In the period 2001-2002, overallexports to Singapore decreased by 6.8 percent, but several sectors experiencedgrowth, including professional instruments, general industrial machinery, petroleumproducts, and plastic products.
Services Trade
In 2002, U.S. cross- border exports of services to Singapore measured $4.1 billion,while U.S. service imports measured $2.0 billion (table 3-9). The resulting $2.1 billionsurplus in services trade contributed significantly to the $0.6 billion overall U.S. tradesurplus with Singapore. Approximately 30 percent of cross-border exports aretransactions between U.S. parent corporations and their Singapore affiliates, while 23percent of U.S. exports comprise receipts of royalties and license fees. Sectors thataccount for significant portions of cross-border exports to Singapore include traveland transportation; business, technical and professional services; and financialservices. U.S. cross-border imports of services from Singapore are heavily comprisedof travel and transportation services, financial services, and business, technical, andprofessional services.
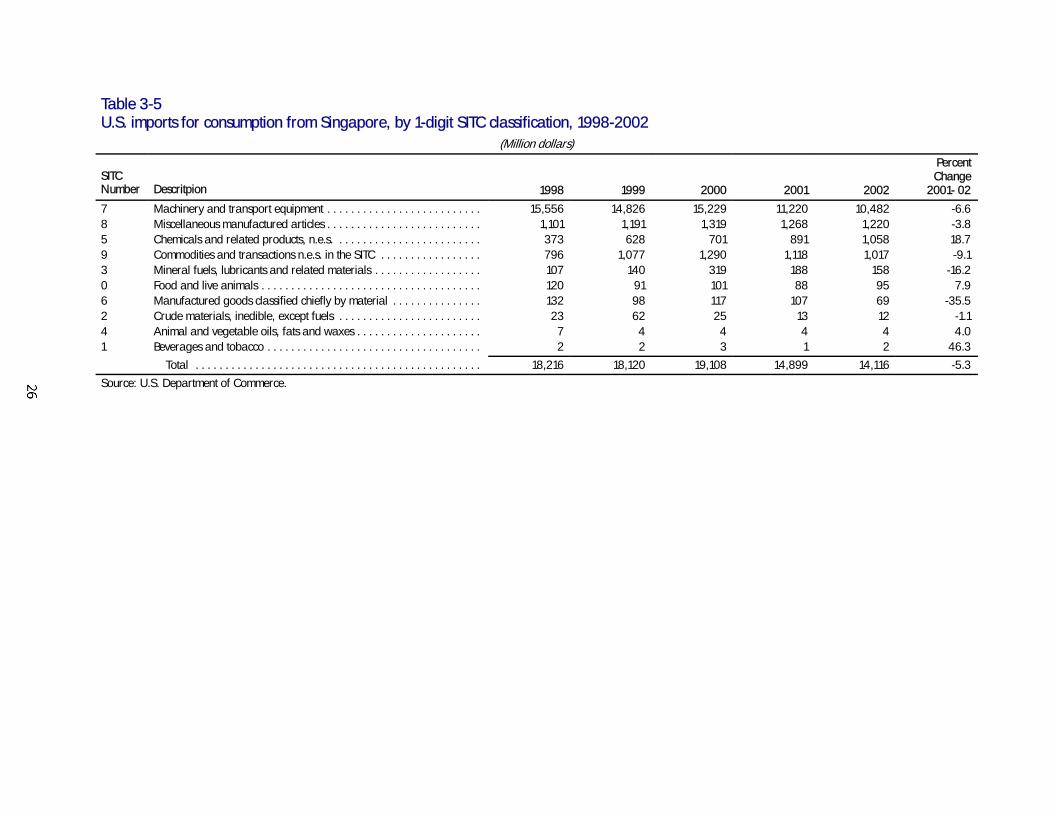
Table 3-5U.S. imports for consumption from Singapore, by 1-digit SITC classification, 1998-2002
(Million dollars)
SITCNumber Descritpion 1998 1999 2000 2001 2002
PercentChange
2001- 02
7 Machinery and transport equipment . . . . . . . . . . . . . . . . . . . . . . . . . . 15,556 14,826 15,229 11,220 10,482 -6.68 Miscellaneous manufactured articles . . . . . . . . . . . . . . . . . . . . . . . . . . 1,101 1,191 1,319 1,268 1,220 -3.85 Chemicals and related products, n.e.s. . . . . . . . . . . . . . . . . . . . . . . . . 373 628 701 891 1,058 18.79 Commodities and transactions n.e.s. in the SITC . . . . . . . . . . . . . . . . . 796 1,077 1,290 1,118 1,017 -9.13 Mineral fuels, lubricants and related materials . . . . . . . . . . . . . . . . . . 107 140 319 188 158 -16.20 Food and live animals . . . . . . . . . . . . . . . . . . . . . . . . . . . . . . . . . . . . . 120 91 101 88 95 7.96 Manufactured goods classified chiefly by material . . . . . . . . . . . . . . . 132 98 117 107 69 -35.52 Crude materials, inedible, except fuels . . . . . . . . . . . . . . . . . . . . . . . . 23 62 25 13 12 -1.14 Animal and vegetable oils, fats and waxes . . . . . . . . . . . . . . . . . . . . . 7 4 4 4 4 4.01 Beverages and tobacco . . . . . . . . . . . . . . . . . . . . . . . . . . . . . . . . . . . . 2 2 3 1 2 46.3
Total . . . . . . . . . . . . . . . . . . . . . . . . . . . . . . . . . . . . . . . . . . . . . . . . 18,216 18,120 19,108 14,899 14,116 -5.3
Source: U.S. Department of Commerce.
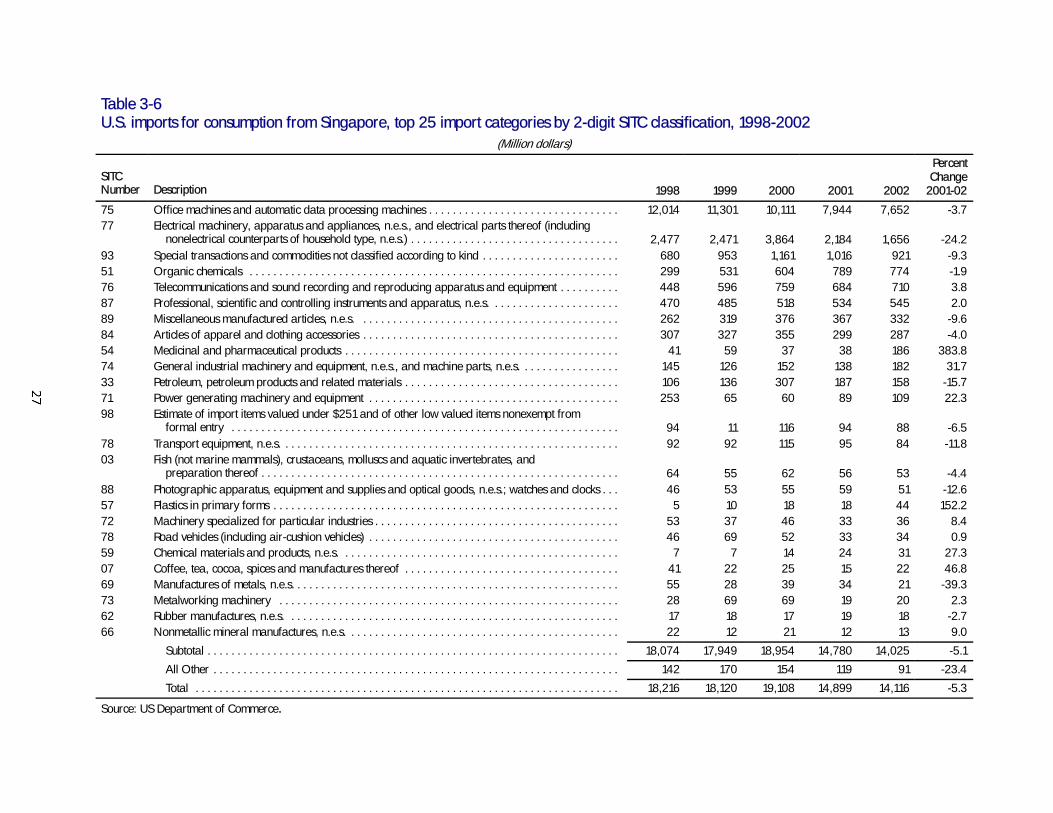
Table 3-6U.S. imports for consumption from Singapore, top 25 import categories by 2-digit SITC classification, 1998-2002
(Million dollars)
SITCNumber Description 1998 1999 2000 2001 2002
PercentChange
2001-02
75 Office machines and automatic data processing machines . . . . . . . . . . . . . . . . . . . . . . . . . . . . . . . . 12,014 11,301 10,111 7,944 7,652 -3.777 Electrical machinery, apparatus and appliances, n.e.s., and electrical parts thereof (including
nonelectrical counterparts of household type, n.e.s.) . . . . . . . . . . . . . . . . . . . . . . . . . . . . . . . . . . . 2,477 2,471 3,864 2,184 1,656 -24.293 Special transactions and commodities not classified according to kind . . . . . . . . . . . . . . . . . . . . . . . 680 953 1,161 1,016 921 -9.351 Organic chemicals . . . . . . . . . . . . . . . . . . . . . . . . . . . . . . . . . . . . . . . . . . . . . . . . . . . . . . . . . . . . . . 299 531 604 789 774 -1.976 Telecommunications and sound recording and reproducing apparatus and equipment . . . . . . . . . . 448 596 759 684 710 3.887 Professional, scientific and controlling instruments and apparatus, n.e.s. . . . . . . . . . . . . . . . . . . . . . 470 485 518 534 545 2.089 Miscellaneous manufactured articles, n.e.s. . . . . . . . . . . . . . . . . . . . . . . . . . . . . . . . . . . . . . . . . . . . 262 319 376 367 332 -9.684 Articles of apparel and clothing accessories . . . . . . . . . . . . . . . . . . . . . . . . . . . . . . . . . . . . . . . . . . . 307 327 355 299 287 -4.054 Medicinal and pharmaceutical products . . . . . . . . . . . . . . . . . . . . . . . . . . . . . . . . . . . . . . . . . . . . . . 41 59 37 38 186 383.874 General industrial machinery and equipment, n.e.s., and machine parts, n.e.s. . . . . . . . . . . . . . . . . 145 126 152 138 182 31.733 Petroleum, petroleum products and related materials . . . . . . . . . . . . . . . . . . . . . . . . . . . . . . . . . . . . 106 136 307 187 158 -15.771 Power generating machinery and equipment . . . . . . . . . . . . . . . . . . . . . . . . . . . . . . . . . . . . . . . . . . 253 65 60 89 109 22.398 Estimate of import items valued under $251 and of other low valued items nonexempt from
formal entry . . . . . . . . . . . . . . . . . . . . . . . . . . . . . . . . . . . . . . . . . . . . . . . . . . . . . . . . . . . . . . . . . 94 11 116 94 88 -6.578 Transport equipment, n.e.s. . . . . . . . . . . . . . . . . . . . . . . . . . . . . . . . . . . . . . . . . . . . . . . . . . . . . . . . . 92 92 115 95 84 -11.803 Fish (not marine mammals), crustaceans, molluscs and aquatic invertebrates, and
preparation thereof . . . . . . . . . . . . . . . . . . . . . . . . . . . . . . . . . . . . . . . . . . . . . . . . . . . . . . . . . . . . 64 55 62 56 53 -4.488 Photographic apparatus, equipment and supplies and optical goods, n.e.s.; watches and clocks . . . 46 53 55 59 51 -12.657 Plastics in primary forms . . . . . . . . . . . . . . . . . . . . . . . . . . . . . . . . . . . . . . . . . . . . . . . . . . . . . . . . . . 5 10 18 18 44 152.272 Machinery specialized for particular industries . . . . . . . . . . . . . . . . . . . . . . . . . . . . . . . . . . . . . . . . . 53 37 46 33 36 8.478 Road vehicles (including air-cushion vehicles) . . . . . . . . . . . . . . . . . . . . . . . . . . . . . . . . . . . . . . . . . . 46 69 52 33 34 0.959 Chemical materials and products, n.e.s. . . . . . . . . . . . . . . . . . . . . . . . . . . . . . . . . . . . . . . . . . . . . . . 7 7 14 24 31 27.307 Coffee, tea, cocoa, spices and manufactures thereof . . . . . . . . . . . . . . . . . . . . . . . . . . . . . . . . . . . . 41 22 25 15 22 46.869 Manufactures of metals, n.e.s. . . . . . . . . . . . . . . . . . . . . . . . . . . . . . . . . . . . . . . . . . . . . . . . . . . . . . . 55 28 39 34 21 -39.373 Metalworking machinery . . . . . . . . . . . . . . . . . . . . . . . . . . . . . . . . . . . . . . . . . . . . . . . . . . . . . . . . . 28 69 69 19 20 2.362 Rubber manufactures, n.e.s. . . . . . . . . . . . . . . . . . . . . . . . . . . . . . . . . . . . . . . . . . . . . . . . . . . . . . . . 17 18 17 19 18 -2.766 Nonmetallic mineral manufactures, n.e.s. . . . . . . . . . . . . . . . . . . . . . . . . . . . . . . . . . . . . . . . . . . . . . 22 12 21 12 13 9.0
Subtotal . . . . . . . . . . . . . . . . . . . . . . . . . . . . . . . . . . . . . . . . . . . . . . . . . . . . . . . . . . . . . . . . . . . . . 18,074 17,949 18,954 14,780 14,025 -5.1
All Other . . . . . . . . . . . . . . . . . . . . . . . . . . . . . . . . . . . . . . . . . . . . . . . . . . . . . . . . . . . . . . . . . . . . 142 170 154 119 91 -23.4
Total . . . . . . . . . . . . . . . . . . . . . . . . . . . . . . . . . . . . . . . . . . . . . . . . . . . . . . . . . . . . . . . . . . . . . . . 18,216 18,120 19,108 14,899 14,116 -5.3
Source: US Department of Commerce.
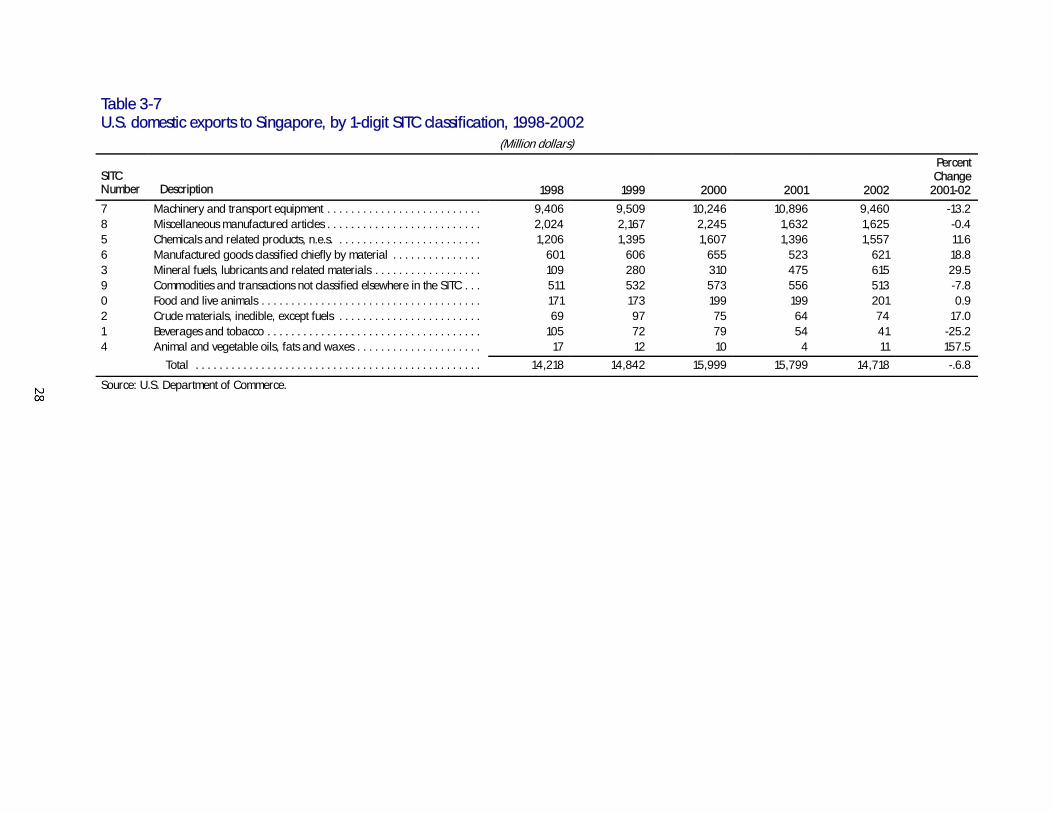
Table 3-7U.S. domestic exports to Singapore, by 1-digit SITC classification, 1998-2002
(Million dollars)
SITCNumber Description 1998 1999 2000 2001 2002
PercentChange
2001-02
7 Machinery and transport equipment . . . . . . . . . . . . . . . . . . . . . . . . . . 9,406 9,509 10,246 10,896 9,460 -13.28 Miscellaneous manufactured articles . . . . . . . . . . . . . . . . . . . . . . . . . . 2,024 2,167 2,245 1,632 1,625 -0.45 Chemicals and related products, n.e.s. . . . . . . . . . . . . . . . . . . . . . . . . 1,206 1,395 1,607 1,396 1,557 11.66 Manufactured goods classified chiefly by material . . . . . . . . . . . . . . . 601 606 655 523 621 18.83 Mineral fuels, lubricants and related materials . . . . . . . . . . . . . . . . . . 109 280 310 475 615 29.59 Commodities and transactions not classified elsewhere in the SITC . . . 511 532 573 556 513 -7.80 Food and live animals . . . . . . . . . . . . . . . . . . . . . . . . . . . . . . . . . . . . . 171 173 199 199 201 0.92 Crude materials, inedible, except fuels . . . . . . . . . . . . . . . . . . . . . . . . 69 97 75 64 74 17.01 Beverages and tobacco . . . . . . . . . . . . . . . . . . . . . . . . . . . . . . . . . . . . 105 72 79 54 41 -25.24 Animal and vegetable oils, fats and waxes . . . . . . . . . . . . . . . . . . . . . 17 12 10 4 11 157.5
Total . . . . . . . . . . . . . . . . . . . . . . . . . . . . . . . . . . . . . . . . . . . . . . . . 14,218 14,842 15,999 15,799 14,718 -.6.8
Source: U.S. Department of Commerce.
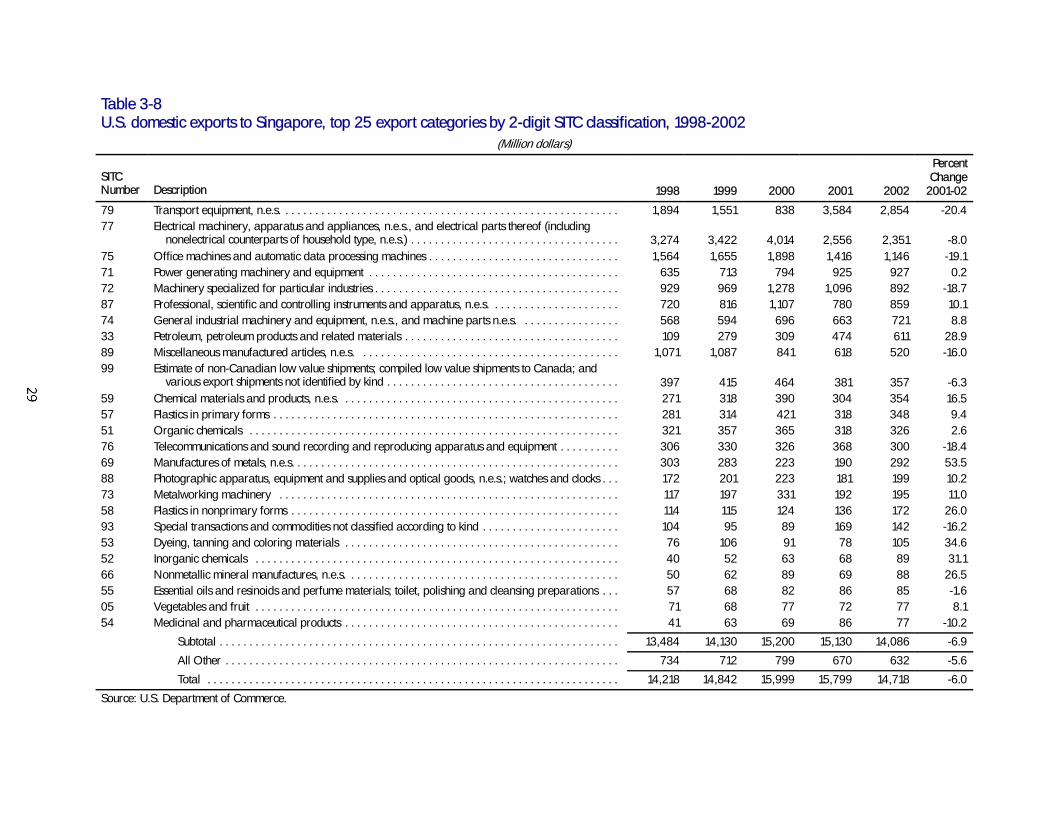
Table 3-8U.S. domestic exports to Singapore, top 25 export categories by 2-digit SITC classification, 1998-2002
(Million dollars)
SITCNumber Description 1998 1999 2000 2001 2002
PercentChange
2001-02
79 Transport equipment, n.e.s. . . . . . . . . . . . . . . . . . . . . . . . . . . . . . . . . . . . . . . . . . . . . . . . . . . . . . . . . 1,894 1,551 838 3,584 2,854 -20.477 Electrical machinery, apparatus and appliances, n.e.s., and electrical parts thereof (including
nonelectrical counterparts of household type, n.e.s.) . . . . . . . . . . . . . . . . . . . . . . . . . . . . . . . . . . . 3,274 3,422 4,014 2,556 2,351 -8.075 Office machines and automatic data processing machines . . . . . . . . . . . . . . . . . . . . . . . . . . . . . . . . 1,564 1,655 1,898 1,416 1,146 -19.171 Power generating machinery and equipment . . . . . . . . . . . . . . . . . . . . . . . . . . . . . . . . . . . . . . . . . . 635 713 794 925 927 0.272 Machinery specialized for particular industries . . . . . . . . . . . . . . . . . . . . . . . . . . . . . . . . . . . . . . . . . 929 969 1,278 1,096 892 -18.787 Professional, scientific and controlling instruments and apparatus, n.e.s. . . . . . . . . . . . . . . . . . . . . . 720 816 1,107 780 859 10.174 General industrial machinery and equipment, n.e.s., and machine parts n.e.s. . . . . . . . . . . . . . . . . 568 594 696 663 721 8.833 Petroleum, petroleum products and related materials . . . . . . . . . . . . . . . . . . . . . . . . . . . . . . . . . . . . 109 279 309 474 611 28.989 Miscellaneous manufactured articles, n.e.s. . . . . . . . . . . . . . . . . . . . . . . . . . . . . . . . . . . . . . . . . . . . 1,071 1,087 841 618 520 -16.099 Estimate of non-Canadian low value shipments; compiled low value shipments to Canada; and
various export shipments not identified by kind . . . . . . . . . . . . . . . . . . . . . . . . . . . . . . . . . . . . . . . 397 415 464 381 357 -6.359 Chemical materials and products, n.e.s. . . . . . . . . . . . . . . . . . . . . . . . . . . . . . . . . . . . . . . . . . . . . . . 271 318 390 304 354 16.557 Plastics in primary forms . . . . . . . . . . . . . . . . . . . . . . . . . . . . . . . . . . . . . . . . . . . . . . . . . . . . . . . . . . 281 314 421 318 348 9.451 Organic chemicals . . . . . . . . . . . . . . . . . . . . . . . . . . . . . . . . . . . . . . . . . . . . . . . . . . . . . . . . . . . . . . 321 357 365 318 326 2.676 Telecommunications and sound recording and reproducing apparatus and equipment . . . . . . . . . . 306 330 326 368 300 -18.469 Manufactures of metals, n.e.s. . . . . . . . . . . . . . . . . . . . . . . . . . . . . . . . . . . . . . . . . . . . . . . . . . . . . . . 303 283 223 190 292 53.588 Photographic apparatus, equipment and supplies and optical goods, n.e.s.; watches and clocks . . . 172 201 223 181 199 10.273 Metalworking machinery . . . . . . . . . . . . . . . . . . . . . . . . . . . . . . . . . . . . . . . . . . . . . . . . . . . . . . . . . 117 197 331 192 195 11.058 Plastics in nonprimary forms . . . . . . . . . . . . . . . . . . . . . . . . . . . . . . . . . . . . . . . . . . . . . . . . . . . . . . . 114 115 124 136 172 26.093 Special transactions and commodities not classified according to kind . . . . . . . . . . . . . . . . . . . . . . . 104 95 89 169 142 -16.253 Dyeing, tanning and coloring materials . . . . . . . . . . . . . . . . . . . . . . . . . . . . . . . . . . . . . . . . . . . . . . 76 106 91 78 105 34.652 Inorganic chemicals . . . . . . . . . . . . . . . . . . . . . . . . . . . . . . . . . . . . . . . . . . . . . . . . . . . . . . . . . . . . . 40 52 63 68 89 31.166 Nonmetallic mineral manufactures, n.e.s. . . . . . . . . . . . . . . . . . . . . . . . . . . . . . . . . . . . . . . . . . . . . . 50 62 89 69 88 26.555 Essential oils and resinoids and perfume materials; toilet, polishing and cleansing preparations . . . 57 68 82 86 85 -1.605 Vegetables and fruit . . . . . . . . . . . . . . . . . . . . . . . . . . . . . . . . . . . . . . . . . . . . . . . . . . . . . . . . . . . . . 71 68 77 72 77 8.154 Medicinal and pharmaceutical products . . . . . . . . . . . . . . . . . . . . . . . . . . . . . . . . . . . . . . . . . . . . . . 41 63 69 86 77 -10.2
Subtotal . . . . . . . . . . . . . . . . . . . . . . . . . . . . . . . . . . . . . . . . . . . . . . . . . . . . . . . . . . . . . . . . . . . 13,484 14,130 15,200 15,130 14,086 -6.9
All Other . . . . . . . . . . . . . . . . . . . . . . . . . . . . . . . . . . . . . . . . . . . . . . . . . . . . . . . . . . . . . . . . . . 734 712 799 670 632 -5.6
Total . . . . . . . . . . . . . . . . . . . . . . . . . . . . . . . . . . . . . . . . . . . . . . . . . . . . . . . . . . . . . . . . . . . . . 14,218 14,842 15,999 15,799 14,718 -6.0
Source: U.S. Department of Commerce.
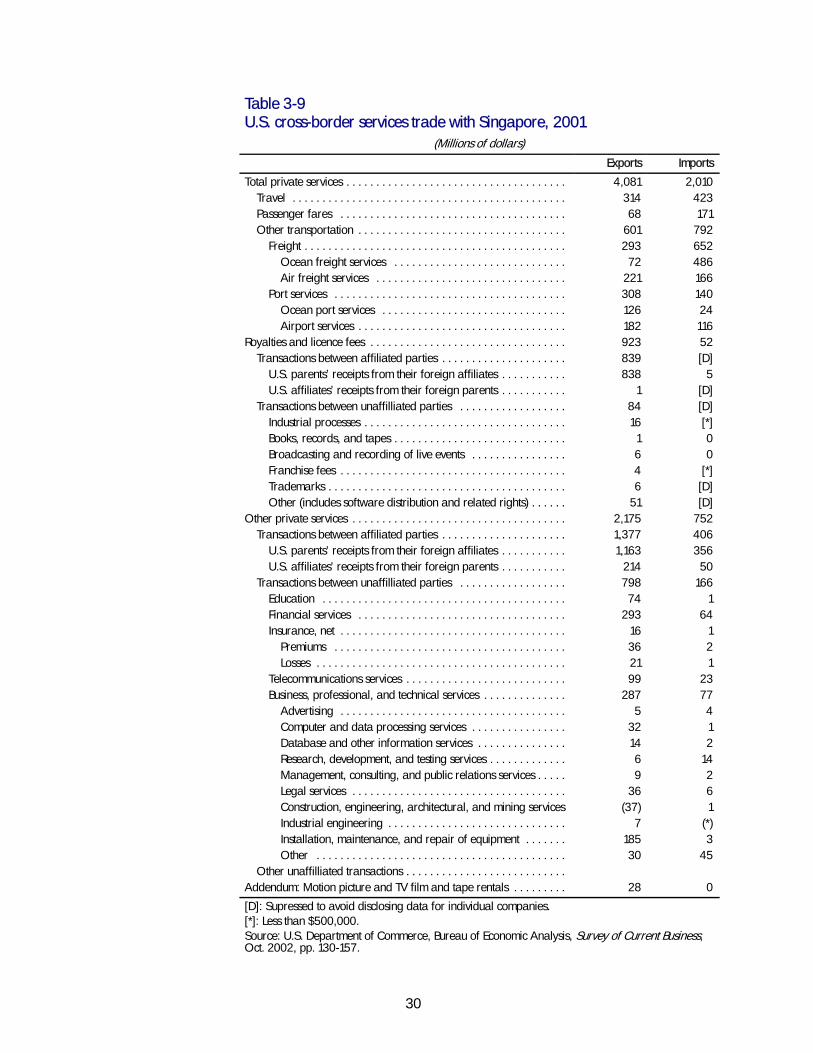
30
Table 3-9U.S. cross-border services trade with Singapore, 2001
(Millions of dollars)
Exports Imports
Total private services . . . . . . . . . . . . . . . . . . . . . . . . . . . . . . . . . . . . . 4,081 2,010Travel . . . . . . . . . . . . . . . . . . . . . . . . . . . . . . . . . . . . . . . . . . . . . . 314 423Passenger fares . . . . . . . . . . . . . . . . . . . . . . . . . . . . . . . . . . . . . . 68 171Other transportation . . . . . . . . . . . . . . . . . . . . . . . . . . . . . . . . . . . 601 792
Freight . . . . . . . . . . . . . . . . . . . . . . . . . . . . . . . . . . . . . . . . . . . . 293 652Ocean freight services . . . . . . . . . . . . . . . . . . . . . . . . . . . . . 72 486Air freight services . . . . . . . . . . . . . . . . . . . . . . . . . . . . . . . . 221 166
Port services . . . . . . . . . . . . . . . . . . . . . . . . . . . . . . . . . . . . . . . 308 140Ocean port services . . . . . . . . . . . . . . . . . . . . . . . . . . . . . . . 126 24Airport services . . . . . . . . . . . . . . . . . . . . . . . . . . . . . . . . . . . 182 116
Royalties and licence fees . . . . . . . . . . . . . . . . . . . . . . . . . . . . . . . . . 923 52Transactions between affiliated parties . . . . . . . . . . . . . . . . . . . . . 839 [D]
U.S. parents’ receipts from their foreign affiliates . . . . . . . . . . . 838 5U.S. affiliates’ receipts from their foreign parents . . . . . . . . . . . 1 [D]
Transactions between unaffilliated parties . . . . . . . . . . . . . . . . . . 84 [D]Industrial processes . . . . . . . . . . . . . . . . . . . . . . . . . . . . . . . . . . 16 [*]Books, records, and tapes . . . . . . . . . . . . . . . . . . . . . . . . . . . . . 1 0Broadcasting and recording of live events . . . . . . . . . . . . . . . . 6 0Franchise fees . . . . . . . . . . . . . . . . . . . . . . . . . . . . . . . . . . . . . . 4 [*]Trademarks . . . . . . . . . . . . . . . . . . . . . . . . . . . . . . . . . . . . . . . . 6 [D]Other (includes software distribution and related rights) . . . . . . 51 [D]
Other private services . . . . . . . . . . . . . . . . . . . . . . . . . . . . . . . . . . . . 2,175 752Transactions between affiliated parties . . . . . . . . . . . . . . . . . . . . . 1,377 406
U.S. parents’ receipts from their foreign affiliates . . . . . . . . . . . 1,163 356U.S. affiliates’ receipts from their foreign parents . . . . . . . . . . . 214 50
Transactions between unaffilliated parties . . . . . . . . . . . . . . . . . . 798 166Education . . . . . . . . . . . . . . . . . . . . . . . . . . . . . . . . . . . . . . . . . 74 1Financial services . . . . . . . . . . . . . . . . . . . . . . . . . . . . . . . . . . . 293 64Insurance, net . . . . . . . . . . . . . . . . . . . . . . . . . . . . . . . . . . . . . . 16 1
Premiums . . . . . . . . . . . . . . . . . . . . . . . . . . . . . . . . . . . . . . . 36 2Losses . . . . . . . . . . . . . . . . . . . . . . . . . . . . . . . . . . . . . . . . . . 21 1
Telecommunications services . . . . . . . . . . . . . . . . . . . . . . . . . . . 99 23Business, professional, and technical services . . . . . . . . . . . . . . 287 77
Advertising . . . . . . . . . . . . . . . . . . . . . . . . . . . . . . . . . . . . . . 5 4Computer and data processing services . . . . . . . . . . . . . . . . 32 1Database and other information services . . . . . . . . . . . . . . . 14 2Research, development, and testing services . . . . . . . . . . . . . 6 14Management, consulting, and public relations services . . . . . 9 2Legal services . . . . . . . . . . . . . . . . . . . . . . . . . . . . . . . . . . . . 36 6Construction, engineering, architectural, and mining services (37) 1Industrial engineering . . . . . . . . . . . . . . . . . . . . . . . . . . . . . . 7 (*)Installation, maintenance, and repair of equipment . . . . . . . 185 3Other . . . . . . . . . . . . . . . . . . . . . . . . . . . . . . . . . . . . . . . . . . 30 45
Other unaffilliated transactions . . . . . . . . . . . . . . . . . . . . . . . . . . .Addendum: Motion picture and TV film and tape rentals . . . . . . . . . 28 0
[D]: Supressed to avoid disclosing data for individual companies.[*]: Less than $500,000.Source: U.S. Department of Commerce, Bureau of Economic Analysis, Survey of Current Business,Oct. 2002, pp. 130-157.
31
Investment Relationship with the United StatesSingapore maintains a liberal investment policy regime that is consistent with itslongstanding policy of encouraging foreign investment to support economic andtechnological development. Foreign exchange and capital transfers are unrestricted.Through various incentive programs, Singapore actively encourages foreign directinvestment in the electronics, chemicals, life sciences, engineering, communications,education, and healthcare industries.
Foreign firms face few establishment limitations as, for most industries, Singaporedoes not maintain any joint venture, management control, or performancerequirements. Equity limitations that had constrained foreign participation in thetelecommunications, banking, insurance, and power generation industries wereeliminated in 2000. However, foreign ownership restrictions remain in place withrespect to armament manufacturing, domestic news media services, domesticbroadcasting services, and private property ownership. All foreign investments inSingapore are subject to screening by the Economic Development Board (EDB) todetermine eligibility for incentive programs, but the EDB does not have authority toprohibit investments. Financial service industries are further subject to oversight andlicensing by the Monetary Authority of Singapore (MAS), which also administersvarious investment incentive programs. MAS is in the process of implementing reformsto permit greater foreign participation in the domestic financial service sectors.
Singapore is a signatory to bilateral investment promotion and protection agreementswith many countries, including the United States. In addition, Singapore is a party tothe International Convention on the Settlement of Investment Disputes and created itsown International Arbitration Center in 1991. No major disputes between foreigninvestors and the Government of Singapore have been reported.
A robust intellectual property rights (IPR) regime helps to create a business climate thatis attractive to foreign investors. Singapore’s IPR regime is generally considered to bestrong. Singapore is a signatory to several multilateral IPR agreements and hasenacted laws governing copyrights, patents, trademarks, and other areas of IPR.
Investment PatternsSingapore is one of the world’s most successful countries in attracting foreign directinvestment (FDI). Singapore’s stock of inward FDI measured $95.1 billion in 2001,which is more than $23,200 per person, the highest in the world. Inflows as a share ofGDP averaged about 10 percent per year in the 1980s and 1990s, and haveaccounted for over 20 percent of nominal gross fixed investment expenditure everyyear since 1993. A worsening in the demand for electronics in 2001, however, resultedin a sharp decline in FDI inflows during 2001.
Singapore itself is a large direct investor in other countries, particularly in China, HongKong and Malaysia. Outflows peaked at $9.4 billion in 1997. Outward investmentsubstantially decreased during the 1998 financial crisis, but recovered again thefollowing year.
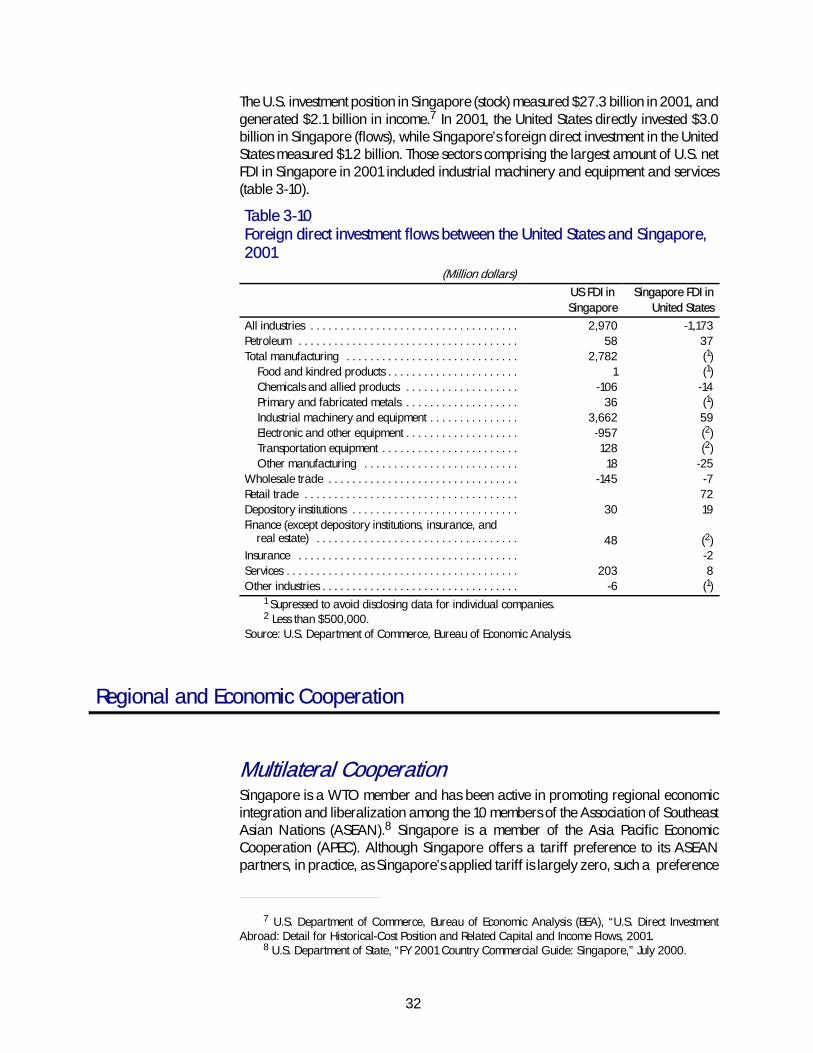
32
The U.S. investment position in Singapore (stock) measured $27.3 billion in 2001, andgenerated $2.1 billion in income.7 In 2001, the United States directly invested $3.0billion in Singapore (flows), while Singapore’s foreign direct investment in the UnitedStates measured $1.2 billion. Those sectors comprising the largest amount of U.S. netFDI in Singapore in 2001 included industrial machinery and equipment and services(table 3-10).
Table 3-10Foreign direct investment flows between the United States and Singapore,2001
(Million dollars)US FDI inSingapore
Singapore FDI inUnited States
All industries . . . . . . . . . . . . . . . . . . . . . . . . . . . . . . . . . . . 2,970 -1,173Petroleum . . . . . . . . . . . . . . . . . . . . . . . . . . . . . . . . . . . . . 58 37Total manufacturing . . . . . . . . . . . . . . . . . . . . . . . . . . . . . 2,782 (1)
Food and kindred products . . . . . . . . . . . . . . . . . . . . . . 1 (1)Chemicals and allied products . . . . . . . . . . . . . . . . . . . -106 -14Primary and fabricated metals . . . . . . . . . . . . . . . . . . . 36 (1)Industrial machinery and equipment . . . . . . . . . . . . . . . 3,662 59Electronic and other equipment . . . . . . . . . . . . . . . . . . . -957 (2)Transportation equipment . . . . . . . . . . . . . . . . . . . . . . . 128 (2)Other manufacturing . . . . . . . . . . . . . . . . . . . . . . . . . . 18 -25
Wholesale trade . . . . . . . . . . . . . . . . . . . . . . . . . . . . . . . . -145 -7Retail trade . . . . . . . . . . . . . . . . . . . . . . . . . . . . . . . . . . . . 72Depository institutions . . . . . . . . . . . . . . . . . . . . . . . . . . . . 30 19Finance (except depository institutions, insurance, and
real estate) . . . . . . . . . . . . . . . . . . . . . . . . . . . . . . . . . . 48 (2)Insurance . . . . . . . . . . . . . . . . . . . . . . . . . . . . . . . . . . . . . -2Services . . . . . . . . . . . . . . . . . . . . . . . . . . . . . . . . . . . . . . . 203 8Other industries . . . . . . . . . . . . . . . . . . . . . . . . . . . . . . . . . -6 (1)
1 Supressed to avoid disclosing data for individual companies.2 Less than $500,000.
Source: U.S. Department of Commerce, Bureau of Economic Analysis.
Regional and Economic Cooperation
Multilateral CooperationSingapore is a WTO member and has been active in promoting regional economicintegration and liberalization among the 10 members of the Association of SoutheastAsian Nations (ASEAN).8 Singapore is a member of the Asia Pacific EconomicCooperation (APEC). Although Singapore offers a tariff preference to its ASEANpartners, in practice, as Singapore’s applied tariff is largely zero, such a preference
7 U.S. Department of Commerce, Bureau of Economic Analysis (BEA), “U.S. Direct InvestmentAbroad: Detail for Historical-Cost Position and Related Capital and Income Flows, 2001.
8 U.S. Department of State, “FY 2001 Country Commercial Guide: Singapore,” July 2000.

33
does not exist. In the APEC forum, Singapore plans to meet the deadline agreed fordeveloped country members to liberalize trade and investment by 2010. Singaporewas also a participant in APEC’s Early Voluntary Sectoral Liberalization (EVSL) andAccelerated Tariff Liberalization (ATL) initiatives, covering 15 and 9 sectors,respectively.9
At the ASEAN meeting in Singapore in October 1999, the ASEAN economic ministersreached agreement on a number of key trade and investment liberalization measures,including a schedule to eliminate import duties on all products by 2015 (for the sixoriginal members) and by 2018 (for the remaining four new members) within theASEAN Free Trade Area (AFTA). This will be completed before the APEC goal of 2020for developing countries. They also signed a protocol including, for the first time,unprocessed agricultural products in tariff reduction talks; and they endorsed a set ofparameters to guide further liberalization of trade in services.
To further attract foreign investment, ASEAN ministers have indicated a preparationof temporary exclusion lists (TEL) in various sectors, which will be gradually phased outand opened to foreign investment over the next few years. They expanded the scope ofthe ASEAN Investment Area (AIA) Agreement to cover services incidental to thesesectors (including manufacturing, agriculture, forestry, fishing, and mining). Acting ona Singapore initiative, ASEAN also embarked on a series of joint investmentpromotion missions to Japan (February-March 2000), the United States (March-April2000), and Europe (June 2000).10
During meetings in November 2000, ASEAN leaders signed a framework agreementto connect ASEAN to the global networked economy. In a statement following themeetings, leaders announced that “the e-ASEAN agreement commits ASEANmembers to an implementation schedule to achieve digital-readiness for the region inorder to develop the basis for ASEAN’s competitiveness into the future, better the livesof citizens through the application of information and communications technologies,and foster the spirit of the ASEAN community.”11
With regard to its WTO commitments, Singapore amended its legislation in light of theTRIPs and custom valuation agreements ahead of the transition period available todeveloping countries. In services, Singapore has signed both the Agreement onTelecommunication Services and the Agreement on Financial Services. Under theAgreement on Telecommunications Services, Singapore committed to grant licensesfor up to two additional operators for public switched services and leased circuitfacilities from April 2000. Under the Agreement on Financial Services, Singapore’scommitments include an offer to increase offshore bank lending limits to residents of
9 World Trade Organization, Trade Policy Reviews: Singapore, March 2000. Found at Internetaddress http://www.wto.org/english/tratop_e/tpr_e/tp130_e.htm, retrieved Nov. 17, 2000.
10 U.S. Department of State, FY 2001 Country Commercial Guide: Singapore, July 2000.11 BNA Inc., “ASEAN Leaders Pledge to Study Possibility of Northeast Asian Trade Zone,” Nov. 28,
2000.
34
Singapore from S$100 million per bank to S$200 million, and to allow up to 49percent aggregate foreign equity ownership in locally owned insurance companies.12
Bilateral CooperationSingapore has undertaken a series of bilateral trade agreements as a part of itsambitious development strategy. In addition, to the free trade agreement with theUnited States, Singapore recently has signed or discussed free trade agreements withNew Zealand, Australia, Japan, Iceland, Liechtenstein, Norway, Switzerland,Mexico, and Taiwan.13
Singapore signed a bilateral FTA with Japan in 2000. In its first such FTA, Japanagreed to eliminate tariffs on 94 percent of Singaporean imports, with the exception ofcertain agricultural, fishery and petroleum products. In return, Singapore agreed toremove all remaining duties imports from Japan.
On February 17, 2003, Australia and Singapore signed a bilateral FTA, confirming adeal reached in early November 2002 after two years of negotiations. Given thealready low trade barriers in both countries and modest levels of bilateralmerchandise trade—neither country ranks among its counterpart’s top five exportmarkets—the elimination of tariffs on goods, as stipulated in the FTA, is more anincremental improvement than a major breakthrough. However, commitments in theFTA to opening up each country’s service sectors are more significant.14
Singapore began formal negotiations with New Zealand in late 1999, and anagreement was signed on November 14, 2000. Singapore has another tradeagreement with the four-country European Free Trade Association (which consists ofIceland, Liechtenstein, Norway, and Switzerland). It is also in talks with Mexico andTaiwan, and is thought to be exploring possible FTA agreements with South Korea andIndia. Mexico and Singapore signed a Joint Declaration for the Creation of a FreeTrade Agreement on November 13, 2000.15 Singapore and the Republic of Koreasigned two Memoranda of Understanding on November 27, 2000, as a part of effortsto strengthen economic ties between the two countries. The first MOU is for cooperationbetween the state managed enterprises (SMEs) of Singapore and Korea. The second isfor cooperation in Standardization and Conformity Assessment. SMEs in the twocountries account for a large proportion of business establishments and much of thenational workforce. Cooperation will help facilitate partnerships between SMEs in thetwo countries, and will increase bilateral trade through a reduction of technicalbarriers to trade.16
12 World Trade Organization, Trade Policy Reviews: Singapore, March 2000. Found athttp://www.wto.org/english/tratop_e/tpr_e/tp130_e.htm, retrieved Nov. 17, 2000.
13 Economic Intelligence Unit, “Singapore Country Briegings: Economic Agreements,” found athttp://eiu.com, retrieved May 15, 2003.
14 Ibid.15 World Trade Online: Around the World. “Mexico, Singapore Start FTA Negotiations,” Nov. 13,
2000. Found at http://www.insidetrade.com, retrieved Dec. 19, 2000.16 World Trade Online: Around the World. “Singapore, Korea Sign Economic Agreements,”
November 27, 2000. Found at http://www.insidetrade.com. Retrieved December 19, 2000.
35
Finally, in the November 2000 ASEAN meetings, Singapore and the nine othermembers pledged to study the possibility of a Northeast Asian Trade Zone. Leadersagreed to push for expanded free trade with Northeast Asia to achieve greatereconomic integration of the region, but conceded that the process would be lengthy. Ina closing statement, Singapore Prime Minister Goh Chok Tong acknowledged thatsome ASEAN members were reluctant to move too quickly to formally allow theeconomic powerhouses of China, Japan, and South Korea to join the group becausethe smaller nations could be left behind. As it now stands, the leaders from China,Japan, and South Korea meet on the sidelines of official ASEAN summits, in what isknown as the ASEAN+3 meetings.17
17 BNA Inc. “ASEAN Leaders Pledge to Study Possibility of Northeast Asian Trade Zone,” November28, 2000.

37
CHAPTER 4Review of Literature
Introduction
This chapter reviews the academic and policy literature pertaining to a U.S.-SingaporeFTA. Prior to reviewing the studies assessing the estimated impact on the United Statesof the U.S.-Singapore FTA, a discussion is presented on the conceptual issuesregarding free trade agreements. The third section discusses the estimated impact onthe United States of actual or potential FTAs in which Singapore is a member. The lastsection compares the economic welfare impacts of three studies reviewed in thischapter along with the findings of the current Commission study.
General Effects of Trade Agreements
Studying the economic impact of an FTA entails investigating static effects such as tradecreation and trade diversion as well as terms of trade. In addition, issues related toscale effects and non-quantifiable effects have to be considered. A discussion of theseissues is presented below.
Static Effects: Trade Creation and Trade DiversionTrade liberalization can in general be undertaken in two different manners. First, itcan be based on the “most favored nation” (MFN) principle where better marketaccess is granted to all trading partners equally. The classical “gains from trade”argument asserts that such trade liberalization would help consumers to have access tomore goods at lower prices, and producers to have more sources for their inputs andmore markets for their products (for which they may receive higher prices). Second, itcan be done in a preferential way, with better market access granted to one partnerbut not to others. An FTA, such as the one between the United States and Singapore, isan agreement in which preferential liberalization is undertaken reciprocally betweenparticipating countries.
To the extent that FTAs are designed to liberalize trade, they are likely to engendereconomic gains similar to those of an MFN liberalization. However, given theirdiscriminatory nature, studying the economic impact of FTAs involves additional issuesthat are not present in an MFN liberalization. The traditional way to study an FTA is tocategorize the FTA-induced trade expansion into trade creation or trade diversion.1
1 The seminal works on this issue are J. Viner, The Customs Union Issue, New York: CarnegieEndowment for International Peace, 1950 and J. Meade, The Theory of Customs Union, Amsterdam:North Holland, 1955.

38
Trade creation improves welfare and occurs when partner country productiondisplaces higher cost domestic production. Trade diversion reduces welfare andoccurs when partner country production displaces lower cost imports from the rest ofthe world.2 The combined effect of an FTA on intra-bloc trade will then reflect tradecreation as well as trade diversion. Whether the trade-creation (welfare enhancing) orthe trade-diversion (welfare reducing) effects dominate depends on a variety offactors, including external trade barriers, cost differences, and relative supply anddemand responses and other domestic policies. From that point of view, the overallwelfare impact of an FTA is not unambiguous, making its determination an empiricalissue.
Static Effects: Terms of TradeThe impact of an FTA also can be studied from a “terms of trade” (i.e., the price ofexports relative to the price of imports) viewpoint. If the participating countries arelarge enough to be able to affect import and export prices by their actions, theestablishment of an FTA is likely to affect the terms of trade of a given FTA member inthree different manners. First, by increasing the demand for its partner’s products, thecountry’s own preferential trade liberalization may increase the (pre-tariff) price of itsimports from the partner country leading to a deterioration in its terms of trade.Second, tariff reduction by the partner country could increase the demand (and theprice) for the FTA member’s exports and improve its terms of trade. Finally, thedecreased demand for imports originating from nonmember countries tends todecrease their price and improve the FTA members’ terms of trade. Therefore, theimpact on economic welfare will depend on whether the terms of trade have improvedor deteriorated for a given partner country.
Scale EffectsTo the extent that FTAs integrate (and, hence, enlarge) markets, some would argue thatthey offer firms an opportunity to exploit economies of scale (or increasing returns toscale) and to lower costs by expanding production. Moreover, by increasing theintensity of competition, an FTA can potentially induce firms to make efficiencyimprovements in order to raise productivity levels.3 It has, for instance, been pointedout that firms in Canada have long argued that U.S. market access would enable themto exploit economies of scale, and that this access would allow them to increase theirexports not only to the countries in North America, but also to the rest of the world.4
2 Losses from trade diversion occur when lost tariff revenue associated with changes in the pattern oftrade exceeds efficiency gains from the decline of the prices paid by consumers. These losses will belarger the higher the FTA’s margin of preferences (i.e., the trade barriers facing nonmembers relative tointra-FTA barriers).
3 A closely related gain comes from increased competition as firms are induced to cut prices and toexpand sales, benefitting consumers as the monopolistic distortion is reduced.
4 H.J. Wall, “NAFTA and the Geography of North American Trade,” Federal Reserve Bank of St.Louis Review, vol. 85, No. 2, Mar./Apr. 2003.
39
Increasing returns to scale also affect the volume of trade in inputs and intermediategoods used by increasing-return industries because as firms expand production andexploit economies of scale, they need to purchase more inputs and intermediategoods. These goods may be imported from inside or outside the FTA.
The enlarged FTA market also may attract investment, including foreign directinvestment (FDI), especially investment for which market size is important. It should benoted that the higher the FTA’s margin of preference, the more attractive it will be asan FDI destination. In the long run, changes in trade flows can lead to substantialchanges in the location of production between member countries of an FTA. Theserelocations may be determined by comparative advantage (i.e., the removal ofbarriers might lead each country to produce the goods at which it is best). Alternatively,sectors with strong backward or forward linkages may all relocate to one country andtake advantage of the preferential access to cater to the whole FTA market from there.These agglomeration effects are stronger in the presence of economies of scale. Theimpact of an FTA will depend on the increased level of economic activity within the FTAand on the distribution of the effects among members.
Political EffectsIn addition to the generally quantifiable effects discussed so far, regional integrationcan provide other potential benefits that are more difficult to evaluate. A World Bankpublication discusses a variety of additional effects (or classes of effects) that mayresult from regional integration agreements.5 One such effect is enhanced security(either against nonmembers or between members).6 Another potential benefit is thatby forming a unit and pooling their bargaining power, FTA members can negotiatemore efficiently in international forums. Regional integration can also be useful in“locking in” domestic (trade or other policy) reforms by raising the cost of policyreversal. Another possible gain is the increased possibilities for cooperation inenvironmental or technological assistance projects.
The effects of a free trade agreement on which economists tend to focus their analyticalefforts are illustrated in table 4-1. It shows how limited the area is where effects of tradepolicy are discernible. A “yes” indicates that the given effect is generally measurable(or can be modeled in a simulation) and/or has been measured. Note that these occurmainly in the static economic effects. The fact that relatively few effects are measurabledoes not mean that other effects are not important. By focusing attention on a selectednumber of FTA effects, analysts provide important insights into specific aspects of tradeagreements, but it is possible that other non-quantifiable effects dominate.
5 The World Bank, Trade Blocs, New York: Oxford University Press, 2000, p. 66.6 For more on this, see Maurice Schiff and L. Alan Winters, “Regional Integration as Diplomacy,”
World Bank Economic Review, 1998, 12(2): 271–96.
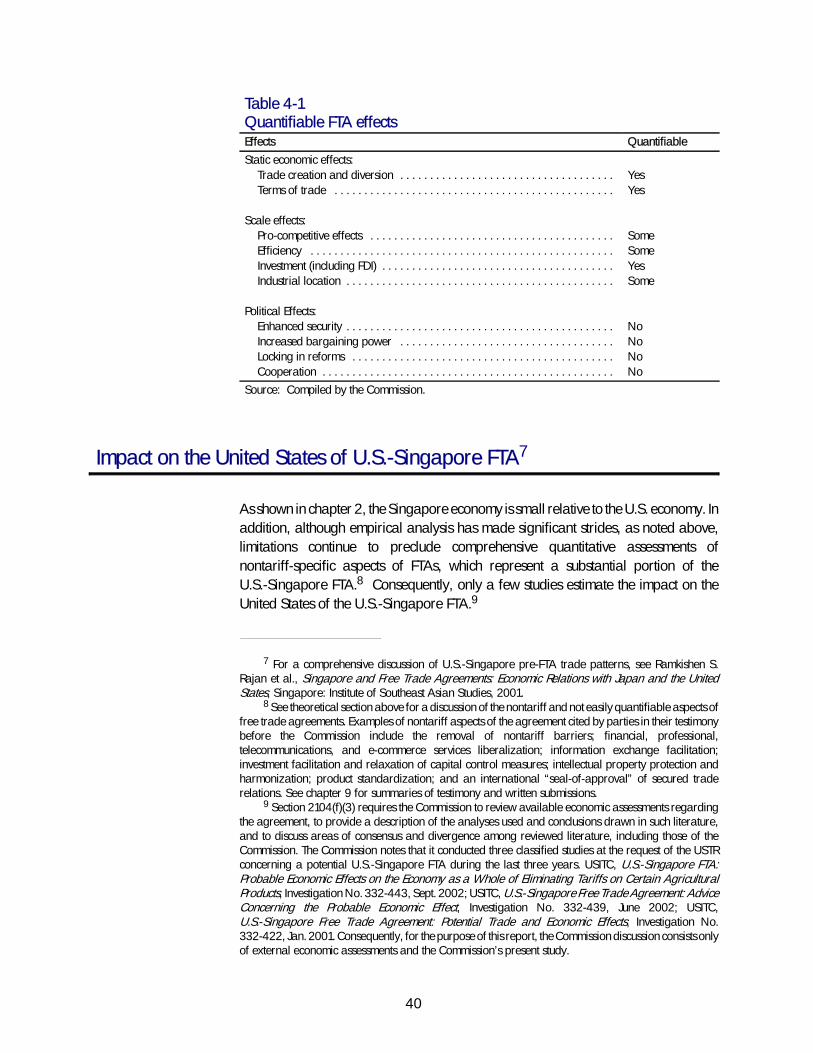
40
Table 4-1Quantifiable FTA effectsEffects Quantifiable
Static economic effects:Trade creation and diversion . . . . . . . . . . . . . . . . . . . . . . . . . . . . . . . . . . . . YesTerms of trade . . . . . . . . . . . . . . . . . . . . . . . . . . . . . . . . . . . . . . . . . . . . . . . Yes
Scale effects:Pro-competitive effects . . . . . . . . . . . . . . . . . . . . . . . . . . . . . . . . . . . . . . . . . SomeEfficiency . . . . . . . . . . . . . . . . . . . . . . . . . . . . . . . . . . . . . . . . . . . . . . . . . . . SomeInvestment (including FDI) . . . . . . . . . . . . . . . . . . . . . . . . . . . . . . . . . . . . . . . YesIndustrial location . . . . . . . . . . . . . . . . . . . . . . . . . . . . . . . . . . . . . . . . . . . . . Some
Political Effects:Enhanced security . . . . . . . . . . . . . . . . . . . . . . . . . . . . . . . . . . . . . . . . . . . . . NoIncreased bargaining power . . . . . . . . . . . . . . . . . . . . . . . . . . . . . . . . . . . . NoLocking in reforms . . . . . . . . . . . . . . . . . . . . . . . . . . . . . . . . . . . . . . . . . . . . NoCooperation . . . . . . . . . . . . . . . . . . . . . . . . . . . . . . . . . . . . . . . . . . . . . . . . . No
Source: Compiled by the Commission.
Impact on the United States of U.S.-Singapore FTA7
As shown in chapter 2, the Singapore economy is small relative to the U.S. economy. Inaddition, although empirical analysis has made significant strides, as noted above,limitations continue to preclude comprehensive quantitative assessments ofnontariff-specific aspects of FTAs, which represent a substantial portion of theU.S.-Singapore FTA.8 Consequently, only a few studies estimate the impact on theUnited States of the U.S.-Singapore FTA.9
7 For a comprehensive discussion of U.S.-Singapore pre-FTA trade patterns, see Ramkishen S.Rajan et al., Singapore and Free Trade Agreements: Economic Relations with Japan and the UnitedStates, Singapore: Institute of Southeast Asian Studies, 2001.
8 See theoretical section above for a discussion of the nontariff and not easily quantifiable aspects offree trade agreements. Examples of nontariff aspects of the agreement cited by parties in their testimonybefore the Commission include the removal of nontariff barriers; financial, professional,telecommunications, and e-commerce services liberalization; information exchange facilitation;investment facilitation and relaxation of capital control measures; intellectual property protection andharmonization; product standardization; and an international “seal-of-approval” of secured traderelations. See chapter 9 for summaries of testimony and written submissions.
9 Section 2104(f)(3) requires the Commission to review available economic assessments regardingthe agreement, to provide a description of the analyses used and conclusions drawn in such literature,and to discuss areas of consensus and divergence among reviewed literature, including those of theCommission. The Commission notes that it conducted three classified studies at the request of the USTRconcerning a potential U.S.-Singapore FTA during the last three years. USITC, U.S.-Singapore FTA:Probable Economic Effects on the Economy as a Whole of Eliminating Tariffs on Certain AgriculturalProducts, Investigation No. 332-443, Sept. 2002; USITC, U.S.-Singapore Free Trade Agreement: AdviceConcerning the Probable Economic Effect, Investigation No. 332-439, June 2002; USITC,U.S.-Singapore Free Trade Agreement: Potential Trade and Economic Effects, Investigation No.332-422, Jan. 2001. Consequently, for the purpose of this report, the Commission discussion consists onlyof external economic assessments and the Commission’s present study.
41
Robert Scollay and John P. Gilbert analyze the economic impact of a number ofpotential free trade agreements and various alternative scenarios.10 Scollay andGilbert’s analyses are based on the GTAP computable general equilibrium model anddatabase, aggregated to include 22 countries/regions and 21 sectors. The modelassumes perfect competition, constant returns to scale, and product differentiation bycountry of origin (i.e., the Armington assumption). Data are adjusted to incorporatefull Uruguay Round and AFTA implementation.11 However, data limitations do notallow substantive treatment of the services sector liberalization. The authors report thewelfare impact on the United States of the U.S.-Singapore FTA to be less than onehundredth of a percentage point of GDP.12 They also report that, as a result of theagreement, U.S. exports are expected to increase by 0.17 percent, and U.S. imports by0.16 percent.13 They also assess the change in factor incomes for land, skilled labor,unskilled labor, capital, and natural resources. The only factor which experiencesmore than one-half of one hundredth of one percent change from the base year island, whose relative returns are expected to increase by 0.01 percent.14
Drusilla K. Brown, Alan V. Deardorff, and Robert M. Stern assess a variety of potentialmultilateral, regional, and bilateral trade agreements.15 The authors use the MichiganModel, a computable general equilibrium model with 20 countries/regions and 18sectors. In contrast to the GTAP model, the Michigan Model incorporates features of“New Trade Theory,” including monopolistic competition, increasing returns to scale,and product variety.16 The authors incorporate full Uruguay Round implementationand run four simulations: agricultural products liberalization, industrial productsliberalization, services liberalization, and all of the above; however, only the fourthsimulation is reported.17 Brown et al. also note that their computational analysis doesnot take into account potentially beneficial, but not easily quantifiable features of thevarious FTAs, such as the negotiation of specific rules for the use of capital control
10 Robert Scollay and John P. Gilbert, New Regional Trading Arrangements in the Asia Pacific?,Washington, DC: Institute For International Economics, Policy Analyses in International Economics No.63, May 2001, p. 62.
11 AFTA is the ASEAN Free Trade Area, and includes Brunei Darussalam, Cambodia, Indonesia,Laos, Malaysia, Myanmar, the Philippines, Singapore, Thailand, and Vietnam; found athttp://www.aseansec.org, retrieved Apr. 22, 2003. Uruguay Round implementation includes uniformreductions of 36 and 20 percent in agricultural export subsidies and output subsidies, respectively; as wellas elimination of tariff equivalents of textile export quotas. The authors do not assume WTO accession byChina or Taiwan, but do assume that reductions in protection by other economies are made available tothese two economies on an MFN basis. AFTA implementation involves adjustments to tariffs of ASEANeconomies. Ibid., p. 157.
12 Ibid., table 3.2a.13 Ibid., tables 3.3a and 3.4a; percent change from base.14 Ibid., table 3.5a.15 Drusilla Brown, Alan V. Deardorff, and Robert M. Stern, “Multilateral, Regional, and Bilateral
Trade-Policy Options for the United States and Japan,” Research Seminar in International Economics,Discussion Paper No. 490, available at http://www.spp.umich.edu/rsie/workingpapers/wp.html,Dec. 16, 2002.
16 Ibid., p. 2.17 Uruguay Round implementation includes reductions in tariff and nontariff barriers. Ibid., p. 5 and
10.
42
measures, or potentially protectionist components of FTAs, such as rules of origin.18
They estimate that the welfare impact on the United States of the U.S.-Singapore FTA is0.19 percent of GNP ($18 billion).19 Although the authors do not report thedisaggregated effects of the various liberalization scenarios, key factors in their largerreported economywide welfare results, as compared to Scollay and Gilbert, includethe estimates of services liberalization and the assumption of increasing returns toscale. Brown et al. also assess the sectoral employment effects of the agreement. Of the18 sectors, only wearing apparel, trade and transport, and other private services areexpected to experience employment contraction (table 4-2).20
Several factors lead to findings of relatively small impacts. Singapore’s economy issmall in comparison to the U.S. economy.21 In addition, U.S. trade with Singapore isrelatively small, trade accounts for a smaller share of U.S. output than most countries,and U.S. tariffs are already low.22 Consequently, in terms of percent of GDP, a priorieconomywide effects of trade liberalization on the United States are expected to besmall relative to most countries. As seen in the studies discussed above, regardless ofthe model employed, the GTAP model (whose key assumptions include constantreturns to scale and perfect competition) or the Michigan Model (whose keyassumptions include increasing returns to scale and monopolistic competition), theestimated economywide impact on the United States ranges from Scollay and Gilbert’sGTAP estimate of 0.00 percent of GDP to Brown et al.’s Michigan Model estimate of0.19 percent of GNP. Estimated welfare impact, however, is a function of the modelspecifications employed and the modeler’s ability to quantify less
18 Ibid., p. 14-15.19 Ibid., table 7. “The difference between GDP and GNP is net receipts of factor income from the rest
of the world. These net receipts represent income from the goods and services produced abroad using thelabor and property supplied by U.S. residents less payments to the rest of the world for the goods andservices produced in the United States using the labor and property supplied by foreign residents. Factorincomes are measured as compensation of employees, corporate profits (dividends, earnings ofunincorporated affiliates, and reinvested earnings of incorporated affiliates), and interest.” Bureau ofEconomic Analysis, “A Guide to the NIPA’s,” found at http://www.bea.doc.gov/bea/an/0398niw/maintext.htm, retrieved June 2, 2003.
20 Although certain sectors are estimated to experience employment contraction or expansion, themodel is a static employment level model, and, consequently, there is no change to economywideemployment levels.
21 See chapter 3 for a discussion of the Singapore economy and U.S.-Singapore trade. Singapore’sGDP represents approximately 0.85 percent of U.S. GDP (2001); U.S. GDP from Bureau of EconomicAnalysis, found at http://www.bea.gov; and Singapore GDP from Singapore Department of Statistics,Economic Survey of Singapore, 2002.
22 The trade-to-output ratio is 23.8 percent for the United States and 280 percent for Singapore(2001); U.S. data from Bureau of Economic Analysis, found at http://www.bea.gov; and Singapore datafrom Singapore Department of Statistics, Economic Survey of Singapore, 2002; most imports either enterthe United States duty free or are subject to low tariffs, all except two of which are bound. In 2000, theaverage MFN rate stood at 5.4 percent for all goods, 10.6 percent for agri-food products and 4.5percent for non-agricultural products. World Trade Organization, Trade Policy Review Body, “SummaryObservations,” Trade Policy Review — United States — Report by the Secretariat, WT/TPR/S/88, Aug.15, 2001, p. xii, par. 12.

43
Table 4-2Sectoral employment effects for the United States of the U.S.-SingaporeFTA, estimates by Brown et al.
SectorPercent of
employmentNumber of
workersAgriculture . . . . . . . . . . . . . . . . . . . . . . . . . . . . . . . . . . . . . . . . . . . . . 0.10 4,216Mining . . . . . . . . . . . . . . . . . . . . . . . . . . . . . . . . . . . . . . . . . . . . . . . . . 0.09 616Food, beverages, and tobacco . . . . . . . . . . . . . . . . . . . . . . . . . . . . . . 0.04 1,146Textiles . . . . . . . . . . . . . . . . . . . . . . . . . . . . . . . . . . . . . . . . . . . . . . . . 0.05 581Wearing apparel . . . . . . . . . . . . . . . . . . . . . . . . . . . . . . . . . . . . . . . . -0.03 -300Leather products and footwear . . . . . . . . . . . . . . . . . . . . . . . . . . . . . . 0.19 275Wood and wood products . . . . . . . . . . . . . . . . . . . . . . . . . . . . . . . . . 0.03 1,231Chemicals . . . . . . . . . . . . . . . . . . . . . . . . . . . . . . . . . . . . . . . . . . . . . . 0.06 1,769Non-metallic mineral products . . . . . . . . . . . . . . . . . . . . . . . . . . . . . . 0.04 338Metal products . . . . . . . . . . . . . . . . . . . . . . . . . . . . . . . . . . . . . . . . . . 0.07 2,045Transportation equipment . . . . . . . . . . . . . . . . . . . . . . . . . . . . . . . . . . 0.06 1,231Machinery and equipment . . . . . . . . . . . . . . . . . . . . . . . . . . . . . . . . . 0.15 4,222Other manufactures . . . . . . . . . . . . . . . . . . . . . . . . . . . . . . . . . . . . . . 0.19 3,511Elec., gas, and water . . . . . . . . . . . . . . . . . . . . . . . . . . . . . . . . . . . . . 0.01 409Construction . . . . . . . . . . . . . . . . . . . . . . . . . . . . . . . . . . . . . . . . . . . . 0.00 38Trade and transport . . . . . . . . . . . . . . . . . . . . . . . . . . . . . . . . . . . . . . -0.07 -22,013Other private services . . . . . . . . . . . . . . . . . . . . . . . . . . . . . . . . . . . . . 0.00 -569Government services . . . . . . . . . . . . . . . . . . . . . . . . . . . . . . . . . . . . . . 0.00 1,254
Source: Drusilla Brown, Alan V. Deardorff, and Robert M. Stern, “Multilateral, Regional, and Bilat-eral Trade-Policy Options for the United States and Japan,” Research Seminar in InternationalEconomics, Discussion Paper No. 490, available athttp://www.spp.umich.edu/rsie/workingpapers/wp.html, Dec. 16, 2002, table 8.
tangible aspects of trade agreements; these distinctions can lead to considerablydifferent findings.23
Impact on the United States of Other Actual or Potential Singapore FTAs
Singapore is a small open economy with a high ratio of trade to GDP, and has recentlyengaged in a number of free trade agreements. In addition to the United States,Singapore has ongoing or concluded free trade agreements with ASEAN and thePeople’s Republic of China, Australia, Canada, the European Free Trade Association(EFTA),24 India, Japan, Mexico, New Zealand, and the Republic of Korea.25 Rajanand Sen classify Singapore’s trade agreements into two main groups.26 The first
23 For example, both Scollay and Gilbert, and Brown et al. assess the potential impact on the UnitedStates of an APEC FTA. While Scollay and Gilbert estimate, at most, a potential 0.07 percent change inU.S. GDP, Brown et al., who were able to incorporate estimates for services sector liberalization, estimatea potential 2.69 percent change in GNP (table 4-6 and 4-7).
24 EFTA members include Iceland, Liechtenstein, Norway, and Switzerland; found athttp://www.efta.int, retrieved Apr. 22, 2003.
25 Singapore Ministry of Trade and Industry, Free Trade Agreements, found athttp://www.mti.gov.sg/FTA, retrieved Apr. 21, 2003.
26 Ramkishen Rajan and Rahul Sen, “The Japan-Singapore ‘New Age’ Economic PartnershipAgreement: Background, Motivation and Implications,” Canberra: Centre for International EconomicStudies, Discussion Paper No. 0208, Mar. 2002, p.5-6.
44
group includes countries such as Australia, New Zealand, and EFTA countries which,generally, do not account for a relatively large amount of Singapore’s trade, but allowSingapore to seek new markets and diversify external linkages. The second groupincludes the United States and Japan which are established trading partners, withwhom free trade agreements can be seen as formalization of de facto linkages.27
Although Rajan and Sen do not directly assess the economic welfare impact on theUnited States of the Singapore-Japan agreement, they note that “trade and investmentdiversion remains a real concern, particularly with regard to the services sector,” andcould potentially negatively affect third-party countries, such as the United States.28
The Centre for International Economics in Canberra, Australia, conducted a study ofthe impact of an AFTA-CER29 free trade area, which would include Australia,Indonesia, New Zealand, Malaysia, Philippines, Singapore, and Thailand.30 Thescenario modeled is for free trade in goods and services between member economiesby 2005. Using a general equilibrium global model, the authors estimate threescenarios: AFTA-CER liberalization, APEC liberalization,31 and both AFTA-CER andAPEC combined. With respect to the United States, the authors only report theestimated impact on net international capital flows (table 4-3). Because the FTAincreases productivity and income in the member countries, and the improvedefficiency increases returns on investment, the AFTA-CER members experience anincrease in investment inflows funded partially by the United States (which experiencesnet capital outflows). In addition, the increased capital inflows contribute toappreciations of the real exchange rate vis-a-vis the U.S. dollar, around 0.4 to 1.2percent above baseline.32 These results represent only two of numerous ways inwhich the proposed FTA could impact the United States, and in and of themselves, donot imply either a positive or negative impact on U.S. welfare.
Thomas Hertel, Terrie Walmsley, and Ken Itakura provide a broad spectrum ofpotential effects on the United States of the Japan-Singapore FTA.33 In addition to thefacilitation of trade through reduction of tariffs and nontariff measures, the
27 Ibid., p. 6.28 Ibid., p. 22.29 AFTA is the ASEAN Free Trade Area and CER is the Australia-New Zealand Closer Economic
Relations Trade Agreement.30 Centre for International Economics, Canberra, “Economic benefits from an AFTA-CER free trade
area: Year 2000 study,” June 2000.31 APEC is the Asia Pacific Economic Cooperation, and member economies are Australia, Brunei
Darussalam, Canada, Chile, People’s Republic of China, Hong Kong (China), Indonesia, Japan,Republic of Korea, Malaysia, Mexico, New Zealand, Peru, The Republic of the Philippines, the RussianFederation, Singapore, Chinese Taipei, Thailand, United States of America, and Vietnam; found athttp://www.apecsec.org.sg, retrieved Apr. 22, 2003. APEC liberalization is assumed to be the adoptionof the APEC Bogor Declaration by all APEC countries whereby current MFN tariff rates are reduced tozero by 2010 for developed APEC countries and by 2020 for developing APEC countries; Ibid., p. 21.
32 Ibid., p. 29.33 Thomas Hertel, Terrie Walmsley, and Ken Itakura, “Dynamic Effects of the ‘New Age’ Free Trade
Agreement between Japan and Singapore,” Center for Global Trade Analysis, Purdue University, Sept.2001, p. 3.
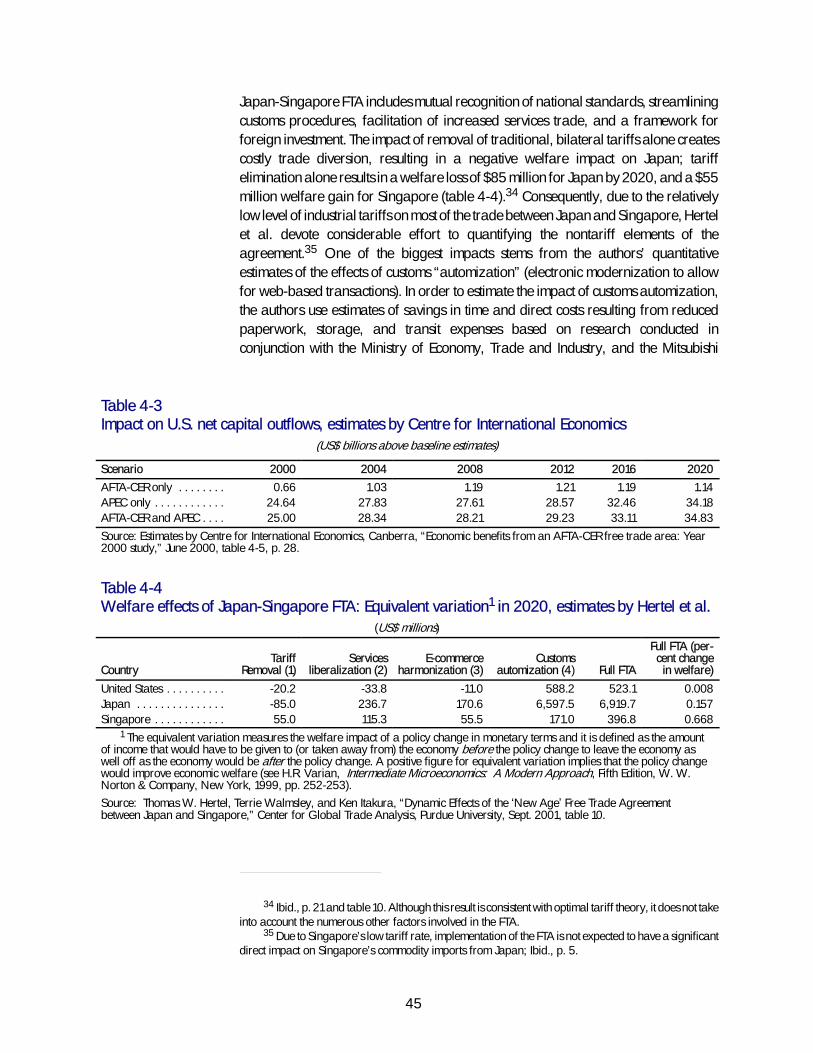
45
Japan-Singapore FTA includes mutual recognition of national standards, streamliningcustoms procedures, facilitation of increased services trade, and a framework forforeign investment. The impact of removal of traditional, bilateral tariffs alone createscostly trade diversion, resulting in a negative welfare impact on Japan; tariffelimination alone results in a welfare loss of $85 million for Japan by 2020, and a $55million welfare gain for Singapore (table 4-4).34 Consequently, due to the relativelylow level of industrial tariffs on most of the trade between Japan and Singapore, Hertelet al. devote considerable effort to quantifying the nontariff elements of theagreement.35 One of the biggest impacts stems from the authors’ quantitativeestimates of the effects of customs “automization” (electronic modernization to allowfor web-based transactions). In order to estimate the impact of customs automization,the authors use estimates of savings in time and direct costs resulting from reducedpaperwork, storage, and transit expenses based on research conducted inconjunction with the Ministry of Economy, Trade and Industry, and the Mitsubishi
Table 4-3Impact on U.S. net capital outflows, estimates by Centre for International Economics
(US$ billions above baseline estimates)
Scenario 2000 2004 2008 2012 2016 2020
AFTA-CER only . . . . . . . . 0.66 1.03 1.19 1.21 1.19 1.14APEC only . . . . . . . . . . . . 24.64 27.83 27.61 28.57 32.46 34.18AFTA-CER and APEC . . . . 25.00 28.34 28.21 29.23 33.11 34.83
Source: Estimates by Centre for International Economics, Canberra, “Economic benefits from an AFTA-CER free trade area: Year2000 study,” June 2000, table 4-5, p. 28.
Table 4-4Welfare effects of Japan-Singapore FTA: Equivalent variation1 in 2020, estimates by Hertel et al.
(US$ millions)
CountryTariff
Removal (1)Services
liberalization (2)E-commerce
harmonization (3)Customs
automization (4) Full FTA
Full FTA (per-cent changein welfare)
United States . . . . . . . . . . -20.2 -33.8 -11.0 588.2 523.1 0.008Japan . . . . . . . . . . . . . . . -85.0 236.7 170.6 6,597.5 6,919.7 0.157Singapore . . . . . . . . . . . . 55.0 115.3 55.5 171.0 396.8 0.668
1 The equivalent variation measures the welfare impact of a policy change in monetary terms and it is defined as the amountof income that would have to be given to (or taken away from) the economy before the policy change to leave the economy aswell off as the economy would be after the policy change. A positive figure for equivalent variation implies that the policy changewould improve economic welfare (see H.R. Varian, Intermediate Microeconomics: A Modern Approach, Fifth Edition, W. W.Norton & Company, New York, 1999, pp. 252-253).Source: Thomas W. Hertel, Terrie Walmsley, and Ken Itakura, “Dynamic Effects of the ‘New Age’ Free Trade Agreementbetween Japan and Singapore,” Center for Global Trade Analysis, Purdue University, Sept. 2001, table 10.
34 Ibid., p. 21 and table 10. Although this result is consistent with optimal tariff theory, it does not takeinto account the numerous other factors involved in the FTA.
35 Due to Singapore’s low tariff rate, implementation of the FTA is not expected to have a significantdirect impact on Singapore’s commodity imports from Japan; Ibid., p. 5.
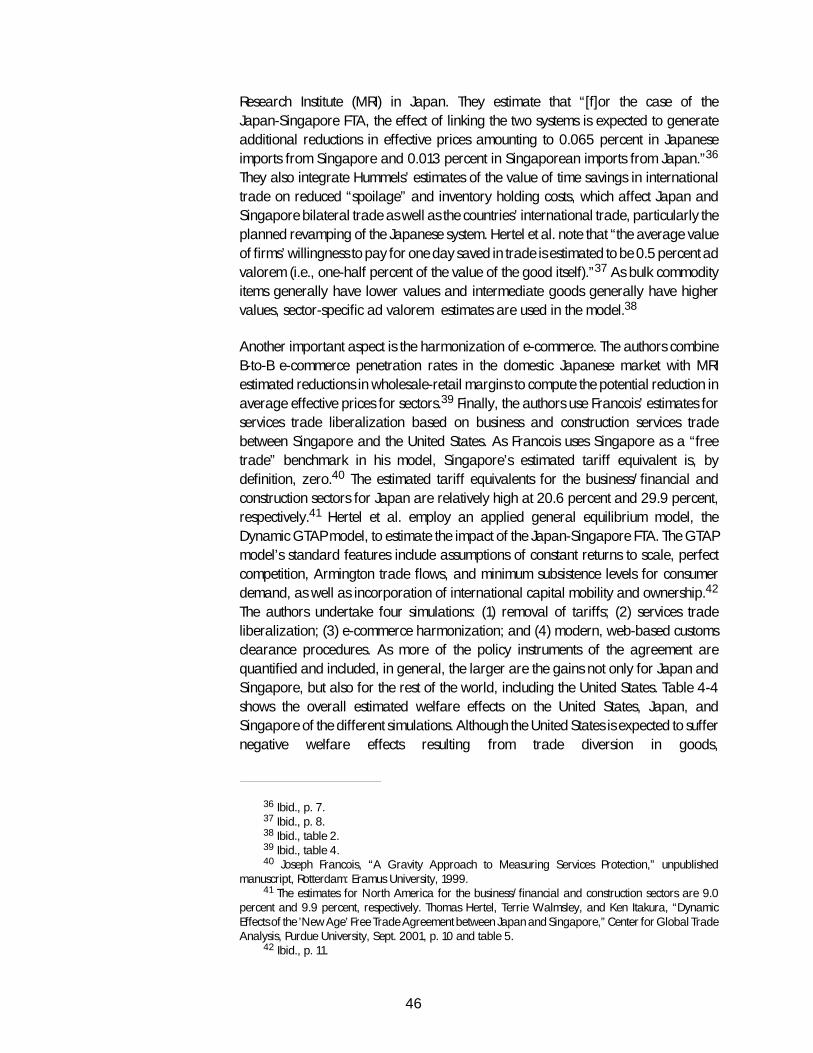
46
Research Institute (MRI) in Japan. They estimate that “[f]or the case of theJapan-Singapore FTA, the effect of linking the two systems is expected to generateadditional reductions in effective prices amounting to 0.065 percent in Japaneseimports from Singapore and 0.013 percent in Singaporean imports from Japan.”36
They also integrate Hummels’ estimates of the value of time savings in internationaltrade on reduced “spoilage” and inventory holding costs, which affect Japan andSingapore bilateral trade as well as the countries’ international trade, particularly theplanned revamping of the Japanese system. Hertel et al. note that “the average valueof firms’ willingness to pay for one day saved in trade is estimated to be 0.5 percent advalorem (i.e., one-half percent of the value of the good itself).”37 As bulk commodityitems generally have lower values and intermediate goods generally have highervalues, sector-specific ad valorem estimates are used in the model.38
Another important aspect is the harmonization of e-commerce. The authors combineB-to-B e-commerce penetration rates in the domestic Japanese market with MRIestimated reductions in wholesale-retail margins to compute the potential reduction inaverage effective prices for sectors.39 Finally, the authors use Francois’ estimates forservices trade liberalization based on business and construction services tradebetween Singapore and the United States. As Francois uses Singapore as a “freetrade” benchmark in his model, Singapore’s estimated tariff equivalent is, bydefinition, zero.40 The estimated tariff equivalents for the business/financial andconstruction sectors for Japan are relatively high at 20.6 percent and 29.9 percent,respectively.41 Hertel et al. employ an applied general equilibrium model, theDynamic GTAP model, to estimate the impact of the Japan-Singapore FTA. The GTAPmodel’s standard features include assumptions of constant returns to scale, perfectcompetition, Armington trade flows, and minimum subsistence levels for consumerdemand, as well as incorporation of international capital mobility and ownership.42
The authors undertake four simulations: (1) removal of tariffs; (2) services tradeliberalization; (3) e-commerce harmonization; and (4) modern, web-based customsclearance procedures. As more of the policy instruments of the agreement arequantified and included, in general, the larger are the gains not only for Japan andSingapore, but also for the rest of the world, including the United States. Table 4-4shows the overall estimated welfare effects on the United States, Japan, andSingapore of the different simulations. Although the United States is expected to suffernegative welfare effects resulting from trade diversion in goods,
36 Ibid., p. 7.37 Ibid., p. 8.38 Ibid., table 2.39 Ibid., table 4.40 Joseph Francois, “A Gravity Approach to Measuring Services Protection,” unpublished
manuscript, Rotterdam: Eramus University, 1999.41 The estimates for North America for the business/financial and construction sectors are 9.0
percent and 9.9 percent, respectively. Thomas Hertel, Terrie Walmsley, and Ken Itakura, “DynamicEffects of the ’New Age’ Free Trade Agreement between Japan and Singapore,” Center for Global TradeAnalysis, Purdue University, Sept. 2001, p. 10 and table 5.
42 Ibid., p. 11.
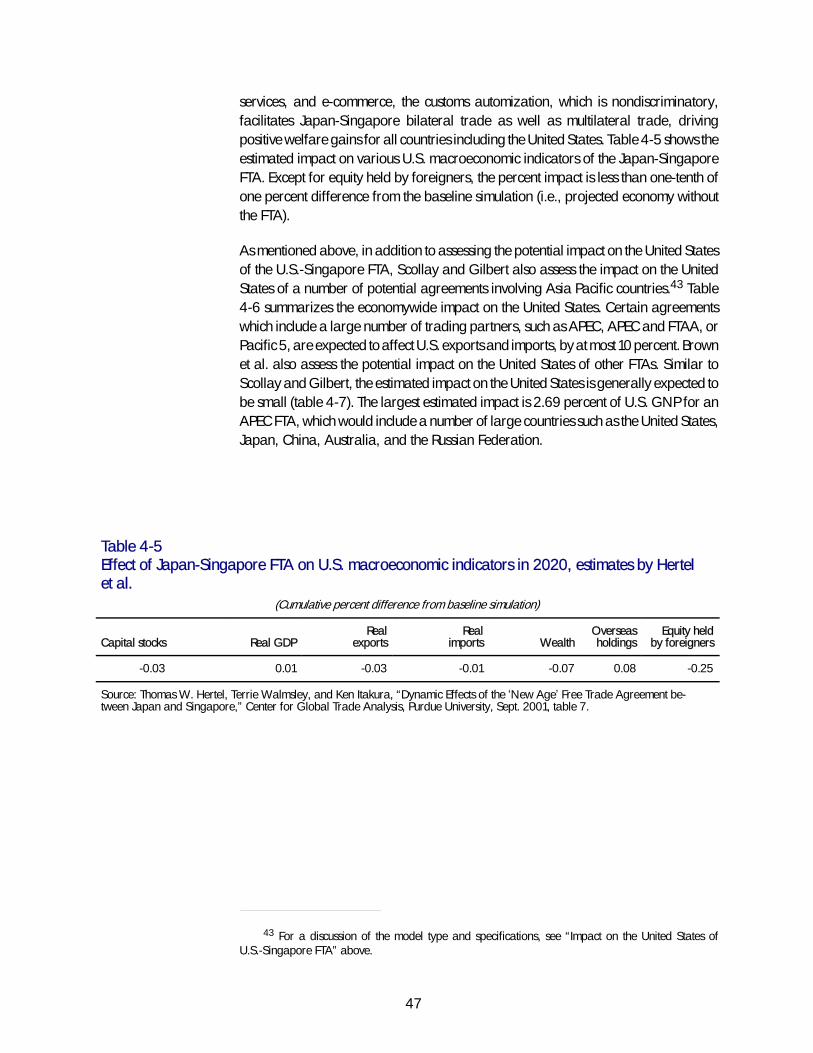
47
services, and e-commerce, the customs automization, which is nondiscriminatory,facilitates Japan-Singapore bilateral trade as well as multilateral trade, drivingpositive welfare gains for all countries including the United States. Table 4-5 shows theestimated impact on various U.S. macroeconomic indicators of the Japan-SingaporeFTA. Except for equity held by foreigners, the percent impact is less than one-tenth ofone percent difference from the baseline simulation (i.e., projected economy withoutthe FTA).
As mentioned above, in addition to assessing the potential impact on the United Statesof the U.S.-Singapore FTA, Scollay and Gilbert also assess the impact on the UnitedStates of a number of potential agreements involving Asia Pacific countries.43 Table4-6 summarizes the economywide impact on the United States. Certain agreementswhich include a large number of trading partners, such as APEC, APEC and FTAA, orPacific 5, are expected to affect U.S. exports and imports, by at most 10 percent. Brownet al. also assess the potential impact on the United States of other FTAs. Similar toScollay and Gilbert, the estimated impact on the United States is generally expected tobe small (table 4-7). The largest estimated impact is 2.69 percent of U.S. GNP for anAPEC FTA, which would include a number of large countries such as the United States,Japan, China, Australia, and the Russian Federation.
Table 4-5Effect of Japan-Singapore FTA on U.S. macroeconomic indicators in 2020, estimates by Hertelet al.
(Cumulative percent difference from baseline simulation)
Capital stocks Real GDPReal
exportsReal
imports WealthOverseasholdings
Equity heldby foreigners
-0.03 0.01 -0.03 -0.01 -0.07 0.08 -0.25
Source: Thomas W. Hertel, Terrie Walmsley, and Ken Itakura, “Dynamic Effects of the ‘New Age’ Free Trade Agreement be-tween Japan and Singapore,” Center for Global Trade Analysis, Purdue University, Sept. 2001, table 7.
43 For a discussion of the model type and specifications, see “Impact on the United States ofU.S.-Singapore FTA” above.
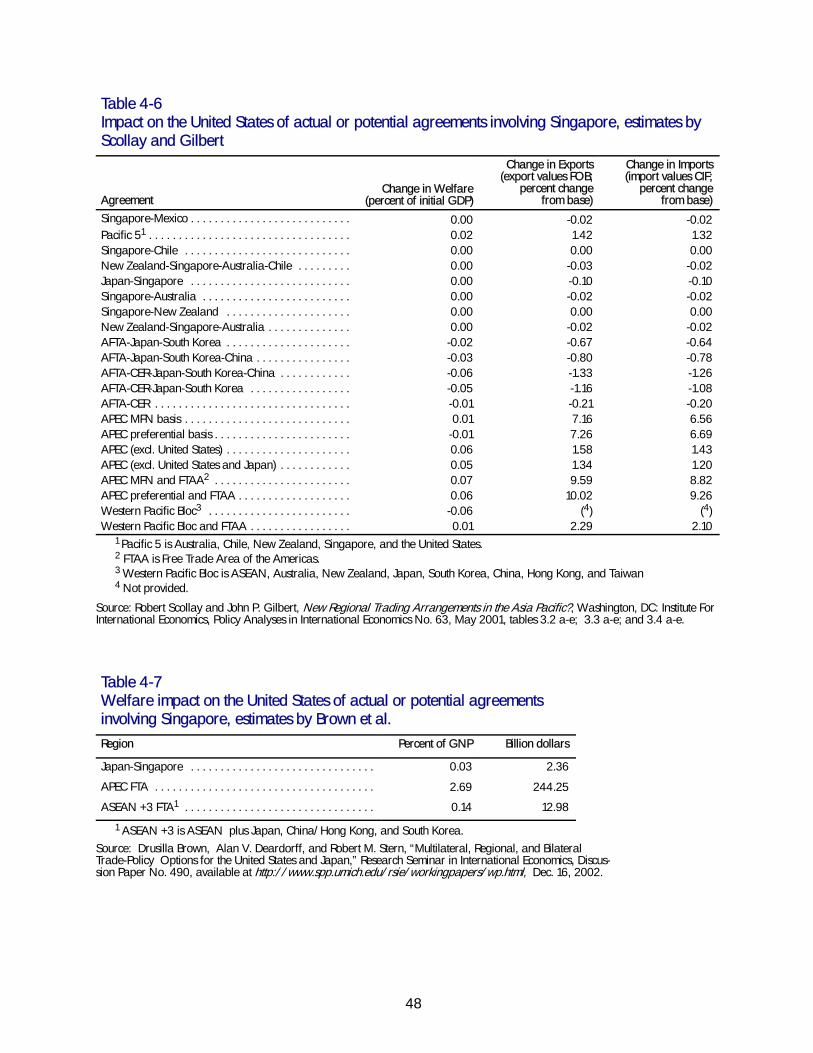
48
Table 4-6Impact on the United States of actual or potential agreements involving Singapore, estimates byScollay and Gilbert
AgreementChange in Welfare
(percent of initial GDP)
Change in Exports(export values FOB;
percent changefrom base)
Change in Imports(import values CIF;
percent changefrom base)
Singapore-Mexico . . . . . . . . . . . . . . . . . . . . . . . . . . . 0.00 -0.02 -0.02Pacific 51 . . . . . . . . . . . . . . . . . . . . . . . . . . . . . . . . . . 0.02 1.42 1.32Singapore-Chile . . . . . . . . . . . . . . . . . . . . . . . . . . . . 0.00 0.00 0.00New Zealand-Singapore-Australia-Chile . . . . . . . . . 0.00 -0.03 -0.02Japan-Singapore . . . . . . . . . . . . . . . . . . . . . . . . . . . 0.00 -0.10 -0.10Singapore-Australia . . . . . . . . . . . . . . . . . . . . . . . . . 0.00 -0.02 -0.02Singapore-New Zealand . . . . . . . . . . . . . . . . . . . . . 0.00 0.00 0.00New Zealand-Singapore-Australia . . . . . . . . . . . . . . 0.00 -0.02 -0.02AFTA-Japan-South Korea . . . . . . . . . . . . . . . . . . . . . -0.02 -0.67 -0.64AFTA-Japan-South Korea-China . . . . . . . . . . . . . . . . -0.03 -0.80 -0.78AFTA-CER-Japan-South Korea-China . . . . . . . . . . . . -0.06 -1.33 -1.26AFTA-CER-Japan-South Korea . . . . . . . . . . . . . . . . . -0.05 -1.16 -1.08AFTA-CER . . . . . . . . . . . . . . . . . . . . . . . . . . . . . . . . . -0.01 -0.21 -0.20APEC MFN basis . . . . . . . . . . . . . . . . . . . . . . . . . . . . 0.01 7.16 6.56APEC preferential basis . . . . . . . . . . . . . . . . . . . . . . . -0.01 7.26 6.69APEC (excl. United States) . . . . . . . . . . . . . . . . . . . . . 0.06 1.58 1.43APEC (excl. United States and Japan) . . . . . . . . . . . . 0.05 1.34 1.20APEC MFN and FTAA2 . . . . . . . . . . . . . . . . . . . . . . . 0.07 9.59 8.82APEC preferential and FTAA . . . . . . . . . . . . . . . . . . . 0.06 10.02 9.26Western Pacific Bloc3 . . . . . . . . . . . . . . . . . . . . . . . . -0.06 (4) (4)Western Pacific Bloc and FTAA . . . . . . . . . . . . . . . . . 0.01 2.29 2.10
1 Pacific 5 is Australia, Chile, New Zealand, Singapore, and the United States.2 FTAA is Free Trade Area of the Americas.3 Western Pacific Bloc is ASEAN, Australia, New Zealand, Japan, South Korea, China, Hong Kong, and Taiwan4 Not provided.
Source: Robert Scollay and John P. Gilbert, New Regional Trading Arrangements in the Asia Pacific?, Washington, DC: Institute ForInternational Economics, Policy Analyses in International Economics No. 63, May 2001, tables 3.2 a-e; 3.3 a-e; and 3.4 a-e.
Table 4-7Welfare impact on the United States of actual or potential agreementsinvolving Singapore, estimates by Brown et al.Region Percent of GNP Billion dollars
Japan-Singapore . . . . . . . . . . . . . . . . . . . . . . . . . . . . . . . 0.03 2.36
APEC FTA . . . . . . . . . . . . . . . . . . . . . . . . . . . . . . . . . . . . . 2.69 244.25
ASEAN +3 FTA1 . . . . . . . . . . . . . . . . . . . . . . . . . . . . . . . . 0.14 12.98
1 ASEAN +3 is ASEAN plus Japan, China/Hong Kong, and South Korea.Source: Drusilla Brown, Alan V. Deardorff, and Robert M. Stern, “Multilateral, Regional, and BilateralTrade-Policy Options for the United States and Japan,” Research Seminar in International Economics, Discus-sion Paper No. 490, available at http://www.spp.umich.edu/rsie/workingpapers/wp.html, Dec. 16, 2002.
49
Comparison of economic welfare impacts
This section summarizes the salient characteristics of the modeling frameworks used inScollay and Gilbert, Hertel et al., Brown et al., and the current Commission report andcompares their welfare implications. All studies relied on computable generalequilibrium models which are different in several aspects. The current Commissionanalysis (see Chapter 5) and Hertel et al. are based on the GTAP model, asdocumented in Hertel.44 As mentioned above, the GTAP model is based on theassumptions of constant returns to scale, perfect competition, and commoditydifferentiation by country of origin (i.e., the Armington assumption). The currentCommission work relied on sequential solutions of the comparative static GTAP modelto approximate a dynamic process in which the world’s economies change over time;Hertel et al., however, used the dynamic variant of the GTAP model. Scollay andGilbert used the model documented in Rutherford (1998), which has the sametheoretical foundations as the GTAP model.45 Brown et al. used the Michigan model,which is different from the aforementioned models in two important aspects.46 First,the Michigan model views agriculture as a perfectly competitive sector and all othersectors as monopolistically competitive sectors (due to increasing returns to scale) withfree entry and exit of firms. Second, the Michigan model introduces productdifferentiation employing the love of variety approach, which assumes that eachconsumer has a demand for multiple varieties of a product. One of the differencesbetween the love of variety approach and the Armington approach in modelingproduct differentiation is that under the love of variety approach a policy change thatinduces increased variety is welfare enhancing.47
44 T.W. Hertel (ed.), Global Trade Analysis: Modeling and Applications (Cambridge: CambridgeUniversity Press), 1997.
45 Thomas F. Rutherford, “GTAP in GAMS: The Database and Static Model,” University of Coloradoat Boulder, photocopy, Oct. 23, 1998.
46 A complete description of the formal structure and equations of the Michigan model can be foundonline at http://www.Fordschool.umich.edu/rsie/model/.
47 An example of this would be restaurant meals. Most consumers who eat out frequently also willswitch between restaurants, one day eating at a Chinese restaurant, another day at a Mexicanrestaurant, etc. If all consumers share the same love of variety then the aggregate market will sustaindemand for many varieties of goods simultaneously. If a utility function is specified that incorporates alove of variety, then the well-being of any consumer is greater the larger the number of varieties of goodsavailable. Thus, in this case, the consumers would prefer to have twenty varieties to choose betweenrather than ten.
50
In terms of economic data, all four studies relied on information provided by GTAP; thedata versions and base years, however, are different and each study made an effortto incorporate more recent information regarding either economic linkages orpolicies. Figure 4-1 summarizes the welfare impacts for FTA partners from Scollay andGilbert, Brown et al., Hertel et al. and the current Commission study. As shown inFigure 4-1, the current Commission study estimated the welfare impact on the UnitedStates of tariff liberalization under a U.S.-Singapore FTA to range between a negative0.002 percent of U.S. GDP to less than a negative 0.001 percent of U.S. GDP (seechapter 5); Scollay and Gilbert estimated the welfare impact on the United States to beless than one hundredth of a percentage point of GDP. The estimated impact in bothstudies reflects the removal of tariffs only, as data limitations did not allow substantivetreatment of other nontariff barriers. When Hertel et al. simulate a Japan-SingaporeFTA considering only the removal of tariffs, they find a negative 0.002 percent welfareimpact for Japan; the welfare impact for Singapore is 0.09 percent. These areexpected outcomes for both the United States and Japan because, besides being largeeconomies, their trade with Singapore is small and with Singapore being relatively anopen economy, its imports are not expected to increase significantly due to tariffremoval under an FTA.
Hertel et al. extend their computational analysis of a Japan-Singapore FTA to firstinclude services liberalization and then to e-commerce liberalization. As shown infigure 4-1, Hertel et al. find that the welfare impact of the FTA for Japan increases to0.003 percent and then to 0.01 percent of GDP. However, when modernization ofcustoms clearance procedures for Japan is included in the specification of the FTA,Hertel et al. find that the welfare impact for Japan increases to 0.16 percent of GDP.
Brown et al. assess a variety of potential multilateral, regional, and bilateral tradeagreements, including services liberalization in their analysis.48 As shown in figure4-1, Brown et al. estimated the welfare impact on the United States of a U.S.-SingaporeFTA to be 0.19 percent of GDP, which is larger than the estimates found in Scollay andGilbert and in this Commission study. Due to Brown et al.’s different assumptionsregarding imperfect competition, and product differentiation as well as itsspecification of services liberalization, it is difficult to identify the factors that areresponsible for generating larger welfare impacts for the United States.
In summary, the current Commission study reaches similar conclusions regarding thewelfare impact of tariff removal under a U.S.-Singapore FTA as Scollay and Gilbertdo; and the Hertel et al. study illustrates that the magnitude of the potential economicimpact of an FTA depends on the degree to which nontariff aspects of an FTA can bequantified.
48 Brown et al. rely on Hoekman’s work for specifying services liberalization (see B. Hoekman, “TheNext Round of Services Negotiations: Identifying Priorities and Options,” Federal Reserve Bank of St.Louis Review, July/August 2000, pp. 31-47). Hoekman’s work suggests that U.S. barriers on services aresignificant and larger than those for Singapore. The assessment reached in Chapter 6 of this report,however, suggests that the U.S.-Singapore FTA will have little impact on U.S. trade in services withSingapore, primarily because the U.S. and Singapore markets have relatively few barriers.
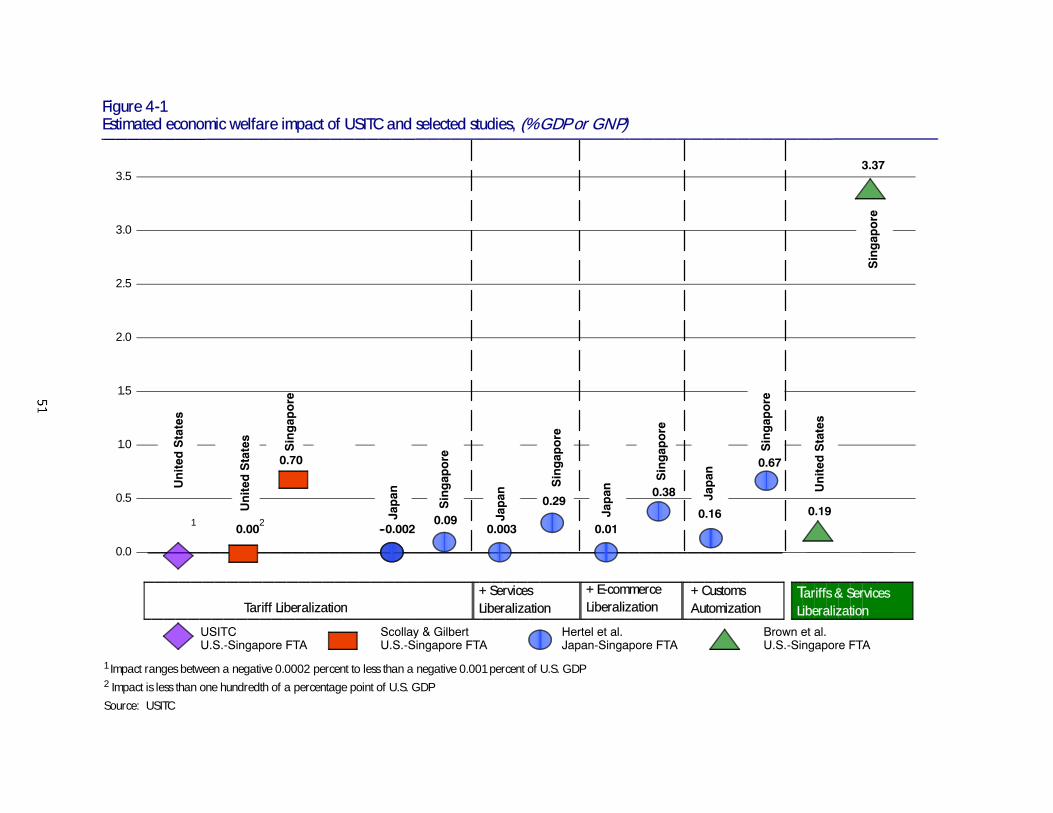
0.0
0.5
1.0
1.5
2.0
2.5
3.0
3.5
Figure 4-1Estimated economic welfare impact of USITC and selected studies, (% GDP or GNP)
Tariff Liberalization+ ServicesLiberalization
+ E-commerceLiberalization
+ CustomsAutomization
Tariffs & ServicesLiberalization
Scollay & GilbertU.S.-Singapore FTA
Hertel et al.Japan-Singapore FTA
USITCU.S.-Singapore FTA
Brown et al.U.S.-Singapore FTA
Singapore
0.00 --0.002 0.003 0.010.09
0.38
0.16
0.67
0.19
3.37
Singapore
Singapore
Singapore
United
States
Japan
Singapore
Japan 0.29
Singapore
Japan Japan
United
States
1
1 Impact ranges between a negative 0.0002 percent to less than a negative 0.001 percent of U.S. GDP2 Impact is less than one hundredth of a percentage point of U.S. GDP
Source: USITC
0.70
United
States
2


53
CHAPTER 5Impact of Eliminating Tariffs
Introduction
This chapter investigates the likely economic effects of a preferential elimination oftariffs between the United States and Singapore. To do so, a computable generalequilibrium (CGE) model and its corresponding data are used to illustrate the possibleeffects on a number of economic measures, including the volume of trade in goods andservices between the two countries and, for the United States, economic welfare andGDP, sectoral output, wages, and employment across industry sectors, and the finalprices paid by consumers.1
The U.S.-Singapore FTA provides broader trade liberalization than captured in thischapter which focuses only on the effect of the removal of tariffs. The implications ofother important provisions of the FTA are discussed in Chapter 6 (services), Chapter 7(intellectual property rights), and in Chapter 8 (investment). The total impact of all theprovisions found in the FTA is the whole of the conclusions reached in this chapter aswell as in chapters 6, 7, and 8.
As was stated in chapter 2, the proposed tariff cuts will be phased into effect over atransitional period of 12 years for the United States.2 In order to take this timedimension into account, the Commission’s modeling efforts included a number ofspecific adjustments to the standard modeling procedures. The model used in this studyallows the Commission to assess the likely effects of a multiple stage phase-in of tariffcuts, and to include an explicit time dimension in the assessment.
Summary of Findings
The Commission found that after full implementation of the tariff cuts scheduled in theU.S.-Singapore FTA, U.S. exports to Singapore would be 0.5 to 1.1 percent higher,while U.S. imports from Singapore would be about 3.8 to 10.5 percent higher. Relative
1 Economic simulation models, such as the one used here, are useful tools in addressing questionssuch as the economic effects of trade agreements. Such models reflect key economic and traderelationships in the U.S. and world economy and they help to organize analysis. Model results should beinterpreted as illustrative as to what might occur given the assumptions of the model and the focus ontrade-related changes. Economic, political, and natural events unrelated to the trade agreement shouldalso be expected to affect the economic variables of interest to this study.
2 Singapore will eliminate all customs duties upon entry-into-force of the Agreement.
54
to total U.S. trade, these changes are small with total U.S. imports and exportspotentially increasing by 0.02 to 0.05 percent. At the sectoral level, the estimatedimpacts are relatively large for those sectors with high initial tariffs. Given thatSingapore has very few tariffs, the impact of the tariff cuts on U.S. exports toSingapore is expected to be small with the largest increases in vegetables and fruits(27.4 to 58.4 percent), meats (27.5 to 59.7 percent), dairy products (21.6 to 45.8percent), and other processed foods (13.7 to 30.6 percent). U.S. imports fromSingapore would increase by more than 100 percent (albeit from small bases) fordairy products, textiles, apparel, and leather products, sugar manufacturing, andother crops. The estimated impacts on U.S. imports are largely driven by the removal ofrelative large tariffs and tariff equivalents: dairy products (34.8 percent), textiles andapparel (15.0 percent), sugar manufacturing (43.8 percent), and other crops (17.5percent).3 In the case of textiles, apparel, and leather products, rules of originprovisions in the FTA would limit the impact of tariff elimination.
Preferential tariff liberalization has a minimal impact on U.S. production. The textiles,apparel, and leather products sector–the most affected sector–is estimated to shrink by0.03 to 0.12 percent in the United States. U.S. output of vegetables and fruits isprojected to increase by 0.04 to 0.07 percent.
As it is suggested by the small sectoral impacts discussed above, welfare analysisshows that following the reciprocal tariff elimination in the U.S.-Singapore FTA, theeconomic welfare and GDP impacts for the United States range between a negative0.002 percent of U.S. GDP to less than a negative 0.001 percent of U.S. GDP.4
General Equilibrium Analysis
Database and AggregationThe GTAP modeling framework, which serves as a basis for the present analysis,consists of a comparative static computable general equilibrium (CGE) model and aglobal database on domestic markets and international trade.5 In addition to the data
3 In the case of the services sector, the agreement does not contain liberalization that could beanalytically captured in this general equilibrium analysis. Furthermore, the impacts estimated in thisreport reflect only the removal of tariffs (and to a lesser extent some TRQs for food and agriculturalproducts); other effects, such as those of the removal of nontariff trade measures, investment restrictions,or the easing of customs procedures, are not quantified.
4 The magnitudes of the estimated FTA impacts in this report are similar to those in a report by Scollayand Gilbert (2001) which is reviewed in chapter 4 (Robert Scollay and John P. Gilbert, New RegionalTrading Arrangements in the Asia Pacific?, Policy Analyses in International Economics No. 63,Washington, D.C., Institute For International Economics, May 2001).
5 For additional information, see T.W. Hertel, ed., Global Trade Analysis: Modeling andApplications, Cambridge: Cambridge University Press, 1997, and Betina V. Dimaranan and Robert A.McDougall, Global Trade, Assistance, and Production: The GTAP 5 Data Base, Center for Global TradeAnalysis, Purdue University, 2002.
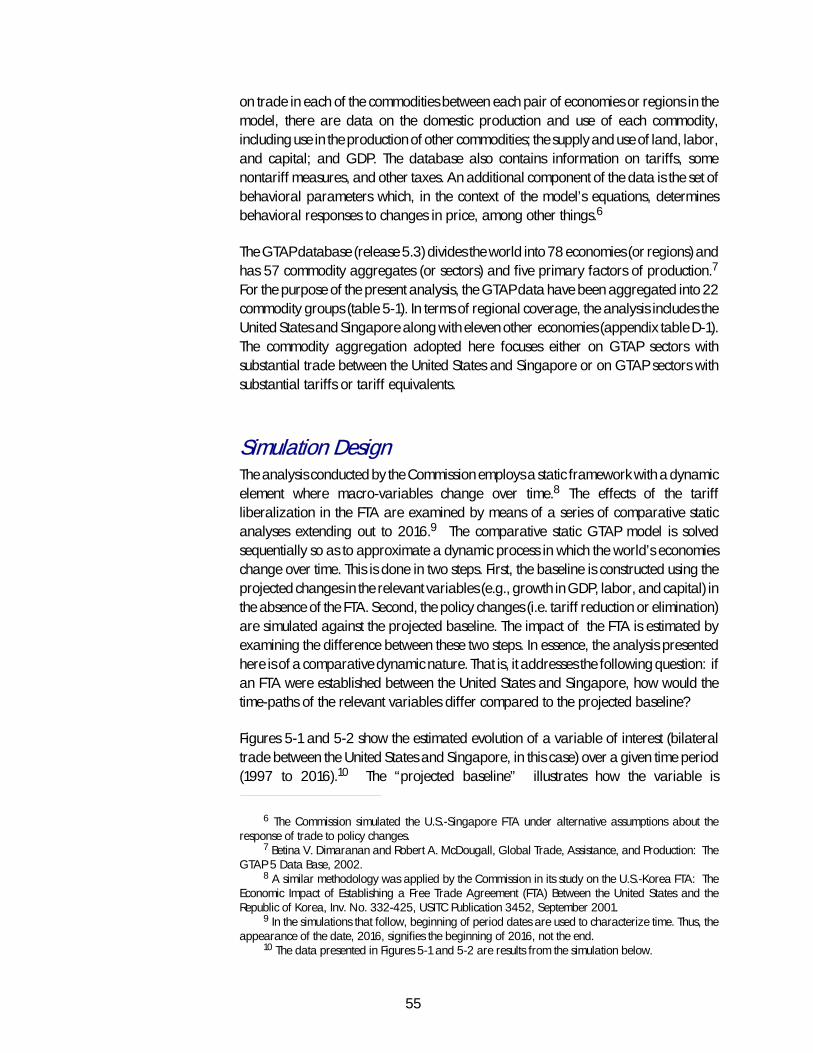
55
on trade in each of the commodities between each pair of economies or regions in themodel, there are data on the domestic production and use of each commodity,including use in the production of other commodities; the supply and use of land, labor,and capital; and GDP. The database also contains information on tariffs, somenontariff measures, and other taxes. An additional component of the data is the set ofbehavioral parameters which, in the context of the model’s equations, determinesbehavioral responses to changes in price, among other things.6
The GTAP database (release 5.3) divides the world into 78 economies (or regions) andhas 57 commodity aggregates (or sectors) and five primary factors of production.7
For the purpose of the present analysis, the GTAP data have been aggregated into 22commodity groups (table 5-1). In terms of regional coverage, the analysis includes theUnited States and Singapore along with eleven other economies (appendix table D-1).The commodity aggregation adopted here focuses either on GTAP sectors withsubstantial trade between the United States and Singapore or on GTAP sectors withsubstantial tariffs or tariff equivalents.
Simulation DesignThe analysis conducted by the Commission employs a static framework with a dynamicelement where macro-variables change over time.8 The effects of the tariffliberalization in the FTA are examined by means of a series of comparative staticanalyses extending out to 2016.9 The comparative static GTAP model is solvedsequentially so as to approximate a dynamic process in which the world’s economieschange over time. This is done in two steps. First, the baseline is constructed using theprojected changes in the relevant variables (e.g., growth in GDP, labor, and capital) inthe absence of the FTA. Second, the policy changes (i.e. tariff reduction or elimination)are simulated against the projected baseline. The impact of the FTA is estimated byexamining the difference between these two steps. In essence, the analysis presentedhere is of a comparative dynamic nature. That is, it addresses the following question: ifan FTA were established between the United States and Singapore, how would thetime-paths of the relevant variables differ compared to the projected baseline?
Figures 5-1 and 5-2 show the estimated evolution of a variable of interest (bilateraltrade between the United States and Singapore, in this case) over a given time period(1997 to 2016).10 The “projected baseline” illustrates how the variable is
6 The Commission simulated the U.S.-Singapore FTA under alternative assumptions about theresponse of trade to policy changes.
7 Betina V. Dimaranan and Robert A. McDougall, Global Trade, Assistance, and Production: TheGTAP 5 Data Base, 2002.
8 A similar methodology was applied by the Commission in its study on the U.S.-Korea FTA: TheEconomic Impact of Establishing a Free Trade Agreement (FTA) Between the United States and theRepublic of Korea, Inv. No. 332-425, USITC Publication 3452, September 2001.
9 In the simulations that follow, beginning of period dates are used to characterize time. Thus, theappearance of the date, 2016, signifies the beginning of 2016, not the end.
10 The data presented in Figures 5-1 and 5-2 are results from the simulation below.

56
Table 5-1GTAP database: Commodity aggregationCommodity
FishingForestryGrainsSugar cropsVegetables, fruits, and nutsOther cropsLivestockCoal, oil, gas, and other mineralsMeat productsDairy productsSugar manufacturingOther processed food and tobacco productsTextiles, wearing apparel, and leather productsWood productsPetroleum, coal, chemical, rubber, plastic products, and other mineral productsFerrous metalsMetals n.e.c. and metal productsMotor vehicles and parts and other transportation equipmentElectronic equipmentOther machinery and equipmentOther manufacturesServices
Sources: Compiled from the GTAP database.
60
80
100
120
140
160
Years
Figure 5-1U.S. exports to Singapore (1997 = 100)
Source: GTAP simulation and USITC calculations.
Percentage Baseline U.S.-Singapore FTA
1997 2001 2004 2008 2012 2016
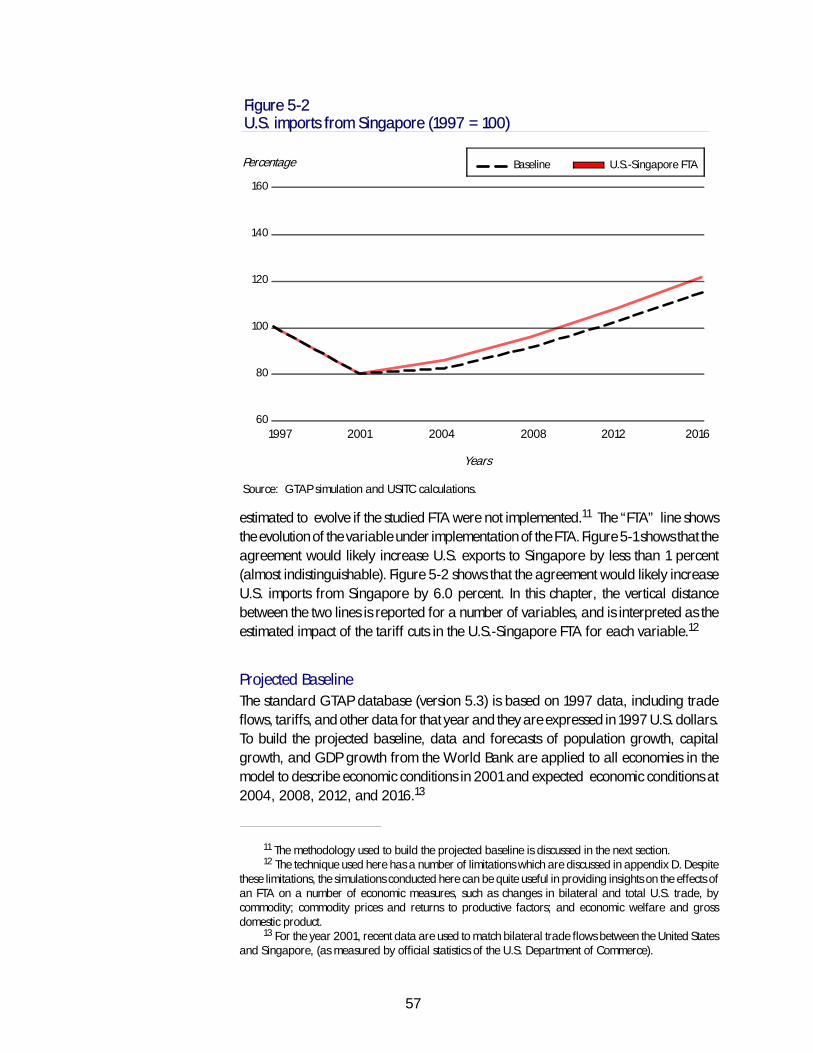
57
60
80
100
120
140
160
Years
Figure 5-2U.S. imports from Singapore (1997 = 100)
Source: GTAP simulation and USITC calculations.
Percentage Baseline U.S.-Singapore FTA
1997 2001 2004 2008 2012 2016
estimated to evolve if the studied FTA were not implemented.11 The “FTA” line showsthe evolution of the variable under implementation of the FTA. Figure 5-1 shows that theagreement would likely increase U.S. exports to Singapore by less than 1 percent(almost indistinguishable). Figure 5-2 shows that the agreement would likely increaseU.S. imports from Singapore by 6.0 percent. In this chapter, the vertical distancebetween the two lines is reported for a number of variables, and is interpreted as theestimated impact of the tariff cuts in the U.S.-Singapore FTA for each variable.12
Projected BaselineThe standard GTAP database (version 5.3) is based on 1997 data, including tradeflows, tariffs, and other data for that year and they are expressed in 1997 U.S. dollars.To build the projected baseline, data and forecasts of population growth, capitalgrowth, and GDP growth from the World Bank are applied to all economies in themodel to describe economic conditions in 2001 and expected economic conditions at2004, 2008, 2012, and 2016.13
11 The methodology used to build the projected baseline is discussed in the next section.12 The technique used here has a number of limitations which are discussed in appendix D. Despite
these limitations, the simulations conducted here can be quite useful in providing insights on the effects ofan FTA on a number of economic measures, such as changes in bilateral and total U.S. trade, bycommodity; commodity prices and returns to productive factors; and economic welfare and grossdomestic product.
13 For the year 2001, recent data are used to match bilateral trade flows between the United Statesand Singapore, (as measured by official statistics of the U.S. Department of Commerce).

58
In addition to the growth data, for each of the four time intervals comprising theprojected baseline, the protection database is adjusted to reflect the phasing-in of thetrade policy measures ratified under the Agreements on Agriculture and on Textilesand Clothing (ATC) of the Uruguay Round. Thus, economic conditions in 2001 reflectreductions in export subsidies and import tariffs for food and agricultural products andexpansion of quotas for textiles and clothing agreed to in the Uruguay Round;14 thedata for the year 2004 reflect further reductions in trade policies for food andagricultural products on the part of developing countries and removal of theremaining quotas for textiles and clothing. Table 5-2 shows the tariff rates and tariffequivalents for the two countries for the year 2004 along with the relevant trade flowsafter the above adjustments have been implemented. It is noted that both countriesalready have relatively open trade regimes prior to the implementation of theagreement. In Singapore, U.S. exports enter duty free except for fruits and vegetables,meats, dairy, and other processed foods. In the United States, Singapore’s exportsface substantial tariffs in a number of sectors, including sugar, dairy products, othercrops; and textiles and apparel products.15
Policy ExperimentThe next step is to determine the policy experiments–or the shocks–that would reflectthe staged tariff liberalization during the transitional period. The length of thisphase-in period is 12 years for the United States, while it is immediate for Singapore.The Commission examined the impact of the provisions that would be in effect in thefirst year of the agreement (2004), fourth year (2008), eighth year (2012) and fullimplementation (2016). For the 22 commodity sectors and for each of the four stages,table 5-3 reports the weighted average share of the initial tariff that will remain aftereach stage of the analysis. For example, the initial U.S. tariff cuts will include anaverage tariff cut of 12 percent on vegetables, fruits and nuts, leaving U.S. tariffs at 88percent of their initial MFN level, and an average tariff cut of 17 percent on textiles andapparel, leaving U.S. tariffs at 83 percent of their initial MFN level. It should be pointedout that, for textiles and apparel, the analysis in this chapter does not fully capture therestrictiveness of the yarn forward rules of origin under the FTA. Hence, the resultsreported here should be considered as upper-bound. A more detailed analysis of theFTA effects on the textile and apparel sector, taking into account the rules of origin, ispresented in Chapter 6.
In the case of the services sector, the agreement does not contain liberalization whichcould be accounted for in this general equilibrium analysis.16 Other studies cited in
14 Regarding textiles and clothing, the textiles and clothing quotas are modeled in the GTAPdatabase as an export tax; to model the expansion and then the removal of those quotas, the relevantexport taxes are reduced by about 16 percent in 2001 and 2004; the remaining (about 70 percent) exporttaxes are removed completely in 2005 (captured by 2008 in the present framework).
15 The estimate of the U.S. import tariff on textiles, apparel, and leather products does not include thedirect price impact of quotas for textiles and apparel. In the GTAP data the impact of those quotas ismodeled as an export tax on U.S. imports of textiles and apparel from Singapore.
16 This distinguishes the current report from other studies of “hypothetical” FTAs that include theeffects of services liberalization. See, for example, Drusilla Brown, Alan V. Deardorff, and Robert M.Stern, “Multilateral, Regional, and Bilateral Trade-Policy Options for the United States and Japan,”
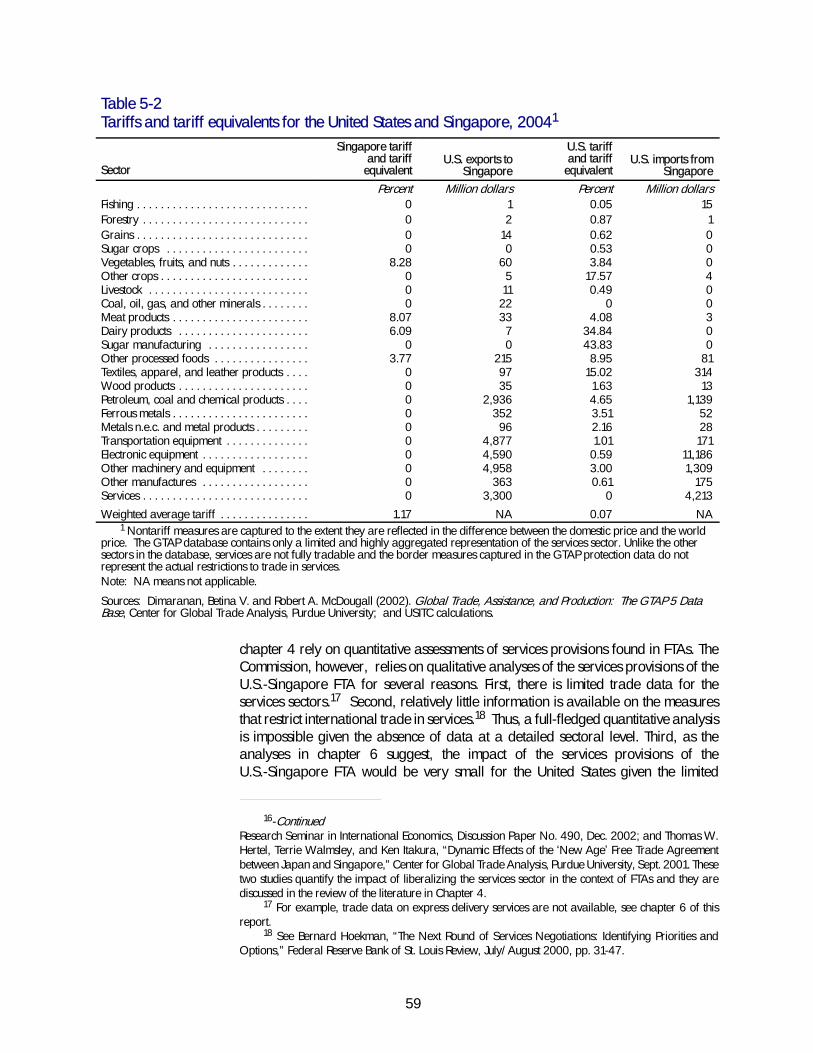
59
Table 5-2Tariffs and tariff equivalents for the United States and Singapore, 20041
Sector
Singapore tariffand tariff
equivalentU.S. exports to
Singapore
U.S. tariffand tariff
equivalentU.S. imports from
SingaporePercent Million dollars Percent Million dollars
Fishing . . . . . . . . . . . . . . . . . . . . . . . . . . . . . 0 1 0.05 15Forestry . . . . . . . . . . . . . . . . . . . . . . . . . . . . 0 2 0.87 1Grains . . . . . . . . . . . . . . . . . . . . . . . . . . . . . 0 14 0.62 0Sugar crops . . . . . . . . . . . . . . . . . . . . . . . . 0 0 0.53 0Vegetables, fruits, and nuts . . . . . . . . . . . . . 8.28 60 3.84 0Other crops . . . . . . . . . . . . . . . . . . . . . . . . . 0 5 17.57 4Livestock . . . . . . . . . . . . . . . . . . . . . . . . . . . 0 11 0.49 0Coal, oil, gas, and other minerals . . . . . . . . 0 22 0 0Meat products . . . . . . . . . . . . . . . . . . . . . . . 8.07 33 4.08 3Dairy products . . . . . . . . . . . . . . . . . . . . . . 6.09 7 34.84 0Sugar manufacturing . . . . . . . . . . . . . . . . . 0 0 43.83 0Other processed foods . . . . . . . . . . . . . . . . 3.77 215 8.95 81Textiles, apparel, and leather products . . . . 0 97 15.02 314Wood products . . . . . . . . . . . . . . . . . . . . . . 0 35 1.63 13Petroleum, coal and chemical products . . . . 0 2,936 4.65 1,139Ferrous metals . . . . . . . . . . . . . . . . . . . . . . . 0 352 3.51 52Metals n.e.c. and metal products . . . . . . . . . 0 96 2.16 28Transportation equipment . . . . . . . . . . . . . . 0 4,877 1.01 171Electronic equipment . . . . . . . . . . . . . . . . . . 0 4,590 0.59 11,186Other machinery and equipment . . . . . . . . 0 4,958 3.00 1,309Other manufactures . . . . . . . . . . . . . . . . . . 0 363 0.61 175Services . . . . . . . . . . . . . . . . . . . . . . . . . . . . 0 3,300 0 4,213
Weighted average tariff . . . . . . . . . . . . . . . 1.17 NA 0.07 NA1 Nontariff measures are captured to the extent they are reflected in the difference between the domestic price and the world
price. The GTAP database contains only a limited and highly aggregated representation of the services sector. Unlike the othersectors in the database, services are not fully tradable and the border measures captured in the GTAP protection data do notrepresent the actual restrictions to trade in services.Note: NA means not applicable.
Sources: Dimaranan, Betina V. and Robert A. McDougall (2002). Global Trade, Assistance, and Production: The GTAP 5 DataBase, Center for Global Trade Analysis, Purdue University; and USITC calculations.
chapter 4 rely on quantitative assessments of services provisions found in FTAs. TheCommission, however, relies on qualitative analyses of the services provisions of theU.S.-Singapore FTA for several reasons. First, there is limited trade data for theservices sectors.17 Second, relatively little information is available on the measuresthat restrict international trade in services.18 Thus, a full-fledged quantitative analysisis impossible given the absence of data at a detailed sectoral level. Third, as theanalyses in chapter 6 suggest, the impact of the services provisions of theU.S.-Singapore FTA would be very small for the United States given the limited
16-ContinuedResearch Seminar in International Economics, Discussion Paper No. 490, Dec. 2002; and Thomas W.Hertel, Terrie Walmsley, and Ken Itakura, “Dynamic Effects of the ‘New Age’ Free Trade Agreementbetween Japan and Singapore,” Center for Global Trade Analysis, Purdue University, Sept. 2001. Thesetwo studies quantify the impact of liberalizing the services sector in the context of FTAs and they arediscussed in the review of the literature in Chapter 4.
17 For example, trade data on express delivery services are not available, see chapter 6 of thisreport.
18 See Bernard Hoekman, “The Next Round of Services Negotiations: Identifying Priorities andOptions,” Federal Reserve Bank of St. Louis Review, July/August 2000, pp. 31-47.
60
Table 5-3U.S. schedule for tariff liberalization
Percent remaining of initial average MFN tariffSector 2004 2008 2012 2016
Fishing . . . . . . . . . . . . . . . . . . . . . . . . . 0.00 0.00 0.00 0.00Forestry . . . . . . . . . . . . . . . . . . . . . . . . 0.00 0.00 0.00 0.00Grains . . . . . . . . . . . . . . . . . . . . . . . . . 0.00 0.00 0.00 0.00Sugar crops . . . . . . . . . . . . . . . . . . . . 0.00 0.00 0.00 0.00Vegetables, fruits, and nuts . . . . . . . . . 88.77 59.18 19.73 0.00Other crops . . . . . . . . . . . . . . . . . . . . . 56.15 0.00 0.00 0.00Livestock . . . . . . . . . . . . . . . . . . . . . . . 0.00 0.00 0.00 0.00Coal, oil, gas, and other minerals . . . . 0.00 0.00 0.00 0.00Meat products . . . . . . . . . . . . . . . . . . . 0.00 0.00 0.00 0.00Dairy products . . . . . . . . . . . . . . . . . . 0.00 0.00 0.00 0.00Sugar manufacturing . . . . . . . . . . . . . 0.00 0.00 0.00 0.00Other foods . . . . . . . . . . . . . . . . . . . . . 71.85 21.14 6.68 0.00Textiles, apparel and leather products1 82.93 55.26 18.42 0.00Wood products . . . . . . . . . . . . . . . . . . 66.52 0.00 0.00 0.00Petroleum, coal and chemical products 4.30 0.46 0.06 0.00Ferrous metals . . . . . . . . . . . . . . . . . . . 45.95 0.00 0.00 0.00Metals n.e.c. and metal products . . . . . 0.42 0.07 0.00 0.00Transportation equipment . . . . . . . . . . 0.56 0.20 0.00 0.00Electronic equipment . . . . . . . . . . . . . . 5.38 0.49 0.00 0.00Other machinery and equipment . . . . 17.58 0.12 0.00 0.00Other manufactures . . . . . . . . . . . . . . 32.61 2.83 0.00 0.00Services2 . . . . . . . . . . . . . . . . . . . . . . . NA NA NA NA
1 The analysis in this chapter does not fully capture the restrictiveness of the yarn forward rulesof origin under the FTA. Hence, the results reported here should be considered as upper-bound.A more detailed analysis of the FTA effects, taking into account the rules of origin, is presented inChapter 6.
2 Unlike the other sectors in the GTAP database, services are not fully tradable and the bordermeasures captured in the GTAP protection data do not fully represent the actual restrictions totrade in services. Additionally, the agreement does not contain substantial service liberalizationthat could be captured in this type of analysis.NOTE: NA means not applicable.Source: USTR and USITC calculations.
restrictions in place. It is likely that the U.S.-Singapore FTA provides broader tradeliberalization than captured in the Commission’s analysis. Chapters 6, 7, and 8provide qualitative analyses of the likely impact of the measures with respect toselected sectors, intellectual property rights, and investment that are included in theagreement but not captured here.
Simulation ResultsGenerally, the results of the type of analytical exercise conducted in this chapterdepend on many parameters that are included in the model (e.g., responseparameters or projected baseline). Given the ex-ante or forward-looking nature of theanalysis, there is no presumption as to the exact levels of those parameters. Hence, inan effort to capture the different possibilities regarding the state of the world when theFTA is fully implemented, the Commission has conducted a series of simulations using
61
different assumptions regarding (1) the relative growth of the U.S. economy and,19 (2)the economies’ responsiveness to changes in trade policies.20
Given the different dimensions of the analysis and the varying assumptions, this sectionpresents the ranges of the likely impact of the tariff cuts in the U.S.-Singapore FTA onselected economic aggregates: trade flows, sectoral output, wages and employmentacross industry sectors, final prices paid by consumers, GDP, and welfare. Thereported results correspond to the full implementation (year 12) of the agreement.Appendix D (tables D-2 to D-4) presents the likely impact of the tariff cut provisions thatwould be in effect in the first year of the agreement, mid-implementation (year 4 andyear 8) as well as full implementation.
Trade VolumesTrade agreements are generally designed to increase trade flows between theparticipating economies. Indeed, the results of the general equilibrium analysissuggest that U.S.-Singapore bilateral trade would increase, albeit slightly, as a resultof the FTA. The general equilibrium analysis indicates that following the fullimplementation of a U.S.-Singapore FTA, U.S. exports to Singapore would increaseslightly by as much as 1.1 percent (table 5-4), while U.S. imports from Singapore couldincrease by 10.5 percent (table 5-5). The U.S. trade balance with Singapore would bearound $1.3 billion smaller than if the bilateral tariffs have not been removed.21 GivenSingapore’s size relative to the United States and the low level of tariffs between thetwo countries, the impact of the tariff cuts on total U.S. trade is minuscule. In fact, U.S.exports and imports are estimated to increase by less that one tenth of a onepercentage point.
The bulk of the trade response to FTAs are generally concentrated in sectors facingrelatively large tariffs, because the FTA-led market access improvement tends to bemore important in those sectors. Given that Singapore has very few tariffs, the impactof the tariff cuts on U.S. exports to Singapore is estimated to be very small (table 5-4).The only notable potential increases are in vegetables and fruits (58 percent), meats(60 percent), dairy products (46 percent), and other processed foods (31 percent).
19 The Commission varied annual U.S. growth rates for the period 2004-16 from 20 percent lowerthan the standard World Bank projection to 20 percent higher.
20 In the GTAP model, the responsiveness to trade policy changes is captured by the Armingtonelasticities of substitution. The default values for these elasticities are based on reviews of the econometricliterature. In this study, the Commission considered a range of the elasticities between a power oftwo-thirds and three-halves of their default GTAP values. For a discussion of the Armington assumptionand parameters in the CGE model used in this report, see chapters 2 and 4 in T. W. Hertel, ed., GlobalTrade Analysis: Modeling and Applications, Cambridge: Cambridge University Press, 1997.
21 In the general equilibrium model, and absent net interest payments from abroad, changes in thetrade balance (i.e., exports less imports) are equal to changes in national savings less investment (i.e., thecapital balance). Furthermore, global savings (which are not expected to change much due to the FTA)determine the global availability of investment funds. The regional distribution of those investment funds,however, is expected to change because capital productivity would change across economies due to theFTA (for additional discussion of the macroeconomic closure, see chapter 2, pp. 52-54 in T. W. Hertel,ed., Global Trade Analysis: Modeling and Applications, Cambridge: Cambridge University Press,1997). In this case, the FTA causes an increase in investment in the United States and Singapore, whichcauses a deterioration in the trade balance in the United States and Singapore.
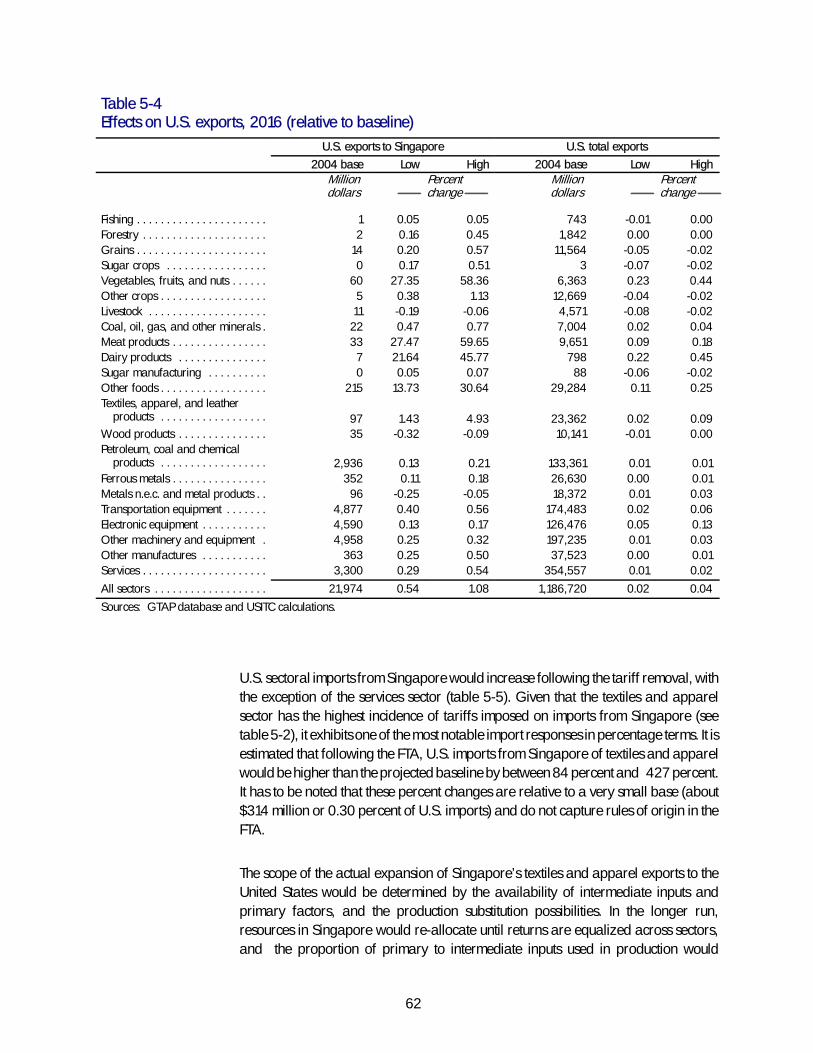
62
Table 5-4Effects on U.S. exports, 2016 (relative to baseline)
U.S. exports to Singapore U.S. total exports2004 base Low High 2004 base Low High
Milliondollars
Milliondollars
Percentchange
Percentchange
Fishing . . . . . . . . . . . . . . . . . . . . . . 1 0.05 0.05 743 -0.01 0.00Forestry . . . . . . . . . . . . . . . . . . . . . 2 0.16 0.45 1,842 0.00 0.00Grains . . . . . . . . . . . . . . . . . . . . . . 14 0.20 0.57 11,564 -0.05 -0.02Sugar crops . . . . . . . . . . . . . . . . . 0 0.17 0.51 3 -0.07 -0.02Vegetables, fruits, and nuts . . . . . . 60 27.35 58.36 6,363 0.23 0.44Other crops . . . . . . . . . . . . . . . . . . 5 0.38 1.13 12,669 -0.04 -0.02Livestock . . . . . . . . . . . . . . . . . . . . 11 -0.19 -0.06 4,571 -0.08 -0.02Coal, oil, gas, and other minerals . 22 0.47 0.77 7,004 0.02 0.04Meat products . . . . . . . . . . . . . . . . 33 27.47 59.65 9,651 0.09 0.18Dairy products . . . . . . . . . . . . . . . 7 21.64 45.77 798 0.22 0.45Sugar manufacturing . . . . . . . . . . 0 0.05 0.07 88 -0.06 -0.02Other foods . . . . . . . . . . . . . . . . . . 215 13.73 30.64 29,284 0.11 0.25Textiles, apparel, and leather
products . . . . . . . . . . . . . . . . . . 97 1.43 4.93 23,362 0.02 0.09Wood products . . . . . . . . . . . . . . . 35 -0.32 -0.09 10,141 -0.01 0.00Petroleum, coal and chemical
products . . . . . . . . . . . . . . . . . . 2,936 0.13 0.21 133,361 0.01 0.01Ferrous metals . . . . . . . . . . . . . . . . 352 0.11 0.18 26,630 0.00 0.01Metals n.e.c. and metal products . . 96 -0.25 -0.05 18,372 0.01 0.03Transportation equipment . . . . . . . 4,877 0.40 0.56 174,483 0.02 0.06Electronic equipment . . . . . . . . . . . 4,590 0.13 0.17 126,476 0.05 0.13Other machinery and equipment . 4,958 0.25 0.32 197,235 0.01 0.03Other manufactures . . . . . . . . . . . 363 0.25 0.50 37,523 0.00 0.01Services . . . . . . . . . . . . . . . . . . . . . 3,300 0.29 0.54 354,557 0.01 0.02
All sectors . . . . . . . . . . . . . . . . . . . 21,974 0.54 1.08 1,186,720 0.02 0.04
Sources: GTAP database and USITC calculations.
U.S. sectoral imports from Singapore would increase following the tariff removal, withthe exception of the services sector (table 5-5). Given that the textiles and apparelsector has the highest incidence of tariffs imposed on imports from Singapore (seetable 5-2), it exhibits one of the most notable import responses in percentage terms. It isestimated that following the FTA, U.S. imports from Singapore of textiles and apparelwould be higher than the projected baseline by between 84 percent and 427 percent.It has to be noted that these percent changes are relative to a very small base (about$314 million or 0.30 percent of U.S. imports) and do not capture rules of origin in theFTA.
The scope of the actual expansion of Singapore’s textiles and apparel exports to theUnited States would be determined by the availability of intermediate inputs andprimary factors, and the production substitution possibilities. In the longer run,resources in Singapore would re-allocate until returns are equalized across sectors,and the proportion of primary to intermediate inputs used in production would
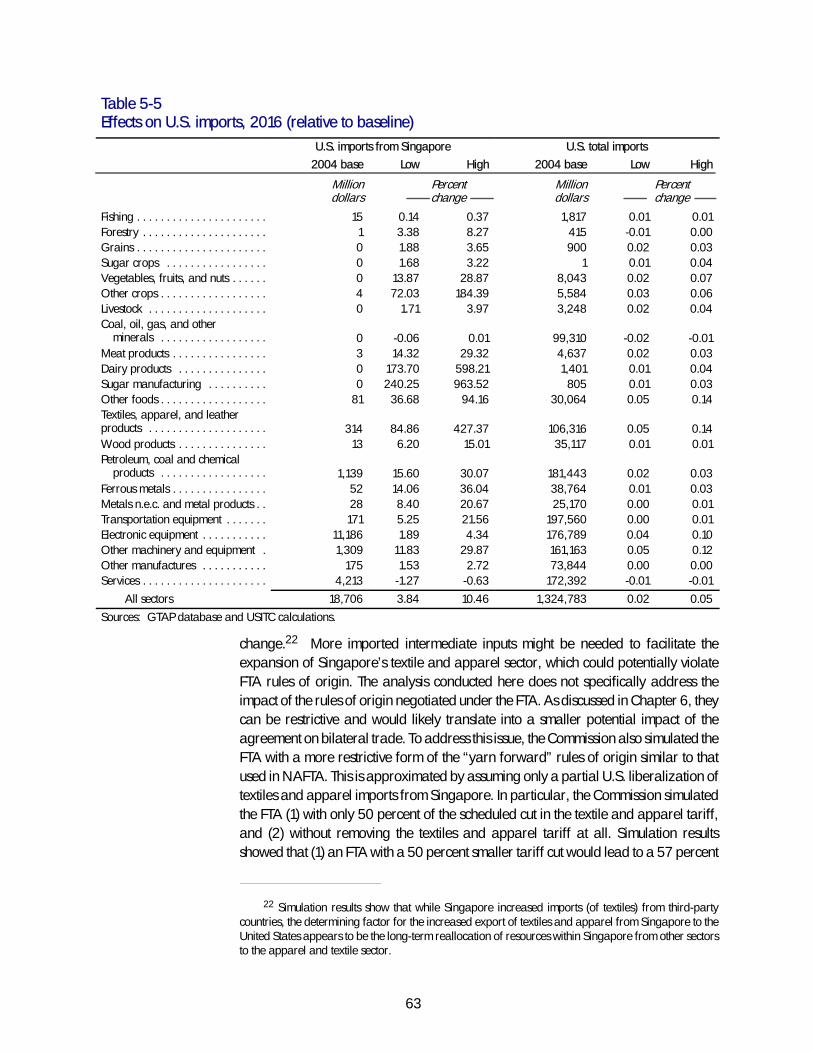
63
Table 5-5Effects on U.S. imports, 2016 (relative to baseline)
U.S. imports from Singapore U.S. total imports2004 base Low High 2004 base Low High
Milliondollars
Milliondollars
Percentchange
Percentchange
Fishing . . . . . . . . . . . . . . . . . . . . . . 15 0.14 0.37 1,817 0.01 0.01Forestry . . . . . . . . . . . . . . . . . . . . . 1 3.38 8.27 415 -0.01 0.00Grains . . . . . . . . . . . . . . . . . . . . . . 0 1.88 3.65 900 0.02 0.03Sugar crops . . . . . . . . . . . . . . . . . 0 1.68 3.22 1 0.01 0.04Vegetables, fruits, and nuts . . . . . . 0 13.87 28.87 8,043 0.02 0.07Other crops . . . . . . . . . . . . . . . . . . 4 72.03 184.39 5,584 0.03 0.06Livestock . . . . . . . . . . . . . . . . . . . . 0 1.71 3.97 3,248 0.02 0.04Coal, oil, gas, and other
minerals . . . . . . . . . . . . . . . . . . 0 -0.06 0.01 99,310 -0.02 -0.01Meat products . . . . . . . . . . . . . . . . 3 14.32 29.32 4,637 0.02 0.03Dairy products . . . . . . . . . . . . . . . 0 173.70 598.21 1,401 0.01 0.04Sugar manufacturing . . . . . . . . . . 0 240.25 963.52 805 0.01 0.03Other foods . . . . . . . . . . . . . . . . . . 81 36.68 94.16 30,064 0.05 0.14Textiles, apparel, and leatherproducts . . . . . . . . . . . . . . . . . . . . 314 84.86 427.37 106,316 0.05 0.14Wood products . . . . . . . . . . . . . . . 13 6.20 15.01 35,117 0.01 0.01Petroleum, coal and chemical
products . . . . . . . . . . . . . . . . . . 1,139 15.60 30.07 181,443 0.02 0.03Ferrous metals . . . . . . . . . . . . . . . . 52 14.06 36.04 38,764 0.01 0.03Metals n.e.c. and metal products . . 28 8.40 20.67 25,170 0.00 0.01Transportation equipment . . . . . . . 171 5.25 21.56 197,560 0.00 0.01Electronic equipment . . . . . . . . . . . 11,186 1.89 4.34 176,789 0.04 0.10Other machinery and equipment . 1,309 11.83 29.87 161,163 0.05 0.12Other manufactures . . . . . . . . . . . 175 1.53 2.72 73,844 0.00 0.00Services . . . . . . . . . . . . . . . . . . . . . 4,213 -1.27 -0.63 172,392 -0.01 -0.01
All sectors 18,706 3.84 10.46 1,324,783 0.02 0.05
Sources: GTAP database and USITC calculations.
change.22 More imported intermediate inputs might be needed to facilitate theexpansion of Singapore’s textile and apparel sector, which could potentially violateFTA rules of origin. The analysis conducted here does not specifically address theimpact of the rules of origin negotiated under the FTA. As discussed in Chapter 6, theycan be restrictive and would likely translate into a smaller potential impact of theagreement on bilateral trade. To address this issue, the Commission also simulated theFTA with a more restrictive form of the “yarn forward” rules of origin similar to thatused in NAFTA. This is approximated by assuming only a partial U.S. liberalization oftextiles and apparel imports from Singapore. In particular, the Commission simulatedthe FTA (1) with only 50 percent of the scheduled cut in the textile and apparel tariff,and (2) without removing the textiles and apparel tariff at all. Simulation resultsshowed that (1) an FTA with a 50 percent smaller tariff cut would lead to a 57 percent
22 Simulation results show that while Singapore increased imports (of textiles) from third-partycountries, the determining factor for the increased export of textiles and apparel from Singapore to theUnited States appears to be the long-term reallocation of resources within Singapore from other sectorsto the apparel and textile sector.
64
increase in U.S. imports of textiles and apparel from Singapore, and (2) an FTAwithout any reduction in the U.S. tariff on textiles and apparel would in fact reduce U.S.imports from Singapore by 0.5 percent. The simulated impact on other relevantvariables did not change significantly.
Other sectors projecting significant percent increases in U.S. imports from Singaporeinclude dairy, sugar manufacturing, other crops, other processed foods, othermachinery and equipment, vegetables and fruits, and ferrous metals.23 However,these bilateral changes translate into very small impacts on total U.S. sectoral imports.For all the sectors considered, the potential changes to total imports are less than onetenth of one percent except for textiles (increase of 0.14 percent) and other foods(increase of 0.14 percent).
Domestic ProductionThe changes in trade flows affect output at the sectoral and the aggregate levels.Generally, an increased incentive to export would lead to an increase in the output of asector. Conversely, increased competition taking the form of a higher volume ofimports may shrink domestic production in a sector, at least in the short term. As theincentives to produce in a particular sector change, productive resources arereallocated across sectors, and cross-sectoral demands for different factors ofproduction are altered. Because the supply of factors of production is constrained atany given time, expansion of one sector usually means contraction of another.Generally then, membership in an FTA has implications for almost all parts of theeconomy, with some sectors expanding while others contract.
The results of the simulations indicate that changes in U.S. domestic sectoralproduction, following the FTA implementation, are generally very small in percentageterms (table 5-6). Few of the sectoral impacts estimated exceed one tenth of a percent.These results are not unexpected given that the tariffs to be removed are small and thatU.S. trade with Singapore is small relative to total U.S. trade and total U.S. production.The FTA-led increase in vegetables and fruit exports to Singapore could expandproduction in that sector by as much as 0.07 percent. On the other hand, the textilesand apparel sector could experience a decline of 0.12 percent. This small decline isdriven by the increase in imports from Singapore, which slightly decreases incentivesfor (or profitability of) domestic production. The effects of the tariff liberalization onsectoral output would induce changes in the demand for labor in the United States(table 5-7). General equilibrium results indicate that for each sector the impact of thetariff cuts is identical for skilled and unskilled labor. In the absence of technologicaldevelopment, changes in demand for the different factors of production should beclosely related to changes in the incentives to produce. It is, therefore, not surprisingthat the effects on sectoral demand for labor tend to be almost equal to the impact onsectoral output reported earlier.
23 The aggregated data and model used in this analysis show the United States and Singaporeexporting to and importing from each other in all sectors. Thus, it is not inconsistent to conclude forexample that the United States would export to and import from Singapore more dairy products due to theFTA. Such a result should be interpreted that U.S. exports consist of different dairy products than thosefound in U.S. imports of dairy products.

65
Table 5-6Effects on sectoral output in the United States, 2016 (relative to baseline)
Low High
Percent change
Fishing . . . . . . . . . . . . . . . . . . . . . . . . . . . . . . . . . . . 0.00 0.00Forestry . . . . . . . . . . . . . . . . . . . . . . . . . . . . . . . . . . 0.00 0.00Grains . . . . . . . . . . . . . . . . . . . . . . . . . . . . . . . . . . . 0.00 0.00Sugar crops . . . . . . . . . . . . . . . . . . . . . . . . . . . . . . 0.00 0.00Vegetables, fruits, and nuts . . . . . . . . . . . . . . . . . . . 0.04 0.07Other crops . . . . . . . . . . . . . . . . . . . . . . . . . . . . . . . -0.02 -0.01Livestock . . . . . . . . . . . . . . . . . . . . . . . . . . . . . . . . . 0.00 0.00Coal, oil, gas, and other minerals . . . . . . . . . . . . . . 0.00 0.00Meat products . . . . . . . . . . . . . . . . . . . . . . . . . . . . . 0.01 0.01Dairy products . . . . . . . . . . . . . . . . . . . . . . . . . . . . 0.00 0.01Sugar manufacturing . . . . . . . . . . . . . . . . . . . . . . . 0.00 0.00Other processed foods . . . . . . . . . . . . . . . . . . . . . . 0.01 0.02Textiles,apparel, and leather products . . . . . . . . . . -0.12 -0.03Wood products . . . . . . . . . . . . . . . . . . . . . . . . . . . . 0.00 0.00Petroleum, coal and chemical products . . . . . . . . . . -0.01 -0.01Ferrous metals . . . . . . . . . . . . . . . . . . . . . . . . . . . . . 0.00 0.00Metals n.e.c. and metal products . . . . . . . . . . . . . . . 0.00 0.01Transportation equipment . . . . . . . . . . . . . . . . . . . . 0.01 0.02Electronic equipment . . . . . . . . . . . . . . . . . . . . . . . . 0.00 0.01Other machinery and equipment . . . . . . . . . . . . . . -0.01 0.00Other manufactures . . . . . . . . . . . . . . . . . . . . . . . . 0.00 0.00Services . . . . . . . . . . . . . . . . . . . . . . . . . . . . . . . . . . 0.00 0.00Sources: GTAP database and USITC calculations.
Table 5-7Effects on demand for labor, by commodity, 2016 (relative to baseline)Commodity Low High
Percent change
Fishing . . . . . . . . . . . . . . . . . . . . . . . . . . . . . . . . . . . 0.00 0.00Forestry . . . . . . . . . . . . . . . . . . . . . . . . . . . . . . . . . . 0.00 0.00Grains . . . . . . . . . . . . . . . . . . . . . . . . . . . . . . . . . . . 0.00 0.00Sugar crops . . . . . . . . . . . . . . . . . . . . . . . . . . . . . . 0.00 0.01Vegetables, fruits, and nuts . . . . . . . . . . . . . . . . . . . 0.04 0.08Other crops . . . . . . . . . . . . . . . . . . . . . . . . . . . . . . . -0.01 0.00Livestock . . . . . . . . . . . . . . . . . . . . . . . . . . . . . . . . . 0.00 0.01Coal, oil, gas, and other minerals . . . . . . . . . . . . . . 0.00 0.00Meat products . . . . . . . . . . . . . . . . . . . . . . . . . . . . . 0.01 0.01Dairy products . . . . . . . . . . . . . . . . . . . . . . . . . . . . 0.00 0.01Sugar manufacturing . . . . . . . . . . . . . . . . . . . . . . . 0.00 0.00Other processed foods . . . . . . . . . . . . . . . . . . . . . . 0.01 0.02Textiles, apparel, and leather products . . . . . . . . . . -0.12 -0.03Wood products . . . . . . . . . . . . . . . . . . . . . . . . . . . . 0.00 0.00Petroleum, coal and chemical products . . . . . . . . . . -0.01 -0.01Ferrous metals . . . . . . . . . . . . . . . . . . . . . . . . . . . . . 0.00 0.00Metals n.e.c. and metal products . . . . . . . . . . . . . . . 0.00 0.01Transportation equipment . . . . . . . . . . . . . . . . . . . . 0.01 0.02Electronic equipment . . . . . . . . . . . . . . . . . . . . . . . . 0.00 0.01Other machinery and equipment . . . . . . . . . . . . . . -0.01 0.00Other manufactures . . . . . . . . . . . . . . . . . . . . . . . . 0.00 0.00Services . . . . . . . . . . . . . . . . . . . . . . . . . . . . . . . . . . 0.00 0.00Sources: GTAP database and USITC calculations.

66
Changes in demand for the different primary factors of production would affect theirreal rate of return (i.e., the payment made to the factor’s owner). In general, an outputexpansion in a particular sector is accompanied by an increase in the returns to thefactors that are intensively used in that sector, and a decrease in returns to factors lessintensively used. Given that agriculture (e.g., fruits and vegetables) uses landintensively, the return to land slightly increases by 0.02 percent in the United States(table 5-8).
Prices Paid by ConsumersThe bilateral tariff eliminations associated with the FTA affect the domestic marketprices in each economy through various channels. Given that the price paid byconsumers for imported goods is equal to a good’s international price plus any tradetaxes, the removal of a trade barrier on that good should decrease its domestic price.At the same time, a policy change that leads to an increase in the demand for (or, adecrease in the supply of) a particular imported good tends to increase its price.Furthermore, consumers in each economy consume a mix of imported and domesticproducts, with the prices of domestic products changing in the same direction as theprices of imported goods but not by the same magnitude. The effects of the reciprocaltariff liberalization on the domestic prices depend on the relative strength andinteraction between those offsetting forces. Simulation results indicate that theconsumer price changes triggered by the FTA in the United States are extremelysmall–an average decrease of 0.01 percent (table 5-9). Textiles and apparel, as wellas electronic equipment would experience small price decreases following the FTA. Atthe same time, the bilateral tariff cuts could have a small positive impact on the price ofvegetables and fruits, as well as other agricultural products.
Table 5-8Effects on real rate of return on primary factors in the United States, 2016(relative to baseline)Factor Low High
Percent change
Land . . . . . . . . . . . . . . . . . . . . . . . . . . . . . . . . 0.02 0.02Unskilled labor . . . . . . . . . . . . . . . . . . . . . . . . 0.00 0.00Skilled labor . . . . . . . . . . . . . . . . . . . . . . . . . . 0.00 0.00Capital . . . . . . . . . . . . . . . . . . . . . . . . . . . . . . 0.00 0.00Natural resources . . . . . . . . . . . . . . . . . . . . . . 0.00 0.01
1 In CGE analyses, a price remains constant because only relative prices are relevant. In theCGE simulations performed in this report, the price that remains constant is the income-weightedaverage of U.S. primary factor returns. Thus, on average, primary factor returns do not change inthe United States.Sources: GTAP database and USITC calculations.
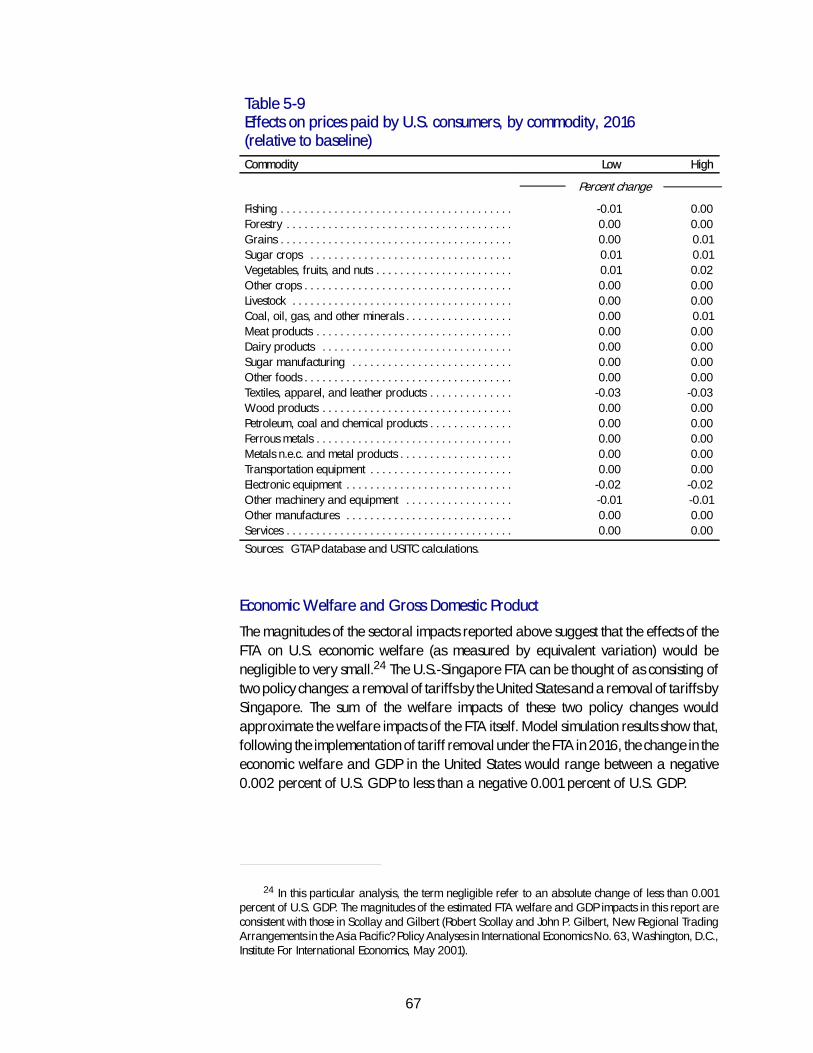
67
Table 5-9Effects on prices paid by U.S. consumers, by commodity, 2016(relative to baseline)Commodity Low High
Percent change
Fishing . . . . . . . . . . . . . . . . . . . . . . . . . . . . . . . . . . . . . . . -0.01 0.00Forestry . . . . . . . . . . . . . . . . . . . . . . . . . . . . . . . . . . . . . . 0.00 0.00Grains . . . . . . . . . . . . . . . . . . . . . . . . . . . . . . . . . . . . . . . 0.00 0.01Sugar crops . . . . . . . . . . . . . . . . . . . . . . . . . . . . . . . . . . 0.01 0.01Vegetables, fruits, and nuts . . . . . . . . . . . . . . . . . . . . . . . 0.01 0.02Other crops . . . . . . . . . . . . . . . . . . . . . . . . . . . . . . . . . . . 0.00 0.00Livestock . . . . . . . . . . . . . . . . . . . . . . . . . . . . . . . . . . . . . 0.00 0.00Coal, oil, gas, and other minerals . . . . . . . . . . . . . . . . . . 0.00 0.01Meat products . . . . . . . . . . . . . . . . . . . . . . . . . . . . . . . . . 0.00 0.00Dairy products . . . . . . . . . . . . . . . . . . . . . . . . . . . . . . . . 0.00 0.00Sugar manufacturing . . . . . . . . . . . . . . . . . . . . . . . . . . . 0.00 0.00Other foods . . . . . . . . . . . . . . . . . . . . . . . . . . . . . . . . . . . 0.00 0.00Textiles, apparel, and leather products . . . . . . . . . . . . . . -0.03 -0.03Wood products . . . . . . . . . . . . . . . . . . . . . . . . . . . . . . . . 0.00 0.00Petroleum, coal and chemical products . . . . . . . . . . . . . . 0.00 0.00Ferrous metals . . . . . . . . . . . . . . . . . . . . . . . . . . . . . . . . . 0.00 0.00Metals n.e.c. and metal products . . . . . . . . . . . . . . . . . . . 0.00 0.00Transportation equipment . . . . . . . . . . . . . . . . . . . . . . . . 0.00 0.00Electronic equipment . . . . . . . . . . . . . . . . . . . . . . . . . . . . -0.02 -0.02Other machinery and equipment . . . . . . . . . . . . . . . . . . -0.01 -0.01Other manufactures . . . . . . . . . . . . . . . . . . . . . . . . . . . . 0.00 0.00Services . . . . . . . . . . . . . . . . . . . . . . . . . . . . . . . . . . . . . . 0.00 0.00
Sources: GTAP database and USITC calculations.
Economic Welfare and Gross Domestic Product
The magnitudes of the sectoral impacts reported above suggest that the effects of theFTA on U.S. economic welfare (as measured by equivalent variation) would benegligible to very small.24 The U.S.-Singapore FTA can be thought of as consisting oftwo policy changes: a removal of tariffs by the United States and a removal of tariffs bySingapore. The sum of the welfare impacts of these two policy changes wouldapproximate the welfare impacts of the FTA itself. Model simulation results show that,following the implementation of tariff removal under the FTA in 2016, the change in theeconomic welfare and GDP in the United States would range between a negative0.002 percent of U.S. GDP to less than a negative 0.001 percent of U.S. GDP.
24 In this particular analysis, the term negligible refer to an absolute change of less than 0.001percent of U.S. GDP. The magnitudes of the estimated FTA welfare and GDP impacts in this report areconsistent with those in Scollay and Gilbert (Robert Scollay and John P. Gilbert, New Regional TradingArrangements in the Asia Pacific? Policy Analyses in International Economics No. 63, Washington, D.C.,Institute For International Economics, May 2001).

69
CHAPTER 6Impact of a U.S.-Singapore FTA on SelectedSectors
Information in this chapter supplements the quantitative results presented earlier in thereport with qualitative analysis of the U.S.-Singapore FTA and the potential impact ondistinct industry segments.1 Industry sectors addressed are textiles and apparel,express delivery services, financial services, professional services, andtelecommunications services. Industries were chosen based on a collectiveconsideration of apparent sectoral liberalization in terms of tariff and other nontariffbarriers and the extent to which business facilitation is promoted by provisions of theFTA, the importance of the sector in terms of bilateral trade or prominence in theagreement, and the level of industry interest in the FTA commitments or U.S.-Singaporetrade relationship with respect to a particular area.
The qualitative examination looks at relevant commitments in the U.S.-Singapore FTAthat could potentially affect trade in goods and services, including sector specific tariffelimination, general and industry-specific nontariff measures, rules of origin andcustoms provisions, and commitments with respect to market access and the movementof personnel. The analysis also considers global industry developments andimplementation of the U.S.-Singapore FTA in the context of sectoral, bilateral, and/orregional trade liberalization. Finally, input from industry sources concerning theactual anticipated benefits and effects of the agreement is incorporated, includinginformation taken from hearing testimony, submissions to the Commission, andinterviews with government and industry representatives. Unlike the quantitativeanalysis, which reflects long term effects of the U.S.-Singapore FTA, the qualitativeassessment on selected sectors reflects short- to mid-term effects.
Textiles and Apparel
OverviewU.S. bilateral trade in textiles and apparel with Singapore has declined significantlysince 1990, reflecting that country’s decreasing competitiveness vis-a-vis lower-cost
1 Modeling results from the quantitative analysis may differ from the qualitative results presented inthis chapter. This is generally because the CGE model used in Chapter 5 is unable to quantify certainnontariff measures affecting trade in commodity sectors and cannot accommodate actual operatingconditions in the examined industries. In addition, service sectors are aggregated as opposed toexamined separately, and the model is unable to quantify regulatory measures and nontariff barriersaffecting services trade; therefore, U.S. and Singapore tariff equivalents for services are listed as zero.

70
Asian suppliers such as China. Imports of textiles and apparel from Singapore fellfrom more than $600 million a year during the early 1990s to $289 million in 2002,while exports of such goods to Singapore peaked at $138 million in 1997, and then fellto $69 million in 2002.2 The relative decline of Singapore, which accounts for lessthan 0.5 percent of total U.S. textile and apparel trade, likely will continue ascompetition further intensifies following elimination of U.S. quotas on imports of textilesand apparel in 2005.3
Total U.S. imports of textiles and apparel have grown significantly since 1990, to $82billion in 2002, while U.S. exports of such goods, after expanding during much of the1990s, have fallen in the past 2 years to $16 billion. Much of the import growth in thepast 5 years came from Asian countries whose currencies had depreciatedsubstantially during the Asian financial crisis of 1997-98, effectively reducing dollarprices of their goods in the U.S. market. The recent decline in U.S. textile and apparelexports was attributable not only to slowing economic activity in major foreignmarkets, but also to the continued strength of the U.S. dollar, which has effectivelyreduced the price competitiveness of U.S. goods in foreign markets, and weak foreigndemand in Mexico and the Caribbean Basin countries for U.S. inputs used in theproduction of apparel for export to the United States. These competitive pressures havelimited the ability of U.S. producers to pass higher costs on to customers.
U.S. IndustryThe U.S. textile industry faces shrinking domestic markets for its yarn and fabric outputnot only because of growing imports of these goods but also because of even greaterimport competition in the form of finished end-use goods, such as apparel. The growthin such indirect import competition and decline in domestic production of end-usegoods limit the domestic market for U.S. producers of yarns and fabrics, particularlybecause imports of end-use goods often contain foreign inputs. Weak domesticdemand for U.S. textile inputs, however, had been partially offset by demand for U.S.exports of yarns and fabrics to Caribbean Basin countries and Mexico, where U.S.and other firms assemble garments and re-import the finished goods for sale mainly inthe U.S. market.
Faced with difficult market conditions and the prospect of increased import competitionfollowing quota elimination in 2005, the U.S. textile industry continues to consolidateoperations, close plants, shed non-core and underperforming assets, and shiftproduction from commodity goods to value- added or specialty products. The industryhas long invested in high-speed, automated technology to achieve high levels ofproductivity in the manufacture of high-volume commodity goods and in dyeing and
2 Data on U.S. imports and exports are in terms of the Commission’s trade-monitoring productgroups.
3 The Uruguay Round Agreement on Textiles and Clothing, which entered into force as part of theWTO agreements in 1995, calls for the phaseout of quotas on textiles and apparel, established by theUnited States and other importing countries under the Multifiber Arrangement (MFA), over a 10-yeartransition period ending on January 1, 2005.
71
finishing operations. More recently, the industry has invested in new production,information, and service technologies to increase not only productivity, but alsooperating flexibility and customer and market responsiveness. A few U.S. textile firmshave also invested in production in Mexico in an effort to benefit from NAFTApreferences, along with lower operating costs and closer proximity to theirapparel-manufacturing customers. In addition, some U.S. producers of apparelfabrics now offer U.S. apparel companies and retailers “full package” goods in whichthey use their own fabrics in producing garments made to customer specifications. TheU.S. textile industry likely will continue to benefit from U.S. trade legislation thatauthorizes preferential access to the U.S. market for apparel made offshore fromU.S.-made yarns and fabrics.4
The competitive pressures facing the U.S. apparel industry primarily reflect the largenumber of apparel suppliers in the domestic market, changing consumer preferences,rising import penetration, and growing buying power of large retailers.5 Many U.S.apparel producers have restructured operations to reduce costs and focus onmarketing. Producers have also expanded global sourcing, including the use ofassembly operations in Caribbean Basin countries and Mexico, further reducingemployment levels in the domestic industry. For many of the thousands of smalldomestic apparel producers, implementation of new strategies to respond to evengreater import competition likely will be limited, largely because of the lack of sufficientproduction volume and financial resources. The ongoing phaseout of U.S. importquotas on apparel likely will prompt many of these small firms either to reduceoperations and focus on niche markets or to cease production altogether.
Industry in SingaporeSingapore’s textile and apparel industries have declined in size since at least the early1980s, from about 1.5 percent of total manufacturing output in 1980 to about 0.5percent in 2001.6 Net domestic investment commitments in the sector declined fromS$32.6 million in 1980 (US $15.2 million) to S$10.2 million in 1998 (US $ 5.1 million),and to zero in 2001. Employment in the sector has also fallen since the early 1980s,when the government instituted a “wage-correction policy” to boost manufacturingwages. While Singapore’s textile and apparel sector accounted for 14 percent of total
4 The United States grants duty-free and quota-free treatment to imports of qualifying apparelarticles, including those made with U.S. yarns and fabrics, from Mexico under the North American FreeTrade Agreement (NAFTA), from eligible Caribbean Basin countries under the United States-CaribbeanBasin Trade Partnership Act, and from eligible sub-Saharan African countries under the African Growthand Opportunity Act. According to certain U.S. retailers, the U.S. textile industry does not supply many ofthe fabrics or yarns used in apparel production today. Fabrics used in the apparel industry that U.S. textileproducers do supply are often not produced in quantities sufficient to meet market demands placed onU.S. textile production by yarn-forward requirements of preference program agreements granted byCongress.
5 A growing concentration of retail sales among a few large retailers has enhanced the bargainingpower of these retailers in negotiating prices and other contract terms with suppliers.
6 Information in the paragraph is mainly from U.S. Department of State telegram 1372, “TextileTrade Without Quotas — Singapore,” prepared by U.S. Embassy, Singapore, Apr. 29, 2002.
72
employment in 1980, it accounted for only 2.4 percent of total employment in 2000.However, the number of textile and apparel manufacturing firms in Singapore hasincreased during the past 20 years, from 99 in 1980 to 187 in 2000, reflecting the factthat apparel firms in Singapore now sub-contract most production to overseasoperations that benefit from lower labor costs and unfilled export quotas.
As wage rates in Singapore rose to levels higher than in any other developingcountries in Asia, the competitiveness of its labor-intensive textile and apparelindustries declined vis-a-vis its counterparts in neighboring Asian countries, spurringmany Singapore textile and apparel firms to discontinue or relocate production tolower cost countries such as China, Indonesia, Malaysia, and Sri Lanka.7 As such,Singapore’s domestic production of apparel accounts for less than 1 percent of totalmanufacturing in Singapore, with about two-thirds of apparel made by Singaporecompanies produced outside of Singapore.8 Singapore’s apparel industry hasevolved as more of a center for design, warehousing, and distribution for apparelproducts than a manufacturing base.
The United States is Singapore’s leading export market for apparel, accounting for 74percent of its apparel exports in 2001, but few of its textile exports. Slightly more thanone-half of Singapore’s apparel exports to the United States that year consisted ofre-exports (i.e., Singapore garments partially assembled offshore). AlthoughSingapore exports of textiles and apparel grew in 1999 and 2000, they declined in2001, largely because of weak U.S. economic activity.9
According to United Nations data, Singapore posted a trade deficit for textiles andapparel of approximately $350 million in 2001. Its exports of such goods totaled $2.4billion, of which $1.6 billion was apparel and the remainder textiles. Its importsamounted to $2.7 billion, with apparel accounting for $1.7 billion and textiles theremainder.
Potential Impact on U.S. ImportsThe Commission’s CGE model results of Chapter 5 found that, after the removal oftariffs in the U.S.-Singapore FTA, U.S. textile and apparel imports from Singaporewould increase by more than 100 percent (albeit from small bases) in the long run. Thiswould result in a minimum impact on U.S. sectoral output which would decline by 0.05
7 “Textile Industry,” found at http://www.timesone.com, retrieved Jan. 30, 2003. Because of thesignificant relocation of apparel production from Singapore to Indonesia, the two countries requestedthat the United States shift part of Singapore’s apparel quotas to Indonesia. The United States rejected therequest, partly because there is no precedent for a quota swap under the U.S. textile program and thus itwould require a major policy change; the quotas are fixed and part of a 10-year automatic phaseoutplan; and Singapore’s lack of cooperation with U.S. customs in preventing illegal textile transshipments.See U.S. Department of State telegram No. 114425, “Textiles: Quota Swap Proposal,” Washington, DC,June 15, 2000.
8 U.S. Department of State telegram No. 1372, “Textile Trade Without Quotas – Singapore,”prepared by U.S. Embassy, Singapore, Apr. 29, 2002.
9 U.S. Department of State telegram No. 1372, “Textile Trade Without Quotas – Singapore,”prepared by U.S. Embassy, Singapore, Apr. 29, 2002.

73
percent. However, when rules of origin are considered, U.S. imports of textiles andapparel would increase by 57 percent, limiting the effects of the tariff removal in theFTA for this sector.
In the short run, according to industry analysis, the U.S.-Singapore FTA likely will resultin no measurable increase in total U.S. imports of textiles and apparel from Singaporeresulting most likely in no measurable effect on production or employment in the U.S.textile and apparel industries. Although U.S. textile and apparel imports fromSingapore are subject to quotas and relatively high tariffs (trade weighted averageduty rate of 18 percent ad valorem in 2002), the FTA will limit duty-free and quota-freetreatment to textile and apparel articles made in Singapore from yarns and fabricsproduced in either Singapore or the United States.10 Singapore reportedly has limitedproduction capacity for yarns and fabrics, and it is unlikely that Singapore firms willimport U.S. yarns and fabrics because of the time and cost associated with shippingthese products. Under such conditions, the FTA provides negligible benefit to eitherSingapore yarn or fabric producers, but the agreement may benefit U.S. yarn andfabric producers. However, costs associated with shipping goods across the oceantwice may negate any potential duty benefits from the FTA, put apparel producers at adisadvantage for providing goods to the U.S. market, and may make Singapore a lessattractive location for apparel manufacture.11 All but a small part of U.S. textile andapparel imports from Singapore during 1997-2002 were apparel articles,particularly knit tops such as sweaters, shirts, and blouses. Most of these knitweararticles are believed to have been made from third-country yarns.
The FTA duty-free and quota-free treatment likely will result in a measurable increasein total U.S. imports of certain high-duty items from Singapore, such as women’s orgirls’ knit manmade-fiber trousers and shorts (HTS subheading 6104.63.20) andcertain women’s or girls’ shirts and blouses (6106.20.20). The 2003 U.S. duty ratesare 28.4 percent ad valorem for the trousers and shorts and 32.3 percent ad valoremfor the shirts and blouses. In 2002, Singapore’s shipments of such trousers and slackstotaled $10 million, or 2.5 percent of total U.S. imports of such goods, while itsshipments of the the shirts and blouses totaled $2 million, or 0.6 percent of total U.S.imports. Although these apparel articles are subject to U.S. import quotas, Singaporefilled less than 20 percent of its quotas for these products in 2002.
10 The FTA rules of origin for textiles and apparel were modeled after those in NAFTA, and wouldrequire that imports of apparel from Singapore, for example, would have to be assembled from inputsmade either there or in the United States, generally from the yarn stage forward. Under this “yarnforward” rule, only the fibers may be from third countries. In a letter to the USTR, the National RetailFederation stated that, while it supports the proposed FTA, it recommends that the FTA rules of origin fortextiles and apparel be based on those now provided under section 334 of the Uruguay RoundAgreements Act rather than the NAFTA origin rules. It claims that the NAFTA rules work only when U.S.yarn and fabric mills are located near apparel firms, such as is the case with Mexico, or if the FTA countryhas significant yarn or fabric production, which is not the case with Singapore. An official of the AmericanApparel and Footwear Association also opposed the use of the NAFTA textile and apparel rules of originin the FTA (telephone interview by Commission staff, Dec. 11, 2000).
11 U.S. apparel retailers, e-mail to Commission staff, Apr. 30, 2003, and telephone interviews byCommission staff, May 8 and 12, 2003.
74
Under the U.S.-Singapore FTA, the United States would grant immediate unlimitedduty-free treatment to products meeting the FTA rules of origin (i.e., “originatinggoods”).12 For most garments, the rules of origin require the use of yarns or fabricsmade in the United States or Singapore.13 Under the de minimis rule of the FTA, up to 7percent of the total weight of the originating good can consist of fibers or yarns that arenot made in the United States or Singapore, except for elastomeric yarns, which mustbe wholly made in the United States.
The FTA also provides for a tariff preference level that will exempt specified levels ofSingapore’s apparel exports from the yarn forward rule for 8 years, permitting the useof third-country yarns and fabrics (i.e., inputs from countries other than Singapore andthe United States). The agreement provides for a TPL total of 25 million square metersequivalent (SMEs) for cotton and manmade-fiber apparel in the first year of the FTA,which will be reduced by 3.125 million SMEs each year thereafter, reaching zero in theninth year. In 2002, Singapore exported a total of 66.4 million SMEs of cotton andmanmade-fiber apparel to the United States, comprised of 52.9 million SMEs of cottonapparel and 13.5 million SMEs of manmade fiber apparel. U.S. duty rates under theTPL remain in place while being reduced to zero in equal increments over a 5-yearperiod, thus limiting the time apparel producers have to use the TPLs.
The FTA Textiles Chapter (5) sets forth provisions for “cooperation in the prevention ofcircumvention” with considerable obligations on the Government of Singapore tomonitor trade and ensure compliance. Further FTA provisions pertinent to theprevention of textile and apparel transshipments involve elaborate record keepingcriteria, even for goods made under outward processing arrangements. The FTAincludes provisions for cooperation and enforcement with procedures for monitoringfree trade zones, obligation to share information, and steps to deal with violations. Ifeither FTA party believes that the other is not in compliance with the terms of theagreement with respect to textiles and apparel, it can request consultations (e.g., theUnited States can apply quotas to Singapore-made goods or revoke preferentialbenefits for particular firms or products).14
Potential Impact on U.S. ExportsThe U.S.-Singapore FTA likely will have no measurable effect on total U.S. exports oftextiles and apparel to Singapore, absent growth in demand over time, because, while
12 In February 2003, Singapore signed a free trade agreement with Australia; implementation ofthe agreement is expected to occur in mid-2003.
13 In hearing testimony, Wal-Mart Stores, Inc., cited overly restrictive rules of origin for textile andapparel products as an agreement imperfection. The company stated that such rules, combined with thelogistical problem of using the U.S. yarn forward, serve to eliminate Singapore as an option for apparelsourcing. Wal-Mart further expressed concern with respect to the precedent-setting nature of the yarnforward rule, and hopes that it, and the U.S.-Singapore FTA rules of origin, will not be carried over toother FTAs currently under negotiation. Hearing transcript at pp. 48 and 68.
14 The American Textile Manufacturers Institute expressed concern that an FTA with Singapore willlead to an increase in illegal textile and apparel transshipments from Asia. Charles Bremer, VicePresident, International Trade, American Textiles Manufacturers Institute, telephone interview byCommission staff, Apr. 22, 2003.

75
Singapore’s bound duty rate on these goods is 10 percent ad valorem, its appliednormal tariff relations (NTR) rate is free.15 The FTA would ensure that Singapore willnot apply the bound rate to U.S. exports of qualifying textile and apparel articles.Singapore does not impose any restrictions or duties on imports or exports of textilesand apparel.
Express Delivery Services
Overview
U.S. IndustryThe express delivery services industry comprises companies involved in the expeditedmovement of documents, parcels, and other goods. Express delivery operators offeran integrated service, maintaining control of the goods throughout the deliveryprocess and often using tracking and tracing technology to monitor the location ofeach item. Value-added services include, for example, collection from a pointdesignated by the sender, release upon signature, specific delivery time guarantee,and the ability of the sender to confirm delivery. Express delivery providers primarilycompete with transportation companies involved in the movement of goods, includingfreight forwarders, local courier providers, logistic service providers,16 and postalservice operators; and they distinguish themselves from their competitors by the extentof the integrated service that they provide.
In 2001, the U.S. market for express delivery-related services totaled $106.7 billion.17
In that year, the four largest U.S. express delivery providers–United Parcel Service(UPS), FedEx Corporation (FedEx), Menlo Worldwide,18 and AirborneExpress19–generated total revenues of $59 billion, representing over 55 percent of theU.S. market for express delivery-related services. These four U.S. express deliveryproviders employed over 604,000 people in 2001. U.S. express delivery servicecompanies generate annual international revenues of approximately $10 billion,representing 23 percent of worldwide express delivery revenues.20
15 U.S. Department of Commerce (USDOC), Office of Textiles and Apparel (OTEXA), “Otexa ExportAdvantage: Singapore,” found at http://otexa.ita.doc.gov, retrieved Dec. 7, 2000.
16 Logistic services involve the movement of semifinished or finished goods from manufacturers toendusers.
17 Demand for the service has increased largely as a result of the growing trend for companies touse “just-in-time” manufacturing that enables companies to produce to order, thereby reducing costsassociated with maintaining large physical inventories. Logistic services include, for example, freighttransportation, storage and warehousing, inventory control, order processing, and managementservices.
18 Estimated by USITC staff.19 Menlo Worldwide is a division of CNF, Inc.20 On Mar. 25, 2003, Germany’s DHL International announced its intention to purchase the ground
transportation assets of Airborne Express. Regulatory approval is pending.
76
Industry in Singapore
Revenue information on Singapore’s express delivery industry is not available.However, the U.S. Department of Commerce (USDOC) estimates that Singapore’slogistic services industry generates revenues of approximately $7.2 billion annuallyand employs 93,000 people.21 Currently, over 3,000 domestic and foreigntransportation and logistic services firms operate in Singapore, the largest of whichare U.S.- and Europe-based and Europe-based express delivery firms. These firmsinclude Menlo Worldwide, FedEx, UPS, Airborne Express, DHL Worldwide Express(Germany), and TNT Post Group (the Netherlands).22
Potential Impact on U.S. ImportsThe U.S.-Singapore free trade agreement is groundbreaking in its inclusion of expressdelivery services in a free trade agreement, and the sectoral provisions in thisparticular FTA will ensure the efficient provision of these services in each country.However, the agreement will have little impact on U.S. imports of express deliveryservices from Singapore, principally because Singapore has a relatively smallindustry with little capability to project itself into the U.S. market and because only aportion of the projected increase in total imports from Singapore will require expediteddelivery. Although trade data on express delivery services are not available,air-freight transport trade data are reasonable proxies.23 These data indicate thatU.S. imports of such services from Singapore totaled $166 million in 2001, whichrepresents approximately 4 percent of total U.S. air-freight transportation imports.24
U.S. imports of air freight services from Singapore predominantly reflect payments toSingapore’s air freight carriers for transporting imported goods to the United States.Imports of such goods decreased significantly, by 22 percent, during 2001, largelyowing to unfavorable economic conditions in the United States.25
Although the increase in U.S. imports of express delivery services is expected to besmall, customs administration provisions in the agreement may facilitate the movementof Singapore express shipments to the United States. For such shipments, theagreement requires the United States to provide prearrival processing; to permit theuse of minimal declaration documentation, preferably a single document submittedthrough electronic means; to provide for the release of certain goods with minimaldocumentation and deferred payment, where possible; and to ensure the rapidrelease of express shipments. Although these provisions may increase delivery speeds
21 Estimated by USITC staff.22 USDOC, United States and Foreign Commercial Service (US&FCS), “Logistic Services -
Singapore,” Industry Sector Analysis, Mar. 2003, p. 2.23 Ibid., pp. 21-23; and Triangle Management Services, Ltd., “Industry Links,” found at
http://www.triangleconsultancy.co.uk/internet/search/internet_search_results_web.asp,retrieved Mar. 17, 2003.
24 Cross-border air-freight transport data comprise U.S. international transactions arising from thetransport of goods by air, including time-definite, or express carriage.
25 USDOC, Bureau of Economic Analysis (BEA), Survey of Current Business, Oct. 2002, pp. 88-91.
77
for Singapore firms’ express shipments, the provisions will not have a significantimpact on cross-border imports, owing to Singapore firms’ limited capacity andpresence in the U.S. market.
Potential Impact on U.S. ExportsThe U.S.-Singapore free trade agreement will have little impact on U.S. exports ofexpress delivery services owing to the existing openness of the Singapore market andthe causal relationship between demand for U.S. products and export shifts. As notedabove, trade data on express delivery services are not available, but air-freighttransport trade data are reasonable proxies. These data show that U.S. exports toSingapore in 2001 totaled $221 million, representing approximately 4 percent of totalU.S. air-freight transportation services exports.26 Increased exports of such servicesdepend largely on demand for U.S. semifinished and finished goods in Singapore. In2001, U.S. exports of such goods declined by 1.5 percent to $17.4 billion. This decline islargely attributable to unfavorable economic conditions in Singapore during 2001.
Singapore’s express delivery services market is relatively open, and major U.S.-basedexpress delivery firms already have a significant presence in Singapore. In 1999, UPSestablished its first company-owned and constructed headquarters in Singapore. Thenew facility houses UPS Corporate’s country office and operations facility as well as itsfinished goods logistic services warehouse.27 Similarly, FedEx operates a distributioncenter in Singapore.28 Both companies report strong demand for their services inSingapore as a result of their increased presence in the country.29
As described above, customs administration provisions, which apply to both parties ofthe agreement, may facilitate U.S. express shipments to Singapore. AlthoughSingapore has a reservation for postal services, the reservation does not apply toexpress delivery services, including express letter services, thereby ensuring that suchservices are covered by the provisions of the agreement. Singapore’s reservation onpostal services limits the potential for monopoly abuse by prohibitingcross-subsidization of express letter services with profits from postal delivery of letters.
Although the U.S.-Singapore FTA will not likely lead to increased U.S. exports ofexpress delivery services, industry representatives are encouraged by the agreement’strade facilitating provisions and its investment provisions, which create greaterregulatory certainty for service provision in Singapore.30 Industry representatives alsonote that for the first time in any trade agreement, the definition used to describe theindustry accurately reflects the activities involved in the provision of express deliveryservices, thereby setting an important precedent for future trade agreements.31
26 USDOC, BEA, U.S. International Transactions, Fourth Quarter and Year 2001, Apr. 2001, p. 57.27 USDOC, BEA, Survey of Current Business, Oct. 2002, pp. 88-91.28 UPS, “UPS Invests S$38 Million in Asia Pacific Headquarters,” press release, Oct. 21, 1999.29 FedEx, “FedEx Signs Strategic Retail Agreement with Singapore Post Greater Convenience and
Access for SMEs and Consumers,” press release, Sept. 24, 2002.30 UPS, “UPS Posts Solid 1st Quarter Earnings,” press release, Apr. 19, 2002; and FedEx, “FedEx
Signs Strategic Retail Agreement with Singapore Post,” Sept. 24, 2002.31 Industry representative, telephone interview with USITC staff, Washington, DC, Mar. 19, 2003;
and Selina Jackson, International Public Affairs Manager, United Parcel Service, written submission,Apr. 24, 2003.
78
Financial Services
Overview
U.S. Industry
The financial services industry comprises companies involved in the provision ofinsurance, banking, securities, and asset management services.32 The domesticindustry is large and well established, with U.S. firms globally active and highlycompetitive in the world financial services market. In the United States, at the end of2000 there were 4,764 insurance companies, which wrote premiums valued at$865.3 billion, representing 35 percent of the global market.33 Ranking by 2001revenues, 5 U.S. firms were among the top 10 property/casualty firms globally. OneU.S. firm, MetLife, ranked among the top 10 life insurers worldwide.34 U.S. insurancecarriers, agents, brokers, and services firms employed 2.2 million workers in 2001.35
In the U.S. banking industry, approximately 1.9 million workers were employed by9,354 commercial banks and savings institutions in 2002, which reported total assetsof $8.4 trillion, total loans of $5.1 trillion, and total domestic deposits of $4.9 trillion.36
In December 2002, U.S. commercial banks reported total assets of $752.6 billion heldin foreign offices, representing 11 percent of their total assets.37 Citigroup andJPMorgan Chase are the only 2 U.S.-based firms among the world’s 10 largestcommercial banks, ranked by assets.38 Foreign-owned banks represent an importantsegment of the U.S. banking system, accounting for $1.3 trillion in U.S. domestic assets,representing nearly 16 percent of total U.S. domestic bank assets.39 Three Singaporebanks have five branch offices in the United States, with total assets of $3.2 billion,representing a small percentage of the U.S. market.40
32 Ibid; and Susan Presti, Executive Director, Air Courier Conference of America, writtensubmission, Apr. 10, 2003.
33 Excludes deposit-taking and lending services.34 In 2000, 67 percent of U.S. insurance companies were property/casualty companies and 33
percent were life/health companies. Insurance Information Institute, The III Fact Book 2003, New York:Insurance Information Institute, 2003, pp. 12 and 15.
35 Ibid., pp. 2-3.36 USDOC, BEA, Survey of Current Business, Aug. 2002, p. 80.37 Includes all institutions insured by the Federal Deposit Insurance Corporation (FDIC). FDIC,
“QBP-Stats At A Glance,” found at http://www.fdic.gov/, retrieved Mar. 17, 2003. Employment figuresare for 2001 and includes employees of U.S.-owned and foreign-owned depository institutions. USDOC,BEA, Survey of Current Business, Aug. 2002, p. 80.
38 Savings institutions are included in the statistics for total assets of the U.S. banking system, butsavings institutions do not hold foreign assets. FDIC, “Statistics on Depository Institutions Report,” Dec.2002, found at http://www3.fdic.gov/sdi/rpt_Financial.asp, retrieved Mar. 17, 2003.
39 “World’s Top Banking Companies by Assets,” American Banker, found at Internet addresshttp://www.americanbanker.com, retrieved Oct. 31, 2002.
40 U.S. Federal Reserve, “Structure Data for U.S. Offices of Foreign Banks,” Dec. 31, 2002, found athttp://www.federalreserve.gov/releases/, retrieved Mar. 13, 2003.

79
In 2001, the three U.S. stock exchanges41 listed 7,598 companies, with a combinedmarket capitalization of $14.7 trillion.42 The United States has the world’s largestsecurities market. Six U.S. firms were among the world’s 10 largest investment banks asranked by 2002 sales.43 All of these leading firms have operations in Singapore.44
At the end of 2001, the U.S. mutual fund industry comprised 8,307 mutual funds, with$7.0 trillion in assets under management.45 The entire U.S. securities industryemployed 767,000 workers in 2001.46
Industry in SingaporeIn contrast to the size and scope of the U.S. financial services sector, the industry inSingapore is small. Insurance companies in Singapore generated premiums of $4.0billion in 2001, representing just 0.2 percent of the global total.47 There were 121commercial banks in Singapore as of March 2003, with total assets of $208.1 billionand total deposits of $101.8 billion. Foreign-owned firms, including a number ofprominent U.S. banks, hold approximately 40 percent of total deposits in Singapore’sbanking market.48 In Singapore’s securities market, the Singapore Exchange (SGX),listed 525 companies at year-end 2002, with a combined market capitalization of$296.6 billion. During 2002, the SGX recorded share turnover volume of 92.6 billionshares, valued at $66.3 billion.49 At the end of 2001, Singapore-based mutual fundfirms held total assets of $173.4 billion under management, and employed 1,114investment professionals.50
Potential Impact on U.S. ImportsThe U.S.-Singapore FTA is unlikely to have a measurable impact on U.S. imports ofinsurance services from Singapore, which totaled $1 million in 2001, representing a
41 The three banks are Overseas Chinese Banking Corp., with U.S. assets of $534 million,Development Bank of Singapore, with assets of $765 million, and United Overseas Bank, with U.S. assetsof $1.9 billion. All of the offices are located in either New York or Los Angeles. Ibid.,
42 There are three major stock markets in the United States: the New York Stock Exchange (NYSE),the American Stock Exchange (AMEX), and the Nasdaq.
43 Securities Industry Association (SIA), Securities Industry Fact Book 2002, New York: SIA, 2002,p. 48.
44 Morgan Stanley, Merrill Lynch, Goldman Sachs, Salomon Smith Barney (a Citigroup subsidiary),Lehman Brothers, and Bear Stearns. Hoover’s Online, Financial Services Industry Snapshot, found athttp://www.hoovers.com/industry/snapshot/0,2204,18,00.html, retrieved Jan. 28, 2003.
45 Monetary Authority of Singapore (MAS), “Directory,” found at http://www.mas.gov.sg/directory/, retrieved Mar. 20, 2003.
46 Investment Company Institute (ICI), 2002 Mutual Fund Fact Book, Washington, D.C.: ICI, 2002,pp. 25 and 34.
47 USDOC, BEA, Survey of Current Business, Aug. 2002, p. 80.48 Swiss Re, Sigma insurance database.49 Bank of America, Citibank, and JPMorgan Chase all hold Qualifying Full Bank licenses,
American Express holds a wholesale bank license, and Bank of New York, Fleet Bank, and State StreetBank all hold offshore bank licenses. MAS, “Directory,” found at http://www.mas.gov.sg/directory/,retrieved Mar. 20, 2003.
50 The SGX was launched in December 1999, as a result of a merger between the former StockExchange of Singapore and the Singapore International Monetary Exchange. Singapore Exchange(SGX) website, “Market Statistics, 2002 December,” found at http://info.sgx.com, retrieved Mar. 17,2003.
80
small percentage of total U.S. insurance imports of $4.9 billion.51 Although the U.S.insurance market has few existing barriers, few Singapore firms have chosen to enterthe U.S. market.
The U.S.-Singapore FTA is also unlikely to have a significant impact on U.S. imports ofbanking and securities services. In 2001, U.S. imports of banking, securities, and assetmanagement services from Singapore totaled $64 million, compared to total U.S.imports of such services of $4.0 billion.52 As is the case for insurance, although the U.S.banking and securities markets have few existing market access barriers, fewSingapore firms have chosen to enter the U.S. market. Although many foreign banksfind it advantageous to maintain a presence in the United States, many smallerforeign-owned banks, such as those from Singapore, focus on providing services suchas trade financing to clients from their home countries, and do not compete directlywith U.S.-based banks in the U.S. financial services market. Further investment bySingapore banks in the United States largely depends on increased demand fromnonfinancial Singapore firms, and is not directly related to financial sectorliberalization.
Potential Impact on U.S. ExportsThe U.S.-Singapore FTA provisions with respect to the aggregate financial servicessector are trade liberalizing in terms of remaining nontariff barriers and areconsidered to be extremely advantageous by U.S. companies.53 However,implementation of the FTA is unlikely to have a measurable impact on total U.S. exportsof insurance services, primarily because Singapore accounts for a relatively smallshare of total U.S. insurance exports.54 Yet, the FTA may result in increased U.S.exports to Singapore in certain specific segments of the insurance industry. Forexample, the FTA may lead to increased U.S. exports of insurance services toSingapore in the marine, aviation, and transport (MAT) insurance segment, sincecross-border supply of MAT insurance to Singapore is permitted for the first time.55
Additionally, the agreement includes provisions that permit U.S. insurers who meetcertain prescribed conditions to offer services to Singapore residents through theCentral Provident Fund Investment Scheme (CPFIS), Singapore’s privatized socialsecurity system. The FTA also contains provisions that waive mandatory filing ofapproval for new products, except for life insurance, CPFIS-related products, andinvestment-related products. Where such approval is required, Singapore will allow
51 Does not include support staff. MAS, “2001 Survey of the Singapore Asset ManagementIndustry,” found at http://www.mas.gov/sg/, retrieved Mar. 13, 2003.
52 USDOC, BEA, Survey of Current Business, Oct. 2002, p. 111.53 Ibid., p. 107.54 Jeffrey R. Shafer, Managing Director, Global Markets, Citigroup, written submission, Apr. 21,
2003.55 In 2001, the United States recorded net exports of insurance services of $16 million to Singapore,
reflecting premiums of $36 million and claims payments of $21 million. This compares to premiums of$8.7 billion written by U.S. insurers globally. USDOC, BEA, Survey of Current Business, Oct. 2002, p. 111.
81
the product to be offered unless it is disapproved within a reasonable amount oftime.56
Two restrictions that were considered significant market access barriers by the U.S.insurance industry, namely a ban on new licenses and a 49-percent foreign equityownership limit on insurance companies, were unilaterally removed by Singapore in2000,57 limiting the impact of the new FTA on total U.S. exports of insurance services toSingapore. However, industry representatives indicate that the agreement is importantin establishing regulatory certainty by binding these liberalization measures in atreaty, since they are not bound in the GATS agreement. U.S. industry representativesalso indicate that the U.S.-Singapore FTA serves an important purpose as abenchmark for future bilateral FTAs between the United States and other countries.58
In the banking and securities sector, the U.S.- Singapore FTA is unlikely to have asignificant impact on overall U.S. cross-border exports of banking and securitiesservices. However, sales by U.S. bank affiliates in Singapore are likely to show ameasurable increase, owing to provisions of the treaty that allow U.S. banks greateraccess to Singapore’s retail banking market.59 Several provisions of the agreementalso remove market access restrictions to asset management firms, but the extent ofany resulting increase in exports or affiliate sales will depend on market conditions inSingapore.60
The agreement removes Singapore’s existing ban on new bank licenses, both at theretail and the wholesale levels. The ban on new licenses for full-service, retail bankswill be abolished 18 months after the agreement’s implementation, and the ban onnew wholesale licenses will be abolished 3 years after the agreement’s entry intoforce. In another important change, U.S. banks with Qualifying Full Bank (QFB)licenses61 will be permitted to increase the number of their branches (including ATMs),to 30 from 15 immediately upon entry into force of the agreement, followed by theremoval of all numerical limits two years later. U.S. banks with QFB licenses will also bepermitted to negotiate on commercial terms with Singapore-based banks to achieveaccess to the local ATM network. Currently, no foreign bank access to the ATM networkis permitted. Restrictions remain on the activities of wholesale and offshore banks.However, the restrictions largely serve to separate wholesale from retail business, andonce the ban on new retail licenses is removed, banks can avoid the restrictions entirelyby obtaining retail bank licenses.62
56 Statistics that reflect trade specifically in the MAT subsector are not available. Office of the U.S.Trade Representative, “Free Trade with Singapore,” found at http://www.ustr.gov/, retrieved Mar. 19,2003.
57 The Monetary Authority of Singapore (MAS) will endeavor to disapprove products within 30days.
58 The MAS also implemented an open admission policy for new insurance brokers, opened thefinancial guarantee insurance business to multiline insurers and reinsurers, and reduced the paid-upcapital requirement for captive insurers to S$400,000. (US $232,000) U.S. & Foreign CommercialService, Market Research Reports, “Direct Insurance Market Opens,” Apr. 12, 2000, found athttp://www.stat-usa.gov/, retrieved Mar. 12, 2003.
59 Industry representatives, telephone interviews with USITC staff, Mar. 20 and 24, 2003.60 Ibid.61 Ibid., Mar. 20, 2003.62 Foreign-owned banks operating in the retail market receive QFB licenses, rather than the Full
Bank licenses that Singapore-owned banks receive.
82
The U.S.-Singapore FTA will likely result in increased sales by foreign affiliates of U.S.asset management firms, as a result of two provisions of the agreement that representimportant market liberalization. First, Singapore will permit U.S. asset managementfirms to provide investment advice and portfolio management services from outsideSingapore, provided that the services are not custodial or trustee services, and that thefirm has a manager located in the territory of Singapore. The U.S. asset managementindustry has cited this as an important way for their members to reduce costs, thusenhancing their competitiveness with local firms in foreign markets.63 Second,Singapore will permit U.S. asset managers who meet certain prescribed conditions tooffer services to Singapore residents through the CPFIS.
Professional Services
Overview
U.S. IndustryThe professional services industry comprises individuals and firms involved in theprovision of accounting, architectural and engineering, and legal services. In 2000,the U.S. accounting services industry employed nearly 1.2 million workers in 100,363establishments; similarly, the architectural, engineering, and related services industryemployed 1.2 million in 102,292 establishments; and the legal services industryemployed 1.1 million in 176,720 establishments.64 In 2001, accounting services firmsgenerated revenues of $85.1 billion, architectural and engineering services firmsgenerated $174.9 billion, and legal services firms generated $175.4 billion.65 TheUnited States is the world’s largest market for these services, and the largest U.S.
63 Wholesale banks may not accept fixed deposits of less than S$250,000 (US $145,000) perdeposit from nonbank customers, and they may not pay interest on Singapore dollar current accountsoperated by resident individuals. Offshore banks operate primarily in Asian Currency Units (ACUs)rather than in Singapore dollars. The Asian Currency Unit is a separate accounting unit of banks andfinanical institutions given approval to trade in the Asian dollar market. As long as they do business in thisoffshore currency, they are not restricted as to their activities. However, when doing business in localcurrency, they face the same restrictions as wholesale banks, with additional restrictions as follows: theymay not accept interest bearing deposits from resident nonbank customers other than approved financialinstitutions, and they may not extend total credit facilities in Singapore dollars exceeding S$500 million(US $290 million) to nonbank customers who are residents of Singapore. The MAS is in the process ofconverting all offshore bank licenses to wholesale bank licenses.
64 Industry representatives, submissions to the Commission, Dec. 4, 2000; and telephone interviewswith USITC staff, Mar. 21, 2003.
65 USDOC, BEA, 2000 County Business Patterns, found at http://censtats.census.gov/cgi-bin/cbpnaic/cbpdetl.pl, retrieved Mar. 19, 2003. Estimates are reported for industries as classifiedin the 1997 North American Industry Classification System (NAICS) and reflect total employees, in orderto examine detailed data on individual professional service industries. Data for accounting services alsoinclude tax preparation, bookkeeping, and payroll services, and data for architectural and engineering
83
professional services firms are among the most prominent in providing such servicesacross borders as well as domestically.
Industry in Singapore
By comparison, Singapore’s professional services industry is small and in the initialstages of expanding such services to neighboring countries. In June 2002, theGovernment of Singapore estimated that employment of professionals totaled231,600, representing 12 percent of Singapore’s total work-force.66 Professionalslicensed to practice in Singapore totaled 7,348, consisting of 759 certified publicaccountants, 1,074 architects, 2,396 engineers, and 3,120 attorneys.67 The Instituteof Certified Public Accountants of Singapore reportedly anticipates increased industryunemployment resulting from a recent regulatory change that now exempts fromannual audits those private companies with annual sales less than US$2.8 million.68 Inlegal services, more than 725 law firms generated revenues of approximatelyUS$478 million in 2000.69 Reportedly, an increasing number of Singapore legalservices firms are consolidating their operations in an effort to shore up revenues andfocus practices on new niches such as intellectual property law andinformation/communications technology law.70
65-Continuedservices also include landscape architectural, drafting, building inspection, surveying and mapping, andtesting laboratory services. In contrast to data on total employment, data on the number of professionalsin the industry reveal that as of 2001-03, U.S. State regulatory bodies granted the right to practice in theseprofessions to 580,297 accountants, 105,149 architects, approximately 360,000 engineers, and1,048,903 attorneys. American Institute of Certified Public Accountants, from data supplied by theNational Association of State Boards of Accountancy, “Tabulation of CPAs as of August 1, 2002,” foundat http://www.aicpa.org/, retrieved Apr. 9, 2003; official of the National Council of ArchitecturalRegistration Boards, telephone interview with Commission staff, May 5, 2003; official of the NationalSociety of Professional Engineers, e-mail to Commission staff, May 7, 2003; and industry officialrepresenting the American Bar Association, e-mail to Commission staff, May 7, 2003.
66 Bureau of the Census, 2001 Service Annual Survey: Professional, Scientific, and TechnicalServices, table 6.1, found at http://www.census.gov/svsd/www/sas54.html, retrieved Mar. 19, 2003.Data for revenues at architectural and engineering services firms exclude revenues of landscapearchitectural services firms.
67 Government of Singapore, Ministry of Manpower, Report on Labour Force in Singapore, 2002,pp. 14-15, found at http://www.mom.gov.sg/, retrieved Mar. 28, 2003.
68 Officials of the Public Accountants Board of Singapore, the Institute of Certified PublicAccountants of Singapore, the Board of Architects of Singapore, and the Professional Engineers Board ofSingapore, e-mails to Commission staff, Apr. 20-24, 2003; and Ministry of Law, Singapore, “Findings ofLegal Census,” found at http://app.internet.gov.sg/scripts/ minlaw/hq/newswatch/, retrieved Mar.14, 2003.
69 PricewaterhouseCoopers, “International Briefings — Singapore: Audit Exemption for PrivateExempt Companies,” December 2002.
70 Government of Singapore, Ministry of Law, “Findings of Legal Census,” found athttp://app.internet.gov.sg/scripts/minlaw/, retrieved Mar. 14, 2003. According to responses fromprofessional licensing bodies in Singapore to inquiries by Commission staff, no information is availableas to revenues generated by other professional service industries in Singapore.

84
Potential Impact on U.S. ImportsThe U.S.-Singapore FTA is not likely to result in a measurable increase in U.S. importsof professional services, given the current low level of imports from Singapore and thelikely continuation of mostly regional operations by Singapore professional servicefirms. In 2001, U.S. imports of architectural and engineering services from Singaporetotaled $1 million,71 while U.S. imports of legal services from Singapore totaled $6million. Such imports represented just 0.2 percent and 0.8 percent of total U.S. importsof architectural and engineering services and legal services, respectively, in 2001.Accounting services trade data are not separately reported;72 however, it is likely thatU.S. imports of accounting services from Singapore represent a similarly marginalshare of total U.S. imports of such services.
The U.S. professional services market has few barriers. Market access conditions forSingapore professionals may be further improved by provisions in the U.S.-SingaporeFTA that expedite short-term multiple entry of professionals. The FTA’s provisions forspecial visas for professionals, which require a change in U.S. immigration law, wouldbe based on proof of nationality, the purpose of entry, and evidence of professionalcredentials. The U.S.-Singapore FTA establishes an initial annual limit of 5,400Singapore professionals approved for admission into the United States. Despite thesebenefits, U.S. industry sources expressed disappointment that the agreement will notallow temporary entry into the United States of very highly skilled or talented personswho do not have the requisite level of education to meet the U.S. definition ofprofessional but who operate at such a level by exceptional experience and training.73
Potential Impact on U.S. ExportsThe U.S.-Singapore FTA reduces certain restrictive regulatory barriers affecting U.S.professional service firms.74 However, the agreement is not likely to result in ameasurable increase in U.S. exports of professional services. Singapore represents arelatively small market for U.S. exports of professional services.75 In 2001, U.S.
71 Ibid. and PricewaterhouseCoopers, “International Briefings — Singapore: Recommendations ofthe Economic Review Committee,” Oct. 2002.
72 These data report U.S. imports of construction, engineering, architectural, and mining services,combined. Import data for these services, unlike export data, are not published net of merchandiseimports and outlays for wages and other expenses. USDOC, BEA, Survey of Current Business, Oct. 2002,p. 119.
73 Ibid. U.S. import data on accounting services are combined with those on medical services,miscellaneous disbursements, operational leasing, sports and performing arts, training services, andother business, professional, and technical services, unaffiliated, which totaled $45 million fromSingapore in 2001.
74 “The U.S.-Singapore Free Trade Agreement (FTA),” report of the Industry Sector AdvisoryCommittee on Services for Trade Policy Matters (ISAC 13), available at http://www.ustr.gov, retreivedFeb. 28, 2003.
75 For example, local ownership restrictions will be relaxed for U.S. architectural and engineeringfirms. Singapore will also relax the requirement that U.S. law firms must participate in joint law ventureswith local firms, and the country will recognize law degrees granted to Singapore citizens andpermanent residents by a limited number of U.S. law schools for the purposes of qualifying for theSingapore bar.
85
exports of architectural and engineering services to Singapore totaled a negative $37million,76 while U.S. exports of legal services to Singapore totaled $36 million.77 Thenet negative in architectural and engineering services exports to Singapore contrastedwith net exports of $2.6 billion of such services to all countries in 2001. Singaporeaccounted for 1 percent of the $3.1 billion in legal services exported in 2001.
Statements to the Commission convey that under the U.S.-Singapore FTA, Singaporeagrees to reduce restrictions and provide enhanced market access for U.S.professional service firms and individuals,78 easing conditions on the practice ofarchitectural, engineering and land surveying, and legal services.79 Nevertheless, theU.S.-Singapore FTA does not liberalize important segments of Singapore’sprofessional services industry in certain major respects. For example, Singaporeincludes registration and residency requirements among its reservations on auditingservices in the FTA. Moreover, reservations that apply to corporations providingauditing services appear to be more stringent than reservations stated in theSingapore-Australia FTA.80
Concerning legal services, foreign law firms operating in Singapore are currentlyprohibited from practicing the law of Singapore, nor may they hire Singapore lawyersto practice the law of Singapore. Additionally, foreign law firms cannot litigate inSingapore’s courts.81 The removal of the first two restrictions is considered mostimportant to the U.S. industry.82 However, aside from certain provisions granting U.S.lawyers the ability to practice the law of Singapore provided they work for aSingapore law firm, the U.S.-Singapore FTA includes reservations by Singapore topreserve the restrictions regarded as the most burdensome. The agreement modestlyimproves conditions of establishment by easing requirements to form joint law ventures
76 U.S. exports of construction, engineering, architectural, and mining services to Singapore, forexample, were recorded as a negative value in 2001, as the value of contractually linked merchandiseexports and outlays abroad for wages, materials, and other expenses exceeded the value of exports ofsuch services.
77 USDOC, BEA, Survey of Current Business, Oct. 2002, pp. 118-119. The data cited are exports ofconstruction, engineering, architectural, and mining services, net of merchandise exports and net ofoutlays abroad for wages, services, materials, and other expenses.
78 USDOC, BEA, Survey of Current Business, Oct. 2002, p. 118. Export data on accounting servicesare aggregated with other business, professional, and technical services, unaffiliated, in the samemanner as import data cited above. In 2001, exports to Singapore of these services, including accountingservices, totaled $30 million.
79 Myron Brilliant, Vice President - Asia, United States Chamber of Commerce, written submission,Apr. 24, 2003.
80 H.E. The Hon. Chan Heng Chee, Ambassador of Singapore, written submission, Apr. 24, 2003.81 Reservations by Singapore in the agreement with Australia do not include requirements present in
the agreement with the United States that not less than two-thirds of the boards of directors must beSingapore-registered public accountants, the business of the corporation must be under the control ofdirectors who are Singapore-registered public accountants, and not less than two-thirds of the votingshares of the corporation must be owned by Singapore-registered public accountants. U.S. Departmentof State telegram, “Singapore-Australia FTA Signed,” message reference No. 00632, prepared by U.S.Embassy, Singapore, Feb. 18, 2003.
82 “The U.S.-Singapore Free Trade Agreement (FTA),” report of the Industry Sector AdvisoryCommittee on Services for Trade Policy Matters (ISAC 13), available at http://www.ustr.gov, retreivedFeb. 28, 2003.
86
or formal law alliances with Singapore law firms.83 The agreement also enables U.S.lawyers to participate in arbitrations in Singapore with assistance from Singaporelawyers in applying the law of Singapore. Under the agreement, for the first time, lawdegrees granted to Singapore citizens or permanent residents from four U.S. lawschools are to be recognized for the purpose of partially fulfilling requirements foradmission to practice law in Singapore.84 Nonetheless, these relatively narrow gainscombined with the small size of the Singapore market suggest that the FTA will not likelyresult in a notable increase in U.S. exports of legal services.
With respect to architectural and engineering services, U.S. industry sources note thatthe agreement could improve the conditions under which most engineering firmsoperate in Singapore and level the playing field among competitors.85 Nevertheless,Singapore’s national treatment reservations raise concern from U.S. industry sourcesover the lack of a phase-out period for local control of ownership of engineeringservice firms. Singapore’s reservations state that Singapore-registered professionalsmust comprise at least 51 percent of directors in architectural and engineeringcorporations, and fully control assets and profits in partnerships. Moreover, U.S.industry sources consider Singapore’s government procurement contracts’ minimumvalues ambiguous with regard to construction services, potentially subjectingengineering services to high domestic preference requirements.86 Singaporemaintains a residency requirement on architectural and engineering services. U.S.industry sources condition support of the Singapore FTA on their understanding that aforeign person can easily obtain a type of Singapore residency/employment visaknown as the employment pass, which is part of a visa program that allows aprofessional to remain in Singapore more than 90 days.87 As with legal services, theapparent limitations and/or liberalization accorded by the U.S.-Singapore FTA willnot likely increase or deter exports, as the overall market in Singapore is small.
83 Hearing transcript at p. 25.84 By comparison, provisions of the Singapore-Australia FTA doubled the number of Australian
universities whose law degrees are recognized in Singapore, from four to eight. Nineteen Britishuniversities and two New Zealand universities also have law degrees recognized in Singapore.Australian Department of Foreign Affairs and Trade, “Singapore-Australia Free Trade Agreement(SAFTA),” found at http://www.dfat.gov.au/trade/negotiations/, retrieved Mar. 20, 2003; andUSDOC, FCS, “Singapore Country Commercial Guide FY 2003 - Investment Climate,” Aug. 19, 2002,found at http://www.stat-usa.gov, retrieved Mar. 26, 2003.
85 “The U.S.-Singapore Free Trade Agreement (FTA),” report of the Industry Sector AdvisoryCommittee on Services for Trade Policy Matters (ISAC 13), available at http://www.ustr.gov, retreivedFeb. 28, 2003.
86 Ibid.87 Ibid.
87
Telecommunications Services
Overview
U.S. IndustryTelecommunication services include both basic and value-added services, both ofwhich can be provided across national borders and through foreign-basedaffiliates.88 In terms of revenue, the U.S. telecommunication services industry is thelargest in the world. In 2000, U.S. telecommunication services revenues totaled$292.8 billion, representing nearly 33 percent of worldwide revenues.89 In 2001, theU.S. telecommunication services industry contributed approximately 2 percent to U.S.GDP and employed 1.1 million people, accounting for approximately 1 percent of totalU.S. employment.90 Although the U.S. industry consists of over 700 companies thatprovide long distance telephone services and approximately 1,300 companies thatprovide local services,91 over 90 percent of U.S. telecommunication service revenuesare generated by three long-distance companies and the four Regional Bell OperatingCompanies (RBOCs).92 Similarly, in 2001, eight service providers accounted for 84percent of total subscribers in the U.S. wireless telecommunication services segment.93
The U.S. telecommunication services industry is currently recovering from the excessesof the late 1990s telecom boom, when many companies borrowed heavily to buildbroadband networks and develop new services, both domestically and abroad.Ultimately, these firms were left with massive excess capacity and unmanageable debtloads when actual network traffic flows fell far short of predictions. The inflatedexpectations of demand and profitability that prevailed at the end of the 1990s alsoencouraged scores of new companies to enter the U.S. market. Subsequent intensecompetition led to falling service prices and revenue shortfalls in many marketsegments. As a result, many companies in the U.S. telecommunication services industryfiled for bankruptcy, including new entrants such as Global Crossing and incumbentssuch as Worldcom. Despite the current financial problems in the industry, U.S.telecommunications firms are highly competitive globally. The major U.S. firms,including AT&T, MCI, and Sprint, operate in most international markets, incorporateadvanced network technology, and offer innovative services.
88 Basic services include the transmission of voice without change in form or content. Value-addedservices include services such as electronic mail, electronic data interchange, electronic funds transfer,enhanced facsimile, and on-line database access.
89 International Telecommunications Union (ITU), World Telecommunication Development Report,2002, Geneva: ITU, Mar. 2002, p. A-55.
90 USDOC, BEA, Survey of Current Business, Nov. 2002, p. 32; and USDOC, BEA, Survey ofCurrent Business, Aug. 2002, p. 80.
91 Standard and Poor’s, Telecommunications: Wireline, Industry Survey, May 31, 2002.92 The three long-distance companies are AT&T Corp., Sprint Corp., and MCI, Inc. The four Regional
Bell Operating Companies are Verizon Inc., BellSouth, SBC Communications, and QwestCommunications International.
93 These include Verizon, Cingular, AT&T, Sprint PCS, Nextel, Voicestream, Alltel, and US Cellular.
88
Industry in Singapore
Singapore has one of the world’s most advanced telecommunication networks. Thewireline network reaches over 95 percent of Singapore households, and more than 70percent of the population owns a mobile telephone.94 In 2001, revenues fortelecommunication services in Singapore totaled $2.4 billion, representing less than 1percent of worldwide telecommunication service revenues. 95State-controlledSingapore Telecommunications Limited (SingTel) is the dominant player in allsegments of Singapore’s telecommunication services industry, including nationaltelephone services, public and private network and data services, mobilecommunications, and international services.96 Its main competitor is Starhub, whichoffers competition in the fixed line, Internet, and mobile markets. Other majorcompetitors in Singapore include Internet service provider Pacific Internet and wirelessservices provider Mobile One. Growth in Singapore’s wireline and wireless servicemarkets is unlikely owing to the country’s small population as well as high penetrationrates for telecommunication services. Despite the small number of companies,Singapore’s telecommunication services market is highly competitive, with newentrants competing against incumbent firms for market share. Such competitionamong existing players in Singapore has led to price erosion in several importantmarkets, resulting in declining industry profitability.
Potential Impact on U.S. ImportsThe telecommunication services sector is the subject of a distinct chapter in theU.S.-Singapore FTA, due not only to its prominence in terms of bilateral trade but alsoowing to its vital role as an input in the production and trade of goods and services.However, while the agreement is noted as further liberalizing market access intelecommunication services,97 the U.S.-Singapore FTA will likely have no measurableimpact on U.S. imports of telecommunication services. Accounting rate reductions areexpected to be the major determinant of changes in imports of telecommunicationservices from Singapore. Cross-border telecommunication services import dataprimarily reflect U.S. carriers’ payments to Singapore firms for the transmission ofvoice messages, measured in minutes. Such imports largely depend on the accountingrate level, which has fallen by approximately 42 percent since 1998 as a result ofreform efforts led by the U.S. Federal Communications Commission. Althoughdeclining accounting rates will likely lead to an increase in the volume of voice minutestraded between Singapore and the United States, the value of imports measured indollars will likely decline as a result of the large reduction in accounting rates.
94 USDOC, US&FCS, Singapore Country Commercial Guide 2003, found at Internet addresshttp://www.buyusainfo.net, retrieved on Mar. 18, 2003; and USDOC, US&FCS, Recent Developments inSingapore’s Telecommunication Industry, found at http://www.buyusainfo.net, retrieved on Mar. 18,2003.
95 ITU, World Telecommunication Development Report, 2002, p. A-55.96 SingTel was partially privatized in 1993, leaving the government with a 67.5 percent share of the
company.97 Hearing transcript at pp. 26 and 114.

89
The United States telecommunications market is already relatively open, as is reflectedin the WTO Basic Telecommunications Agreement.98 Moreover, the main provisions ofthe U.S.-Singapore FTA, which include commitments related to network access andinterconnection, licensing and regulatory transparency, and competitive safeguards,are already largely reflected in the reference paper attached to the United States’WTO commitments. Despite such openness, Singapore telecommunication servicesfirms have not entered the U.S. market. In the near term, economic conditions in thedomestic U.S. market together with the scarcity of capital for telecommunicationprojects will likely reduce the incentive for Singapore telecom firms to establish anaffiliate in the United States. Over the long term, however, the incrementalcommitments made in the U.S.-Singapore FTA may benefit prospective U.S.-basedSingapore affiliates through increased transparency and greater regulatorycertainty.
Potential Impact on U.S. ExportsThe U.S.-Singapore FTA will likely have no measurable impact on U.S. exports oftelecommunication services. Commitments made by the government of Singapore aspart of the WTO Basic Telecommunications Agreement lifted most restrictions.Moreover, the main provisions of the U.S.-Singapore FTA, which include commitmentsrelated to network access and interconnection, licensing and regulatory transparency,and competitive safeguards, are already largely reflected in the reference paperattached to Singapore’s WTO commitments. Further, the only major limitationscheduled by Singapore in the WTO agreement, a foreign ownership restriction, wasunilaterally lifted in April 2000.99 U.S. industry concerns related to the Singaporetelecommunication services market center on the high cost of leased circuits inSingapore. The U.S.-Singapore FTA, by requiring that major Singaporetelecommunication suppliers lease circuits at terms, conditions, pricing structures, andrates that are reasonable, nondiscriminatory, and transparent, will likely remove thismarket impediment.
Although U.S. telecommunication service providers AT&T and MCI have establishedoperations in Singapore, it is not a key market owing to its small population.100
Moreover, in the short term, poor economic conditions in the U.S. domestic marketcombined with the scarcity of capital for telecommunication projects will likely limitadditional investment in the Singapore telecommunication services sector by U.S.firms. Over the long term, the incremental commitments made in the U.S.-SingaporeFTA will benefit U.S. companies with an established commercial presence in Singaporethrough increased transparency and greater regulatory certainty.
98 The WTO Basic Telecommunications Agreement became effective Feb. 5, 1998.99 Representative from the Infocomm Development Authority of Singapore, e-mail to Commission
staff, Mar. 31, 2003.100 In 2001, exports of U.S. telecommunication services to Singapore amounted to only 2.1 percent
of total telecommunications exports and only 0.03 percent of total private services exports.

90
As described above, accounting rate reductions are expected to be the largestdeterminant of changes in exports of telecommunication services to Singapore.Cross-border telecommunication services export data primarily reflect U.S. firms’receipts from Singapore for the transmission of voice messages, measured in minutes.Although declining accounting rates will likely lead to an increase in the volume ofvoice minutes traded between Singapore and the United States, the value of exportsmeasured in dollars will likely decline as a result of large reductions in the accountingrate.

91
CHAPTER 7Impact of a U.S.-Singapore FTA on IntellectualProperty Rights
Singapore is generally noted as having a comparatively strong intellectual propertyrights (IPR) regime; however, certain difficulties remain. The U.S.-Singapore FTApromises to build on the country’s established commitments and practices and addressremaining concerns about IPR protection for U.S. firms and industries. The FTA sets outhigh standards for protection and enforcement for copyrights and other intellectualproperty and may lead to increased revenues for certain U.S. industries dependent onIPR. The following presents a description of the current status of IPR protection inSingapore, summarizes key provisions of the FTA related to IPR, and to the extentpossible describes the potential effects of implementation of IPR provisions in the FTAon U.S. industries and the U.S. economy as a whole.
Current Conditions of IPR Protection in Singapore
Although Singapore is generally considered to have made substantial progress inimproving its intellectual property rights (IPR) regime over the past several years,problems remain.1 As a member of the World Trade Organization (WTO), Singaporemust comply with the WTO Agreement on Trade-Related Aspects of IntellectualProperty Rights (TRIPs), which it has implemented in its domestic legislation.2
Singapore also has acceded to several major international IPR treaties including theParis Convention, the Berne Convention, the Budapest Treaty, and the NiceAgreement. Singapore IPR-related legislation includes the Copyright Act of 1987, theTrade Marks Act of 1998, the Patents Act of 1994, the Geographical Indications Act of1998, and the Layout Design of Integrated Circuits Act of 1999.3 Further, improvementin enforcement in recent years led to Singapore’s removal from the U.S. Special 301Watch List4 in 2001.
1 United States Trade Representative (USTR), “Singapore,” 2003 National Trade Estimate Report onForeign Trade Barriers, Mar. 31, 2003, pp. 343-44.
2 Singapore Economic Development Board (EDB), “Protecting Intellectual Property Rights inSingapore,” Business Resources, 2003, found at http://www.sedb.com/edbcorp, retrieved Feb. 26,2003.
3 Ibid.4 Special 301 refers to a provision of U.S. trade law that requires USTR to provide an annual report
to identify countries that deny adequate and effective protection of intellectual property rights (IPR), ordeny fair and equitable market access to U.S. persons or firms that rely on intellectual property protection.Countries with laws, policies, or practices that have the greatest adverse effects on relevant U.S.producers or products must be designated as Priority Foreign Countries unless USTR finds that thecountries are entering into good faith negotiations or are making significant progress in bilateral or
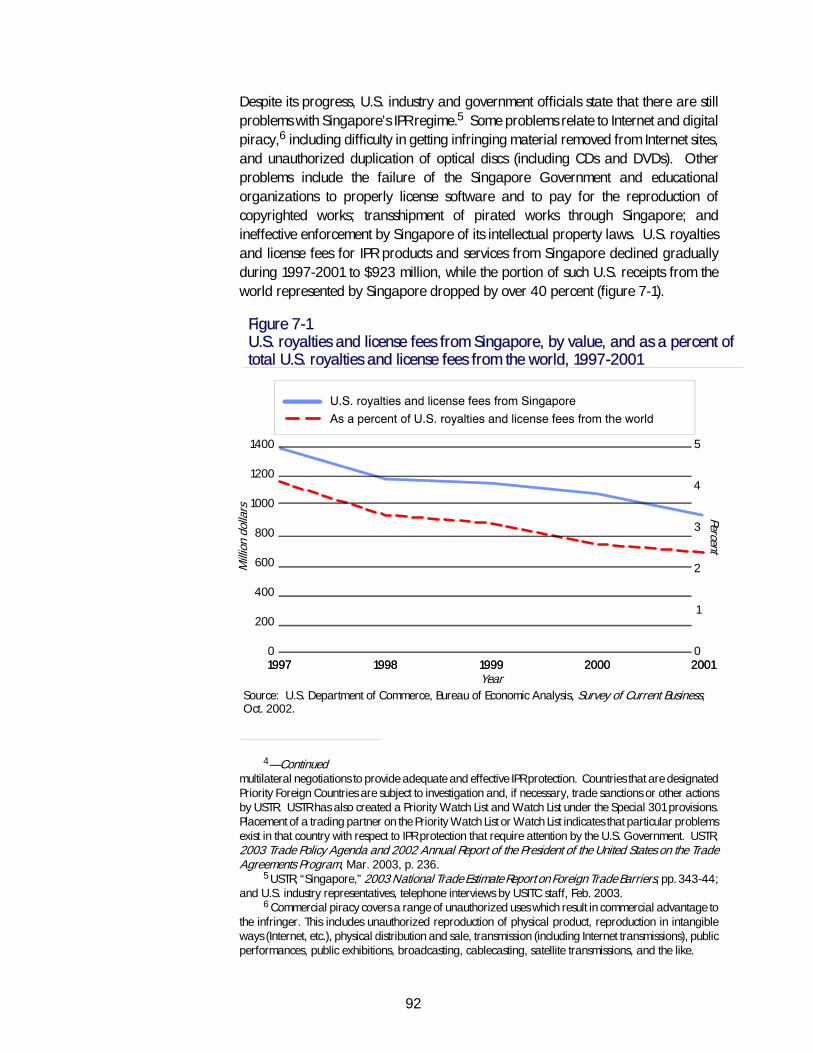
92
Despite its progress, U.S. industry and government officials state that there are stillproblems with Singapore’s IPR regime.5 Some problems relate to Internet and digitalpiracy,6 including difficulty in getting infringing material removed from Internet sites,and unauthorized duplication of optical discs (including CDs and DVDs). Otherproblems include the failure of the Singapore Government and educationalorganizations to properly license software and to pay for the reproduction ofcopyrighted works; transshipment of pirated works through Singapore; andineffective enforcement by Singapore of its intellectual property laws. U.S. royaltiesand license fees for IPR products and services from Singapore declined graduallyduring 1997-2001 to $923 million, while the portion of such U.S. receipts from theworld represented by Singapore dropped by over 40 percent (figure 7-1).
0
200
400
600
800
1000
1200
1400
1997 1998 1999 2000 20010
1
2
3
4
5
1997 1998 1999 2000 2001Year
Figure 7-1U.S. royalties and license fees from Singapore, by value, and as a percent oftotal U.S. royalties and license fees from the world, 1997-2001
Source: U.S. Department of Commerce, Bureau of Economic Analysis, Survey of Current Business,Oct. 2002.
Mill
ion
dolla
rs Percent
U.S. royalties and license fees from SingaporeAs a percent of U.S. royalties and license fees from the world
4—Continuedmultilateral negotiations to provide adequate and effective IPR protection. Countries that are designatedPriority Foreign Countries are subject to investigation and, if necessary, trade sanctions or other actionsby USTR. USTR has also created a Priority Watch List and Watch List under the Special 301 provisions.Placement of a trading partner on the Priority Watch List or Watch List indicates that particular problemsexist in that country with respect to IPR protection that require attention by the U.S. Government. USTR,2003 Trade Policy Agenda and 2002 Annual Report of the President of the United States on the TradeAgreements Program, Mar. 2003, p. 236.
5 USTR, “Singapore,” 2003 National Trade Estimate Report on Foreign Trade Barriers, pp. 343-44;and U.S. industry representatives, telephone interviews by USITC staff, Feb. 2003.
6 Commercial piracy covers a range of unauthorized uses which result in commercial advantage tothe infringer. This includes unauthorized reproduction of physical product, reproduction in intangibleways (Internet, etc.), physical distribution and sale, transmission (including Internet transmissions), publicperformances, public exhibitions, broadcasting, cablecasting, satellite transmissions, and the like.

93
Internet, optical disc, and other digital piracy in Singapore continue to be the majorareas of concern. Unlike the United States, Singapore has not yet signed or ratified theWorld Intellectual Property Organization (WIPO) Copyright Treaty (WCT) or theWIPO Performances and Phonograms7 Treaty (WPPT),8 both of which were adoptedin 1996 to address Internet and other types of digital piracy (see text box).9 U.S.industry and government officials state that Singapore’s requirements and proceduresfor removing IPR infringing material from Internet sites are time consuming andineffective.10 Further, because Internet service providers are not liable for allowingwebsites hosted on their servers to offer and sell pirated products, they have littleincentive to work with IPR holders to remove such material. Unauthorized duplicationof optical discs11 is another major digital piracy problem as pirated audio and videodiscs are widely available throughout the country, and software piracy rates, whilelow for Asia, are significantly higher than in the United States.12 U.S. industryrepresentatives state that if Singapore required the use of source identification codeson every optical disc produced, it would minimize some of these illicit activities.
The unauthorized use of copyrighted material by schools, businesses, and governmentagencies is costly to U.S. right holders. Some government-operated educationalinstitutions are still not in compliance with Singapore’s legal obligations to pay royaltyfees to publishers to obtain the right to duplicate copyrighted printed material for use incourse materials.13 Meanwhile, many businesses and some government agencies useunlicensed software.14 Failure of these organizations to comply with copyrightrequirements costs U.S. publishers millions of dollars each year in lost sales andlicensing fees.
Transshipment of IPR infringing products from other Asian countries throughSingapore has become a problem, because of Singapore’s importance as an Asianport.15 To rectify this, U.S. industry representatives believe that Singapore mustrespond by enacting criminal sanctions and actively pursue such transshipments,regardless of the origin of the infringing goods.16 Such efforts would require
7 Phonograms are sound recordings.8 Hearing transcript at pp. 89 and 92.9 These two treaties are often referred to as the “Internet Treaties,” because they provide new
international standards for the protection of copyrights and related rights in the digital economy. Bothtreaties went into force as international law in 2002, once the required 30 governments had formallyacceded to them. The United States ratified each treaty and implemented them domestically via the DigitalMillennium Copyright Act of 1998.
10 U.S. industry representatives, telephone interviews by USITC staff, Feb. 2003.11 Motion Pictures Association of America (MPAA), “Statement by Jack Valenti on the US-Singapore
Free Trade Agreement,” MPAA Press Releases, Jan. 17, 2003, p. 1, found at http://www.mapaa.org,retrieved Apr. 8, 2003.
12 USTR, “Singapore,” 2003 National Trade Estimate Report, pp. 343-44; and U.S. industryrepresentatives, telephone interviews by USITC staff, Feb. 2003.
13 Ibid.14 Ibid.15 Hearing transcript at pp. 126-128.16 U.S. industry representatives, interviews by USITC staff, June-Aug. 2002.
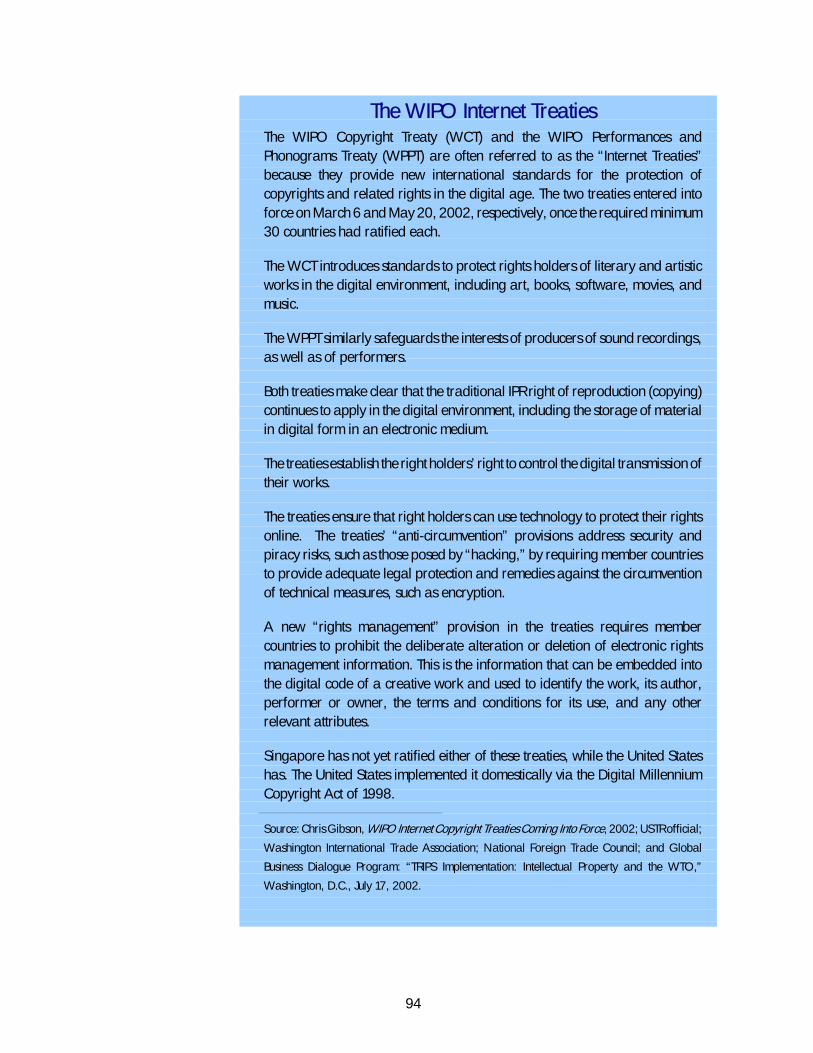
94
The WIPO Internet TreatiesThe WIPO Copyright Treaty (WCT) and the WIPO Performances andPhonograms Treaty (WPPT) are often referred to as the “Internet Treaties”because they provide new international standards for the protection ofcopyrights and related rights in the digital age. The two treaties entered intoforce on March 6 and May 20, 2002, respectively, once the required minimum30 countries had ratified each.
The WCT introduces standards to protect rights holders of literary and artisticworks in the digital environment, including art, books, software, movies, andmusic.
The WPPT similarly safeguards the interests of producers of sound recordings,as well as of performers.
Both treaties make clear that the traditional IPR right of reproduction (copying)continues to apply in the digital environment, including the storage of materialin digital form in an electronic medium.
The treaties establish the right holders’ right to control the digital transmission oftheir works.
The treaties ensure that right holders can use technology to protect their rightsonline. The treaties’ “anti-circumvention” provisions address security andpiracy risks, such as those posed by “hacking,” by requiring member countriesto provide adequate legal protection and remedies against the circumventionof technical measures, such as encryption.
A new “rights management” provision in the treaties requires membercountries to prohibit the deliberate alteration or deletion of electronic rightsmanagement information. This is the information that can be embedded intothe digital code of a creative work and used to identify the work, its author,performer or owner, the terms and conditions for its use, and any otherrelevant attributes.
Singapore has not yet ratified either of these treaties, while the United Stateshas. The United States implemented it domestically via the Digital MillenniumCopyright Act of 1998.
Source: Chris Gibson, WIPO Internet Copyright Treaties Coming Into Force, 2002; USTR official;
Washington International Trade Association; National Foreign Trade Council; and Global
Business Dialogue Program: “TRIPS Implementation: Intellectual Property and the WTO,”
Washington, D.C., July 17, 2002.

95
Singapore to change its laws to make the export, transshipment, or brokering ofinfringing products a crime.17
U.S. industry and government officials state that enforcement of IPR laws in Singaporecould be improved.18 Although Singapore has established a special branch in itspolice force to enforce its IPR laws, right holders are still required to make significantefforts of their own to initiate the prosecution of infringement cases. This places anexpensive burden on right holders. According to the U.S. officials, Singapore shouldtreat IPR infringement in the same manner as other crimes of theft, with police takinggreater initiatives in the investigation and prosecution of such crimes.
Major IPR Provisions of the U.S.-Singapore FTA
In general, the IPR provisions of the U.S.-Singapore FTA go further than the WTO TRIPsagreement to protect intellectual property rights. National treatment provisions arebroad, permit no exceptions, and extend to “any benefits derived” from the“protection and enjoyment” of intellectual property of any kind.19 Other significantenhancements include stronger protections for copyrights (including those for digitaland Internet works), trademarks, patents, and trade secrets. IPR enforcementprovisions are also strongly increased in the agreement.20
CopyrightsAmong the major IPR achievements of the U.S.-Singapore FTA is that it addressesdigital and, in particular, Internet piracy by containing a number of copyrightprovisions included in the WCT and the WPPT, while requiring the ratification of, oraccession to, those treaties within one year of the date of entry into force of the FTA.21
In this regard, the FTA ensures that only authors, composers, and other copyrightowners have the right to make their works available online. Further, copyright ownersmaintain rights to temporary copies of their works on computers, which is important inprotecting music, videos, software, and text from unauthorized sharing on the Internet.
17 U.S. Department of State, “Fact Sheet: U.S.-Free Trade Agreement With Singapore,” pp. 1-11,Press Release, Dec. 19, 2002, found at http://www.state.gov, retrieved Feb. 21, 2003.
18 USTR, “Singapore,” 2003 National Trade Estimate Report, pp. 343-44; and U.S. industryrepresentatives, telephone interviews by USITC staff, Feb. 2003.
19 Industry Functional Advisory Group on Intellectual Property Rights for Trade Policy Matters(IFAC-3), The U.S.-Singapore Free Trade Agreement: The Intellectual Property Provisions,Feb. 28, 2003, p. 5, found at http://www.ustr.gov, retrieved Mar. 13, 2003.
20 Hearing transcript at p. 89; and the United States Chamber of Commerce, “SingaporeFTA–Almost Concluded–With Free Flow of Capital Caveat,” Asia, 2003, found athttp://www.uschamber.com, retrieved Feb. 26, 2003.
21 MPAA, “Statement by Jack Valenti on the US-Singapore Free Trade Agreement,” p. 1; USTR,“Free Trade with Singapore,” Trade Facts, Dec. 16, 2002, pp. 1 and 5-7; and International IntellectualProperty Alliance (IIPA), “The Copyright Industries Laud the Conclusion of the U.S.-Singapore Free TradeAgreement,” Press Release, Jan. 21, 2003, pp. 1-2.

96
Also, the FTA provides strict legal protections and remedies against the circumventionof effective technological measures used by copyright holders to prevent piracy andunauthorized distribution of copyrighted materials over the Internet.22 The FTA statesthat to knowingly participate in such piracy, circumvention, or unauthorizeddistribution of copyrighted material will result in criminal and civil liability.23
Also included under FTA digital IPR provisions are a number of other requirements.For instance, the unauthorized production of optical discs is prohibited, andauthorized production must be licensed.24 Moreover, every licensee is to ensure thateach optical disc manufactured is marked with a source identification ormanufacturer’s code and that production records are maintained.25 The alteration ofrights management information or trafficking in works from which rights managementinformation has been removed or altered is also prohibited, and such activities aresubject to criminal and civil liability. Further, because the pervasive digitization ofcopyrighted works and their transmission over the Internet leave little justification tocontinue treating sound recordings differently from other protected works, the FTAdoes not make a distinction between copyright and “related” rights, in contrast toprevious agreements.26 This change ensures that the level of protection for recordproducers and performers, often protected under “related” or “neighboring” rightsregimes in many other countries, is the same as for other copyright protectionprovisions, including those provided by the Berne Convention, a principalinternational treaty governing copyright protection.27
In addition, protection for encrypted program-carrying satellite signals is extended tothe signals themselves as well as the programming. The manufacture and traffickingof tools to unlawfully intercept the signals is prohibited in order to deter piracy ofsatellite television programming. Satellite signal piracy is subject to both civil andcriminal liability. Finally, each party is to ratify or accede to the Brussels ConventionRelating to the Distribution of Programme-Carrying Signals Transmitted by Satellitewithin one year of the date or entry into force of the FTA.
Other copyright provisions of the FTA extend terms of protection beyond thoserequired by TRIPs.28 Under the FTA, where the term of protection of a work (includinga photographic work), performance or phonogram is to be calculated on the basis of aperson’s life, the term shall be not less than the life of the author and 70 years after the
22 Singapore Ministry of Trade and Industry, Information Paper on the U.S.-Singapore Free TradeAgreement, Dec. 16, 2002, pp. 1-8, found at http://www.mti.gov.sg, retrieved Feb. 21, 2003.
23 However, immunity will be provided to Internet service providers for complying with notificationand take-down procedures when materials suspected to be infringing are hosted on their servers. Ibid.
24 Side letter on Intellectual Property, Optical Disks of the U.S.-Singapore FTA.25 Singapore may provide an exception to this obligation in cases where each right holder that has a
right to the content to be contained on an optical disc expressly requests that no manufacturer’s code bemarked on the optical disc. Side letter on Intellectual Property, Optical Disks of the U.S.-Singapore FTA.
26 IFAC-3, The U.S.-Singapore Free Trade Agreement: The Intellectual Property Provisions, pp. 8-9.27 Ibid.28 MPAA, “Statement by Jack Valenti on the US-Singapore Free Trade Agreement,” p. 1.

97
author’s death. By reference to the Berne Convention, the term of protection in TRIPs islife of the author and 50 years after his death.29 In cases where the term of protectionof a work (including a photographic work), performance, or phonogram is to becalculated on a basis other than the life of a person, the term in the FTA is 70 years fromthe end of the calendar year of the first authorized publication of the work. Thecomparable period of protection in TRIPs is 50 years and does not apply tophotographic works. Finally, failing such authorized publication within 50 years fromthe creation of a work (including a photographic work), performance, or phonogram,the FTA term of protection is to be not less than 70 years from the end of the calendaryear of the creation of the work. Again, the comparable period of protection in TRIPs is50 years and does not apply to photographic works.
The U.S.-Singapore FTA prohibits unauthorized use of software by governmentagencies. Appropriate administrative or executive decrees, laws, orders, orregulations are to be issued mandating that all government agencies use onlycomputer software authorized for intended use. Records of software present ongovernment agencies’ computers and existing software licenses shall be maintained toactively regulate the acquisition and management of such software.
TrademarksTrademark protections are also strengthened by the U.S.-Singapore FTA, andprovisions have been simplified for right holders. The FTA provides that the owner of aregistered trademark shall have the exclusive right to prevent third parties not havingthe owner’s consent from using identical or similar signs where such use would result ina likelihood of confusion, with limited exceptions such as fair use of descriptive terms.30
The FTA broadens protection of well-known marks, extending protection of such marksto dissimilar goods and services, whether registered or not. This broadened protectionis based on an association between the goods and services and the owner of thewell-known mark and when the interests of the trademark owner are likely to bedamaged.31 Trademark licensees will no longer be required to register theirtrademark licenses in order to assert their rights to a trademark.32 Further, thetrademark filing process is simplified by allowing applicants to use their own nationalpatent/trademark offices for filing trademark applications for acceptance in the othercountry.33 The provisions also apply the principle of “first-to-file, first-in-right” to
29 Although the term of protection based on the life of a natural person is not specifically stated in theWTO TRIPs Agreement, Article 9 of that agreement specifies that WTO members shall comply withArticles 1-21 of the Berne Convention for the Protection of Literary and Artistic Works (1971). Article 7 ofthe Berne Convention provides that “the term of protection granted by this Convention shall be the life ofthe author and fifty years after his death.”
30 IFAC-3, The U.S.-Singapore Free Trade Agreement: The Intellectual Property Provisions, p. 6.31 The U.S.-Singapore FTA provides that each party shall, at a minimum, give effect to Articles 1-6 of
the Joint Recommendation Concerning Provisions on the Protection of Well-Known Marks (1999),adopted by the Assembly of the Paris Union for the Protection of Industrial Property and the GeneralAssembly of WIPO; and certain provisions of the Trademark Law Treaty.
32 Singapore Ministry of Trade and Industry, Information Paper on the U.S.-Singapore Free TradeAgreement, pp. 1-8.
33 Ibid.; and USTR, “Free Trade with Singapore,” pp. 1 and 5-7.
98
trademarks and geographical indicators34 applied to products. Thus, the first to filefor a trademark is granted the first right to use that name, phrase, or geographicalplace name. Trademark provisions of the FTA also ensure government involvement inresolving disputes related to the illegal use of trademarks in Internet domain names.
Patents and Trade SecretsThe patent and trade secret provisions of the U.S.-Singapore FTA clarify and improveon the standards contained in the TRIPs agreement.35 Each party shall make patentsavailable and exclude inventions from patentability only in limited cases as defined inTRIPs. Grounds for revoking a patent are limited to the same grounds required tooriginally refuse a patent to prevent arbitrary invalidation of a patent in favor ofanother party. The provisions also ensure that government product-approvalagencies will not grant approval to patent-violating products. Patent terms can beextended beyond the 20-year term required by TRIPs to compensate for up-frontadministrative or regulatory delays in granting the original patent.36 Pharmaceuticalcompanies owning patented products are protected against the import ofpharmaceutical products by other parties without the patent holder’s consent.37
Patents covering bio-engineered plants and animals are allowed by the FTA, and eachparty is required to ratify or accede to the International Convention for the Protectionof New Varieties of Plants. Finally, test data and trade secrets submitted to agovernment for the purpose of product approval are to be protected againstdisclosure for a period of 5 years for pharmaceuticals and 10 years for agriculturalchemicals.38
EnforcementThe U.S.-Singapore FTA also provides for improved enforcement and tougherpenalties for IPR infringement.39 For instance, the FTA mandates both statutory andactual damages for copyright and trademark violations.40 This is expected to detersuch infringement by providing for monetary damages even when actual economicharm cannot be determined.41 To further deter copyright and trademark
34 Geographical indications identify a product with a given characteristic that is attributable to itsgeographical origin in a particular region, country, locality, etc. (e.g. Burgundy wine from France, notfrom California; basmati rice from India, not from Texas).
35 U.S. Department of State, “U.S.-Free Trade Agreement With Singapore,” pp. 1-11.36 Singapore Ministry of Trade and Industry, Information Paper on the U.S.-Singapore Free Trade
Agreement, pp. 1-8.37 U.S. pharmaceutical industry representatives, telephone interviews by USITC staff, Feb. 20, 2003.38 Pharmaceutical manufacturers state that all proprietary information submitted to a regulatory
body should be protected from unfair commercial use. They indicate that if it were not for the obligation toprovide test data to governments to gain marketing approval, data generated at considerable cost, time,and risk would be considered a trade secret. Pharmaceutical Research and Manufacturers of America(PhRMA), “Appendix A-1,” PhRMA Special 301 Submission, Mar. 31, 2003, pp. 151-152, found athttp://www.phrma.org, retrieved Apr. 8, 2003.
39 Hearing transcript at pp. 93-94 and 98; and USTR, “Free Trade with Singapore,” pp. 1 and 5-6.40 U.S. Department of State, “U.S.-Free Trade Agreement With Singapore,” pp. 1-11.41 Hearing transcript at pp. 93-94.
99
infringement, the FTA applies criminal procedures and penalties in cases of trademarkcounterfeiting, copyright, or related rights piracy that are willful or done on acommercial scale. It also makes end-user piracy a criminal offense. Enforcementprovisions of the FTA require the seizure, forfeiture, and destruction of counterfeit andpirated goods and the equipment used to produce them. Moreover, IPR laws are to beenforced not only against infringement originating within each country, but alsoagainst goods in transit to deter violators from using ports or free-trade zones to trafficin pirated products. To improve such enforcement, authorities may initiateunannounced border actions. To facilitate monitoring of the IPR enforcementprovisions of the FTA, laws and regulations pertaining to such enforcement shall bepublished and made publicly available, and each party to the FTA shall publicizeinformation on its efforts to provide effective enforcement. Finally, the FTA provides forcooperation between the two governments to prevent pirated and counterfeit goodsfrom being imported into each country.
Potential Effects
The intellectual property provisions of the U.S.-Singapore FTA address many of themost significant concerns the U.S. industry has expressed regarding the IPR regime inSingapore.42 Full implementation and enforcement of the IPR provisions of the FTA bySingapore will increase the level of protection currently afforded to IPR holders andlikely result in increased revenues for U.S. industries dependent on copyrights, patents,trademarks, and trade secrets. However, due to the relatively small size ofSingapore’s economy compared to that of the United States, any increases in revenuesfor the U.S. IPR industry would likely have a limited effect on the U.S. economy as awhole.43 As previously indicated, although data on total U.S. revenues derived fromthe sales of all IPR-dependent products are not available, U.S. royalties and licensingfees from Singapore represented a small percentage of the total of such revenues fromthe world (figure 7-1).44
Among the U.S. copyright industries that would potentially benefit most due to theincreased digital technology features of the FTA would be the motion picture industry,the recording industry, the software industry (including producers of both business and
42 Hearing transcript at pp. 89, 98, 106, and 114; IFAC-3, The U.S.-Singapore Free TradeAgreement: The Intellectual Property Provisions; IIPA, “The Copyright Industries Laud the Conclusion ofthe U.S.-Singapore Free Trade Agreement,” pp. 2-3; The United States Chamber of Commerce,“Singapore FTA–Almost Concluded–With Free Flow of Capital Caveat,” p. 1; and MPAA, “Statement byJack Valenti on the US-Singapore Free Trade Agreement,” p. 1.
43 However, the size of Singapore’s economy would have less of a limiting effect on U.S. industryrevenues resulting from Singapore’s increased responsibilities under the FTA for enforcing laws withrespect to infringing goods that are transshipped through its port from other countries.
44 U.S. Department of Commerce, Bureau of Economic Analysis, Survey of Current Business,Oct. 2002, p. 98.
100
entertainment software), and the publishing industry.45 Industries that would benefitfrom greater patent protections would include the pharmaceutical industry and theagricultural chemicals industry. A broad range of U.S. industries should benefit fromstrengthened trademark, trade secret, and other IPR provisions of the FTA.
Because the United States already meets the relatively high standards of IPR protectionand enforcement included in the U.S.-Singapore FTA, there would be little if any effecton U.S. industries or the U.S. economy based on U.S. implementation of its obligationsunder the FTA provisions.
The principal U.S. trade advisory committee representing IPR interests states that theIPR provisions of the U.S.-Singapore FTA are broadly consistent with the negotiatinggoals and objectives contained in the Trade Act of 2002 and those of the U.S.intellectual property-based industries, creators, and innovators.46 The committeestrongly supports the U.S.-Singapore FTA chapter on IPR, and believes that itestablishes precedents to be included in future FTAs, which can raise the level ofprotection and enforcement globally.
45 IIPA, “The Copyright Industries Laud the Conclusion of the U.S.-Singapore Free TradeAgreement,” pp. 1-2; and United States Chamber of Commerce, “Singapore FTA-AlmostConcluded-With Free Flow of Capital Caveat,” p. 1.
46 IFAC-3, The U.S.-Singapore Free Trade Agreement: The Intellectual Property Provisions, pp. 2-3.
101
CHAPTER 8Impact of a U.S.-Singapore FTA on Investment
The United States and Singapore have relatively open investment regimes and are keyinvestors in each other’s economies. Nonetheless, the investment provisions in theU.S.-Singapore FTA go beyond those of any other agreement to which both parties aresignatories and may therefore support continued growth in bilateral investment in thelong term. The following presents a description of the U.S.-Singapore bilateralinvestment relationship, summarizes the major investment provisions of the FTA relatedto investment, and to the extent possible, considers the potential effects ofimplementation of the investment provisions on U.S. industries and the U.S. economyas a whole.
U.S.-Singapore Investment
The United States and Singapore have a strong investment relationship. In 2001, theU.S. direct investment position in Singapore measured $27.3 billion on a historical costbasis (figure 8-1), which generated income of $2.1 billion.1 During 1997-2001, U.S.direct investment in Singapore increased at an average annual rate of 11 percent. TheUnited States is the leading foreign investor in Singapore,2 and only Japan, Australia,and Hong Kong host higher levels of U.S. investment within the Asia-Pacific region.3
U.S. investment in Singapore is broadly based, with 29 percent in industrial machineryand equipment manufacturing; 26 percent in finance, insurance, and real estate; and18 percent in electronic equipment manufacturing (figure 8-2).4
Singapore’s direct investment in the United States is also relatively substantial, with theUnited States ranking fourth behind China, Hong Kong, and Malaysia as a destination
1 The direct investment position is the value of direct investors’ equity in, and net outstanding loans to,their foreign affiliates. Direct investment is defined as ownership of at least 10 percent of the votingsecurities of an incorporated foreign business enterprise or equivalent interest in an unincorporatedenterprise. The investment position is presented on a historical-cost basis, which means that the datareflect the value of the investment at the time the transaction took place. Although other measures, such ascurrent cost and market value, may provide a more accurate depiction of the present value of foreigndirect investment, only historical-cost data are available in sufficient detail to permit a discussion ofspecific countries or industry sectors. U.S. Department of Commerce (USDOC), Bureau of EconomicAnalysis (BEA), “U.S. Direct Investment Abroad: Detail for Historical-Cost Position and Related Capitaland Income Flows, 2001,” Survey of Current Business, Sept. 2002, p. 69, and table 16, pp. 93-94.
2 U.S. & Foreign Commercial Service, “Singapore Country Commercial Guide FY 2003 - InvestmentClimate,” Aug. 19, 2002, found at http://www.stat-usa.gov, retrieved Mar. 5, 2003.
3 USDOC, BEA, “U.S. Direct Investment Abroad: Detail for Historical-Cost Position and RelatedCapital and Income Flows, 2001,” Survey of Current Business, Sept. 2002, table 16, pp. 93-94.
4 Ibid., table 10.3, p. 77.

102
0
5
10
15
20
25
30
1997 1998 1999 2000 2001
Source: U.S. Department of Commerce, Bureau of Economic Analysis, Survey of Current Business,Sept. 2002, pp. 93-94; and “Foreign Direct Investment in the United States: Country Detail for SelectedItems,” found at http://www.bea.doc.gov, retrieved Mar. 25, 2003.
Billi
ondo
llars
Figure 8-1U.S. direct investment with Singapore, 1997-2001
U.S. investment in Singapore
Singapore investment in the United States
for Singapore investment.5 In comparison with other countries in the Asia-Pacificregion, only Japan and Australia have a larger direct investment position in the UnitedStates.6 In 2001, the direct investment position of Singapore in the United Statesmeasured $6.5 billion, which produced income of $21 million.7 During 1997-2001,Singapore’s direct investment position in the United States increased at an averageannual rate of 25 percent, despite a nearly 50-percent decline during 1997-99. Directinvestment from Singapore is concentrated in the manufacturing and real estatesectors, which account for 75 percent and 17 percent of the total position,respectively.8 The specific distribution of investment within the U.S. manufacturingsector cannot be discerned, as data for the manufacturing categories of foodproducts, primary and fabricated metals, and machinery were suppressed to avoiddisclosure of data of individual companies.
Singapore’s investment regime is described as being very friendly to foreign investors,with no significant performance requirements like joint ventures, and no restrictions on
5 U.S. & Foreign Commercial Service, “Singapore Country Commercial Guide FY 2003,” Aug. 19,2002, found at http://www.stat-usa.gov.
6 USDOC, BEA, “Foreign Direct Investment in the United States: Country Detail for Selected Items,”found at http://www.bea.doc.gov/bea/di/fdi-ctry.htm.
7 Ibid.8 Maria Borga and Daniel R. Yorgason, “Direct Investment Positions for 2001: Country and Industry
Detail,” U.S. Survey of Current Business, July 2002, table 2.2, p. 33.
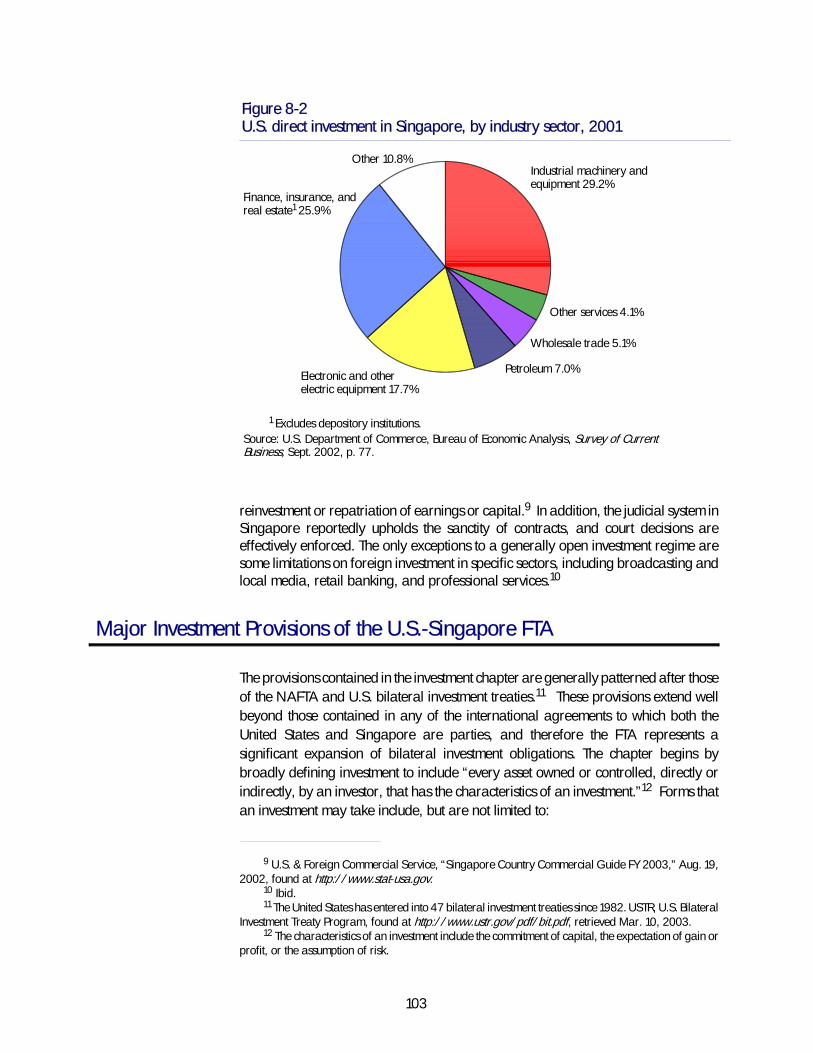
103
Figure 8-2U.S. direct investment in Singapore, by industry sector, 2001
Finance, insurance, andreal estate1 25.9%
Industrial machinery andequipment 29.2%
Wholesale trade 5.1%
Electronic and otherelectric equipment 17.7%
1 Excludes depository institutions.Source: U.S. Department of Commerce, Bureau of Economic Analysis, Survey of CurrentBusiness, Sept. 2002, p. 77.
Petroleum 7.0%
Other services 4.1%
Other 10.8%
reinvestment or repatriation of earnings or capital.9 In addition, the judicial system inSingapore reportedly upholds the sanctity of contracts, and court decisions areeffectively enforced. The only exceptions to a generally open investment regime aresome limitations on foreign investment in specific sectors, including broadcasting andlocal media, retail banking, and professional services.10
Major Investment Provisions of the U.S.-Singapore FTA
The provisions contained in the investment chapter are generally patterned after thoseof the NAFTA and U.S. bilateral investment treaties.11 These provisions extend wellbeyond those contained in any of the international agreements to which both theUnited States and Singapore are parties, and therefore the FTA represents asignificant expansion of bilateral investment obligations. The chapter begins bybroadly defining investment to include “every asset owned or controlled, directly orindirectly, by an investor, that has the characteristics of an investment.”12 Forms thatan investment may take include, but are not limited to:
9 U.S. & Foreign Commercial Service, “Singapore Country Commercial Guide FY 2003,” Aug. 19,2002, found at http://www.stat-usa.gov.
10 Ibid.11 The United States has entered into 47 bilateral investment treaties since 1982. USTR, U.S. Bilateral
Investment Treaty Program, found at http://www.ustr.gov/pdf/bit.pdf, retrieved Mar. 10, 2003.12 The characteristics of an investment include the commitment of capital, the expectation of gain or
profit, or the assumption of risk.
104
(a) an enterprise;
(b) shares, stock, and other forms of equity participation in an enterprise;
(c) bonds, debentures, other debt instruments, and loans;
(d) futures, options, and other derivatives;
(e) turnkey construction, management, production, concession,revenue-sharing, and other similar contracts;
(f) intellectual property rights;
(g) licenses, authorizations, permits, and similar rights conferred pursuant todomestic law;
(h) other tangible or intangible, movable or immovable property, and relatedproperty rights, such as leases, mortgages, liens, and pledges.
The investment chapter then proceeds to enumerate various disciplines or rulesconcerning the treatment of investors and investments. These disciplines addressnational treatment, most favored nation treatment, minimum standard of treatment,performance requirements and incentives, senior management issues, financialtransfers, and expropriation, among other things.
The provisions on national and most-favored-nation treatment address the issue ofdiscrimination against or among foreign investors and investments. By committing toaccord national treatment, each party agrees to treat investors and investments fromthe other party no differently from domestic investors and investments. In accordingmost-favored-nation treatment, each party is obliged to treat investors from the otherparty no less favorably than investors from countries that are not party to theagreement. Ultimately, these two disciplines are designed to ensure that investors fromthe FTA parties are treated no less favorably than all other investors. Both national andmost-favored-nation treatment apply only to the “...establishment, acquisition,expansion, management, conduct, operation, and sale or other disposition ofinvestments.”
The minimum standard of treatment discipline addresses how foreign investments aretreated by the government in the conduct of its legal system, an area which is outsidethe scope of national and most-favored-nation treatment. For example, a foreigninvestor could receive national treatment in the establishment and operation of anenterprise, but face discriminatory treatment in legal proceedings. To address thisconcern, the minimum standard discipline establishes the customary international lawminimum standard of treatment of aliens as the baseline level of treatment. Thisstandard includes the concepts of “fair and equitable treatment” and “full protectionand security,” which are clarified further to indicate that “...‘fair and equitabletreatment’ includes the obligation not to deny justice in criminal, civil, or administrativeadjudicatory proceedings in accordance with the principle of due process embodied inthe principle legal systems of the world...,” whereas “...‘full protection and security’requires each party to provide the level of police protection that is required undercustomary international law.”
105
The discipline on expropriation and compensation specifies that direct or indirectexpropriation or nationalization of a covered investment is permitted only ifperformed for a public purpose; in a nondiscriminatory manner; with payment ofprompt, adequate, and effective compensation; and in accordance with due processof law. The level of compensation is defined as the fair market value of the investmentimmediately prior to the expropriation. The expropriation discipline is clarifiedthrough letters appended to the agreement, which specify that an action must interferewith a tangible or intangible property right in order to be considered expropriation,and further defines what is meant by direct and indirect expropriation. Directexpropriation refers to the formal transfer of title or outright seizure of an investment,whereas indirect expropriation refers to an action or series of actions that have aneffect equivalent to direct expropriation without formal transfer of title or outrightseizure.13 The letters conclude by noting that nondiscriminatory regulatory actions toprotect legitimate public welfare objectives do not constitute indirect expropriationsexcept in rare circumstances. Such legitimate objectives would include those intendedto protect public health, safety, and the environment.
Financial transfers are addressed through article 15.7, which requires both parties topermit all transfers related to covered investments to take place freely and withoutdelay. Exceptions to this provision are possible for the application of laws relating tobankruptcy, securities, criminal offenses, financial reporting, and ensuringcompliance with orders or judgments in judicial or administrative proceedings.
The provisions on performance requirements and incentives call for the elimination ofcertain trade-distorting policy measures. With respect to performance requirements,both parties commit to neither impose nor enforce policies that link an investment withthe fulfillment of the following kinds of requirements: export performance, domesticcontent, local purchasing, trade or foreign exchange balancing, technology transfer,and exclusive regional marketing arrangements.14 With respect to incentives, bothparties similarly commit to neither impose nor enforce policies that condition receivingan investment incentive on compliance with the following requirements: domesticcontent, local purchasing preference, and trade or foreign exchange balancing. Thediscipline on performance requirements and incentives is qualified by a number of
13 The letters provide additional guidance on how to determine whether an indirect expropriationhas taken place by noting that such a determination must be made on a case-by-case basis withconsideration of various factors, including the economic impact of the government action, the extent towhich the government action interferes with reasonable investment-backed expectations, and thecharacter of the government action.
14 Export performance requirements impose an obligation to export a given level or percentage ofgoods or services; domestic content requirements mandate achieving a given level or percentage of localcontent; local purchasing requirements entail an obligation to purchase, use, or accord a preference togoods produced in a party’s territory or to purchase goods from persons in its territory; trade and foreignexchange balancing requirements relate the volume or value of imports as well as local sales of goods orservices to the volume or value of exports or to the amount of foreign exchange inflows associated with aninvestment; technology transfer requirements impose an obligation to transfer a particular technology,production process, or other proprietary knowledge to a person within the territory of a party; andexclusive marketing arrangements include requirements to supply exclusively from the territory of a partythe goods that it produces or the services that it provides to a specific regional market or to the worldmarket.
106
exceptions. In particular, incentives to locate production, provide a service, train oremploy workers, construct or expand particular facilities, or carry out research anddevelopment are excluded from the scope of this discipline. In addition, measures thatare consistent with the provisions of the intellectual property chapter or measuresimposed to remedy anticompetitive situations are not subject to the limitation ontechnology transfer requirements.
Another important exception concerns certain measures that are not directly related tointernational trade and investment, such as environmental measures, but whichpotentially could be considered inconsistent with the limitation on performancerequirements. The aforementioned measures-if not applied in an arbitrary orunjustifiable manner or if not a disguised restriction on trade and investment-are notsubject to the limitation on the use of domestic content, local purchasing, andtechnology transfer requirements, or the limitation on the use of incentives for domesticcontent and local purchasing.
Remaining areas excluded from the scope of the disciplines on performancerequirements and incentives are export promotion and foreign aid programs,government procurement, and local content requirements related to qualification forpreferential tariffs or quotas.
Finally, the investment chapter also includes provisions on senior managers andboards of directors that are designed to ensure that foreign investors retain controlover enterprises established abroad. These provisions bar requirements that seniormanagement positions be filled by persons of a particular nationality. However,nationality or residency requirements for the board of directors or other committeesare permitted, provided that the ability of the investor to exercise control over itsinvestment is not materially impaired.
Dispute SettlementThe investment chapter includes additional dispute settlement provisions that permitforeign investors to bring claims directly against the host government and potentiallyreceive monetary awards. This “investor-state” dispute settlement differs from theapproach used for disputes arising in relation to other chapters of the agreement, forwhich the claim must be brought by the government of the affected party and no directawards may be received by individual investors. The investor-state dispute settlementprocedures call for an initial period of consultation and negotiation prior to submittinga claim to arbitration. Such a claim must allege a breach of the agreement and that lossor damage was incurred as a result of that breach. Advance notice of 90 days must begiven to the respondent prior to the submission of a claim, and this notice should specifythe nature of the breach, the legal and factual basis for the claim, and the relief sought,including the approximate amount of damages claimed. The claim may then besubmitted to the International Centre for Settlement of Investment Disputes or theAdditional Facility of the Centre in accordance with the arbitration rules of the UnitedNations Commission on International Trade Law. Alternatively, the claim may be
107
submitted to any other arbitration institution mutually agreed upon by both theclaimant and respondent.
In order to bring a claim, the alleged breach of the agreement must have becomeknown to the claimant within three years. In addition, when submitting a claim, theclaimant must waive any rights to pursue other administrative or judicial proceedings.In other words, once the claimant decides to pursue arbitration under the investmentchapter procedures, it cannot simultaneously pursue the claim in a different venue ormake an appeal to a court of law or administrative tribunal if it is dissatisfied with thefindings of the arbitration. Finally, the investor-state dispute settlement mechanismprovides for transparency during the arbitral proceedings by requiring that relevantdocuments be made available to the public.15 In addition, all hearings by disputesettlement tribunals will be open to the public.
Awards granted by the arbitral tribunal may include costs and attorneys’ fees,monetary damages plus applicable interest, and restitution of property. Punitivedamages may not be awarded, however. The government of the respondent mustprovide for the enforcement of awards. At present, the agreement does not containprovisions for appealing the decision of a tribunal. However, a side letter leaves openthe possibility of creating such an appeals process, stating that, within three years ofthe entry into force of the agreement, the parties to the agreement shall considerwhether to establish an appellate body or similar mechanism to review awards.
Nonconforming MeasuresThe investment chapter contains provisions for the treatment of existing or futuremeasures that are inconsistent with certain disciplines (specifically, those concerningnondiscrimination, performance requirements, and senior personnel). Existingmeasures maintained at the central or regional government level are exempted fromthese disciplines provided that they are described in annex 8A of the agreement.Reservations to ensure that a party maintains flexibility to impose measures in thefuture that may be inconsistent with these disciplines must be described in annex 8B.Nonconforming measures at the local government level are simply exempted withoutrequiring any notation in an annex. The actual content of these reservations varieswidely. Some reservations are horizontal in nature, meaning they address generalpolicy provisions that affect all investments, whereas others apply to specific industrysegments. Singapore’s horizontal reservations principally concern the treatment ofstate enterprises and government land, with Singapore essentially reserving the rightto accord preference to domestic investors in relation to privatization programs. Forexample, in divesting a state-owned enterprise, Singapore reserves the right to limitforeign shareholding to 49 percent of the equity. In addition, Singapore listed a
15 These documents, which may be redacted to prevent disclosure of confidential businessinformation, include all pleadings, memorials, and briefs from the disputing parties; written submissionsfrom the government that is not a participant in the dispute, and amicus curiae submissions from anyinterested parties; minutes or transcripts of hearings; and orders, awards, and decisions of the tribunal.
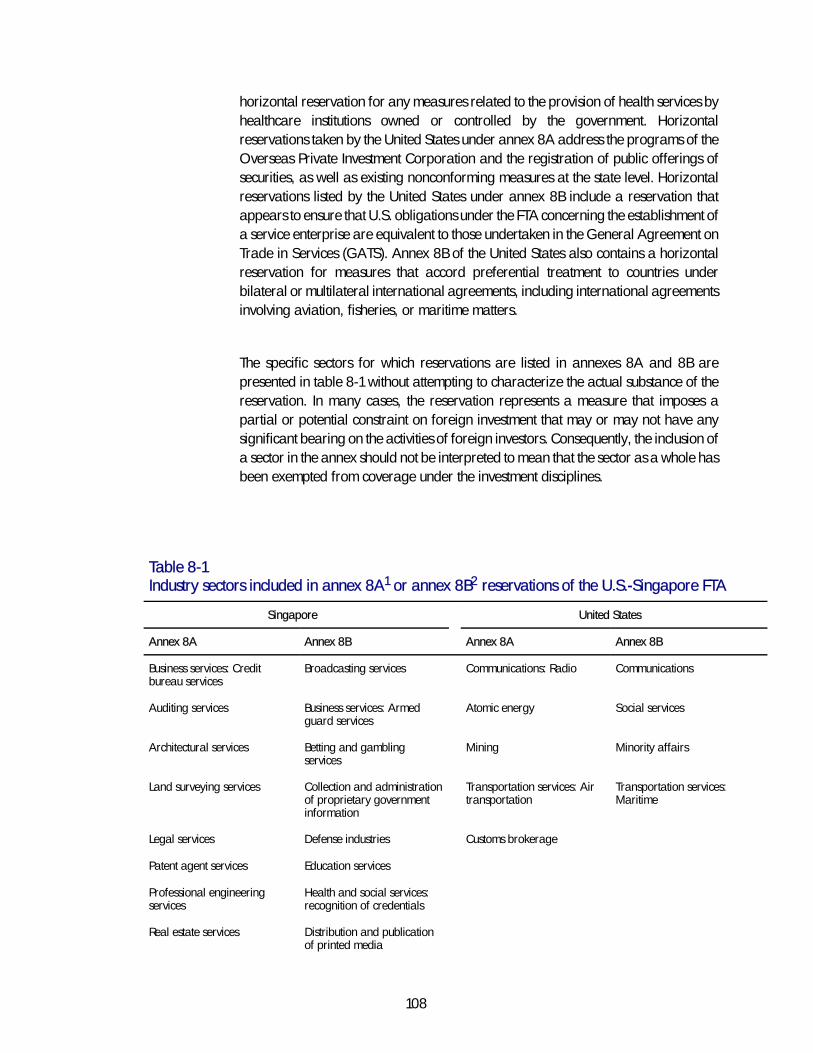
108
horizontal reservation for any measures related to the provision of health services byhealthcare institutions owned or controlled by the government. Horizontalreservations taken by the United States under annex 8A address the programs of theOverseas Private Investment Corporation and the registration of public offerings ofsecurities, as well as existing nonconforming measures at the state level. Horizontalreservations listed by the United States under annex 8B include a reservation thatappears to ensure that U.S. obligations under the FTA concerning the establishment ofa service enterprise are equivalent to those undertaken in the General Agreement onTrade in Services (GATS). Annex 8B of the United States also contains a horizontalreservation for measures that accord preferential treatment to countries underbilateral or multilateral international agreements, including international agreementsinvolving aviation, fisheries, or maritime matters.
The specific sectors for which reservations are listed in annexes 8A and 8B arepresented in table 8-1 without attempting to characterize the actual substance of thereservation. In many cases, the reservation represents a measure that imposes apartial or potential constraint on foreign investment that may or may not have anysignificant bearing on the activities of foreign investors. Consequently, the inclusion ofa sector in the annex should not be interpreted to mean that the sector as a whole hasbeen exempted from coverage under the investment disciplines.
Table 8-1Industry sectors included in annex 8A1 or annex 8B2 reservations of the U.S.-Singapore FTA
Singapore United States
Annex 8A Annex 8B Annex 8A Annex 8B
Business services: Creditbureau services
Broadcasting services Communications: Radio Communications
Auditing services Business services: Armedguard services
Atomic energy Social services
Architectural services Betting and gamblingservices
Mining Minority affairs
Land surveying services Collection and administrationof proprietary governmentinformation
Transportation services: Airtransportation
Transportation services:Maritime
Legal services Defense industries Customs brokerage
Patent agent services Education services
Professional engineeringservices
Health and social services:recognition of credentials
Real estate services Distribution and publicationof printed media
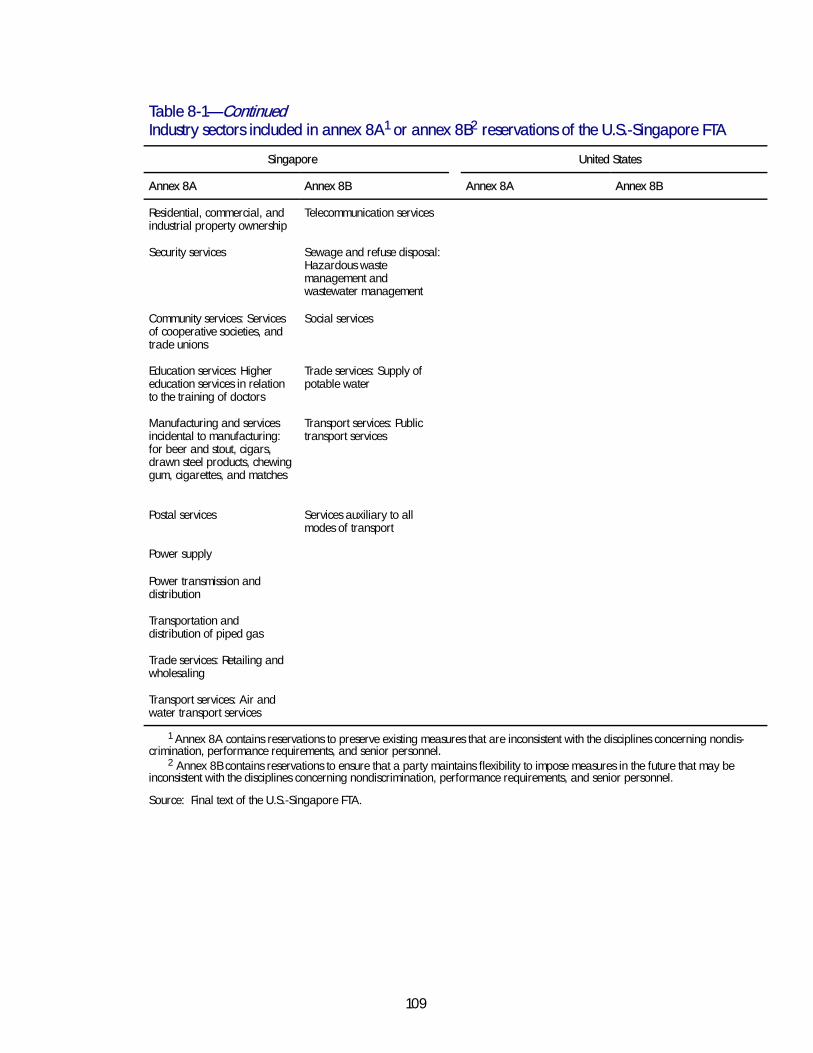
109
Table 8-1—ContinuedIndustry sectors included in annex 8A1 or annex 8B2 reservations of the U.S.-Singapore FTA
Singapore United States
Annex 8A Annex 8B Annex 8A Annex 8B
Residential, commercial, andindustrial property ownership
Telecommunication services
Security services Sewage and refuse disposal:Hazardous wastemanagement andwastewater management
Community services: Servicesof cooperative societies, andtrade unions
Social services
Education services: Highereducation services in relationto the training of doctors
Trade services: Supply ofpotable water
Manufacturing and servicesincidental to manufacturing:for beer and stout, cigars,drawn steel products, chewinggum, cigarettes, and matches
Transport services: Publictransport services
Postal services
Power supply
Services auxiliary to allmodes of transport
Power transmission anddistribution
Transportation anddistribution of piped gas
Trade services: Retailing andwholesaling
Transport services: Air andwater transport services
1 Annex 8A contains reservations to preserve existing measures that are inconsistent with the disciplines concerning nondis-crimination, performance requirements, and senior personnel.
2 Annex 8B contains reservations to ensure that a party maintains flexibility to impose measures in the future that may beinconsistent with the disciplines concerning nondiscrimination, performance requirements, and senior personnel.
Source: Final text of the U.S.-Singapore FTA.
110
Potential Effects
The U.S.-Singapore FTA has the potential to affect investment in two dimensions. First,liberalization of market access conditions for trade in goods and services is likely toencourage increased trade between the FTA parties, which in turn may be supportedby additional foreign direct investment. Consequently, trade liberalization may resultin increased foreign investment.
The second dimension concerns the effects of the investment chapter itself, which mayinfluence investment either by encouraging the removal of restrictions or by bolsteringthe confidence of foreign investors in the transparency and stability of the investmentregime. In the particular case of the U.S.-Singapore FTA, neither party will need tomake any significant changes to their respective investment policies in order to complywith the obligations of the agreement.16 As a result, the implementation of theagreement will not have any effect on investment, at least not in the short term. In thelonger term, greater confidence resulting from the presence of the investmentobligations may have bearing, provided that this agreement affords greaterinvestment protections than any existing agreements to which both parties arepresently bound.
At present, there are only two international agreements that affect investment to whichboth the United States and Singapore are signatories: the Agreement on TradeRelated Investment Measures (TRIMs) and the GATS. Both of these agreements werenegotiated during the Uruguay Round. The coverage of the TRIMs agreement isextremely limited. The agreement itself does not contain any new disciplines, but simplyrestates that measures inconsistent with Articles III and XI (national treatment andquantitative restrictions) of the General Agreement on Tariffs and Trade (GATT) areprohibited.17 These GATT disciplines apply only to measures that affect the import orexport of goods, which means that measures affecting the ability to establish andoperate locally are not covered, nor are measures affecting services or other forms ofinvestment. For example, national treatment under the TRIMs or GATS refers to thetreatment of goods that are imported or exported, so a measure that links the approvalof an investment in order to establish a factory to the volume of products exportedwould be prohibited. However, measures that impose discriminatory requirements thatare not linked to merchandise trade are unaffected, such as joint venturerequirements, foreign equity limitations, or technology transfer requirements that arelinked to receiving approval to establish a commercial presence. Consequently, incomparison with the FTA, the TRIMs agreement applies to only a subset of investmentactivities, and the disciplines only partially address national treatment andperformance requirements. The TRIMs agreement does not address the areas ofmost-favored-nation treatment, minimum standard of treatment, senior managementissues, financial transfers, and expropriation; nor does it address dispute settlementother than by reference to standard GATT procedures.
16 U.S. Government representative, interview by USITC staff, Mar. 18, 2003.17 Paul Civello, “The TRIMs Agreement: A Failed Attempt at Investment Liberalization,” Minnesota
Journal of Global Trade, vol. 8, No. 97, 1999, p. 98.
111
The GATS goes considerably further than the TRIMs agreement, but is similarly limitedto a subset of issues relative to the FTA. The GATS did break new ground bydevelopinga number of disciplines that affect investment. These include disciplines onmarket access, national treatment, most-favored-nation treatment, seniormanagement issues, and some financial transfers. But because the GATS concernsonly services, these disciplines apply only to investments necessary to establish andoperate a service enterprise. Investment in manufacturing as well as portfolioinvestment are outside the scope. In addition, the GATS disciplines do not addressminimum standards of treatment, performance requirements and incentives, andexpropriation, which are addressed in the FTA. Another drawback of the GATSrelative to the FTA is that it applies a “positive list” methodology for certain disciplines,including market access and national treatment. Under this approach, thesedisciplines apply only to service sectors that are explicitly listed in an attached“Schedule of Specific Commitments.” By contrast, the FTA applies a “negative list”approach, whereby all sectors are presumed to be covered by all disciplines unlessthey are explicitly excluded in the attached annexes. Although in theory bothapproaches could yield the same level of coverage, thus far the positive list approachhas resulted in more limited coverage as many WTO members have opted to includeonly selected sectors in their schedules of commitments. Finally, the GATS relies uponthe WTO dispute settlement procedures, which do not permit investors to bring a claimon their own behalf or to provide for compensation. Instead, disputes under the WTOmust be brought by the government of the investor, and the final determinationsaddress only whether specific policy measures should be changed. Consequently,dispute settlement under the GATS offers a means of changing investment policies inthe future, but does not afford any direct recourse to individual investors who havebeen adversely affected by present policies.

113
CHAPTER 9Summary of Views of Interested Parties
Air Courier Conference of America1
Air Courier Conference of America (ACCA) represents the express delivery serviceindustry, which specializes in fast, reliable transportation services for documents,parcels, and freight. ACCA’s members include large integrated express deliverycompanies, such as FedEx Corp., United Parcel Service (UPS), DHL WorldwideExpress, and TNT U.S.A., Inc.; as well as local and regional couriers and messengers.ACCA members employ 800,000 people worldwide and generate annual revenuesof $60 billion.
ACCA supports the U.S.-Singapore FTA and believes express delivery operators willbenefit from increased transport volumes as a result of increased trade in goodsbetween the two countries. Additionally, the U.S.-Singapore FTA includes provisionson customs procedures that ACCA thinks will facilitate business operations for expressdelivery providers in Singapore. Specifically, the FTA promises the simplification andharmonization of customs procedures and the efficient and fair processing of expressdelivery imports and exports. However, ACCA states that the time frame for shipmentrelease should be reduced from the agreement’s stated target of six hours.
ACCA asserts that the U.S.-Singapore FTA’s definition of express delivery servicesaccurately reflects the nature of the industry and is encouraged by the FTA’sclarification that express delivery commitments apply to all suppliers of the service.ACCA also is encouraged that the FTA includes provisions that limit cross-subsidizationof Singapore Post’s express letter delivery with funds generated by itsmonopoly-protected services. However, ACCA advocates that future tradeagreements should include more rigorous cross-subsidization provisions that wouldpreclude postal administrations from using monopoly profits to subsidize all theirexpress delivery operations (not just express letter delivery).
1 David Spence, Chairman, International Trade Subcommittee, Air Courier Conference ofAmerica, and Senior Counsel, FedEx Regulatory and Legal Affairs.
114
American Council of Life Insurers, American Insurance Association,and Financial Services Coordinating Council2
The American Council of Life Insurers (ACLI) addresses issues including retirementsecurity, privacy, and international trade. Its 400 member companies are leadingproviders of financial and retirement security products that cover individual andbusiness markets. The American Insurance Association (AIA) is the leadingproperty-casualty insurance trade organization. The AIA represents more than 424insurers that write more than $103 billion in premiums each year.
The ACLI and AIA support the Singapore FTA, because the relatively liberal regulatoryenvironment in the Singapore insurance market has resulted in liberal commitmentsthat could establish precedence and momentum for other bilateral, regional, andmultilateral agreements. The Singapore FTA incorporates the types of commitmentssought by the ACLI and AIA on regulatory best practices that help develop markets byencouraging innovation and competition.
The ACLI and AIA identify as the major accomplishments of the agreement full marketaccess and national treatment commitments; the ability to provide some insuranceservices on a cross-border basis without establishing a commercial presence; theinclusion of pensions commitments; the right to offer compulsory lines of insurance; fullnational treatment with regard to financial requirements; legislative and regulatorytransparency obligations; and speed to market obligations. The ACLI and AIA statethat these provisions enhance stability and ensure effective market access for U.S.firms. Such provisions are critical to member firms’ global competitiveness and aidU.S. consumers, stakeholders, and the U.S. economy. In addition to benefittingmember firms, the ACLI and AIA state that a regulatory system that promotes solvencyand enhances competition supports the growth of the local insurance marketplace andbenefits local consumers with the widespread availability of insurance.
The Financial Services Coordinating Council indicates in a letter attached to theSecurity Industry Association’s formal submission that it supports the FTA and seeks toassociate itself with the ACLI and AIA’s written comments.
American Dehydrated Onion and Garlic Association3
The American Dehydrated Onion and Garlic Association (ADOGA), an associationcomposed of two firms accounting for the majority of domestic dehydrated onion and
2 Brad Smith, Managing Director, International Relations, American Council of Life Insurers; DavidF. Snyder, Vice President and Assistant General Counsel, American Insurance Association; and theFinancial Services Coordinating Council.
3 Irene Ringwood, Ball Janik LLP, Washington, DC, counsel for the American Dehydrated Onionand Garlic Association.
115
garlic production, opposes a U.S.-Singapore FTA. Most of the ADOGA firms’production is sold to institutional and foodservice buyers for use, in small quantities, asan ingredient in other processed foods such as soups, salad dressings, seasoningmixes, condiments, and sauces. With the cost of dried onions or garlic accounting for avery small fraction of the cost of the end product in which it is used, demand for each ofthese products is derived and price changes will elicit very minor changes in deriveddemand for these products by end-product producers. Because dehydrators areunable to affect demand through price adjustments for their raw product, the U.S.industry believes it is quite vulnerable to competition from lower-priced imports.
ADOGA states that the production of dehydrated onions and garlic, althoughseparate products, has developed interdependently. ADOGA further states that adehydrator’s ability to run production lines concurrently for both products enhancesoverall production efficiency and any market competition from lower-priced importsof either product could negatively affect the entire industry. According to the U.S.industry, raw onions and garlic for dehydrating can be grown more cheaply almostanywhere outside of the United States and the costs of other key inputs are alsosignificantly less in other countries such as Singapore. The United States has received asteady flow of fresh garlic and onions for a number of years from Singapore.According to ADOGA, Singapore has had more than 30 vegetable dehydrationfacilities in operation over the last decade, any of which could be used to dehydrateonions and garlic.
ADOGA emphasizes that the enactment of duty-free treatment for dried onions andgarlic entered into the United States, reported to be one of the largest global marketsfor such vegetables, would be an incentive for increased competition and marketdisplacement in the U.S. market, with little opportunity to sell U.S.-produceddehydrated onions and garlic in Singapore. In addition, dried onions and garlic haveextremely high duties, which the industry states have discouraged exports to the U.S.market in recent years but may encourage the circumvention of U.S. duties by Chineseexports transshipped through Singapore.
American Federation of Labor and Congress of Industrial Organizations4
The American Federation of Labor and Congress of Industrial Organizations(AFL-CIO) is a voluntary federation of 65 national and international labor unionsrepresenting more than 13 million workers nationwide. The organization has fourprimary goals: strengthening working families by enabling more workers to jointogether in unions, building a stronger political voice for working families, providing anew voice for workers in the global economy, and creating a more effective voice forworking families in communities.
4 Gregory Woodhead, Ph.D., Representative, Public Policy Department, AFL-CIO.
116
The AFL-CIO states that the FTA represents a unique challenge because it is the firsttrade agreement where U.S. tariffs are higher than those of the trading partner priorto the implementation of the agreement. It states that the possibility of lower U.S. tariffswill exacerbate current trade deficits in specific sectors such as machinery, chemicals,and apparel. According to the AFL-CIO, imports from Singapore have contributed tolosses in industries already devastated by international competition and technologicalchange.
The AFL-CIO expresses a number of concerns with regard to specific provisions of theFTA: (1) the FTA’s rules of origin fail to promote production and employment in theUnited States or in Singapore; (2) the safeguard provisions offer no more protectionthan the limited safeguard mechanism in the NAFTA and fail to provide the necessaryimport surge protections for American workers; (3) the “Integrated Sourcing Initiative”investment provision requires no reciprocal market from the Indonesian islands, whichare included in the FTA, and will have a negative impact on U.S. jobs; (4) the laborprovisions do not apply to workers’ rights violations on these Indonesian islands; and(5) the FTA’s protections against transshipment may do little to counter Singapore’sattractiveness as a transshipment route. The AFL-CIO also is concerned that the FTAdoes not address the important issues of external indebtedness, currencymanipulation, and financial speculation.
The Boeing Company5
The Boeing Company produces civil and military air and spacecraft, weapons systems,and aerospace support services. Its sales totaled $54 billion in 2002, and is thenation’s largest single exporter of manufactured products, with customers in 145countries. It is one of only two producers of large civil aircraft in the world, with AirbusSAS (France) being its sole competitor. The company employs more than 160,000workers in the United States and has a domestic supplier base of 26,000 companies.
Boeing states it supports the U.S-Singapore FTA. Boeing states that an open,rules-based trading system promotes its competitiveness by contributing to globaleconomic growth, reduces tensions between the United States and key tradingpartners, improves market access, and addresses unfair trading practices. Inaddition, Boeing notes that Singapore Airlines, which is one of the leading operators inAsia, has a fleet composed of nearly 90 percent Boeing aircraft. As such, it is one ofBoeing’s key customers in both the Asia Pacific region and the world, with total sales toSingapore Airlines of approximately $20-25 billion.
5 Theodore Austell III, Vice President, International Policy, The Boeing Company.
117
Citigroup6
Citigroup is a U.S.-based financial services institution engaging in banking, insurance,and investment operations. The company has 260,000 employees operating in 102countries, with more than one-third of its revenue generated abroad. Citigroupsupports the U.S.-Singapore FTA and states that the agreement will help expand U.S.financial services business opportunities in Singapore, provide a model for futureagreements in other parts of Asia, and help the United States promote its diverseefforts to liberalize global trade. Citigroup states that the provision requiringSingapore to lift its current ban on new licenses for full-service banks is important to thecompany’s growth strategy for operations in that country. Further, Citigroup cites thefollowing additional provisions within the FTA as potentially beneficial to its business inSingapore: access to local ATM networks, ability for U.S. institutions to offer asset andportfolio management services in Singapore through the establishment of a localoffice or by acquisition of a local firm, commitment to open and transparent regulatoryprocedures, and prohibition of capital controls. Finally, the company emphasizes theimportance of new negotiations for the services sector. It states that the potential forgrowth in services exports is high and in order to capitalize on that, the United Statesshould continue to pursue bilateral and regional free trade agreements that allow forfaster and deeper liberalization.
Direct Selling Association7
The U.S. Direct Selling Association (DSA) is a national trade association representingmore than 140 companies that manufacture and distribute goods and services solddirectly to consumers through independent contractors. Worldwide, direct sellingaccounts for more than $78 billion in retail sales and provides income-earningopportunities to more than 43 million people.
The DSA supports the U.S.-Singapore FTA and advocates full market access for directselling in Singapore. It asserts that the FTA is critical for the industry’s access to theSingapore market and is important for both consumers and businesses. Legislation inSingapore such as the Multi-Level Marketing and Pyramid Selling(Prohibition)(Amendment) Act 2000 and Final Order allow multilevel marketing firmsto operate, but prohibit any company from operating if compensation was related torecruitment activities. The DSA states that because many direct selling multilevelcompanies provide compensation awards based on recruiting, they were either forcedto adapt their compensation system for a single market or to forego the Singaporemarket entirely due to exorbitant expenses and the onerous financial accounting taskof operating a separate and secondary compensation system in Singapore.
6 Jeffrey Shafer, Managing Director, Citigroup Global Markets, Citigroup.7 John W. Heese, Senior Attorney, Direct Selling Association.
118
According to the DSA, the Multi-Level Marketing and Pyramid Selling (ExcludedSchemes and Arrangements)(Amendment) Order 2001 provided a regulatoryremedy to the recruiting provision of the 2000 Final Order and contributed to anincrease in sales for the direct selling industry. However, since the prohibitory actremains in force, Singapore could revoke the 2001 order at any time, creatingregulatory uncertainty.
The DSA states that the FTA provides several benefits for the direct selling industry. Forexample, the Government of Singapore will be required to grant full market access tothe industry, including all marketing methods on a more permanent basis. In addition,other governments in the region may consider Singapore’s treatment of direct sellingwhen formulating their own policies. Lastly, the DSA notes that the U.S.-Singapore FTAwill create a more permanent and stable business environment for U.S. companies,resulting in long-term growth in sales and income-earning opportunities in the UnitedStates and Singapore. It asserts the FTA also will provide regional regulatory stability.
Discovery Communications, Inc.8
Discovery Communications, Inc. (DCI) is a U.S.-based leading global media andentertainment company with operations in over 155 countries and territories, and over935 million subscribers worldwide. DCI has operations worldwide including severalregional networks. One of these is Discovery Networks Asia, which has its regionalheadquarters in Singapore. DCI credits Singapore’s strategic location, outstandinginfrastructure, and talent pool for the exceptional growth of Discovery Networks Asia.Discovery Networks Asia has grown from a single channel to a 3-channel networkreaching over 60 million households in over 15 countries and territories throughoutAsia-Pacific.
Acknowledging an already productive and beneficial business relationship inSingapore, DCI supports the U.S.-Singapore FTA, viewing it as a comprehensiveagreement with potential to benefit the U.S. economy as a whole in addition tonumerous U.S. industrial sectors. Furthermore, DCI emphasizes that the FTA will setrules-based precedents in several areas and will provide a strong foundation forfuture trade agreements in the Asia-Pacific region, other regions, and in the WorldTrade Organization. Specifically, DCI praises the FTA as a foundation for providingnew opportunities for growth and market development by providing state-of-the artintellectual property protections, including comprehensive protection andenforcement; liberalizing Singapore’s services regime, which includes the audiovisualand telecommunications sectors; providing important commitments in the area ofcustoms administration and e-commerce; and providing a more stable and attractiveinvestment environment. In addition, DCI supports provisions allowing temporaryentry of business personnel.
8 Alexa Verveer, Vice President, Public Policy and Government Relations, DiscoveryCommunications, Inc.
119
Whereas DCI commends the U.S.-Singapore FTA, it expresses concern over contentand spectrum reservations in the area of broadcast services. DCI would like to see thegovernments involved eliminate these reservations in the future.
Electronics Industries Alliance9
The Electronic Industries Alliance (EIA) is a partnership of electronic and high-techtrade associations representing 2,500 companies and more than 80 percent of the$430 billion electronics industry. EIA states that the U.S.-Singapore FTA will havepositive effects in the region. It will be the United States’ first FTA with an Asian nation; itwill send the message that the United States will pursue trade opportunities in theregion; and it will signal the United States’ commitment to the region. EIA states thatSingapore is a good place to start because it has an admirable track record forpursing open trade, its investment laws are clear and fair, and it has a strong history ofprotecting private property rights.
EIA states that the agreement will have positive economic effects. As an FTA withSingapore will give Singapore firms better access to the U.S. market than theirneighbors enjoy, EIA thinks the agreement will lead other countries to seek similarFTAs. Further, it will erase the disadvantage U.S. firms face from the FTAs thatSingapore already has in place with New Zealand, Japan, the European Free TradeAssociation, and Australia.
EIA states that the agreement also will benefit the electronics industry. Singapore hasno tariffs on imports of electronics products; however, the United States still retainssome duties on electronics products. The FTA will equalize tariff treatment inelectronics trade between the United States and Singapore in comparison with othercountries that already have duty-free relations with Singapore. The FTA also will raisestandards in areas such as intellectual property rights, e-commerce liberalization, andtelecommunications market access.
EIA indicates that the rules of origin proposed by the FTA are similar to those under theNAFTA and, as such, are highly complex. The EIA would like to see the rules of originimproved.
Entertainment Industry Coalition for Free Trade10
The Entertainment Industry Coalition for Free Trade (EIC) represents the interests ofmultichannel programmers and cinema owners; producers and distributors; guilds
9 Brian L. Kelly, Senior Vice President of Government Relations & Communications, ElectronicIndustries Alliance.
10 Bonnie J. K. Richardson, Vice President, Trade and Federal Affairs, Motion Picture Association;and Laura J. Lane, Vice President, International Public Policy, AOL Time Warner.
120
and unions; trade associations; and individual companies who produce, distribute,and exhibit many forms of creative expression, including theatrical motion pictures,television programming, home video entertainment, recorded music, and videogames. The EIC supports the U.S.-Singapore FTA.
The EIC states that the entertainment industries and their employees are dependent fortheir success on defending their rights to the intellectual content they have created.Achieving enhanced global standards of copyright protection and enforcement,ensuring meaningful market access, and developing trade disciplines that keep pacewith technological development are all central to EIC members’ ability to remaincompetitive and to ensure good jobs for America’s creative community. However,according to the coalition, growing levels of physical piracy, online piracy, andinadequate enforcement of copyright and other intellectual property right lawsinternationally are challenging the competitiveness of its industries worldwide.
The EIC reports that the U.S.-Singapore FTA includes numerous commitments that arevital to the members of the coalition such as (1) providing strong protection ofintellectual property in the digital age, (2) strengthening copyright enforcement, (3)securing market access for the goods and services produced and distributed by itsmembers, and (4) demonstrating that trade agreements can be constructed toincorporate commitments on opening up service markets while simultaneouslyaddressing countries’ specific socio-cultural concerns. According to the EIC, the FTAhas succeeded in addressing these challenges in ways that not only bode well forcontinued high levels of intellectual property right protection in Singapore but also setimportant precedents for future FTAs. The coalition states that the U.S.-Singapore FTApromotes its members’ economic interests and contributes to a strengthened U.S.economy.
General Electric Company11
The General Electric Company (GE) is a major multinational corporation with businessunits providing a wide range of products and services globally. GE exports variousproducts to Singapore, from medical equipment and plastics to power generationequipment and aircraft engines. In addition, Singapore is an importantmanufacturing and sourcing location for GE, as well as the site for the headquarters ofa number of GE businesses that serve the Asian region.
GE supports the U.S.-Singapore FTA. GE sees the FTA as an important way toreinforce the existing positive relationship with Singapore and to facilitate furthergrowth in trade and investment in the ASEAN region. In addition, GE believes thisagreement can strengthen overall security and stability in the region. GE notes thatSingapore already serves as an attractive location for investment and a magnet fortrade because it provides a high standard of investor protection and offers a virtually
11 R. Michael Gadbaw, Vice President, Senior Counsel, General Electric Company.
121
open market for trade in goods and services. Nevertheless, GE welcomes a number ofimprovements brought about through the agreement, including enhancedcommitments on financial services that improve market access while also addressingcross-subsidization, regulatory policies, and regulatory transparency in the industry.Other positive developments cited by GE include the adoption of improved investmentprotections, in particular the insertion of provisions for investor-state disputesettlement; the adoption of provisions on transparency in government procurement;the removal of limitations on the operation of certain professional services; and theaddition of a side letter providing for free trade in e-commerce. Finally, GEemphasizes that the real benefit of the agreement is likely to be felt in its potential as acatalyst and model for other bilateral, regional, and multilateral initiatives to promoteopen trade and investment.
Government of Singapore12
The Government of Singapore (GoS) notes that the United States and Singapore enjoya deep bilateral trade relationship and a multifaceted cooperative alliance. Tradebetween the United States and Singapore has grown steadily since the mid-1970s, andthe United States is currently the largest investor in Singapore, while Singapore is thesecond largest Asian investor in the United States. The GoS asserts that theU.S.-Singapore FTA will bring immediate economic benefits to Singapore in terms oftariff cuts and market access liberalization; likewise, the United States will benefit fromgreater security for U.S. investments and businesses in Singapore. The GoS furtherstates that the FTA will have a multiplier effect on bilateral trade and investment flows,could potentially lead to greater exchange of talent and innovation, and will createnew opportunities and better lives for the residents of both countries.
Specifically, the GoS indicates that the U.S.-Singapore FTA reinforces, establishes,enhances, and modernizes standards and rules relating to competition, transparency,customs and trade facilitation, intellectual property protection, labor, environment,rules of origin, and e-commerce. According to the GoS, the U.S.-Singapore FTA willprovide numerous benefits to U.S. companies including (1) enhanced market access infinancial services; (2) greater protection for intellectual property via theimplementation of new and expanded laws and rights in Singapore, as well as greaterenforcement measures; (3) further deregulation of professional services, particularlywith respect to the provision of legal and architectural, engineering, and landsurveying services; (4) groundbreaking and bold e-commerce disciplines; (5)improved access for government procurement activities; and (6) closer cooperationwith respect to labor and environmental issues. Finally, the GoS points out that, as thefirst free trade agreement that the United States will sign with an Asian country, the
12 H.E. The Honorable Chan Heng Chee, Ambassador, Embassy of Singapore, Washington, D.C.
122
U.S.-Singapore FTA will both strengthen the bridge across the Pacific and serve toanchor the United States in the dynamic Asia Pacific region.
International Intellectual Property Alliance13
The International Intellectual Property Alliance (IIPA) is a coalition of six tradeassociations representing almost 1,100 U.S. companies that produce and distributematerials protected by copyright laws throughout the world.14 IIPA supports the earlyadoption by Congress of the U.S.-Singapore FTA. According to IIPA, theU.S.-Singapore FTA sets out the highest standards of protection and enforcement forcopyrights and other intellectual property yet achieved in a bilateral or multilateralagreement, treaty, or convention. It builds on the standards currently in force in theWTO Agreement on Trade-Related Aspects of Intellectual Property Rights and in theNAFTA Agreement with the goal to update and clarify those standards to take intoaccount not only the experiences gained since those agreements entered into force,but also the significant and rapid technological and legal developments that haveoccurred since that time. For instance, IIPA states that the U.S.-Singapore FTA providesthe essential legal infrastructure for e-commerce through obligations that will assistintellectual property right holders in safeguarding the transmission of copyrightedworks over advanced networks like the Internet and by providing higher standards ofprotection for digital products generally. As such, IIPA believes that the U.S.-SingaporeFTA will set new global standards of intellectual property protection and serve as aprecedent for future bilateral, plurilateral, and multilateral free trade negotiations.
Investment Company Institute15
The Investment Company Institute (ICI) is the national association of the Americaninvestment company industry. Founded in 1940, ICI’s membership consists of 8,912open-end investment companies (mutual funds), 554 closed-end investmentcompanies, and 6 sponsors of investment trusts. ICI’s members have over 90 millionindividual shareholders and aggregate assets of approximately $6.25 trillion,accounting for around 95 percent of total industry assets. ICI points to the manybenefits accorded U.S. asset management firms by the U.S.-Singapore FTA and sees
13 Eric H. Smith, President, International Intellectual Property Alliance.14 IIPA member associations include the Association of American Publishers, the American Film
Marketing Association, the Business Software Alliance, the Interactive Digital Software Association, theMotion Picture Association of America, and the Recording Industry Association of America.
15 Mary Podesta, Senior Counsel, Investment Company Institute.

123
certain achievements in this bilateral FTA as setting an important precedent for futuretrade negotiations.
In particular, the FTA makes important strides in market access. ICI notes that theagreement allows for the cross-border provision of portfolio management serviceswith respect to mutual funds, which will ultimately allow U.S. firms to achieveeconomies of scale and utilize their global expertise in servicing clients in Singapore.The agreement also liberalizes Singapore’s minimum staffing requirements, whichhave heretofore acted as a barrier to entry for U.S. firms. Although the agreementaddresses the primary goals and concerns of the asset management industry, ICIexpresses disappointment with one aspect of the market access provisions–that is, themaintenance of certain quantitative limitations on pension investments abroad.
Concerning regulatory transparency, ICI indicates that the transparency commitmentson financial services, specifically those pertaining to acceptable procedures withrespect to application processing and the adoption of rules, are of particularimportance to U.S. asset management firms. ICI also expresses satisfaction withprovisions in the FTA that allow for the free flow of capital and set forth remedies ifeither country imposes capital control measures. The industry’s approval of the capitalcontrol commitments is mitigated, however, by provisions that require investors to waitfor one year after the imposition of controls before submitting a claim, a regulation thatICI finds troublesome and potentially hindering. ICI states that the FTA achieves manyof the industry’s most important objectives and represents significant progress inopening Singapore’s market for the U.S. asset management industry. Finally, ICIindicates that the provisions of the U.S.-Singapore FTA will benefit both the UnitedStates and Singapore.
Leather Industries of America, Inc.16
Leather Industries of America, Inc. (LIA) is a national trade association representingU.S. leather tanners and distributors, and their suppliers. LIA reports that historicallywhen raw hides (classified under HTS headings 4101, 4102, and 4103) are initiallytanned and then subsequently dried into crust leather (HTS headings 4104, 4105, and4106), the country in which the initial tanning was performed has been considered theproduct’s country of origin. Crust leather may undergo further minor processingknown as finishing operations. Finishing operations such as applying additional color,embossing, surface coatings and other treatments are performed to enhance theproperties of the final product. The proposed U.S.-Singapore FTA addresses countryof origin issues in connection with leather that has been further processed or finished(HTS headings 4107, 4112, and 4113). Under the proposed FTA, the country thatperforms minor finishing operations would be considered the leather’s country of
16 Lauren Howard, Collier Shannon Scott, PLLC, counsel to Leather Industries of America, Inc.

124
origin. LIA opposes allowing the minor processing involved in finishing operations toconfer origin. It asserts that the proposed treatment contradicts numerous CustomsService rulings as well as the rules of origin for leather in NAFTA, which codifiedhistorical substantial transformation rules into a tariff shift approach. LIA urgesmodification of the proposed FTA regarding the country of origin provisions anddiscourages the incorporation of this provision in future free trade agreements.
Pharmaceutical Research and Manufacturers of America17
The Pharmaceutical Research and Manufacturers of America (PhRMA), the nationalassociation representing the U.S. research-based pharmaceutical industry, supportsthe U.S.-Singapore FTA. PhRMA considers Singapore a leader in Asian biomedicalresearch and development, one of the most open trade and investment regimes in theworld, and a strong proponent of transparent science-based regulation ofpharmaceutical products.
The association notes that there were virtually no government-sanctioned pricecontrols on pharmaceutical products. More specifically, “[M]arket access barrierssuch as abusive price controls, reference pricing, monopsonistic purchasing practices,state trading monopolies, unreasonable restrictions on listing and governmentestablished formularies, toleration of the legal discounts or discounting practices thatrepresent WTO and legal subsidies to local manufacturers, all of which were identifiedin the TPA Act, section 2018, key negotiating objectives are not an issue inSingapore.”18
The association believes Singapore to have science-based drug-approval anddrug-regulatory procedures that are timely and transparent. The drug regulatoryrequirements are faithful to generally accepted international scientific standards, andthe drug approval process is transparent, allowing all stakeholders to participate inthe approval process. PhRMA considers Singapore’s Health Sciences Authority to be aregional model for science-based regulation.
PhRMA notes that Singapore has committed itself to strong intellectual property rights.It not only implemented key obligations of the Uruguay Round, but it also added furtherelements such as data exclusivity and patent-term restoration. In particular, the FTAwill extend pharmaceutical patents to compensate for lost time during thedrug-approval process.
The association supports the agreement for three reasons: (1) to improve strongercommercial ties between the United States and Singapore and the general interest of
17 Joseph Damond, Associate Vice President for Japan & Asia Pacific, Pharmaceutical Research andManufacturers of America.
18 Hearing transcript at p. 108.

125
the private sector, (2) to support Singapore’s positive market-oriented and sciencebased policies in support of their sector, and (3) to recognize Singapore’sscience-based regulatory regime and strong IPR protection. Finally, PhRMA notes thatthe agreement also will serve as a model for other trade agreements in the future.
Securities Industry Association19
The Securities Industry Association represents more than 600 securities firms, includinginvestment banks, broker-dealers, and mutual fund companies. Collectively,member-firms employ more than 495,000 individuals, representing 97 percent oftotal employment by securities brokers and dealers. In 2001, the U.S. securitiesindustry generated domestic revenues of $280 billion and global revenues of $383billion.
The association supports the U.S.-Singapore FTA and indicates that it successfullyachieves many of the organization’s key trade objectives, which include favorablemarket access conditions, including 100 percent ownership rights and the right toestablish in corporate form of choice; national treatment for U.S. financial servicesfirms and investors; transparency of regulations; the elimination of all economic needstests; and the ability to process and disseminate financial information within countryand across borders. The association notes that the U.S.-Singapore FTA “locks-in”current market access levels in Singapore and produces commitments by Singapore toreduce and/or eliminate some of the few remaining establishment barriers. Althoughthe agreement permits the free and immediate transfer of capital related to aninvestment, the association states that it contains exceptions to this generalcommitment. The industry hopes that exceptions to free capital movements will not forma template for future trade agreements. The Financial Services Coordinating Councilindicates in a letter attached to the association’s formal submission that it supports theFTA and seeks to associate itself with these written comments.
Semiconductor Industry Association20
The Semiconductor Industry Association is the leading voice for the semiconductorindustry and has represented U.S. manufacturers since 1977. Member companiescomprise approximately 90 percent of U.S.-based semiconductor production. Theassociation supports the free trade agreement with Singapore. High-technology tradebetween the United States and Singapore represents about half of total two-way
19 Lou Costantino, Jr., Vice President and Director, Government Relations, Securities IndustryAssociation.
20 Anne Craib, Director of International Trade and Governmental Affairs, Semiconductor IndustryAssociation. Ms. Craib also was appearing on behalf of the High-Tech Trade Coalition.

126
trade. In 2002, the United States exported $6 billion in high-technology products toSingapore and imported $10.6 billion in such goods from that country. The associationnotes that Singapore is a major supply and logistics hub for the high-technologyindustry’s operations in Asia, and U.S. high-technology firms have made over $1billion in investments in Singapore. The U.S.-Singapore FTA is the first such agreementin the region, and its further liberalizes the important high-technology relationshipbetween the two countries. Even though Singapore already has removed tariffs on keyinformation technology products via the Information Technology Agreement, theassociation thinks that the proposed FTA will simplify customs procedures; increasemarket access for services, including telecommunications and computer-relatedservices; include favorable e-commerce provisions; and improve intellectual propertyrights protection.
Telecommunications Industry Association21
The Telecommunications Industry Association (TIA) is a U.S.-based, non-profit tradeassociation serving the U.S. communications and information technology industries.TIA’s activities include domestic and international advocacy, market development,industry trade shows, standards development, and e-business initiatives. Itsmembership comprises more than 1,000 companies that manufacture and supplytelecommunication products and services.
The TIA supports the U.S.-Singapore FTA. The TIA also approves of certain keyprovisions that it considers are important to its member companies. For example, theTIA approves of provisions in the telecommunication services chapter that ensureaccess to and use of public telecommunication networks and services on anon-discriminatory basis. The TIA also favors the “negative list” approach, whichallows new telecommunication services to be introduced in a fully liberalizedenvironment.
The TIA believes that the provisions of the telecommunications chapter provide a highlevel of transparency in telecommunication services by ensuring the publication oftelecom regulations and consultation on regulatory matters, and by instituting a priornotice period for new regulations and changes to existing regulations. The TIA alsosupports provisions allowing full-recourse appeals to decisions of regulatory bodies.
The TIA also thinks that the inclusion of non-binding language calling for technologicalneutrality in the mobile telecommunication services sector serves as a useful startingpoint. However, it emphasizes the need for binding rules on technological neutrality infuture agreements.
21 Matthew J. Flanigan, President, Telecommunications Industry Association.
127
Tile Council of America, Inc.22
The Tile Council of America, Inc. (TCA) is a national trade association for the ceramictile industry.23 TCA represents over 40 manufacturers of ceramic tiles and relatedproducts, and its members account for over 50 percent of the ceramic tile produced inthe United States.
TCA opposes the U.S.-Singapore FTA as it applies to ceramic tile and other importsensitive products. In its submission, TCA states that the domestic ceramic tile industry isimport sensitive and faces a high level of import penetration. According to TCA,competition from low-priced imports has placed downward pressure on prices andforced a number of U.S. tile firms to scale back operations or exit the industry entirely.Moreover, surviving producers are operating far below capacity. TCA notes thatwhile current imports from Singapore do not comprise a significant percent of totalU.S. ceramic tile imports, the U.S. ceramic tile industry is concerned about the potentialthat the U.S.-Singapore FTA could allow for another source of low-priced imports,which would exacerbate the already precarious condition of the U.S. industry. TCAalso is concerned that without a sufficient and enforceable rule-of-origin protocol,Singapore could become a transhipment point for low-cost ceramic tiles producedelsewhere in the region. Finally, TCA objects to the inclusion of import sensitiveproducts to tariff reductions or concessions in the negotiations with Singapore, andparticularly objects to the shorter 8-year tariff staging received by ceramic tiles (asopposed the longest possible tariff phase out schedule) under the U.S.-Singapore FTA.
United Parcel Service24
United Parcel Service (UPS) is the world’s largest package delivery company and aleading provider of specialized transportation and logistics services. UPS employs320,000 in the United States and delivers packages to over 200 countries andterritories worldwide. UPS supports the U.S.-Singapore FTA , and believes that it willcontribute to industry growth by increasing trade volumes between the United Statesand Singapore and by reducing barriers that affect the provision of express deliveryservices (EDS). UPS is pleased that the U.S.-Singapore FTA recognizes EDS as a distinctservice sector, and that commitments apply to all suppliers of the service, whether suchsuppliers are public or private enterprises. UPS believes that although the agreement’sprovisions on customs procedures could be improved, they are expected to facilitatecustoms procedures and enhance the ability of EDS suppliers to quickly and reliably
22 Juliana Cofrancesco and John Bruce, Howrey, LLP, counsel to the Tile Council of America, Inc.23 TCA notes that its comments are limited to the likely impact of the U.S.-Singapore FTA on the U.S.
industry producing ceramic tiles classified under HTS headings 6907 and 6908.24 Selina Jackson, International Public Affairs Manager, United Parcel Service.
128
meet the needs of their customers. Similarly, UPS believes that the agreement’sprovisions on cross-subsidization could be improved in future trade agreements byeffectively addressing cross-subsidization of EDS by those with government-grantedmonopoly rights.
U.S. Chamber of Commerce25
The U.S. Chamber of Commerce (Chamber) is the world’s largest business federation.It represents three million businesses of all sizes and sectors, and from every region ofthe United States. The Chamber supports the FTA and views it as a significant steptoward advancing trade with Singapore and U.S. economic prosperity. The Chambernotes that U.S. two-way trade with Singapore accounts for over $30 billion annuallyand over 1,500 American companies are operating in Singapore today.Consequently, the Chamber asserts that the FTA will bring tangible commercialbenefits to American companies, workers, and consumers and offer greater access toSingapore’s market while increasing the U.S. competitive position in the region.
In regards to the general provisions of the FTA, the Chamber contends that key benefitsfor U.S. companies are in the following areas: trade in goods, investment, competitionpolicy, government procurement, movement of personnel, customs procedures, rulesof origin, and intellectual property rights. The Chamber also believes that the FTA willprovide substantial benefits to the U.S. service industry. Specific service industriesmentioned by the Chamber include: financial services, professional services,telecommunications, express delivery services, electronic commerce, and insurance.
U.S.-Singapore FTA Business Coalition26
The U.S.-Singapore FTA Business Coalition (Coalition) is a group of approximately 75leading U.S. trade associations. The Coalition endorses the U.S.-Singapore FTA andstates that the agreement’s emphasis on bilateral customs cooperation, expeditedcustoms clearances, and tariff elimination will lead to increased trade volumes. TheCoalition contends that the FTA will open new sectors to American companies inSingapore, spur economic growth in both countries, create higher paying jobs forAmerican workers, and increase economic integration between the two countries.Further, the Coalition indicates that for American companies, the FTA represents newinvestment opportunities and the potential for more profitable business activities. The
25 Myron Brilliant, Vice President, Asia, U.S. Chamber of Commerce.26 Robert D. Baulerlein, Co-Chair, U.S.-Singapore FTA Business Coalition, and Vice President of
International Operations, The Boeing Company.
129
Coalition notes that the FTA also will stimulate interest in the United States as a potentialinvestment destination. The Coalition asserts that the FTA will further solidify America’spresence and commitment to the Southeast Asian region. Finally, the Coalition notesthat the United States has fallen behind the rest of the world, because it is only asignatory to four of the estimated 130 FTAs that exist.
The Coalition indicates that the largest sector that is to gain from the FTA is the servicesarea. It states that the FTA allows for new and expanded trading opportunities forspecific service sector industries which include: financial services, insurance, expressdelivery services, healthcare, telecommunications, information technology,transportation, and travel and tourism. For example, the Coalition states that in thebanking sector, the establishment of more branch operations in Singapore will allowU.S. banks to become more competitive with features such as enhanced customerservice capabilities through access to the local ATM network. In regards to intellectualproperty rights (IPR), the Coalition asserts that the U.S.-Singapore FTA breaks newground and supports provisions that the American high-technology industry deemsessential for marketing its products abroad. The Coalition states that the FTA’s IPRprovisions will provide benefits to American biotech, chemical, pharmaceutical,entertainment, and multimedia companies that include: nondiscriminatory treatment,government involvement in the investigation and prosecution of violators, as well asactive application of anticircumvention rules. For e-commerce, the Coalition assertsthat the FTA commits Singapore to the nondiscriminatory treatment of digital productsand lowers the barriers on the use and development of e-commerce.
Wal-Mart Stores, Inc.27
Wal-Mart Stores, Inc. is the world’s largest retailer, with $218 billion in sales in 2002.The company employs more than 1.3 million workers worldwide and maintainsfacilities in the United States, as well as Argentina, Brazil, Canada, China, Germany,Japan, Korea, Mexico, Puerto Rico, and the United Kingdom.
Wal-Mart support free trade agreements that reduce barriers to trade. Wal-Martsupported the Singapore FTA negotiations and expects that its volume of trade willincrease under a liberalized regime. Wal-Mart believes that Singapore representsboth a sound economy in which to invest and a significant logistical hub in Asia.According to Wal-Mart, the agreement will advance Singapore’s economicdevelopment and create a model for regional and economic cooperation. Wal-Martsupports tariff elimination as well as commitments to eliminate technical barriers totrade that impede sales of high-quality, low-cost goods to consumers. Wal-Mart is
27 Angela Marshall Hofmann, Director, International Trade, National Government Relations,Wal-Mart Stores, Inc.

130
very interested in regulatory transparency disciplines and values the establishment ofstrong intellectual property rights protections. In addition, Wal-Mart recognizes thatthe agreement accords market access and national treatment to service providers.
Despite its general support, Wal-Mart believes the rules of origin for textile andapparel products are overly restrictive and may adversely impact apparel sourcingfrom Singapore. Wal-Mart thinks further liberalization of apparel trade would helpSingapore offset China’s emerging dominance in apparel sourcing. Wal-Mart hopesthat these rules are not used as a precedent in other FTAs, preferring rules that allowfor accumulation of inputs from other free trade partners or preferential tradepartners.

A-1
APPENDIX AREQUEST LETTER

A-2
A-3


B-1
APPENDIX BFEDERAL REGISTER NOTICE

B-2

B-3
B-4

C-1
APPENDIX CHEARING PARTICIPANTS

C-2
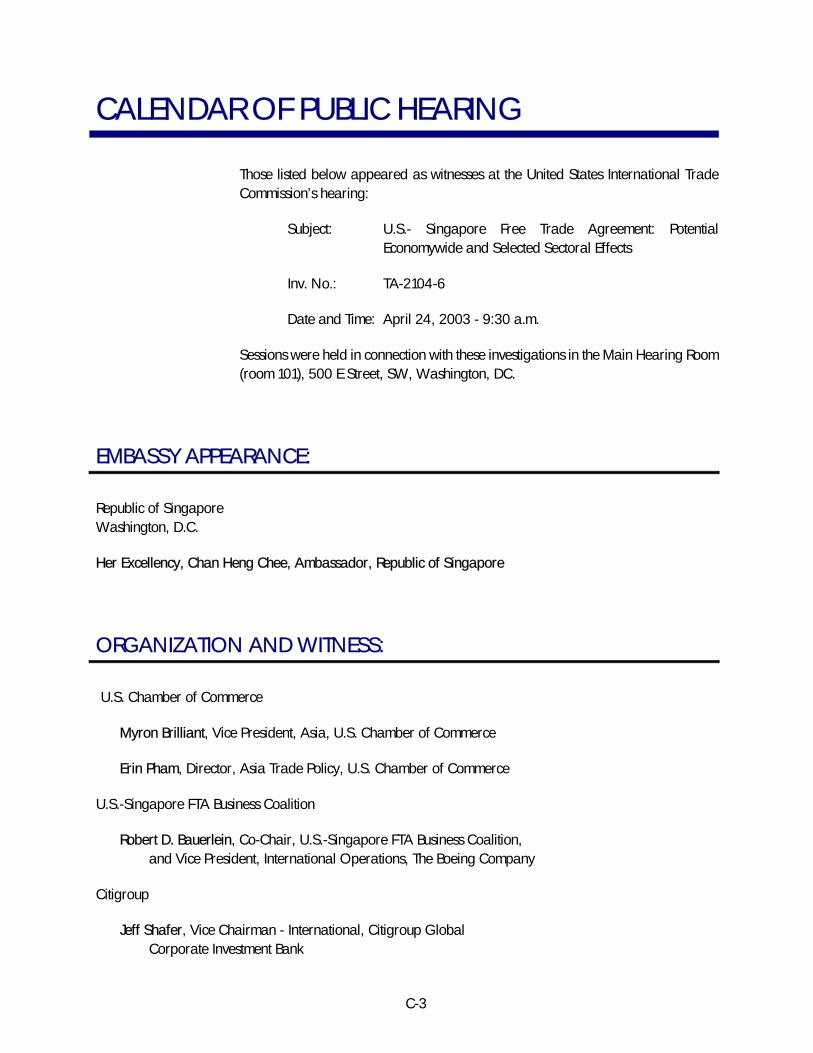
C-3
CALENDAR OF PUBLIC HEARING
Those listed below appeared as witnesses at the United States International TradeCommission’s hearing:
Subject: U.S.- Singapore Free Trade Agreement: PotentialEconomywide and Selected Sectoral Effects
Inv. No.: TA-2104-6
Date and Time: April 24, 2003 - 9:30 a.m.
Sessions were held in connection with these investigations in the Main Hearing Room(room 101), 500 E Street, SW, Washington, DC.
EMBASSY APPEARANCE:
Republic of SingaporeWashington, D.C.
Her Excellency, Chan Heng Chee, Ambassador, Republic of Singapore
ORGANIZATION AND WITNESS:
U.S. Chamber of Commerce
Myron Brilliant, Vice President, Asia, U.S. Chamber of Commerce
Erin Pham, Director, Asia Trade Policy, U.S. Chamber of Commerce
U.S.-Singapore FTA Business Coalition
Robert D. Bauerlein, Co-Chair, U.S.-Singapore FTA Business Coalition,and Vice President, International Operations, The Boeing Company
Citigroup
Jeff Shafer, Vice Chairman - International, Citigroup GlobalCorporate Investment Bank
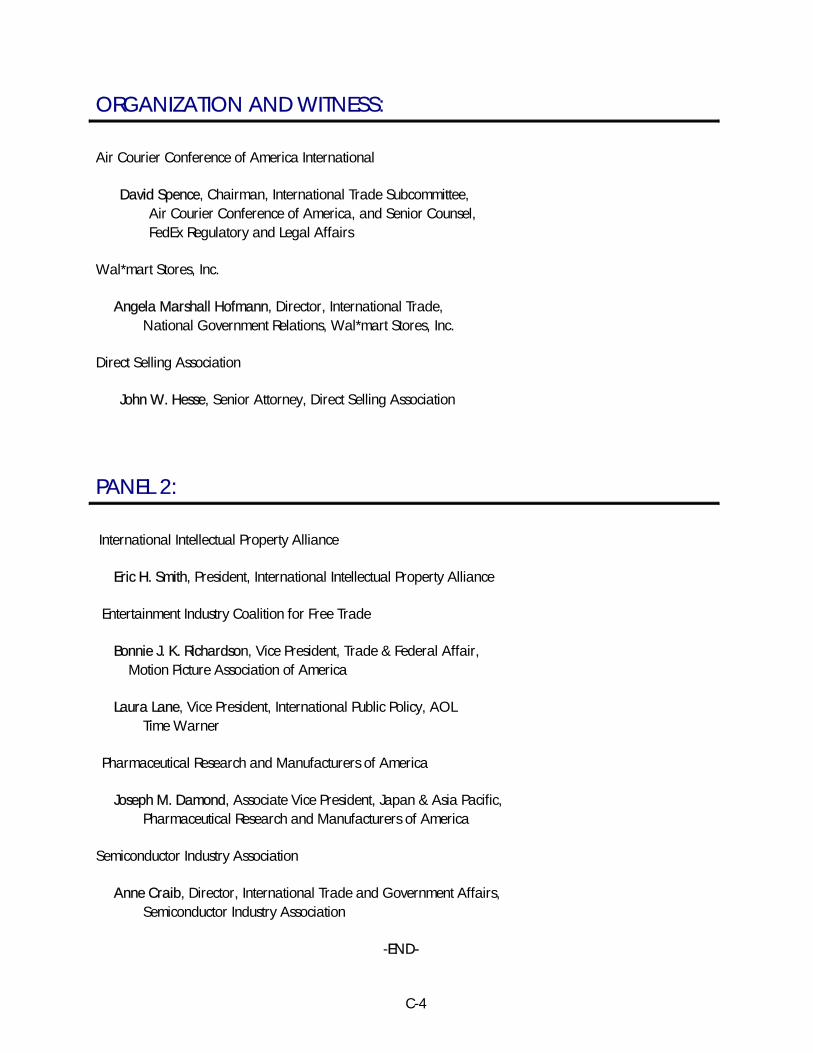
C-4
ORGANIZATION AND WITNESS:
Air Courier Conference of America International
David Spence, Chairman, International Trade Subcommittee,Air Courier Conference of America, and Senior Counsel,FedEx Regulatory and Legal Affairs
Wal*mart Stores, Inc.
Angela Marshall Hofmann, Director, International Trade,National Government Relations, Wal*mart Stores, Inc.
Direct Selling Association
John W. Hesse, Senior Attorney, Direct Selling Association
PANEL 2:
International Intellectual Property Alliance
Eric H. Smith, President, International Intellectual Property Alliance
Entertainment Industry Coalition for Free Trade
Bonnie J. K. Richardson, Vice President, Trade & Federal Affair,Motion Picture Association of America
Laura Lane, Vice President, International Public Policy, AOLTime Warner
Pharmaceutical Research and Manufacturers of America
Joseph M. Damond, Associate Vice President, Japan & Asia Pacific,Pharmaceutical Research and Manufacturers of America
Semiconductor Industry Association
Anne Craib, Director, International Trade and Government Affairs,Semiconductor Industry Association
-END-

D-1
APPENDIX DTECHNICAL APPENDIX

D-2
APPENDIX D
The discussion that follows focuses on the quantitative analysis incorporated in thisreport—the computable general equilibrium analysis presented in chapter 5.
The GTAP Model
In general, the dynamic questions of interest to policymakers involve the ways in whichthe trade policy under consideration interacts with other changes that are expected inthe economies of interest. In this report, the Commission reports policy impactsobtained from sequential solutions of the standard static Global Trade Analysis Project(GTAP) model that was adjusted to address those specific issues.1 This appendixreviews the procedures used to adapt the standard GTAP model in order to assess thelikely impacts of the FTA between the United States and Singapore. First, the basicfeatures of the static GTAP model are introduced. Second, the adjustments made to thestandard database are discussed. The third and fourth sections present variousaspects of the baseline construction and solution techniques.
The Standard GTAP Model2The GTAP model is a static general equilibrium model consisting of a documentedglobal database on international trade, economywide interindustry relationships,national income accounts, and a standard modeling framework to organize andanalyze the data. It allows for comparisons of the global economy in twoenvironments: one in which the base values of policy instruments such as tariffs orexport restrictions are unchanged, and another in which these measures are changed,or shocked, to reflect the policies that are being studied. A change in policy makes itselffelt throughout the economies depicted in the model. The static model by design doesnot produce information about the speed with which changes occur, about whathappens to various dimensions of the economies in the meanwhile, or what may havehappened to change some of the underlying dynamic structures of the economies, suchas specific patterns of foreign direct investment or technological changes that mayalter the future growth pattern of economies.
Results from the GTAP model are based upon established global trade patterns. Thismeans that the model is unable to estimate changes in trade in commodities that
1 Other important issues such as adjustment costs and anticipated versus unexpected policies are notaddressed here.
2 For further information, see T.W. Hertel, ed., Global Trade Analysis: Modeling and Application,Cambridge: Cambridge University Press, 1997.
D-3
historically have not been traded. That is to say, if a particular commodity is not tradedbetween two economies, the model will assume that there will always be no trade inthat commodity.3 Furthermore, patterns of trade may exist for such reasons as thedistance between countries or cultural preferences, which are imperfectly captured bythe model. The GTAP model does not directly account for historical or cultural factorsas determinants of trade patterns. The model assumes that these factors are unaffectedby the trade policy change. The model will tend to show smaller effects of policychanges operating on smaller trade flows, and larger effects on larger flows.
In the GTAP model, domestic products and imports are consumed by firms,governments, and households. Product markets are assumed to be perfectlycompetitive (implying zero economic profit for the firm), with imports as imperfectsubstitutes for domestic products (i.e., consumers are aware of the source of theproducts and may distinguish between them based on the foreign or domestic origin),and sectoral production determined by global demand and supply of the output.
Updating the GTAP DatabaseThe current version of the GTAP database (release 5.3) covers trade in 57 commodityaggregates, or GTAP sectors, among 78 economies.4 For the purpose of the presentanalysis, the database has been aggregated into 13 economies and 22 commoditygroups (table D-1). The commodity aggregation adopted here focuses either on GTAPsectors with either substantial trade between the United States and FTA partnereconomy or on GTAP sectors with substantial domestic-world prices wedges.
In addition to the data on bilateral trade in each of the commodities in the model, dataare incorporated on the domestic production and use of each commodity (includinguse in the production of other commodities), the supply and use of land, labor, capital,population, and GDP. The database also contains information on tariffs, somenontariff barriers, and other taxes. An additional component of the data is a set ofparameters which, in the context of the model’s equations, determines economicbehavior. This is principally a set of elasticity values that determine, among otherthings, the extent to which imports and domestically produced goods are substitutes forone another.
The current standard GTAP data is based on the year 1997–i.e., trade flows andbarriers, and other data refer to the world in that year. For the purpose of the presentstudy, the standard data set was projected to reflect 2004, using data from the U.S.Department of Commerce (U.S. imports and exports, as well as U.S.-Singapore
3 This shortcoming does not affect the analysis here because the sectoral specification, shown intable D-2, is quite aggregated. At that level of aggregation, there is trade for almost all sectors.
4 Betina V. Dimaranan (2003), “Memo regarding candidate database for GTAP interim release5.3,” Center for Global Trade Analysis, Purdue University, Feb. 7, 2003, and Betina V. Dimaranan andRobert A. McDougall, Global Trade, Assistance, and Production: The GTAP 5 Data Base, Center forGlobal Trade Analysis, Purdue University, 2002.
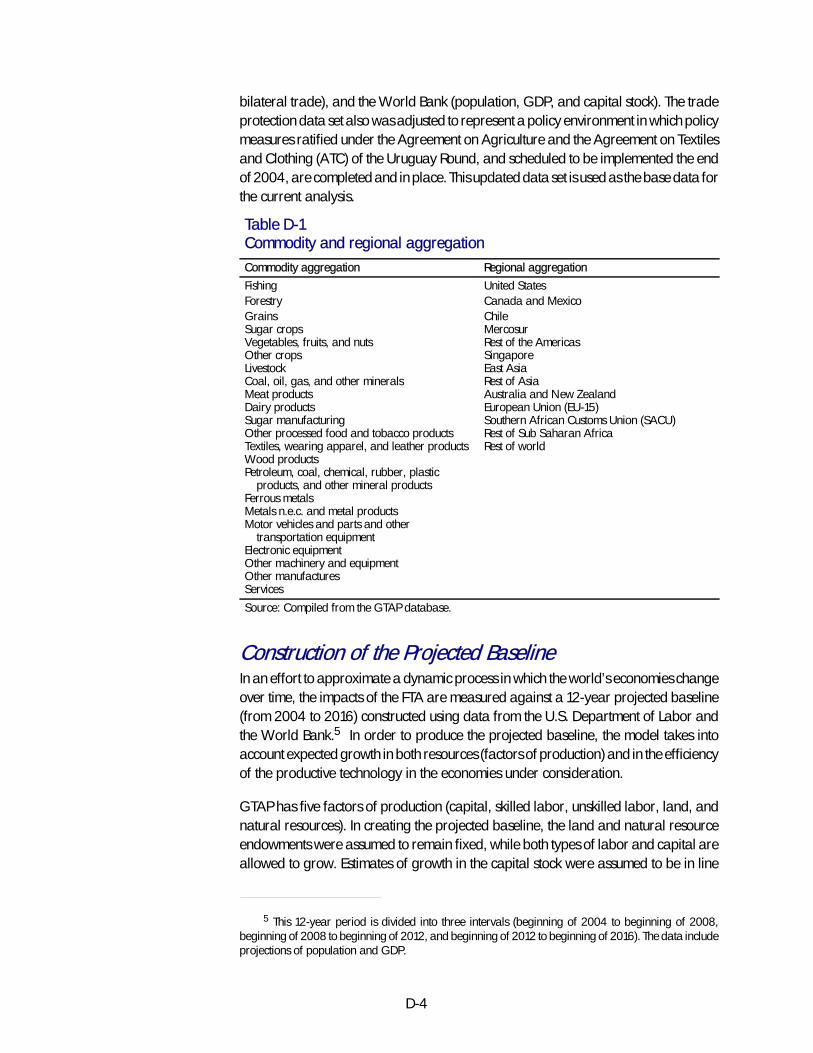
D-4
bilateral trade), and the World Bank (population, GDP, and capital stock). The tradeprotection data set also was adjusted to represent a policy environment in which policymeasures ratified under the Agreement on Agriculture and the Agreement on Textilesand Clothing (ATC) of the Uruguay Round, and scheduled to be implemented the endof 2004, are completed and in place. This updated data set is used as the base data forthe current analysis.
Table D-1Commodity and regional aggregationCommodity aggregation Regional aggregation
Fishing United StatesForestry Canada and MexicoGrainsSugar cropsVegetables, fruits, and nutsOther cropsLivestockCoal, oil, gas, and other mineralsMeat productsDairy productsSugar manufacturingOther processed food and tobacco productsTextiles, wearing apparel, and leather productsWood productsPetroleum, coal, chemical, rubber, plastic
products, and other mineral productsFerrous metalsMetals n.e.c. and metal productsMotor vehicles and parts and other
transportation equipmentElectronic equipmentOther machinery and equipmentOther manufacturesServices
ChileMercosurRest of the AmericasSingaporeEast AsiaRest of AsiaAustralia and New ZealandEuropean Union (EU-15)Southern African Customs Union (SACU)Rest of Sub Saharan AfricaRest of world
Source: Compiled from the GTAP database.
Construction of the Projected BaselineIn an effort to approximate a dynamic process in which the world’s economies changeover time, the impacts of the FTA are measured against a 12-year projected baseline(from 2004 to 2016) constructed using data from the U.S. Department of Labor andthe World Bank.5 In order to produce the projected baseline, the model takes intoaccount expected growth in both resources (factors of production) and in the efficiencyof the productive technology in the economies under consideration.
GTAP has five factors of production (capital, skilled labor, unskilled labor, land, andnatural resources). In creating the projected baseline, the land and natural resourceendowments were assumed to remain fixed, while both types of labor and capital areallowed to grow. Estimates of growth in the capital stock were assumed to be in line
5 This 12-year period is divided into three intervals (beginning of 2004 to beginning of 2008,beginning of 2008 to beginning of 2012, and beginning of 2012 to beginning of 2016). The data includeprojections of population and GDP.

D-5
with the World Bank projections.6 Growth rates of skilled and unskilled labor wereassumed equal to the projections of population growth rates.7
The World Bank data do not report expected growth in total factor productivity (TFP), avariable that represents the growth of economic efficiency in each economy. However,the implicit rate of TFP growth can be derived from model simulations that estimate theefficiency gains that would allow the projected growth in inputs to produce theexpected growth in output.8 In order to determine the baseline growth in TFP, theGTAP model is adjusted so that it addresses this, using projections of labor, capital,and GDP. The additional efficiency needed to produce the projected change in outputthen becomes an input into the projected baseline.9
For each time interval of the projected baseline, the protection data are changed toreflect the Uruguay Round (including the Agreements on Agriculture and on Textilesand Clothing). Thus, economic conditions in 2004 reflect reductions in export subsidiesand import tariffs for food and agricultural products and expansion of quotas fortextiles and clothing agreed at the Uruguay Round.
Solution TechniqueA typical experiment conducted in the standard GTAP framework measures thelong-term effects of a one-time, full implementation of an agreement.10 It is assumedin the model that sufficient time is allowed to let the full effect of the agreement work itsway through the economy. Reported figures show the effects of a trade policy shock asit would have appeared in the base year of the data. Such estimates require no
6 In the development of the baseline from 1997 to 2016, regional investment in new capital goodswas made consistent with the capital stock growth rates from the World Bank forecasts.
7 The World Bank projects population growth, but does not project how the composition of thepopulation changes over time. There are likely to be changes over time in the rate of unemployment, theshare of workers that could be considered skilled, and the productivity of the average worker. Withoutprojections on these variables, they are assumed fixed over time.
8 Solving the model to produce TFP growth rates is equivalent in concept to the growth accountingapproach typically used in simple calculations. In growth accounting, 3 percent growth in GDP and 2percent growth in inputs (capital and labor) implies a 1 percent (3 - 2 = 1) increase in TFP. Because themathematical structure of the GTAP model is more complicated than the model used in growthaccounting, we could not use growth accounting, though the estimates calculated in growth accountingwould be quite similar to those calculated within the model. Because the purpose of the exercise is toeventually replicate the GDP forecast exactly, TFP growth must be computed within the context of themodel.
9 Economies undergo several kinds of technological change over time. These assumptions captureonly the average change in an economy’s ability to change a given bundle of inputs into output. Oneaspect of technical change is how the nature of an economy’s input-output structure changes over time.For example, as a developing economy grows, it may begin to use a larger share of capital (tractors) inagricultural production. These projections assume no change in input-output structures over time.
10 See, for example, USITC, The Impact on the U.S. Economy of Including the United Kingdom in aFree Trade Arrangement with the United States, Canada, and Mexico, USITC Pub. 3339, August 2000,or USITC, Overview and Analysis of the Economic Impact of U.S. Sanctions with Respect to India andPakistan, USITC Pub. 3236, September 1999.
D-6
assumptions about the time required for full adjustment. The primary disadvantage ofthe static approach is that it does not account for expected changes in the economyover time.
In the present counterfactual analysis, the baseline described earlier is assumed torepresent a reasonable projection of the likely evolution of the relevant variables in theabsence of the U.S.- Singapore FTA or other trade policy changes.11 The modelingapproach is a sequential simulation of the static GTAP model, with an updatingprocedure that allows key macroeconomic variables in the model to match the WorldBank projections of these variables. This framework allows for changes in theproductive resources (capital and labor) available in each economy, as well as theirproductivity, so that the changing trade pattern can be affected both by the tariff cutsand by projected changes in inputs and in economy-wide output. The effects of theagreement at a given point in time are estimated by: (1) calculating baseline data byshocking the model with cumulative increases in labor, capital, and TFP, (2) solving themodel once again using the FTA liberalization, and (3) reporting the results of themodeling. This procedure is done for each solution point (2004, 2008, 2012, and2016). It is assumed that trade barrier elimination starts in 2004, with gradualphase-outs. Economic agents portrayed in the model are not able to link the periods oftime when they make their decisions.12 Thus, the decision makers are neither forward-nor backward-looking, they simply act in each period as the relevant resourceconstraints bind them to do.
Measuring the Impacts of the FTAThe probable effects of the U.S.-Singapore FTA reported are simply the deviations ofthe relevant variables from their levels in the projected baseline, at any given solutionpoint. Reported deviations in economic variables like production, trade, and income,indicate the likely degree to which the policy causes the modeled economies to deviatefrom their expected paths. Changes in the variables of interest are measured inpercentage terms, relative to the projected baseline.
Tables D-2 to D-4 report sectoral impacts for U.S. imports, exports and output atmid-point implementation of the agreement for simulations with the base caseparameters.
11 It should be stressed that the baseline is not intended as a forecast, but as a projection that relies onaverage expected growth rates. Unexpected events may lead the actual macroeconomic evolution of thevariables of interest to differ substantially from the projected baseline. The projected baseline is simply theCommission’s best estimate of how these variables are expected to evolve, given the projections from theWorld Bank.
12 In this sense, the model is not quite as rigorous as some dynamic CGE models, which allow theagents the possibility to consider future outcomes when making current decisions.

D-7
Table D-2Effects on U.S. exports, 2004-16 (relative to baseline)
U.S. total exports to the world U.S. exports to Singapore2004 2004 2008 2012 2016 2004 2004 2008 2012 2016
Milliondollars
MilliondollarsPercent change Percent change
Fishing . . . . . . . . . . . . . . . . . . . . . . . . 743 0.0 0.0 0.0 0.0 1 0.0 0.1 0.1 0.1Forestry . . . . . . . . . . . . . . . . . . . . . . . 1,842 0.0 0.0 0.0 0.0 2 0.0 0.1 0.2 0.3Grains . . . . . . . . . . . . . . . . . . . . . . . . 11,564 0.0 0.0 0.0 0.0 14 0.0 0.2 0.3 0.3Sugar crops . . . . . . . . . . . . . . . . . . . 3 0.0 0.0 0.0 0.0 0 0.0 0.1 0.2 0.3Vegetables, fruits, and nuts . . . . . . . . 6,363 0.3 0.3 0.3 0.3 60 37.2 37.0 36.9 36.9Other crops . . . . . . . . . . . . . . . . . . . . 12,669 0.0 0.0 0.0 0.0 5 0.1 0.3 0.5 0.6Livestock . . . . . . . . . . . . . . . . . . . . . . 4,571 0.0 0.0 0.0 0.0 11 -0.1 -0.1 -0.1 -0.1Coal, oil, gas, and other minerals . . . 7,004 0.0 0.0 0.0 0.0 22 0.8 0.7 0.7 0.6Meat products . . . . . . . . . . . . . . . . . . 9,651 0.1 0.1 0.1 0.1 33 36.6 36.6 36.8 37.0Dairy products . . . . . . . . . . . . . . . . . 798 0.3 0.3 0.3 0.3 7 29.0 29.0 29.0 29.0Sugar manufacturing . . . . . . . . . . . . 88 0.0 0.0 0.0 0.0 0 0.0 0.1 0.1 0.1Other foods . . . . . . . . . . . . . . . . . . . . 29,284 0.1 0.1 0.1 0.1 215 18.7 18.6 18.6 18.5Textiles and apparel . . . . . . . . . . . . 23,362 0.0 0.0 0.0 0.0 97 0.4 0.9 1.9 2.5Wood products . . . . . . . . . . . . . . . . . 10,141 0.0 0.0 0.0 0.0 35 -0.1 -0.1 -0.1 -0.2Petroleum, coal and chemical
products . . . . . . . . . . . . . . . . . . . . 133,361 0.0 0.0 0.0 0.0 2,936 0.2 0.2 0.2 0.2Ferrous metals . . . . . . . . . . . . . . . . . . 26,630 0.0 0.0 0.0 0.0 352 0.2 0.2 0.2 0.1Metals n.e.c. and metal products . . . . 18,372 0.0 0.0 0.0 0.0 96 0.0 0.0 -0.1 -0.1Transportation equipment . . . . . . . . . 174,483 0.0 0.0 0.0 0.0 4,877 0.3 0.4 0.4 0.4Electronic equipment . . . . . . . . . . . . . 126,476 0.0 0.1 0.1 0.1 4,590 0.3 0.2 0.2 0.2Other machinery and equipment . . . 197,235 0.0 0.0 0.0 0.0 4,958 0.3 0.3 0.3 0.3Other manufactures . . . . . . . . . . . . . 37,523 0.0 0.0 0.0 0.0 363 0.1 0.2 0.3 0.3Services . . . . . . . . . . . . . . . . . . . . . . . 354,557 0.0 0.0 0.0 0.0 3,300 0.3 0.3 0.4 0.4All sectors . . . . . . . . . . . . . . . . . . . . . 1,186,720 0.0 0.0 0.0 0.0 21,974 0.6 0.6 0.7 0.7
Sources: GTAP database and USITC calculations.
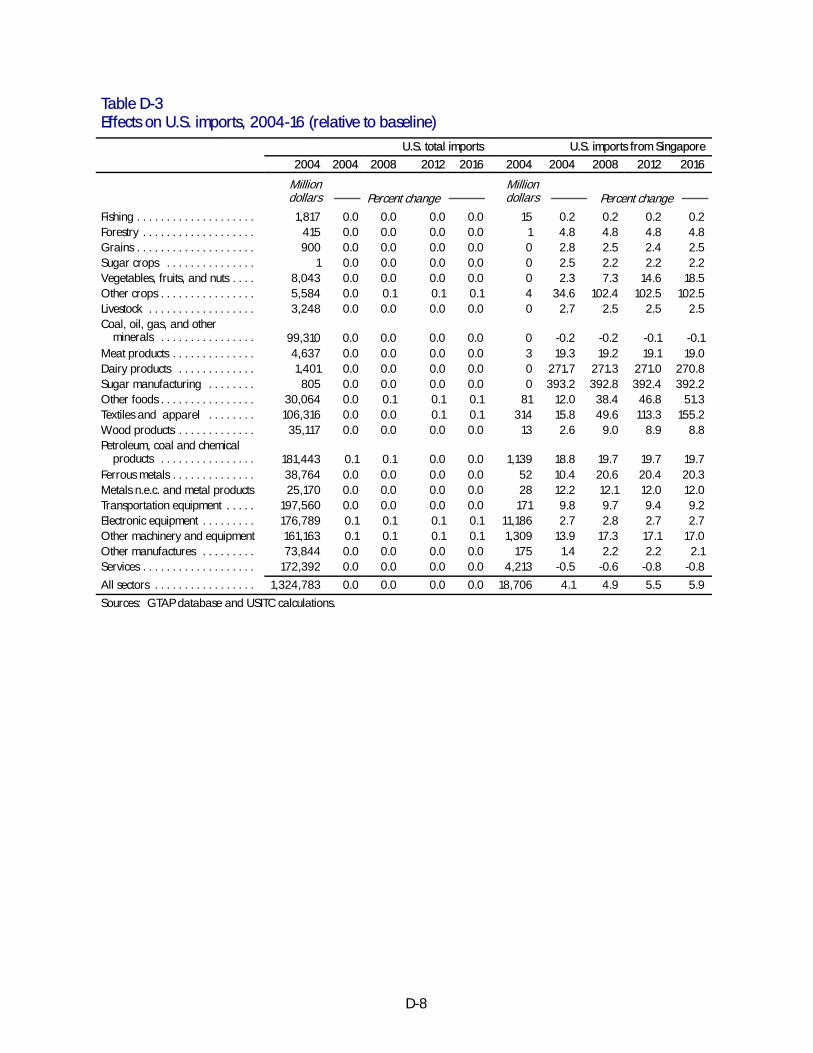
D-8
Table D-3Effects on U.S. imports, 2004-16 (relative to baseline)
U.S. total imports U.S. imports from Singapore2004 2004 2008 2012 2016 2004 2004 2008 2012 2016
Milliondollars
MilliondollarsPercent change Percent change
Fishing . . . . . . . . . . . . . . . . . . . . 1,817 0.0 0.0 0.0 0.0 15 0.2 0.2 0.2 0.2Forestry . . . . . . . . . . . . . . . . . . . 415 0.0 0.0 0.0 0.0 1 4.8 4.8 4.8 4.8Grains . . . . . . . . . . . . . . . . . . . . 900 0.0 0.0 0.0 0.0 0 2.8 2.5 2.4 2.5Sugar crops . . . . . . . . . . . . . . . 1 0.0 0.0 0.0 0.0 0 2.5 2.2 2.2 2.2Vegetables, fruits, and nuts . . . . 8,043 0.0 0.0 0.0 0.0 0 2.3 7.3 14.6 18.5Other crops . . . . . . . . . . . . . . . . 5,584 0.0 0.1 0.1 0.1 4 34.6 102.4 102.5 102.5Livestock . . . . . . . . . . . . . . . . . . 3,248 0.0 0.0 0.0 0.0 0 2.7 2.5 2.5 2.5Coal, oil, gas, and other
minerals . . . . . . . . . . . . . . . . 99,310 0.0 0.0 0.0 0.0 0 -0.2 -0.2 -0.1 -0.1Meat products . . . . . . . . . . . . . . 4,637 0.0 0.0 0.0 0.0 3 19.3 19.2 19.1 19.0Dairy products . . . . . . . . . . . . . 1,401 0.0 0.0 0.0 0.0 0 271.7 271.3 271.0 270.8Sugar manufacturing . . . . . . . . 805 0.0 0.0 0.0 0.0 0 393.2 392.8 392.4 392.2Other foods . . . . . . . . . . . . . . . . 30,064 0.0 0.1 0.1 0.1 81 12.0 38.4 46.8 51.3Textiles and apparel . . . . . . . . 106,316 0.0 0.0 0.1 0.1 314 15.8 49.6 113.3 155.2Wood products . . . . . . . . . . . . . 35,117 0.0 0.0 0.0 0.0 13 2.6 9.0 8.9 8.8Petroleum, coal and chemical
products . . . . . . . . . . . . . . . . 181,443 0.1 0.1 0.0 0.0 1,139 18.8 19.7 19.7 19.7Ferrous metals . . . . . . . . . . . . . . 38,764 0.0 0.0 0.0 0.0 52 10.4 20.6 20.4 20.3Metals n.e.c. and metal products 25,170 0.0 0.0 0.0 0.0 28 12.2 12.1 12.0 12.0Transportation equipment . . . . . 197,560 0.0 0.0 0.0 0.0 171 9.8 9.7 9.4 9.2Electronic equipment . . . . . . . . . 176,789 0.1 0.1 0.1 0.1 11,186 2.7 2.8 2.7 2.7Other machinery and equipment 161,163 0.1 0.1 0.1 0.1 1,309 13.9 17.3 17.1 17.0Other manufactures . . . . . . . . . 73,844 0.0 0.0 0.0 0.0 175 1.4 2.2 2.2 2.1Services . . . . . . . . . . . . . . . . . . . 172,392 0.0 0.0 0.0 0.0 4,213 -0.5 -0.6 -0.8 -0.8
All sectors . . . . . . . . . . . . . . . . . 1,324,783 0.0 0.0 0.0 0.0 18,706 4.1 4.9 5.5 5.9
Sources: GTAP database and USITC calculations.
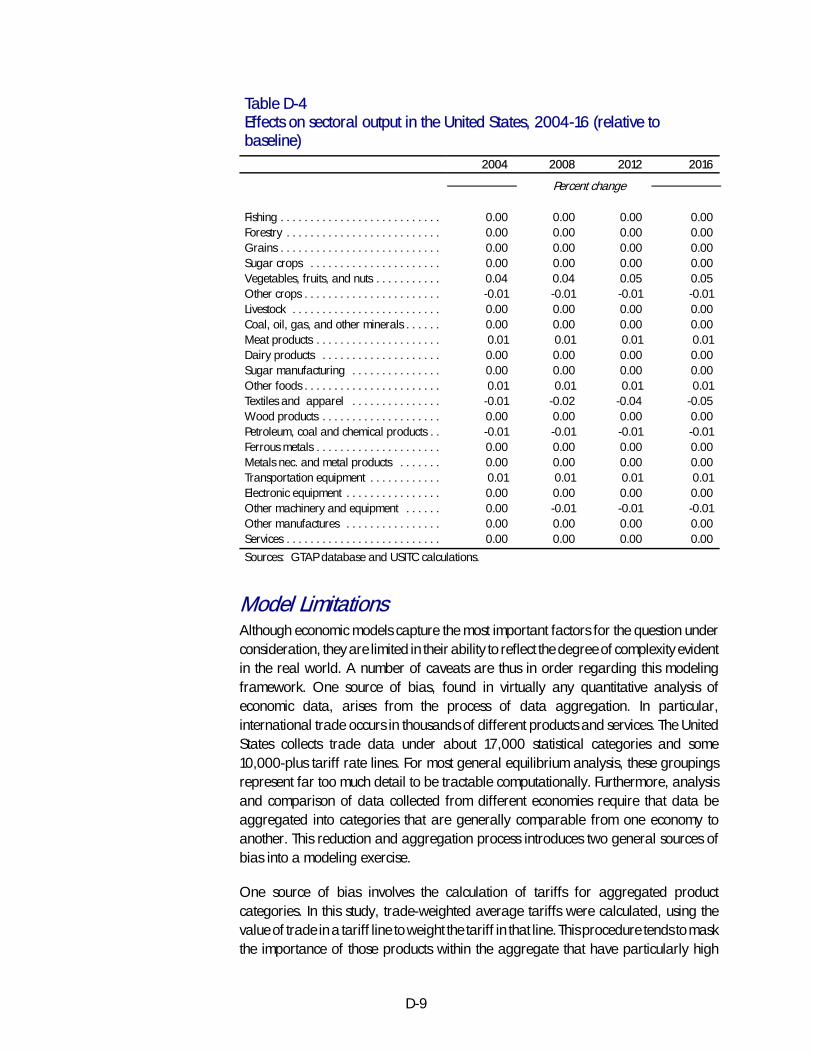
D-9
Table D-4Effects on sectoral output in the United States, 2004-16 (relative tobaseline)
2004 2008 2012 2016
Percent change
Fishing . . . . . . . . . . . . . . . . . . . . . . . . . . . 0.00 0.00 0.00 0.00Forestry . . . . . . . . . . . . . . . . . . . . . . . . . . 0.00 0.00 0.00 0.00Grains . . . . . . . . . . . . . . . . . . . . . . . . . . . 0.00 0.00 0.00 0.00Sugar crops . . . . . . . . . . . . . . . . . . . . . . 0.00 0.00 0.00 0.00Vegetables, fruits, and nuts . . . . . . . . . . . 0.04 0.04 0.05 0.05Other crops . . . . . . . . . . . . . . . . . . . . . . . -0.01 -0.01 -0.01 -0.01Livestock . . . . . . . . . . . . . . . . . . . . . . . . . 0.00 0.00 0.00 0.00Coal, oil, gas, and other minerals . . . . . . 0.00 0.00 0.00 0.00Meat products . . . . . . . . . . . . . . . . . . . . . 0.01 0.01 0.01 0.01Dairy products . . . . . . . . . . . . . . . . . . . . 0.00 0.00 0.00 0.00Sugar manufacturing . . . . . . . . . . . . . . . 0.00 0.00 0.00 0.00Other foods . . . . . . . . . . . . . . . . . . . . . . . 0.01 0.01 0.01 0.01Textiles and apparel . . . . . . . . . . . . . . . -0.01 -0.02 -0.04 -0.05Wood products . . . . . . . . . . . . . . . . . . . . 0.00 0.00 0.00 0.00Petroleum, coal and chemical products . . -0.01 -0.01 -0.01 -0.01Ferrous metals . . . . . . . . . . . . . . . . . . . . . 0.00 0.00 0.00 0.00Metals nec. and metal products . . . . . . . 0.00 0.00 0.00 0.00Transportation equipment . . . . . . . . . . . . 0.01 0.01 0.01 0.01Electronic equipment . . . . . . . . . . . . . . . . 0.00 0.00 0.00 0.00Other machinery and equipment . . . . . . 0.00 -0.01 -0.01 -0.01Other manufactures . . . . . . . . . . . . . . . . 0.00 0.00 0.00 0.00Services . . . . . . . . . . . . . . . . . . . . . . . . . . 0.00 0.00 0.00 0.00
Sources: GTAP database and USITC calculations.
Model LimitationsAlthough economic models capture the most important factors for the question underconsideration, they are limited in their ability to reflect the degree of complexity evidentin the real world. A number of caveats are thus in order regarding this modelingframework. One source of bias, found in virtually any quantitative analysis ofeconomic data, arises from the process of data aggregation. In particular,international trade occurs in thousands of different products and services. The UnitedStates collects trade data under about 17,000 statistical categories and some10,000-plus tariff rate lines. For most general equilibrium analysis, these groupingsrepresent far too much detail to be tractable computationally. Furthermore, analysisand comparison of data collected from different economies require that data beaggregated into categories that are generally comparable from one economy toanother. This reduction and aggregation process introduces two general sources ofbias into a modeling exercise.
One source of bias involves the calculation of tariffs for aggregated productcategories. In this study, trade-weighted average tariffs were calculated, using thevalue of trade in a tariff line to weight the tariff in that line. This procedure tends to maskthe importance of those products within the aggregate that have particularly high
D-10
tariffs, and which therefore present a greater barrier to imports than would be the caseif all goods within the aggregation had the same average tariff. The relationshipbetween the level of an import-weighted average tariff and the effects of the individualtariffs that comprise the group depend on the correlation between the level of thesetariffs and the price responsiveness of final demand for the goods in question.13 As aresult, modeling the reduction of an aggregate average tariff would tend to understatethe effect of reducing the tariff of a high-tariff component of the aggregate.
Another source of aggregation bias is due to the likelihood that goods within anaggregate may not be close substitutes for one another. In particular, imported goodsof a particular category may be quite dissimilar to a economy’s domestic product inthat category. However, when the price of an import falls, for example, the trademodel may indicate a certain amount of substitution of that import for the domesticproduct when, in fact, they are not close substitutes. In this case, the model wouldoverstate the impact of a given average tariff reduction.14
A number of further caveats apply to the dynamic analysis, which requires someadditional assumptions about the timing and nature of the economies’ responses to theproposed policy shocks. First, the static model makes no specific assumptions about thespeed with which changes affect the relevant economies. Because the modelingtechnique applied here requires a time frame to the adjustment process, assumptionsabout adjustment times are necessary. Second, the model assumes a singlemacroeconomic time path, and so does not allow for consideration of unexpectedmacroeconomic events such as recessions or large currency movements. Assumptionsabout the path of the projected baseline can affect estimates of the impact of the tariffcuts. Finally, because there is no information about how input-output relationships areexpected to evolve over time, the model assumes no changes in the economies’input-output structures, so that economic or technical changes that lead an industry tosubstitute one input for another are not considered.
Despite these limitations, the simulations performed here, can be quite useful inproviding insights on the effects of an FTA on a number of economic measures. Themodel presents a unified framework in which to assess the likely effects of the policy.Tying the proposed trade policy framework to a time line that includes expected futureeconomic changes allows estimation of the economic effects in the future.
13 See James E. Anderson and J. Peter Neary, “Measuring the Restrictiveness of Trade Policy,”World Bank Economic Review, vol. 8, No. 2, May 1994, pp. 151-69.
14 This type of bias is reduced in empirical trade models, like the GTAP model, that apply theArmington assumption, which treats products produced in different economies as imperfect substitutes.