Embed Size (px)
Citation preview


Address all communications toSecretary to the Commission
United States International Trade CommissionWashington, DC 20436
U.S. International Trade Commission
COMMISSIONERS
Stephen Koplan, ChairmanDeanna Tanner Okun, Vice Chairman
Lynn M. Bragg
Robert A. RogowskyDirector of Operations
Marcia E. MillerJennifer A. Hillman
Vern SimpsonDirector of Industries
Dennis M. Devaney
Project Staff:
Office of IndustriesKimberlie Freund, Project Leader
[email protected] Baumert, Deputy Project Leader
Laura Rodriguez, Rose M. Steller, Cynthia Foreso,Lisa J. Ferens, and Nicholas Austin
Office of EconomicsJames Fetzer
Primary ReviewersWilliam A. Lipovsky, Office of Industries
Janis L. Summers, Office of Tariff Affairs and Trade Agreements
With supporting assistance fromBrenda F. Carroll, Judy M. Bryant, Melissa Wiens, Loretta Willis,
Amelia Preece, Heather Sykes, and Jackie Jones

OMB No.: 3117--0188
09/01
ITC READER SATISFACTION SURVEYCertain Wool Articles: First Annual Report on U.S. Market Conditions
The U.S. International Trade Commission (ITC) is interested in your voluntary comments(burden < 15 minutes) to help us assess the value and quality of our reports, and to assist us inimproving future products. Please return survey by fax (202-205-3161) or by mail to the ITC.
Your name and title (please print; responses below not for attribution):
Please specify information in this report most useful to you/your organization:
Was any information missing that you consider important? Yes (specify below) No
If yes, please identify missing information and why it would be important or helpful to you:
Please assess the value of this ITC report (answer below by circling all that apply): SA—StronglyAgree; A—Agree; N—No Opinion/Not Applicable; D—Disagree; SD—Strongly Disagree
" Report presents new facts, information, and/or data SA A N D SD" Staff analysis adds value to facts, information, and/or data SA A N D SD" Analysis is unique or ground breaking SA A N D SD" Statistical data are useful to me/my organization SA A N D SD" Subject matter and analysis are timely SA A N D SD" ITC is the only or the preferred source of this information SA A N D SD
If not, please identify from what other source the information is available
Please evaluate the quality of this report (answer below by circling all that apply): SA—StronglyAgree; A—Agree; N—No Opinion/Not Applicable; D—Disagree; SD—Strongly Disagree
" Written in clear and understandable manner SA A N D SD" Report findings or executive summary address key issues SA A N D SD" Figures, charts, graphs are helpful to understanding issue SA A N D SD" Analysis throughout report answers key questions SA A N D SD" Report references variety of primary and secondary sources SA A N D SD" Sources are fully documented in text or footnotes SA A N D SD
Please provide further comment on any of the above performance measures, as appropriate:
Suggestions for improving this report and/or future reports:
Other topics/issues of interest or concern:
Please provide your Internet address and update your mailing address below, if applicable:

UNITED STATESINTERNATIONAL TRADE COMMISSION
WASHINGTON, DC 20436
OFFICIAL BUSINESSPENALTY FOR PRIVATE, USE $300
FOLD
NO POSTAGENECESSARY
IF MAILEDIN THE
UNITED STATES
BUSINESS REPLY MAILFIRST CLASS PERMIT NO. 12840 WASHINGTON, DC
POSTAGE WILL BE PAID BY ADDRESSEE
U.S INTERNATIONAL TRADE COMMISSION500 E STREET, SW.WASHINGTON, DC 20277--2840
ATTN:OFFICE OF INDUSTRIESCertain Wool Articles: First Annual Report onU.S. Market Conditions


U.S. International Trade CommissionWashington, DC 20436
Certain Wool ArticlesFirst Annual Report onU.S. Market Conditions
Investigation No. 332-427
September 2001
www.usitc.gov


i
ABSTRACTFollowing receipt of a request from the United States Trade Representative (USTR) on January 22,2001, the U.S. International Trade Commission (Commission) instituted investigation No. 332-427,U.S. Market Conditions for Certain Wool Articles, under section 332(g) of the Tariff Act of 1930 (19U.S.C. 1332(g)) on February 12, 2001. As requested by the USTR, the Commission is providinginformation on U.S. market conditions for men’s (and boys’) worsted wool tailored clothing, worstedwool fabrics and yarn used in such clothing, and wool fibers used in such fabrics and yarn. The results are as follows:
Apparent U.S. consumption of men’s wool tailored clothing grew in unit volume during 1996-2000, asdemand for sport coats and separate trousers generally rose, while demand for suits fell in 1999 and2000. The growth in tailored clothing consumption during 1996-2000 was accounted for almostentirely by imports, which rose almost without interruption and now supply most of the market. U.S.production of such clothing fell during most of 1996-2000.
A number of U.S. tailored clothing manufacturers reported they are experiencing financial difficulty,mainly because of declining sales, pressure from retailers to reduce prices, and intense competition. The manufacturers stated that the decline in U.S. tailored clothing production largely reflectedinsufficient quantities and varieties of cost-competitive fabrics available in the United States relative toCanada and Mexico, major foreign suppliers of tailored clothing that benefit from preferential marketaccess under the North American Free Trade Agreement (NAFTA). The U.S. manufacturers alsostated that high U.S. import tariffs on worsted wool fabrics have put them at a disadvantage vis-a-vistheir competitors in Canada and Mexico.
Official statistics show that U.S. consumption of all worsted wool fabrics fell during 1996-2000. Thedecline was accounted for by the U.S. fabric industry, whose output fell 51 percent in the period. Bycontrast, imports of such fabrics rose 24 percent in the period.
The Commission estimates that the size of the domestic market for the worsted wool fabrics wasapproximately 19 million square meters in 2000. The Commission estimates that coarse-micronfabrics account for the majority of the market, while fine-micron fabrics account for a comparativelysmall but growing market share.
The U.S. worsted wool fabric industry, which has substantial excess production capacity, hassufficient capacity to produce the quantity of worsted wool fabrics required by the U.S. tailoredclothing industry, whether for fine-micron or coarse-micron fabrics. However, tailored clothingmanufacturers’ desire to diversify their supplier base outside the U.S. market to spread risk and obtaina measure of exclusivity in fabric styles suggests significant increased utilization of U.S. capacity toproduce worsted wool fabrics, especially in fine-micron counts, is unlikely. For coarse-micron fabrics,the fabric industry appears to have difficulty providing the number and variety of fabric styles, fabricquality and consistency, and minimum order sizes required by the clothing manufacturers.


iii
Table of ContentsPage
Abstract . . . . . . . . . . . . . . . . . . . . . . . . . . . . . . . . . . . . . . . . . . . . . . . . . . . . . . . . . . . . . . i
Executive summary . . . . . . . . . . . . . . . . . . . . . . . . . . . . . . . . . . . . . . . . . . . . . . . . ix
Chapter 1. Introduction . . . . . . . . . . . . . . . . . . . . . . . . . . . . . . . . . . . . . . . . . . 1-1
Purpose and scope . . . . . . . . . . . . . . . . . . . . . . . . . . . . . . . . . . . . . . . . . . . . . . . . . . . . . . . 1-1Legislative background . . . . . . . . . . . . . . . . . . . . . . . . . . . . . . . . . . . . . . . . . . . . . . . . . . . . 1-2Questionnaires and other information sources . . . . . . . . . . . . . . . . . . . . . . . . . . . . . . . . . . . 1-4Product coverage and organization of report . . . . . . . . . . . . . . . . . . . . . . . . . . . . . . . . . . . . 1-5
Chapter 2. U.S. market conditions for men’s and boys’worsted wool tailored clothing . . . . . . . . . . . . . . . . . . . . . . . . . 2-1
Market overview . . . . . . . . . . . . . . . . . . . . . . . . . . . . . . . . . . . . . . . . . . . . . . . . . . . . . . . . . 2-1U.S. industry . . . . . . . . . . . . . . . . . . . . . . . . . . . . . . . . . . . . . . . . . . . . . . . . . . . . . . . . . . . 2-4
Restructuring and consolidation . . . . . . . . . . . . . . . . . . . . . . . . . . . . . . . . . . . . . . . . . 2-4Production . . . . . . . . . . . . . . . . . . . . . . . . . . . . . . . . . . . . . . . . . . . . . . . . . . . . . . . . . 2-5
Imports . . . . . . . . . . . . . . . . . . . . . . . . . . . . . . . . . . . . . . . . . . . . . . . . . . . . . . . . . . . . . . . 2-8
Chapter 3. U.S. market conditions for certain worstedwool fabrics . . . . . . . . . . . . . . . . . . . . . . . . . . . . . . . . . . . . . . . . . . . . . . . . . 3-1
U.S. market for worsted wool fabrics . . . . . . . . . . . . . . . . . . . . . . . . . . . . . . . . . . . . . . . . . 3-1U.S. imports . . . . . . . . . . . . . . . . . . . . . . . . . . . . . . . . . . . . . . . . . . . . . . . . . . . . . . . . . . . . 3-4Factors affecting demand for certain worsted wool fabrics . . . . . . . . . . . . . . . . . . . . . . . . . . 3-6U.S. worsted wool fabric industry . . . . . . . . . . . . . . . . . . . . . . . . . . . . . . . . . . . . . . . . . . . . 3-8
Burlington Industries, Inc. . . . . . . . . . . . . . . . . . . . . . . . . . . . . . . . . . . . . . . . . . . . . . . 3-10Warren Corp. . . . . . . . . . . . . . . . . . . . . . . . . . . . . . . . . . . . . . . . . . . . . . . . . . . . . . . . 3-11Cleyn & Tinker International Inc. . . . . . . . . . . . . . . . . . . . . . . . . . . . . . . . . . . . . . . . . 3-12Victor Forstmann, Inc. . . . . . . . . . . . . . . . . . . . . . . . . . . . . . . . . . . . . . . . . . . . . . . . . 3-12Stillwater Inc. . . . . . . . . . . . . . . . . . . . . . . . . . . . . . . . . . . . . . . . . . . . . . . . . . . . . . . . 3-12

iv
Table of Contents–Continued
Page
Chapter 4. Prices of domestic and imported worstedwool fabrics . . . . . . . . . . . . . . . . . . . . . . . . . . . . . . . . . . . . . . . . . . . . . . . . . 4-1
Data collection . . . . . . . . . . . . . . . . . . . . . . . . . . . . . . . . . . . . . . . . . . . . . . . . . . . . . . . . . . 4-1Price comparisons . . . . . . . . . . . . . . . . . . . . . . . . . . . . . . . . . . . . . . . . . . . . . . . . . . . . . . . 4-3Price trends . . . . . . . . . . . . . . . . . . . . . . . . . . . . . . . . . . . . . . . . . . . . . . . . . . . . . . . . . . . . 4-6Factors affecting prices . . . . . . . . . . . . . . . . . . . . . . . . . . . . . . . . . . . . . . . . . . . . . . . . . . . . 4-6Pricing methods . . . . . . . . . . . . . . . . . . . . . . . . . . . . . . . . . . . . . . . . . . . . . . . . . . . . . . . . . 4-8
Chapter 5. Ability of domestic fabric producers to meet the needs of domestic clothing manufacturers . . . . . 5-1
In terms of quantity . . . . . . . . . . . . . . . . . . . . . . . . . . . . . . . . . . . . . . . . . . . . . . . . . . . . . . 5-1In terms of market demands for the clothing . . . . . . . . . . . . . . . . . . . . . . . . . . . . . . . . . . . . 5-3
Quality and consistency . . . . . . . . . . . . . . . . . . . . . . . . . . . . . . . . . . . . . . . . . . . . . . . 5-5Availability of supply and reliability of delivery . . . . . . . . . . . . . . . . . . . . . . . . . . . . . 5-6Styles . . . . . . . . . . . . . . . . . . . . . . . . . . . . . . . . . . . . . . . . . . . . . . . . . . . . . . . . . . . . . 5-9Flexible lot sizes and price . . . . . . . . . . . . . . . . . . . . . . . . . . . . . . . . . . . . . . . . . . . . . 5-11
Chapter 6. Lost sales and revenues . . . . . . . . . . . . . . . . . . . . . . . . . . . . 6-1
Lost sales and revenues by U.S. producers of worsted wool fabrics . . . . . . . . . . . . . . . . . . . 6-1Lost sales and revenues by U.S. tailored clothing manufacturers . . . . . . . . . . . . . . . . . . . . . 6-2
Chapter 7. Wool fibers and yarns . . . . . . . . . . . . . . . . . . . . . . . . . . . . . . 7-1
Wool fibers . . . . . . . . . . . . . . . . . . . . . . . . . . . . . . . . . . . . . . . . . . . . . . . . . . . . . . . . . . . . 7-1Worsted wool yarns . . . . . . . . . . . . . . . . . . . . . . . . . . . . . . . . . . . . . . . . . . . . . . . . . . . . . . 7-3
Chapter 8. Position of interested parties . . . . . . . . . . . . . . . . . . . . . 8-1

v
Table of Contents–Continued
Page
Appendixes
A. Request letter from the United States Trade Representative . . . . . . . . . . . . . . . . . . . . . . . . . . A-1B. Federal Register notice . . . . . . . . . . . . . . . . . . . . . . . . . . . . . . . . . . . . . . . . . . . . . . . . . . . . . B-1C. Calendar of public hearing . . . . . . . . . . . . . . . . . . . . . . . . . . . . . . . . . . . . . . . . . . . . . . . . . . C-1D. Questionnaire data on production, shipments, inventory, imports, and exports . . . . . . . . . . . . D-1E. Questionnaire data on prices . . . . . . . . . . . . . . . . . . . . . . . . . . . . . . . . . . . . . . . . . . . . . . . . . E-1
Boxes
1-1. Title V of the Trade and Development Act of 2000 . . . . . . . . . . . . . . . . . . . . . . . . . . . . . . . 1-33-1. Total size of the worsted wool fabric market . . . . . . . . . . . . . . . . . . . . . . . . . . . . . . . . . . . . 3-5
Figures
4-1. Worsted wool fabric: Weighted-average purchase prices of domestic and imported100-percent wool fine-micron fancy fabric, by quarters, January-March 1999 toJanuary-March 2001 . . . . . . . . . . . . . . . . . . . . . . . . . . . . . . . . . . . . . . . . . . . . . . . . . . 4-5
4-2. Worsted wool fabric: Weighted-average sales prices of domestic and imported100-percent wool fine-micron fancy fabric, by quarters, January-March 1999 toJanuary-March 2001 . . . . . . . . . . . . . . . . . . . . . . . . . . . . . . . . . . . . . . . . . . . . . . . . . . 4-5
4-3. Worsted wool fabric: Weighted-average purchase prices of domestic and imported100-percent wool fine-micron solid fabric, by quarters, January-March 1999 toJanuary-March 2001 . . . . . . . . . . . . . . . . . . . . . . . . . . . . . . . . . . . . . . . . . . . . . . . . . . 4-5
4-4. Worsted wool fabric: Weighted-average sales prices of domestic and imported100-percent wool fine-micron solid fabric, by quarters, January-March 1999 toJanuary-March 2001 . . . . . . . . . . . . . . . . . . . . . . . . . . . . . . . . . . . . . . . . . . . . . . . . . . 4-5
4-5. Worsted wool fabric: Weighted-average purchase prices of domestic and imported100-percent wool coarse-micron fancy fabric, by quarters, January-March 1999 toJanuary-March 2001 . . . . . . . . . . . . . . . . . . . . . . . . . . . . . . . . . . . . . . . . . . . . . . . . . . 4-5
4-6. Worsted wool fabric: Weighted-average sales prices of domestic and imported100-percent wool coarse-micron fancy fabric, by quarters, January-March 1999 toJanuary-March 2001 . . . . . . . . . . . . . . . . . . . . . . . . . . . . . . . . . . . . . . . . . . . . . . . . . . 4-5
4-7. Worsted wool fabric: Weighted-average purchase prices of domestic and imported100-percent wool coarse-micron solid fabric, by quarters, January-March 1999 toJanuary-March 2001 . . . . . . . . . . . . . . . . . . . . . . . . . . . . . . . . . . . . . . . . . . . . . . . . . . 4-5
4-8. Worsted wool fabric: Weighted-average sales prices of domestic and imported100-percent wool coarse-micron solid fabric, by quarters, January-March 1999 toJanuary-March 2001 . . . . . . . . . . . . . . . . . . . . . . . . . . . . . . . . . . . . . . . . . . . . . . . . . . 4-5

vi
Table of Contents–Continued
Page
Tables
1-1. TRQ in-quota, over-quota (NTR), and NAFTA rates of duty on worsted wool fabrics andNTR and NAFTA rates of duty on men’s and boys’ worsted wool sport coats, 2001 . . . . . . 1-2
2-1. Men’s and boys’ wool suits, sport coats, and trousers: U.S. production, imports forconsumption, exports of domestic merchandise, and apparent consumption, 1996-2000 . . . . . . . . . . . . . . . . . . . . . . . . . . . . . . . . . . . . . . . . . . . . . . . . . . . . . . . . . . 2-2
2-2. Men’s and boys’ worsted wool suits, sport coats, and trousers: U.S. manufacturers’production, by micron counts, 1999-2000, January-March 2000, and January-March 2001 . . . . . . . . . . . . . . . . . . . . . . . . . . . . . . . . . . . . . . . . . . . . . . . . . . . . . . . . . 2-6
2-3. Men’s and boys’ wool suits, sport coats, and trousers: U.S. imports for consumption,by principal sources, 1996-2000, January-May 2000, and January-May 2001 . . . . . . . . 2-10
3-1. Worsted wool fabrics: U.S. production, imports for consumption, exports of domesticmerchandise, and apparent consumption, 1996-2000 . . . . . . . . . . . . . . . . . . . . . . . . . . . 3-2
3-2. Worsted wool fabrics for use in men’s and boys’ tailored clothing: U.S. production,imports for consumption, exports of domestic merchandise, and apparentconsumption, 1999-2000, January-March 2000, and January-March 2001 . . . . . . . . . . 3-3
3-3. Worsted wool fabrics: U.S. imports for consumption, by principal sources, 1996-2000,January-May 2000, and January-May 2001 . . . . . . . . . . . . . . . . . . . . . . . . . . . . . . . . . 3-7
3-4. Worsted wool fabrics: U.S. capacity and production, by company, 1999-2000,January-March 2000, and January-March 2001 . . . . . . . . . . . . . . . . . . . . . . . . . . . . . . 3-9
3-5. Worsted wool fabrics for men’s and boys’ tailored clothing: U.S. production, bycompany, 1999-2000, January-March 2000, and January-March 2001 . . . . . . . . . . . . . 3-10
4-1. Worsted wool fabrics: Sales and purchases of domestic and imported fabrics, 2000 . . . . . . 4-24-2. Worsted wool fabrics: Weighted-average selling and purchase prices for domestic
and imported fabrics (100-percent wool), January-March 2001 . . . . . . . . . . . . . . . . . . . 4-44-3. Overall appreciation or depreciation amounts for currencies of selected countries
relative to the U.S. dollar . . . . . . . . . . . . . . . . . . . . . . . . . . . . . . . . . . . . . . . . . . . . . . . 4-75-1. Worsted wool fabrics for use in men’s and boys’ tailored clothing: Estimated size of U.S.
market, production minus exports, and imports for consumption for 2000, and TRQlimits for 2001 . . . . . . . . . . . . . . . . . . . . . . . . . . . . . . . . . . . . . . . . . . . . . . . . . . . . . . . 5-2
5-2. Number of firms reporting ranking of factors used by men’s tailored clothingmanufacturers in making purchasing decisions on worsted wool fabrics . . . . . . . . . . . . . 5-4
5-3. Number of firms rating U.S. versus imported fabrics from selected sources for productquality and product consistency . . . . . . . . . . . . . . . . . . . . . . . . . . . . . . . . . . . . . . . . . . 5-6
5-4. Number of firms rating U.S. versus imported fabrics from selected sources foravailability of fabrics and reliability of supply . . . . . . . . . . . . . . . . . . . . . . . . . . . . . . . 5-8
5-5. Number of firms rating U.S. versus imported fabrics from selected sources for delivery time and flexible lead time . . . . . . . . . . . . . . . . . . . . . . . . . . . . . . . . . . . . . . . . 5-9
5-6. Number of firms rating U.S. versus imported fabrics from selected sources for stylesavailable, custom options, and product range . . . . . . . . . . . . . . . . . . . . . . . . . . . . . . . . 5-12
5-7. Number of firms rating U.S. versus imported fabrics from selected sources forflexibility in lot size and minimum quantity . . . . . . . . . . . . . . . . . . . . . . . . . . . . . . . . . . 5-13

vii
Table of Contents–Continued
Page
Tables–Continued
5-8. Number of firms rating U.S. versus imported fabrics from selected sources forlowest price and discounts . . . . . . . . . . . . . . . . . . . . . . . . . . . . . . . . . . . . . . . . . . . . . . 5-15
6-1. Lost sales and revenues allegations of tailored clothing manufacturers . . . . . . . . . . . . . . . . . 6-37-1. Wool: U.S. production, imports, and mill consumption by end uses, 1999-2000,
January-May 2000, and January-May 2001 . . . . . . . . . . . . . . . . . . . . . . . . . . . . . . . . . 7-27-2. Wool fiber: Domestic and imported purchases, by fiber diameter, 1999-2000,
January-March 2000, and January-March 2001 . . . . . . . . . . . . . . . . . . . . . . . . . . . . . . 7-37-3. Worsted wool yarns: U.S. production, imports for consumption, exports of domestic
merchandise, and apparent consumption, 1996-2000, January-May 2000, and January-May 2001 . . . . . . . . . . . . . . . . . . . . . . . . . . . . . . . . . . . . . . . . . . . . . . . . . . . . 7-4


1 In general, under a TRQ, the United States applies a lower tariff rate to imports of an article up to aparticular amount, known as the in-quota quantity, and another higher rate to imports in excess of the givenamount. Title V of the Act established two TRQs for worsted wool fabrics, which went into effect for 3 yearsbeginning on January 1, 2001. For 2001, the first TRQ permits 2.5 million square meters of “coarse-micron”fabrics to enter at 18.8 percent ad valorem and the other TRQ permits 1.5 million square meters of “fine-micron” fabrics to enter at 6 percent ad valorem. Imports in excess of these TRQ quantities are subject to thenormal-trade-relations duty rate of 28.3 percent ad valorem.
ix
EXECUTIVE SUMMARYFollowing receipt of a request from the United States Trade Representative (USTR) on
January 22, 2001, the U.S. International Trade Commission (Commission) instituted investigation No.332-427, U.S. Market Conditions for Certain Wool Articles, under section 332(g) of the Tariff Act of1930 (19 U.S.C. 1332(g)) on February 12, 2001. As requested by the USTR, the Commission isproviding information on U.S. market conditions for men’s (and boys’) worsted wool tailored clothing,worsted wool fabrics and yarn used in such clothing, and wool fibers used in such fabrics and yarn. Title V of the Trade and Development Act of 2000 (the Act) temporarily reduced tariffs andestablished tariff-rate quotas (TRQs) on U.S. imports of worsted wool fabrics for use in themanufacture of men’s tailored clothing.1
Principal Findings
U.S. Market Conditions for Men’s Tailored Clothing
• U.S. consumption of men’s wool tailored clothing grew in unit volume during 1996-2000, asdemand for sport coats and trousers generally rose, while demand for suits fell in 1999 and 2000. Imports accounted for nearly all of the growth in consumption of men’s wool tailored clothingduring 1996-2000, rising almost without interruption to supply most of the U.S. market. In 2000,the import shares were estimated at 78 percent for suits, 83 percent for sport coats, and 71percent for trousers. U.S. tailored clothing production fell during 1996-2000.
• According to industry sources, the U.S. market for men’s worsted wool tailored clothing during1996-2000 experienced growing demand for goods made from “fine-micron” fabrics having anaverage fiber diameter of 18.5 microns or less (the lower the number, the finer the fiber; thesefabrics often are marketed under such terms as Super 100s and Super 120s). Industry sourcesstated the decline in U.S. consumption of wool suits in 1999 and 2000 was concentrated in thoseselling for less than $500 each at retail, which tend to be made from “coarse-micron” fabricshaving an average fiber diameter greater than 18.5 microns.
• Based on questionnaire data from U.S. tailored clothing manufacturers, U.S. production of men’sworsted wool suits in 2000 fell 9 percent from 1999, and is down 23 percent in January-March2001 from the year-ago level (see table below). The decline in production of wool suits made ofcoarse-micron fabrics offset the gain in output of suits made of fine-micron fabrics in 2000. Inthe 2001 period, a decline occurred in production of suits made of both fabric types.

x
Men’s and boys’ worsted wool suits, sport coats, and trousers: U.S. manufacturers’production, by micron counts, 1999-2000, January-March 2000, and January-March 2001
(1,000 units)
Item 1999 2000
January-March--
2000 2001
Suits . . . . . . . . . . . . . . . . . . . . . . . . . . . . . . . . . . . . . . . . . . . . . 1,500 1,359 354 271
18.5 microns or less . . . . . . . . . . . . . . . . . . . . . . . . . . . . . . *** *** *** ***
Greater than 18.5 microns . . . . . . . . . . . . . . . . . . . . . . . . . *** *** *** ***
Sport coats . . . . . . . . . . . . . . . . . . . . . . . . . . . . . . . . . . . . . . . . 943 1,124 224 229
18.5 microns or less . . . . . . . . . . . . . . . . . . . . . . . . . . . . . . *** *** *** ***
Greater than 18.5 microns . . . . . . . . . . . . . . . . . . . . . . . . . *** *** *** ***
Trousers . . . . . . . . . . . . . . . . . . . . . . . . . . . . . . . . . . . . . . . . . . 1,169 1,174 203 214
18.5 microns or less . . . . . . . . . . . . . . . . . . . . . . . . . . . . . . *** *** *** ***
Greater than 18.5 microns . . . . . . . . . . . . . . . . . . . . . . . . . *** *** *** ***
Note.–Data at the micron-count level were partly estimated by the Commission for purposes of this table,because certain questionnaire responses were incomplete.
Source: Compiled from data submitted by U.S. tailored clothing manufacturers in response to Commissionquestionnaires, except as noted.
• Production of men’s worsted wool sport coats and trousers both rose in 2000 and in January-March 2001. Production of sport coats made of fine-micron fabrics grew in both periods, whileoutput of sport coats made of coarse-micron fabrics increased in 2000 but decreased in the 2001period. Production of trousers made of fine-micron fabrics fell in both 2000 and the 2001 period,while output of trousers made of coarse-micron fabrics rose in both periods.
• A number of clothing manufacturers reported they are experiencing financial difficulty, mainlybecause of declining sales, pressure from retailers to reduce prices, and intense competition. Themanufacturers said the overall production decline in tailored clothing largely reflected insufficientquantities and varieties of cost-competitive fabrics available in the United States relative to Canadaand Mexico, major foreign suppliers of tailored clothing benefiting from preferential market accessunder the North American Free Trade Agreement (NAFTA). The manufacturers also stated thathigh U.S. tariffs on imports of worsted wool fabrics have put them at a disadvantage vis-a-vis theircompetitors in Canada and Mexico. As such, many U.S. clothing manufacturers now contract outsewing operations offshore, as well as source finished garments globally. The worsted wooltailored clothing made domestically tends to compete in the smaller but higher priced segments ofthe domestic market.
U.S. Worsted Wool Fabric Industry
• Official statistics show that apparent U.S. consumption of all worsted wool fabrics declined42 percent during 1996-2000. The decline was accounted for entirely by the U.S. fabric industry,whose output fell 51 percent in the period. Imports of such fabrics rose 24 percent during 1996-2000. As a result, the import share of U.S. consumption of worsted wool fabrics rose from

xi
19 percent in 1996 to 40 percent in 2000. The leading foreign suppliers of the fabrics by quantityin 2000 were Mexico, Italy, and Canada. Approximately 38 percent of U.S. imports of worstedwool fabrics by quantity that year entered free of duty under NAFTA and the U.S.-Israel FreeTrade Agreement, or 15 percent of U.S. consumption of all worsted wool fabrics.
• U.S. demand for worsted wool fabrics has decreased significantly in recent years because ofreduced domestic production of men’s tailored clothing, the major market for U.S. producers ofsuch fabrics. The decline in fabric demand has been concentrated in coarse-micron fabrics, thelarger of the two markets. In contrast, there has been little reduction in demand for fine-micronfabrics, because of consumer preference for clothing made of fine wool fabrics. U.S. fabricproducers have substantial excess production capacity. Based on questionnaire data from fabricproducers, capacity utilization is estimated at *** percent for U.S. mills producing worsted woolfabrics for men’s tailored clothing.
• The Commission estimates that the size of the domestic market for worsted wool fabrics used in themanufacture of men’s tailored clothing totaled about 19 million square meters in 2000 (see tablebelow). Based on questionnaire data, coarse-micron fabrics account for the majority of the market,while fine-micron fabrics account for a comparatively small but growing market share. TheCommission believes that a significant portion of domestic and imported fabrics, particularlycoarse-micron fabrics, are used in offshore assembly operations and, therefore, are not eligible forthe TRQs.
Worsted wool fabrics for use in men’s and boys’ tailored clothing: Estimated size of U.S.market, production minus exports, and imports for consumption for 2000, and TRQ limits for 2001
(Million square meters)
ItemFine-micron
fabricCoarse-
micron fabric Total
Size of--
Market . . . . . . . . . . . . . . . . . . . . . . . . . . . . . . . . . . . . . . . . . *** *** 19.0
Production minus exports . . . . . . . . . . . . . . . . . . . . . . . . . . . *** *** ***
Imports . . . . . . . . . . . . . . . . . . . . . . . . . . . . . . . . . . . . . . . . *** *** ***
TRQ limits . . . . . . . . . . . . . . . . . . . . . . . . . . . . . . . . . . . . . . 1.5 2.5 (1)
1 Not applicable.
Note.--It is believed that a portion of the domestic and imported fabrics are cut into garment parts in theUnited States, sent offshore for assembly, and re-imported under the production-sharing provisions of HTSChapter 98. Imported fabrics used in production-sharing arrangements are not eligible for the temporaryduty reductions under the TRQs and, therefore, are not included in the total size of the market (theestimated 19.0 million square meter figure). Therefore, U.S. production minus exports, plus U.S. imports, isgreater than the total size of the U.S. market.
Source: Estimated by the Commission based on questionnaire data, telephone interviews of industryrepresentatives, and U.S. Customs data.

xii
Fabric Prices
• Based on questionnaire data from U.S. tailored clothing manufacturers regarding their purchases ofworsted wool fabrics and U.S. mills and wholesaler-importers regarding their sales of such fabrics,the average purchase price and average selling price for fine-micron domestic fabrics were *** thanthose for similar imported fabrics. For coarse-micron fancy fabrics (containing two or morecolors), the average purchase and selling prices were *** for domestic fabrics than for similarimported fabrics. For coarse-micron solid-color fabrics, data from the clothing manufacturersshow that the average purchase price was *** for domestic fabrics than for similar importedfabrics, while data from the U.S. fabric mills and wholesaler-importers show that the averageselling price of domestic fabrics was ***. The average quarterly purchase prices reported by theclothing manufacturers tended to be higher than the average quarterly selling prices reported by thefabric mills and wholesaler-importers, whether for a given domestic or imported fabric or for aspecific fine-micron or coarse-micron fabric, primarily because most of the purchase price datareceived by the Commission came from manufacturers of medium- to high-end clothing thattypically use relatively high-cost fabrics.
• Data from U.S. tailored clothing manufacturers and fabric wholesaler-importers show that theaverage prices of imported fine-micron fabrics generally *** on a quarterly basis from January-March 1999 to January-March 2001. For domestic fine-micron fabrics, data from the clothingmanufacturers show that the average purchase price *** during the period, ***. For coarse-micronfabrics, quarterly changes in average selling and purchase prices were mixed for 1999 and 2000.
Ability of U.S. Fabric Producers to Meet Needs ofU.S. Tailored Clothing Manufacturers
• U.S. tailored clothing manufacturers state that fabric quality and consistency, the number andvariety of fabric styles, reliability and flexibility of supply, and minimum order requirements are allimportant factors affecting their sourcing decisions and ability to compete in the domestic market. Based on information from the clothing manufacturers, they appear to favor fabric mills in Italyand the United Kingdom over those in the United States and other countries in terms of thesefactors.
• The U.S. fabric industry has sufficient capacity to produce the quantity of worsted wool fabricsrequired by the U.S. tailored clothing industry, whether for fine-micron or coarse-micron fabrics. However, several non-capacity factors, including number and variety of fabric styles, fabric qualityand consistency, minimum order sizes, and diversification of supplier sourcing, suggest significantincreased utilization of U.S. capacity is unlikely by tailored clothing manufacturers.
• Although the U.S. fabric industry appears to have sufficient capacity to produce the quantity offine-micron fabrics required by the U.S. tailored clothing industry, ***. U.S. clothingmanufacturers claim that they need to purchase fabrics from many mills worldwide to obtain fabricdiversity that will enable them to differentiate their clothing in the domestic market and to diversifyfinancial risk by minimizing their reliance on any one supplier. U.S. fabric producers claim that

2 The temporary duty reductions are retroactive–that is, they apply to imports of worsted wool fabricsentered, or withdrawn from warehouse for consumption, on or after January 1, 2001. On July 10, 2001, theU.S. Department of Commerce issued its “Notice of Allocation of Tariff Rate Quotas on the Import of CertainWorsted Wool Fabrics for Calendar Year 2001,” published in the Federal Register of July 31, 2001 (66 F.R.39490). As required by Title V of the Trade and Development Act of 2000, the TRQs were allocated to firmswhich cut and sew men’s worsted wool tailored clothing in the United States and which apply for an allocationbased on the amount of such suits cut and sewn during the prior calendar year.
xiii
they have the capability to make a significant share of what the market demands and that they willcustomize fabrics according to customer specifications.
• Although historically U.S. tailored clothing manufacturers have focused their concerns on fine-micron fabric producers, U.S. mills producing coarse-micron fabrics are reported to have difficultyproviding the number and variety of fabric styles, fabric quality and consistency, and minimumorder sizes required by the tailored clothing manufacturers.
• U.S. tailored clothing manufacturers also prefer to purchase fabrics from foreign mills in order toobtain a measure of exclusivity in the U.S. market (but not necessarily the world market) withouthaving to buy the larger minimum lot sizes generally required by U.S. and foreign producers for anexclusive order. Many foreign mills produce a standard quantity of these “exclusive” fabrics andsell them in smaller quantities to customers in different countries and markets, thereby minimizingthe possibility that the fabrics will be sold to clothing manufacturers competing in similar markets.
Lost Sales and Revenues
• The Commission questionnaire for U.S. producers of worsted wool fabrics requested that theyprovide information on any lost sales and revenues resulting from the temporary duty reductionsunder the TRQs for worsted wool fabrics, which went into effect for 3 years beginning on January1, 2001. The TRQ in-quota quantities for calendar year 2001 were allocated among U.S. tailoredclothing manufacturers in July 2001,2 allowing each such manufacturer to import that share of thetotal TRQ quantity at reduced rates of duty while paying normal-trade-relations rates of duty onother imports. Because this action was taken at mid-year, *** of the four U.S. fabric producersresponding to the questionnaire stated it was too early to determine if they had lost sales due to thetemporary duty reductions, but that ***. ***.
• The Commission questionnaire for U.S. tailored clothing manufacturers requested that they provideinformation on any lost sales and revenues resulting from the inability to purchase adequatesupplies of the worsted wool fabrics on a cost-competitive basis. Of the 18 clothing manufacturersproviding such information, 12 reported they had lost sales or revenues because of their inability topurchase adequate supplies of worsted wool fabrics on a cost-competitive basis.

xiv
Wool Fibers and Yarns
• Apparent U.S. consumption of worsted wool yarns fell 39 percent during 1996-2000 to15.8 million kilograms (kg), as domestic output fell 54 percent to 10.7 million kg and imports rose88 percent to 5.6 million kg. The declines in U.S. consumption and output largely reflected weakdemand resulting from a decrease in U.S. output of apparel fabrics and an increase in U.S. importsof articles containing worsted wool yarns (e.g., apparel). U.S. worsted wool yarn producers,whose output consists mainly of coarse-micron yarns, have closed plants, consolidated operations,and cut output in recent years.
• U.S. mill consumption of raw wool fell 47 percent during 1996-2000 to 34 million kg. U.S. woolproduction fell for the 11th consecutive year in 2000, to 11 million kg, down 18 percent from1996. U.S. raw wool imports fell 40 percent to 20 million kg. The decline in mill consumptionreflected substantially reduced wool usage by domestic mills making inputs for apparel. Raw woolfor apparel applications accounted for 87 percent of total mill consumption of raw wool during1996-2000.

1 A copy of the USTR request letter is in appendix A of this report, and a copy of the Commission’s noticeof institution, which was published in the Federal Register (66 F.R. 11315) on February 23, 2001, is inappendix B. 2 U.S. International Trade Commission (USITC), Certain Wool Articles: Interim Report on U.S. MarketConditions (investigation No. 332-427), USITC publication 3422, May 2001.
1-1
CHAPTER 1INTRODUCTION
Purpose and Scope
Following receipt of a request from the United States Trade Representative (USTR) onJanuary 22, 2001, the U.S. International Trade Commission (Commission) instituted investigationNo. 332-427, U.S. Market Conditions for Certain Wool Articles, under section 332(g) of the TariffAct of 1930 (19 U.S.C. 1332(g)) on February 12, 2001.1 As requested by the USTR, the Commissionis providing information on U.S. market conditions, including domestic demand, supply, andproduction for men’s (and boys’) worsted wool suits, suit-type jackets, and trousers; worsted woolfabrics and yarn used in the manufacture of such clothing; and wool fibers used in the manufacture ofsuch fabrics and yarn. Also as requested by the USTR, the Commission is providing, to the extentpossible, data on:
(1) increases or decreases in sales and production of the subject domestically-produced worstedwool fabrics;
(2) increases or decreases in domestic production and consumption of the subject apparel items;(3) the ability of domestic producers of the subject worsted wool fabrics to meet the needs of
domestic manufacturers of the subject apparel items in terms of quantity and ability to meetmarket demands for the apparel items;
(4) sales of the subject worsted wool fabrics lost by domestic manufacturers to imports benefitingfrom the temporary duty reductions on certain worsted wool fabrics under the tariff-ratequotas (TRQs) described in headings 9902.51.11 and 9902.51.12 of the Harmonized TariffSchedule of the United States (HTS);
(5) loss of sales by domestic manufacturers of the subject apparel items related to the inability topurchase adequate supplies of the subject worsted wool fabrics on a cost-competitive basis;and
(6) the price per square meter of imported and domestically produced worsted wool fabrics.
The USTR requested that the Commission submit an interim report and two annual reportsunder this investigation. The Commission submitted the interim report to the USTR in May 2001.2 The report under consideration here is the first annual report, which provides the requested data for1999, 2000, and year-to-date 2000-01. The USTR requested the first annual report by September 17,2001. The second annual report, providing data for 2001 and year-to-date 2001-02, was requested bySeptember 16, 2002.

3 At the time of enactment of Title V, the fabrics were classified for tariff purposes under HTS subheadings5112.11.20 (of a weight not exceeding 200 grams per square meter) and 5112.19.90 (other). To implementprovisions of Title V, subheading 5112.11.20 was replaced by subheadings 5112.11.30 (fabrics of wool yarnswith an average fiber diameter of 18.5 microns or less) and 5112.11.60 (other); subheading 5112.19.90 wasreplaced by subheadings 5112.19.60 and 5112.19.95 providing for identical breakouts. See PresidentialProclamation 7383, published in the Federal Register on December 6, 2000 (65 F.R. 76551). 4 The rate will be subject to the same staged duty reductions as those agreed to by the United States in theUruguay Round of multilateral trade negotiations for men’s wool sport coats (HTS subheading 6203.31.00). The 18.8 percent ad valorem rate in 2001 will be reduced to 18.4 percent in 2002 and 18 percent in 2003 (thelast year of the temporary duty reductions for the fabrics). 5 The President is authorized to reduce the 6 percent ad valorem duty rate, as necessary, to equalize therate with that of Canada.
1-2
Legislative Background
Title V of the Trade and Development Act of 2000 temporarily reduced tariffs on imports ofworsted wool fabrics containing 85 percent or more by weight of wool and certified by the importer assuitable for use in men’s suits, suit-type jackets (sport coats), and trousers.3 (See box 1-1 for adiscussion of the legislation.) Title V created two TRQs for the purpose of granting the dutyreductions on the subject fabrics for 3 years beginning on January 1, 2001. HTS heading 9902.51.11permits 2.5 million square meter equivalents (SMEs) of worsted wool fabrics having an average fiberdiameter greater than 18.5 microns (coarse-micron fabrics) to enter each year at the same duty rate asthat for men’s wool sport coats.4 HTS heading 9902.51.12 permits 1.5 million SMEs of worsted woolfabrics having an average fiber diameter of 18.5 microns or less (fine-micron fabrics) to enter eachyear at 6 percent ad valorem, the same as Canada’s rate on the finer worsted wool fabrics.5 Imports inexcess of the TRQ in-quota quantities will be subject to the normal trade relations (NTR) duty rates(table 1-1).
Table 1-1TRQ in-quota, over-quota (NTR), and NAFTA rates of duty on worsted wool fabrics and NTR andNAFTA rates of duty on men’s and boys’ worsted wool sport coats, 2001
ItemIn-quota
ad valorem rateNTR
ad valorem rate NAFTA
rate
Worsted wool fabrics having an average fiber diameter–
18.5 microns or less . . . . . . . . . . . . . . . . . . . . . . . . 6% 28.3% Free
Greater than 18.5 microns . . . . . . . . . . . . . . . . . . . . . . 118.8% 28.3% Free
Men’s and boys’ worsted wool sport coats . . . . . . . . . . (2) 18.8% Free for Canada4.4% for Mexico
1 The 18.8 percent ad valorem duty rate on coarse-micron fabrics corresponds to the tariff level for men’s andboys’ worsted wool sport coats, thereby temporarily removing a tariff inversion in which the duty has been higher onthe fabric than on garments made from such fabric.
2 Not applicable.

1-3
Box 1-1 Title V of the Trade and Development Act of 2000
Title V of the Trade and Development Act of 2000, enacted on May 18, 2000, and implemented by PresidentialProclamation 7383 of December 1, 2000, provided tariff relief to U.S. manufacturers of specific wool articles. Itreduced tariffs on worsted wool fabrics used by U.S. manufacturers of men’s tailored clothing and suspended tariffson fine-micron wool yarns, fibers, and tops used by U.S. producers of worsted wool fabrics and yarns for 3 yearsbeginning on January 1, 2001. It authorized a partial refund of duties paid by U.S. firms in each of calendar years2000-02, limited to an amount not to exceed one-third of duties actually paid on the inputs imported in calendar year1999. Title V also created a fund for research and market development for U.S. wool growers to assist indisseminating information that would help the industry improve fiber quality and production methods.
Title V established tariff-rate quotas (TRQs) to implement the duty reductions on worsted wool fabrics used in themanufacture of men’s tailored clothing. In general, under a TRQ, the United States applies a lower tariff rate toimports of an article up to a particular amount, known as the in-quota quantity, and another higher rate to anyimports in excess of the given amount. For the wool fabric TRQs, the President has the authority to reduce theapplicable tariffs in order to take into account any staged reductions in the U.S. tariff rate on the wool sport coatsand the Canadian tariff rate on the fine-micron worsted wool fabric that serve as benchmark rates.
The President also has the authority to grant additional tariff relief on the fabric in response to requests from U.S.manufacturers of men’s worsted wool tailored clothing. Title V authorizes the President to modify the TRQ in-quotaquantities, subject to a review of U.S. market conditions, but by not more than 1.0 million SMEs in any of the 3 years.Title V also requires the President to monitor U.S. market conditions, including domestic demand, supply, andproduction for the men’s worsted wool tailored clothing; worsted wool fabrics and yarn used in the manufacture ofsuch clothing; and wool fibers used in the manufacture of such fabrics and yarn. In Proclamation 7383, thePresident delegated the authority to modify the TRQ in-quota quantities to the Secretary of Commerce, anddelegated to the USTR the authority to monitor these market conditions.
According to the Conference Report, the duty reductions on the wool fabrics are intended to address a “tariffinversion,” where imports of the fabrics have been subject to higher duty rates than imports of apparel made fromsuch fabrics (see table 1-1 for the duty rates). By applying a higher tariff to the input, the tariff schedule providesan incentive for importing the more labor-intensive and higher value-added finished apparel. The impact of the tariffinversion has been compounded by the reduction of tariffs on men’s tailored clothing under the North American FreeTrade Agreement (NAFTA), so that U.S. clothing manufacturers face an even greater competitive disadvantagerelative to tailored clothing from Canada and Mexico.
U.S. clothing manufacturers already had faced a competitive disadvantage relative to their counterparts in Canada,where the tariff on imports of fine-micron worsted wool fabrics is about 6 percent ad valorem. Most wool suitsimported from Canada are made from foreign fabrics, but the suits still qualify for NAFTA preferences under a limitedexception set aside for wool apparel. Although NAFTA effectively applies a “yarn-forward” standard, whereby anapparel article must be cut and sewn in a NAFTA country and the fabric and yarn must be made in a NAFTA country,NAFTA established tariff preference levels (TPLs) that permit specified amounts of wool apparel from Canada toenter the United States free of duty even though the garments do not meet the NAFTA rules of origin (e.g., the suitsare made of European fabric). NAFTA contains a similar TPL for wool apparel from Mexico.
Source: U.S. House of Representatives, Conference Report: Trade and Development Act of 2000 (H.R. 434),106th Cong., 2d sess., Report 106-606, May 4, 2001, pp. 125-127.

6 A list of individuals who appeared at the hearing is in appendix C. The views of interested parties aresummarized in chapter 8 of this report. 7 The Commission compiled a list of possible U.S. producers of the subject fabrics based on informationfrom the Northern Textile Association and the American Textile Manufacturers Institute. 8 The firm stated it produces ***. 9 The Commission compiled a list of possible purchasers of the subject fabrics based on information fromthe Tailored Clothing Association, American Apparel and Footwear Association, U.S. fabric producers, andU.S. Customs import records. 10 ***
1-4
Questionnaires and Other Information Sources
This report draws on market and industry information received by the Commission from manydifferent sources. The Commission obtained information at a hearing on May 31, 2001, and in writtenstatements from representatives of U.S. producers of worsted wool fabrics and men’s tailored clothing.6 Commission staff conducted in-person and telephone interviews with representatives of U.S. producersand importers of worsted wool fabrics and yarns, and U.S. manufacturers and retailers of men’stailored clothing. The staff also conducted interviews and plant visits in Virginia, Connecticut, andNew York to obtain first-hand information about the industries and markets under consideration. Staffalso reviewed the available literature on the issues under consideration.
Because there are no published data available on U.S. markets for the subject wool articles bymicron count, the Commission used four types of questionnaires to obtain such data, as follows: (1) aproducer’s questionnaire, sent to U.S. producers of the subject fabrics; (2) a purchaser’s questionnaire,sent to firms that purchase the fabrics, mainly U.S. manufacturers of men’s tailored clothing; (3) animporter’s questionnaire, sent to firms that import and sell the fabrics; and (4) a yarn questionnaire,sent to U.S. producers and purchasers of worsted wool yarns.
The producer questionnaire was sent to 12 firms that reportedly have produced, or had thecapability to produce, the subject fabrics since January 1, 1999.7 Five of the firms stated they producethe fabrics and seven stated they did not make them during the period. Four of the five firms producingthe fabrics provided information in response to the Commission questionnaire; the fifth firm, in atelephone interview by Commission staff, provided data on its production and production capacity.8 The Commission believes that the information received in response to the producer questionnaire and infollow-up interviews represents most, if not all, domestic production of the subject fabrics.
The purchaser questionnaire was sent to 31 firms that reportedly purchased the subject fabrics,of which 25 were clothing manufacturers and 6 were retailers that reportedly “outsourced” productionof men’s tailored clothing.9 Two of the clothing manufacturers receiving the questionnaire, HartmarxCorp. and Individualized Apparel Group (The Tom James Co.), had their respective subsidiariescomplete the questionnaire for their own individual operations rather than provide a corporate-wideresponse. Some subsidiaries of the two firms also received the questionnaire directly from theCommission. ***10 Of the clothing manufacturers that did not respond to the questionnaire, one firmwas interviewed by Commission staff to obtain data on its tailored clothing production and purchasesof the subject fabrics, another firm went out of business, and the other five are believed to accountindividually for a very small portion of U.S. tailored clothing production based on discussions with the

11 The Commission compiled a list of possible importers of the subject fabrics based on information fromU.S. clothing manufacturers and U.S. Customs import records.
1-5
firms themselves and other industry sources. Of the six retailers, four stated they do not purchase thesubject fabrics directly, although three of them indicated that they do influence the fabric purchases interms of such factors as fabric styles. The Commission did not receive a questionnaire response fromthe other two retailers, although one of them in a telephone interview provided Commission staff withan estimate of its purchases of the subject fabrics. The Commission accounted for productionoutsourced by retailers by asking the clothing manufacturers in the questionnaire to report separatelytheir contract production of clothing made from fabrics owned by others. Based on Commission staffinterviews with clothing manufacturers and retailers, it is believed that the direct fabric purchases ofthe retailers account for a relatively small portion of total purchases of the subject fabrics.
The importer’s questionnaire was sent to 17 firms that were believed to import the subjectfabrics, including import agents and U.S. fabric producers that import the fabrics from their foreignfacilities.11 The Commission received responses from 10 of the 17 firms; one non-respondent was asubsidiary of a clothing manufacturer that had responded to the purchaser questionnaire. Responseswere not received from three firms believed to represent a large share of the clothing manufacturers’purchases of imported fabrics. For this reason, the Commission did not rely solely on responses to theimporter’s questionnaire for data on sales of imported fabrics, but also relied on data submitted byclothing manufacturers in response to the Commission’s purchaser questionnaire and on U.S. Customsdata.
The yarn questionnaire was sent to 16 firms believed to be either producing wool tops or yarns,or purchasing worsted wool yarns suitable for use in the subject fabrics. Questionnaire responses werereceived from 13 firms, 5 of which produce worsted wool tops or yarns for use in the fabrics.
Product Coverage and Organization of Report
For purposes of this report, “men’s” tailored clothing also includes such clothing for boys(consistent with the HTS), and “sport coats” refer to suit-type jackets (the term used in the legislation). The term “fine-micron fabrics” refers to worsted wool fabrics having an average fiber diameter of 18.5microns or less (the lower the number, the finer the fiber). The term “coarse-micron fabrics” refers toworsted wool fabrics having an average fiber diameter greater than 18.5 microns. The term “fancyfabrics” refers to fabrics containing two or more colors.
Chapters 2 through 7 of this report provide the information requested, to the extent possible, onU.S. market conditions for men’s worsted wool tailored clothing (chapter 2) and for worsted woolfabrics (chapter 3); on prices of domestic and imported worsted wool fabrics (chapter 4); on the abilityof domestic fabric producers to meet the needs of domestic clothing producers (chapter 5); on lost salesand revenues (chapter 6); and on U.S. market conditions for certain wool yarns and fibers (chapter 7). Chapter 8 provides a summary of the views of interested parties as presented in written statements tothe Commission and in the public hearing held before the Commission.


1 This chapter draws on information received by the Commission at the hearing, in response to itsquestionnaires, in written statements, and from in-person and telephone interviews by Commission staff withofficials of Hickey-Freeman Co.; Martin Greenfield Clothiers, Ltd.; Saint Laurie Ltd.; Hartz & Co.; HartSchaffner & Marx; American Fashion Inc.; Nordstrom Inc.; and Jos. A. Bank Clothiers Inc., Mar.-July 2001. 2 Official statistics of the U.S. Department of Commerce, which were used to develop the data on apparentU.S. consumption (production plus imports minus exports), overstate the total size of the domestic market formen’s worsted wool tailored clothing, in terms of the market conditions being monitored under Title V of theTrade and Development Act of 2000. First, production data include garment parts cut in the United States,exported for sewing, and imported as finished apparel. Second, import and export data include garments notcovered by the Act (e.g., those comprising more than 50 percent wool by weight but less than 85 percent). Finally, the data include clothing made from woolen fabric, which is not covered by the Act, along with thesubject garments of worsted wool fabric. Most wool tailored clothing is made from worsted fabric (a tightlywoven fabric with a smooth, hard surface and is made from worsted yarn containing long wool fibers that havebeen carded and combed). Significant quantities of sport coats, however, are made from woolen fabric (aloosely woven fabric with a fuzzy or napped surface and is made from fuzzy, loosely twisted yarn containingshort wool fibers that have been separated by carding).
2-1
CHAPTER 2U.S. MARKET CONDITIONS FORMEN’S AND BOYS’ WORSTEDWOOL TAILORED CLOTHING1
This chapter provides the requested information on U.S. market conditions for men’s (andboys’) worsted wool tailored clothing. The first section of this chapter discusses recent developmentsin the U.S. market for men’s tailored clothing and factors affecting demand for such goods. Thesecond section reviews recent developments in the U.S. men’s tailored clothing industry and the finalsection discusses recent trends in imports of the clothing.
Market Overview
Apparent U.S. consumption of men’s wool tailored clothing (made from both worsted andwoolen fabrics) grew in unit volume during 1996-2000, as demand for sport coats and separatetrousers generally rose while demand for suits weakened in 1999 and 2000 (table 2-1).2 Consumptionof wool trousers rose from 10.4 million units in 1996 to 11.6 million units in 1999, and then increased36 percent to 15.8 million units in 2000. Consumption of wool sport coats rebounded slightly in 2000,following small declines in the preceding 2 years. By contrast, consumption of wool suits peaked at8.4 million units in 1998, and then fell in 1999 and again in 2000, to 8.0 million units. According toindustry sources, the U.S. market for men’s wool tailored clothing during 1996-2000 experiencedgrowing demand for goods made from “fine-micron” fabrics having an average fiber diameter of 18.5microns or less (the lower the number, the finer the fiber; these fabrics often are marketed under suchterms as Super 100s and Super 120s). Industry sources stated the decline in consumption of wool

2-2
Table 2-1Men’s and boys’ wool suits, sport coats, and trousers: U.S. production, imports forconsumption, exports of domestic merchandise, and apparent consumption, 1996-2000
Item and yearU.S.
productionU.S.
imports1 U.S.
exports2
Apparent U.S.
consumption
Ratio ofimports to
consumption
-----------------------------1,000 units--------------------------- Percent
Suits:
1996 . . . . . . . . . . . . . . . . . . . . 2,609 4,628 65 7,172 65
1997 . . . . . . . . . . . . . . . . . . . . 2,474 5,119 40 7,553 68
1998 . . . . . . . . . . . . . . . . . . . . 2,320 6,127 77 8,370 73
1999 . . . . . . . . . . . . . . . . . . . . 1,928 6,185 57 8,056 77
2000 . . . . . . . . . . . . . . . . . . . . 1,792 6,221 40 7,973 78
Sport coats:
1996 . . . . . . . . . . . . . . . . . . . . 2,493 3,589 268 5,814 62
1997 . . . . . . . . . . . . . . . . . . . . 2,559 4,791 529 6,821 70
1998 . . . . . . . . . . . . . . . . . . . . 2,313 4,989 565 6,737 74
1999 . . . . . . . . . . . . . . . . . . . . 2,231 4,810 326 6,715 72
2000 . . . . . . . . . . . . . . . . . . . . 2,131 5,646 990 6,787 83
Trousers:
1996 . . . . . . . . . . . . . . . . . . . . 5,138 6,129 855 10,412 59
1997 . . . . . . . . . . . . . . . . . . . . 4,651 6,962 765 10,848 64
1998 . . . . . . . . . . . . . . . . . . . . 4,310 7,613 618 11,305 67
1999 . . . . . . . . . . . . . . . . . . . . 4,068 8,018 466 11,620 69
2000 . . . . . . . . . . . . . . . . . . . . 5,002 11,139 353 15,788 71
1 Import data are based on HTS statistical reporting numbers 6203.11.2000, 6203.11.6000, 6203.11.9000,6203.31.0010, 6203.31.5010, and 6203.31.9010 (suits); 6203.21.0015, 6203.21.3015, 6203.21.9015,6203.31.0020, 6203.31.5020, and 6203.31.9020 (sport coats); and 6203.21.0020, 6203.21.3020,6203.21.9020, 6203.41.1210, 6203.41.1220, 6203.41.1510, 6203.41.1520, 6203.41.1810, and 6203.41.1820(trousers). Imports of trousers were reduced by a quantity equal to the quantity of suit-type jackets importedunder HTS 6203.31.0010, 6203.31.5010, and 6203.31.9010 (suit-type jackets imported as parts of suits that donot meet the requirements for tariff classification as suits; for example, the outer shells of the suit-type jacketsdo not contain the required four or more panels; see note 3(a) of HTS Chapter 62 for a complete definition of“suits”).
2 Export data are based on HTS subheadings 6203.11.00 (suits), 6203.31.00 (sport coats), and 6203.41.00(trousers).
Source: Compiled from official statistics of the U.S. Department of Commerce.
suits in 1999 and 2000 was concentrated in those selling for less than $500 each at retail, which tend tobe made from “coarse-micron” fabrics having an average fiber diameter greater than 18.5 microns.
The overall growth in U.S. consumption of men’s wool tailored clothing during 1996-2000was accounted for almost entirely by imports, which rose almost without interruption and now supplymost of the market. In 2000, the import shares were 78 percent for suits, 83 percent for sport

3 See, for example, Crittenden Rawlings, President and Chief Executive Officer, Oxxford Clothes Inc.,transcript of hearing, p. 53. 4 See, for example, Andrew Kozinn, President, Saint Laurie Ltd., transcript of hearing, p. 39, and StanGellers, “Serious Business: Specialty Stores Report a Shift from Sport Coats to Dressier Suits for theWorkplace,” DNR (Daily News Record), July 16, 2001, p. 38. 5 U.S. military uniforms are not included in this analysis. The “Berry Amendment,” enacted as Title IX ofPublic Law 102-396, as amended, requires U.S. military procurement of uniforms, among other goods, to bemanufactured in the United States from U.S.-produced components. 6 Information in this paragraph is from officials of Fechheimer Brothers & Co., Uniforms to You & Co.,Inc., and Brookhurst, telephone interviews by Commission staff, July 10, 2001. 7 According to one uniform producer, ***.
2-3
coats, and 71 percent for trousers. By contrast, domestic production fell during most of 1996-2000(for further information on domestic output, see the “production” section later in this chapter).
The U.S. market for men’s wool tailored clothing has been affected by a number of style trendsin the last decade, particularly a trend toward casual dress in the workplace and heightened demand forclothing made from fine-micron fabrics.3 The clothing manufacturers stated the reduced demand forwool suits and increased demand for wool sport coats and trousers in 2000 largely reflected the trendtoward business casual dress. The manufacturers noted that while consumers have shifted away fromtraditional sartorial looks, they are still buying sport coats and trousers made from fine-micron woolfabrics. Industry sources also stated that the casual wear trend is gradually subsiding in 2001 in favorof a return to classic suiting.4
U.S. clothing manufacturers stated that although consumers are buying fewer articles oftailored clothing, those who are buying such clothing are more likely to purchase high-end goods madefrom fine-micron wool fabrics. To meet growing demand for fashionable tailored clothing of fine-micron fabrics, U.S. clothing manufacturers and retailers are increasingly focusing on new fabricpatterns, colors, and weaves, as well as new fiber blends, in an effort to provide their customers with adifferent look for each new selling season (fall and spring). Some manufacturers are also making morecustom-tailored clothing for small independent tailor shops and department stores. According to theclothing manufacturers, the growing importance of product differentiation, in terms of styling andfabric selection, and the growing use of custom-tailored programs have led to even greater demand fora wider range of fine-micron wool fabrics in smaller minimum-order sizes.
The U.S. market for men’s tailored clothing of worsted wool fabrics also includes tailoredcommercial uniforms made from such fabrics.5 The domestic market for these commercial uniforms,such as those worn by airline, hotel, and public safety personnel, is believed to be supplied mostly bydomestic production.6 Some commercial uniforms are assembled in Mexico and Caribbean Basincountries under production-sharing arrangements with U.S. firms. The worsted wool fabrics used byU.S. uniform producers are ***.7

8 Although the number of establishments rose from 189 in 1998 to 194 in 1999, the increase occurred solelyin businesses consisting of less than 20 employees. Overall industry employment fell 17 percent. 9 According to U.S. fabric producers Burlington Industries and Warren Corp., major clothing-manufacturing customers that have ceased domestic operations since 1995 include ***. 10 For example, clothing manufacturer Jos. J. Pietrafesa Co., which used mostly imported fabrics to makesuits that retailed for about $700 to $800 each, declared bankruptcy and closed its manufacturing operations inJanuary 2001, due in part to clients moving operations offshore. Edward W. Clark, Jr., Executive VicePresident, the Union of Needletrades, Industrial and Textile Employees (UNITE), transcript of hearing, p. 27,and Diane Justian, President, Local 220, UNITE, transcript of hearing, p. 30.
2-4
U.S. Industry
Restructuring and Consolidation
The U.S. tailored clothing industry as a whole has declined by most measures during the past 5years. According to the U.S. Census Bureau’s County Business Patterns, the number ofestablishments in the industry fell one-third from 293 in 1996 to 194 in 1999,8 and it is likely to havefallen further since then, given recent plant closures.9 Similarly, official statistics of the U.S. Bureau ofLabor Statistics show that industry employment fell 34 percent during 1996-2000 to 21,300. Anumber of clothing manufacturers and retailers have expanded their global sourcing of finishedclothing, including their use of production-sharing arrangements in Mexico, Colombia, and CaribbeanBasin countries (see the “imports” section later in this chapter for more information on production-sharing trade). According to the clothing manufacturers, production of moderate to lower pricedtailored clothing has moved abroad to such countries as Canada, Mexico, Colombia, and CaribbeanBasin countries.10 The worsted wool tailored clothing articles being made domestically tend to competein the smaller but higher priced segments of the domestic market.
Based on questionnaire data, 5 of 20 clothing manufacturers, accounting for about 20 percentof estimated U.S. production of men’s worsted wool tailored clothing in 2000, reported financialsolvency or sales growth, while 15 (accounting for about 80 percent of estimated production) reportedthey are experiencing financial difficulty, primarily because of declining sales, pressure by retailers toreduce prices, and competition in a highly price-sensitive market. Despite decreased sales, some firmsindicated they were able to maintain positive cash flow by reducing inventories, collecting receivables,and replacing some production with contract sales. However, these firms also stated such measurescannot be sustained over the long term if sales do not increase. Ten of the responding clothingmanufacturers, accounting for over 50 percent of estimated U.S. production of men’s worsted wooltailored clothing in 2000, stated they had definitive plans or a high probability for reduction inproduction, closures of existing facilities, and/or reductions in staffing for the remainder of 2001 andfor 2002.

11 The Commission purchaser questionnaire also requested data on U.S. manufacturers’ shipments oftailored clothing. However, the shipments data from the clothing manufacturers were incomplete. Thus, theproduction and fabric purchase data were used to examine industry trends. See appendix D for questionnairedata on production, shipments, imports, exports, and inventories of men’s tailored clothing. 12 Hartmarx markets men’s tailored clothing under its own brand names (e.g., Hart Schaffner & Marx andHickey-Freeman) and licensed trademarks (e.g., Kenneth Cole). ***.
2-5
Production
Based on data submitted by 20 U.S. clothing manufacturers in response to the Commissionpurchaser questionnaire for 2000,11 the largest U.S. manufacturer of men’s tailored clothing is theHartmarx Corp., which accounted for an estimated *** percent of the total quantity of U.S. productionof wool suits, *** percent for wool sport coats, and *** percent for wool trousers.12 Hartmarx is alsothe largest purchaser of worsted wool fabrics for use in men’s tailored clothing, accounting for ***percent of total purchases of domestic and imported fabrics in 2000. *** of the fabric purchases. Because of the significance of Hartmarx in the U.S. market for men’s tailored clothing, much of theproduction and other market-related data submitted by Hartmarx and other clothing manufacturers inresponse to the Commission purchaser questionnaire are confidential.
As shown in table 2-1, the quantity of U.S. production of men’s wool suits and sport coatsdeclined almost without interruption during 1996-2000, while trouser output fell until 2000, when itrose 23 percent over the 1999 level. Industry sources stated that although clothing manufacturerscontinued to experience a decline in production of worsted wool suits so far in 2001, they were postinggains in production of sport coats and separate dress trousers made from worsted wool fabrics.
Based on questionnaire data, U.S. production of men’s worsted wool suits in 2000 declined9 percent from 1999 (table 2-2). Production of suits made from coarse-micron fabrics declined*** percent, *** offsetting the *** increase in output of suits made from fine-micron fabrics. Thedecline in wool suit production accelerated in January-March 2001, falling 23 percent from the year-earlier level. In the 2001 period, production of suits of coarse-micron fabrics declined *** percent andoutput of suits of fine-micron fabrics fell *** percent.
The questionnaire data show total production of sport coats grew 19 percent in 2000, reflectingincreases of *** percent in sport coats of fine-micron fabrics and *** percent in sport coats of coarse-micron fabrics. Production of sport coats grew slightly in January-March 2001, as the *** increase inproduction of sport coats of fine-micron fabrics *** offset the *** decline in production of sport coatsof coarse-micron fabrics. Trouser production rose slightly in 2000 and in January-March 2001. Unlike suits and sport coats, however, production of trousers of fine-micron fabrics fell whileproduction of trousers of coarse-micron fabrics rose in 2000. These trends in trouser productioncontinued in the 2001 period.

13 U.S. manufacturers stated that just as Canadian clothing firms cannot, and do not, rely on duty-freeNAFTA fabrics to compete, U.S. clothing firms need similar access to wool fabrics from non-NAFTAcountries such as Italy at competitive after-duty prices. See David A. Starr, Williams & Jensen, P.C.,Washington, DC, Counsel to the Tailored Clothing Association (TCA), written submission to theCommission, May 21, 2001, p. 20.
2-6
Table 2-2Men’s and boys’ worsted wool suits, sport coats, and trousers: U.S. manufacturers’production, by micron counts, 1999-2000, January-March 2000, and January-March 2001
(1,000 units)
Item 1999 2000
January-March--
2000 2001
Suits . . . . . . . . . . . . . . . . . . . . . . . . . . . . . . . . . . . . . . . . . . . . 1,500 1,359 354 271
18.5 microns or less . . . . . . . . . . . . . . . . . . . . . . . . . . . . . . *** *** *** ***
Greater than 18.5 microns . . . . . . . . . . . . . . . . . . . . . . . . . *** *** *** ***
Sport coats . . . . . . . . . . . . . . . . . . . . . . . . . . . . . . . . . . . . . . . 943 1,124 224 229
18.5 microns or less . . . . . . . . . . . . . . . . . . . . . . . . . . . . . . *** *** *** ***
Greater than 18.5 microns . . . . . . . . . . . . . . . . . . . . . . . . . *** *** *** ***
Trousers . . . . . . . . . . . . . . . . . . . . . . . . . . . . . . . . . . . . . . . . . 1,169 1,174 203 214
18.5 microns or less . . . . . . . . . . . . . . . . . . . . . . . . . . . . . . *** *** *** ***
Greater than 18.5 microns . . . . . . . . . . . . . . . . . . . . . . . . . *** *** *** ***
Source: Compiled from data submitted by U.S. clothing manufacturers in response to Commissionquestionnaires. Data at the micron-count level may not correspond to questionnaire data reported inappendix D because certain questionnaire data were incomplete and, therefore, were estimated for purposes ofthis table.
Based on information submitted in response to Commission questionnaires, the decline in U.S.production of tailored clothing in January-March 2001 may be attributable to a slowing U.S. economyand sluggish retail sales. The clothing manufacturers report that the share of orders increased forclothing made from fine-micron fabrics and special-order clothing but declined for less-expensive suitsmade from coarse-micron fabrics and other “stock items.”
According to the clothing manufacturers, the overall import increase and production decreaseduring 1996-2000 largely reflected insufficient quantities and varieties of cost-competitive fabricsavailable in the United States relative to Canada and Mexico. The manufacturers stated that high U.S.tariffs on imports of worsted wool fabrics have put them at a competitive disadvantage vis-a-vis theircounterparts in Canada and Mexico.13 According to the clothing manufacturers, the fabric tariffs addsignificantly to their fabric costs, which represent a major portion of their overall costs. Based on datafrom 14 clothing manufacturers, the share of total production costs accounted for by fabric costaverages 30 percent for suits, 26 percent for sport coats, and 48 percent for trousers. Themanufacturers also state that the “tariff inversion” serves as an incentive to import finished garmentsand that sales of tailored clothing are often lost to imports of comparable goods, as evidenced by risingimport penetration during 1996-2000.

14 U.S. Census Bureau, Annual Survey of Manufactures: Statistics for Industry Groups and Industries -1999 (M99(AS)-1 (RV)), May 2001, pp. 7 and 39. 15 Arthur Gundersheim, Director of International Trade, UNITE, transcript of hearing, p. 40. 16 The comparative hourly wage rates for the apparel industry are from Werner International, Inc., “HourlyLabor Cost in the Apparel Industry,” spring 1998. The data include social benefits and fringes. 17 Ibid. 18 Crittenden Rawlings, President and Chief Executive Officer, Oxxford Clothes Inc., transcript of hearing,p. 47.
2-7
Another significant cost for clothing manufacturers is labor cost, which accounted for anaverage of 22 percent of the total value of industry shipments in 1999, the latest year for which suchdata are available.14 According to several clothing manufacturers, labor costs are not a significantfactor affecting their competitiveness in the domestic market because their primary import competitionis from Canada and Western Europe.15 A comparison of labor rates show wages in the apparelindustry of Canada are comparable to those in the United States, and those for Italy are 34 percenthigher.16 Apparel wages in Mexico and Colombia, the major low-cost foreign suppliers of tailoredclothing, are 85 to 87 percent lower than those in the United States.17
Industry sources claim the decline in U.S. clothing production also reflects the growing buyingpower of large retailers, which has led to considerable downward pressure on prices and, in somecases, lost sales (see chapter 6 for further information on lost sales). For example, ***. However,based on the total quantity and value of shipments reported by U.S. clothing manufacturers for 2000,compared with 1999, the average unit values for (1) suits of coarse-micron and fine-micron fabricsrose *** percent and *** percent, respectively; (2) sport coats of coarse-micron fabrics rose ***percent and those of fine-micron fabrics fell *** percent; and (3) trousers of coarse-micron and fine-micron fabrics rose *** percent and *** percent, respectively (see appendix D, table D-2).
U.S. clothing manufacturers typically source fabrics by attending trade shows, through importagents, and through direct contact with domestic and foreign mills. A clothing manufacturer mayconduct business with as many as 150 mills worldwide to assemble a product line with enough uniquestyles and patterns to differentiate its products in the domestic market.18 Clothing manufacturers alsostress the importance of spreading financial risk by purchasing fabrics from many mills rather thanconcentrating high volumes of business on one or two (for more information on fabric sourcing, seechapter 5 of this report). Industry sources indicate that the trend toward global fabric sourcing reflectsthe need of U.S. clothing manufacturers for sufficient variety, quantity, quality, and reliability ofsupply at competitive prices. U.S. clothing manufacturers often require a large variety of fabric insmall lot sizes and the option of placing reorders on short notice. Because sport coats and certain dresstrousers tend to be regarded as fashion items subject to trend fluctuations, manufacturers often producemany small runs using a variety of fabrics. In addition, sport coats require less fabric than suits,resulting in smaller purchases of any one style of fabric. However, the increased demand for sportcoats and trousers has prompted manufacturers to buy more fabric overall as production of separatesrequires slightly more fabric than is used to cut a suit.

19 Based on data submitted by U.S. clothing manufacturers in response to Commission questionnaires, onesuit equals 5.3 SMEs, one sport coat equals 3.1 SMEs, and one pair of trousers equals 2.6 SMEs. 20 Under the production-sharing provisions of HTS Chapter 98, U.S. importers receive a partial-dutyexemption for articles assembled abroad in whole or in part of U.S. components. In general, the duty isassessed only on the value added abroad (mainly the cost of sewing the garment parts together). The fabric formaking the apparel parts can be of either U.S. or foreign origin as long as the fabric is cut to shape in theUnited States, exported ready for assembly, and not advanced in value abroad except by assembly andincidental operations. 21 The average unit values for imports of suits, sport coats, and trousers are landed duty-paid values, and arebased on official statistics of the U.S. Department of Commerce for 2000.
2-8
Imports
U.S. imports of men’s wool suits, sport coats, and trousers together totaled 79.4 million squaremeter equivalents (SMEs) in 2000, representing an increase of 27.9 million SMEs, or 54 percent, fromthe 1996 level.19 The largest category by SMEs is suits (33.0 million SMEs, or 42 percent of the 2000total), followed by trousers (29.0 million SMEs, or 36 percent), and sport coats (17.5 million SMEs, or22 percent). The largest import increase by SMEs during 1996-2000 occurred in trouser imports,which rose 13.0 million SMEs (or 82 percent); suit imports rose 8.4 million SMEs (or 34 percent) andsport coat imports rose 6.4 million SMEs (or 57 percent).
The leading foreign suppliers of men’s wool tailored clothing by SMEs are Italy, Mexico, andCanada, which together accounted for 48 percent of total imports in 2000. Imports of such clothingfrom Italy rose 44 percent during 1996-2000 to 12.9 million SMEs. Imports from Mexico rose 167percent during the period to 12.8 million SMEs, while those from Canada, the top supplier in 1996 and1997, rose 11 percent to 12.1 million SMEs. Imports of qualifying goods from Mexico and Canadabenefit from NAFTA preferences.
U.S. imports of men’s wool tailored clothing under the production-sharing provisions ofChapter 98 of the Harmonized Tariff Schedule of the United States (HTS; formerly the “807” tariffprovision) increased 54 percent during 1996-2000 to 79.4 million SMEs.20 Production-sharing tradeaccounted for 18 percent of total imports of men’s wool tailored clothing by SMEs in 2000, down froma high of 22 percent in 1997. Most imports of such clothing under the production-sharing provisionscome from Mexico, the Caribbean Basin countries, and Colombia.
On a product basis, imports of wool suits rose less than 1 percent a year in 1999 and 2000,and then fell 10 percent in January-May 2001 from the year-earlier level (table 2-3). Wool suitimports from Mexico increased 124 percent during 1996-2000 to 1.3 million suits, enabling Mexico tosurpass Canada and Italy as the top volume supplier of such imports in 2000. Imports from Italyincreased 43 percent, while those from Canada fell 17 percent. Italy was the top foreign supplier byvalue (32 percent) in 2000, reflecting a much higher average unit value21 of its wool suits ($161 persuit) relative to that of Mexico ($73). Suits of fine-micron fabrics accounted for 20 percent of woolsuit imports by quantity in January-May 2001, and they came primarily from Mexico, Canada, andItaly. Imports of men’s wool suits under the production-sharing provisions of HTS Chapter 98 rose 78percent during 1996-2000 to 708,000 suits.

22 Maria Luisa Mejia Arango, President, Everfit Indulana, Colombia, in-person interview by Commissionstaff, Washington, DC, June 15, 2001.
2-9
Imports of wool sport coats rose 57 percent between 1996 and 2000. The leading foreignsuppliers of wool sport coats by quantity in 2000 were Colombia and Canada, which accounted for acombined 26 percent of the total, followed by Italy (10 percent) and Mexico (9 percent). Imports fromMexico doubled between 1996 and 2000. Colombia’s textile and apparel industry includes a numberof worsted wool fabric producers and clothing manufacturers. For example, the Colombian firmEverfit Indulana, which is vertically integrated from raw materials to finished garments, produces***.22 The top foreign suppliers of wool sport coats by value in 2000 were Italy (22 percent) andCanada (18 percent), whose sport coats had average unit values of $142 and $84 per unit, respectively. The average unit values were much lower for sport coats from Colombia ($44) and Mexico ($54). Sport coats of fine-micron wool fabrics accounted for 27 percent of total imports of wool sport coats inJanuary-May 2001. Imports of wool sport coats under the production-sharing provisions of HTSChapter 98 rose 76 percent between 1996 and 2000 to almost 1.7 million units.
U.S. imports of men’s wool trousers rose 82 percent between 1996 and 2000, likely reflectingthe popularity of business casual dress. The leading foreign suppliers of the wool trousers by quantityin 2000 were Italy (17 percent of the total), Canada (15 percent), and Mexico (15 percent). Importsfrom Mexico rose 364 percent between 1996 and 2000 to 1.7 million units. Italy, Canada, and Mexicowere the top foreign suppliers by value in 2000, reflecting average unit values of $40, $31, and $21 perunit, respectively. Trousers of fine-micron wool fabrics accounted for 12 percent of total U.S. importsof wool trousers by quantity in January-May 2001. Imports of men’s wool trousers under theproduction-sharing provisions of HTS Chapter 98 fluctuated widely between 1996 and 2000; theytotaled slightly less than 2.0 million pairs in 2000.

2-10
Table 2-3Men’s and boys’ wool suits, sport coats, and trousers: U.S. imports for consumption, by principalsources, 1996-2000, January-May 2000, and January-May 2001
(1,000 units)
Item and source 1996 1997 1998 1999 2000
January-May--
2000 2001
Suits:
Mexico . . . . . . . . . . . . . . . . . . . . . . . . . 576 775 996 1,195 1,293 523 432
Italy . . . . . . . . . . . . . . . . . . . . . . . . . . . . 839 923 1,213 1,187 1,200 479 496
Canada . . . . . . . . . . . . . . . . . . . . . . . . . 1,241 1,373 1,282 1,307 1,024 495 421
Korea . . . . . . . . . . . . . . . . . . . . . . . . . . . 119 133 319 306 344 135 91
Costa Rica . . . . . . . . . . . . . . . . . . . . . . 164 252 302 236 250 80 66
Macedonia . . . . . . . . . . . . . . . . . . . . . . . 107 144 182 186 180 84 25
India . . . . . . . . . . . . . . . . . . . . . . . . . . . 10 31 108 146 170 69 79
Poland . . . . . . . . . . . . . . . . . . . . . . . . . . 216 164 218 190 169 72 49
Dominican Republic . . . . . . . . . . . . . . . 174 171 175 141 145 51 45
All other . . . . . . . . . . . . . . . . . . . . . . . . . 1,182 1,153 1,331 1,291 1,447 566 585
Total . . . . . . . . . . . . . . . . . . . . . . . . 4,628 5,119 6,127 6,185 6,221 2,554 2,289
Sport coats:
Colombia . . . . . . . . . . . . . . . . . . . . . . . . 489 570 575 598 737 308 287
Canada . . . . . . . . . . . . . . . . . . . . . . . . . 459 517 535 563 732 237 303
Italy . . . . . . . . . . . . . . . . . . . . . . . . . . . . 516 469 573 552 553 182 215
Mexico . . . . . . . . . . . . . . . . . . . . . . . . . . 263 466 435 446 532 150 217
Dominican Republic . . . . . . . . . . . . . . . 193 590 635 452 441 122 158
Guatemala . . . . . . . . . . . . . . . . . . . . . . . 122 180 206 199 371 124 143
Costa Rica . . . . . . . . . . . . . . . . . . . . . . 119 258 294 275 276 100 112
China . . . . . . . . . . . . . . . . . . . . . . . . . . . 168 243 214 221 231 109 89
Korea . . . . . . . . . . . . . . . . . . . . . . . . . . . 86 98 127 116 162 53 54
All other . . . . . . . . . . . . . . . . . . . . . . . . . 1,175 1,401 1,396 1,388 1,612 380 348
Total . . . . . . . . . . . . . . . . . . . . . . . . 3,589 4,791 4,989 4,810 5,646 1,765 1,926
Trousers:
Italy . . . . . . . . . . . . . . . . . . . . . . . . . . . . 1,139 1,134 1,465 1,586 1,869 738 852
Canada . . . . . . . . . . . . . . . . . . . . . . . . . 1,110 1,035 1,238 1,285 1,698 609 697
Mexico . . . . . . . . . . . . . . . . . . . . . . . . . . 356 1,112 1,308 1,320 1,652 568 787
Dominican Republic . . . . . . . . . . . . . . . 881 870 574 585 826 290 265
China . . . . . . . . . . . . . . . . . . . . . . . . . . . 863 842 900 821 825 346 276
Colombia . . . . . . . . . . . . . . . . . . . . . . . . 208 327 454 492 551 274 232
Bahrain . . . . . . . . . . . . . . . . . . . . . . . . . 0 0 0 0 521 0 53
India . . . . . . . . . . . . . . . . . . . . . . . . . . . 49 104 108 145 436 28 267
Korea . . . . . . . . . . . . . . . . . . . . . . . . . . . 149 66 237 332 422 125 119
All other . . . . . . . . . . . . . . . . . . . . . . . . . 1,374 1,472 1,329 1,452 2,340 417 627
Total . . . . . . . . . . . . . . . . . . . . . . . . 6,129 6,962 7,613 8,018 11,139 3,395 4,175
Note.–Import data are based on HTS statistical reporting numbers 6203.11.2000, 6203.11.6000, 6203.11.9000, 6203.31.0010,6203.31.5010, and 6203.31.9010 (suits); 6203.21.0015, 6203.21.3015, 6203.21.9015, 6203.31.0020, 6203.31.5020, and 6203.31.9020(sport coats); and 6203.21.0020, 6203.21.3020, 6203.21.9020, 6203.41.1210, 6203.41.1220, 6203.41.1510, 6203.41.1520,6203.41.1810, and 6203.41.1820 (trousers). Imports of the trousers were reduced by a quantity equal to the quantity of suit-type jacketsimported under HTS 6203.31.0010, 6203.31.5010, and 6203.31.9010 (suit-type jackets imported as parts of suits that do not meet therequirements for tariff classification as suits; for example, the outer shells of the suit-type jackets do not contain the required four or morepanels; see note 3(a) of HTS Chapter 62 for a complete definition of “suits”).
Source: Compiled from official statistics of the U.S. Department of Commerce.

1 This chapter draws on information received by the Commission at the hearing, in response to itsquestionnaires, in written statements, and from in-person and telephone interviews by Commission staff withofficials of Burlington Industries, Cleyn & Tinker International Inc., Northern Textile Association, StillwaterInc., and Warren Corp. 2 Karl Spilhaus, President, Northern Textile Association, and Pier Luigi Loro Piana, Chief ExecutiveOfficer, Warren Corp., transcript of hearing, pp. 112 and 126-127. 3 Questionnaire data show that apparent consumption of fine-micron worsted wool fabrics decreased by anestimated *** percent in both 2000 and January-March 2001 from the year-ago level. 4 The manufacture of a pair of trousers and a sport coat requires slightly more fabric than the manufactureof a suit. See Walter B.D. Hickey, Jr., Chairman, Hickey-Freeman Co., transcript of hearing, p. 52. 5 Walter B.D. Hickey, Jr., Chairman, Hickey-Freeman Co., and Crittenden Rawlings, President and ChiefExecutive Officer, Oxxford Clothes, Inc., transcript of hearing, pp. 51-53.
3-1
CHAPTER 3U.S. MARKET CONDITIONS FORCERTAIN WORSTED WOOL FABRICS1
This chapter provides the requested information on the U.S. market for U.S.-produced worstedwool fabrics suitable for use in men’s tailored clothing. The chapter discusses the extent of U.S.consumption, production, and imports of the subject fabrics, outlines the factors affecting the demandfor certain fabrics, and characterizes U.S.-produced fabrics in terms of those factors. Finally, thischapter discusses the U.S. worsted wool fabric industry and provides brief overviews of individualfirms.
U.S. Market for Worsted Wool Fabrics
U.S. demand for worsted wool fabrics has decreased significantly in recent years because ofreduced domestic production of men’s tailored clothing, the principal market for U.S. producers ofworsted wool fabric (see chapter 2 for further information on U.S. production of tailored clothing).2 The decline in demand for worsted wool fabrics has been concentrated in coarse-micron fabrics (thosehaving an average fiber diameter greater than 18.5 microns). In contrast, there has been little reductionin demand for fine-micron worsted wool fabrics (those having an average fiber diameter of 18.5microns or less)3 because of increasing consumer preference for fine clothing. In addition, the shift tocasual dress in the corporate workplace has led to a transition from suits to sport coats and trousers,which in turn has affected the nature of worsted wool fabric demand. Specifically, style and minimumorder requirements have become increasingly important as the manufacture of trousers and sport coatstypically requires smaller lot sizes4 and more diverse styles of fabric than the manufacture of suits.5 These trends are reflected in both the data obtained from Commission questionnaires and the officialstatistics of the U.S. Department of Commerce.
The Commission is providing two sets of data on apparent U.S. consumption of worsted woolfabrics. Table 3-1 shows official U.S. statistics on apparent U.S. consumption for all worsted woolfabrics, including those for men’s tailored clothing, as well as for women’s wear and military

6 The consumption, production, and trade data are overstated for purposes of this report because theyinclude worsted wool fabrics not only for men’s tailored clothing but also for women’s clothing and U.S.military uniforms. Also, the production and trade data are not reported on a comparable basis–that is, theproduction data include worsted fabric containing 36 percent or more by weight of wool, while the trade datainclude worsted fabric containing 85 percent or more by weight of wool. As such, the import share of the U.S.market for worsted wool fabrics is understated. 7 For a summary of questionnaire data from U.S. worsted wool fabric producers, see appendix D, table D-4. 8 In 2000, U.S. imports of men’s tailored clothing entered under the production-sharing provisions of HTSChapter 98 totaled 14 million square meter equivalents (SMEs), compared with estimated apparent U.S.consumption of about 25 million square meters. The 14 million SMEs includes an unknown quantity ofclothing made with fabrics containing less than 85 percent by weight of wool.
3-2
uniforms.6 Table 3-2 is based primarily on data received from questionnaire respondents and is limitedto worsted wool fabrics for use in men’s tailored clothing.7 Apparent U.S. consumption of worstedwool fabrics for use in men’s tailored clothing (table 3-2) represent *** percent of that for all worstedwool fabrics (table 3-1). However, it is believed that apparent U.S. consumption as presented in table3-2 overstates the true size of the U.S. market for worsted wool fabrics for use in men’s tailoredclothing, because an unknown, but believed to be substantial portion of the fabrics are destined foroffshore assembly and, thus, the import market share may be understated.8
Table 3-1Worsted wool fabrics: U.S. production, imports for consumption, exports of domesticmerchandise, and apparent consumption, 1996-2000
YearU.S.
production¹U.S.
imports²U.S.
exports³
Apparent U.S.
consumption
Ratio ofimports to
consumption
--------------------------1,000 square meters--------------------- Percent
1996 . . . . . . . . . . . . . . . . . . . . . 83,077 17,567 6,587 94,057 19
1997 . . . . . . . . . . . . . . . . . . . . . 81,385 19,347 7,449 93,283 21
1998 . . . . . . . . . . . . . . . . . . . . . 65,979 19,573 8,282 77,270 25
1999 . . . . . . . . . . . . . . . . . . . . . 44,834 19,837 7,589 57,082 35
2000 . . . . . . . . . . . . . . . . . . . . . 40,521 21,780 8,147 54,154 401 Includes production of worsted fabrics containing at least 36 percent by weight of wool. 2 Includes imports of worsted fabrics containing 85 percent or more by weight of wool, classified under HTS
subheadings 5112.11.20, 5112.11.30, 5112.11.60, 5112.19.60, 5112.19.90, and 5112.19.95.3 Includes exports of worsted fabrics containing 85 percent or more by weight of wool, reported under
Schedule B subheadings 5112.11.00 and 5112.19.00.
Note.--The consumption, production, and trade data are overstated for purposes of this report because theyinclude worsted wool fabrics not only for men’s tailored clothing but also for women’s clothing and U.S. militaryuniforms. Also, the production and trade data are not reported on a comparable basis–that is, the productiondata include worsted fabric containing 36 percent or more by weight of wool, while the trade data includeworsted fabric containing 85 percent or more by weight of wool. As such, the import share of the U.S. marketfor worsted wool fabrics is understated.
Source: Production data compiled from U.S. Census Bureau, Current Industrial Reports: Broadwoven Fabrics(Gray) - Summary 2000 (MQ313T(00)-5), and prior years; trade data compiled from official statistics of theU.S. Department of Commerce.

3-3
Table 3-2Worsted wool fabrics for use in men’s and boys’ tailored clothing: U.S. production, importsfor consumption, exports of domestic merchandise, and apparent consumption, 1999-2000,January-March 2000, and January-March 2001¹
Item and yearU.S.
productionU.S.
imports2U.S.
exports
Apparent U.S.
consumption
Ratio ofimports to
consumption
--------------------------1,000 square meters---------------------
Percent
Total:
1999 . . . . . . . . . . . . . . . . . . . *** *** *** *** ***
2000 . . . . . . . . . . . . . . . . . . . *** *** *** *** ***
Jan.-Mar.:
2000 . . . . . . . . . . . . . . . . . *** *** *** *** ***
2001 . . . . . . . . . . . . . . . . . *** *** *** *** ***
18.5 microns or less:
1999 . . . . . . . . . . . . . . . . . . . *** *** *** *** ***
2000 . . . . . . . . . . . . . . . . . . . *** *** *** *** ***
Jan.-Mar.:
2000 . . . . . . . . . . . . . . . . . *** *** *** *** ***
2001 . . . . . . . . . . . . . . . . . *** *** *** *** ***
Greater than 18.5 microns:
1999 . . . . . . . . . . . . . . . . . . . *** *** *** *** ***
2000 . . . . . . . . . . . . . . . . . . . *** *** *** *** ***
Jan.-Mar.:
2000 . . . . . . . . . . . . . . . . . *** *** *** *** ***
2001 . . . . . . . . . . . . . . . . . *** *** *** *** ***
¹ Includes only that fabric intended for use in men’s and boys’ tailored clothing.2 U.S. import data are estimated by the Commission based on questionnaire response data for direct
imports as reported by importers (including U.S. fabric producers) and clothing manufacturers. In addition, theCommission estimated a portion of the imports for non-respondents based on U.S. Customs data.
Note 1.--Certain data may not correspond to the questionnaire data reported in appendix D, as some estimateswere adjusted based on telephone interviews with industry representatives and imports were adjusted toinclude estimates of imports for non-respondents.
Note 2.--Apparent consumption data in this table are believed to overstate the true size of the U.S. market forworsted wool fabrics for use in men’s tailored clothing, because an unknown, but believed to be substantialportion of the fabrics are destined for offshore assembly. As such, the import market share may beunderstated.Source: Commission estimates based on questionnaire responses and telephone interviews of industryrepresentatives, and U.S. Customs data.
Source: Commission estimates based on questionnaire responses and telephone interviews of industryrepresentatives, and U.S. Customs data.
U.S. consumption of worsted wool fabrics of all types fell by 42 percent during 1996-2000(table 3-1). The decline was accounted for entirely by the U.S. fabric industry, whose output fell by 51percent in the period. Imports of worsted wool fabrics rose steadily during 1996-2000, by 24 percent. As a result, the import share of U.S. consumption expanded from 19 percent in 1996 to at least 40percent in 2000.

9 The import market share is unknown, but believed to be significant. A portion of the imported fabrics arecut into garment parts in the United States, sent offshore for assembly, and re-imported under the production-sharing provisions of HTS Chapter 98. Title V of the Trade and Development Act of 2000 grants temporaryduty reductions only to worsted wool fabrics cut and sewn into finished tailored clothing in the United States.
3-4
The Commission estimates that apparent U.S. consumption of worsted wool fabrics for use inmen’s tailored clothing decreased by *** percent, from *** million square meters in 1999 to *** millionsquare meters in 2000 (table 3-2). The majority of this decline was accounted for by the U.S. fabricindustry, whose output decreased by *** percent in 2000. As such, the import share of consumptionrose from *** percent in 1999 to *** percent in 2000. By fabric types, the import share was ***percent for fine-micron fabrics and *** percent for coarse-micron fabrics in 2000.
Commission estimates indicate that the majority of the decline in U.S. consumption of worstedwool fabrics in 2000 was likely accounted for by a decline in consumption of coarse-micron fabrics. Based on questionnaire data, U.S. consumption of coarse-micron fabrics decreased from *** millionsquare meters in 1999 to *** million square meters in 2000, accounting for the majority (*** percent)of total U.S. apparent consumption. Consumption of fine-micron fabrics decreased by *** percentduring the period to *** million square meters, or *** percent of total consumption. Questionnaire dataindicate that U.S. production of coarse- and fine-micron worsted wool fabrics in 2000 totaled ***million and *** million square meters, respectively. According to information obtained fromCommission questionnaires and interviews of industry officials, commercial uniform fabric accountedfor an estimated *** square meters of domestically produced coarse-micron fabric in 2000.
Because the data on apparent U.S. consumption of worsted wool fabrics for men’s tailoredclothing are believed to overstate the true size of the market, the Commission estimated the size of themarket based on production data provided by U.S. tailored clothing manufacturers in theirquestionnaire responses. Based on these data, the Commission estimates the size of the market to beapproximately 19 million square meters in 2000, of which about *** million square meters, or ***percent, are accounted for by fine-micron fabrics, and the remaining *** million square meters, or ***percent, are accounted for by coarse-micron fabrics.9 (Detailed information regarding the formulationof questionnaire-based estimates on total domestic market size can be found in box 3-1.)
U.S. Imports
Official data indicate that U.S. imports of worsted wool fabrics in 2000 increased 10 percentby quantity over the 1999 level, and are up 8 percent in January-May 2001 compared with the year-earlier level (table 3-3). During January-May 2001, fine-micron fabrics accounted for 23 percent ofthe volume of U.S. worsted wool fabric imports.
Imported fabric has remained highly competitive in the U.S. market due to lower labor costs insome foreign markets (e.g., Mexico) and due to U.S. consumer preferences for imported fabrics,especially those from Italy and the United Kingdom. Italy’s competitiveness in the U.S. worsted

3-5
Box 3-1Total Size of the Worsted Wool Fabric Market
The total size of the U.S. market for worsted wool fabrics suitable for use in men’s tailored clothing was estimatedbased on data collected from U.S. tailored clothing manufacturers regarding fabric purchases and clothingproduction (as converted into square meter equivalents (SMEs)).1 For 2000, data collected on purchases of worstedwool fabric for use in domestic production of men’s tailored clothing totaled about *** million SMEs, and datacollected on domestic production of men’s worsted wool tailored clothing totaled *** million SMEs.2 These dataare believed to represent virtually all of the production of companies who are members of the Tailored ClothingAssociation (TCA). TCA stated that its members account for 75 to 80 percent of domestic production of men’sworsted wool tailored clothing.3 Therefore, it is estimated that the U.S. market for worsted wool fabrics for use inmen’s tailored clothing is approximately 19 million SMEs, assuming that *** to *** million SMEs representbetween 75 and 80 percent of the total market. This estimate is substantially less than the *** million SMEsreported for apparent U.S. consumption of worsted wool fabrics in table 3-2. Apparent U.S. consumption, however,is believed to be overstated, because an unknown but believed to be significant share of U.S. fabric production andU.S. fabric imports are used in offshore assembly operations and therefore are not eligible for the TRQs.
The Commission estimate of 19 million SMEs also differs substantially from data reported by the U.S. CensusBureau (see table 3-1). However, official statistics likely overstate the U.S. market for the subject worsted woolfabrics. For example, official data on apparent U.S. consumption of worsted wool fabrics, which totaled 54.2million SMEs in 2000, incorporate production data on all fabrics containing at least 36 percent by weight of wool,and production and import data on worsted wool fabrics intended for all end-use markets (including men’s tailoredclothing, women’s wear, and specialty items). Likewise, Census data on U.S. production of tailored clothing, whichtotaled 25 million SMEs in 2000, include a substantial amount of clothing production that is cut in the United Statesand sent offshore for assembly. Fabrics used in such clothing production are not eligible for the TRQs.4
It is believed that the TCA members account for almost all U.S. purchases of fine-micron fabrics. U.S. purchasesof fine-micron fabrics for use in men’s tailored clothing totaled an estimated *** million SMEs in 2000, based onquestionnaire responses.5 Questionnaire data indicated that U.S. production of men’s tailored clothing using fine-micron fabrics totaled *** million SMEs in 2000. Apparent U.S. consumption of fine-micron fabrics totaled ***million square meters in 2000, the majority of which are believed to be used in U.S. production of men’s tailoredclothing. Based on these data, the Commission estimated the size of the market for fine micron-fabrics atapproximately *** million SMEs in 2000 (see table 5-1 in chapter 5 of this report for further information).
The Commission estimates the size of the market for coarse-micron fabrics at about *** million square meters for2000.
1 It was assumed that one suit equals 5.3 SMEs, one sport coat equals 3.1 SMEs, and one pair of trousers equals 2.6SMEs. The conversion used here is based on data on average fabric usage for each garment as reported by tailored clothingmanufacturers in their responses to the Commission questionnaire.
2 Of the 20 clothing manufacturers responding to the Commission purchaser questionnaire, 18 reported data on fabricpurchases for 2000. Data were estimated for one additional respondent, based on data supplied on domestic production ofgarments using fabric it purchased. In addition, production data were adjusted to include additional information received ina telephone interview with a non-respondent.
3 David A. Starr, Williams & Jensen, Counsel to TCA, transcript of hearing, p. 77. 4 Conversely, subtracting imports of garments assembled offshore from U.S. production figures would likely understate
U.S. production, because U.S. import data of worsted wool garments can include blends containing less than 85 percent byweight of wool.
5 Purchase data for three companies were not reported by micron count; however, the Commission estimated these databased on other information contained in the questionnaires (including production data), as well as through follow-upinterviews with the respondents.
10 For a more detailed discussion on lot sizes, see “Flexible Lot Sizes and Price” in chapter 5 of this report. 11 ***
3-6
wool fabric market partly reflects the wide range of fancy fabrics produced and marketed by Italianproducers, and the ability of these producers to produce fabrics in small lot sizes (as little as 50 linearmeters) at competitive prices.10 The ability to purchase short lengths of fabric is particularly importantto the manufacture of sport coats, which requires a greater number of different fabric styles in smallerlot sizes than the manufacture of suits.
In 2000, the largest sources of U.S. worsted wool fabric imports by quantity were Mexico,Italy, and Canada. U.S. imports of worsted wool fabrics from Mexico increased 73 percent byquantity in 2000, enabling Mexico to surpass Italy as the top volume supplier of such imports in 2000.*** Imports of worsted wool fabrics from Mexico are eligible to enter free of duty under NAFTA. U.S. imports from Italy fell by 7 percent in 2000; however, Italy remained the top foreign supplier byvalue (33 percent) due to the substantially higher average unit value of its worsted wool fabrics of alltypes ($9.76 per square meter, based on U.S. Customs value) relative to that of Mexico ($4.87). Interms of micron count, Italy was the top supplier of fine-micron fabric imports and the second-largestsupplier of coarse-micron fabric imports in January-May 2001. Conversely, Mexico was the second-largest suppler of fine-micron fabric imports11 and the top supplier of coarse-micron fabric imports.
A substantial share of U.S. worsted wool fabric imports currently receive duty-free treatmentunder the NAFTA and U.S.-Israel Free Trade Agreement (FTA) (table 3-3). In 2000, 34 percent (or7.4 million square meters) of U.S. worsted wool fabric imports qualified for duty-free treatment underNAFTA, while an additional 5 percent (or 1.0 million square meters) qualified for duty-free treatmentunder the U.S.-Israel FTA. Thus, while imports accounted for 40 percent of U.S. worsted wool fabricconsumption in 2000, dutiable imports accounted for only 25 percent of such consumption. Officialdata for January-May 2001 indicate that 31 percent of U.S. imports of fine-micron worsted woolfabrics received duty-free treatment, while 46 percent of U.S. imports of coarse-micron worsted woolfabrics entered duty-free.
Factors Affecting Demand for Certain Worsted WoolFabrics
The demand for worsted wool fabrics is based, in part, on the intended end use of that fabric.Fabrics used in the manufacture of men’s suits and trousers generally are not interchangeable withfabrics used in sport coats. Fabric construction and the type of yarn used can affect the “tailorability”of the fabric, making a certain fabric more or less appropriate for a particular end use. While fancyfabrics are used in both sport coats and suits, sport coats require a greater diversity of style, becausesport coats are considered more of a fashion item. According to industry sources, fabrics with differenttextures and special weave patterns are also increasingly used in trousers. Commercial uniforms,which are included within the men’s tailored clothing category, are typically made of solid-color,

12 Industry representatives, telephone interviews by Commission staff, July 10-11, 2001. 13 Pier Luigi Loro Piana, Chief Executive Officer, Warren Corp., transcript of hearing, p. 175.
3-7
Table 3-3Worsted wool fabrics: U.S. imports for consumption, by principal sources, 1996-2000,January-May 2000, and January-May 2001
(1,000 square meters)January-May--
Item 1996 1997 1998 1999 2000 2000 2001
Mexico . . . . . . . . . . . . . . . . . 1,170 1,837 1,439 3,035 5,252 2,124 3,129
Italy . . . . . . . . . . . . . . . . . . . 4,717 5,177 5,689 5,215 4,849 2,151 2,159
Canada . . . . . . . . . . . . . . . . . 1,696 1,711 1,199 1,303 2,158 825 985
Korea . . . . . . . . . . . . . . . . . . 1,001 961 1,271 1,994 1,453 668 639
India . . . . . . . . . . . . . . . . . . . 433 1,158 1,593 1,360 1,301 557 826
Israel . . . . . . . . . . . . . . . . . . 1,276 877 1,207 1,012 1,002 312 257
Germany . . . . . . . . . . . . . . . 305 407 613 812 864 363 290
Brazil . . . . . . . . . . . . . . . . . . 1,585 1,203 1,042 807 851 566 329
Turkey . . . . . . . . . . . . . . . . . 681 644 632 710 847 472 302
Uruguay . . . . . . . . . . . . . . . . 583 884 793 804 634 402 262
United Kingdom . . . . . . . . . . 604 706 620 516 520 216 229
China . . . . . . . . . . . . . . . . . . 767 709 1,140 862 514 181 198
Peru . . . . . . . . . . . . . . . . . . . 143 274 361 312 361 173 99
Chile . . . . . . . . . . . . . . . . . . . 317 326 216 94 182 67 36
Portugal . . . . . . . . . . . . . . . . 89 281 354 265 138 67 80
All other . . . . . . . . . . . . . . . . 2,197 2,192 1,405 736 853 358 446
Total . . . . . . . . . . . . . . . 17,567 19,347 19,573 19,837 21,780 9,502 10,266
Imports receiving duty-freetreatment under–
NAFTA . . . . . . . . . . . . . . 2,823 3,505 2,606 4,299 7,373 2,933 4,108
U.S.-Israel FTA . . . . . . . 1,263 870 1,207 1,012 1,000 312 256
Total duty-free imports . . . . . 4,085 4,375 3,813 5,310 8,372 3,245 4,363
Note.–Includes imports of worsted wool fabrics classified in HTS subheadings 5112.11.20, 5112.11.30,5112.11.60, 5112.19.60, 5112.19.90, and 5112.19.95.
Source: Compiled from official statistics of the U.S. Department of Commerce.
coarse-micron fabrics and are often made to satisfy certain detailed specifications.12 In addition,fabrics are sometimes constructed differently for separate dress trousers than for suits and sport coats,because trousers typically have a shorter useful life than other types of tailored clothing. Becausefabrics intended for suits and sport coats require different types of designs and separate research andmarketing efforts, a fabric manufacturer typically will specialize in the production of fabrics intendedfor one particular end use.13 Most U.S. firms that produce worsted wool fabric for the men’s tailoredclothing industry specialize in the production of fabrics intended for suits and trousers. U.S. mills alsoproduce some worsted wool fabrics intended for sport coats.

14 Andrew Kozinn, President, Saint Laurie Ltd., Crittenden Rawlings, President and Chief ExecutiveOfficer, Oxxford Clothes, Inc., and Walter B.D. Hickey, Jr., Chairman, Hickey-Freeman Co., transcript ofhearing, pp. 49-50; and official statistics of the U.S. Department of Commerce. 15 For example, an apparel manufacturer states that the two-ply four-harness fabrics produced in the UnitedKingdom are not available from a domestic mill. Andrew Kozinn, President, Saint Laurie Ltd., transcript ofhearing, p. 22. 16 Unless otherwise indicated, the information presented in this section is based on questionnaires submittedby Burlington Industries, Cleyn & Tinker International, Victor Forstmann Co., and Warren Corp., or onCommission staff interviews with industry representatives. 17 The wool fabric industry includes producers of woolen and worsted wool fabrics intended for a variety ofend uses, including men’s tailored clothing, women’s wear, commercial and military uniforms, and specialtyitems. 18 Employment data reflect total employment in the wool fabric (worsted and woolen) industry; data are notavailable on the number of workers involved only in the production of worsted wool fabrics. 19 Karl Spilhaus, President, Northern Textile Association, transcript of hearing, pp. 111-113.
3-8
Other factors that may motivate clothing manufacturers to purchase worsted wool fabrics froma certain source include price, which is discussed in chapter 4 of this report, as well as fabric quality,fabric styling, the ability to customize fabrics, minimum order requirements, and reliability of supply. Based on questionnaire responses, ***. Most U.S.-produced worsted wool fabrics are made to order,although a small portion of such fabrics are produced for “stock programs,” through which customtailors can purchase fabric for a single garment. Most U.S. fabric producers offer a substantialnumber of fabric styles and designs. In addition, all U.S. fabric producers indicated ***. Based onquestionnaire responses, the minimum order sizes typically offered by U.S. mills range from *** yardsto *** yards, and *** U.S. mills offer quantity discounts. According to questionnaire responses of U.S.apparel manufacturers, domestically-produced worsted wool fabrics are typically *** than comparablefabrics produced overseas (see chapter 4 for additional information on pricing).
No single country appears to produce the full range of worsted wool fabrics that the men’stailored clothing industry demands. For example, a substantial number of fabric mills in countries suchas Italy, the United Kingdom, and Germany produce fine-micron, high-quality worsted wool fabrics.14 Official U.S. trade data indicate that a significant volume of lower-priced, coarse-micron worsted woolfabric is available from countries such as Mexico, Korea, and India. In addition, there are certaintypes of fabric that are only available from foreign fabric producers.15
U.S. Worsted Wool Fabric Industry16
The segment of the U.S. wool fabric industry producing worsted wool fabrics for men’stailored clothing17 consists of five firms: Burlington Industries, Inc., Greensboro, NC; Cleyn & TinkerInternational Inc., Malone, NY; Stillwater Inc., Goshen, VA; Victor Forstmann Inc., Dublin, GA; andWarren Corp., Stafford Springs, CT. Based on official statistics of the U.S. Bureau of LaborStatistics, employment in the wool fabric industry fell 38 percent from 14,300 employees in 1996 to8,900 employees in 2000.18 Both Burlington Industries and Warren Corp. currently have significantunused capacity due to decreased demand for fabrics from U.S. tailored clothing producers.19 Questionnaire data indicate that the capacity utilization rate of U.S. worsted wool fabric producerstogether averaged *** percent in 2000 (table 3-4). U.S. production of worsted wool fabrics for use in

3-9
the manufacture of men’s tailored clothing is shown in table 3-5. The product mix, financial health,and recent history of these companies are summarized below.
Table 3-4Worsted wool fabrics: U.S. capacity and production, by company, 1999-2000, January-March2000, and January-March 2001¹
Item 1999 2000
January-March--
2000 2001
1,000 square meters
Average production capacity, total . . . . . . . . . . . . . . . . . *** *** *** ***
Burlington Industries . . . . . . . . . . . . . . . . . . . . . . . . . . . *** *** *** ***
Warren Corp. . . . . . . . . . . . . . . . . . . . . . . . . . . . . . . . . . *** *** *** ***
Cleyn & Tinker International . . . . . . . . . . . . . . . . . . . . . . *** *** *** ***
Other . . . . . . . . . . . . . . . . . . . . . . . . . . . . . . . . . . . . . . . *** *** *** ***
U.S. production, total . . . . . . . . . . . . . . . . . . . . . . . . . . . . *** *** *** ***
Burlington Industries, total . . . . . . . . . . . . . . . . . . . . . . . *** *** *** ***
18.5 microns or less . . . . . . . . . . . . . . . . . . . . . . . . . *** *** *** ***
Greater than 18.5 microns . . . . . . . . . . . . . . . . . . . . *** *** *** ***
Warren Corp., total . . . . . . . . . . . . . . . . . . . . . . . . . . . . *** *** *** ***
18.5 microns or less . . . . . . . . . . . . . . . . . . . . . . . . . *** *** *** ***
Greater than 18.5 microns . . . . . . . . . . . . . . . . . . . . *** *** *** ***
Cleyn & Tinker International, total . . . . . . . . . . . . . . . . . *** *** *** ***
18.5 microns or less . . . . . . . . . . . . . . . . . . . . . . . . . *** *** *** ***
Greater than 18.5 microns . . . . . . . . . . . . . . . . . . . . *** *** *** ***
Other, total . . . . . . . . . . . . . . . . . . . . . . . . . . . . . . . . . . *** *** *** ***
18.5 microns or less . . . . . . . . . . . . . . . . . . . . . . . . . *** *** *** ***
Greater than 18.5 microns . . . . . . . . . . . . . . . . . . . . *** *** *** ***
Percent
Average production capacity utilization, total . . . . . . . . . *** *** *** ***
Burlington Industries . . . . . . . . . . . . . . . . . . . . . . . . . . . *** *** *** ***
Warren Corp. . . . . . . . . . . . . . . . . . . . . . . . . . . . . . . . . . *** *** *** ***
Cleyn & Tinker International . . . . . . . . . . . . . . . . . . . . . . *** *** *** ***
Other . . . . . . . . . . . . . . . . . . . . . . . . . . . . . . . . . . . . . . . *** *** *** ***
¹ Certain data may not correspond to the questionnaire data reported in appendix D, as some estimateswere adjusted based on telephone interviews with industry representatives.
Source: Estimates based on questionnaire responses and telephone interviews of industry representatives.

20 Jim Leonard, Jim Leonard & Associates, representing Burlington Industries, transcript of hearing, p.118. 21 Burlington Industries, written submission to the Commission, June 15, 2001. 22 Burlington Industries, Inc., Form 10-K filed with the U.S. Securities and Exchange Commission, Dec.22, 2000, found at Internet address http://www.sec.gov, retrieved Mar. 27, 2001. 23 Burlington Industries, “About Burlington: International,” found at Internet addresshttp://www.burlington.com/, retrieved July 6, 2001.
3-10
Table 3-5Worsted wool fabrics for men’s and boys’ tailored clothing: U.S. production, by company,1999-2000, January-March 2000, and January-March 20011
(1,000 square meters)
Item 1999 2000
January-March--
2000 2001
U.S. production, total . . . . . . . . . . . . . . . . . . . . . . . . . . . . *** *** *** ***
Burlington Industries, total . . . . . . . . . . . . . . . . . . . . . . . *** *** *** ***
18.5 microns or less . . . . . . . . . . . . . . . . . . . . . . . . . *** *** *** ***
Greater than 18.5 microns . . . . . . . . . . . . . . . . . . . . . *** *** *** ***
Warren Corp., total . . . . . . . . . . . . . . . . . . . . . . . . . . . . . *** *** *** ***
18.5 microns or less . . . . . . . . . . . . . . . . . . . . . . . . . *** *** *** ***
Greater than 18.5 microns . . . . . . . . . . . . . . . . . . . . . *** *** *** ***
Cleyn & Tinker International, total . . . . . . . . . . . . . . . . . . *** *** *** ***
18.5 microns or less . . . . . . . . . . . . . . . . . . . . . . . . . *** *** *** ***
Greater than 18.5 microns . . . . . . . . . . . . . . . . . . . . . *** *** *** ***
Other, total . . . . . . . . . . . . . . . . . . . . . . . . . . . . . . . . . . . *** *** *** ***
18.5 microns or less . . . . . . . . . . . . . . . . . . . . . . . . . *** *** *** ***
Greater than 18.5 microns . . . . . . . . . . . . . . . . . . . . . *** *** *** ***
¹ Certain data may not correspond to the questionnaire data reported in appendix D, as some estimateswere adjusted based on telephone interviews with industry representatives.
Source: Estimates based on questionnaire responses and telephone interviews of industry representatives.
Burlington Industries, Inc.
Burlington Industries is the leading U.S. producer of worsted wool fabric for men’s tailoredclothing.20 In recent years, the firm has been consolidating its operations. In 1996, Burlington closedits “Customer Special Requirements Plant,” which produced only small quantities (or “short runs”) offabric.21 ***. Burlington also reported that it reduced its U.S. production capacity for apparel fabrics,including worsted wool fabrics, by approximately 25 percent during its fiscal year 1999.22 During thatsame year, the firm opened a mill in Yecapixtla, Mexico that produces worsted wool fabrics.23 Burlington recorded income (before taxes and interest) of $61 million in 1999, but posted a loss of

24 Burlington Industries, Inc., “Investor Information: Financial Highlights,” found at Internet addresshttp://www.burlington.com, retrieved Apr. 23, 2001. 25 Jim Leonard, Jim Leonard & Associates, representing Burlington Industries, transcript of hearing, p.118. 26 Commercial uniform fabric accounts for approximately *** percent of Burlington’s total worsted woolfabric production. Representative of Burlington Industries, telephone interview by Commission staff, June 29,2001. 27 Jim Leonard, Jim Leonard & Associates, representing Burlington Industries, transcript of hearing, 137-139. 28 Officials of Burlington Industries, interview by Commission staff, Clarksville and Halifax, VA, Mar. 29,2001. 29 Pier Luigi Loro Piana, Chief Executive Officer, Warren Corp., transcript of hearing, p. 124. 30 Official of Warren Corp., interview by Commission staff, Stafford Springs, CT, Mar. 20, 2001. 31 *** 32 Official of Warren Corp., interview by Commission staff, Stafford Springs, CT, Mar. 20, 2001. 33 Pier Luigi Loro Piana, Chief Executive Officer, Warren Corp., transcript of hearing, p. 124. 34 Officials of Warren Corp., interview by Commission staff, Washington, DC, July 2, 2001. 35 Pier Luigi Loro Piana, Chief Executive Officer, Warren Corp., transcript of hearing, p. 125. 36 Officials of Warren Corp., interview by Commission staff, Washington, DC, July 2, 2001. 37 Ibid.
3-11
$422 million in 2000.24 Currently, about one-third of Burlington’s domestic labor force, orapproximately 4,000 workers, are involved in worsted wool fabric production.25
Burlington produces a wide range of wool and wool-blended fabrics for use in men’s andwomen’s wear, military uniforms, and commercial uniforms.26 *** percent of these fabrics are intendedfor men’s tailored clothing. ***. Burlington is set up to produce fabric in large lots.27 Based onquestionnaire responses, coarse-micron fabrics account for *** percent of Burlington’s worsted woolfabric production for men’s tailored clothing (table 3-5). The finest worsted wool fabrics currentlymade by Burlington have an average fiber diameter of *** microns. ***.28
Warren Corp.
Warren Corp. has produced textiles for 150 years. Prior to its 1988 acquisition by Italian firmLoro Piana, Warren ***. Loro Piana invested heavily in staff training, new equipment, and retrofittingto produce fine-micron worsted wool fabrics at the Connecticut plant.29 Worsted wool fabrics nowaccount for *** of Warren’s total fabric production. ***.30 However, as a result of ***,31 Warrenstated in its questionnaire response that ***. ***. ***.32 Currently, Warren employs a total of 260individuals at its Connecticut plant and its New York office.33
The fabrics made by Warren are intended for high-end men’s tailored clothing and ***.34 Forexample, suits made from Warren’s fabric retail for more than $500 each, and many retail for morethan $1,000 each.35 According to its questionnaire response, Warren primarily produces worsted woolfabrics having an average fiber diameter of *** microns. As a result of Warren’s ***.36 ***. According to Warren officials, ***.37

38 Cleyn & Tinker Internet site, found at Internet address http://www.cleyn.com/indexe.htm. 39 Official of Cleyn & Tinker, telephone interview by Commission staff, July 3, 2001. 40 Victor Forstmann Internet site, found at Internet address http://www.forstmann.com/index.html; andquestionnaire response. 41 Victor Forstmann Internet site, found at Internet address http://www.forstmann.com/index.html. 42 Official of Stillwater, Inc., telephone interview by Commission staff, July 9, 2001.
3-12
Cleyn & Tinker International Inc.
Cleyn & Tinker International Inc. (CTI) is a subsidiary of Canadian-based Cleyn & TinkerInc. and produces worsted wool fabrics at its only U.S. facility in Malone, NY.38 According to itsquestionnaire response, CTI ***.39
Victor Forstmann, Inc.
Victor Forstmann, Inc. was established in September 1999 when Canadian-based VictorWoolen Products of America, Inc., acquired U.S.-based Forstmann & Co. (its two plants in Dublin,GA, the equipment, and the Forstmann brand name). Prior to this acquisition, Forstmann & Co.declared bankruptcy and closed facilities in Louisville and Milledgeville, GA that had manufacturedworsted wool fabrics and yarns (these facilities were not among the assets that Victor Woolen Productsacquired in 1999). Currently, Victor Forstmann, doing business as the Forstmann Co., employs morethan 800 workers in the two Dublin plants, where it produces worsted wool fabrics ***.40
Victor Forstmann produces fashion and institutional apparel fabrics,41 of which those intendedfor men’s tailored clothing account for ***.
Stillwater Inc.
Stillwater Inc., Goshen, VA, produces worsted wool fabrics ***.42
1 The Commission requested that values be net of all discounts and rebates and exclude U.S.-inlandtransportation costs for delivery to the customer. 2 The quantity data were collected in linear yards and converted into square meters, assuming that thefabrics are made in 60-inch widths (one yard equals 1.392 square meters).
4-1
CHAPTER 4PRICES OF DOMESTIC ANDIMPORTED WORSTED WOOLFABRICS
This chapter provides information on prices of domestic and imported worsted wool fabrics for1999, 2000, and January-March 2000 and 2001. Information in this chapter, unless otherwise noted,is based on responses to Commission questionnaires from U.S. producers (mills), wholesaler-importers(importers) of worsted wool fabrics, and U.S. manufacturers of men’s tailored clothing that purchaseand import such fabrics. The chapter first discusses the price data collected, including the types offabrics for which data were requested and the limitations of such data. The chapter then comparesprices of domestic and imported fabrics and analyzes price trends and factors affecting prices. Finally,the chapter discusses pricing methods of U.S. mills and importers in selling fabrics to the clothingmanufacturers.
Data Collection
The Commission sent questionnaires to mills and importers requesting quarterly data on thetotal quantity and value of their shipments (sales) of specified fabrics to unrelated U.S. customers (theclothing manufacturers).1 Similarly, the questionnaire sent to the clothing manufacturers requestedquarterly data on the total quantity and value of their purchases and direct imports of the specifiedfabrics for their own use. The sales data of the mills and importers were used to construct weightedaverage “selling prices” and the purchase and direct import data of the clothing manufacturers wereused to construct weighted average “purchase prices.”2
Because prices of such fabrics can vary greatly due to differences in wool content, micronlevel, weight, quality, weave construction, and style, the Commission questionnaires requested pricedata for eight different types of worsted wool fabrics used in men’s tailored clothing. The eight fabrictypes, listed in table 4-1, are distinguished by three criteria, as follows:
(1) wool content -- 100-percent wool or blends containing at least 85 percent by weight of wool; (2) micron count -- fabrics having an average fiber diameter of 18.5 microns or less (fine-micron
wool fabrics) or greater than 18.5 microns (coarse-micron fabrics); and(3) fancy or solid color -- a fancy fabric contains two or more colors.
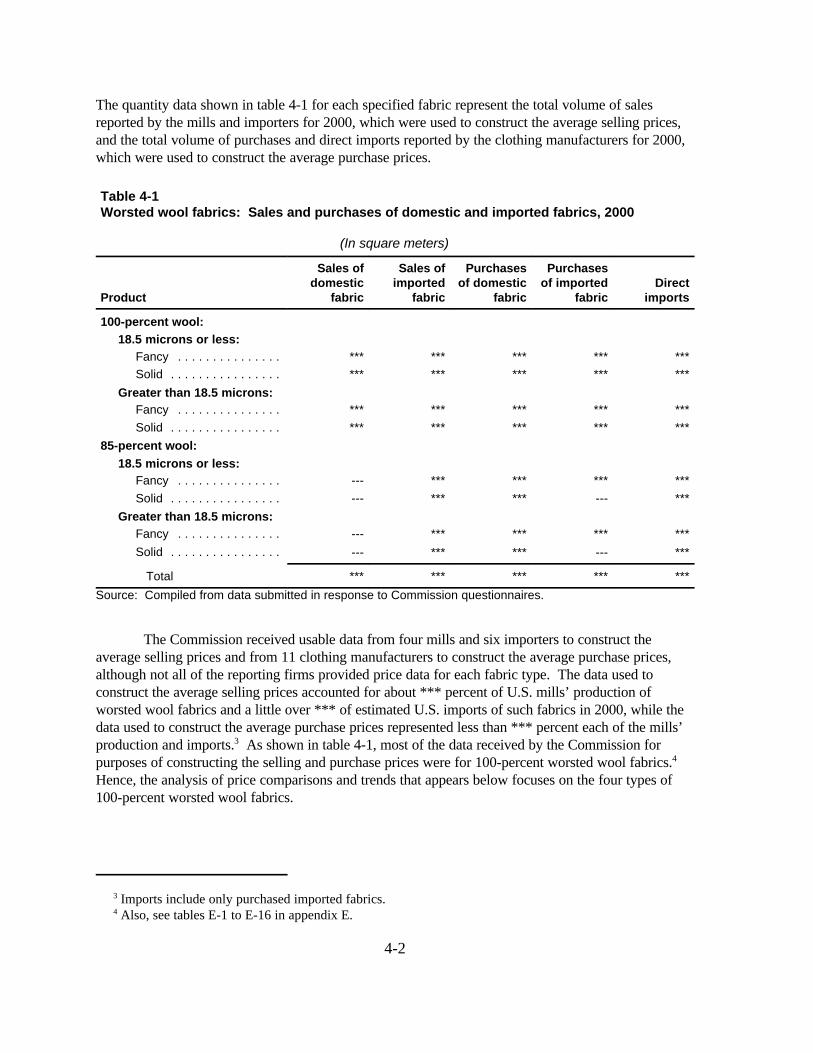
3 Imports include only purchased imported fabrics. 4 Also, see tables E-1 to E-16 in appendix E.
4-2
The quantity data shown in table 4-1 for each specified fabric represent the total volume of salesreported by the mills and importers for 2000, which were used to construct the average selling prices,and the total volume of purchases and direct imports reported by the clothing manufacturers for 2000,which were used to construct the average purchase prices.
Table 4-1Worsted wool fabrics: Sales and purchases of domestic and imported fabrics, 2000
(In square meters)
Product
Sales ofdomestic
fabric
Sales ofimported
fabric
Purchasesof domestic
fabric
Purchasesof imported
fabricDirect
imports
100-percent wool: 18.5 microns or less: Fancy . . . . . . . . . . . . . . . *** *** *** *** ***
Solid . . . . . . . . . . . . . . . . *** *** *** *** ***
Greater than 18.5 microns: Fancy . . . . . . . . . . . . . . . *** *** *** *** ***
Solid . . . . . . . . . . . . . . . . *** *** *** *** ***
85-percent wool:
18.5 microns or less: Fancy . . . . . . . . . . . . . . . --- *** *** *** ***
Solid . . . . . . . . . . . . . . . . --- *** *** --- ***
Greater than 18.5 microns: Fancy . . . . . . . . . . . . . . . --- *** *** *** ***
Solid . . . . . . . . . . . . . . . . --- *** *** --- ***
Total *** *** *** *** ***
Source: Compiled from data submitted in response to Commission questionnaires.
The Commission received usable data from four mills and six importers to construct theaverage selling prices and from 11 clothing manufacturers to construct the average purchase prices,although not all of the reporting firms provided price data for each fabric type. The data used toconstruct the average selling prices accounted for about *** percent of U.S. mills’ production ofworsted wool fabrics and a little over *** of estimated U.S. imports of such fabrics in 2000, while thedata used to construct the average purchase prices represented less than *** percent each of the mills’production and imports.3 As shown in table 4-1, most of the data received by the Commission forpurposes of constructing the selling and purchase prices were for 100-percent worsted wool fabrics.4 Hence, the analysis of price comparisons and trends that appears below focuses on the four types of100-percent worsted wool fabrics.

5 It is uncertain, if this is true, for import selling price data since few importers who reported pricing dataprovided a list of their customers. Another factor that may cause differences between average domestic sellingand purchase prices is the possibility that some domestic producers may have included export sales in theirpricing data.
4-3
The price data are limited by several factors. First, relative to sales of domestic fabrics, thereis low coverage of purchases of domestic fabrics. Second, the reported purchases of both domestic andimported fabrics were mostly accounted for by medium- to high-end clothing manufacturers who tendto purchase higher quality, more expensive fabric. This trend may cause differences between domesticselling prices, which generally have broader coverage, and purchase price data.5 Finally, two U.S.clothing manufacturers *** reported purchase price data that were not disaggregated by country oforigin. As such, and because many other clothing manufacturers reported quantity and value of theirpurchases which yielded the same unit values for purchases from each country of origin in a given timeperiod, comparisons of average prices for imports by country are not very informative and are thereforeexcluded from the analysis below.
Price Comparisons
Based on questionnaire data from U.S. tailored clothing manufacturers regarding theirpurchases of worsted wool fabrics and U.S. mills and wholesaler-importers regarding their sales ofsuch fabrics, the average purchase price and average selling price for fine-micron domestic fabricswere *** than those for similar imported fabrics, as shown in figures 4-1 to 4-2. For coarse-micronfancy fabrics (containing two or more colors), the average purchase and selling prices were *** fordomestic fabrics than for similar imported fabrics (figures 4-5 and 4-6). For coarse-micron solid-colorfabrics, data from the clothing manufacturers show that the average purchase price was *** fordomestic fabrics than for similar imported fabrics, while data from the U.S. fabric mills andwholesaler-importers show that the average selling price of domestic fabrics was *** (figures 4-7 and4-8). The average quarterly purchase prices reported by the clothing manufacturers tended to be higherthan the average quarterly selling prices reported by the fabric mills and wholesaler-importers, whetherfor a given domestic or imported fabric or for a specific fine-micron or coarse-micron fabric, primarilybecause most of the purchase price data received by the Commission came from manufacturers ofmedium- to high-end clothing that typically use relatively high-cost fabrics.
Data from U.S. tailored clothing manufacturers and fabric wholesaler-importers show that theaverage prices of imported fine-micron fabrics generally *** on a quarterly basis from January-March1999 to January-March 2001. For domestic fine-micron fabrics, data from the clothing manufacturersshow that the average purchase price *** during the period, ***. For coarse-micron fabrics, quarterlychanges in average selling and purchase prices were mixed for 1999 and 2000.
As shown in table 4-2 and seen in figures 4-1, 4-2, 4-5, and 4-6, the pricing pattern for fine-micron wool fabrics noted above also generally holds true in all periods, ***. *** the averagepurchase price for fancy fabric made domestically of $*** per square meter was *** than that ($***)for similar imported fabric. *** the average purchase price for solid-color fabric made domestically of$*** per square meter was *** than that for similar imported fabric ($***). The average selling pricefor fancy fabric made domestically of $*** per square meter was *** than that for similar

6 Pier Luigi Loro Piana, Chief Executive Officer, Warren Corp., transcript of hearing, p. 152. 7 Andrew Kozinn, President, Saint Laurie Ltd., transcript of hearing, p. 23.
4-4
Table 4-2Worsted wool fabrics: Weighted-average selling and purchase prices for domestic andimported fabrics (100-percent wool), January-March 20011
(Per square meter)
Product
Sales ofdomestic
fabric
Sales ofimported
fabric
Purchasesof
domesticfabric
Purchasesof imported
fabricDirect
imports
18.5 microns or less: Fancy . . . . . . . . . . . . . . . . . . $*** $*** $*** $*** $***
Solid . . . . . . . . . . . . . . . . . . . *** *** *** *** ***
Greater than 18.5 microns: Fancy . . . . . . . . . . . . . . . . . . *** *** *** *** ***
Solid . . . . . . . . . . . . . . . . . . . *** *** *** *** ***
1 Weighted-average selling and purchase prices for both domestic and imported fabric are f.o.b. U.S. pointof shipment. Weighted-average purchase prices for direct imports do not include U.S.-inland transportationcosts for delivery.
Source: Compiled from data submitted in response to Commission questionnaires.
imported fabric ($***), while the average purchase price for solid-color fabric made domestically of$*** per square meter was *** than that for similar imported fabric ($***).
For coarse-micron fabrics, the price data reported by the clothing manufacturers for January-March 2001 show ***. The clothing manufacturers’ data show that the average price of coarse-micronfancy fabric made domestically was $*** per square meter, which was *** than that for similarimported fabric ($***). U.S. producers’ data show that the average selling price of the domestic fabricwas $***, which was *** than that reported by importers for similar imported fabric ($***). On theother hand, for coarse-micron solid-color fabric, the average purchase price for domestic fabric of $***per square meter was *** than that for similar imported fabric ($***), while the average selling price ofdomestic fabric ($***) was *** than that for imported fabric ($***).
The weighted-average selling and purchase prices constructed from responses to Commissionquestionnaires differ significantly, in some instances, from individual company prices. According toWarren Corp., clothing manufacturers fall into one of three different market segments in terms of theirpurchases of worsted wool fabrics: those who typically pay between $30 and $40 per linear yard($21.53 and $28.70 per square meter), those who typically pay between $10 and $20 per linear yard($7.18 and $14.35), and those who typically pay between $9 and $12 per linear yard ($6.46 and$8.62).6 For example, Saint Laurie reports that it pays an average of $18 per square meter forimported fabric, reflecting a premium for having access to higher quality fabrics in smaller quantities.7 For two specific fabrics, Saint Laurie pays about $16 per linear yard ($11.48 per square

4-5
Figure 4-1Worsted wool fabric: Weighted-average purchase prices of domestic and imported 100-
percent wool fine-micron fancy fabric, by quarters, January-March 1999 to January-March2001
* * * * * * *
Figure 4-2Worsted wool fabric: Weighted-average sales prices of domestic and imported 100-percent
wool fine-micron fancy fabric, by quarters, January-March 1999 to January-March 2001
* * * * * * *
Figure 4-3Worsted wool fabric: Weighted-average purchase prices of domestic and imported 100-
percent wool fine-micron solid fabric, by quarters, January-March 1999 to January-March2001
* * * * * * *
Figure 4-4Worsted wool fabric: Weighted-average sales prices of domestic and imported 100-percent
wool fine-micron solid fabric, by quarters, January-March 1999 to January-March 2001
* * * * * * *
Figure 4-5Worsted wool fabric: Weighted-average purchase prices of domestic and imported 100-
percent wool coarse-micron fancy fabric, by quarters, January-March 1999 to January-March 2001
* * * * * * *
Figure 4-6Worsted wool fabric: Weighted-average sales prices of domestic and imported 100-percent
wool coarse-micron fancy fabric, by quarters, January-March 1999 to January-March 2000
* * * * * * *
Figure 4-7Worsted wool fabric: Weighted-average purchase prices of domestic and imported 100-
percent wool coarse-micron solid fabric, by quarters, January-March 1999 to January-March 2001
* * * * * * *
Figure 4-8Worsted wool fabric: Weighted-average sales prices of domestic and imported 100-percent
wool coarse-micron solid fabric, by quarters, January-March 1999 to January-March 2001
* * * * * * *

8 Ibid., p. 84. 9 Walter B.D. Hickey, Jr., Chairman, Hickey-Freeman Co., transcript of hearing, pp. 59-60. 10 This was calculated as the change in price between January-March 1999 and January-March 2001. 11 See transcript of hearing for testimony of Pier Luigi Loro Piana, Chief Executive Officer, Warren Corp.,p. 130; Crittenden Rawlings, President and Chief Executive Officer, Oxxford Clothes, p. 92; and Walter B.D.Hickey, Jr., Chairman, Hickey-Freeman Co., p. 92.
4-6
meter) and $24 per linear yard ($17.22), respectively.8 Hickey-Freeman Co. stated that the cost of suitfabric ranges from $20 to $40 per linear yard ($14.35 to $28.70 per square meter).9
Price Trends
Although average purchase prices of both domestic and imported fine-micron wool fabrics andaverage selling prices of imported fine-micron fabrics generally *** on a quarterly basis from January-March 1999 to January-March 2001, average selling prices of domestic fine-micron fabrics *** duringthe same period. The changes in average selling and purchase prices of the coarse-micron wool fabricswere mixed in 1999 and 2000.10
From January-March 1999 to January-March 2001, the average purchase price reported by theclothing manufacturers for fine-micron wool fancy and solid-color fabrics made domestically *** by*** percent and *** percent, respectively, while the average purchase price for similar imported fabrics*** by *** and *** percent, respectively. Similarly, the average selling price reported by importers forfine-micron wool fancy and solid fabrics *** by *** and *** percent, respectively. However, theaverage selling price reported by the mills for fine-micron wool fancy and solid fabrics madedomestically *** by *** and *** percent, respectively.
The changes in average selling and purchase prices of the coarse-micron wool fabrics were mixedin 1999 and 2000. The average purchase price of such fabrics made domestically *** by *** percentfor fancy fabric but *** by *** percent for solid-color fabric, while the average purchase price forsimilar imported fabric *** by *** percent for fancy fabric but *** by *** percent for solid-colorfabric. The average selling price of domestic fancy and solid fabrics *** by *** percent and ***percent, respectively, while the average selling price of similar imported fabrics *** by *** percent and*** by *** percent, respectively. One domestic mill stated that domestic prices fell during 1999 and2000, while the clothing manufacturers stated that prices were relatively stable.11
Factors Affecting Prices
Prices of worsted wool fabrics are affected by changes in consumer demand for men’s tailoredclothing, which are discussed in chapter 2 of this report, as well as by changes in exchange rates ofmajor exporting countries, U.S. duties on the fabrics, raw material costs, and transportation costs. Differences in pricing methods used by mills to market fabrics also affect prices, and these differencesare discussed later in this chapter.
Currency depreciations of major exporting countries against the U.S. dollar reduce the pricecompetitiveness of domestic fabrics relative to imports, while currency appreciations increase their

12 Pier Luigi Loro Piana, Chief Executive Officer, Warren Corp., transcript of hearing, pp. 127 and 128. 13 Walter B.D. Hickey, Jr., Chairman, Hickey-Freeman Co., Andrew Kozinn, President, Saint Laurie Ltd.,Crittenden Rawlings, President and Chief Executive Officer, Oxxford Clothes, and Howard Goldstein, ChiefFinancial Officer, Hartz & Co., transcript of hearing, p. 74. 14 A depreciation of the Italian lira does not necessarily mean that the cost of production in Italy isabsolutely lower than that in the United States. In fact, the Union of Needletrades, Industrial, and TextilesEmployees (UNITE) states that total labor costs in Italy were 3 percent higher than those of the United Statesin the summer and autumn of 2000. Arthur Gundersheim, Director, International Trade Department, UNITE,written submission to the Commission, June 5, 2001.
4-7
price competitiveness. Significant fluctuations in exchange rates of several major exporting countriesoccurred between January 1999 and April 2001, when the Italian lira depreciated by 22 percent relativeto the dollar in real terms and the Mexican peso appreciated by 19 percent in real terms (table 4-3).
Table 4-3Overall appreciation or depreciation amounts for currencies of selected countries relative tothe U.S. dollar1
(In percent)
Country
Nominal exchange rate Real exchange rate
Currencyappreciation
Currencydepreciation
Currencyappreciation
Currencydepreciation
Canada . . . . . . . . . . . . . . . . . . . . - 2.5 - 3.8
India2 . . . . . . . . . . . . . . . . . . . . . - 9.1 - 10.3
Israel3 . . . . . . . . . . . . . . . . . . . . . - 2.0 - 6.9
Italy . . . . . . . . . . . . . . . . . . . . . . - 23.2 - 22.4
Korea . . . . . . . . . . . . . . . . . . . . . - 11.4 - 13.8
Mexico4 . . . . . . . . . . . . . . . . . . . . 8.1 - 19.4 -1 Unless otherwise noted, nominal changes in exchange rates are measured for the period Jan. 1999-Apr.
2001 and real changes in exchange rates are for the period Jan. 1999-Mar. 2001.2 Data for real exchange rates are for the period Jan. 1999-Feb. 2001.3 Data for nominal exchange rates are for the period Jan. 1999-Mar. 2001.4 Data for real exchange rates are for the period Jan. 199-Dec. 1999.
Source: International Monetary Fund, International Financial Statistics, June 2001 and selected back issues.
Warren Corp., a U.S. fabric producer affiliated with Loro Piana of Italy, stated that the recentfall in the Italian lira effectively negates the existing U.S. tariff on worsted wool fabrics by allowingU.S. importers of such fabrics from Italy to lower their prices.12 However, several clothingmanufacturers who purchase Italian fabrics stated that exchange rate fluctuations do not affect theirpurchasing decisions.13
As a result of the depreciation of the Italian lira, imports of Italian fabrics are relatively morecompetitive in the U.S. market because the cost of producing fabric is relatively lower in Italy than inthe United States, allowing Italian producers to lower their dollar prices and increase their fabric salesin the U.S. market.14 The degree to which Italian fabric mills lower their dollar prices and increasetheir sales to the U.S. market as a result of the depreciation depends on how much purchasers of Italian

15 TRQ allocations for 2001 were announced on July 31, 2001. The TRQ allocations were awarded toindividual tailored clothing manufacturers who use imported fabric to produce men’s and boys’ tailoredclothing. See Federal Register (66 F.R. 39490) published on July 31, 2001. 16 The TRQ may not be fully utilized when imports of fabric for individual tailored clothing manufacturersare greater than their TRQ allocations because importers can choose to enter each shipment under either thein-quota or the over-quota category. Importers may tend to enter higher priced fabric within the TRQ andtheir lower priced fabric at the over-quota higher duty rate. 17 Also, some U.S. fabric producers make their own yarn, while others purchase at least some portion oftheir yarn. Moreover, the cost of wool yarn accounts for as much as 50 percent of the fabric price. Pier LuigiLoro Piana, Chief Executive Officer, Warren Corp., transcript of hearing, pp. 185 and 186. 18 Pier Luigi Loro Piana, Chief Executive Officer, Warren Corp., transcript of hearing, pp. 185 and 186.***. Anne M. Costa, Accounting Supervisor, Warren Corp., written submission to the Commission, June 8,2001. 19 Anne M. Costa, Accounting Supervisor, Warren Corp., written submission to the Commission, June 8,2001. 20 These estimates are derived from official import data and represent insurance and freight charges onimports valued on a c.i.f. basis.
4-8
fabrics in the U.S. market respond to price changes and how much market power Italian fabric millscan exert in the U.S. market.
Reductions in U.S. duties on worsted wool fabrics covered by the TRQs can also affect theprice of worsted wool fabric. A reduction in duties on imports of fabric under the TRQ may lowerprices and increase sales of dutiable fabric.15 The degree to which prices fall and sales increasedepends on how much purchasers of imported fabrics in the U.S. market respond to price changes, howmuch market power Italian fabric mills can exert in the U.S. market, expected and actual demand fordutiable fabric, and expected and actual TRQ allocations for individual tailored clothingmanufacturers.16
Changes in raw material costs can significantly affect prices of worsted wool fabrics becausethe main raw material (wool) makes up about 30 to 35 percent of the price of the fabric.17 WarrenCorp. states that wool prices have fluctuated significantly in the last 3 years and that these pricechanges affect the price of fabric “very much.”18 ***.19
Changes in international transportation costs have a relatively small effect on fabric pricesbecause such costs represent a relatively small portion of total import costs. The cost of shippingworsted wool fabrics to the United States varies by country of origin, averaging an estimated3.6 percent of the total import cost for all countries, 3.9 percent for Italy, and 1.5 percent for Mexico in2000.20
Pricing Methods
The price of any fabric may differ by purchaser because fabric suppliers sometimes negotiateprices and have different sales terms. Minimum lot sizes and quantity discounts can also make pricesdifferent for different quantities of fabric purchased.
***.

21 ***.
4-9
Importers reported using a combination of methods to determine prices. They make most oftheir sales of worsted wool fabric on a contract basis, and their contracts fix both quantity and priceand in most cases do not have “meet or release” provisions. Importers usually sell fabric on an f.o.b.or landed duty-paid value basis.
Although only two of the four responding producers offer quantity discounts, all producersrequire purchases of a minimum lot size for at least some orders (discussed in chapter 5). Fabric pricesof mills having lower minimum lot sizes may be higher than prices of comparable fabric from millshaving higher minimum lot sizes. Although it can be difficult to determine how prices differ acrossfirms due to varying minimum lot sizes, the discount in prices for purchasing different quantities fromthe same firm is more transparent. For example, discounts offered by ***.21 ***.


5-1
CHAPTER 5ABILITY OF DOMESTIC FABRICPRODUCERS TO MEET THE NEEDS OFDOMESTIC CLOTHINGMANUFACTURERS
This chapter provides information on the ability of U.S. producers of worsted wool fabrics tomeet the needs of U.S. tailored clothing manufacturers in terms of quantity and clothing marketdemands. It discusses the total size of the domestic market for worsted wool fabrics used in men’stailored clothing and the level of U.S. production capacity and production for such fabrics. Thechapter also examines factors that clothing manufacturers consider most important in their fabricpurchasing decisions.
Based on the available data, the Commission estimated that the U.S. market for worsted woolfabrics suitable for use in men’s tailored clothing was approximately 19 million square meters in 2000(see below). In terms of quantity, U.S. producers of the worsted wool fabrics have sufficient capacityto meet market demand for the fabrics. Based on data from these producers, the Commission estimatesthat U.S. production capacity for the subject fabrics totals approximately *** million square meters.
However, several non-capacity factors, including number and variety of fabric styles, fabricquality and consistency, minimum order sizes, and diversification of supplier sourcing, suggestssignificant increased utilization of U.S. capacity is unlikely by tailored clothing manufacturers. Clothing manufacturers consider these factors to be very important, because they compete in the mid-to-upper price end of the domestic retail market where product quality, fashion, and differentiation arecritical selling determinants. For fine-micron fabrics, ***. The tailored clothing manufacturers claimthey need to purchase fabrics from many mills worldwide to obtain the diversity of fabrics they requireand to spread financial risk, suggesting that they are unlikely to increase significantly their purchasesof fine-micron fabrics from U.S. fabric mills. Although historically the tailored clothing manufacturershave focused their concerns on fine-micron fabric producers, U.S. mills producing coarse-micronfabrics are reported to have difficulty in meeting the needs of the clothing manufacturers in terms of thenumber and variety of fabric styles, fabric quality and consistency, and minimum order sizes.
In Terms of Quantity
The Commission estimated that the size of the domestic market for worsted wool fabrics foruse in men’s tailored clothing was approximately 19 million square meters in 2000 (table 5-1).

5-2
Table 5-1Worsted wool fabrics for use in men’s and boys’ tailored clothing: Estimated size of U.S.market, production minus exports, and imports for consumption for 2000, and TRQ limits for2001
(Million square meters)
ItemFine-micron
fabricCoarse-micron
fabric Total
Size of--
Market . . . . . . . . . . . . . . . . . . . . . . . . . . . . . . . . . . . . . . . . . *** *** 19.0
Production minus exports . . . . . . . . . . . . . . . . . . . . . . . . . . *** *** ***
Imports . . . . . . . . . . . . . . . . . . . . . . . . . . . . . . . . . . . . . . . . *** *** ***
TRQ limits . . . . . . . . . . . . . . . . . . . . . . . . . . . . . . . . . . . . . . 1.5 2.5 (1)
1 Not applicable.
Note.--It is believed that a portion of the domestic and imported fabrics are cut into garment parts in the UnitedStates, sent offshore for assembly, and re-imported under the production-sharing provisions of HTS Chapter98. Imported fabrics used in production-sharing arrangements are not eligible for the temporary dutyreductions under the TRQs and, therefore, are not included in the total size of the market (the estimated 19.0million square meter figure). Therefore, U.S. production minus exports, plus U.S. imports, is greater than thetotal size of the U.S. market.
Source: Data on the U.S. market, production, and imports are estimated by the Commission on the basis ofquestionnaire responses, staff telephone interviews of industry representatives, and U.S. Customs data.
Coarse-micron fabrics accounted for the majority of the market, or an estimated *** million squaremeters, while fine-micron fabrics accounted for about *** million square meters. Based onquestionnaire data, U.S. fabric producers supplied approximately *** million square meters of coarse-micron fabrics and *** million square meters of fine-micron fabrics to U.S. tailored clothingmanufacturers in 2000, some portion of which may have been used in offshore production-sharingoperations. Burlington Industries, the largest U.S. producer of coarse-micron fabrics, appears to havesufficient excess capacity to meet any additional fabric demand by the clothing manufacturers that iscurrently being supplied by importers. Warren Corp., the only U.S. producer to specialize in theproduction of fine-micron fabrics, stated that it has existing capacity to expand production by ***million square meters without incurring any additional investments. (See chapter 3 of this report foradditional information on estimates of the U.S. market for the subject fabrics.)
The Commission estimates that U.S. imports of worsted wool fabrics totaled an estimated ***million square meters in 2000, of which coarse-micron fabrics accounted for an estimated *** percent,and fine-micron fabrics accounted for an estimated *** percent. It is believed that some portion ofthese imports were sent offshore in the form of cut garment parts for assembly under U.S. production-sharing arrangements. Although questionnaire data do not indicate how much of total estimatedimports of worsted wool fabrics entered free of duty, official statistics on the quantity of such importsfor January-May 2001 show that 46 percent of coarse-micron fabrics and 31 percent of fine-micronfabrics for all end uses were duty-free under NAFTA and the United States-Israel Free TradeAgreement.

1 The Commission producer questionnaire asked respondents to provide data on their total capacity andproduction for all worsted wool fabrics and for the subject fabrics separately. 2 Guy Birkhead, Vice President of Operations, Warren Corp., Stafford Springs, CT, written submission tothe Commission, Apr. 17, 2001, and officials of Warren Corp., interview by Commission staff, Mar. 20, 2001. 3 Officials of Burlington Industries, Inc., Clarksville, VA, interview by Commission staff, Mar. 29, 2001. 4 Pier Luigi Loro Piana, Chief Executive Officer, Warren Corp., transcript of hearing, p. 176. 5 Official of Warren Corp., Stafford Springs, CT, interview by Commission staff, Apr. 27, 2001. 6 Official of Warren Corp., interview by Commission staff, Washington, DC, July 2, 2001.
5-3
U.S. production of fine-micron fabrics totaled an estimated *** million square meters, of whichan estimated *** million square meters were available for manufacturers of U.S. men’s tailoredclothing (production minus exports; see chapter 3 for further information). Of the *** U.S. firms thatreported production of fine-micron fabrics, Warren and Burlington accounted for *** percent of theoutput. ***. U.S. production of coarse-micron fabrics totaled an estimated *** million square meters,of which about *** million square meters were available to U.S. clothing manufacturers. It is believedthat at least *** percent of U.S.-made coarse-micron fabrics available to U.S. clothing manufacturersare for men’s tailored clothing sold at retail, while the remainder go to the commercial uniform market(see chapter 3 for further information on uniform fabrics).
U.S. producers of the subject fabrics appear to have considerable unused production capacityin which to expand production without incurring additional investments. According to questionnairedata for 2000, capacity utilization for all worsted wool fabrics averaged *** percent, based onestimates of *** million square meters for total production capacity and *** million square meters foractual production.1 In its questionnaire response, Burlington stated that its total production capacityfor all worsted wool fabrics is *** million square meters and that its actual production of such fabricsin 2000 was *** million square meters, of which *** million square meters consisted of the subjectfabrics. Warren stated that it could increase its production of worsted wool fabrics from the currentlevel of *** million square meters to *** million square meters using existing capacity, and to ***million square meters with minor investments.2
As noted in chapter 3, most U.S. worsted wool fabric producers specialize in the production ofworsted wool fabrics for use in suits and trousers. Burlington stated that it ***.3 Warren stated thatits primary strength is the design, research, and development of fabrics for suits, but that it alsoproduces a line of fabrics for sport coats and trousers.4 Warren stated that its fabrics, ***. Warrenindicated that it ***,5 but that it ***.6 Warren stated that ***.
In Terms of Market Demands for the Clothing
U.S. worsted wool fabric producers and clothing manufacturers both agree that, within a givenprice range, the most important factor a consumer considers in the purchase of tailored clothing is thefabric, including its appearance and feel. Based on information available to the Commission, the threemost critical factors influencing fabric purchase decisions for the majority of clothing manufacturers,regardless of the price points at which they compete, are fabric quality and consistency, fabricavailability and reliability of delivery, and the variety of styles available for purchase. Other importantfactors in the purchasing decisions include fabric price and the ability to buy fabric in flexible lot sizes,

7 Walter B.D. Hickey, Jr., Chairman, Hickey-Freeman Co., and President, TCA, transcript of hearing,p. 10.
5-4
particularly small lots. In response to a question in the Commission purchaser questionnaire that askedrespondents to mark which factors were “very important,” “somewhat important,” or “not important,”the factors deemed to be very important by all or virtually all of the respondents were delivery time andreliability of fabric supply, and fabric quality and consistency (table 5-2). More than one-half of therespondents stated that fabric availability, flexible lead times, minimum order requirements, andavailable styles were very important, while the remaining respondents indicated that these factors weresomewhat important. Less than one-half of the respondents stated that price was very important; threerespondents stated that price was not important. Based on questionnaire responses of the clothingmanufacturers, it appears that fabric mills in Italy and the United Kingdom rank higher than those inthe United States and other countries in nearly all of the factors considered most important to the U.S.tailored clothing manufacturers.
Table 5-2 Number of firms reporting ranking of factors used by men’s tailored clothing manufacturersin making purchasing decisions on worsted wool fabrics
FactorVery
importantSomewhatimportant
Notimportant
Delivery time . . . . . . . . . . . . . . . . . . . . . . . . . . . . . . . . . . . . . . . . . . . 20 0 0
Product quality . . . . . . . . . . . . . . . . . . . . . . . . . . . . . . . . . . . . . . . . . . 20 0 0
Reliability of supply . . . . . . . . . . . . . . . . . . . . . . . . . . . . . . . . . . . . . . 20 0 0
Product consistency . . . . . . . . . . . . . . . . . . . . . . . . . . . . . . . . . . . . . . 19 1 0
Availability . . . . . . . . . . . . . . . . . . . . . . . . . . . . . . . . . . . . . . . . . . . . . 16 4 0
Flexible lead times . . . . . . . . . . . . . . . . . . . . . . . . . . . . . . . . . . . . . . . 14 6 0
Minimum quantity requirements . . . . . . . . . . . . . . . . . . . . . . . . . . . . . 14 6 0
Styles available . . . . . . . . . . . . . . . . . . . . . . . . . . . . . . . . . . . . . . . . . 13 7 0
Lowest price . . . . . . . . . . . . . . . . . . . . . . . . . . . . . . . . . . . . . . . . . . . 9 8 3
Flexibility in lot sizes . . . . . . . . . . . . . . . . . . . . . . . . . . . . . . . . . . . . . 9 8 3
Product range . . . . . . . . . . . . . . . . . . . . . . . . . . . . . . . . . . . . . . . . . . 8 11 0
Custom options . . . . . . . . . . . . . . . . . . . . . . . . . . . . . . . . . . . . . . . . . 7 10 3
Delivery terms . . . . . . . . . . . . . . . . . . . . . . . . . . . . . . . . . . . . . . . . . . 6 13 1
Technical support/service . . . . . . . . . . . . . . . . . . . . . . . . . . . . . . . . . 5 13 2
U.S. transportation costs . . . . . . . . . . . . . . . . . . . . . . . . . . . . . . . . . . 5 7 7
Discounts offered . . . . . . . . . . . . . . . . . . . . . . . . . . . . . . . . . . . . . . . . 4 13 3
Transportation network . . . . . . . . . . . . . . . . . . . . . . . . . . . . . . . . . . . 4 12 4
Source: Compiled from data submitted in response to the Commission purchaser questionnaire.
In terms of fabric types, it appears that fine-micron fabrics come in a wider range of designsthan do coarse-micron fabrics. It also appears that ***. However, the clothing manufacturers statethat they purchase fabrics from a large number of different mills in an effort to obtain a variety ofstyles and to diversify financial risk. According to the Hickey-Freeman Co., it “is probably the largestcustomer of Loro Piana USA [Warren], but we should not as a practical business matter purchasemore than 20 to 25 percent of our fabric needs from one mill.”7 Some clothing manufacturers stated

8 Andrew Kozinn, President, Saint Laurie Ltd., transcript of hearing, p. 23. 9 Walter B.D. Hickey, Jr., Chairman, Hickey-Freeman Co., and President, TCA, transcript of hearing, pp.9, 10, and 41. 10 Pier Luigi Loro Piana, Chief Executive Officer, Warren Corp., transcript of hearing, p. 125.
5-5
***. An incentive exists for clothing manufacturers to purchase foreign fabrics to obtain some measureof exclusivity in the U.S. market (but not the world market) without having to buy the larger minimumlot sizes generally required for an exclusive order.
Coarse-micron fabrics appear to come in fewer styles for suits and sport coats than do fine-micron fabrics (see “styling” below). In addition, the minimum lot size requirements of most U.S.producers of coarse-micron fabrics are much larger than those of many foreign mills. Several clothingmanufacturers stated ***.
Quality and Consistency
Factors affecting fabric quality include any physical defects in the fabric, its tactile qualities(or “hand”), how easily the fabric can be cut and sewn into a garment, and its drape (how the fabrichangs, particularly once it has been made into a garment). Consistency refers to the uniformity of thefabric characteristics, including quality and color, between different batches of fabric. Quality was oneof the reasons given by clothing manufacturers for purchasing imported fabrics over domestic fabrics.
The Commission questionnaire asked the clothing manufacturers to compare domestic andimported worsted wool fabrics in terms of quality, price, and availability. All 16 respondents whoreported purchasing fabrics from Italy stated that Italian fabric was superior in quality to U.S. fabric(table 5-3). Of the countries from which five or more respondents reported fabric purchases, onlyimports of fabric from India were considered by some respondents to be of inferior quality andconsistency to U.S. fabric. For the other countries listed in table 5-3, the respondents were divided onwhether or not U.S. fabric was comparable or inferior to that from the foreign country. For fabricconsistency, U.S. fabric was considered comparable by at least some respondents, though more of therespondents stated that U.S. fabric was inferior to fabric from Italy, the UK, Spain, and Portugal. U.S.clothing manufacturers were also asked if U.S. fabric producers had ever been unable to meet theirneeds or if they had reduced purchases from any domestic producers and if so, why. ***.
Saint Laurie stated that although it does not buy fabrics from U.S. mills, the Warren Corp. isthe only U.S. mill that makes fabric of a quality it would consider purchasing.8 Hickey-Freeman, which makes suits that retail at the upper end of the market, stated that it is the largest customer ofWarren and that Burlington, once a major supplier, does not offer fabrics of sufficient quality for itssuits.9 Warren stated that its fabrics are of a quality and design for use in suits that retail for morethan $1,000 each, but that it also produces some fabrics for suits that sell at retail for as low as $500.10

5-6
Table 5-3Number of firms rating U.S. versus imported fabrics from selected sources for product qualityand product consistency
SourceU.S.
superiorU.S.
comparableU.S.
inferior
Fabric quality
Italy . . . . . . . . . . . . . . . . . . . . . . . . . . . . . . . . . . . . . . . . . . . . . . . . . . 0 0 16
United Kingdom . . . . . . . . . . . . . . . . . . . . . . . . . . . . . . . . . . . . . . . . . 0 1 9
India . . . . . . . . . . . . . . . . . . . . . . . . . . . . . . . . . . . . . . . . . . . . . . . . . 3 3 3
Korea . . . . . . . . . . . . . . . . . . . . . . . . . . . . . . . . . . . . . . . . . . . . . . . . 0 2 6
Spain . . . . . . . . . . . . . . . . . . . . . . . . . . . . . . . . . . . . . . . . . . . . . . . . . 0 2 5
Portugal . . . . . . . . . . . . . . . . . . . . . . . . . . . . . . . . . . . . . . . . . . . . . . . 0 2 4
Mexico . . . . . . . . . . . . . . . . . . . . . . . . . . . . . . . . . . . . . . . . . . . . . . . . 0 2 3
Turkey . . . . . . . . . . . . . . . . . . . . . . . . . . . . . . . . . . . . . . . . . . . . . . . . 0 0 5
Canada . . . . . . . . . . . . . . . . . . . . . . . . . . . . . . . . . . . . . . . . . . . . . . . 0 4 1
Uruguay . . . . . . . . . . . . . . . . . . . . . . . . . . . . . . . . . . . . . . . . . . . . . . . 0 3 2
Chile . . . . . . . . . . . . . . . . . . . . . . . . . . . . . . . . . . . . . . . . . . . . . . . . . 0 2 3
Consistency of fabric
Italy . . . . . . . . . . . . . . . . . . . . . . . . . . . . . . . . . . . . . . . . . . . . . . . . . . 0 5 11
United Kingdom . . . . . . . . . . . . . . . . . . . . . . . . . . . . . . . . . . . . . . . . . 0 2 8
India . . . . . . . . . . . . . . . . . . . . . . . . . . . . . . . . . . . . . . . . . . . . . . . . . 3 5 1
Korea . . . . . . . . . . . . . . . . . . . . . . . . . . . . . . . . . . . . . . . . . . . . . . . . 0 5 3
Spain . . . . . . . . . . . . . . . . . . . . . . . . . . . . . . . . . . . . . . . . . . . . . . . . . 0 2 5
Portugal . . . . . . . . . . . . . . . . . . . . . . . . . . . . . . . . . . . . . . . . . . . . . . . 0 2 4
Mexico . . . . . . . . . . . . . . . . . . . . . . . . . . . . . . . . . . . . . . . . . . . . . . . . 0 4 1
Turkey . . . . . . . . . . . . . . . . . . . . . . . . . . . . . . . . . . . . . . . . . . . . . . . . 0 3 2
Canada . . . . . . . . . . . . . . . . . . . . . . . . . . . . . . . . . . . . . . . . . . . . . . . 0 4 1
Uruguay . . . . . . . . . . . . . . . . . . . . . . . . . . . . . . . . . . . . . . . . . . . . . . . 0 5 0
Chile . . . . . . . . . . . . . . . . . . . . . . . . . . . . . . . . . . . . . . . . . . . . . . . . . 0 5 0
Source: Compiled from data submitted in response to the Commission purchaser questionnaire.
Availability of Supply and Reliability of Delivery
Production of the subject fabrics generally occurs on a made-to-order basis. Clothingmanufacturers usually place orders for fabrics on a seasonal basis, based on their customers’ clothingpurchase orders and, to some extent, their own forecasts. Clothing manufacturers typically placefabric orders 4 to 6 months prior to fabric delivery. For some custom-designed fabrics, clothingmanufacturers will begin to work with fabric producers as much as 9 months prior to fabric deliveryand 18 months in advance of the clothing selling season. Because of these long lead times, reliability offabric supply is of great importance to clothing manufacturers. Also important is the ability to reorderand receive fabrics during the selling season on short notice. Clothing manufacturers report that theypurchase fabrics from many different suppliers worldwide in order to diversify financial risk and toobtain the widest possible assortment of fabric styles.
11 Top-dyed fabrics are fabrics in which the wool top (prior to spinning) is dyed, package-dyed fabrics arefabrics for which the yarn is dyed, and piece-dyed fabrics are fabrics in which the fabric is dyed. Top-dyed andpackage-dyed fabrics are often “fancy” fabrics in that they contain more than one color yarn. Piece-dyedfabrics are usually solid in color. (Some variation in color can be achieved in piece-dyed fabrics by usingdifferent fiber yarns that do not dye uniformly.) 12 Pier Luigi Loro Piana, Chief Executive Officer, Warren Corp., transcript of hearing, p. 136.
5-7
The majority of the clothing manufacturers responding to the Commission questionnaire statedthat compared with domestic fabrics, the reliability of supply was higher for imported fabrics fromItaly, the UK, and Portugal, but comparable to imported fabrics from other countries (table 5-4). Most respondents indicated that delivery time for domestic fabrics is comparable to that forimported fabrics. The one exception is India, which rated lower (table 5-5). For flexible lead times,including the ability to reorder fabric during the selling season, roughly one-half of the respondentsstated that U.S. producers were comparable with mills in Italy and the UK, while the other half statedthat U.S. producers had less flexible lead times. For the other countries listed, most respondents statedthat U.S. mills had lead times that were comparable to mills in the foreign countries. In terms of fabricavailability, 13 of 16 respondents who were importing from Italy stated that fabric mills in Italy weresuperior to U.S. mills, and 6 of 10 respondents importing from the UK stated that the UK mills weresuperior. ***.
U.S. fabric producers’ standard lead times from order placement to fabric delivery rangebetween 5 and 16 weeks, depending on the fabric style and whether or not the style is a custom order. Burlington stated that its standard lead time is ***. ***.11 Victor Forstmann’s reported standard leadtime is ***, while Warren’s is ***. In its questionnaire response, Warren stated it makes some fabrics***. It also offers overnight delivery of single fabric pieces of 50 linear meters (55 square meters) andsuit-cut lengths of fabric from its warehouse to manufacturers and individual tailors.12
Another factor relating to flexible lead times, particularly the ability of U.S. fabric producersto respond quickly to fabric reorders, is the inventory of yarns on hand to process (weave) into fabrics. In their questionnaire responses, ***. These firms said the lead time to produce or purchase yarnsranges from ***. ***.
In testimony before the Commission, Hartz & Co. stated that it buys a “meager amount offabric” from Warren. In addition, Hartz stated that it buys “some gabardine fabrics from Burlington,the latter mostly produced outside the United States.” Hartz stated that it “worked with Burlington formany years to design unique fabric patterns--literally hundreds of fabric patterns per year” and thatBurlington was its largest fabric supplier more than 2 years ago. In February 1999, however, Hartzstated that it received written notice from Burlington that it was cancelling deliveries of fabrics alreadyspecified for Spring 2000, including most of the fabrics designed by Hartz. Hartz stated thecancellation created “an enormous disruption for [its] business and [its] customers.” According toHartz, Burlington has not resumed production of much of its fancy fabrics. Instead, Hartz said itreceived a letter from Burlington stating that “very few companies, including Burlington, can operatesuccessfully on a Heinz 57 varieties basis where they try to be all things to all people.” Hartz still

13 The information in this paragraph is based on the following sources: Howard Goldstein, ChiefFinancial Officer, Hartz & Co., transcript of hearing, pp. 18-19 and 80-81; and Commission staff interviewswith officials of Hartz & Co., New York, NY, Mar. 21, 2001, and Broadway, VA, Apr. 5, 2001.
5-8
purchases some solid-color gabardine fabrics from Burlington, ***, but purchases its fancy fabricsfrom overseas.13
Table 5-4Number of firms rating U.S. versus imported fabrics from selected sources for availability offabrics and reliability of supply
SourceU.S.
superiorU.S.
comparableU.S.
inferior
Availability of fabrics
Italy . . . . . . . . . . . . . . . . . . . . . . . . . . . . . . . . . . . . . . . . . . . . . . . . . . 0 3 13
United Kingdom . . . . . . . . . . . . . . . . . . . . . . . . . . . . . . . . . . . . . . . . . 0 4 6
India . . . . . . . . . . . . . . . . . . . . . . . . . . . . . . . . . . . . . . . . . . . . . . . . . 2 4 3
Korea . . . . . . . . . . . . . . . . . . . . . . . . . . . . . . . . . . . . . . . . . . . . . . . . 0 3 5
Spain . . . . . . . . . . . . . . . . . . . . . . . . . . . . . . . . . . . . . . . . . . . . . . . . . 0 3 4
Portugal . . . . . . . . . . . . . . . . . . . . . . . . . . . . . . . . . . . . . . . . . . . . . . . 0 4 2
Mexico . . . . . . . . . . . . . . . . . . . . . . . . . . . . . . . . . . . . . . . . . . . . . . . . 0 3 2
Turkey . . . . . . . . . . . . . . . . . . . . . . . . . . . . . . . . . . . . . . . . . . . . . . . . 0 1 4
Canada . . . . . . . . . . . . . . . . . . . . . . . . . . . . . . . . . . . . . . . . . . . . . . . 0 4 1
Uruguay . . . . . . . . . . . . . . . . . . . . . . . . . . . . . . . . . . . . . . . . . . . . . . . 0 1 4
Chile . . . . . . . . . . . . . . . . . . . . . . . . . . . . . . . . . . . . . . . . . . . . . . . . . 0 0 0
Reliability of supply
Italy . . . . . . . . . . . . . . . . . . . . . . . . . . . . . . . . . . . . . . . . . . . . . . . . . . 0 5 11
United Kingdom . . . . . . . . . . . . . . . . . . . . . . . . . . . . . . . . . . . . . . . . . 0 2 8
India . . . . . . . . . . . . . . . . . . . . . . . . . . . . . . . . . . . . . . . . . . . . . . . . . 3 4 2
Korea . . . . . . . . . . . . . . . . . . . . . . . . . . . . . . . . . . . . . . . . . . . . . . . . 1 6 1
Spain . . . . . . . . . . . . . . . . . . . . . . . . . . . . . . . . . . . . . . . . . . . . . . . . . 0 5 2
Portugal . . . . . . . . . . . . . . . . . . . . . . . . . . . . . . . . . . . . . . . . . . . . . . . 0 2 4
Mexico . . . . . . . . . . . . . . . . . . . . . . . . . . . . . . . . . . . . . . . . . . . . . . . . 0 5 2
Turkey . . . . . . . . . . . . . . . . . . . . . . . . . . . . . . . . . . . . . . . . . . . . . . . . 0 3 1
Canada . . . . . . . . . . . . . . . . . . . . . . . . . . . . . . . . . . . . . . . . . . . . . . . 0 4 2
Uruguay . . . . . . . . . . . . . . . . . . . . . . . . . . . . . . . . . . . . . . . . . . . . . . . 0 3 2
Chile . . . . . . . . . . . . . . . . . . . . . . . . . . . . . . . . . . . . . . . . . . . . . . . . . 0 3 0
Source: Compiled from data submitted in response to the Commission purchaser questionnaire.

14 Officials of Hartz & Co., Broadway, VA, interview by Commission staff, Apr. 5, 2001.
5-9
Table 5-5Number of firms rating U.S. versus imported fabrics from selected sources for delivery timeand flexible lead time
SourceU.S.
superiorU.S.
comparableU.S.
inferior
Delivery time
Italy . . . . . . . . . . . . . . . . . . . . . . . . . . . . . . . . . . . . . . . . . . . . . . . . . 0 14 2
United Kingdom . . . . . . . . . . . . . . . . . . . . . . . . . . . . . . . . . . . . . . . . 0 9 1
India . . . . . . . . . . . . . . . . . . . . . . . . . . . . . . . . . . . . . . . . . . . . . . . . . 4 5 0
Korea . . . . . . . . . . . . . . . . . . . . . . . . . . . . . . . . . . . . . . . . . . . . . . . . 2 5 1
Spain . . . . . . . . . . . . . . . . . . . . . . . . . . . . . . . . . . . . . . . . . . . . . . . . 0 5 2
Portugal . . . . . . . . . . . . . . . . . . . . . . . . . . . . . . . . . . . . . . . . . . . . . . 0 4 2
Mexico . . . . . . . . . . . . . . . . . . . . . . . . . . . . . . . . . . . . . . . . . . . . . . . 2 3 0
Turkey . . . . . . . . . . . . . . . . . . . . . . . . . . . . . . . . . . . . . . . . . . . . . . . 0 5 0
Canada . . . . . . . . . . . . . . . . . . . . . . . . . . . . . . . . . . . . . . . . . . . . . . . 0 4 1
Uruguay . . . . . . . . . . . . . . . . . . . . . . . . . . . . . . . . . . . . . . . . . . . . . . 0 5 0
Chile . . . . . . . . . . . . . . . . . . . . . . . . . . . . . . . . . . . . . . . . . . . . . . . . . 0 0 0
Flexible lead time
Italy . . . . . . . . . . . . . . . . . . . . . . . . . . . . . . . . . . . . . . . . . . . . . . . . . 0 9 7
United Kingdom . . . . . . . . . . . . . . . . . . . . . . . . . . . . . . . . . . . . . . . . 0 5 5
India . . . . . . . . . . . . . . . . . . . . . . . . . . . . . . . . . . . . . . . . . . . . . . . . . 3 6 0
Korea . . . . . . . . . . . . . . . . . . . . . . . . . . . . . . . . . . . . . . . . . . . . . . . . 1 6 1
Spain . . . . . . . . . . . . . . . . . . . . . . . . . . . . . . . . . . . . . . . . . . . . . . . . 0 5 2
Portugal . . . . . . . . . . . . . . . . . . . . . . . . . . . . . . . . . . . . . . . . . . . . . . 0 4 2
Mexico . . . . . . . . . . . . . . . . . . . . . . . . . . . . . . . . . . . . . . . . . . . . . . . 0 5 0
Turkey . . . . . . . . . . . . . . . . . . . . . . . . . . . . . . . . . . . . . . . . . . . . . . . 0 3 2
Canada . . . . . . . . . . . . . . . . . . . . . . . . . . . . . . . . . . . . . . . . . . . . . . . 0 4 1
Uruguay . . . . . . . . . . . . . . . . . . . . . . . . . . . . . . . . . . . . . . . . . . . . . . 0 5 0
Chile . . . . . . . . . . . . . . . . . . . . . . . . . . . . . . . . . . . . . . . . . . . . . . . . . 0 0 0
Source: Compiled from data submitted in response to the Commission purchaser questionnaire.
Styles
U.S. clothing manufacturers purchase fabrics in hundreds of different styles for each sellingseason (fall and spring). Hartz, for example, stated that it currently buys roughly *** different stylefabrics per season.14 The number of different fabric styles purchased by the domestic industry as awhole is likely to be well into the thousands, as manufacturers try to differentiate their clothing fromthose of their competitors. Given that U.S. clothing manufacturers compete in the middle to higher endof the domestic market, the manufacturers try to avoid selling clothing made with the same style fabricto more than one retailer. Clothing manufacturers may also switch fabric suppliers if the variety ofdesigns offered by a supplier does not change significantly from one season to the next.

15 Harry G. Barto, President, Burlington Performance Wear, Burlington Industries, Inc., Greensboro, NC,written submission to the Commission, June 15, 2001, and officials of Burlington Industries, Clarksville, VA,interview by Commission staff, Mar. 29, 2001. 16 Testimony of Jim Leonard, Jim Leonard and Associates (former employee of Burlington Industries, Inc.,and now a consultant on international trade issues), transcript of hearing, p. 134. 17 Information in this paragraph is from Pier Luigi Loro Piana, Chief Executive Officer, Warren Corp.,transcript of hearing, pp. 125, 133, 169, and 176; response to the Commission questionnaire; and officials ofWarren Corp., interview by Commission staff, Washington, DC, July 2, 2001. 18 Information in this paragraph is based entirely on responses to the Commission producer questionnaire.
5-10
Although the total quantity of fabric used in tailored clothing made domestically has declinedin the last 5 years, the variety of fabric styles required reportedly has increased. Clothingmanufacturers stated that they need to offer retailers a greater variety of different fabric styles in aneffort to compete with imported garments from Canada, Italy, and other countries.
Burlington stated in its questionnaire response that it offers *** different styles of fabrics aspart of its standard product offering, of which *** are the fine-micron fabrics. Each fabric style differsin terms of the type and number of yarns used in the manufacture of the fabric, and each fabric stylecan have numerous patterns and colors. Burlington stated that it offers more than 1,000 differentcolored patterns for its customers to view and use to make buying decisions and that it makes fabrics***.15 The firm produces worsted wool fabrics not only for suits (including tuxedos), sport coats, andtrousers, but also for tailored commercial uniforms, such as for police, airline pilots, and school bands. Burlington stated that although it probably does not “make everything that companies want” in termsof quality, style, price, or variety, it has the capability to produce a significant share of what the marketdemands.16
Warren stated that it offered *** different styles of fabrics in 1999 and *** styles in 2000 and2001, and that it ***.17 Warren also stated that it offers fine-micron fabrics in more than 800 differentdesigns in any given year. Each design is offered in a variety of different colors. In addition, Warrensaid it ***. Warren stated that because it produces fabrics primarily for the U.S. market, ***. According to Warren, it can offer more than 70 percent of the fabrics needed by its customers and hasthe capability to produce the remaining 30 percent, but would not do so for business reasons. Most ofWarren’s worsted wool fabrics have an average fiber diameter of 18 microns or less. These fine-micron fabrics accounted for *** styles in 1999 and *** styles in 2000 and 2001. Warren alsoproduces some coarse-micron fabrics (up to 20 microns). The firm produces ***.
The fabric offerings of Burlington and particularly Warren differ from those of CTI and VictorForstmann.18 CTI offers more than *** standard product offerings each season and makes ***. In itsquestionnaire response, Victor Forstmann stated that it offers *** styles of worsted wool fabrics formenswear, of which ***. Victor Forstmann ***. Custom-designed fabrics accounted for *** percentof Victor Forstmann’s sales of worsted wool fabrics in 1999. In 2000, Victor Forstmann ***. Thefirm stated that some of its fabrics ***.
All U.S. clothing manufacturers who testified at the Commission hearing contended that U.S.mills do not produce the variety of fabric styles required for them to be competitive. According to theTailored Clothing Association (TCA), “the capacity to survive as an individual company and as an

19 David A. Starr, Counsel to the TCA, written submission to the Commission, May 21, 2001. 20 Walter B.D. Hickey, Jr., Chairman, Hickey-Freeman Co., and President, TCA, transcript of hearing,p. 41. 21 Information in this paragraph on Warren, unless otherwise noted, is based on its questionnaireresponse; testimony of Pier Luigi Loro Piana, Chief Executive Officer, transcript of hearing, p. 136;Commission staff interviews with company officials, Stafford Springs, CT, Mar. 20, 2001, and Washington,DC, July 2, 2001; and Commission staff telephone interview with company officials, July 3, 2001.
5-11
industry depends on the ability to purchase fabrics from scores of mills in scores of countries.”19 Italso appears that the clothing manufacturers use many different sources worldwide not only to get alarge variety of fabrics, but also to get some measure of exclusivity in the U.S. market without havingto buy the larger minimum lot sizes required to guarantee exclusivity. For example, Saint Laurie statedthat if it were to buy domestic fabrics, it would be “subject to a large minimum order requirement andwould be offered the same fabrics” sold to its competitors. Saint Laurie stated that by purchasingforeign fabrics, the firm is able to buy as little as roughly 10 linear meters (compared with *** linearmeters required by Warren for an exclusive order), and offer its customers a wider range of fabricsfrom which to choose. Similarly, Hickey-Freeman stated that it “cannot buy the same stripe, the sameplaid suit [fabric] that Oxxford does, because we’re dealing with the same retailers.”20
Based on questionnaire responses, U.S. clothing manufacturers generally consider importedfabrics made in Italy and the UK to be superior to domestic fabrics in terms of available fabric styles,product range, and custom options (table 5-6). The clothing manufacturers consider imported fabricsmade in Canada and Mexico to be the most comparable to domestic fabrics in terms of these samevariables, although they consider the Mexican fabrics to be superior to domestic fabrics in terms ofavailable fabric styles. India was the only country listed for which respondents stated they thoughtdomestic fabrics were superior for each of these variables. ***. While questionnaire respondents saidmost fabric styles are available from multiple sources, a few cited specific examples of styles that arenot available from multiple sources (see chapter 3 for further information).
Flexible Lot Sizes and Price
Clothing manufacturers consider a mill’s willingness to offer flexible lot sizes, particularly asthey relate to minimum order size, and competitive prices to be important factors in their fabricsourcing decisions. Almost all questionnaire respondents rate fabric mills in Italy and the UK higherthan U.S. mills in terms of flexibility in lot size and minimum order requirements (table 5-7). Foreignmills that sell fabrics to clothing manufacturers worldwide can split a production lot size betweenseveral customers who are based in different markets, and thereby offer their customers some measureof exclusivity in their home market. At least one-half of the respondents consider mills in Mexico,Turkey, Canada, and Korea to be comparable with U.S. mills in terms of lot sizes. For other countries,the majority of the respondents indicated that India, Spain, Portugal, Uruguay, and Chile all offer moreflexible and smaller lot sizes than U.S. producers.
***.21 *** Warren stated that it ***. Warren stated in testimony before the Commission thatit has supplied one piece (55 square meters) on several occasions and has sold a “big” quantity

5-12
Table 5-6Number of firms rating U.S. versus imported fabrics from selected sources for stylesavailable, custom options, and product range
SourceU.S.
superiorU.S.
comparableU.S.
inferior
Styles available
Italy . . . . . . . . . . . . . . . . . . . . . . . . . . . . . . . . . . . . . . . . . . . . . . . . . 0 2 15
United Kingdom . . . . . . . . . . . . . . . . . . . . . . . . . . . . . . . . . . . . . . . . 0 1 9
India . . . . . . . . . . . . . . . . . . . . . . . . . . . . . . . . . . . . . . . . . . . . . . . . 2 4 3
Korea . . . . . . . . . . . . . . . . . . . . . . . . . . . . . . . . . . . . . . . . . . . . . . . 0 3 5
Spain . . . . . . . . . . . . . . . . . . . . . . . . . . . . . . . . . . . . . . . . . . . . . . . . 0 1 7
Portugal . . . . . . . . . . . . . . . . . . . . . . . . . . . . . . . . . . . . . . . . . . . . . . 0 2 4
Mexico . . . . . . . . . . . . . . . . . . . . . . . . . . . . . . . . . . . . . . . . . . . . . . . 0 2 4
Turkey . . . . . . . . . . . . . . . . . . . . . . . . . . . . . . . . . . . . . . . . . . . . . . . 0 2 4
Canada . . . . . . . . . . . . . . . . . . . . . . . . . . . . . . . . . . . . . . . . . . . . . . 0 4 1
Uruguay . . . . . . . . . . . . . . . . . . . . . . . . . . . . . . . . . . . . . . . . . . . . . . 0 1 4
Chile . . . . . . . . . . . . . . . . . . . . . . . . . . . . . . . . . . . . . . . . . . . . . . . . 0 1 4
Custom options
Italy . . . . . . . . . . . . . . . . . . . . . . . . . . . . . . . . . . . . . . . . . . . . . . . . . 0 3 14
United Kingdom . . . . . . . . . . . . . . . . . . . . . . . . . . . . . . . . . . . . . . . . 1 1 8
India . . . . . . . . . . . . . . . . . . . . . . . . . . . . . . . . . . . . . . . . . . . . . . . . 1 4 4
Korea . . . . . . . . . . . . . . . . . . . . . . . . . . . . . . . . . . . . . . . . . . . . . . . 0 3 5
Spain . . . . . . . . . . . . . . . . . . . . . . . . . . . . . . . . . . . . . . . . . . . . . . . . 0 6 2
Portugal . . . . . . . . . . . . . . . . . . . . . . . . . . . . . . . . . . . . . . . . . . . . . . 0 2 4
Mexico . . . . . . . . . . . . . . . . . . . . . . . . . . . . . . . . . . . . . . . . . . . . . . . 0 4 2
Turkey . . . . . . . . . . . . . . . . . . . . . . . . . . . . . . . . . . . . . . . . . . . . . . . 0 3 3
Canada . . . . . . . . . . . . . . . . . . . . . . . . . . . . . . . . . . . . . . . . . . . . . . 0 4 1
Uruguay . . . . . . . . . . . . . . . . . . . . . . . . . . . . . . . . . . . . . . . . . . . . . . 0 4 1
Chile . . . . . . . . . . . . . . . . . . . . . . . . . . . . . . . . . . . . . . . . . . . . . . . . 0 5 0
Product range
Italy . . . . . . . . . . . . . . . . . . . . . . . . . . . . . . . . . . . . . . . . . . . . . . . . . 0 2 15
United Kingdom . . . . . . . . . . . . . . . . . . . . . . . . . . . . . . . . . . . . . . . . 0 1 9
India . . . . . . . . . . . . . . . . . . . . . . . . . . . . . . . . . . . . . . . . . . . . . . . . 3 2 4
Korea . . . . . . . . . . . . . . . . . . . . . . . . . . . . . . . . . . . . . . . . . . . . . . . 0 3 5
Spain . . . . . . . . . . . . . . . . . . . . . . . . . . . . . . . . . . . . . . . . . . . . . . . . 0 1 7
Portugal . . . . . . . . . . . . . . . . . . . . . . . . . . . . . . . . . . . . . . . . . . . . . . 0 2 4
Mexico . . . . . . . . . . . . . . . . . . . . . . . . . . . . . . . . . . . . . . . . . . . . . . . 0 3 3
Turkey . . . . . . . . . . . . . . . . . . . . . . . . . . . . . . . . . . . . . . . . . . . . . . . 0 1 5
Canada . . . . . . . . . . . . . . . . . . . . . . . . . . . . . . . . . . . . . . . . . . . . . . 0 4 1
Uruguay . . . . . . . . . . . . . . . . . . . . . . . . . . . . . . . . . . . . . . . . . . . . . . 0 1 4
Chile . . . . . . . . . . . . . . . . . . . . . . . . . . . . . . . . . . . . . . . . . . . . . . . . 0 1 4
Source: Compiled from data submitted in response to the Commission purchaser questionnaire.

22 Burlington’s short run facility, which was closed in 1996, made *** linear yards (*** square meters). Burlington Performance Wear, written submission to the Commission, June 15, 2001, p. 3.
5-13
Table 5-7Number of firms rating U.S. versus imported fabrics from selected sources for flexibility in lotsize and minimum quantity
SourceU.S.
superiorU.S.
comparableU.S.
inferior
Flexibility in lot size
Italy . . . . . . . . . . . . . . . . . . . . . . . . . . . . . . . . . . . . . . . . . . . . . . . . 0 1 14
United Kingdom . . . . . . . . . . . . . . . . . . . . . . . . . . . . . . . . . . . . . . . 0 2 8
India . . . . . . . . . . . . . . . . . . . . . . . . . . . . . . . . . . . . . . . . . . . . . . . . 0 3 6
Korea . . . . . . . . . . . . . . . . . . . . . . . . . . . . . . . . . . . . . . . . . . . . . . . 0 4 4
Spain . . . . . . . . . . . . . . . . . . . . . . . . . . . . . . . . . . . . . . . . . . . . . . . 0 2 5
Portugal . . . . . . . . . . . . . . . . . . . . . . . . . . . . . . . . . . . . . . . . . . . . . 0 2 4
Mexico . . . . . . . . . . . . . . . . . . . . . . . . . . . . . . . . . . . . . . . . . . . . . . 0 3 2
Turkey . . . . . . . . . . . . . . . . . . . . . . . . . . . . . . . . . . . . . . . . . . . . . . 0 4 1
Canada . . . . . . . . . . . . . . . . . . . . . . . . . . . . . . . . . . . . . . . . . . . . . . 0 4 1
Uruguay . . . . . . . . . . . . . . . . . . . . . . . . . . . . . . . . . . . . . . . . . . . . . 0 2 3
Chile . . . . . . . . . . . . . . . . . . . . . . . . . . . . . . . . . . . . . . . . . . . . . . . . 0 2 3
Minimum quantity
Italy . . . . . . . . . . . . . . . . . . . . . . . . . . . . . . . . . . . . . . . . . . . . . . . . 0 0 16
United Kingdom . . . . . . . . . . . . . . . . . . . . . . . . . . . . . . . . . . . . . . . 0 1 9
India . . . . . . . . . . . . . . . . . . . . . . . . . . . . . . . . . . . . . . . . . . . . . . . . 0 3 6
Korea . . . . . . . . . . . . . . . . . . . . . . . . . . . . . . . . . . . . . . . . . . . . . . . 0 4 4
Spain . . . . . . . . . . . . . . . . . . . . . . . . . . . . . . . . . . . . . . . . . . . . . . . 0 1 6
Portugal . . . . . . . . . . . . . . . . . . . . . . . . . . . . . . . . . . . . . . . . . . . . . 0 2 4
Mexico . . . . . . . . . . . . . . . . . . . . . . . . . . . . . . . . . . . . . . . . . . . . . . 0 3 2
Turkey . . . . . . . . . . . . . . . . . . . . . . . . . . . . . . . . . . . . . . . . . . . . . . 0 4 1
Canada . . . . . . . . . . . . . . . . . . . . . . . . . . . . . . . . . . . . . . . . . . . . . . 0 4 1
Uruguay . . . . . . . . . . . . . . . . . . . . . . . . . . . . . . . . . . . . . . . . . . . . . 0 2 3
Chile . . . . . . . . . . . . . . . . . . . . . . . . . . . . . . . . . . . . . . . . . . . . . . . . 0 2 3
Source: Compiled from data submitted in response to the Commission purchaser questionnaire.
of these fabrics to Hickey-Freeman. Warren also said it will sell fabrics in 3-meter lengths from itsstock program for custom tailoring. Warren stated that it ***.
Other U.S. fabric producers have minimum lot sizes ***. Burlington requires a lot size of ***linear yards (*** square meters) for standard orders ***.22 CTI reported having minimum lot sizes forits standard offerings of *** linear yards (*** square meters) ***, while Victor Forstmann has aminimum lot size of *** linear yards (*** square meters) *** (see chapter 4 for further information).

23 According to TCA, Burlington’s “piece” is 100 yards in length. David A. Starr, Counsel to TCA,written submission to the Commission, June 7, 2001. 24 Crittenden Rawlings, President and Chief Executive Officer, Oxxford Clothes, transcript of hearing, pp.14, 42-43, and 71-72. Converted from 1,200 yards and 50 to 60 yards, respectively. 25 Andrew Kozinn, President, Saint Laurie Ltd., transcript of hearing, p. 83. Converted from 35 linearyards.
5-14
U.S. clothing manufacturers stated that they are sometimes able to buy fabrics in much smallerminimum lot sizes from Italy and the UK at a standard price. Oxxford Clothes stated that it no longerbuys fabrics from Burlington, partly because it had to buy at least 8 pieces (1,083 square meters)23 ofthe same fabric, while it could buy as little as one piece (70 to 84 square meters) from Italian and UKmills, and that although it is able to buy one-piece quantities from 100 European mills, it cannot buythem from any U.S. mill.24 Saint Laurie stated that for some fabrics, it sometimes orders as little asone-half piece (49 square meters) from foreign mills.25
Regarding prices, 9 of the 17 clothing-manufacturer respondents indicated that the lowestprices offered by producers in Italy and the United States were comparable, while 7 stated that Italy’sprices were lower and 1 indicated that Italy’s prices were higher (table 5-8). For discounts, theresponses were similarly mixed, with roughly one-half of the respondents stating that the discounts ofmills in Italy and the United States were similar. In comparison with the UK, 5 of the 10 respondentsindicated that U.S. mills offer the lowest price, while the other 5 stated that the prices are comparable. Most respondents consider Mexican mills to be comparable with U.S. mills in terms of lowest pricesand discounts offered, while most respondents consider Korean mills to be superior to U.S. mills for thesame price factors.
***.
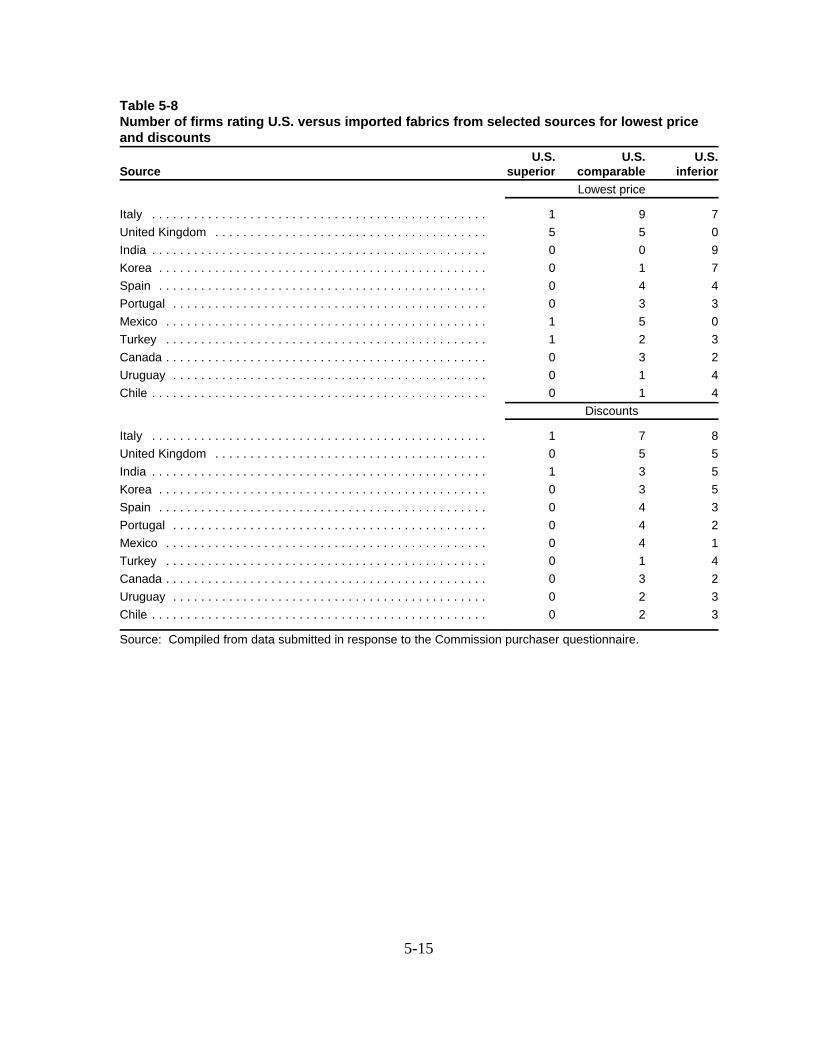
5-15
Table 5-8Number of firms rating U.S. versus imported fabrics from selected sources for lowest priceand discounts
SourceU.S.
superiorU.S.
comparableU.S.
inferior
Lowest price
Italy . . . . . . . . . . . . . . . . . . . . . . . . . . . . . . . . . . . . . . . . . . . . . . . . 1 9 7
United Kingdom . . . . . . . . . . . . . . . . . . . . . . . . . . . . . . . . . . . . . . . 5 5 0
India . . . . . . . . . . . . . . . . . . . . . . . . . . . . . . . . . . . . . . . . . . . . . . . . 0 0 9
Korea . . . . . . . . . . . . . . . . . . . . . . . . . . . . . . . . . . . . . . . . . . . . . . . 0 1 7
Spain . . . . . . . . . . . . . . . . . . . . . . . . . . . . . . . . . . . . . . . . . . . . . . . 0 4 4
Portugal . . . . . . . . . . . . . . . . . . . . . . . . . . . . . . . . . . . . . . . . . . . . . 0 3 3
Mexico . . . . . . . . . . . . . . . . . . . . . . . . . . . . . . . . . . . . . . . . . . . . . . 1 5 0
Turkey . . . . . . . . . . . . . . . . . . . . . . . . . . . . . . . . . . . . . . . . . . . . . . 1 2 3
Canada . . . . . . . . . . . . . . . . . . . . . . . . . . . . . . . . . . . . . . . . . . . . . . 0 3 2
Uruguay . . . . . . . . . . . . . . . . . . . . . . . . . . . . . . . . . . . . . . . . . . . . . 0 1 4
Chile . . . . . . . . . . . . . . . . . . . . . . . . . . . . . . . . . . . . . . . . . . . . . . . . 0 1 4
Discounts
Italy . . . . . . . . . . . . . . . . . . . . . . . . . . . . . . . . . . . . . . . . . . . . . . . . 1 7 8
United Kingdom . . . . . . . . . . . . . . . . . . . . . . . . . . . . . . . . . . . . . . . 0 5 5
India . . . . . . . . . . . . . . . . . . . . . . . . . . . . . . . . . . . . . . . . . . . . . . . . 1 3 5
Korea . . . . . . . . . . . . . . . . . . . . . . . . . . . . . . . . . . . . . . . . . . . . . . . 0 3 5
Spain . . . . . . . . . . . . . . . . . . . . . . . . . . . . . . . . . . . . . . . . . . . . . . . 0 4 3
Portugal . . . . . . . . . . . . . . . . . . . . . . . . . . . . . . . . . . . . . . . . . . . . . 0 4 2
Mexico . . . . . . . . . . . . . . . . . . . . . . . . . . . . . . . . . . . . . . . . . . . . . . 0 4 1
Turkey . . . . . . . . . . . . . . . . . . . . . . . . . . . . . . . . . . . . . . . . . . . . . . 0 1 4
Canada . . . . . . . . . . . . . . . . . . . . . . . . . . . . . . . . . . . . . . . . . . . . . . 0 3 2
Uruguay . . . . . . . . . . . . . . . . . . . . . . . . . . . . . . . . . . . . . . . . . . . . . 0 2 3
Chile . . . . . . . . . . . . . . . . . . . . . . . . . . . . . . . . . . . . . . . . . . . . . . . . 0 2 3
Source: Compiled from data submitted in response to the Commission purchaser questionnaire.

1 The temporary duty reductions are retroactive–that is, they apply to imports of worsted wool fabricsentered, or withdrawn from warehouse for consumption, on or after January 1, 2001. On July 10, 2001, theU.S. Department of Commerce issued its “Notice of Allocation of Tariff Rate Quotas on the Import of CertainWorsted Wool Fabrics for Calendar Year 2001,” published in the Federal Register of July 31, 2001 (66 F.R.39490). As required by Title V of the Trade and Development Act of 2000, the TRQs were allocated to firmswhich cut and sew men’s worsted wool tailored clothing in the United States and which apply for an allocationbased on the amount of such suits cut and sewn during the prior calendar year. 2 Harry G. Barto, President, Burlington Performance Wear, written submission to the Commission, June15, 2001, p. 3. 3 Guy Birkhead, Vice President of Operations, Warren Corp., written submission to the Commission, Apr.17, 2001.
6-1
CHAPTER 6LOST SALES AND REVENUES
This chapter examines allegations of lost sales and revenues by (1) U.S. producers of worstedwool fabrics, due to imports of such fabrics benefiting from temporary duty reductions under theTRQs, and (2) U.S. tailored clothing manufacturers, due to their inability to purchase adequatesupplies of such fabrics on a cost competitive basis.
Lost Sales and Revenues by U.S. Producers of WorstedWool Fabrics
The Commission questionnaire for U.S. producers of worsted wool fabrics requested that theyprovide information on any lost sales and revenues resulting from the temporary duty reductions underthe TRQs for worsted wool fabrics. The TRQ in-quota quantities for calendar year 2001 wereallocated among U.S. tailored clothing manufacturers in July 2001,1 allowing each such manufacturerto import that share of the total TRQ quantity at reduced rates of duty while paying normal-trade-relations rates of duty on other imports. Because this action was taken at mid-year, *** of the fourU.S. fabric producers responding to the questionnaire stated it was too early to determine if they hadlost sales due to the temporary duty reductions, but that ***. ***.
Burlington Industries indicated that it ***. The firm stated that its business would be severelyaffected by any increase in TRQ levels because the TRQs are *** and that the TRQs are unmanageablebecause they take a great investment in equipment, people, and time to test fabrics and monitorimports.2
Victor Forstmann, Inc. stated it ***.
Warren Corp. stated it ***. Warren Corp. stated the temporary duty reductions for the TRQ-covered fabrics have resulted in significant downward price pressure on U.S. mills and the firm has lostprofits as a result of aggressively adjusting its prices to maintain sales.3 Warren Corp. claimed all

4 Pier Luigi Loro Piana, Chief Executive Officer, Warren Corp., transcript of hearing, pp. 130-131, andAnne M. Costa, Accounting Supervisor, Warren Corp., written submission to the Commission, June 8, 2001. 5 Anne M. Costa, Accounting Supervisor, Warren Corp., written submission to the Commission, June 8,2001. 6 David A. Starr, Counsel to TCA, written submission to the Commission, June 7, 2001, pp. 8-9. 7 Walter B.D. Hickey, Jr., Chairman, Hickey-Freeman Co., transcript of hearing, p. 108. 8 Because most lost sales and revenues reported by clothing manufacturers were general in nature,Commission staff did not attempt to verify any specific allegations. *** 9 Walter B.D. Hickey, Jr., Chairman, Hickey-Freeman Co., Andrew Kozinn, President, Saint Laurie Ltd.,Crittenden Rawlings, President and Chief Executive Officer, Oxxford Clothes, and Howard Goldstein, ChiefFinancial Officer, Hartz & Co., transcript of hearing, pp. 105-107.
6-2
additional imports resulting from any increase in the TRQ in-quota quantities for finer fabrics willcome at its expense and duties are necessary to compensate for the strength of the dollar and the highcost of U.S. labor.4 Warren Corp. also stated that if the TRQ in-quota quantity for fine-micron fabricsis increased, the firm ***.5 According to U.S. clothing manufacturers, Warren Corp. would notnecessarily lose sales as a result of any increase in the TRQ level for fine-micron fabrics, partlybecause many clothing manufacturers do not buy its fabrics.6 Hickey-Freeman Co. stated that itreduced its fabric purchases from Warren Corp. because of the quantity and quality of Warren Corp.’sswatches, and not because of pricing or purchases of imported fabrics benefiting from the dutyreductions.7
Lost Sales and Revenues by U.S. Tailored ClothingManufacturers
The Commission questionnaire for U.S. tailored clothing manufacturers requested that theyprovide information on any lost sales and revenues resulting from the inability to purchase adequatesupplies of the worsted wool fabrics on a cost-competitive basis. Of the 18 clothing manufacturersproviding such information, 12 reported they had lost sales or revenues because of their inability topurchase adequate supplies of worsted wool fabrics on a cost-competitive basis. Six manufacturersprovided data showing they have lost more than $15.4 million in sales and more than $1.0 million inrevenues since January 1999, with four of the firms reporting lost sales, one reporting lost revenues andone reporting both lost sales and lost revenues (table 6-1).8 The clothing manufacturers stated thatwhile some clothing manufacturers may have lost sales due to a shift in demand from suits to sportcoats and trousers, most losses in sales and revenues are due to imports, particularly in low- tomedium-price point goods.9
Hickey-Freeman Co. stated that U.S. tailored clothing manufacturers need access to a widerange of fabric patterns, styles, and colors in order to compete in the domestic market, but that U.S.fabric producers are not capable of producing the necessary variety. The firm also stated that U.S.import tariffs on men’s wool tailored clothing are lower than those on the fabrics themselves, providingan economic incentive to import finished clothing. In addition, the firm stated that NAFTA permitsclothing manufacturers in Canada and Mexico to ship large quantities (more than 6.5 million SMEs) of

10 Walter B.D. Hickey, Jr., Chairman, Hickey-Freeman Co., written submission to the Commission, Mar.26, 2001.
6-3
wool garments to the United States free of duty, even though the garments are made from non-NAFTAfabrics. Hickey-Freeman Co. stated that the NAFTA preferences, coupled with much lower duty rateslevied by Canada (about 6 percent) and Mexico (about 18 percent) on non-NAFTA worsted woolfabrics, provide clothing manufacturers in Canada and Mexico with an enormous price advantage inthe domestic market.10
Table 6-1Lost sales and revenues allegations of tailored clothing manufacturers
* * * * * * *


1 Carding serves to disentangle the fibers to prepare them for spinning, and is done by passing the fibersbetween rollers covered with fine wire teeth. This step produces wool in the form of a loose, untwisted, rope-like “sliver,” ready for spinning into woolen yarn. Combing serves to remove the shorter fibers and furtheralign the longer ones to produce “tops,” a smoother, more uniform sliver suitable for spinning into worstedyarn. See U.S. Customs Service, “Fibers and Yarns: Construction and Classification Under the HTSUS,”Customs Bulletin and Decisions, vol. 34, No. 52, Dec. 27, 2000, p. 127. 2 U.S. Department of Agriculture (USDA), Economic Research Service (ERS), Cotton and Wool Situationand Outlook Yearbook (CWS-2000), Nov. 2000, p. 13, and facsimile from ERS, Mar. 22, 2001. 3 Timothy J. Galvin, Administrator, USDA, Foreign Agricultural Service (FAS), in an undated letter to theHonorable Thad Cochran, United States Senate. The FAS official was responding to a letter from SenatorCochran of April 14, 1999, concerning a statement of the U.S. International Trade Commission in its Industryand Trade Summary: Wool and Related Fine Animal Hair that the United States is dependent on Australia forthe finer grades of wool fibers. The FAS official in his letter stated that the FAS does “not have the data bywhich to refute” the Commission’s statement “that the United States is dependent on Australia for those [finer]grades.”
7-1
CHAPTER 7WOOL FIBERS AND YARNS
This chapter provides an overview of U.S. market conditions for wool fibers and worsted yarnsused in the manufacture of worsted wool fabrics for men’s tailored clothing. To process wool fibersinto yarns, the fibers are first aligned in a parallel manner, and then wound together (spun) so that thefibers adhere to each other. Wool fibers that undergo carding and combing are spun into “worsted”yarns, while those fibers that undergo carding only are spun into “woolen” yarns.1 Although both typesof wool yarns are used in apparel, only the worsted yarns are covered by this investigation. The fibersused in the apparel worsted yarns usually have an average diameter of 18.5 to 21 microns, but notmore than 25.
Wool Fibers
U.S. mill consumption of raw wool declined 47 percent during 1996-2000 to 33.9 millionkilograms (kg), the lowest on record (table 7-1). U.S. wool production decreased for the 11th straightyear in 2000, to 11.1 million kg (clean content), down 18 percent from 1996. U.S. raw wool importsfell 40 percent, to 20 million kg, notwithstanding a small gain in 2000. The decline in millconsumption reflected substantially reduced wool usage by domestic mills making inputs for apparel,which accounted for 87 percent of raw wool mill consumption during 1996-2000 (carpet accounted forthe remainder). Consumption of wool for apparel fell slightly more than one-half during the period to27.3 million kg, with consumption of wool decreasing 50 percent for worsted apparel and 57 percentfor woolen apparel, to about 14 million kg each.2
One-half of U.S. imports of raw wool in 2000 consisted of fibers having an average diameterof 25 microns or less; Australia supplied 90 percent of these imports. Although current data are notavailable on U.S. production of wool fibers by micron count, wool fibers having an average diameter of18 to 19 microns reportedly account for less than 0.5 percent of total U.S. wool production.3

4 Data on wool fiber purchases collected from questionnaire responses may include some wools used formarkets other than that used in the manufacture of worsted wool fabrics for men’s tailored clothing.
7-2
Table 7-1Wool: U.S. production, imports, and mill consumption by end uses, 1999-2000, January-May2000, and January-May 2001
(1,000 kilograms, clean content)
Item 1999 2000
January-May--
2000 2001
Production . . . . . . . . . . . . . . . . . . . . . . . . . . . . . . . . . . . . . . . . . 11,159 11,123 (1) (1)
Imports:
25 microns or less2 . . . . . . . . . . . . . . . . . . . . . . . . . . . . . . . . 9,042 10,048 5,673 3,635
All other . . . . . . . . . . . . . . . . . . . . . . . . . . . . . . . . . . . . . . . . 10,496 10,364 4,354 5,165
Total imports . . . . . . . . . . . . . . . . . . . . . . . . . . . . . . . . . . . 19,538 20,412 10,027 8,800
Mill consumption:
Worsted apparel . . . . . . . . . . . . . . . . . . . . . . . . . . . . . . . . . . 15,596 13,656 33,898 33,568
25 microns or less2 . . . . . . . . . . . . . . . . . . . . . . . . . . . . . . 12,442 9,857 (1) (1)
All other . . . . . . . . . . . . . . . . . . . . . . . . . . . . . . . . . . . . . . . 3,155 3,798 (1) (1)
Woolen apparel . . . . . . . . . . . . . . . . . . . . . . . . . . . . . . . . . . . 13,223 13,693 33,877 33,958
Total apparel . . . . . . . . . . . . . . . . . . . . . . . . . . . . . . . . . . . 28,819 27,349 37,775 37,525
Carpet . . . . . . . . . . . . . . . . . . . . . . . . . . . . . . . . . . . . . . . . . . 6,328 6,583 31,716 31,940
Total U.S. wool consumption . . . . . . . . . . . . . . . . . . . . . . . 35,147 33,932 39,492 39,466
1 Not available.2 Represents wool finer than 58s (equivalent to average fiber diameters of 24.94 microns or less).
According to the USDA, imports of such fine wool include all imports under HTS statistical reporting numbers5101.11.6060, 5101.19.6060, 5101.21.4060, and 5101.29.4060, and 50 percent of those under HTSsubheadings 5101.21.70, 5101.29.70, and 5101.30.70; the remaining 50 percent of imports under thesesubheadings are included in “other.”
3 Data are for January-March of the specified year.
Note.–Figures may not add to totals shown because of rounding.
Source: Data on production and mill consumption derived from statistics of the U.S. Department of Agriculture(USDA), Economic Research Service, Cotton and Wool Situation and Outlook Yearbook (CWS-2000), Nov.2000, and USDA, National Agricultural Statistics Service (NASS), Sheep and Goats, Jan. 26, 2001. Importdata compiled from official statistics of the U.S. Department of Commerce.
Data submitted in response to the Commission yarn questionnaire by five firms show that the
largest buyers of wool fibers used in worsted wool yarns for apparel applications are Prouvost USA,Inc., Jamestown, SC, and Burlington Industries, which together accounted for *** percent of totalreported purchases of domestic and imported wool fibers in 2000.4 Total reported purchases that yearrose *** percent over the 1999 level, but were down *** percent in January-March 2001 from the year-earlier level (table 7-2). The increase in 2000 and decrease in the 2001 period largely reflected changesin purchases of imported fibers, which accounted for *** percent of total reported purchases in 1999

7-3
Table 7-2Wool fiber: Domestic and imported purchases, by fiber diameter, 1999-2000, January-March2000, and January-March 2001
(In kilograms)
Item 1999 2000
January-March--
2000 2001
Domestic:
Wool fiber having an average diameter:
18.5 microns or less . . . . . . . . . . . . . . . . . . *** *** *** ***
Greater than 18.5 microns . . . . . . . . . . . . . *** *** *** ***
Total domestic purchases . . . . . . . . . . . *** *** *** ***
Imported:
Wool fiber having an average diameter:
18.5 microns or less . . . . . . . . . . . . . . . . . . *** *** *** ***
Greater than 18.5 microns . . . . . . . . . . . . . *** *** *** ***
Total imported purchases . . . . . . . . . . . . *** *** *** ***
Grand total:
Wool fiber having an average diameter:
18.5 microns or less . . . . . . . . . . . . . . . . . . *** *** *** ***
Greater than 18.5 microns . . . . . . . . . . . . . *** *** *** ***
Total purchases . . . . . . . . . . . . . . . . . . . *** *** *** ***
Source: Compiled from data submitted in response to the Commission yarn questionnaire.
and *** percent in 2000. Import purchases rose *** percent in 2000, but fell *** percent in the 2001period. In contrast, reported purchases of domestic wool fibers rose *** percent in 2000, and were up*** percent in the 2001 period.
Coarse-micron fibers (average fiber diameter greater than 18.5 microns) accounted for ***percent of total reported purchases of wool fibers in 2000 (table 7-2). Purchases of coarse-micronfibers rose *** percent in 2000, but fell *** percent in the 2001 period. Imports accounted for ***percent of the purchased coarse-micron fibers in 2000. Purchases of fine-micron fibers (18.5 micronsor less) fell in both 2000 (by *** percent) and the 2001 period (by *** percent). Imports accounted for*** percent of the fine-micron wool fibers purchased in 2000.
Worsted Wool Yarns
Apparent U.S. consumption of worsted wool yarns declined 39 percent during 1996-2000 to15.8 million kg, as domestic production fell 54 percent to 10.7 million kg and imports rose by88 percent to 5.6 million kg (table 7-3). As such, the import share of U.S. consumption tripled duringthe period to 35 percent. The decline in U.S. consumption and production during 1996-2000 largelyreflected weak demand resulting from a decrease in U.S. output of apparel fabrics and an increase inU.S. imports of goods containing worsted wool yarns--namely, worsted wool fabrics and

7-4
Table 7-3Worsted wool yarns: U.S. production, imports for consumption, exports of domesticmerchandise, and apparent consumption, 1996-2000, January-May 2000, and January-May2001
YearU.S.
productionU.S.
importsU.S.
exports
Apparent U.S.
consumption
Ratio ofimports to
consumption
--------------------------1,000 kilograms-------------------- Percent
1996 . . . . . . . . . . . . . . . . . . . . . . . . 23,379 2,978 387 25,970 11
1997 . . . . . . . . . . . . . . . . . . . . . . . . 22,023 4,298 386 25,935 17
1998 . . . . . . . . . . . . . . . . . . . . . . . . 19,941 4,454 312 24,083 18
1999 . . . . . . . . . . . . . . . . . . . . . . . . 15,936 4,660 172 20,424 23
2000 . . . . . . . . . . . . . . . . . . . . . . . . 10,670 5,593 494 15,769 35
Jan.-May:
2000 . . . . . . . . . . . . . . . . . . . . . . (1) 2,480 175 (1) (1)
2001 . . . . . . . . . . . . . . . . . . . . . . (1) 1,957 312 (1) (1)
1 Not available.
Note.–Import data are for HTS subheadings 5107.1000, 5107.1030, 5107.1060, 5107.2000, 5107.2030and 5107.2060; export data are for HTS subheadings 5107.1000 and 5107.2000.
Source: Production data compiled from U.S. Census Bureau, Current Industrial Report: Yarn Production(MA313F(00)-1, 2000 and prior years; trade data compiled from official statistics of the U.S. Department ofCommerce.
and tailored clothing, which often are made from foreign materials. The production decline is alsoattributable to a switch by some mills to making yarns of acrylic and other fibers.
Based on questionnaire data, U.S. production capacity for worsted wool yarns fell *** percentin 2000 to *** million kg. U.S. production of such yarns fell *** percent in 2000 to 5.0 million kg,while the production level in January-March 2001 was unchanged from the year-earlier level of ***million kg. An industry source stated that U.S. yarn producers may benefit from provisions in thenewly enacted United States-Caribbean Basin Trade Partnership Act (CBTPA) that authorizes duty-free and quota-free treatment for imports of apparel made in Caribbean Basin beneficiary countriesfrom fabrics made in the United States of U.S. yarns. U.S. exports of wool yarns in January-May2001 rose 78 percent over the year-earlier level (table 7-3), and those to CBTPA beneficiary countriesrose from zero to 37,000 kg.
The segment of the U.S. yarn industry making worsted wool yarns continues to restructure, asfirms close plants, consolidate operations, and cut production. ***. In addition, several firms havegone out of business and another firm (Forstmann), once a leading producer of worsted wool yarns,sold its yarn division to Kent Manufacturing Co. in 2000.
The major U.S. producers of worsted wool yarns used in fabrics for men’s tailored clothing arebelieved to be Kent Manufacturing (*** percent of total U.S. production of such yarns in 2000),

5 *** 6 Jim Hiers, Prouvost USA, Inc. 7 ***
7-5
Burlington (*** percent), Hanora Spinning, Jagger Brothers, and Warren.5 ***. The yarn producerspurchase raw materials (wool tops and fibers) from either domestic sources (Burlington and Prouvostare believed to be the only U.S. producers of wool tops) or foreign suppliers. Purchases of rawmaterials from U.S. producers totaled *** million kg in 2000, up *** percent from 1999, andpurchases of imported raw materials totaled *** million kg, up *** percent. Prouvost stated that ***.6
U.S. production of worsted wool yarns consists mostly of coarse-micron yarns. According toquestionnaire data, coarse-micron yarns accounted for at least *** percent of U.S. worsted wool yarnproduction in 1999 and 2000; the remainder consisted of fine-micron yarns. Hanora Spinning stated it***.
Industry sources report domestic worsted wool yarns are similar in quality to imported yarns,which came mainly from Canada, Italy, and New Zealand during 1996-2000. Mexico entered themarket in the late 1990s and became the fourth-largest import source in 2000 with shipments of$8.8 million. Imports from Mexico ***.
Based on questionnaire data, purchases of worsted wool yarns from U.S. producers *** in2000.7 Purchases of coarse-micron yarns accounted for most of the increase, rising *** percent to ***kg; purchases of fine-micron yarns rose *** percent to *** kg. Total purchases of imported worstedwool yarns rose *** percent in 2000 to *** million kg; all of the increase in total purchases of importedworsted wool yarns was accounted for by purchases of imported coarse-micron yarns; purchases ofimported fine-micron yarns declined *** percent to *** kg in 2000.


1 See appendix C for a list of witnesses appearing at the public hearing held by the Commission inconnection with this investigation on May 31, 2001. 2 Walter B.D. Hickey, Jr., Chairman, Hickey-Freeman Co., Inc., Rochester, NY, and President, TCA,written submission to the Commission, Mar. 26, 2001, and testimony before the Commission, May 31, 2001. 3 Hartmarx believes it is the largest U.S. manufacturer and marketer of men’s tailored clothing and offersits goods under a number of owned and licensed trademarks (e.g., Hart Schaffner & Marx and Hickey-Freeman). See Form 10-K filed by Hartmarx with the U.S. Securities and Exchange Commission (SEC), Feb.26, 2001. The Form 10-K is available from the SEC website at <www.sec.gov/Archives/edgar/data>.
8-1
CHAPTER 8POSITION OF INTERESTED PARTIES
This chapter summarizes the views of interested parties submitted to the Commission inconnection with the investigation, either at the hearing or in written statements.1 The views ofrepresentatives of the U.S. tailored clothing industry and its workers appear first, followed by those ofrepresentatives of the U.S. worsted wool fabric industry. In general, representatives of the tailoredclothing industry and its workers support an increase in the annual quantities of worsted wool fabricsfor use in making men’s tailored clothing that may be imported at the TRQ in-quota tariff rates,whereas representatives of the fabric industry oppose any such increase.
Representatives of the U.S. Tailored Clothing Industryand Its Workers
Hickey-Freeman Co., Inc., and the Tailored Clothing Association (TCA)
• Hickey-Freeman,2 a subsidiary of the Hartmarx Corp.3 and a producer of men’s tailored clothing,stated that the U.S. tailored clothing industry has been declining for several decades and is nowhalf the size it was 10 years ago. It said U.S. producers of the subject fabrics are currently notcapable of making fabrics in the patterns, styles, and colors required by the U.S. tailored clothingindustry.
• According to Hickey-Freeman, because U.S. import tariffs are much higher on the subject fabrics(28.3 percent ad valorem in 2001) than on clothing made from such fabrics (e.g., the 2001 dutyrate on wool sport coats is 18.8 percent), much incentive exists to expand imports of such apparel. It said that NAFTA duty-free treatment for U.S. imports of wool clothing made in Canada andMexico from non-North American fabrics has given suit producers in these countries a priceadvantage over U.S. tailored clothing manufacturers in the domestic market. The firm stated thatthis practice has enabled Canadian and Mexican firms to develop substantial export industries andhas adversely affected U.S. producers of fabrics and apparel, including wool suits and fabrics. Itnoted that whereas U.S. manufacturers made 1.9 million wool suits in 1999, Canadian andMexican firms are exporting almost 2.5 million suits annually to the United States.

4 Stephen Lamar, Director of Government Relations, AAFA, Arlington, VA, written submissions to theCommission, Apr. 13, May 21 (joint AAFA-NRF statement), and June 7, 2001.
8-2
• Hickey-Freeman stated that U.S. consumer trends have shifted during the past decade from moreformal to more casual dress attire. Although the product mix has shifted, the aggregate amount ofworsted wool apparel has not necessarily changed. The firm noted that U.S. consumption of wooltailored clothing rose from 47.1 million square meter equivalents (SMEs) in 1997 to 49.6 millionSMEs in 1999 and that U.S. imports of such clothing rose from 33.3 million SMEs in 1999 to 36.4million SMEs in 2000. It stated that although lower labor costs and currency valuation differencespartly explain why U.S. clothing manufacturers are losing market share to imports, the majorreasons are high U.S. tariffs on the subject fabrics and the lack of an adequate domestic fabricindustry.
• Hickey-Freeman stated the temporary duty reductions on the subject fabrics represented the firstconcerted U.S. Government effort to enable U.S. clothing manufacturers to compete moreeffectively with foreign producers. Nevertheless, the firm stated that the tariff reductions do notprovide tariff rate parity with the rates paid by Canadian producers on imported worsted woolfabrics. The firm noted that the quantity of fabric subject to the reduced duties, 4 million SMEs, isnot sufficient to meet the current production needs of the U.S. tailored clothing industry.
• Hickey-Freeman stated that since enactment of Title V of the Trade and Development Act of 2000,U.S. production of the subject fabrics has fallen substantially, whereas imports of such fabricshave risen rapidly. The firm noted that specific company activities point to a decline in U.S.production of the fabrics. The firm stated that Burlington Industries implemented significantdecreases in its fabric production (a 25-percent reduction in overall U.S. fabric capacity in 1999,and a 14-percent reduction in worsted wool fabric capacity at its facility in Clarksville, VA) andthat these declines cannot be replaced by any other U.S. producer of the subject fabrics.
• Hickey-Freeman stated that, despite the decline in U.S. production of the subject fabrics, the U.S.market continues to demand tailored clothing made from fine-micron worsted wool fabrics,prompting U.S. clothing manufacturers to import such fabrics. Hickey-Freeman stated that asurvey of 1998 fabric purchases of TCA members showed about 60 percent of tailored clothingsales and domestic production were in these fine-micron wool fabrics.
American Apparel & Footwear Association (AAFA) andNational Retail Federation (NRF)
• AAFA,4 an industry association whose members include U.S. producers of men’s tailored clothing,and NRF, a retail trade association whose members include retailers of such clothing, submitted ajoint statement in which they indicated the domestic market for men’s tailored clothing has beenaffected by (1) the decline in domestic sources of worsted wool fabrics for use in tailored clothing;(2) the tariff inversion on imports of such fabrics (U.S. duties are higher on the fabrics than on thefinished garments), which encourages imports of the finished garments by making it cheaper toimport them rather than make the same garments domestically from the imported fabrics; and (3)the effect, since passage of NAFTA, of trade policies that allow tailored clothing producers in

5 Crittenden Rawlings, President and Chief Executive Officer, Oxxford Clothes, Chicago, IL, testimonybefore the Commission, May 31, 2001.
8-3
Canada and Mexico to import worsted wool fabrics at low duty rates, make the clothing there, andexport the finished garments to the United States free of duty under NAFTA.
• AAFA and NRF stated that two other factors together will likely reduce even further the amount ofU.S.-made worsted wool fabrics available for use in U.S. production of men’s tailored clothing. They stated that Title V of the Trade and Development Act of 2000 provides tariff relief onimported worsted wool fabrics only for U.S. manufacturers of men’s tailored clothing, not U.S.producers of other garments such as women’s clothing. AAFA and NRF noted that theseproducers compete with the men’s clothing manufacturers for the limited supply of domesticallyavailable worsted wool fabrics and that their consumption will further reduce the supply of fabricsavailable for men’s clothing. They also noted that several new U.S. trade programs that promotethe use of U.S. fabrics (through preferential access to the U.S. market for apparel made in theCaribbean Basin, sub-Saharan Africa, and Southeastern Europe) will further strain availability ofU.S.-produced worsted wool fabric supplies.
• AAFA stated there is insufficient U.S. production of the subject fabrics in the styles andappropriate quantities (short runs) needed by U.S. clothing manufacturers. It stated that AAFAmembers have been increasingly unable to rely upon U.S. mills to meet their fabric needs, that U.S.mills are no longer making sufficient quantities of the subject fabrics, and that the quantities thatare made are not varied enough or marketed in small enough runs to meet their needs.
Oxxford Clothes Inc.
• Oxxford Clothes,5 a manufacturer of hand-tailored worsted wool clothing, stated that the marketfor tailored clothing has changed in such a way, over the past several decades, that U.S. mills areno longer able to meet the needs of clothing manufacturers. It stated that since World War II,foreign mills have been increasingly making more creative wool fabrics of higher quality than thosetraditionally made in the United States. Oxxford stated that while U.S. mills are producing someof these fabrics, the mills do not offer the necessary range of selection and quality. Oxxford statedthat foreign mills are more willing to accommodate specific purchaser needs than U.S. mills, whichoften require minimum purchase amounts that exceed manufacturer needs. The firm stated thatBurlington and Loro Piana (Warren Corp.) ask for much higher quantities than mills in Europe,where it can purchase one piece of cloth from 100 different mills. Oxxford said that as demand forfabrics has grown, manufacturers have had to choose between selling items made with the samefabrics that U.S. mills have always made or importing from foreign mills and paying the duties.
• Oxxford stated that the determination to allow duty-free imports of clothing made from non-NAFTA fabrics indicates U.S. Government awareness of the inability to sufficiently source fabricsfrom mills in Canada, Mexico, or the United States. It stated that because U.S. clothingmanufacturers do not enjoy similar tariff relief, the firms are at a disadvantage vis-a-vis theircounterparts in Canada and Mexico and that fact has resulted in a reduction of the U.S. industry byhalf in the last 10 years.

6 Howard Goldstein, Treasurer and Chief Financial Officer, Hartz & Co., Inc., Frederick, MD, testimonybefore the Commission, May 31, 2001. 7 Andrew Kozinn, President, Saint Laurie Ltd., New York, NY, testimony before the Commission, May 31,2001.
8-4
• Oxxford stated that it is impossible for U.S. textile mills to adequately supply the tailored clothingindustry that annually produces 16 to 22 million SMEs of worsted wool clothing. It stated thateven if the annual TRQs for 2001-03 were increased by the maximum amount permitted underTitle V, the result would be 10 million SMEs of imported fabric at reduced duties with firms stillneeding to import significant amounts of fabric at duty rates in excess of 25 percent ad valorem.
Hartz & Co., Inc.
• Hartz,6 a manufacturer of men’s worsted wool apparel priced from the middle range to thebeginning of the higher range, stated that the firm must source its fabrics from abroad to becompetitive because there are no U.S. mills that serve its market niche. It stated that BurlingtonIndustries had been its largest supplier of the subject fabrics until February 1999, when Burlingtonannounced it would no longer make the same quantity and variety of fabrics available. Hartzindicated it does not buy significant quantities of the subject fabrics from Warren Corp., becauseWarren’s fabrics are for the high end of the market.
• Hartz stated that in 2001 almost all its fabrics would have been imported regardless of whether ornot Title V was enacted. The firm stated that it sources fabrics abroad just as its Canadian andMexican competitors do, yet it is subject to high U.S. tariffs. Hartz stated that a reduced duty ratewould not harm U.S. fabric mills, citing the example of the Canadian mill Cleyn & Tinker that hasremained successful more than 10 years after Canada reduced duty rates to about 6 percent advalorem.
Saint Laurie Ltd.
• Saint Laurie,7 a manufacturer of men’s custom tailored clothing, stated that because it mustpurchase most of its fabrics in small, varied lots, the high minimum order requirements imposed byBurlington and Warren preclude it from sourcing fabrics from these mills. The firm also said itbuys high-end fabrics of a kind that are not made by U.S. mills. The firm stated that mills inEngland are willing to sell short runs of many different fabric types and designs with the option forreordering with immediate delivery, a service not offered by U.S. mills.
• Saint Laurie stated that because of competition from Canadian and other foreign manufacturers, itscapacity to survive is contingent on its ability to maintain a market niche in which it is subject to a30 percent duty rate on worsted wool fabrics. The firm stated that this tariff makes it lesscompetitive against foreign manufacturers that are not subject to such duties on imports of thesame fabrics.
• Saint Laurie stated its concern over U.S. government policies that grant Canadian and Mexicanfirms the right to ship to U.S. markets duty-free tailored clothing made from more than 6.5 millionSMEs of non-NAFTA fabrics -- while offering U.S. clothing manufacturers only 4 million SMEs

8 Edward W. Clark, Jr., Executive Vice President, UNITE, New York, NY, accompanied by Diane Justian,former employee of Joseph Pietrafesa Co., Liverpool, NY, and President, Local 220, UNITE; NorbertoGonzalez, an employee of H. Freeman & Son, Philadelphia, PA; and Arthur Gundersheim, Director,International Trade, UNITE; testimony before the Commission, May 31, 2001. Arthur Gundersheim, writtensubmission to the Commission, June 5, 2001.
8-5
of fabric imports subject to duty rates of 6 percent and 19 percent ad valorem. The firm alsostated its concern about policies that tax U.S. fabric importers more than they tax their competitorswho make tailored clothing offshore.
The Union of Needletrades, Industrial and Textile Employees (UNITE)
• UNITE,8 representing over 85 percent of the workers in the U.S. tailored clothing industry, statedthat the significant job loss in this industry is due entirely to an inverted duty structure, wherebyfinished suits could be imported at tariff rates one-third less than the basic material from whichthey were made, as well as the consequences resulting from international trade agreements (e.g.,NAFTA). It stated that differences in labor costs between fabric mills in the United States andItaly, a major foreign supplier of the subject fabrics, have not significantly influenced the growth offabric imports from Italy. UNITE stated that labor costs of the textile industry in Italy were 103percent of U.S. costs, based on data prepared by Werner International for the period summer-autumn 2000.
• According to UNITE, its members reported only about 25 percent of the fabrics they work on aremade domestically, and in many shops nearly all the fabrics are imported. UNITE said the majoreffect of high U.S. duty rates on the subject fabrics is to give a cost advantage to foreigncompetitors while protecting the U.S. fabric industry. It stated that if U.S. clothing manufacturersare not able to buy imported fabrics close to the low or zero duty rates of their foreign competitors,the U.S. firms will have to cease production in the United States and source elsewhere.
• UNITE stated that the large quantities of worsted wool fabrics from Mexico likely consist of low-quality fabrics used primarily for outward processing production. According to UNITE, thefabrics are cut in the United States, sent offshore for assembly (mainly into trousers), and then re-exported to the United States.

9 Carlos Moore, Executive Vice President, ATMI, Washington, DC, written submission to the Commission,Mar. 7, 2001. 10 Cindy Siddoway, President, ASI, Englewood, CO, written submission to the Commission, Apr. 17, 2001. 11 John D. Englar, Senior Vice President, Burlington Industries, Inc., Greensboro, NC, written submissionto the Commission, Apr. 16, 2001, and Jim Leonard, Jim Leonard and Associates (former Burlingtonemployee and now a consultant on international trade issues), on behalf of Burlington, testimony before theCommission, May 31, 2001, and written submission to the Commission, June 15, 2001.
8-6
Representatives of the U.S. Worsted Wool Fabric Industry
American Textile Manufacturers Institute (ATMI)
• ATMI,9 an industry association whose members include U.S. producers of worsted wool fabricsand yarns, stated its support for monitoring the domestic market for worsted wool fabrics. However, ATMI indicated it is not feasible for the Commission to determine the effects of theTRQs by September 17, 2001 (the date on which the Commission’s first annual report is scheduledto be submitted to the USTR), because sufficient data regarding the impact of the TRQs will not beavailable, given that the TRQs had not been allocated as of March 7, 2001.
American Sheep Industry Association (ASI)
• ASI10 contends that U.S. wool producers would be adversely affected by any increase in the TRQin-quota quantities for worsted wool fabrics. ASI states it is impossible to calculate the impact ofthe TRQ duty reductions because the TRQs had not been allocated.
Burlington Industries, Inc.
• Burlington11 stated it is the largest U.S. producer of the subject fabrics and that it opposes anyincrease in the TRQ in-quota quantities for the fabrics because it will have a negative effect on thealready depressed U.S. worsted wool fabric industry. It stated that U.S. producers of the fabricsemploy thousands of U.S. workers whose jobs will be jeopardized by increases in the TRQs. Thefirm stated that all of the subject fabrics are made domestically and that existing U.S. capacityshould be used before the U.S. Government provides greater incentives to import the subjectfabrics at reduced duties.
• Burlington stated it has capacity in its U.S. facilities to produce 40 million linear yards of thesubject fabrics and has significant unused capacity that could easily be dedicated to the productionof such fabrics. The firm stated that, due to a decline in orders, it had to lay off more than 1,500workers in the worsted wool fabric division during the past 2 years.
• Burlington stated that the U.S. wool fabric industry has made substantial investments in productioncapacity based on the Uruguay Round tariff reduction schedule and on indications from the U.S.Government that further significant tariff reductions were unlikely. Burlington noted that the tariffreductions embodied in Title V have had a significant and negative impact on the value of theseinvestments and on long-term business plans.

12 Karl Spilhaus, President, NTA, Boston, MA, written submission to the Commission, Apr. 24, 2001, andtestimony before the Commission, May 31, 2001.
8-7
• Burlington stated that a major problem in trying to deal with the supply and demand issue is thesize of the market for fine-micron fabrics. Burlington stated that by its estimate, along with severaltrade publication quotes, 10 to 20 percent of the men’s suit market was using fine-micron fabricsand the U.S. fabric industry was supplying more than 60 percent of the demand for such fabrics. According to Burlington, U.S. production of men’s wool suits had fallen to about 2.8 million unitsin 2000. If the share of suits accounted for by fine-micron fabrics is 20 percent, there should be ademand of about 2 million yards of these fine-micron fabrics, assuming 3.5 linear yards of fabricper suit. Burlington stated U.S. mills in that segment of the business have significantly morecapacity than that and actually produced more than that in 2000. For coarse-micron fabrics,Burlington stated the U.S. industry in 1998 had the capacity to produce significant volumes ofthese fabrics. Burlington claimed it alone has capacity to produce 40 million yards of worstedfabrics. The firm also noted it is developing a new line of fabrics using wool fiber having anaverage diameter of 19.3 microns, which will be marketed at competitive prices and will have thesame luxurious characteristics as fine-micron fabrics. According to Burlington, this effort is beingundertaken to provide its customers with a wider range of fabrics, at more competitive prices.
• Burlington stated that, several years ago, it temporarily suspended any new business for part of itsline, which included some fancy high-end fabrics. It stated this was a temporary move dictated byproduction changes associated with the merger of the wool fabric and synthetic fabric divisions. Burlington noted there was some reduction in capacity associated with that move, but it continuesto have unused capacity for the production of the subject fabrics.
Northern Textile Association (NTA)
• NTA,12 representing U.S. producers of wool fabric and yarn, stated that a TRQ increase wouldharm U.S. producers of worsted wool fabrics and yarns. It stated that the TRQs have createduncertainty in the U.S. worsted wool fabric industry, which had made production plans and largeinvestments based on an understanding that U.S. tariffs on the fabrics would remain stablefollowing significant tariff reductions in the Uruguay Round. NTA stated that the U.S. fabricindustry is capable of making all of the subject fabrics needed by the U.S. clothing industry, thatthe fabric industry makes a large amount of the fabrics in a variety of colors, styles, and grades,and that the industry has invested in additional fabric-production capacity. However, NTA statedthat a substantial portion of extant capacity is currently idle due to a decrease in productioncaused, in turn, by a decline in demand from U.S. customers.
• NTA stated that an examination of the effects of the TRQs required under Title V is not currentlypossible, as the TRQs must be in place for a period of time in order to assess their impact. However, NTA stated that prior to their implementation, anticipation of the TRQs had already ledto decreased sales and downward pressure on domestic fabric prices.
• NTA stated that an analysis of U.S. clothing manufacturers’ ability to source the subject fabrics atcompetitive prices should account for those fabrics being imported from NAFTA partners atreduced duty rates. NTA also stated that the strong U.S. dollar represents a de facto tariff

13 Warren Corp., Stafford Springs, CT, Guy Birkhead, Vice President of Operations, written submission tothe Commission, Apr. 17, 2001; Pier Luigi Loro Piana, Chief Executive Officer, testimony before theCommission, May 31, 2001; and Anne Costa, Accounting Supervisor, written submission to the Commission,June 11, 2001.
8-8
reduction, as it enables foreign producers of the subject fabrics to sell their fabrics at lower pricesthan U.S. mills.
Warren Corp.
• Warren,13 a U.S. producer of the subject fabrics and an affiliate of Loro Piana & C.s.p.a. of Italy,stated that it opposes any increase in the TRQ in-quota quantities because it would have a negativeimpact on the U.S. wool fabric industry, exacerbate current market instability, and jeopardize thefirm’s ability to employ U.S. workers. Warren stated its core business (fine-micron worsted woolfabrics) “will be definitively jeopardized by the current TRQ levels during 2001" and that U.S.tariffs “remain absolutely necessary to compensate part of the dollar strength effect and the highcost of U.S. labor.” Warren stated that an increase in the TRQ in-quota quantities wouldencourage fabric imports and further increase the competitive advantage of European fabricproducers as a result of the relatively high value of the U.S. dollar.
• Warren stated that, unlike the gradual tariff reductions of the Uruguay Round that gave U.S. woolfabric producers an opportunity to adjust to new market conditions, the temporary duty reductionson the subject fabrics under Title V of the Trade and Development Act of 2000 were put into effectimmediately. Warren stated these tariff reductions have had a significant impact on prices and thevalue of recent investments in production capacity. As a result, Warren has abandoned severalshort- and long-term business plans.
• Warren stated that declining orders have led to decreased sales and production, despite its efforts tomaintain production and sales levels by adjusting prices. Warren stated these price adjustmentshave, in turn, affected profit margins and it cannot continue to offer these reduced pricesindefinitely.
• Warren stated the TRQ in-quota quantity for fine-micron wool fabrics (1.5 million SMEs)accounts for over half of U.S. demand for such fabrics. Also, U.S. production of men’s tailoredclothing, the primary source of demand for fabrics made by Warren, has been decreasing since themid-1990s. Warren said this trend will likely continue because of increased casual dressing.
• Warren said U.S. capacity should be utilized before any TRQ increase is contemplated and thatU.S. firms currently produce large quantities of the subject fabrics. Warren stated that 50 percentof its production capacity is currently unused and that it could significantly expand production ifits orders justified such an increase. Warren stated it offers high-quality fabric in a wide range ofdesigns and styles, and is willing to satisfy consumer demand for unique styles and small orders.

Appendix ARequest Letter from the United States TradeRepresentative


Appendix BFederal Register Notice


Appendix CCalendar of Public Hearing

CALENDAR OF PUBLIC HEARING
Those listed below appeared as witnesses at the United States International Trade Commission’shearing:
Subject: U.S. Market Conditions for Certain Wool Articles
Inv. No.: 332-427
Date and Time: May 31, 2001 - 9:30 a.m.
Sessions were held in connection with the investigation in the Main Hearing Room, 500 E Street,S.W., Washington, D.C.
ORGANIZATION AND WITNESS:
PANEL 1:
Williams & JensenWashington, D.C. on behalf of
Tailored Clothing Association (TCA)
Walter B.D. Hickey, Jr., Chairman, Hickey-Freeman Company, Rochester, New York
Howard Goldstein, Chief Financial Officer, Hartz & Company, Frederick, Maryland
Andrew Kozinn, President, Saint Laurie, Limited, New York, New York
Crittenden Rawlings, President & Chief Executive Officer, Oxxford Clothes XX, Incorporated, Chicago, Illinois
David A. Starr )--OF COUNSEL

- MORE -
ORGANIZATION AND WITNESS:
PANEL 1 (continued):
UNITE!, New York, New York
Edward W. Clark, Jr., Executive Vice President, UNITE!
Arthur Gundersheim, Director of International Trade, UNITE!
Diane Justian, President of Local 220, Liverpool, New York
Norberto Gonzalez, Worker at H. Freeman Company, Philadelphia, Pennsylvania
PANEL 2:
Northern Textile Association, Boston, Massachusetts
Karl Spilhaus, President, Northern Textile Association
Jim Leonard, Jim Leonard & Associates Representing Burlington Industries
Pier Luigi Loro Piana, Chief Executive Officer, Warren Corporation
- END -

Appendix DQuestionnaire Data on Production,Shipments, Inventory, Imports, and Exports


D-3
Tables
D-1. Men’s and boys’ tailored clothing: U.S. capacity and production, 1999-2000, January-March2000, and January-March 2001
* * * * * * *
D-2. Men’s and boys’ tailored clothing: U.S. shipments and exports, 1999-2000, January-March 2000, and January-March 2001
* * * * * * *
D-3. Worsted wool fabrics: U.S. tailored clothing manufacturers’ purchases for use in men’sand boys’ suits, sport coats, and trousers, 1999-2000, January-March 2000, and
January-March 2001
* * * * * * *
D-4. Worsted wool fabrics: U.S. producers’ capacity, production, shipments, exports, and inventories, 1999-2000, January-March 2000, and January-March 2001
* * * * * * *
D-5. Worsted wool fabrics: U.S. imports and importers’ U.S. shipments, exports, andinventories, 1999-2000, January-March 2000, and January-March 2001
* * * * * * *
D-6. Combed wool yarns: U.S. production, shipments, exports, imports, and inventories, 1999-2000, January-March 2000, and January-March 2001
* * * * * * *
D-7. Wool fibers, tops, and combed yarns: U.S. purchases, 1999-2000, January-March 2000, andJanuary-March 2001
* * * * * * *


Appendix EQuestionnaire Data on Prices