Embed Size (px)
Citation preview
U.S. International Trade Commission
Robert A. RogowskyDirector of Operations and Acting Director of Industries
COMMISSIONERS
Address all communications toSecretary to the Commission
United States International Trade CommissionWashington, DC 20436
Jennifer A. Hillman, Vice ChairmanDeanna Tanner Okun, Chairman
Marcia E. MillerStephen Koplan
Charlotte R. LaneDaniel R. Pearson
This report was prepared by the Office of IndustriesJennifer Baumert, Project Leader
Michael Ferrantino, Economist
Staff assigned:William Chadwick, Lisa Ferens, Tom Jennings,
Dennis Luther, and Linda White
With special assistance from:Lynette Gabourel and Cynthia Payne
Under the direction of:Richard W. Brown
Division Chief
U.S. International Trade CommissionWashington, DC 20436
April 2004
www.usitc.gov
Publication 3679
Solid and Hazardous Waste Services:An Examination of U.S.
and Foreign Markets
Investigation No. 332-455

i
ABSTRACTThe environmental services sector, including the solid and hazardous waste servicesindustry, is the focus of increasing international attention. The sector has receivedspecial emphasis in the World Trade Organization (WTO), as the reduction orelimination of barriers affecting trade in such services has been identified in the DohaMinisterial Declaration as one of the principal goals of the present negotiating round. Moreover, environmental issues have become increasingly tied to international tradeand investment, such that the environmental impact of trade agreements is morelikely to be evaluated and considered as a critical component of the policy underconsideration.
This report provides an overview of U.S. and foreign markets for solid and hazardouswaste services; examines trade and investment in solid and hazardous waste servicesmarkets, including barriers affecting such trade and investment; and discussesexisting regulatory practices. With regard to the geographic coverage of this report,information is presented on both developed- and developing-country markets.
The global market for solid and hazardous waste services is dominated by developedcountries, with the United States, Western Europe, and Japan ranking as the world’slargest markets for such services. In most developed countries, the solid andhazardous waste services sector is considered a mature and competitive industry,while solid and hazardous waste services markets in many developing countries aresmall, but rapidly growing. Among the countries discussed in this report, high-income economies typically generate more solid waste than the middle-incomeeconomies. In addition, high-income countries manage a greater share of their waste,are more likely to employ modern waste management techniques, and are more likelythan developing economies to maintain and enforce strict waste managementregulations, as developing economies may lack the economic and political capacity tofinance extensive waste management programs or maintain strict regulations.
The extent of cross-border trade and investment in solid and hazardous wastemanagement services differs dramatically among the countries examined in thisstudy, but is greatest among high-income countries where stringent regulation andconsistent enforcement create steady demand for waste management services andencourage the development of waste management capacity. Few of the countriesselected for discussion in this report have explicit restrictions on trade in solid andhazardous waste management services. However, regulations and practices thatpertain to all sectors, or to related sectors such as architecture and engineering, canpotentially affect trade in the waste management industry.

1 See appendix A. 2 See appendix B. For summaries of the public submissions received in response to thisinvestigation, see appendix D.
iii
PREFACEOn July 1, 2003, the U.S. International Trade Commission (Commission) received aletter from the United States Trade Representative (USTR) requesting that theCommission conduct two investigations under section 332(g) of the Tariff Act of1930 on discrete segments of the environmental services industry.1 The USTRrequested that the first of these reports focus on solid and hazardous waste services. In response to the request, the Commission instituted investigation 332-455 on July29, 2003.
The USTR requested that the Commission’s report include:
• an overview of foreign and domestic markets for solid and hazardous wasteservices;
• an examination of trade and investment in solid and hazardous waste servicesmarkets, including barriers affecting such trade and investment, if any; and
• a discussion of existing regulatory practices.
The USTR requested that, for the purposes of this investigation, the Commissiondefine the solid and hazardous waste industry to include the collection of solid andhazardous waste from households and industry; the treatment and disposal of solidand hazardous waste by various means; the collection, separation, and sorting ofrecyclable materials; waste compacting; waste reduction services; and incidentalservices. The USTR also requested that the Commission include information on bothdeveloped- and developing-country markets.
Copies of the notice of investigation were posted at the Office of the Secretary, U.S.International Trade Commission, Washington, DC, 20436, and the notice waspublished in the Federal Register (68 F.R. 46223) on August 5, 2003.2 Nothing inthis report should be construed to indicate the Commission’s finding in aninvestigation conducted under other statutory authority covering the same or similarsubject matter.

v
Executive Summary
IntroductionOn July 1, 2003, the U.S. International Trade Commission (Commission) received aletter from the United Stated Trade Representative (USTR) requesting that theCommission conduct two investigations under section 332(g) of the Tariff Act of1930 on discrete segments of the environmental services industry, with the first ofthese reports focusing on solid and hazardous waste services (appendix A). Theenvironmental services sector has received special emphasis in the World TradeOrganization (WTO), as the reduction or elimination of barriers affecting trade insuch services has been identified in the Doha Ministerial Declaration as one of theprincipal goals of the present negotiating round. The USTR indicated thatinformation on environmental services markets would be useful in conducting WTOnegotiations on environmental services, the environmental review of this element ofthe current WTO negotiations, and future negotiations and reviews.
The Solid and Hazardous Waste Services MarketIn 2001, the year for which the most recent global data are available, solid wastemanagement services and hazardous waste management services respectivelyaccounted for 43 percent and 6 percent of the $279 billion worldwide environmentalservices market. The United States is the world’s largest market for solid andhazardous waste services, while other key markets for such services include WesternEurope and Japan. In 2001, the world’s largest solid and/or hazardous waste servicesfirms included Onyx (a subsidiary of French firm Veolia Environment, solid andhazardous waste services), Sita (a subsidiary of French firm Suez, solid wasteservices), Waste Management (United States, solid waste services), Allied Waste(United States, solid waste services), and RWE Entsorgung (Germany, solid wasteservices).
Relevant literature indicates that differences in technology (between methods ofdisposal, between countries, and over time) influence the conditions of supply in theindustry. Changes in the amount of waste generated and in the state of regulationinfluence the conditions of demand. These fundamental determinants of supply anddemand, in conjunction with other forces such as economic growth and the relativeprices of energy and recyclable materials, influence the market structure of theindustry.
There seems to be a significant relationship between economic welfare and thecharacter of national solid and hazardous waste services markets. In most developedcountries, the environmental services sector as a whole, and the solid and hazardouswaste services segments in particular, are considered mature industries characterizedby reduced profitability and excess capacity, which are driving consolidation. Further, high-income countries manage a greater share of their waste, are more likelyto employ modern waste management techniques, and are more likely to maintainand enforce strict waste management regulations than developing economies. By
1 Among the economies discussed in this report, Australia, Canada, China, the CzechRepublic, the European Union, Japan, South Africa, and the United States scheduled GATScommitments on refuse disposal services. Chile, Egypt, Malaysia, and Mexico did notschedule GATS commitments on such services.
vi
contrast, solid and hazardous waste services markets in many developing countriesare small, but are experiencing rapid growth. Many developing countries haveexpressed significant interest in environmental issues, going so far as to pass strictenvironmental legislation, but they sometimes lack the resources to enforce theirenvironmental policies. Private sector participation in the solid waste industry alsoseems to be related to per capita income levels. Solid waste management industriesin high-income countries tend to be dominated by private firms, while in manymiddle-income countries, waste removal is still considered a public-service that stateand local governments undertake themselves.
Certain other market characteristics, particularly in the hazardous waste segment,seem to be unrelated to income. Although high-income economies typically generatemore solid waste than middle-income economies, hazardous waste generation in agiven country does not seem to be closely related to a country’s level ofdevelopment. Additionally, the hazardous waste management industry is dominatedby the private sector in almost all of the sample countries in this investigation,regardless of income level.
Trade and InvestmentThe extent of cross-border trade and investment in solid and hazardous wastemanagement services differs dramatically among the economies examined in thisstudy. Such activity tends to be most common among high-income countries wherestringent regulation and consistent enforcement create steady demand for wastemanagement services and encourage the development of waste management capacity. Affiliate sales associated with direct investment in the waste management servicesindustries are likely one or two orders of magnitude larger than cross-border trade ofsuch services.
Approximately 30 percent of WTO member states– and eight of the twelveeconomies1 discussed in this report– made commitments on refuse disposal servicesunder the General Agreement on Trade in Services (GATS) (appendix C). Restrictions specific to trade in refuse disposal services are limited. However, broadmeasures that apply to purchases or rentals of property, equity holdings, residencyrequirements for directors, tax and subsidy measures, and visa provisions such asquotas and length of stay may have an impact on the foreign provision of solid andhazardous waste management services, as may measures specific to related sectorssuch as architecture and construction.
vii
Table of ContentsPage
Abstract . . . . . . . . . . . . . . . . . . . . . . . . . . . . . . . . . . . . . . . . . . . . . . . . . . . . . . . . . . . . . . . . . . i
Preface . . . . . . . . . . . . . . . . . . . . . . . . . . . . . . . . . . . . . . . . . . . . . . . . . . . . . . . . . . . . . . . . . . . . iii
Executive Summary . . . . . . . . . . . . . . . . . . . . . . . . . . . . . . . . . . . . . . . . . . . . . . . . . . v
Chapter 1. Introduction . . . . . . . . . . . . . . . . . . . . . . . . . . . . . . . . . . . . . . . . . . . . . 1-1
The scope of the solid and hazardous waste services industry . . . . . . . . . . . . . . . . . . . . . . . . . 1-2The global market for solid and hazardous waste services . . . . . . . . . . . . . . . . . . . . . . . . . . . 1-4Approach . . . . . . . . . . . . . . . . . . . . . . . . . . . . . . . . . . . . . . . . . . . . . . . . . . . . . . . . . . . . . . . . . 1-6
Chapter 2. Solid and hazardous waste services: Industryoverview and literature review . . . . . . . . . . . . . . . . . . . . . . . . . . . . . . . . . . . . 2-1
Introduction . . . . . . . . . . . . . . . . . . . . . . . . . . . . . . . . . . . . . . . . . . . . . . . . . . . . . . . . . . . . . . 2-1Activities and technology . . . . . . . . . . . . . . . . . . . . . . . . . . . . . . . . . . . . . . . . . . . . . . . . . . . . . 2-2
Solid waste . . . . . . . . . . . . . . . . . . . . . . . . . . . . . . . . . . . . . . . . . . . . . . . . . . . . . . . . . . . . 2-2Sources of solid waste . . . . . . . . . . . . . . . . . . . . . . . . . . . . . . . . . . . . . . . . . . . . . . . 2-2Collection . . . . . . . . . . . . . . . . . . . . . . . . . . . . . . . . . . . . . . . . . . . . . . . . . . . . . . . . . 2-3Methods of disposal . . . . . . . . . . . . . . . . . . . . . . . . . . . . . . . . . . . . . . . . . . . . . . . . . 2-5
Landfilling . . . . . . . . . . . . . . . . . . . . . . . . . . . . . . . . . . . . . . . . . . . . . . . . . . . . 2-5Incineration . . . . . . . . . . . . . . . . . . . . . . . . . . . . . . . . . . . . . . . . . . . . . . . . . . . . 2-6Recycling . . . . . . . . . . . . . . . . . . . . . . . . . . . . . . . . . . . . . . . . . . . . . . . . . . . . . . 2-7Illegal disposal . . . . . . . . . . . . . . . . . . . . . . . . . . . . . . . . . . . . . . . . . . . . . . . . . . 2-8
Hazardous waste . . . . . . . . . . . . . . . . . . . . . . . . . . . . . . . . . . . . . . . . . . . . . . . . . . . . . . . . 2-9Methods of disposal . . . . . . . . . . . . . . . . . . . . . . . . . . . . . . . . . . . . . . . . . . . . . . . . . 2-10Siting . . . . . . . . . . . . . . . . . . . . . . . . . . . . . . . . . . . . . . . . . . . . . . . . . . . . . . . . . . . . 2-10
Waste generation and demand . . . . . . . . . . . . . . . . . . . . . . . . . . . . . . . . . . . . . . . . . . . . . . . . . 2-11Industry structure . . . . . . . . . . . . . . . . . . . . . . . . . . . . . . . . . . . . . . . . . . . . . . . . . . . . . . . 2-12
Size and scale of firms . . . . . . . . . . . . . . . . . . . . . . . . . . . . . . . . . . . . . . . . . . . . . . . 2-12Organization of firms . . . . . . . . . . . . . . . . . . . . . . . . . . . . . . . . . . . . . . . . . . . . . . . . 2-12
International transactions . . . . . . . . . . . . . . . . . . . . . . . . . . . . . . . . . . . . . . . . . . . . . . . . . 2-14U.S. data on international transactions . . . . . . . . . . . . . . . . . . . . . . . . . . . . . . . . . . . 2-15
viii
Table of Contents–ContinuedPage
Chapter 3. United States . . . . . . . . . . . . . . . . . . . . . . . . . . . . . . . . . . . . . . . . . . . . 3-1
Introduction . . . . . . . . . . . . . . . . . . . . . . . . . . . . . . . . . . . . . . . . . . . . . . . . . . . . . . . . . . . . . . 3-1Market overview . . . . . . . . . . . . . . . . . . . . . . . . . . . . . . . . . . . . . . . . . . . . . . . . . . . . . . . . . . . 3-1Trade and investment . . . . . . . . . . . . . . . . . . . . . . . . . . . . . . . . . . . . . . . . . . . . . . . . . . . . . . . . 3-10Future prospects . . . . . . . . . . . . . . . . . . . . . . . . . . . . . . . . . . . . . . . . . . . . . . . . . . . . . . . . . . . . 3-14
Chapter 4. Canada and Mexico . . . . . . . . . . . . . . . . . . . . . . . . . . . . . . . . . . 4-1
Introduction . . . . . . . . . . . . . . . . . . . . . . . . . . . . . . . . . . . . . . . . . . . . . . . . . . . . . . . . . . . . . . . 4-1Regional market overview . . . . . . . . . . . . . . . . . . . . . . . . . . . . . . . . . . . . . . . . . . . . . . . . . . . . 4-1Canada . . . . . . . . . . . . . . . . . . . . . . . . . . . . . . . . . . . . . . . . . . . . . . . . . . . . . . . . . . . . . . . . . . . 4-2
Market overview . . . . . . . . . . . . . . . . . . . . . . . . . . . . . . . . . . . . . . . . . . . . . . . . . . . . . . . 4-2Trade and investment . . . . . . . . . . . . . . . . . . . . . . . . . . . . . . . . . . . . . . . . . . . . . . . . . . . . 4-6
Mexico . . . . . . . . . . . . . . . . . . . . . . . . . . . . . . . . . . . . . . . . . . . . . . . . . . . . . . . . . . . . . . . . . . . 4-8Market overview . . . . . . . . . . . . . . . . . . . . . . . . . . . . . . . . . . . . . . . . . . . . . . . . . . . . . . . 4-8Trade and investment . . . . . . . . . . . . . . . . . . . . . . . . . . . . . . . . . . . . . . . . . . . . . . . . . . . . 4-14
Future prospects . . . . . . . . . . . . . . . . . . . . . . . . . . . . . . . . . . . . . . . . . . . . . . . . . . . . . . . . . . . . 4-16
Chapter 5. Europe . . . . . . . . . . . . . . . . . . . . . . . . . . . . . . . . . . . . . . . . . . . . . . . . . . . 5-1
Introduction . . . . . . . . . . . . . . . . . . . . . . . . . . . . . . . . . . . . . . . . . . . . . . . . . . . . . . . . . . . . . . . 5-1Regional market overview . . . . . . . . . . . . . . . . . . . . . . . . . . . . . . . . . . . . . . . . . . . . . . . . . . . . 5-2European Union . . . . . . . . . . . . . . . . . . . . . . . . . . . . . . . . . . . . . . . . . . . . . . . . . . . . . . . . . . . . 5-3
Market overview . . . . . . . . . . . . . . . . . . . . . . . . . . . . . . . . . . . . . . . . . . . . . . . . . . . . . . . 5-3Trade and investment . . . . . . . . . . . . . . . . . . . . . . . . . . . . . . . . . . . . . . . . . . . . . . . . . . . . 5-8
Czech Republic . . . . . . . . . . . . . . . . . . . . . . . . . . . . . . . . . . . . . . . . . . . . . . . . . . . . . . . . . . . . 5-9Market overview . . . . . . . . . . . . . . . . . . . . . . . . . . . . . . . . . . . . . . . . . . . . . . . . . . . . . . . 5-9Trade and investment . . . . . . . . . . . . . . . . . . . . . . . . . . . . . . . . . . . . . . . . . . . . . . . . . . . . 5-12
Future prospects . . . . . . . . . . . . . . . . . . . . . . . . . . . . . . . . . . . . . . . . . . . . . . . . . . . . . . . . . . . . 5-12
ix
Table of Contents–ContinuedPage
Chapter 6. Asia and the Pacific . . . . . . . . . . . . . . . . . . . . . . . . . . . . . . . . . . . 6-1
Introduction . . . . . . . . . . . . . . . . . . . . . . . . . . . . . . . . . . . . . . . . . . . . . . . . . . . . . . . . . . . . . . . 6-1Regional market overview . . . . . . . . . . . . . . . . . . . . . . . . . . . . . . . . . . . . . . . . . . . . . . . . . . . . 6-1Australia . . . . . . . . . . . . . . . . . . . . . . . . . . . . . . . . . . . . . . . . . . . . . . . . . . . . . . . . . . . . . . . . . . 6-4
Market overview . . . . . . . . . . . . . . . . . . . . . . . . . . . . . . . . . . . . . . . . . . . . . . . . . . . . . . . 6-4Trade and investment . . . . . . . . . . . . . . . . . . . . . . . . . . . . . . . . . . . . . . . . . . . . . . . . . . . . 6-6
China . . . . . . . . . . . . . . . . . . . . . . . . . . . . . . . . . . . . . . . . . . . . . . . . . . . . . . . . . . . . . . . . . . . . 6-6Market overview . . . . . . . . . . . . . . . . . . . . . . . . . . . . . . . . . . . . . . . . . . . . . . . . . . . . . . . 6-6Trade and investment . . . . . . . . . . . . . . . . . . . . . . . . . . . . . . . . . . . . . . . . . . . . . . . . . . . . 6-9
Japan . . . . . . . . . . . . . . . . . . . . . . . . . . . . . . . . . . . . . . . . . . . . . . . . . . . . . . . . . . . . . . . . . . . . . 6-9Market overview . . . . . . . . . . . . . . . . . . . . . . . . . . . . . . . . . . . . . . . . . . . . . . . . . . . . . . . 6-9Trade and investment . . . . . . . . . . . . . . . . . . . . . . . . . . . . . . . . . . . . . . . . . . . . . . . . . . . . 6-12
Malaysia . . . . . . . . . . . . . . . . . . . . . . . . . . . . . . . . . . . . . . . . . . . . . . . . . . . . . . . . . . . . . . . . . . 6-13Market overview . . . . . . . . . . . . . . . . . . . . . . . . . . . . . . . . . . . . . . . . . . . . . . . . . . . . . . . 6-13Trade and investment . . . . . . . . . . . . . . . . . . . . . . . . . . . . . . . . . . . . . . . . . . . . . . . . . . . . 6-16
Future prospects . . . . . . . . . . . . . . . . . . . . . . . . . . . . . . . . . . . . . . . . . . . . . . . . . . . . . . . . . . . . 6-17
Chapter 7. Other developing-country markets . . . . . . . . . . . . . . 7-1
Introduction . . . . . . . . . . . . . . . . . . . . . . . . . . . . . . . . . . . . . . . . . . . . . . . . . . . . . . . . . . . . . . . 7-1Regional market overview . . . . . . . . . . . . . . . . . . . . . . . . . . . . . . . . . . . . . . . . . . . . . . . . . . . . 7-1Chile . . . . . . . . . . . . . . . . . . . . . . . . . . . . . . . . . . . . . . . . . . . . . . . . . . . . . . . . . . . . . . . . . . . . . 7-2
Market overview . . . . . . . . . . . . . . . . . . . . . . . . . . . . . . . . . . . . . . . . . . . . . . . . . . . . . . . 7-2Trade and investment . . . . . . . . . . . . . . . . . . . . . . . . . . . . . . . . . . . . . . . . . . . . . . . . . . . . 7-7
Egypt . . . . . . . . . . . . . . . . . . . . . . . . . . . . . . . . . . . . . . . . . . . . . . . . . . . . . . . . . . . . . . . . . . . . 7-7Market overview . . . . . . . . . . . . . . . . . . . . . . . . . . . . . . . . . . . . . . . . . . . . . . . . . . . . . . . 7-7Trade and investment . . . . . . . . . . . . . . . . . . . . . . . . . . . . . . . . . . . . . . . . . . . . . . . . . . . . 7-11
South Africa . . . . . . . . . . . . . . . . . . . . . . . . . . . . . . . . . . . . . . . . . . . . . . . . . . . . . . . . . . . . . . . 7-12Market overview . . . . . . . . . . . . . . . . . . . . . . . . . . . . . . . . . . . . . . . . . . . . . . . . . . . . . . . 7-12Trade and investment . . . . . . . . . . . . . . . . . . . . . . . . . . . . . . . . . . . . . . . . . . . . . . . . . . . . 7-15
Future prospects . . . . . . . . . . . . . . . . . . . . . . . . . . . . . . . . . . . . . . . . . . . . . . . . . . . . . . . . . . . . 7-16
Chapter 8. Summary . . . . . . . . . . . . . . . . . . . . . . . . . . . . . . . . . . . . . . . . . . . . . . . . 8-1
Market conditions . . . . . . . . . . . . . . . . . . . . . . . . . . . . . . . . . . . . . . . . . . . . . . . . . . . . . . . . . . . 8-1Solid waste management . . . . . . . . . . . . . . . . . . . . . . . . . . . . . . . . . . . . . . . . . . . . . . . . . 8-1Hazardous waste management . . . . . . . . . . . . . . . . . . . . . . . . . . . . . . . . . . . . . . . . . . . . . 8-7
Trade and investment . . . . . . . . . . . . . . . . . . . . . . . . . . . . . . . . . . . . . . . . . . . . . . . . . . . . . . . . 8-11
x
Table of Contents–ContinuedPage
AppendicesA. Request letter . . . . . . . . . . . . . . . . . . . . . . . . . . . . . . . . . . . . . . . . . . . . . . . . . . . . . . . . . . . . . . . A-1B. Federal Register notice . . . . . . . . . . . . . . . . . . . . . . . . . . . . . . . . . . . . . . . . . . . . . . . . . . . . . . . B-1C. Choice of disposal method: A comparison of country- and U.S. State-specific data . . . . . . . . C-1D. Solid and hazardous waste services in the General Agreement on Trade in Services . . . . . . . D-1E. Position of interested parties . . . . . . . . . . . . . . . . . . . . . . . . . . . . . . . . . . . . . . . . . . . . . . . . . . . E-1F. Glossary . . . . . . . . . . . . . . . . . . . . . . . . . . . . . . . . . . . . . . . . . . . . . . . . . . . . . . . . . . . . . . . . . . . F-1
Figures1-1. Solid and hazardous waste management: Global market, 2000 . . . . . . . . . . . . . . . . . . . . . . . . 1-58-1. GDP and municipal solid waste per capita, by country, 2000 . . . . . . . . . . . . . . . . . . . . . . . . . 8-68-2. GDP per capita and industry perceptions of toxic waste regulations, by country, 2002 . . . . . 8-12C-1. Share of MSW landfilled and population density, most recent year . . . . . . . . . . . . . . . . . . . . C-6C-2. Share of MSW incinerated and population density, most recent year . . . . . . . . . . . . . . . . . . . C-7C-3. Share of MSW recycled and population density, most recent year . . . . . . . . . . . . . . . . . . . . . C-8C-4. Tipping fees and population density in U.S. states, 2000 . . . . . . . . . . . . . . . . . . . . . . . . . . . . C-9C-5. Tipping fees and landfill use in U.S. states, 2000 . . . . . . . . . . . . . . . . . . . . . . . . . . . . . . . . . . C-10
Tables2-1. Selected indicators of U.S. international transactions in waste and waste services, 2001-2002 and
Jan.-Sept. 2003 . . . . . . . . . . . . . . . . . . . . . . . . . . . . . . . . . . . . . . . . . . . . . . . . . . . . . . . . . . . . . . 2-152-2. U.S. merchandise trade under HS 3825, Jan. 2002 - Sept. 2003 . . . . . . . . . . . . . . . . . . . . . . . . 2-172-3. U.S. merchandise trade under HS 3825, Jan. 2002 - Sept. 2003, by subcategory . . . . . . . . . . . 2-183-1. Selected characteristics of the U.S. solid and hazardous waste services market . . . . . . . . . . . . 3-24-1. Selected characteristics of the Canadian solid and hazardous waste services market . . . . . . . . 4-44-2. Selected characteristics of the Mexican solid and hazardous waste services market . . . . . . . . 4-95-1. Selected characteristics of the European Union (EU) market for solid and hazardous
waste services . . . . . . . . . . . . . . . . . . . . . . . . . . . . . . . . . . . . . . . . . . . . . . . . . . . . . . . . . . 5-45-2. Selected characteristics of the Czech Republic market for solid and hazardous
waste services . . . . . . . . . . . . . . . . . . . . . . . . . . . . . . . . . . . . . . . . . . . . . . . . . . . . . . . . . . 5-106-1. Selected characteristics of the Australian market for solid and hazardous waste services . . . . 6-56-2. Selected characteristics of the Chinese market for solid and hazardous waste services . . . . . . 6-76-3. Selected characteristics of the Japanese solid and hazardous waste services . . . . . . . . . . . . . . 6-106-4. Selected characteristics of the Malaysian market for solid and hazardous waste services . . . . 6-147-1. Selected characteristics of the Chilean solid and hazardous waste services market . . . . . . . . . 7-37-2. Selected characteristics of the Egyptian solid and hazardous waste services market . . . . . . . . 7-87-3. Selected characteristics of the South African solid and hazardous waste services market . . . . 7-138-1. Characteristics of selected solid waste markets . . . . . . . . . . . . . . . . . . . . . . . . . . . . . . . . . . . . . 8-28-2. Characteristics of selected hazardous waste markets . . . . . . . . . . . . . . . . . . . . . . . . . . . . . . . . . 8-88-3. Extent of solid and hazardous waste services trade by certain countries, and measures
affecting such trade . . . . . . . . . . . . . . . . . . . . . . . . . . . . . . . . . . . . . . . . . . . . . . . . . . . . . . 8-13C-1. Disposal of municipal waste, selected countries, year of most recent data . . . . . . . . . . . . . . . C-4D-1. Nature of GATS commitments on refuse disposal services . . . . . . . . . . . . . . . . . . . . . . . D-5D-2. Publically available offers submitted by WTO members on refuse disposal services . . . D-12
OMB No.: 3117--0188
04/04
ITC READER SATISFACTION SURVEYSolid and Hazardous Waste Services: An Examination of U.S. and Foreign Markets
The U.S. International Trade Commission (USITC) is interested in your voluntary com-ments (burden less than 10 minutes) to help assess the value and quality of our reports, and to assistin improving future products. Please return survey by facsimile (202-205-2359) or by mail to theUSITC, or visit the USITC Internet home page(http://reportweb.usitc.gov/reader_survey/readersurvey.html) to electronically submit a Web version ofthe survey.
(Please print; responses below not for attribution):
Your name and title:
Organization (if applicable):
Which format is most useful to you? - CD-ROM - Hardcopy - USITC Internet site
Circle your assessment of each factor below: SA = strongly agree, A = agree, N = no opinion,D = disagree, or SD = strongly disagree.
Value of this report:" Statistical data are useful SA A N D SD. . . . . . . . . . . . . . . . . . . . . . . . . . . . . ." Other non-numerical facts are useful SA A N D SD. . . . . . . . . . . . . . . . . . ." Analysis augments statistical data/other facts SA A N D SD. . . . . . . . . . . ." Relevant topic(s)/subject matter SA A N D SD. . . . . . . . . . . . . . . . . . . . . . . ." Primary or leading source of information on this subject SA A N D SD. .
Quality of this report:" Clearly written SA A N D SD. . . . . . . . . . . . . . . . . . . . . . . . . . . . . . . . . . . . . . ." Key issues are addressed SA A N D SD. . . . . . . . . . . . . . . . . . . . . . . . . . . . . . ." Charts and graphs aid understanding SA A N D SD. . . . . . . . . . . . . . . . . . ." References cite pertinent sources SA A N D SD. . . . . . . . . . . . . . . . . . . . . . .
Other preferred source of information on this subject:
Specify chapters, sections, or topics in report that are most useful:
Identify any type of additional information that should have been included in report:
Suggestions for improving report:
Please update your mailing and electronic addresses below (voluntary)-
Mailing address:
City, state, and zip code:
E-mail address:
UNITED STATESINTERNATIONAL TRADE COMMISSION
WASHINGTON, DC 20436
OFFICIAL BUSINESSPENALTY FOR PRIVATE, USE $300
FOLD
NO POSTAGENECESSARY
IF MAILEDIN THE
UNITED STATES
BUSINESS REPLY MAILFIRST CLASS PERMIT NO. 12840 WASHINGTON, DC
POSTAGE WILL BE PAID BY ADDRESSEE
U.S INTERNATIONAL TRADE COMMISSION500 E STREET, SW.WASHINGTON, DC 20277--2840
ATTN:OFFICE OF INDUSTRIESSolid and Hazardous Waste Services:An Examination of U.S. and Foreign Markets
1 Pollution often traverses national borders (transboundary migration), prompting the needfor multinational action and cooperation. 2 World Trade Organization (WTO), Ministerial Declaration: Adopted on 14 November2001, WT/MIN(01)/DEC/1, Nov. 20, 2001. 3 Executive Order 13141, Environmental Review of Trade Agreements, 64 F.R. 63169,Nov. 18, 1999. 4 For example, the U.S. Trade Representative recently announced that the United Stateswould seek additional input from the public on the anticipated environmental effects of amultilateral trade agreement under the Doha Development Agenda. USTR, ZoellickAnnounces United States Will Seek Additional Public Input on Environmental Trade Effects,press release, Sept. 9, 2003.
1-1
CHAPTER 1INTRODUCTION
Environmental services, including solid and hazardous waste management services,are increasingly important both locally and internationally. With the generation ofwaste on the rise, communities view proper collection, treatment, and disposal asever more critical. Demand for solid and hazardous waste services is growing as aresult of several factors, including the rapid increase in waste generation resultingfrom urbanization and population growth; growing awareness of environmentalissues; the development and enforcement of environmental legislation; andtechnological and economic development. Additionally, the transboundary nature ofcertain environmental issues1 has encouraged international environmentalcooperation, which has likely precipitated increased demand for related services.
The solid and hazardous waste services industry, together with the entireenvironmental services sector, has received special emphasis in the World TradeOrganization (WTO), as the reduction or elimination of barriers affecting trade inenvironmental services has been identified in the Doha Ministerial Declaration2 asone of the principal goals of the present negotiating round. It is believed that as tradein such services grows, exporters, importers, and the environment itself may benefitfrom increased competition that generally reduces costs, increases service quality,improves efficiency, and/or introduces services that were previously unavailable. Environmental issues also have become increasingly tied to international trade andinvestment, such that the environmental impact of a trade agreement is more likely tobe evaluated and considered as a critical component of the agreement underconsideration. For instance, the United States is required by Executive Order3 toperform environmental reviews (ERs) of certain major trade agreements. Theenvironmental review process involves environmental groups and the public in thedevelopment of trade agreements,4 informs trade negotiators of the possibleenvironmental implications of such agreements, and identifies opportunities forenvironmental cooperation between the United States and its trading partners.
This report provides an overview of U.S. and foreign markets for solid and hazardouswaste services; examines trade and investment in solid and hazardous waste servicesmarkets, including barriers affecting such trade and investment, if any; and where
5 Such regulatory practices may include national and subnational environmentalregulations, as well as multinational conventions or agreements on environmental issues thatmay have an effect on this market. 6 For more information regarding the parameters of this report, see appendices A and B. 7 The study includes the transportation of waste, insofar as waste is transported during thecollection process and between various transfer, treatment, and disposal facilities. 8 U.S. Environmental Protection Agency (EPA), Hazardous Waste Overview - Definitions,Identification and Regulations, found at Internet addresshttp://www.epa.gov.fedsite/hazwaste/definition.html, retrieved Oct. 23, 2003. 9 WTO, MTN.GNS/W/120, July 10, 1991. 10 United Nations Statistical Division, 1991.
1-2
possible, discusses existing regulatory practices.5 With regard to the geographiccoverage of this report, information is presented on both developed- anddeveloping-country markets.6
The Scope of the Solid and Hazardous Waste ServicesIndustry
For the purpose of this study, solid and hazardous waste services are defined toinclude the collection of solid and hazardous waste from households and industry;7
the treatment and disposal of solid and hazardous waste by various means; thecollection, separation, and sorting of recyclable materials; waste compacting; wastereduction services; and incidental services such as testing and monitoring servicesrelated to waste disposal. Solid waste typically is defined as nonhazardous wastematerial generated by households, institutions, commercial establishments, andindustries which is discharged from their premises for collection. Solid waste alsoincludes non-hazardous agricultural wastes, mining and quarrying wastes (materialthat is extracted in the process of mining), and energy production wastes such as flyash from power plant furnaces. Hazardous waste is defined by the United StatesEnvironmental Protection Agency as waste that is toxic, flammable, corrosive,radioactive, explosive, or otherwise dangerous.8 Such waste may include motor oil,diesel fuel, gasoline, paint, solvents, batteries, pesticides, infectious or otherwisedangerous medical wastes from hospitals and clinics, asbestos materials, radioactivewastes, and other substances. In general, information regarding the management ofhigh-level nuclear waste (the cleanup of nuclear wastes related to nuclear powergeneration, or the production or disposal of nuclear weapons) was not collected forthis report. However, industry data on hazardous waste services such as thatpublished by Environmental Business International, Inc. (EBI) may reflect, inter alia,high-level nuclear waste management activities. Hazardous waste generallyoriginates from the same sources as solid waste, although the collection,transportation, and disposal methods differ. Methods used to manage the wastestream include landfilling, incineration, composting, dumping and incineration at sea,waste recycling, and waste minimization.
The environmental services division of the World Trade Organization (WTO)’sServices Sectorial Classification List9 (also known as the W/120) is divided into foursubgroups, identified by corresponding Central Product Classification10 (CPC) codes:sewage services, CPC 9401; refuse disposal services, CPC 9402; sanitation and
11 The OECD and the Statistical Office of the European Communities (Eurostat) havedeveloped a system that classifies industrial activities under three broad headings: pollutionmanagement, cleaner technologies and products, and resource management. The UnitedStates, the EU, Canada, and Japan reportedly consider this system to be more applicable to thecurrent state of affairs in the industry than the W/120. OECD/Eurostat, Environmental Goodsand Services Industry Manual for the Collection and Analysis of Data, 1999. 12 Wholesale trade services of waste and scrap are excluded. 13 Quantitative analysis of the solid and hazardous waste services industries is difficult asno comprehensive international statistical definitions exist, classification criteria areconsidered inadequate, and definitions often differ from country to country. 14 The terms and conditions under which WTO signatories accord market access andnational treatment to foreign firms is provided within national schedules of specificcommitments. A commitment also discourages signatories from imposing new measures thatwould restrict entry into the market or the operation of the service. In most schedules,commitments are split into two sections: the “horizontal” commitments that apply to all of thesectors included in the schedule, and industry-specific commitments that apply to trade inservices in a particular sector or subsector. 15 Members report that the fundamental issue is that the environmental services industryhas evolved in recent years. When crafted, the W/120 adequately addressed theenvironmental services industry. However, the classification system is now viewed by someto be outdated and incomplete. Identified shortcomings of the W/120, as it applies toenvironmental services, include its lack of emphasis on pollution prevention, sustainableresource management, facilities development, or services provided directly to industry. 16 For more information, see appendix C.
1-3
similar services, CPC 9403; and other environmental services.11 Solid and hazardouswaste services are captured in the refuse disposal services category, which includescollection, treatment, and disposal services,12 incidental transportation services, andwaste reduction services.13 The W/120 is important to the General Agreement onTrade in Services (GATS), as most Member countries use it as a basis for theirschedules of specific commitments.14 However, some WTO Members contend thatthis classification does not reflect current market conditions,15 and are promoting theuse of a new classification scheme during the current round of WTO servicesnegotiations.16
In general, cross-border trade in waste products is a goods issue and is not includedwithin the scope of the solid or hazardous waste services trade. However, regulationsaffecting trade in wastes may affect the provision of services if such trade involvesthe cross-border transfer of waste between treatment or disposal facilities. Thus, suchregulations are addressed within the study. In contrast, cross-border trade in sortedrecyclable waste products falls completely outside the scope of this report, as manyof these products are valuable commodities that recycling facilities sell as inputs tomanufacturing processes.
17 Environmental Business International (EBI), a principal source of the data presented inthis study, defines the solid and hazardous waste management industries to include collection,transportation, and transfer of solid waste; recycling operations; composting; solid wastedisposal at landfills and incinerators; and the management of medical, nuclear, and hazardousindustrial waste. 18 EBI, The Global Environmental Market by Segment, attachment to an e-mail message,received July 31, 2003. 19 More specifically, in 2000, the United States accounted for $39.8 billion, or 34.5 percent,of the global market for solid waste management services, and $5.2 billion, or 30.1 percent, ofthe global market for hazardous waste management services. Environmental BusinessInternational (EBI), The Global Environmental Market by Region, 2000, attachment to an e-mail message, received July 31, 2003. 20 EBI, The Global Environmental Market by Region, 2000, attachment to an e-mailmessage, received July 31, 2003. 21 Environmental Business Journal, vol. XV, No. 11/12, 2003, p. 3. 22 EBI, EBI’s Products by Industry Segment, found at Internet addresshttp://www.ebiusa.com/segments.html, retrieved Jan. 29, 2004. 23 EBI, EBI Report 2000: The U.S. Environmental Industry and Global Market, Sept. 2001,p. 1-3.
1-4
The Global Market for Solid and Hazardous WasteServices
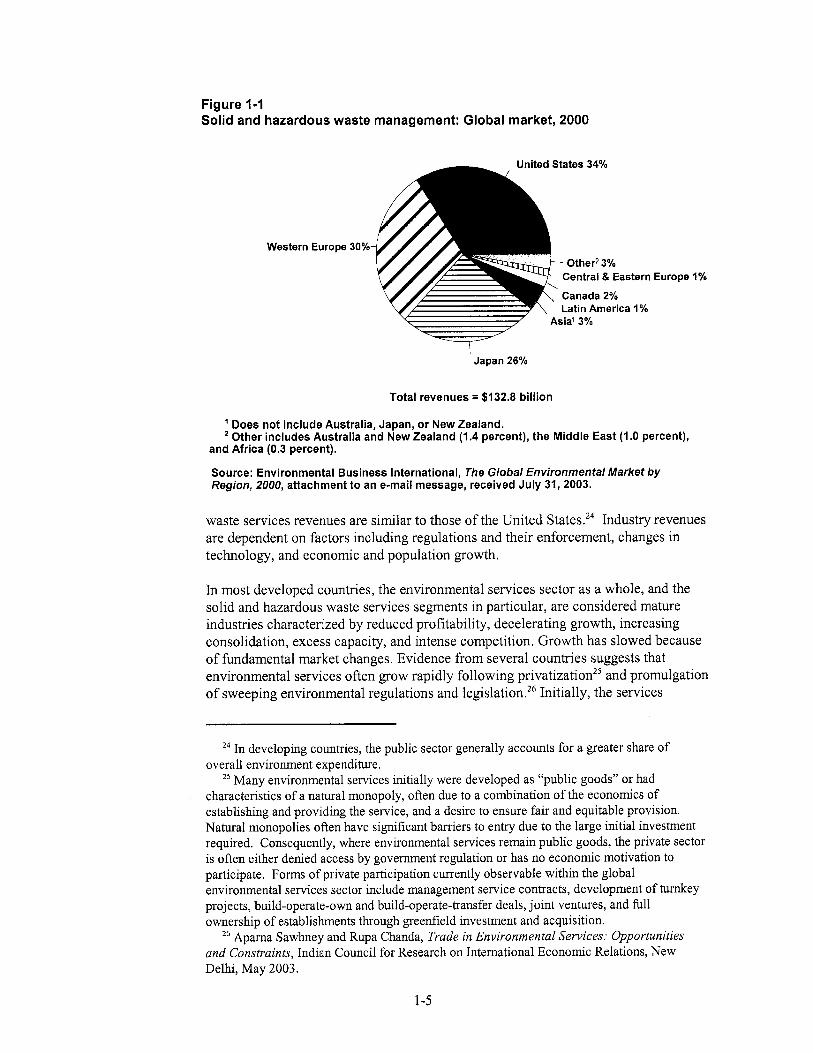
In 2001, the most recent year for which global data are available, solid wastemanagement services and hazardous waste management services17 accounted for 43percent and 6 percent of the $279-billion worldwide environmental services market,respectively.18 The United States is the world’s largest market for solid andhazardous waste services. In 2000, the United States accounted for $45 billion, or 34percent, of the global market for solid and hazardous waste services.19 Other keymarkets for such services included Western Europe and Japan (figure 1-1), whichrespectively accounted for 30 percent and 26 percent of the combined global marketfor solid and hazardous waste management services.20 The global solid andhazardous waste services industry has been consolidating as large firms have mergedto expand their range of goods and services offerings, thereby improving theircompetitive posture. In 2001, the world’s largest solid and/or hazardous wasteservices firms included Onyx (a subsidiary of French firm Veolia Environment, solidand hazardous waste services), Sita (a subsidiary of French firm Suez, solid wasteservices), Waste Management Inc. (United States, solid waste services), Allied Waste(United States, solid waste services), and RWE Entsorgung (Germany, solid wasteservices).21
Typically, the most prominent consumers of solid waste management services aremunicipalities, and industrial and commercial clients. Principal consumers ofhazardous waste management services include government agencies, and chemicaland petroleum production and processing facilities.22 Both public-sector and private-sector firms participate in most solid and hazardous waste services marketsthroughout the world. In 2001, the private sector accounted for 69 percent of revenuegenerated by the U.S. solid waste management services industry, and for 96 percentof revenues generated by the U.S. hazardous waste services industry.23 In many otherdeveloped markets, the public/private ratios for solid and hazardous
27 Industry representative, interview with USITC staff, Washington, DC, Nov. 5, 2003. 28 It would reportedly cost a total of $70 billion per year to manage municipal solid wastein developing countries. Data contained in David Waskow, International Policy Analyst andTrade Policy Coordinator, Friends of the Earth-USA, Washington, DC, written submission tothe Commission, Nov. 5, 2003. 29 Industry representative, interview with USITC staff, Washington, DC, Nov. 12, 2003. 30 For more information regarding GATS commitments on refuse disposal services, seeappendix C. 31 A large share of all environmental services trade, including solid and hazardous wasteservices trade, likely takes place through modes 3 and 4; i.e., production and consumptionoccur inside the territorial/legal jurisdiction of the importing state.
1-6
providers often faced excess demand due to a backlog of existing work that needed tobe completed under the new regulations. In the United States and other developedcountries, most waste-generating firms have had time to comply with theenvironmental standards, and have moved forward toward reducing or eliminatingwaste before it is generated, further reducing the need for environmental services.27 Consequently, cleaner technologies– those that reduce pollutants at the source– andresource management are likely to be areas of future emphasis and growth, althoughindustry revenues will derive principally from providing waste management,pollution control, waste cleanup, and other “end-of-pipe” services.
In many developing countries, solid and hazardous waste services markets are small,but are experiencing rapid growth. In these countries, the environmental reformprocess is just beginning, often in response to a critical need for environmentalimprovements. Many countries have expressed significant interest in environmentalissues, going so far as to pass strict environmental legislation. However, many ofthese countries lack the funds to carry out their ambitious environmental programs.28 Industry reports that this lack of capital is the most significant hurdle facing the development of solid and hazardous waste management markets in newlyindustrializing countries.29
Approximately 30 percent of WTO Member States made commitments on refusedisposal services under the GATS.30 Restrictions on trade specified in thesecommitments are limited. However, measures included in Member countries’horizontal commitments--which generally focus on purchase or rental of property,equity holdings, residency requirements for directors, tax and subsidy measures, andvisa provisions such as quotas and length of stay31--as well as measures affectingrelated sectors such as architecture, engineering, or construction may have animportant impact on the foreign provision of waste management services. Potentialimpediments to trade that fall outside the scope of the GATS may increase the cost ofsupply, reduce demand, or eliminate the provision of the service altogether. Forexample, as governments are among the principal consumers of solid and hazardouswaste services, preferential public procurement practices may serve as restrictions onthe foreign provision of a service.
ApproachThis report presents an overview of the global market for solid and hazardous wasteservices, organized by region. Chapter two of this report presents a literature review
32 The Commission had gathered for presentation in this report the most up-to-date anddetailed trade and investment data available. There is a considerable paucity of data in thisfield. For this reason, the Commission complements available data with characterizations oftrade flows and balances where necessary and appropriate.
1-7
of extant work on service technologies, market trends, trade, and investment in thesolid and hazardous waste services industries. Chapters three through seven examinesolid and hazardous waste in the United States, Canada and Mexico, Europe, Asiaand the Pacific, and certain developing-country markets in other world regions. These chapters follow a similar format that includes a market overview for eachregion, an examination of the trade and investment environment insofar as datapermit,32 and a discussion of future prospects for the solid and hazardous wasteservices industry. In addition, each chapter includes profiles of selected markets, inwhich market and trade information for key regional markets is presented. Chapter 8summarizes the information presented in previous chapters to reveal current trends inthe global solid and hazardous waste services market. Additional information –including the USTR’s request letter, the Federal Register notice, data on disposalmethods, an overview of GATS commitments and negotiations on solid andhazardous waste services, positions of interested parties, and a glossary of terms –can be found in the appendicies to this report.

1 William Rathje and Cullin Murphy, Rubbish! The Archeology of Garbage (Tucson:University of Arizona Press, 2000). 2 The definition of municipal solid waste (MSW) varies from country to country, as domost other definitions pertaining to waste flows and disposal. For the purposes of thischapter, the term as used here generally excludes hazardous waste. The Organization forEconomic Cooperation and Development (OECD) describes municipal waste as “wastecollected and treated by or for municipalities,” including “waste from households, similarwaste from commerce and trade, office buildings, institutions and small businesses, yard andgarden waste, street sweepings, the content of litter containers, and market cleansing waste”and excluding municipal sewage waste and municipal construction and demolition waste. (OECD Environmental Data Compendium 2002: Waste (Paris: OECD), p. 10) OECD data onsolid waste generated by sector for the United States consists only of municipal solid waste. OECD data for other countries includes a significant quantity of waste generated by theagriculture, manufacturing, mining, energy, water, construction and other sectors. It is notclear where data on such waste streams fits into U.S. data reporting systems.
2-1
CHAPTER 2SOLID AND HAZARDOUS WASTESERVICES: INDUSTRY OVERVIEWAND LITERATURE REVIEW
IntroductionThis chapter provides background on the types of materials included in solid andhazardous waste streams and the technologies of collection, treatment, and disposal. As noted, differences in technology (between methods of disposal, betweencountries, and over time) influence the conditions of supply in the industry. Changesin the amount of waste generated and in the state of regulation influence theconditions of demand. These fundamental determinants of supply and demand, inconjunction with other forces such as economic growth and the relative prices ofenergy and recyclable materials, influence the structure of the industry. This chapterdraws on a variety of sources in discussing these economic considerations, includingpublished economic analyses, industry and trade journals, and published data.
Data pertaining to solid and hazardous waste pose special challenges in terms ofdefinitions and comparability between geographic locations and over time. Forexample, the U.S. Environmental Protection Agency (EPA) estimates the types ofmaterials entering the solid waste stream based on production and materials flowspassing through the economy, adjusted for international trade and estimates ofproduct lifetimes and supplemented with survey data. Alternately, the compositionof certain solid waste streams can be estimated directly by sampling the contents oflandfills, as in the University of Arizona’s Garbology Project.1 The trade publicationBiocycle estimates the amount of U.S. municipal solid waste (MSW),2 and itsdistribution among management technologies such as landfilling, recycling, andincineration, by gathering data from state-level authorities. Biocycle estimates of
3 Richard C. Porter, The Economics of Waste (Washington, DC: Resources for the Future,2002), p .4. 4 Environmental Business International, Inc. (EBI), EBI Report 2000: The U. S.Environmental Industry and Global Market, Sept. 2002, pp. 1-3, 1-4. Of the private-industryrevenues originating from private-sector clients, about 60 percent ($9.8 billion) is estimated aspaid for by industrial clients and about 40 percent ($6.5 billion) by commercial or otherclients. 5 USITC calculations based on table 1-1 in Porter, The Economics of Waste, p. 3.
2-2
annual generation of MSW in the United States can be as much as 50 percent higherthan EPA estimates.3 The variety of methods used to compile waste-related data,and the discrepancies between them, imply that many of the characterizations of theindustry below should be considered as tentative.
Activities and Technology
Solid Waste
Sources of Solid Waste
An estimated 60 percent ($24.5 billion) of U.S. solid waste management revenues in2001 were generated by public-sector customers, with the other 40 percent ($16.3billion) originating in the private sector. By contrast, 31 percent ($12.7 billion) ofrevenues were earned by public-sector entities, while the balance of U.S. revenueswere earned by the private sector.4 This implies that the public sector in the UnitedStates pays the private sector to supply about half of the solid waste managementservices it consumes while supplying the other half itself. Waste managementservices purchased by the public sector generally include disposal services for MSW,which is generated by households and small industrial or commercial establishmentsthat rely on the municipal disposal system, as well as disposal services forgovernment entities. Small industrial or commercial establishments may alsocontract directly with private firms to dispose of their waste, or engage in self-disposal (for example, households may haul trash in a private vehicle directly to alocal landfill or recycling center).
The physical composition of solid waste varies widely from country to country, in away which reflects consumption patterns at different levels of income. For example,one study found that about 75 percent of solid waste in urban areas of India consistsof putrescent matter (primarily food wastes), with another 15 to 20 percent consistingof ceramics, dust, ash, and stones. In the United States, by contrast, less than 40percent of waste is putrescent matter, while over 60 percent consists of materials suchas paper, plastic, rubber, leather, glass and metals which represent discarded or worn-out manufactured goods.5 These materials are relatively scarce in developing-country waste, and are often removed by scavengers before the waste reaches an
6 In Jakarta, for example, scavengers regularly tore apart MSW that had already beenmachine-compacted and baled by the city’s sanitation agency. See Carl R. Bartone, Janis D.Bernstain, and Frederick Wright (1990), Investments in Solid Waste Management:Opportunities for Environmental Improvement. Policy, Research and External AffairsWorking Paper No. 405 (Washington, DC: World Bank, Infrastructure and UrbanDevelopment Department, 1990), pp. 18-19. 7 U.S. International Trade Commission, The Dynamic Effects of Trade Liberalization: AnEmpirical Analysis (Publication 3069, Oct. 1997), pp. 10-10 to 10-15. 8 Data arising from the Calcutta Municipal Corporation show that between 1970 and 1993the share of municipal wastes in Calcutta (now Kolkata) accounted for by paper, polythene,plastic, glass, metal, and rubber increased from 5.35 percent to 12.15 percent, with the shareof “vegetable and putrescible fractions” remaining fairly steady at 40.37 percent in 1970 and41.00 percent in 1993. Of the latter, coconut shells alone account for 6.20 percent ofmunicipal wastes and rising. See Snigdha Chakrabarti, Indian Statistical Institute,“Economics of Solid Waste Management: A Survey of the Existing Literature,” 2003,processed. 9 Porter, The Economics of Waste, p. 52. 10 Jerry A. Nathanson, Basic Environmental Technology: Water Supply, WasteManagement, and Pollution Control, 4th addition (Upper Saddle River, New Jersey andColumbus, Ohio: Prentice-Hall, 2003), p. 339.
2-3
organized disposal process, or during that process.6 The lower ratio of putrescentmatter to manufactured material in U.S. wastes may be due, in part, to greaterconsumption of processed foods and to the use of household garbage disposals,which direct wastes to water and wastewater treatment facilities. Waste is the by-product of consumption, and these patterns are consistent with the higher share offood in the material consumption of developing countries and the higher share ofmanufactures in the material consumption of developed countries.7 In the course ofdevelopment, the composition of waste may gradually evolve in the direction impliedby developed-country consumption patterns.8
These patterns of waste composition have implications for collection and disposaltechniques. Putrescent matter is moist and relatively resistant to compaction. It canbe landfilled, composted, or burned at an incinerator or waste-to-energy facility, butgenerally cannot be recycled by other means. Its moisture content may also causebreakdown in the operation of compacting garbage trucks, which are expensive torepair.9 Putrescent matter is biodegradable. The process of biodegradation causesrelease of greenhouse gases such as methane and carbon dioxide, which are noxiousat ground level and (in the case of methane) explosive. Recovered methane can beused for energy generation, as will be discussed in the section on landfills below. The disposal of “hard” manufactured materials such as paper, glass, and metal yieldsnonbiodegradable wastes. These wastes are both easier to compact and more likelyto be recyclable than biodegradable wastes. Paper waste is amenable to the greatestnumber of techniques of disposal, as it is recyclable, biodegradable, and compostable(though with less efficiency than food wastes), and can be burned in incinerators.
Collection
About two-thirds of the costs of MSW management in the United States are related tocollection and transportation of the material from the point of generation to thelocation of processing and ultimate disposal.10 This can include temporary storage orcontainerization of the waste at a transfer station. Part of these costs relate to the
11 Linda N. Edwards and Franklin R. Edwards, “Wellington-Winter Revisited: The Case ofMunicipal Sanitation Collection,” Industrial and Labor Relations Review, vol. 35, No. 3, Apr.1982, pp. 307-318. 12 By contrast, incineration can reduce volume of MSW by about 90 percent and weight byabout 75 percent. Nathanson, Basic Environmental Technology, p. 343. 13 Porter, The Economics of Waste, pp. 51-52. 14 “The State of Garbage in America,” Biocycle, vol. 42, No. 12, Dec. 2001, p. 43. 15 Nathanson, Basic Environmental Technology, p. 341. 16 Porter, The Economics of Waste, p. 50 and studies cited thereat; and Nathanson, BasicEnvironmental Technology, pp. 341.
2-4
labor-intensive nature of garbage truck operations; unionized sanitation workers,particularly in public-sector operations, have significant bargaining power.11 Municipal garbage-compacting trucks can reduce waste volumes by over 50 percent. For materials that will eventually be landfilled, most of the volume reduction takesplace in this compacting operation.12 Waste collection operations have relatively feweconomies of scale and thus are naturally decentralized to the municipal level, thoughsome large firms own and operate collection facilities.
Waste collection is an even more labor-intensive activity in developing countries,where carts or non-compacting vehicles may be used, accompanied by crews withbaskets, shovels, or cans. The use of non-closed vehicles can lead to spillage backonto the street. As noted above, capital-intensive compaction technologies may beless appropriate for developing-country waste, because of its high share of putrescentmatter. In addition, large and wide trucks may not fit through narrow developing-country streets.13 Alternatively, households may bring trash to neighborhood bins or“skips,” which are periodically emptied. In poorer countries, a significant share oftrash may go uncollected because neither households nor governments are willing orable to fund a comprehensive collection program.
The high costs of transportation provide strong incentives for the establishment oftransfer stations. For example, the number of landfills in the United States hasdecreased sharply over time, from nearly 8,000 in 1988 to 2,142 in 2000;14 thus, theaverage distance from individual households and commercial establishments to thelandfill has correspondingly increased. This has provided incentives for theestablishment of transfer stations. Transfer stations permit the achievement of someeconomies of scale, as compacted waste from up to eight individual trucks can beconsolidated onto a single tractor-trailer which then makes only one trip to thelandfill and back.15 The incentives to establish transfer stations vary depending ontransport costs, the initial capital cost of the transfer station, and the degree ofrealizable economies of scale associated with consolidation into larger trucks. Typical estimates indicate that the economical limit for one-way waste hauling by anindividual truck is approximately 12-20 miles.16
17 For a comparison of the predominant disposal methods employed in certain countries andU.S. states, see appendix C. 18 Leachate is the contaminated liquid by-product of solid waste that has percolated throughthe soil or some other medium. Environmental Protection Agency (EPA), “Terms ofEnvironment,” found at Internet address http://www.epa.gov/OCEPAterms/lterms.html,retrieved Mar. 17, 2004; and Nathanson, Basic Environmental Technology, p. 511. 19 Nathanson, Basic Environmental Technology, pp. 361-370. 20 For example, in the United States, the Resource Conservation and Recovery Act (RCRA)of 1976 banned open dumping. A 1988 EPA report prepared under the Hazardous and SolidWaste Amendments of 1984 led to the promulgation of new regulations in 1991, which werephased in during 1991-1998. These regulations, known as the Solid Waste Disposal FacilityCriteria, in many cases represented a significant tightening of existing state standards; in othercases state standards were and remain higher. The criteria require that solid waste landfilloperators demonstrate their ability to pay for closure, postclosure care, and cleanup oflandfills; prevent hazardous waste from being accepted; control insects and rodents; monitormethane gas leakage; and cover landfills with six inches of soil at the end of each day. Operators of landfills must not burn wastes or accept liquid wastes, and may not locate inenvironmentally unsafe areas. (Porter, The Economics of Waste, p. 60). See chapter 5 for moreinformation on the U.S. regulatory system.
2-5
Methods of Disposal 17
Landfilling
Removal of municipal solid wastes to centralized locations outside city limits is apractice that dates to ancient times. The modern sanitary landfill incorporates anumber of technological processes that distinguish it from an open dump. Theseinclude:
• pre-preparation of the site, preferably with an impermeable liner to minimizecontamination of groundwater by leachate;
• spreading out and compacting the waste with heavy machinery, which prolongsthe life of the landfill by reducing volume;
• covering the waste each day with a layer of compacted soil, which minimizes gasrelease into the atmosphere;
• monitoring of water quality of leachate18 and, if necessary, collection andtreatment of leachate to an appropriate standard.19
The relative costs of landfilling depend on the value of land in alternate uses. Landfills tend to be more prevalent in lightly populated areas than in denselypopulated locations where real estate values are higher. Costs associated withlandfilling also have reportedly increased as regulatory standards have increased overtime.20 Owing to the presence of regulatory costs, economies of scale in landfillingare significantly greater than in waste collection. Thus, there has been a trend towardfewer and larger landfills, with each one being supplied with waste from a growingnumber of sources.
Closed landfills may be restored and converted to such uses as parks, golf courses, orin some cases paved over and put to commercial use. Regulatory standards andliability issues usually preclude closed landfills from being reconverted to residentialuse.
21 Porter, The Economics of Waste, pp. 67-69. 22 Nathanson, Basic Environmental Technology, pp. 367-368. 23 EPA, found at Internet address http://www.epa.gov/docs/epacfr40/chapt-I.info/60tc.htm/,retrieved Nov. 14, 2003. 24 Nathanson, Basic Environmental Technology, p. 343. 25 Porter, The Economics of Waste, p. 77.
2-6
Landfill gas is produced as a result of the natural decomposition of the organiccomponent of solid waste. After aerobic bacteria absorb the oxygen in the soil,anaerobic bacteria produce methane and other gases, which can pass through soil orrise to the surface, accumulating in basements and similar structures. If not captured,methane mixed in sufficient concentrations with air can be explosive, and can alsocause death by poisoning if directly inhaled. Minimization of such hazards withoutcommercial recovery of the gas is accomplished by gathering the gas in a perforatedpipe installed in a “vent layer” of the landfill cap and releasing the gas through apipe. Facilities for landfill gas recovery are costly, but the production of a saleableproduct may compensate for these costs and, if profitable, pay for other costs ofmaintaining a closed landfill. The potential profitability of a landfill gas recoveryoperation is difficult to determine ex ante.21
Commercial recovery of methane is accomplished through the use of gas extractionwells and membrane permeation systems, which permit separation of the saleablemethane from CO2 and other unsaleable gases. In a sufficiently moist landfill, gasproduction occurs rapidly at first and is mostly complete after about 20 years. However, the rate of decomposition, and thus the rate of gas production, can beaccelerated by adding moisture.22 Natural gas can be sold or used to generateelectricity which can be sold to the grid. Landfill gas recovery operations areregulated primarily for air pollution purposes.23
Incineration
In most cases, incineration of MSW is performed for the purposes of waste-to-energyconversion, though a small amount of incineration for pure volume reduction appearsto take place in Japan and other countries. As a technology for reducing the volumeand weight of solid waste, incineration often outperforms such alternatives asshredding, pulverizing, baling, and (for organic wastes) composting, reducingvolume by about 90-95 percent and producing both “bottom ash” and “fly ash,”which rises in flue gases. Much of the fly ash can be recaptured with air pollutioncontrol technologies, and then tested to see if it warrants disposal as hazardouswaste.24 Bottom and fly ash can also be combined with lime and water to form roadconstruction base material. This method of ash disposal is particularly popular inEurope.25 Some incinerator ash is also landfilled in what are known as “monofills,” aspecialized form of hazardous-waste disposal facility.
The relative cost of land affects the incentives for incineration. A higher share ofMSW is incinerated in affluent, land-poor areas than in land-abundant locations. Incineration is usually a revenue-generating operation since the vast majority ofincinerators worldwide are waste-to-energy operations, using the combustion processto heat boilers which drive steam turbines for electricity generation. Sinceincineration is a continuous-flow process, it is significantly more likely to be efficientfrom an engineering standpoint, and profitable from an economic standpoint, when
26 Ibid., pp. 70-85; and Jeffrey Morris, “Competition Between Recycling and Incineration,”prepared for Gowling, Strathy and Henderson on behalf of the City of Toronto, Ontario, 1996,found at Internet address http://www.mindfully.org/Plastic/Recycling-And-Incineration.htm/,retrieved Nov. 14, 2003. 27 “The State of Garbage in America,” Biocycle, p. 46. 28 For example, in 1997 Chicago announced that it was meeting a state-level goal of 25percent recycling, half of which was accounted for by yard waste used as landfill cover. Sincelandfill cover is useful (on the landfill, rather than in it), this counted as recycling even thoughthe yard waste included so much glass and other debris as to be uncompostable. In 1996 NewYork City raised its reported recycling rate from 14 percent to the legally mandated 25 percentby counting as recycled abandoned autos that the city towed and sold to junkyards, as well asconstruction debris that was pulverized and used for road construction at the Fresh Killslandfill. Porter, The Economics of Waste, p. 4. 29 Nathanson, Basic Environmental Technology, pp. 352-360.
2-7
the incinerator receives a continuous flow of waste. This enables the full economiesof scale of the incinerator equipment to be exploited. For this reason, it is customaryfor incinerators to engage in contracts with governments in order to guarantee astream of inputs. Nonetheless, reductions in available materials resulting fromincreased recycling or cost reduction efforts by business, combined with increases inregulatory costs have meant that many incinerators operate below capacity. This, inturn, has led to the closure of facilities or to significantly higher tipping fees relativeto landfills.26
Recycling
Metal, glass, plastic, paper, and other manufactured materials that enter the wastestream can potentially be withdrawn therefrom and reprocessed for use as productioninputs. Recycling is commonly associated with the materials described above, whichare the focus of household trash sorting for curb pickup or delivery to the recyclingcenter. However, some states classify composting; the recovery of scrap autos,motor oil, construction and demolition debris, household batteries, or ash; and “food-to-people” programs as recycling while others do not.27 The absence of a uniformdefinition creates both a potential lack of comparability in data for differentgeographical locations and across time, as well as difficulties in interpreting theresults of government-mandated recycling targets.28
In practice, recycling can be accomplished through a variety of technologies,including household hand sorting and curbside collection of sorted or unsortedmaterials. Specialized recycling trucks now exist, which store paper and commingledglass, metals, and plastics in separate compartments. The commingled materials canbe delivered to a materials recycling facility (MRF) which uses a combination ofelectromagnetic separation, vibration, air blowing, and hand sorting to separate thematerials into marketable components, while paper (newsprint, cardboard, and mixedpaper including magazines and junk mail) is handled in a separate stream.29
The recovery rate is highest for materials for which the cost of recycled materials islow relative to virgin materials. The relative energy costs of producing recycled andvirgin materials are a significant determinant of total relative costs. For example,aluminum, which accounts for less than 1.5 percent of MSW, provides the largestshare of recycling revenue (perhaps more than 50 percent) because of the high energycosts associated with extracting aluminum from bauxite ore.
30 Such a requirement was imposed in Germany in 1991, and led to the “Green Dot”program, which is implemented as a separate materials collection system, Duales SystemDeutschland (DSD), operated by a consortium of German manufacturers and running inparallel to government municipal waste collection. Porter, The Economics of Waste, pp. 33-34. 31 “The State of Garbage in America,” p. 43. 32 A retrospective account is given by Aaron Rutkoff et al., “BP Shulman Makes A StinkOver Unwanted Garbage Barge,” found at Internet addresshttp://www.queenstribune.com/anniversary2003/garbagebarge.htm/, retrieved Nov. 14, 2003. 33 In retrospect, as the Mobro’s voyage was an anomalous and nonrecurring event, it wasprobably not an indicator that the United States was running out of landfill space.
2-8
In principle, the incentives for recycling should vary with both the prices ofrecoverable materials (positively) and the price of land (also positively). When landis expensive, other things being equal, markets encourage both recycling andincineration at the expense of landfills. The propensity to recycle is also influencedby other economic and noneconomic factors. A large share of the recyclable wastestream is paper, a combustible material that is in high demand by incinerators. Recycling is encouraged by government policies such as mandated targets forrecycling, container deposit legislation, and requirements that manufacturers gatherand dispose of the packing waste they produce.30
Regardless of data issues, it seems clear that the share of U.S. waste managedthrough recycling has increased sharply since the late 1980s, going from about 8percent of MSW in 1990 to 31 percent in 2001.31 It is unclear whether economicincentives such as land scarcity or rising prices for recyclables are primarilyresponsible for this trend. Landfill tipping fees and the prices of recyclable materialssuch as aluminum, newspaper, and cardboard have increased only modestly in thelast 15 years, and at times have undergone price reversals, while the increase in theshare of MSW devoted to recycling has increased virtually without pause. Thissuggests that consumer attitudes and changes in household behavior may have had asignificant effect on recycling rates. It is interesting to note that the initial upsurge inrecycling corresponds in time with the 1987 odyssey of the garbage barge Mobro4000 from Queens, New York. The Mobro was denied landing rights by five statesand two Latin American countries, due to allegations that samples of its contentscontained hazardous waste.32 This story was widely covered by the news media andlikely had an effect on public discussion of solid waste treatment policy andrecycling.33
Illegal disposal
While illegal disposal is not per se an activity of the solid and hazardous wasteservices industry, a brief mention of this phenomenon is warranted in order tocomplete the picture of the flow of materials in the industry. The service of handlingand treating wastes is costly. Haulers pay tipping fees to landfills and incinerators,and in some cases, businesses and households pay fees (other than mandatory localtaxes) directly to haulers. Alternately, households may have to buy or rentdesignated bags or cans in order to receive curbside hauling service. Any attempt toimplement a “pay-as-you-throw” principle, and thus to align private and social costsof waste removal and treatment, may create incentives to avoid payment by illegaldumping (also known as “midnight dumping” or, in Britain, “fly tipping”). Illegal
34 H. Sigman, “Midnight Dumping: Public Policies and Illegal Disposal of Used Oil,”RAND Journal of Economics, vol. 29, No. 1, Spring 1998, pp. 157-178. 35 USC Title 42, Chapter 82. 36 The text of RCRA is available at the Legal Information Institute, U.S. Code Collection,found at Internet address http://www4.law.cornell.edu/uscode/42/6903.html/, retrieved onNov. 17, 2003. 37 Metric units generated by USITC calculation. 38 U.S. Environmental Protection Agency, The National Biennial RCRA Hazardous WasteReport (Based on 2001 Data), found at Internet addresshttp//:www.epa.gov/epaoswer/hazwaste/data/brsol/national.pdf/, retrieved Nov. 17, 2003, pp.1-3, 1-4; and USITC calculations. 39 U.S. Environmental Protection Agency, The National Biennial RCRA Hazardous WasteReport, pp. 1-4. Basic chemicals, petroleum and coal refining, and rubbers, plastics,synthetic fibers and related industries accounted for 58.5 percent of all recorded hazardouswastes in 2001 (p. 1-7 and USITC staff calculations). 40 As mentioned in chapter 1, information regarding the management of high-level nuclearwastes generally was not collected for this report.
2-9
dumping can take place in a variety of forms, including littering or the unauthorizeduse of commercial dumpsters by households. Hazardous wastes may also be illegallydumped. According to some estimates, as much as 13 percent of used oil in theUnited States may be dumped illegally, purportedly as a consequence of policies inabout two-thirds of the states that prohibit used oil disposal except by specialtreatment.34 Thus, an increase in the relative price or the regulatory restrictionsassociated with any mode of disposal can cause both substitution toward other modesof disposal, and possibly an increase in illegal dumping, which may reduce therevenues available to the waste management industry, but is particularly difficult toquantify.
Hazardous Waste
Hazardous waste is defined in the regulatory system by the potential effects of thewaste. For example, in the United States, the Resource Conservation and RecoveryAct (RCRA) of 1976 as amended35 defines hazardous waste as solid wastes that “maycause, or significantly contribute to an increase in mortality or an increase in seriousirreversible, or incapacitating reversible illness ... or pose a substantial present orpotential hazard to human health or the environment when improperly treated, stored,transported, or disposed of...”36 Hazardous waste generation is concentrated among afew sources. In 2001, 19,000 different sources produced 37.1 million metric tons37 of hazardous waste in the United States, but the top 50 sources accounted for about two-thirds of the total.38 In practice, a large share of waste classified as hazardous in theUnited States originates in the chemical and petrochemical industries. Morespecifically, in 2001 the top 17 generators of hazardous waste in the United Stateswere all either chemical firms or refiners.39 The management of medical wastes andnuclear wastes40 accounted for approximately 27 percent and 18 percent,
41 EBI Report 2000, p. 11-2. 42 This refers to on-site use of chemical byproducts as fuels, including fuel blending. Fuelblending prior to energy recovery at another site is classified separately by the EPA. 43 U.S. Environmental Protection Agency, The National Biannial RCRA Hazardous WasteReport, pp. 2-35. 44 Nathanson (2003), pp. 373-395. 45 V. Kerry Smith and William Desvouges, “The Value of Avoiding a LULU: HazardousWaste Disposal Sites,” Review of Economics and Statistics, vol. 68, No. 2, May 1986, pp.293-299. The acronym LULU denotes “locally undesirable land use.” 46 See Bruno S. Frey, Felix Oberholster-Gee and Reiner Eichenberger, “The Old LadyVisits Your Backyard: A Tale of Morals and Markets,” Journal of Political Economy, vol.104, No. 6, pp. 1297-1313, Dec. 1996, which analyzes this phenomenon in the case of a Swisssearch for a nuclear waste depository. 47 Robert Cameron Mitchell and Richard T. Carson, “Property Rights, Protest, and theSiting of Hazardous Waste Facilities,” American Economic Review, vol. 76, No. 2, May 1996,pp. 285-290.
2-10
respectively, of total revenues of the U.S. hazardous waste services industry in 2001,while the management of industrial wastes accounted for the balance of revenues.41
Methods of Disposal
Hazardous wastes are disposed of by a large variety of methods. The top sixmethods, accounting for over two-thirds of U.S. managed hazardous wastes forwhich the disposal or treatment method is recorded, are (1) deepwell or otherunderground injection, (2) aqueous organic treatment, (3) aqueous inorganictreatment, (4) landfill/surface impoundment, (5) energy recovery,42 and (6)incineration.43 Aqueous treatment of wastes involves oxidation/reduction reactions toneutralize acidic or metallic contamination. Technologies that are similar to thoseused to dispose of nonhazardous solid wastes generally are modified to deal with thetoxic nature of hazardous wastes. For instance, buried hazardous waste drums mayinclude additional filtering layers to control leachate. The transportation ofhazardous waste is more heavily regulated than the transportation of solid wastes. Inthe United States, hazardous waste transportation includes labeling of containers andtrucks and the maintenance of manifests for tracking purposes.44
Siting
There is an extensive literature on the siting of hazardous waste facilities. Manypeople are unwilling to live close to a hazardous waste facility, even if it isregulated.45 The relative scarcity of publicly acceptable sites for hazardous wastedisposal as compared to solid waste disposal requires the transport of hazardouswastes over longer distances on average and makes the realization of economies ofscale in disposal or treatment relatively more important.46 The conflict betweendesires of homeowners to avoid living near a hazardous waste facility and broadersocial desires for disposal or treatment of such wastes can also lead to postponementof final disposal and treatment decisions and increase incentives for illegal“midnight” dumping.47
48 David N. Beede and David E. Bloom, “Economics of the Generation and Management ofMunicipal Solid Waste,” NBER Working Paper No. 5116, ( Cambridge, Mass.: NationalBureau of Economic Research, May 1995). 49 See Nemat Shafik and Sushenjit Bandyopadhyay, Economic Growth and EnvironmentalQuality: Time-Series and Cross-Country Evidence," World Bank Working Paper No. 904,1992, (Background Paper for World Development Report 1992) for an early example of thisresearch. 50 For a general review of the literature on the association of environmental policy with percapita income, see Simone Borghesi (1999), “The Environmental Kuznets Curve: A Survey ofthe Literature,” found at Internet addresshttp://www.feem.it/NR/rdonlyres/1D089671-FFCF-42F9-BA15-DEB9E2A581F1/138/8599.pdf/, retrieved Dec. 9, 2003. For recent findings questioning the conventional inverted-U shapefound with respect to air pollution, see William T. Harbaugh, Arik Levenson, and DavidMolloy Wilson, “Reexamining the Empirical Evidence for an Environmental Kuznets Curve,”Review of Economics and Statistics, vol. 84, No. 3, Nov. 2002, pp. 541-551.
2-11
Waste Generation and Demand Across countries, the generation of MSW increases both as population increases andas per capita income increases, but is probably more closely tied to population than toincome. World Resources Institute data cited in Beede and Bloom (1995) indicatethat Australia’s per capita generation of MSW by weight was less than four times thatof Mozambique in 1990, though Australia’s per capita income was over 27 times thatof Mozambique. Similar patterns hold for other countries. The authors’ estimatesbased on cross-country data imply that the elasticity of national MSW generationwith respect to population is around 1.04 (i.e., a one-percent increase in populationleads to about a one-percent increase in MSW), while the elasticity with respect toper capita income is around 0.34 (i.e., a one-percent increase in per capita incomeleads to about a one-third percent increase in MSW). Estimates on time-series datafor Taiwan and the United States yield income elasticities which are higher than thecross-country estimate, but still less than 1. Thus, it seems likely that the globaldistribution of MSW is disproportionately in developed countries when viewed inproportion to population, but disproportionately in developing countries whenviewed in proportion to national income.48
There is evidence that countries prioritize environmental issues according to percapita income, following a hierarchy-of-needs approach in which the lowest-incomecountries direct limited resources to address the most urgent problems by adoptingtechnologies that are appropriate to their particular needs. Increases in income mayresult in the assignment of resources to additional environmental problems.49 Forexample, even small improvements in per capita income are associated withimprovements in drinking water quality, because of the high rate of mortality andmorbidity associated with water-borne diseases. Air and water pollution havesometimes been said to follow “environmental Kuznets curves” with an inverted U-shape, getting worse as countries advance from low-income to middle-income statusand then improving, although this finding has been questioned by more recentresearch.50 The World Bank’s World Development Report 1992 reported a positiveassociation between MSW per capita and per capita income across the entire range ofper capita income, reinforcing the idea that waste production increases with percapita income. While affluent countries are likely to devote more resources to allenvironmental problems, this finding may suggest that demand for solid and
51 EBI Report 2000, pp. 9-31 and 9-32.
2-12
hazardous waste management may be even more likely to be concentrated indeveloped countries than demand for other environmental services. The findings ofthis report, as illustrated in chapter 8 (figure 8-1), also suggest that there is a positiverelationship between per capita income and per capita MSW generation.
Industry Structure
Size and scale of firms
Because of the economies of scale in landfilling and incineration, large firms have acomparative advantage in the solid waste management market. As discussed above,the steadily declining number of landfills in the United States has been linked to thepush for greater economies of scale in this market segment. There are approximately12,000 private firms and municipalities that provide solid waste services in theUnited States. Three of these firms !Waste Management, Inc. (WMI), Allied WasteIndustries, and Republic Services ! account for 47 percent of private revenues fromMSW, and the top 13 firms account for 58 percent of such revenues. In thesubcategory of waste-to-energy (incineration), three firms (Ogden Projects,Wheelabrator Technologies, and American Ref-Fuel) account for 54 percent ofrevenues.51 As the United States is the world’s largest market for solid wastemanagement services, it follows that if the degree of technological economies ofscale in landfilling and incineration in the U.S. market were captured in othermarkets, the number of sustainable firms in those markets would be correspondinglysmaller. A possible exception is Japan, where the total quantity of MSW incineratedis about 20 - 30 percent larger than the U.S. level, depending on whether waste-to-energy incineration or all incineration is included. Thus, it is in principle possiblethat the size of the Japanese market allows either a larger minimum efficient scale ofincinerator, or more incinerators, or both.
Organization of firms
As alluded to above, there are economies of scale for industrial landfills. This is alsotrue for incinerators, due to the engineering characteristics of process flowtechnologies. There may be further economies of scale in jointly operating a networkof transport facilities, transfer stations, and landfills over a large geographical area insuch a manner as to take full advantage of the potential tradeoffs between scaleeconomies and transport costs.
There are also advantages to internalization of related activities within firms, eitherthrough vertical integration or self-provision of services. Advantages (both technicaland financial) in vertical integration between hauling and disposal activities includestability in disposal prices as companies are reluctant to raise tipping fees on theirown trucks. Also, control of collection routes ensures a constant supply of materialsinto company-owned landfills and prevents defections when competitors reducetipping fees. Of course, the key to this integration is to maximize what industryparticipants call the “internalization ratio,” the amount of waste hauled by the firm
52 EBI Report 2000, p. 9-33. 53 In EPA’s The National Biannial RCRA Hazardous Waste Report, there is a very closecorrespondence between the identities of the 50 largest hazardous waste generators andhazardous waste managers. The list of 50 largest hazardous waste managers does not includeany of the three firms mentioned by EBI as the largest firms in hazardous waste management. None of these three firms had revenues exceeding $1 billion in 2001. 54 EBI Report 2000 , pp. 11-11, 11-15. 55 OECD Environmental Data 2000: Waste, pp. 17-18 and USITC calculation. Acorroborating piece of evidence with respect to nuclear waste, for which data may be betterthan for other components of hazardous waste streams, is that total spent nuclear fuel arisingsin the OECD-25 by weight have declined by 15 percent from their peak in 1992 thru 2001(Ibid., p. 27). A sharp drop in nuclear waste in the United Kingdom appears to account formuch of this decline.
2-13
that is disposed of in company-controlled facilities. The higher the percentage, themore stable the firm’s operating environment.52
In the case of hazardous waste, internalization is most likely to take place betweenthe production and disposal of hazardous waste - that is, firms generating the wasteare likely to dispose of the waste on-site. This facilitates cost reduction bymotivating waste minimization and increasing opportunities for the recovery of theproductive value of waste chemical streams.53
Corresponding with the increasing internalization of hazardous waste managementwithin the waste generating industries themselves is a decline in revenues generatedby the U.S. hazardous waste industry, which fell from about $6.5 billion in 1992 to$2.7 billion in 2001 (not adjusting for inflation) and likely will continue to decline.54 International comparison data show a similar pattern, with the United States possiblybeing ahead with regard to on-site management of hazardous waste andcorresponding reductions in total revenue generation. Using national definitions(which are generally comparable over time if not across countries), total productionof hazardous waste in weight terms has declined 80 percent in the United States from1995-99, and has declined over 50 percent from recent historic peaks in Mexico (71percent reduction during 1997-2000), Korea (65 percent reduction during 1992-2000), the Czech Republic (64 percent reduction during 1996-99), and Poland (69percent reduction during 1996-2000). More modest declines from recent historicpeaks have occurred in Japan, Finland, Hungary, the Netherlands, Norway, theSlovak Republic, Switzerland, and the United Kingdom.55 Production of hazardouswastes may be on the increase in France, Germany, Italy, Russia, and some othercountries, though for certain countries a lack of recent data makes this unclear. Also,there is significant volatility in year-to-year figures, which may result from changesin definitions and/or enforcement. Nonetheless, the evidence is fairly strong insupport of a secular downward trend in the total amount of hazardous waste availablefor processing throughout the developed world, and the amount that presents itself tothe market for processing by hazardous waste management firms.
56 OECD Environmental Data 2002 - Wastes, pp. 17-19.
2-14
International Transactions
There are three types of international transactions pertaining to solid and hazardouswaste services recorded in U.S. data. These include:• merchandise trade transactions, which record physical shipments of waste across
borders;• services transactions on the current account, which record payments for waste
management services such as treatment or disposal; and• sales by overseas affiliates of multinational firms providing waste treatment or
disposal services, both those arising from U.S. direct investment abroad and fromforeign direct investment in the United States.
In some instances, the treatment of a particular shipment of waste may involve morethan one of these activities. For example, waste may be shipped physically fromcountry A to country B, with the producer of waste in country A paying a firm incountry B to manage the waste. From the standpoint of country A, this would berecorded as an export of waste as merchandise, and an import of services on theservices portion of the current account. Alternately, a producer of waste may shipwaste to another firm within its own country for management, with the wastemanagement firm being an affiliate of a foreign-owned firm. This transaction wouldnot be recorded either on the merchandise trade or services portions of the currentaccount. However, data reflecting the operations of the waste management firm willappear in surveys of direct investment, and the waste management firm itself mayengage in related transactions which affect balance-of-payments data. Theseexamples may not exhaust the ways in which the treatment and disposal of solid andhazardous waste can affect data on international transactions.
Only a small fraction of solid and hazardous waste crosses international borders. Data on international trade in solid wastes are spread across a number of differentcategories, some of which are specific to the type of material being traded and someof which do not always distinguish between material for final disposal and materialfor recovery and reuse. Internationally traded hazardous wastes are declared bymanifest by many countries under the Basel Convention. The smaller the country,the more likely that waste will be traded across international borders. AvailableOECD data on hazardous wastes imply that for a number of countries, exports and/orimports of hazardous wastes exceed 10 percent of local production of such wastes. These countries include Austria, Denmark, Ireland, Luxembourg, the Netherlands,Sweden, and Switzerland. In most cases, countries engage in two-way trade inhazardous wastes, although some countries tend to run a persistent surplus or deficit. Consistent net importers of hazardous waste (and thus, probable net exporters ofhazardous waste services) include Canada, Mexico, France, Spain, and the UnitedKingdom. Consistent net exporters of hazardous waste (and thus, probable netimporters of hazardous waste services) include Austria, Denmark, Germany, Ireland,Italy, Luxemborg, and Switzerland.56 The data in table 2-1 suggest that inernationalprovision of waste-related services is much more likely to take place through FDI-related activity of affiliates than through arms’ length trade in services. In somecases, one country may physically ship wastes to another country, which then
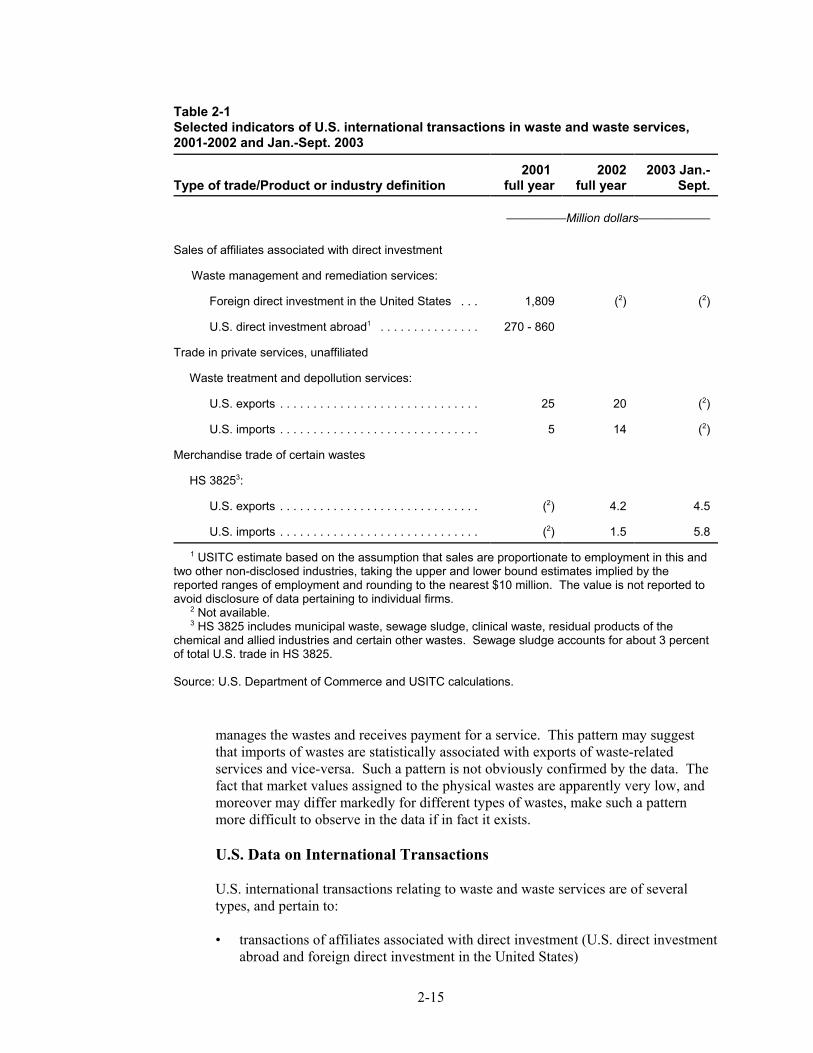
2-15
Table 2-1Selected indicators of U.S. international transactions in waste and waste services,2001-2002 and Jan.-Sept. 2003
Type of trade/Product or industry definition2001
full year2002
full year2003 Jan.-
Sept.
—————Million dollars——————
Sales of affiliates associated with direct investment
Waste management and remediation services:
Foreign direct investment in the United States . . . 1,809 (2) (2)
U.S. direct investment abroad1 . . . . . . . . . . . . . . . 270 - 860
Trade in private services, unaffiliated
Waste treatment and depollution services:
U.S. exports . . . . . . . . . . . . . . . . . . . . . . . . . . . . . . 25 20 (2)
U.S. imports . . . . . . . . . . . . . . . . . . . . . . . . . . . . . . 5 14 (2)
Merchandise trade of certain wastes
HS 38253:
U.S. exports . . . . . . . . . . . . . . . . . . . . . . . . . . . . . . (2) 4.2 4.5
U.S. imports . . . . . . . . . . . . . . . . . . . . . . . . . . . . . . (2) 1.5 5.8
1 USITC estimate based on the assumption that sales are proportionate to employment in this andtwo other non-disclosed industries, taking the upper and lower bound estimates implied by thereported ranges of employment and rounding to the nearest $10 million. The value is not reported toavoid disclosure of data pertaining to individual firms. 2 Not available. 3 HS 3825 includes municipal waste, sewage sludge, clinical waste, residual products of thechemical and allied industries and certain other wastes. Sewage sludge accounts for about 3 percentof total U.S. trade in HS 3825.
Source: U.S. Department of Commerce and USITC calculations.
manages the wastes and receives payment for a service. This pattern may suggestthat imports of wastes are statistically associated with exports of waste-relatedservices and vice-versa. Such a pattern is not obviously confirmed by the data. Thefact that market values assigned to the physical wastes are apparently very low, andmoreover may differ markedly for different types of wastes, make such a patternmore difficult to observe in the data if in fact it exists.
U.S. Data on International Transactions
U.S. international transactions relating to waste and waste services are of severaltypes, and pertain to:
• transactions of affiliates associated with direct investment (U.S. direct investmentabroad and foreign direct investment in the United States)
57 Not elsewhere specified or included.
2-16
• unaffiliated (arms’ length) transactions in services• merchandise trade in solid or hazardous waste itself, which may be transported
across borders for purposes of treatment. Exports of waste may be associatedwith imports of waste treatment services and vice versa, though there may beexceptions to this rule.
Table 2-1 compares selected indicators pertaining to sales by affiliates, unaffiliatedtrade in private services, and merchandise trade in waste. The definition of wasteservices may not be identical for affiliated and unaffiliated services trade, and thedefinition of waste traded as merchandise may not conform precisely to thedefinitions employed elsewhere in the report. The trade classification HTS 3825 isdefined as “residual products of the chemical or allied industries, nesoi,57 municipalwastes, sewage wastes, other wastes specified in note 6 to chapter 38.” In particular,HTS 3825, as reported, does not include wastes associated with the petrochemicalsindustry, which may be treated as hazardous waste but which may often be recycled. The 4-digit code may also exclude other relevant waste.
From table 2-1 it is possible to infer that sales by affiliates associated with directinvestment in the waste management services industries are one or two orders ofmagnitude larger than unaffiliated sales of such services (hundreds of millions orbillions of dollars annually as opposed to tens of millions of dollars). It also appearslikely that sales by affiliates of foreign-owned firms in the United States are severaltimes larger than sales by U.S.-owned affiliates abroad, even though the value of thelatter is uncertain owing to data disclosure issues. Finally, the values assigned to thewaste traded are very low (millions of dollars a year) as compared to the values ofservices associated with waste treatment. Data for HS 3825 are not available prior to2002.
Table 2-2 shows the country-by-country breakout of U.S. merchandise trade inwastes captured by HS 3825. The largest share of U.S. trade (42 percent of the total)is with Canada, in relation to which the United States is a net importer of waste,suggesting that U.S. firms are providing waste management services to the Canadianmarket. The United States is a net exporter of wastes under HS 3825 to other majortrading partners for the 21 months (January 2002-September 2003) for which data areavailable. The most significant of these are the United Kingdom (15 percent of totalU.S. waste trade), China (6 percent) and El Salvador (5 percent).
Table 2-3 presents the main types of waste traded under HS 3825. The largest shareof such trade comprises various chemical waste flows (HS 3825.49 through HS3825.90), which may be either treated as hazardous wastes or recycled. The UnitedStates is a heavy net exporter of chemical wastes in all categories except HS 3825.90,a large and miscellaneous category in which trade is nearly balanced. Imports ofmunicipal waste, sewage sludge, clinical waste, and most categories of chemicalwastes are dominated by imports from Canada.
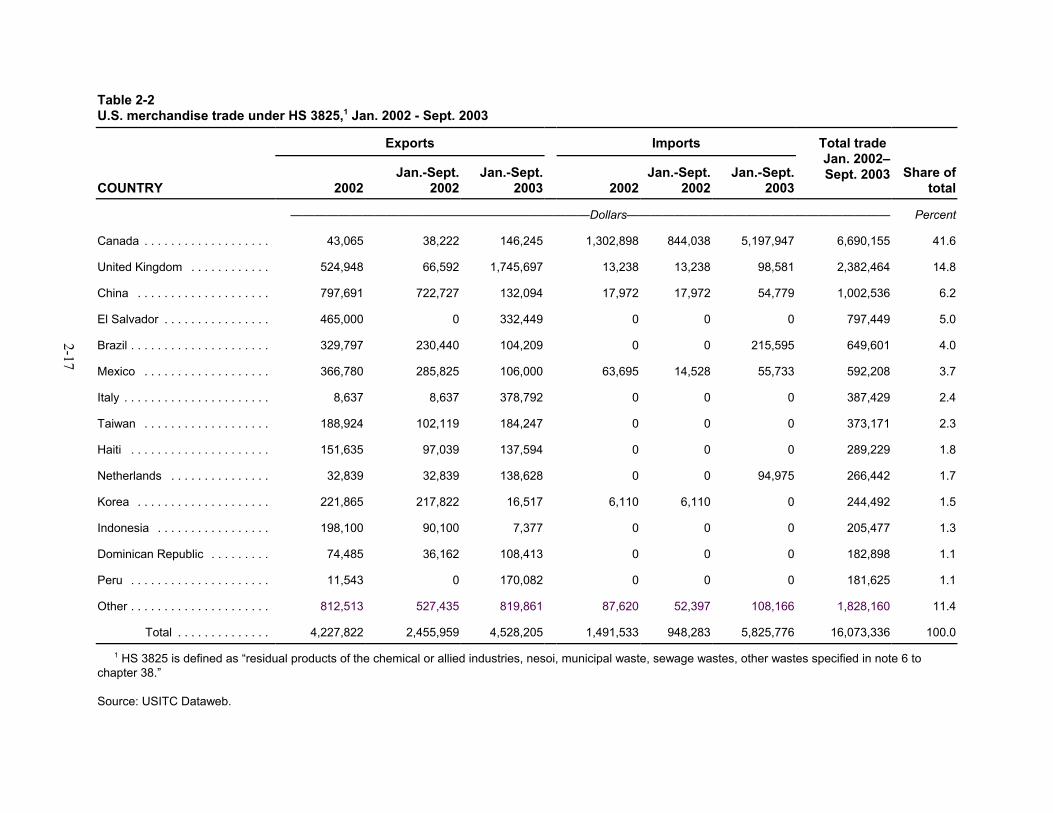
2-17
Table 2-2U.S. merchandise trade under HS 3825,1 Jan. 2002 - Sept. 2003
Exports Imports Total trade Jan. 2002–Sept. 2003 Share of
totalCOUNTRY 2002Jan.-Sept.
2002Jan.-Sept.
2003 2002Jan.-Sept.
2002Jan.-Sept.
2003
—————————————————————————Dollars—————————————————————— Percent
Canada . . . . . . . . . . . . . . . . . . . 43,065 38,222 146,245 1,302,898 844,038 5,197,947 6,690,155 41.6
United Kingdom . . . . . . . . . . . . 524,948 66,592 1,745,697 13,238 13,238 98,581 2,382,464 14.8
China . . . . . . . . . . . . . . . . . . . . 797,691 722,727 132,094 17,972 17,972 54,779 1,002,536 6.2
El Salvador . . . . . . . . . . . . . . . . 465,000 0 332,449 0 0 0 797,449 5.0
Brazil . . . . . . . . . . . . . . . . . . . . . 329,797 230,440 104,209 0 0 215,595 649,601 4.0
Mexico . . . . . . . . . . . . . . . . . . . 366,780 285,825 106,000 63,695 14,528 55,733 592,208 3.7
Italy . . . . . . . . . . . . . . . . . . . . . . 8,637 8,637 378,792 0 0 0 387,429 2.4
Taiwan . . . . . . . . . . . . . . . . . . . 188,924 102,119 184,247 0 0 0 373,171 2.3
Haiti . . . . . . . . . . . . . . . . . . . . . 151,635 97,039 137,594 0 0 0 289,229 1.8
Netherlands . . . . . . . . . . . . . . . 32,839 32,839 138,628 0 0 94,975 266,442 1.7
Korea . . . . . . . . . . . . . . . . . . . . 221,865 217,822 16,517 6,110 6,110 0 244,492 1.5
Indonesia . . . . . . . . . . . . . . . . . 198,100 90,100 7,377 0 0 0 205,477 1.3
Dominican Republic . . . . . . . . . 74,485 36,162 108,413 0 0 0 182,898 1.1
Peru . . . . . . . . . . . . . . . . . . . . . 11,543 0 170,082 0 0 0 181,625 1.1
Other . . . . . . . . . . . . . . . . . . . . . 812,513 527,435 819,861 87,620 52,397 108,166 1,828,160 11.4
Total . . . . . . . . . . . . . . 4,227,822 2,455,959 4,528,205 1,491,533 948,283 5,825,776 16,073,336 100.0
1 HS 3825 is defined as “residual products of the chemical or allied industries, nesoi, municipal waste, sewage wastes, other wastes specified in note 6 tochapter 38.”
Source: USITC Dataweb.
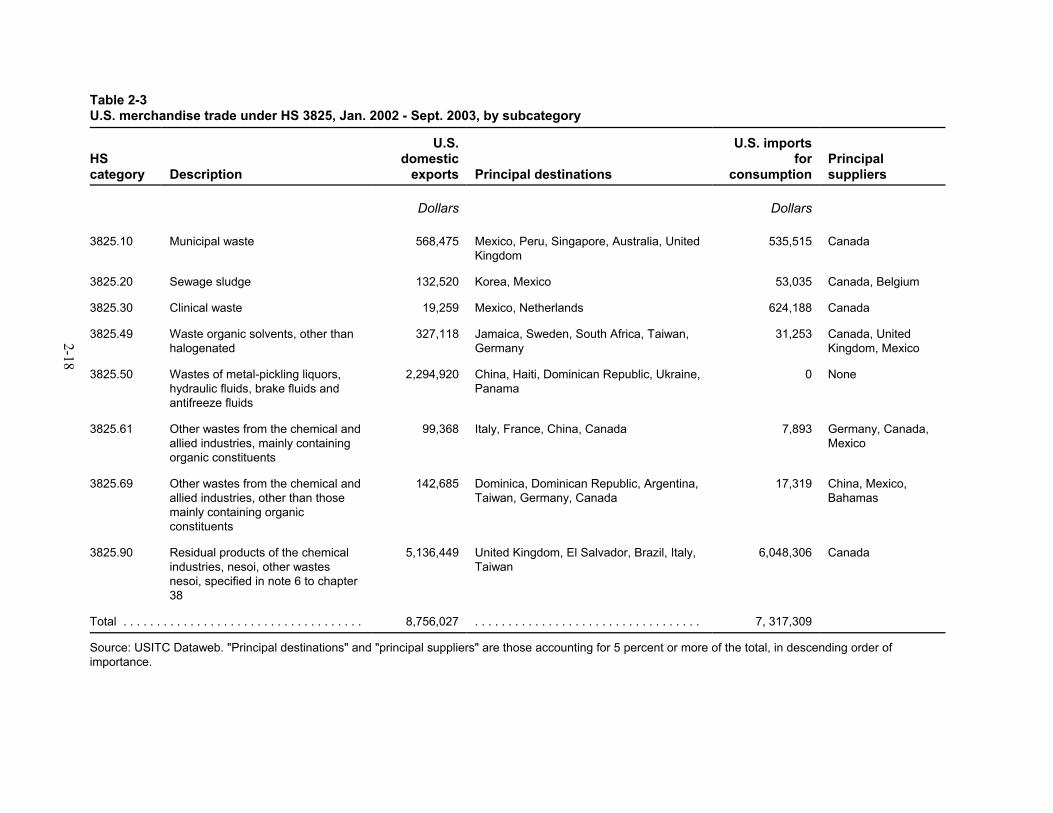
2-18
Table 2-3U.S. merchandise trade under HS 3825, Jan. 2002 - Sept. 2003, by subcategory
HScategory Description
U.S.domestic
exports Principal destinations
U.S. importsfor
consumptionPrincipalsuppliers
Dollars Dollars
3825.10 Municipal waste 568,475 Mexico, Peru, Singapore, Australia, UnitedKingdom
535,515 Canada
3825.20 Sewage sludge 132,520 Korea, Mexico 53,035 Canada, Belgium
3825.30 Clinical waste 19,259 Mexico, Netherlands 624,188 Canada
3825.49 Waste organic solvents, other thanhalogenated
327,118 Jamaica, Sweden, South Africa, Taiwan,Germany
31,253 Canada, UnitedKingdom, Mexico
3825.50 Wastes of metal-pickling liquors,hydraulic fluids, brake fluids andantifreeze fluids
2,294,920 China, Haiti, Dominican Republic, Ukraine,Panama
0 None
3825.61 Other wastes from the chemical andallied industries, mainly containingorganic constituents
99,368 Italy, France, China, Canada 7,893 Germany, Canada,Mexico
3825.69 Other wastes from the chemical andallied industries, other than thosemainly containing organicconstituents
142,685 Dominica, Dominican Republic, Argentina,Taiwan, Germany, Canada
17,319 China, Mexico,Bahamas
3825.90 Residual products of the chemicalindustries, nesoi, other wastesnesoi, specified in note 6 to chapter38
5,136,449 United Kingdom, El Salvador, Brazil, Italy,Taiwan
6,048,306 Canada
Total . . . . . . . . . . . . . . . . . . . . . . . . . . . . . . . . . . . . 8,756,027 . . . . . . . . . . . . . . . . . . . . . . . . . . . . . . . . . . 7, 317,309
Source: USITC Dataweb. "Principal destinations" and "principal suppliers" are those accounting for 5 percent or more of the total, in descending order ofimportance.
1 Metric units generated by USITC staff calculation. 2 U.S. Environmental Protection Agency (EPA), Office of Solid Waste and EmergencyResponse (OSW), Municipal Solid Waste in the United States: 2001 Facts and Figures,EPA530-R-03-001, Oct. 2003. The EPA does not report data on total solid waste. EPAestimates include data for containers and packaging; durable goods such as furniture,appliances, and consumer electronics; nondurable goods such as newspapers and clothing; andother wastes such as food scraps and yard trimmings. Solid wastes excluded from EPA dataon municipal solid waste include municipal sludge, industrial nonhazardous waste,construction and demolition (C and D) debris, and agricultural, oil and gas, and miningwastes. Industry estimates for solid waste generation, which include data for certain solidwaste excluded from EPA data on MSW, exceeded 363 million metric tons in 2001,considerably higher than EPA’s estimates for MSW and based on methodologies substantiallydifferent from the one developed by EPA. 3 Expressed in pounds per person per day, generation totaled 4.5 in 1990 and 4.4 in 2001. EPA, OSW, Municipal Solid Waste in the United States: 2001 Facts and Figures.
3-1
CHAPTER 3UNITED STATES
Introduction
As the world’s largest market for waste management services, the U.S. market ismature, competitive, and highly regulated. In recent years, no major regulations orlegislation affecting waste management services have emerged to stimulate newgrowth in the market, and thus, the U.S. market for waste management services is inthe process of consolidating. The United States has recently become a net importerof solid and hazardous waste services, owing to efforts by leading U.S. firms to focuson domestic businesses. Although nearly all U.S. solid waste management firmsoperate only in the domestic market, one of the leading U.S. solid waste managementfirms has a leading market position in Canada. Moreover, a few U.S. hazardouswaste management firms provide services in Canada and Mexico.
This chapter presents an overview of the U.S. market’s size, key suppliers andconsumers, principal technologies, and regulation; addresses the nature and extent ofU.S. trade and investment in the industry; and discusses the future outlook for theU.S. market for waste management services.
Market OverviewThe United States generated about 208 million metric tons1 of municipal solid waste(MSW) in 2001 (table 3-1),2 reflecting a decrease of about 3 million metric tons, or 1percent, below the previous year, and an increase of 22 million metric tons over1990. Municipal solid waste generation per capita has remained relatively stablesince 1990 but decreased 5 percent during 1999-2001.3 The EPA estimates that
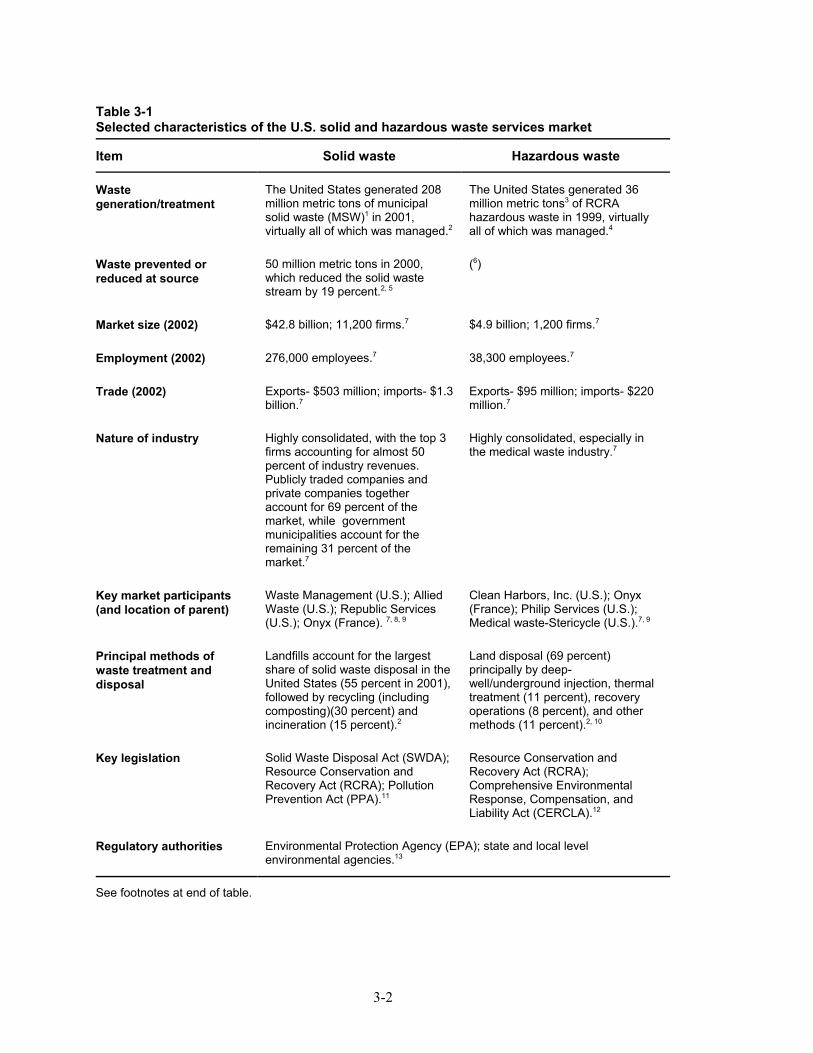
3-2
Table 3-1Selected characteristics of the U.S. solid and hazardous waste services market
Item Solid waste Hazardous waste
Wastegeneration/treatment
The United States generated 208million metric tons of municipalsolid waste (MSW)1 in 2001,virtually all of which was managed.2
The United States generated 36million metric tons3 of RCRAhazardous waste in 1999, virtuallyall of which was managed.4
Waste prevented orreduced at source
50 million metric tons in 2000,which reduced the solid wastestream by 19 percent.2, 5
(6)
Market size (2002) $42.8 billion; 11,200 firms.7 $4.9 billion; 1,200 firms.7
Employment (2002) 276,000 employees.7 38,300 employees.7
Trade (2002) Exports- $503 million; imports- $1.3billion.7
Exports- $95 million; imports- $220million.7
Nature of industry Highly consolidated, with the top 3firms accounting for almost 50percent of industry revenues. Publicly traded companies andprivate companies togetheraccount for 69 percent of themarket, while governmentmunicipalities account for theremaining 31 percent of themarket.7
Highly consolidated, especially inthe medical waste industry.7
Key market participants(and location of parent)
Waste Management (U.S.); AlliedWaste (U.S.); Republic Services(U.S.); Onyx (France). 7, 8, 9
Clean Harbors, Inc. (U.S.); Onyx(France); Philip Services (U.S.);Medical waste-Stericycle (U.S.).7, 9
Principal methods ofwaste treatment anddisposal
Landfills account for the largestshare of solid waste disposal in theUnited States (55 percent in 2001),followed by recycling (includingcomposting)(30 percent) andincineration (15 percent).2
Land disposal (69 percent)principally by deep-well/underground injection, thermaltreatment (11 percent), recoveryoperations (8 percent), and othermethods (11 percent).2, 10
Key legislation Solid Waste Disposal Act (SWDA);Resource Conservation andRecovery Act (RCRA); PollutionPrevention Act (PPA).11
Resource Conservation andRecovery Act (RCRA);Comprehensive EnvironmentalResponse, Compensation, andLiability Act (CERCLA).12
Regulatory authorities Environmental Protection Agency (EPA); state and local levelenvironmental agencies.13
See footnotes at end of table.
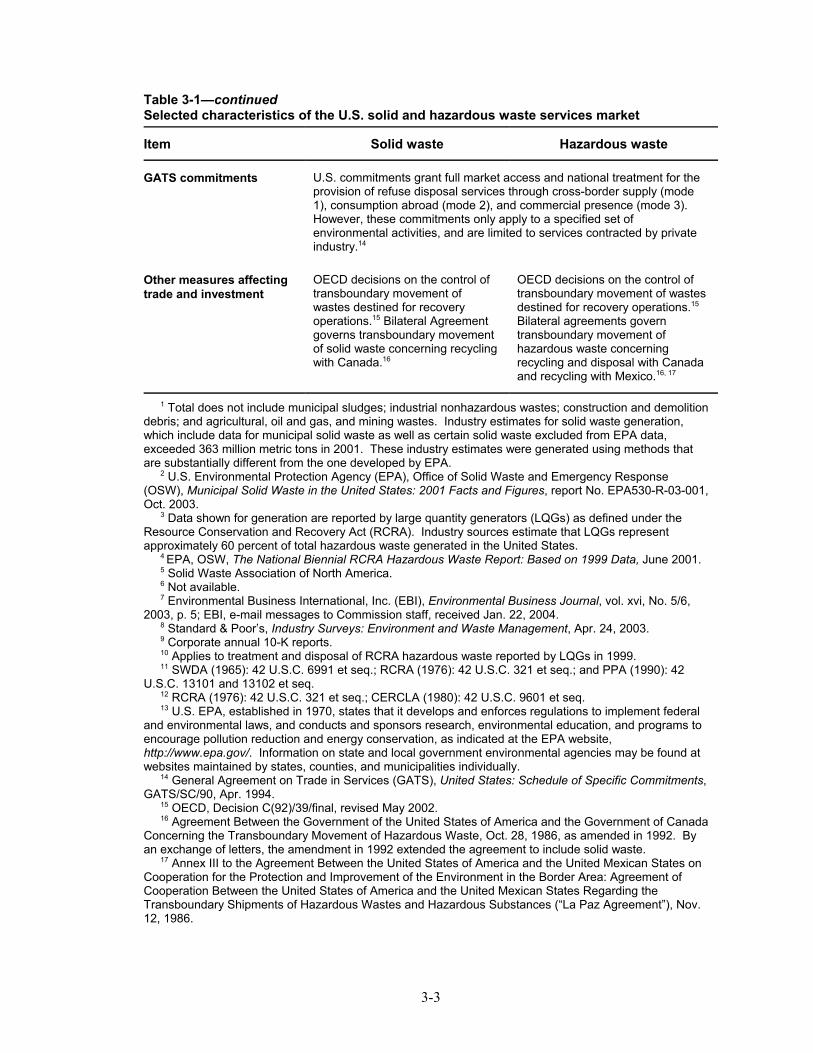
3-3
Table 3-1—continuedSelected characteristics of the U.S. solid and hazardous waste services market
Item Solid waste Hazardous waste
GATS commitments U.S. commitments grant full market access and national treatment for theprovision of refuse disposal services through cross-border supply (mode1), consumption abroad (mode 2), and commercial presence (mode 3). However, these commitments only apply to a specified set ofenvironmental activities, and are limited to services contracted by privateindustry.14
Other measures affectingtrade and investment
OECD decisions on the control oftransboundary movement ofwastes destined for recoveryoperations.15 Bilateral Agreementgoverns transboundary movementof solid waste concerning recyclingwith Canada.16
OECD decisions on the control oftransboundary movement of wastesdestined for recovery operations.15
Bilateral agreements governtransboundary movement ofhazardous waste concerningrecycling and disposal with Canadaand recycling with Mexico.16, 17
1 Total does not include municipal sludges; industrial nonhazardous wastes; construction and demolitiondebris; and agricultural, oil and gas, and mining wastes. Industry estimates for solid waste generation,which include data for municipal solid waste as well as certain solid waste excluded from EPA data,exceeded 363 million metric tons in 2001. These industry estimates were generated using methods thatare substantially different from the one developed by EPA. 2 U.S. Environmental Protection Agency (EPA), Office of Solid Waste and Emergency Response(OSW), Municipal Solid Waste in the United States: 2001 Facts and Figures, report No. EPA530-R-03-001,Oct. 2003. 3 Data shown for generation are reported by large quantity generators (LQGs) as defined under theResource Conservation and Recovery Act (RCRA). Industry sources estimate that LQGs representapproximately 60 percent of total hazardous waste generated in the United States. 4 EPA, OSW, The National Biennial RCRA Hazardous Waste Report: Based on 1999 Data, June 2001. 5 Solid Waste Association of North America. 6 Not available. 7 Environmental Business International, Inc. (EBI), Environmental Business Journal, vol. xvi, No. 5/6,2003, p. 5; EBI, e-mail messages to Commission staff, received Jan. 22, 2004. 8 Standard & Poor’s, Industry Surveys: Environment and Waste Management, Apr. 24, 2003. 9 Corporate annual 10-K reports. 10 Applies to treatment and disposal of RCRA hazardous waste reported by LQGs in 1999. 11 SWDA (1965): 42 U.S.C. 6991 et seq.; RCRA (1976): 42 U.S.C. 321 et seq.; and PPA (1990): 42U.S.C. 13101 and 13102 et seq. 12 RCRA (1976): 42 U.S.C. 321 et seq.; CERCLA (1980): 42 U.S.C. 9601 et seq. 13 U.S. EPA, established in 1970, states that it develops and enforces regulations to implement federaland environmental laws, and conducts and sponsors research, environmental education, and programs toencourage pollution reduction and energy conservation, as indicated at the EPA website,http://www.epa.gov/. Information on state and local government environmental agencies may be found atwebsites maintained by states, counties, and municipalities individually. 14 General Agreement on Trade in Services (GATS), United States: Schedule of Specific Commitments,GATS/SC/90, Apr. 1994. 15 OECD, Decision C(92)/39/final, revised May 2002. 16 Agreement Between the Government of the United States of America and the Government of CanadaConcerning the Transboundary Movement of Hazardous Waste, Oct. 28, 1986, as amended in 1992. Byan exchange of letters, the amendment in 1992 extended the agreement to include solid waste. 17 Annex III to the Agreement Between the United States of America and the United Mexican States onCooperation for the Protection and Improvement of the Environment in the Border Area: Agreement ofCooperation Between the United States of America and the United Mexican States Regarding theTransboundary Shipments of Hazardous Wastes and Hazardous Substances (“La Paz Agreement”), Nov.12, 1986.
4 Environmental Business International, Inc. (EBI), Environmental Business Journal vol.XVI, No. 5/6, 2003, p. 5; and EBI, e-mail messages to USITC staff, received Jan. 22, 2004. 5 Calculated by USITC staff based on EBI sources, e-mail messages to USITC staff,received Jan. 22, 2004. 6 EBI, The U.S. Environmental Industry & Global Market, p. 9-30. 7 Corporations’ annual reports on Form 10-K to the SEC and profiles by Datamonitor,found at Internet address http://www.ebsco.com/, retrieved Jan. 6, 2004. 8 Standard & Poor’s, Industry Surveys: Environmental and Waste Management, Apr. 24,2003. 9 An LQG is defined under U.S. law in the Resource Conservation and Recovery Act of1976 (RCRA) as a generator that exceeds certain specified generation levels of RCRA-classified hazardous waste in a single month or accumulated at any time. 10 EPA, OSW, The National Biennial RCRA Hazardous Waste Report (Based on 1999Data), Executive Summary, EPA530-S-01-001, June 2001. Data reported for 1997 and 1999are not comparable to data reported prior to 1997. 11 Industry representative, e-mail response to USITC staff, Dec. 16, 2003.
3-4
residential consumers generate 55 percent to 65 percent of municipal solid waste,with nonresidential consumers contributing the remainder.
The United States is the world’s largest market for solid waste management services,including MSW and other nonhazardous waste, with revenues totaling $42.8 billionand employment estimated at 276,000 in 2002.4 During 1990-2002, revenuesincreased at an average annual rate of 4 percent.5 Approximately 11,200 companiessupplied solid waste management services to industrial and municipal consumers inthe United States in 2002. In 2001, private and publicly-traded companies accountedfor 69 percent of industry revenues, while government-affiliated entities accountedfor the remaining 31 percent of such revenues. Despite the large number of serviceproviders, the U.S. market for solid waste management services is highlyconsolidated. The three largest firms in terms of revenue– Waste Management, Inc.(WMI), Allied Waste Industries, and Republic Services- all of which are U.S.-owned,accounted for approximately 47 percent of total U.S. solid waste managementrevenues in 2001.6 These firms have vast collection, transportation, transfer,recycling, and disposal operations throughout the United States, with each firm’srevenues exceeding $2 billion in 2002.7 Other waste services firms operate in smallergeographic areas or provide fewer services, and their revenues are considerably lowerthan the three market leaders. The rapid pace of mergers and acquisitions amongsolid waste services firms in the 1990s has slowed in recent years, as leading nationaland regional firms have sought instead to improve operating efficiency, constraincosts, and purchase certain strategic assets from one another to improve their positionin the price-sensitive U.S. market.8
Approximately 20,000 large quantity generators (LQGs)9 in the United Statesproduced a total of 36 million metric tons of hazardous waste in 1999,10 accountingfor about 60 percent of all hazardous waste generated domestically.11 Whether thisrepresented an increase or decrease over previous levels is not clear due to the EPA’srecent reclassification of certain hazardous waste as “special waste.”
12 Industry representative, telephone interview by USITC staff, Oct. 29, 2003. 13 Calculated by USITC staff based on EBI sources, e-mail messages to USITC staff, Jan.22, 2004. 14 Environmental Business International, Inc. (EBI), Environmental Business Journal vol.XVI, No. 5/6, 2003, p. 5; and EBI, e-mail messages to USITC staff, received Jan. 22, 2004. 15 EBI, The U.S. Environmental Industry & Global Market, p. 11-1. 16 Clean Harbors, Inc., annual report on Form 10-K, fiscal year ended Dec. 31, 2002. 17 Ibid. 18 Ibid.; and EBI, The U.S. Environmental Industry & Global Market, p. 11-3. 19 Clean Harbors, Inc., annual report on Form 10-K. 20 Industry analysts generally classify and estimate revenues for the medical wastemanagement services segment as part of the hazardous waste services industry. States usuallyregulate medical waste as a solid or “special” waste rather than as a hazardous waste under theRCRA, although definitions and requirements vary among the states. 21 Stericycle, Inc., annual report on Form 10-K, fiscal year ended Dec. 31, 2002, found atInternet address http://www.sec.gov/; “Stericycle Upped Medical Waste Operating Margins,Analyst Notes,” Milwaukee Journal Sentinel, Oct. 26, 2002, at Internet addresshttp://www.jsonline.com/, retrieved Aug. 22, 2003; and EBI, “$400-Million StericycleContinues Acquisition Campaign Into 2002,” Environmental Business Journal, vol. 14, No.7/8, 2002. 22 “Embattled Med/Waste Files for Bankruptcy,” Waste News, Feb. 18, 2002; and EPA,final report on removal actions at the former Med/Waste Inc. incinerator facility in Hampton,SC, Jan. 2003.
3-5
The United States is likely the world’s largest single-country market for hazardouswaste management services,12 with market revenues of $4.9 billion in 2002. During1990-2002, market revenues decreased at an average annual rate of 2 percent.13 TheU.S. industry for such services comprised approximately 1,200 firms and 38,300workers in 2002.14 The number of firms has decreased in recent years, as factorssuch as excess capacity, high capital costs, corporate debt, price, competition, andlow profit margins have encouraged merger and acquisition activity among leadingfirms.15 In September 2002, Clean Harbors, Inc. (U.S.) acquired Safety-KleenCorp.’s (U.S.) chemical services business, nearly doubling Clean Harbors’ annualrevenues to more than $600 million16 and established the firm as the largest operatorof hazardous waste treatment facilities in North America. As of December 2002,Clean Harbors had hazardous waste management properties located in 36 U.S. states,Canada, Mexico, and Puerto Rico.17 Other leading firms providing hazardous wasteservices in the U.S. market include Onyx (France), Safety-Kleen, Heritage (U.S.),Philip Services (U.S.), Teris (subsidiary of French firm Suez), and WMI.18 Principalconsumers of hazardous waste services include utilities; chemical, petroleum,pharmaceutical, and other industrial generators of large quantities of hazardouswaste; educational institutions; medical and health care providers; otherenvironmental service entities; and government agencies.19
The U.S. medical waste management services industry, considered a segment of theU.S. hazardous waste industry,20 earned revenues exceeding $1.5 billion in 2002. Stericycle, Inc. (U.S.) accounted for approximately 25 percent of this industry’srevenues in 2002,21 while its largest competitor filed for bankruptcy and ceasedoperations in the same year.22 After completing 66 acquisitions during 1993-2002,Stericycle reported having the only fully integrated, national medical wastemanagement network in the United States, serving more than 5,000 large medicalwaste generators, such as hospitals and pharmaceutical manufacturers, andapproximately 285,000 small medical waste generators, such as outpatient clinics and
23 Stericycle, Inc., annual report on Form 10-K. 24 EBI, The U.S. Environmental Industry & Global Market, p. 11-34. 25 Solid Waste Association of North America (SWANA), “Pushing the Envelope on WasteReduction and Recovery,” Jan. 30, 2003, found at Internet addresshttp://www.swana.org/WhyPolicy.asp/, retrived July 12, 2003. 26 EPA, OSW, Municipal Solid Waste in the United States: 2001 Facts and Figures. 27 EBI, The U.S. Environmental Industry & Global Market, ch. 9. 28 EPA, OSW, Municipal Solid Waste in the United States: 2001 Facts and Figures. 29 EBI, The U.S. Environmental Industry & Global Market, p. 9-4. 30 EPA, OSW, Municipal Solid Waste in the United States: 2001 Facts and Figures. 31 SWANA, “Pushing the Envelope on Waste Reduction and Recovery.” 32 EPA, OSW, Municipal Solid Waste in the United States: 2001 Facts and Figures.
3-6
medical and dental practitioners’ offices.23 The $500-million U.S. market for low-level radioactive waste management, another segment of the U.S. hazardous wasteservices market, is served by only a small number of approved disposal sites.24 A 12-fold increase in disposal costs for low-level radioactive waste during 1986-96 has ledgenerators to sharply reduce their production of such waste.
The majority of the U.S. solid waste stream is managed at waste disposal facilities,although the share of the waste stream sent to such facilities has decreased from 90percent in 1980 to 70 percent in 2001 in light of ambitious recycling programs. Landfilling is the most prevalent method of disposal, having accounted for 56 percentof municipal solid waste management, by weight, in 2001. In that year, 116 millionmetric tons of municipal solid waste was disposed in landfills, about 9 percent lessthan in 1990.25 The number of municipal solid waste landfills has decreasedsubstantially, from about 8,000 in 1988 to 1,858 in 2001. At the same time, theaverage size of landfills and the number of waste transfer stations have grown,26 asincreasingly rigorous federal environmental standards beginning in 1989 led landfillowners either to upgrade operations with more costly technologies and expandlandfill size to achieve greater economies of scale, or to cease operations.27 Thesoutheast and western regions host the greatest number of municipal solid wastelandfills, owing to more affordable and available land. In 29 U.S. states, landfillcapacity is considered adequate for more than 10 years,28 although Pennsylvania, thestate that imports the most waste from outside its borders, is among the states thatmay soon face a shortfall in capacity.29
Waste-to-energy (WTE) facilities disposed of about 15 percent of the U.S. municipalsolid waste stream in 2001. Despite the high capital costs associated with theconstruction of such facilities, 97 WTE facilities were operating in the United Statesin 2001.30 Many of these facilities are located in the northeastern United Stateswhere land is relatively limited and expensive. In 2001, WTE facilities processed 31million metric tons of solid waste, approximately equal to the previous year whenindustry data indicated such facilities generated 2,800 megawatts of renewableenergy, equivalent to providing energy to 2.4 million homes.31
Recycling programs recovered an estimated 62 million metric tons of material fromthe U.S. municipal solid waste stream in 2001, accounting for about 30 percent of thewaste stream, up from 16 percent in 1990, and 10 percent in 1980.32 By weight, theleading materials recovered in 2001 included paper and paperboard (34 millionmetric tons, or 54 percent of all recycled municipal solid waste), yard trimmings (15million metric tons, or 23 percent), metals, especially steel (5 million metric tons, or
33 Standard & Poor’s, Industry Surveys: Environment and Waste Management, Apr. 24,2003. 34 Ibid. 35 EPA, “Managing C & D Debris,” found at Internet addresshttp://www.epa.gov/epaoswer/non-hw/debris/manage.htm/, retrieved Dec. 15, 2003. Construction and demolition waste is not included in data on municipal solid waste reportedby EPA. 36 Standard & Poor’s, Industry Surveys: Environmental and Waste Management, Apr. 24,2003. 37 EPA, OSW, Municipal Solid Waste in the United States: 2001 Facts and Figures; andSWANA, “Pushing the Envelope on Waste Reduction and Recovery.” 38 Environmental Industry Association, facsimile to the Commission, Sept. 9, 2003.
3-7
9 percent), glass (2 million metric tons, or 4 percent), and plastics, textiles, wood,rubber and leather, other materials, and food and other wastes (about 1 million each,comprising the remaining 10 percent). Recycling rates for the two highest generatedwaste materials – paper and paperboard, and yard trimmings – amounted to 45percent and 57 percent, respectively, in 2001. The largest amount of recoveredmaterials, by weight, comes from commercial establishments. Growth in municipalrecycling has slowed since the mid-1990s, as recycling costs exceeded disposal costs,and sales of recycled materials were not sufficient to cover the difference.33 In 2001,9,704 curbside recycling programs and 3,846 yard-trimming composting programsoperated in the United States, as the incidence of these programs grew by 5 percentand 1 percent, respectively, in that year. Recyclable materials are sorted andprocessed at about 540 facilities nationwide, including 480 materials recoveryfacilities (MRFs), 43 mixed waste processing facilities, and 16 mixed wastecomposting facilities.
Construction and demolition waste, which reportedly accounts for 15 to 30 percent ofthe U.S. solid waste stream,34 is typically managed through depositing the debris inmunicipal solid waste landfills or landfills devoted specifically to construction anddemolition waste.35 Diversion of construction and demolition waste from disposalfacilities is considered a particularly important strategy for municipalities andrecycling businesses, as these waste materials have established end-use markets andcost less to recycle than to transport to landfills.36
In 1990, in response to rising generation of solid waste, federal legislation was passedthat made waste reduction at the source the top priority of U.S. waste managementpolicy. Source reduction methods include changing the design or composition ofproducts or packaging so as to reduce the quantity of materials used or to facilitatereuse, lengthening a product’s useful life, providing packaging that reduces spoilageor damage, and managing food scraps or yard waste through on-site composting orother alternative disposal methods. Through such waste prevention efforts, 50million metric tons of municipal solid waste were prevented from entering the U.S.waste stream in 2000, resulting in a waste stream that was 19 percent smaller than itwould have been in the absence of such efforts.37
As relatively little solid waste travels far for treatment or disposal, most wastemanagement services activity occurs within state borders. However, transportation ofsolid waste across state borders, chiefly to other U.S. states, is growing, as 47 statesexported some solid waste in 2000, up from 13 states in 1989.38 Where shipments ofsolid waste cross state lines in the United States, industry sources report that
39 Industry representative, e-mail response to USITC staff, Dec. 16, 2003. 40 EPA, OSW, The National Biennial RCRA Hazardous Waste Report (Based on 1999Data), Executive Summary. 41 Katherine N. Probst and Thomas C. Beierle, The Evolution of Hazardous WastePrograms: Lessons from Eight Countries (Washington, DC: Resources for the Future, June1999), p. 67. 42 EPA, OSW, The National Biennial RCRA Hazardous Waste Report (Based on 1999Data). 43 Texas (22 percent), Louisiana (16 percent), Florida (11 percent), Kansas (9 percent), andOhio (6 percent). 44 Stericycle, Inc., annual report on Form 10-K. 45 Ibid. 46 EPA, “Section 1: Introduction to the Resource Conservation and Recovery Act,” found atInternet address http://www.epa.gov/epaoswer/general/orientat/rom1.pdf/, retrieved May 8,2003.
3-8
differences in terms of waste management standards and classification of specificwastes may create challenges and increase operating costs for waste managementfirms.39
In 1999, 1,575 EPA-permitted treatment, storage, or disposal (TSD) facilitiesreported managing 24 million metric tons of hazardous waste.40 Because most of thehazardous waste TSD infrastructure in the United States existed prior to therestrictions on such facilities instituted under the Resource Conservation andRecovery Act (RCRA) and liability for site contamination under the ComprehensiveEnvironmental Response, Compensation, and Liability Act (CERCLA), many TSDfacility closures have occurred in recent years.41 In 1999, 69 percent of managedhazardous waste was subjected to land disposal, principally through deep-well orunderground injection (61 percent) and also through disposal in dedicated landfills (5percent) and surface impoundment (3 percent).42 About 11 percent of managedhazardous waste was thermally treated in incinerators with or without energyrecovery. Recovery operations accounted for 8 percent of managed hazardous waste,concentrated chiefly in fuel blending (4 percent) and metals recovery for reuse (3percent). The remaining 11 percent was managed through stabilization processes orother means. Five U.S. states43 managed 64 percent of the country’s hazardous wastein 1999.
With regard to medical waste, treatment and disposal operations include incineration,autoclaving, and other technologies that employ grinding and heating waste.44 Changes in regulations in 1997 have prompted the closure of numerous on-sitehazardous waste incinerators, as many owners or operators have decided not toundertake the increased costs of regulatory compliance. Further, certain off-siteincinerators have closed in recent years as waste management firms have increasedthe use of waste minimization, separation of various hazardous and nonhazardouswaste materials, and non-incineration treatment and disposal options for certainhazardous waste.45
In the United States, responsibility for public oversight of solid waste management,including functions such as primary planning, regulation, and enforcement, resides atthe state and local government levels.46 The Federal Government provides state andlocal agencies with information and other assistance, such as federal criteria fordesigning municipal solid waste landfills and other solid waste disposal facilities,
47 42 U.S.C. 6901 et seq. 48 The RCRA identified and defined four classes of hazardous waste based on theignitability, reactivity, corrosiveness, and toxicity of certain substances, and lists of hazardouswastes have been published and continue to be revised under the legislation. RCRA allowsonly EPA-permitted facilities to accept designated wastes for authorized treatment, storage, ordisposal. Under the RCRA, EPA reviews state hazardous waste programs and grantsauthority to states to implement their own programs in lieu of the federal program, providedthat these state programs are at least as stringent as the federal program. In practice, statesmay impose more stringent requirements than are provided for in federal legislation andregulations. EPA, OSW, Introduction to the Resource Conservation and Recovery Act. 49 EPA, OSW, Introduction to the Resource Conservation and Recovery Act. 50 More specifically, the 1984 amendments instructed EPA to develop certain regulations,providing for automatic implementation if EPA had not yet issued subject regulations inaccordance with specified timetables. These amendments were adopted in response toconcerns over the safety of existing methods of hazardous waste disposal. 51 42 U.S.C. 9601 et seq. 52 EPA, CERCLA Overview, found at Internet addresshttp://www.epa.gov/superfund/action/law/cercla.htm/, retrieved May 8, 2003.
3-9
which many states adopt through state legislation. For authority over hazardouswaste management, federal laws and regulations set basic requirements for the statesto implement, although states may enact more stringent criteria. New or morerigorous environmental regulation and enforcement are regarded as drivers ofenvironmental services demand, and major catalysts for defining new markets. Federal waste management legislation had its genesis in the 1960s, but the evolutionof the current U.S. waste services industry resulted from the enactment of theRCRA47 in 1976. The RCRA established three interrelated programs: Subtitle C, thehazardous waste program, established a system to control such waste from generationuntil final disposal;48 Subtitle D, the solid waste program, encouraged states toinstitute comprehensive plans to manage nonhazardous industrial and municipal solidwaste, established criteria for municipal solid waste landfills and other solid wastedisposal facilities, and prohibited unregulated dumping of solid waste; and Subtitle I,the underground storage tank program, regulated tanks that store hazardous andpetroleum products.49 The RCRA has been amended several times: in 1984, toestablish the reduction or elimination of hazardous waste as a priority and to expandthe scope and requirements of the RCRA;50 in 1992, to strengthen EPA’s authority toenforce the RCRA at federally owned facilities; and in 1996, to provide regulatoryflexibility for land disposal of certain wastes.
Numerous other federal laws—including transportation security laws, clean air andclean water legislation, occupational safety and health legislation, and waste-specificlaws and regulations other than the RCRA—have an impact on the waste servicesindustry, especially in the hazardous waste services segment. For example, under theCERCLA,51 also known as Superfund,52 generators and transporters of hazardoussubstances, including waste, along with past and present owners and operators ofsites where a release of such substances has occurred, are made strictly, jointly, andseverally liable for cleanup costs resulting from releases or threatened releases ofCERCLA-regulated hazardous substances. Mixed waste that has both hazardous andradioactive components are jointly regulated by EPA, the Department of Energy, andthe Nuclear Regulatory Commission, in accordance with the RCRA and the Atomic
53 EPA, “Frequently Asked Questions on Mixed Waste,” Feb. 1, 1997, found at Internetaddress http://yosemite.epa.gov/osw/rcra.nsf/, retrieved Oct. 10, 2003. 54 EBI, The U.S. Environmental Industry & Global Market, p. 11-34. 55 42 U.S.C. 13101 and 13102, et seq. (P.L. 101-505, Title VI, Subtitle F, Sections 6601-6610). 56 Industry representatives, e-mail response to USITC staff, Dec. 16, 2003, and interviewsby USITC staff, Washington, DC, Sept. 9 and Nov. 12, 2003. 57 Moreover, no statutory authority under the RCRA provides for notice and consent ofmunicipal solid waste imports and exports. EPA, OSW, correspondence to the HonorableDebbie Stabenow, U.S. Senate, Aug. 26, 2003. 58 EBI, e-mail sent to USITC staff, Jan. 22, 2004. 59 Calculated by USITC staff based on various EBI sources. 60 Ibid. 61 U.S. Department of Commerce (USDOC), Bureau of Economic Analysis (BEA), U.S.Direct Investment Abroad, table III.A2, “Selected Data for Foreign Affiliates and U.S. Parentsin All Industries,” preliminary 2000. These data are the first U.S. outbound FDI estimates tobe reported separately for waste management and remediation services.
3-10
Energy Act.53 Moreover, low-level radioactive waste has additional limitations withrespect to the movement of such waste.54 The Pollution Prevention Act (PPA) of1990,55 while not exclusively devoted to waste services, is a federal law establishinga national policy hierarchy that puts top priority on pollution prevention at the sourcewhere feasible, followed by recycling, treatment, and safe disposal. The PPA taskedthe EPA with several responsibilities meant to encourage the development ofpollution prevention technologies and programs. However, industry sources reportthat in recent years, regulation relating to solid and hazardous waste management hasreportedly eased rather than strengthened.56
Trade and InvestmentThe U.S. Government does not publish discrete data on trade in waste managementservices.57 However, industry trade data -- which reflect both cross-border trade andrepatriated earnings from affiliate operations -- estimate that U.S. exports of solidwaste management services totaled $503 million in 2002, while U.S. imports of suchservices totaled $1.3 billion.58 The estimated $827-million trade deficit in solid wasteservices was, in part, a result of the increasing amount of U.S. waste shipped abroad,and the substantial U.S. market presence of foreign-owned firms. During 1994-2002,U.S. exports of solid waste services decreased by 6 percent per year, on average,while imports increased at an average annual rate of 16 percent.59 Industry sourcesestimate that U.S. imports of hazardous waste management services totaled $220million in 2002, while exports of such services amounted to $95 million, resulting ina $125-million deficit. During 1994-2002, U.S. exports of hazardous waste servicesdecreased at a 9-percent average annual rate, although imports increased at the rate of10 percent per year.60
Official U.S. Government data on U.S. foreign direct investment (FDI) abroadindicate that five foreign-based waste management and remediation affiliates of U.S.firms held $3 billion in assets and reported $1.1 billion in sales in 2000.61 Theseaffiliates chiefly supply solid and hazardous waste management services in NorthAmerica and Puerto Rico. Leading U.S. participants in foreign markets include
62 Clean Harbors derived about 91 percent of total revenue from customers in the UnitedStates and Puerto Rico, and 9 percent from customers in Canada in 2002. The firm ownsincineration facilities in Quebec and Ontario designed primarily for the destruction of liquidorganic waste, and operates two commercial hazardous waste landfills in Canada. Additionally, the firm operates in Mexico. Clean Harbors, Inc., annual report on Form 10-K. 63 Stericycle serves customers through collection and treatment facilities in the UnitedStates, Puerto Rico, Canada, and Mexico. In addition, the firm has license agreements andjoint ventures to market its technology and expertise in Asia, Africa, and South America. Stericycle, Inc., annual report on Form 10-K. 64 Industry representative, e-mail response to USITC staff, Dec. 16, 2003. 65 Corporate annual reports. 66 Industry representatives, interviews with USITC staff, Washington, DC, Sept. 9 and Nov.12, 2003. 67 Industry representative, interview by USITC staff, Paris, France, Nov. 3, 2003. 68 USDOC, BEA, Foreign Direct Investment in the United States, table A-1, “SelectedFinancial and Operating Data of Affiliates, by Industry of Affiliate,” revised 2000. 69 USDOC, BEA, Foreign Direct Investment in the United States, table A-1, “SelectedFinancial and Operating Data of Affiliates, by Industry of Affiliate,” revised 1998 and 1999.
3-11
WMI, Clean Harbors,62 and Stericycle.63 In addition to its leading position in termsof revenues in the U.S. solid waste management services market, WMI is the leadingsolid waste management firm operating in Canada. Until recently, WMI providedwaste management services in several European markets, but the company sold theseoperations reportedly for financial and strategic reasons.64 Casella Waste Systems,Inc. (U.S.) also provides solid waste management services in parts of Canada. Ingeneral, U.S. firms providing services related to, but not classified as, wastemanagement services are more active participants in foreign markets than are U.S.waste management firms. Examples include environmental consulting andengineering firms, such as Bechtel, URS, Washington Group, and CH2M Hill.65 U.S.firms that have reduced operations in foreign markets, or exited these marketsentirely, indicate that the slow adoption of environmental regulations and the failureof certain regulatory entities in foreign countries to implement and enforce existingenvironmental measures raised risks of liability and other financial considerations tounacceptable levels.66
Key foreign participants in the U.S. market include French-owned affiliates Onyx (asubsidiary of Veolia Environnement) and Teris (a subsidiary of Suez). Onyx is thelargest foreign-owned firm providing solid waste services in the U.S. market, withU.S. revenues totaling less than $500 million in 2001. Teris operates treatment,storage, and disposal facilities in Arkansas and California, and provides on-siteproject management services and transportation services for hazardous and specialwastes throughout the United States.67 Official U.S. Government data indicate that atotal of six U.S.-based waste management and remediation affiliates of foreign-owned firms held $4.8 billion in assets and reported $1.8 billion in sales in 2000.68 This represents a substantial decrease from 1998, when nine affiliates held $6.3billion in assets and reported $3.5 billion in sales.69
There are no known measures that are imposed specifically on foreign providers ofwaste management services in the United States or on foreign investment in the U.S.waste services industry. Certain professionals that provide services incidental towaste management, such as engineers, are subject to licensing provisions that vary bystate, such as requirements for citizenship or residency. Moreover, Michiganrequires contractors that provide construction and related services– another service
70 State of Michigan, Department of Environmental Quality, Waste and HazardousMaterials Division, “Report of Solid Waste Landfilled in Michigan: October 1, 2001 -September 30, 2002,” Feb. 28, 2003, found at Internet address http://www.michigan.gov/deq/,retrieved Sept. 17, 2003. 71 In January 2003, the City of Toronto began exporting all solid waste earmarked for alandfill, up from approximately 60 percent in the previous year, to a commercial landfill inMichigan, costing Toronto about $26 million per year. E & E Publishing LLC, “InterstateWaste: Michigan Lawmakers to Consider Cap on Imported Trash,” Greenwire, Dec. 3, 2003,found at Internet address http://www.eenews.net/greenwire/, retrieved Dec. 3, 2003. 72 State of Michigan, Department of Environmental Quality, Waste Management Division,“Report of the Michigan Solid Waste Importation Task Force to Governor John Engler andDepartment of Environmental Quality Director Russell J. Harding,” Nov. 22, 2000, found atInternet address http://www.michigan.gov/deq/. 73 Environmental Industry Association, facsimile to the Commission, Sept. 9, 2003; andState of Michigan, Department of Environmental Quality, “Report of the Michigan SolidWaste Importation Task Force,” Nov. 22, 2000. 74 State of Michigan, Department of Environmental Quality, “2002 Michigan DEQEnvironmental Quality Report,” found at Internet address http://www.michigan.gov/deq/,retrieved Sept. 17, 2003. 75 Texas Center for Policy Studies, “The Generation and Management of Hazardous Wastesand Transboundary Hazardous Waste Shipments between Mexico, Canada and the UnitedStates, 1990-2000,” May 2001, p. 64.
3-12
that is frequently provided in conjunction with waste management– to maintain anoffice in the state.
The United States trades only a minimal amount of waste with foreign countries;however, Michigan is an exception, engaging in a substantial amount of such trade. Canada was the state’s largest export market for solid waste management services in2002, surpassing exports to other U.S. states for the first time. Canadian solid wasteas a share of total solid waste disposed of in Michigan landfills increased from 5percent in 1999 to 12 percent in 2002, as the amount of waste sent to Michiganlandfills from Canada increased by 282 percent during 1999-2002.70 Althoughshipments of solid waste into Michigan for disposal may have been consideredmanageable in the short term, state environmental regulators have expressed concernthat continued significant increases in waste shipments from Canada71 couldadversely affect state budget allocations for source reduction and recyclingprograms.72 To date, U.S. courts have ruled that laws enacted in Michigan and otherstates that impose restrictions on imports of wastes from other countries and statesare unconstitutional, absent the U.S. Congress enacting legislation specificallygranting the authority to restrict such trade.73 As regards hazardous waste, Michiganis a net exporter of such waste transported to Canada, and thus may be a net importerof hazardous waste management services.74 U.S. shipments of hazardous wastes toOntario and Quebec reportedly have increased significantly in recent years,reportedly due to relatively less stringent regulatory standards in effect in theprovinces at that time and expanding provincial disposal capacity.75 The UnitedStates and Canada generally permit hazardous waste shipments across each other’sborders for appropriate treatment, recycling, and disposal. However, hazardouswaste containing certain substances above legally permissible thresholds areexceptions. For example, owing to the potential adverse health effects of exposure to
76 EPA, “Polychlorinated Biphenyls (PCBs),” found at Internet addresshttp://www.epa.gov/oppt/pcb/effects.html, retrieved Mar. 12, 2004. 77 Authority is granted under the Toxic Substances Control Act of 1976. 78 Environmental Technology Council, Washington, DC, comments submitted to the USITCregarding Investigation No. 332-455, Nov. 5, 2003. 79 USITC Dataweb. For example, U.S. trade under heading 3825 of the Harmonized TariffSchedule of the United States (2003) includes substantially more trade with Canada than withMexico with respect to clinical waste as a residual product of the chemical or allied industriesduring January 2002 through September 2003. 80 Texas Center for Policy Studies, p. 3. 81 Texas Center for Policy Studies, p. 61. 82 Shipments are principally electric arc dust containing zinc and other metals fromsteelmaking. 83 Texas Center for Policy Studies, p. 59. 84 Certain environmental controls for high temperature recovery units are lower in Mexico,as are liability costs and financial assurance requirements as regard operating recycling plants,according to the Texas Center for Policy Studies. 85 Texas Center for Policy Studies, p. 20. As Texas reportedly lacks the capacity to managezinc recovery, most of this waste is sent to Mexico for recycling. 86 Agreement Between the Government of the United States of America and theGovernment of Canada Concerning the Transboundary Movement of Hazardous Waste, Oct.28, 1986, as amended in 1992. By an exchange of letters, the amendment in 1992 extendedthe agreement to include solid waste. 87 Annex III to the Agreement Between the United States of America and the UnitedMexican States on Cooperation for the Protection and Improvement of the Environment in theBorder Area: Agreement of Cooperation Between the United States of America and theUnited Mexican States Regarding the Transboundary Shipments of Hazardous Wastes andHazardous Substances (“La Paz Agreement”), Nov. 12, 1986. 88 Revision in May 2002 of OECD Decision C(92)/39/final.
3-13
polychlorinated biphenyls (PCBs),76 the process to obtain the U.S. EPA’s approval totransport wastes containing PCBs into the United States77 within authorizedconcentrations may take several years and only the U.S. Department of Defense hasbeen approved for such shipments.78
U.S. trade in hazardous waste with Mexico is believed to be more limited than withCanada,79 as Mexican law bans imports of such waste for final disposal.80 Inaddition, under the La Paz Agreement and Mexican environmental legislation,maquiladora plants that use substantially U.S. inputs must return hazardous wastesgenerated in Mexico to the United States, although the extent of compliancereportedly is subject to question.81 However, hazardous waste shipped to Mexico82
from the United States for the purpose of recycling is believed to have increasedsignificantly since NAFTA entered into force.83 Factors contributing to the increasein U.S. shipments to Mexico include likely cost advantages in using Mexicanrecycling firms84 and a lack of capacity in the United States to treat certain hazardouswaste.85
The United States has major international agreements with Canada86 and Mexico87--its principal trading partners for waste services-- regarding transboundary shipmentsof waste. In addition, the United States abides by the Organization for EconomicCooperation and Development (OECD) decision concerning the control oftransboundary movements of wastes destined for recovery between OECDmembers.88 However, the United States is not a party to the United Nations’ Basel
89 Parties to the Basel convention agree not to trade in hazardous wastes with nonparties,without an agreement pursuant to Article 11 of Basel which does not derogate fromenvironmentally sound management provisions specified in the convention. EPA, OSW,correspondence to a U.S. importer, June 17, 1996. 90 EBI, The U.S. Environmental Industry and Global Market, p. 9-4. 91 Industry representatives, interviews by USITC staff, Rockville and Dickerson, MD, Sept.11 and 25, 2003. 92 EPA, “EPA Funds Nine Projects to Test New Approaches to Waste Reduction,Recycling, and Land Revitalization,” press release, July 10, 2003. 93 EBI, The U.S. Environmental Industry and Global Market, p. 11-8. 94 Ibid., p. 9-33. 95 Industry representative, e-mail response to USITC staff, Dec. 16, 2003.
3-14
Convention on the Control of Transboundary Movements of Hazardous Wastes andTheir Disposal (Basel).89
Future ProspectsAs the number of U.S. landfills continues to decline, demand for additional transferstations is likely to continue to increase,90 which could provide additional sources ofrevenue for firms operating such facilities. Remaining landfills are likely to prolongtheir life spans through the increased use of bioreactor processing technologies,which accelerate waste decomposition.91 As the capital expense to establish andoperate waste-to-energy plants is prohibitive in many areas, the EPA and most stateswill likely emphasize source reduction as the centerpiece of solid waste managementplans. To illustrate, in July 2003, the EPA announced nine new projects that willevaluate various approaches to waste minimization and energy recovery. Theseprojects would build on programs seeking to encourage production and consumptionof products that are easy to recycle and that contain recyclables.92 Such projects arelikely to stimulate additional market opportunities for environmental engineers,consultants, technology companies, and large multidimensional waste managementfirms providing services related to source reduction.
Large industrial generators of hazardous waste appear to be seeking more wastemanagement services from fewer suppliers.93 Accordingly, demand will likelyincrease for suppliers with broader breadth of expertise and geographic coverage. For example, leading hazardous waste management firms are increasingly providingclients with choices of bundled services that span client waste managementoperations from generation to final disposition of waste. The availability of suchservices would further enable clients of waste management firms to contract for theseservices in lieu of dedicating in-house resources. Additional outsourcing of wastemanagement functions to services firms is likely, as part of an accelerating trendacross industries toward outsourcing many facets of administrative, sales, andmarketing expenses.
In the absence of major new domestic environmental regulations, further market exitand consolidation of waste management firms among smaller and regional firms areconsidered likely.94 Additional acquisitions of domestic waste management firms byforeign parent firms are considered by industry sources to be more likely thanincreases in U.S. firms’ acquisitions or operations in foreign markets.95
96 Industry representative, interview by USITC staff, Washington, DC, Nov. 12, 2003. 97 Industry representative, e-mail response to USITC staff, Dec. 16, 2003.
3-15
Opportunities regarding services trade and investment abroad for U.S. wastemanagement and related services firms are likely greatest in hazardous wastemanagement services in Latin American and Asian markets, conditioned on adequatefunding necessary to increase infrastructure and establish enforcement capacity.96 However, the movement of waste across U.S. borders is likely to decrease,97 in partas source reduction programs accelerate.

1 The North American Commission for Environmental Cooperation, mandated under theNAFTA, facilitates a trinational work program that addresses cross-border environmentalissues. In addition, working groups of officials from the three countries address areas such asimplementation of compatibility among national standards for transporting hazardousmaterials, including hazardous waste. These groups continue cooperative efforts first begunon a bilateral basis predating the NAFTA to deal with transboundary environmental issues,including waste management.
4-1
CHAPTER 4CANADA AND MEXICO
IntroductionThe Canadian market for waste management services is approaching maturity yetopen to new service suppliers. Canada is likely a net importer of waste managementservices, and leading U.S. and other non-Canadian firms operate in both solid andhazardous waste management segments in Canada. The Mexican market for wastemanagement services is in the early stage of development, is undercapitalized, andwith respect to solid waste services is dominated by the public sector. Marketparticipants in Mexico are chiefly Mexican-owned firms, with only moderateinvolvement from U.S. or other foreign-owned firms. The North American FreeTrade Agreement (NAFTA) has augmented cooperative efforts and stimulated thedevelopment of trade and capacity building in waste management services.
This chapter presents an overview of the regional market and the Canadian andMexican markets individually with regard to size, key suppliers and consumers,principal technologies, and regulatory circumstances; addresses the nature and extentof trade and investment in this industry in both markets; and discusses the futureoutlook for the Canadian and Mexican markets for waste management services.
Regional Market OverviewSince its inception, the NAFTA is thought to have stimulated economic development,especially in the border areas, and accelerated trade and investment opportunitiesacross all industry sectors, including waste management services. Noting theincreased opportunities and accompanying challenges of such growth, the NAFTApartners incorporated an environmental side agreement into the NAFTA thatmandated, among other provisions, new cooperative efforts1 and regulatoryharmonization, where feasible, on a range of environmental issues, including wastemanagement. At the same time, the NAFTA created one of the most open marketsfor solid and hazardous waste services in the world, and provided mechanisms for thesettlement of disputes when trade or environmental laws are thought to be violated. Although Canada and Mexico are at different stages in the development of regulatoryregimes and capacity for the management and reduction of waste streams,
2 Environmental Business International (EBI), The Global Environmental Market byRegion, 2000, attachment to an e-mail message, received July 31, 2003. 3 Includes collection and transportation of waste for disposal and recycling. 4 Statistics Canada. “Waste Management Industry Survey 2000,” found at Internet addresshttp://www.statcan.ca/english/freepub/16F0023XIE/16F0022XIE00001.pdf/, retrieved Aug. 6,2003. 5 Statistics Canada, “Waste Management Industry Survey 2000." 6 Waste Management Inc., corporate information on Canadian affiliate found at Internetaddress http://www.wm.com/canada/index.asp/, retrieved Aug. 1, 2003. 7 Industry representative, telephone interviews by USITC staff, Aug. 11, 2003.
4-2
both countries have committed to improving solid and hazardous waste servicesthrough greater market liberalization and transparency.
Canada
Market Overview
The Canadian market for solid and hazardous waste services is larger than markets incertain other developed countries, such as Australia and New Zealand, butsignificantly smaller than the solid and hazardous waste markets in the United Statesand Japan. Revenues generated by the solid waste services industry in Canada wereestimated at $2.3 billion in 2000, while the revenues generated by the hazardouswaste services industry were estimated at $400 million.2 The collection andtransportation segments3 of the solid and hazardous waste industry together accountfor the majority of revenues (66 percent).4 Within the collection and transportationsegment, industrial, commercial, and institutional clients account for 77 percent ofrevenues, whereas residential clients account for only 18 percent, and 5 percent comefrom other sources. Ontario and Quebec are Canada’s largest provincial markets forsolid and hazardous waste services, accounting for 45 percent and 21 percent ofindustry revenues, respectively. In 2001, the Canadian solid and hazardous wasteservices industry employed almost 31,000 workers.5 Of these, private-sector firmsemployed 24,197 workers and the public sector employed 6,783 workers. During1998-2000, private-sector employment rose by 18 percent, while public-sectoremployment declined by 6 percent, reflecting an ongoing shift in the provision ofsolid and hazardous waste services from government to private companies.
Canadian Waste Services, a wholly owned subsidiary of the U.S.-based WasteManagement Inc., is Canada’s top provider of solid waste services. The firmemploys 3,600 workers and provides collection, transportation, disposal, andrecycling services to customers throughout the country.6 Casella Waste Systems, Inc.(U.S.) also provides solid waste services in Canada. Key hazardous waste serviceproviders in the Canadian market include PSC (Philip Services)(U.S.), Clean Harbors(U.S.), Onyx (France), and Safety-Kleen (U.S.). A large number of small- andmedium-sized firms also comprise a significant portion of the Canadian hazardouswaste services market. Although competition is high7 in the hazardous wastemanagement market, particularly among medium-sized firms that focus on the
8 Statistics Canada, “Waste Management Industry Survey 2000." 9 Ibid. 10 Ibid. 11 Environment Canada representative, telephone interview by USITC staff, Aug. 13, 2003.
4-3
provision of certain niche services, specialization prevents direct competition amonglarge firms for certain revenue streams.
Canada generated 31.4 million metric tons of nonhazardous solid waste andapproximately 6 million metric tons of hazardous waste in 2000 (table 4-1).8 Fifty-one percent of nonhazardous solid waste is generated by the industrial/commercialsector. Residential solid waste comprises 36 percent of the waste stream, andconstruction waste accounts for the remaining 12 percent. The majority (62 percent)of the solid and hazardous waste stream is generated in Ontario and Quebec.
In 2000, 73 percent of Canada’s solid waste stream was disposed of in Canadianlandfills and incinerators, while approximately 24 percent was diverted and recycled.9 The most common materials recycled include mixed paper and newsprint (32 percentof recycled materials, by weight) and ferrous metals such as iron and steel (25percent). Recent efforts to increase composting rates led to a 45-percent increase inthe amount of materials composted during 1998-2000. As a result, by 2000, organicwaste accounted for 13 percent of all materials recycled in Canada. In 2000, almost900,000 metric tons (net) of Canada’s solid waste, or 3 percent of the waste stream,was exported to foreign facilities, primarily in the United States.10 Recyclablematerial accounted for about one-third of these Canadian waste exports.
The majority of regulations governing solid and hazardous waste management inCanada are prescribed at the provincial and municipal levels. These regulations arecurrently undergoing harmonization, primarily through discussions in the CanadianCouncil of Ministers of the Environment (CCME), an intergovernmental forumcomprised of environmental ministers from the federal, provincial, and territorialgovernments. In 1998, all Canadian provinces, with the exception of Quebec, signedThe Canada-Wide Accord on Environmental Harmonization, which allows provincialgovernments to retain their existing authorities, but commits them to using thisauthority in a coordinated manner to achieve harmonized environmental regulations. Already, CCME has produced a number of model regulations and standards that haveyielded some harmonization. According to Environment Canada, remainingdiscrepancies among provinces regarding solid and hazardous waste services areminor and not of commercial significance.11
The jurisdiction of the Federal Government is limited to federal facilities and lands,aboriginal lands, transboundary movement of hazardous waste (both interprovincialand international), and implementation of international commitments, including therecently signed Rotterdam Convention on the Prior Informed Consent Procedure forCertain Hazardous Chemicals and Pesticides in International Trade, the BaselConvention on the Control of Transboundary Movement of Hazardous Wastes andtheir Disposal, and binational agreements such as the Agreement Between the United
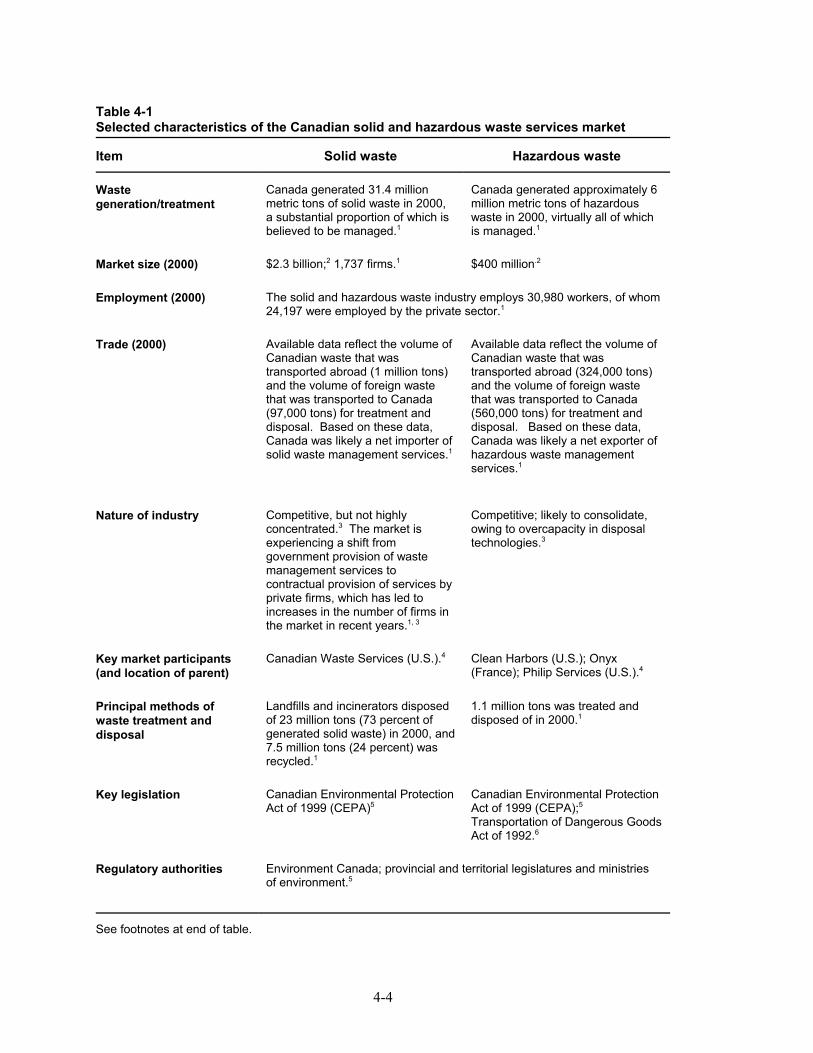
4-4
Table 4-1Selected characteristics of the Canadian solid and hazardous waste services market
Item Solid waste Hazardous waste
Wastegeneration/treatment
Canada generated 31.4 millionmetric tons of solid waste in 2000,a substantial proportion of which isbelieved to be managed.1
Canada generated approximately 6million metric tons of hazardouswaste in 2000, virtually all of whichis managed.1
Market size (2000) $2.3 billion;2 1,737 firms.1 $400 million.2
Employment (2000) The solid and hazardous waste industry employs 30,980 workers, of whom24,197 were employed by the private sector.1
Trade (2000) Available data reflect the volume ofCanadian waste that wastransported abroad (1 million tons)and the volume of foreign wastethat was transported to Canada(97,000 tons) for treatment anddisposal. Based on these data,Canada was likely a net importer ofsolid waste management services.1
Available data reflect the volume ofCanadian waste that wastransported abroad (324,000 tons)and the volume of foreign wastethat was transported to Canada(560,000 tons) for treatment anddisposal. Based on these data,Canada was likely a net exporter ofhazardous waste managementservices.1
Nature of industry Competitive, but not highlyconcentrated.3 The market isexperiencing a shift fromgovernment provision of wastemanagement services tocontractual provision of services byprivate firms, which has led toincreases in the number of firms inthe market in recent years.1, 3
Competitive; likely to consolidate,owing to overcapacity in disposaltechnologies.3
Key market participants(and location of parent)
Canadian Waste Services (U.S.).4 Clean Harbors (U.S.); Onyx(France); Philip Services (U.S.).4
Principal methods ofwaste treatment anddisposal
Landfills and incinerators disposedof 23 million tons (73 percent ofgenerated solid waste) in 2000, and7.5 million tons (24 percent) wasrecycled.1
1.1 million tons was treated anddisposed of in 2000.1
Key legislation Canadian Environmental ProtectionAct of 1999 (CEPA)5
Canadian Environmental ProtectionAct of 1999 (CEPA);5Transportation of Dangerous GoodsAct of 1992.6
Regulatory authorities Environment Canada; provincial and territorial legislatures and ministriesof environment.5
See footnotes at end of table.
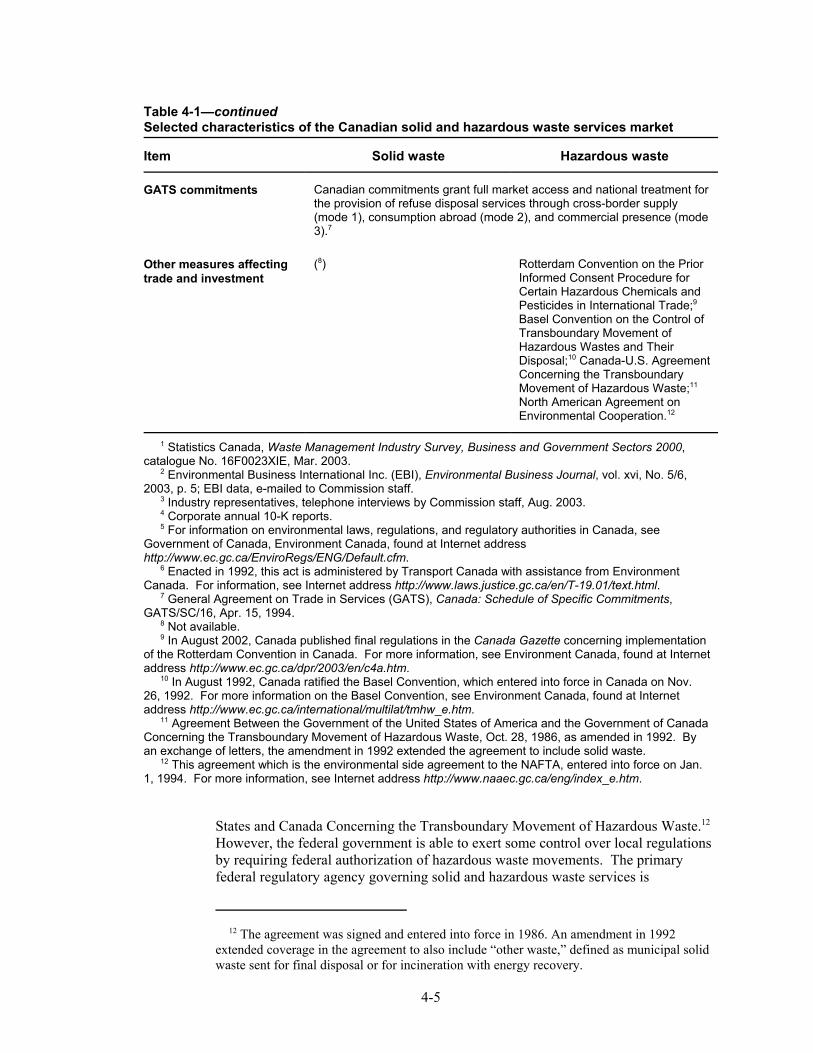
12 The agreement was signed and entered into force in 1986. An amendment in 1992extended coverage in the agreement to also include “other waste,” defined as municipal solidwaste sent for final disposal or for incineration with energy recovery.
4-5
Table 4-1—continuedSelected characteristics of the Canadian solid and hazardous waste services market
Item Solid waste Hazardous waste
GATS commitments Canadian commitments grant full market access and national treatment forthe provision of refuse disposal services through cross-border supply(mode 1), consumption abroad (mode 2), and commercial presence (mode3).7
Other measures affectingtrade and investment
(8) Rotterdam Convention on the PriorInformed Consent Procedure forCertain Hazardous Chemicals andPesticides in International Trade;9Basel Convention on the Control ofTransboundary Movement ofHazardous Wastes and TheirDisposal;10 Canada-U.S. AgreementConcerning the TransboundaryMovement of Hazardous Waste;11
North American Agreement onEnvironmental Cooperation.12
1 Statistics Canada, Waste Management Industry Survey, Business and Government Sectors 2000,catalogue No. 16F0023XIE, Mar. 2003. 2 Environmental Business International Inc. (EBI), Environmental Business Journal, vol. xvi, No. 5/6,2003, p. 5; EBI data, e-mailed to Commission staff. 3 Industry representatives, telephone interviews by Commission staff, Aug. 2003. 4 Corporate annual 10-K reports. 5 For information on environmental laws, regulations, and regulatory authorities in Canada, seeGovernment of Canada, Environment Canada, found at Internet addresshttp://www.ec.gc.ca/EnviroRegs/ENG/Default.cfm. 6 Enacted in 1992, this act is administered by Transport Canada with assistance from EnvironmentCanada. For information, see Internet address http://www.laws.justice.gc.ca/en/T-19.01/text.html. 7 General Agreement on Trade in Services (GATS), Canada: Schedule of Specific Commitments,GATS/SC/16, Apr. 15, 1994. 8 Not available. 9 In August 2002, Canada published final regulations in the Canada Gazette concerning implementationof the Rotterdam Convention in Canada. For more information, see Environment Canada, found at Internetaddress http://www.ec.gc.ca/dpr/2003/en/c4a.htm. 10 In August 1992, Canada ratified the Basel Convention, which entered into force in Canada on Nov.26, 1992. For more information on the Basel Convention, see Environment Canada, found at Internetaddress http://www.ec.gc.ca/international/multilat/tmhw_e.htm. 11 Agreement Between the Government of the United States of America and the Government of CanadaConcerning the Transboundary Movement of Hazardous Waste, Oct. 28, 1986, as amended in 1992. Byan exchange of letters, the amendment in 1992 extended the agreement to include solid waste. 12 This agreement which is the environmental side agreement to the NAFTA, entered into force on Jan.1, 1994. For more information, see Internet address http://www.naaec.gc.ca/eng/index_e.htm.
States and Canada Concerning the Transboundary Movement of Hazardous Waste.12 However, the federal government is able to exert some control over local regulationsby requiring federal authorization of hazardous waste movements. The primaryfederal regulatory agency governing solid and hazardous waste services is
13 New regulations have been drafted and taken through the mandatory consultationprocess. 14 Canadian industry representative, telephone interview by USITC staff, Aug. 11 and 18,2003. 15 Canadian industry representative, telephone interview by USITC staff, Aug. 18, 2003. 16 Ontario’s Waste Diversion Act of 2002 may eventually alleviate some of therequirements for landfilling by distributing the fees collected from waste generating industriesto municipalities for use in new waste management programs and equipment, and allocatingfunds to waste diversion programs including expansion of recycling programs, all of whichare likely to create further opportunities for private investment in waste management services. 17 U.S. Department of State and U.S. Department of Commerce, U.S. Foreign &Commercial Service, “Canada: Municipal Solid Waste Equipment,” Industry Sector Analysis,May 30, 2003, found at Internet address http://www.stat-usa.gov/, retrieved Oct. 9, 2003.
4-6
Environment Canada, which receives its authority from the Canadian EnvironmentalProtection Act of 1999 (CEPA). First enacted in 1988, the legislation wassignificantly revised in 1999 to expand coverage and shift the focus to upstreammethods of pollution and waste reduction. CEPA 1999 provides the mandate forrevision of existing federal regulations governing the transboundary movement ofhazardous waste and provides new authority for the development of regulationsgoverning the transboundary movement of nonhazardous waste. Representativesfrom Environment Canada estimate that new regulations governing nonhazardouswaste will be completed by 2004.13 Canada’s federal regulatory process allows forsignificant input by industry and stakeholders, and industry sources indicate that thisprocess yields fair and balanced regulations.14
Recent regulatory and technological developments have had an impact on the sizeand nature of the Canadian market for solid and hazardous waste services. Forexample, according to industry sources, as regulations in Canada increasingly focuson waste reduction technologies, the market for hazardous waste services has beenshrinking. Thus, many in the industry believe that the industry has reached, andpossibly exceeded, capacity. Additionally, recent advances in sorting technologyfavor a market structure in which one stream of consolidated waste feeds into thesystem and many streams of separated waste and recyclables flow out.15 Theseadvances are creating a competitive advantage for a number of firms, especially inthe recycling market.
Trade and Investment
Data specific to trade and investment in the Canadian solid and hazardous wasteservices industry are not available. However, related data and anecdotal informationsuggest that Canada’s international transactions in this sector are significant,particularly with the United States. Anecdotal evidence suggests that Canada is a netimporter of solid waste management services, as U.S. waste management firms earnsubstantial revenues from Canada by disposing of large quantities of wastetransported into the United States from certain Canadian localities. For example,since January 2003, all solid waste generated in the city of Toronto,16 which isestimated at 1.25 million metric tons per year, has been exported to Michiganlandfills, due to the closing of Toronto’s only landfill site.17
18 Industry representative, telephone interview by USITC staff, Aug. 2003. 19 Statistics Canada; and “15 Percent Decline in Imports of Hazardous Wastes andHazardous Recyclable Materials in 2002,” Canada News Wire, Aug. 20, 2002, found atInternet address http://www.newswire.ca/, retrieved Aug. 22, 2003. 20 Statistics Canada, “Waste Management Industry Survey 2000.” 21 Clean Harbors, Inc., annual report on Form 10-K, year ended Dec. 31, 2002. 22 The Canadian Government has asked Canada’s Federal Court to set aside the tribunal’sdecision on grounds that in certain respects the tribunal exceeded its authority and disregardedCanada’s public policy. Government of Canada, Department of Foreign Affairs and
4-7
Data on the cross-border trade of wastes provides some estimate of the magnitude oftrade in hazardous waste management services, as the export of waste may indicatethe import of a waste management service. Such data indicate that Canada is likely anet exporter of hazardous waste services, although its surplus may have decreased inrecent years. Historically, Canadian imports of hazardous waste have significantlyoutstripped exports, as Canadian hazardous waste regulations were less strict thanthose in the United States. However, in 2000, Ontario tightened regulations byrequiring pretreatment of hazardous waste before landfilling.18 These newregulations are more in line with U.S. standards, and, thus, the cost advantage ofexporting such waste to Canada has been reduced. As a result, Canada’s imports ofhazardous waste have decreased significantly in recent years, from almost 663,000metric tons in 1999 to approximately 423,000 metric tons in 2002.19 During 1999-2000, Canada’s hazardous waste exports increased from 268,000 metric tons to324,000 metric tons.20 The United States dominates Canadian trade in hazardouswaste, having accounted for more than 97 percent of imports and 96 percent ofexports in 2000. More than 99 percent of all waste imported for disposal in Canadawas destined for Ontario and Quebec.
Anecdotal information suggests that Canada purchases a significant amount of solidand hazardous waste services from Canadian-based affiliates of foreign-owned firms,particularly U.S. firms. As stated previously, Canadian affiliates of U.S. firms suchas Waste Management Inc. and Laidlaw are top providers of solid waste services inCanada, while Canadian affiliates of U.S. firms such as Safety-Kleen, PhilipServices, and Clean Harbors are top hazardous waste services providers. Forexample, Waste Management Inc.’s affiliate, Canadian Waste Services, providessolid waste services to 4 million residential and 150,000 commercial and industrialcustomers in Canada; Clean Harbors conducts hazardous waste operations in sixCanadian provinces, including at two commercial landfills and two incinerationplants.21 The French firm Onyx also provides solid and hazardous waste servicesthrough Canadian affiliates. In 2003, a Canadian solid waste services company,Capital Environmental Resources Inc., acquired collection, landfill, and transferstation properties in Arizona.
There are no significant barriers to investment in the Canadian waste managementmarket. Canada has made specific and full commitments on solid and hazardouswaste services under the GATS. However, transboundary movement of solid andhazardous waste has historically been a controversial and litigious issue for Canada. In 2002, a NAFTA dispute settlement tribunal awarded $6 million plus interest to S.D. Myers Inc. (U.S.) in a suit filed by the firm in 1998 against Canada for banningthe exportation of PCB waste from Canada to the firm’s U.S. facility for treatment ordestruction.22 The case has stimulated discussion as to ramifications for future
International Trade, “Dispute Settlement: NAFTA - Chapter 11 - Investment: Cases FiledAgainst the Government of Canada,” found at Internet address http://www.dfait-maeci.gc.ca/tna-nac/SDM-en.asp/, retrieved Aug. 8, 2003. 23 Brian Trevor Hodges, “Where the Grass is Always Greener: Foreign Investor ActionsAgainst Environmental Regulations Under NAFTA’s Chapter 11, S.D. Myers, Inc. v.Canada,” Georgetown International Environmental Law Review, winter 2001, LexisNexisAcademic, found at Internet address http://80-web.lexis-nexis.com/, retrieved Aug. 8, 2003. 24 Organization for Economic Cooperation and Development (OECD), EnvironmentalDirectorate, OECD Environmental Data: Compendium 2002, found at Internet addresshttp://www.oecd.org/, retrieved Aug. 7, 2003. 25 U.S. Department of Commerce, International Trade Administration, “MexicoEnvironmental Technologies Export Market Plan,” Dec. 2001. 26 In an effort to better control hazardous waste, Mexico’s National Institute of Ecology(INE) has undertaken an effort to register all companies generating hazardous waste. Registered firms must report their production of hazardous waste and demonstrate theircompliance with proper disposal techniques. As of May 2000, INE registered 27,820companies as hazardous waste generators. These companies reported generating just over 4million tons of hazardous waste per year. INE estimates that this represents about 40 percentof the total market. 27 U.S. Department of Commerce, International Trade Administration, “MexicoEnvironmental Technologies Export Market Plan,” Dec. 2001. 28 Ibid.
4-8
disputes in which the NAFTA’s commercial and environmental provisions come intoconflict.23
Mexico
Market Overview
In 2000, Mexico generated at least 31 million metric tons of solid waste, of whichhouseholds accounted for about 84 percent (table 4-2).24 By weight, organic materialwas the principal component of the solid waste stream (52 percent), followed bypaper and paperboard (14 percent), plastics and glass (10 percent), textiles and otherwaste (20 percent), and metals (3 percent). Most private-sector sources estimate thatbetween 6 and 11 million metric tons of hazardous waste are produced each year inMexico,25 while the Mexican Government estimated that hazardous waste generationwas close to 8 million metric tons in 1997.26 There are likely over 100,000manufacturing companies and millions of other entities, including households, thatgenerate hazardous waste in Mexico.27
Discrete data on the size of the Mexican solid and hazardous waste services marketare not available. It is estimated that in 2001, the combined market for solid wasteequipment and services totaled $505 million dollars, while the market for hazardouswaste equipment and services totaled $210 million.28 It is estimated that $1.7 billionof new investment is needed annually to develop and construct the infrastructure
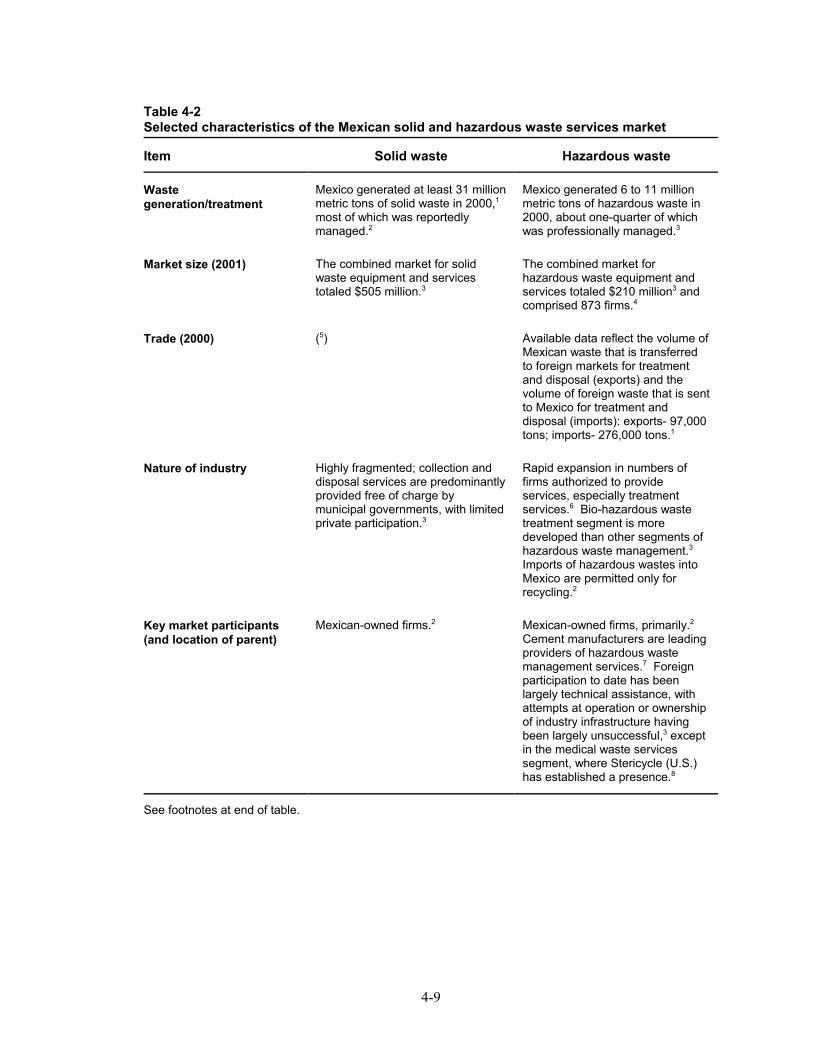
4-9
Table 4-2Selected characteristics of the Mexican solid and hazardous waste services market
Item Solid waste Hazardous waste
Wastegeneration/treatment
Mexico generated at least 31 millionmetric tons of solid waste in 2000,1most of which was reportedlymanaged.2
Mexico generated 6 to 11 millionmetric tons of hazardous waste in2000, about one-quarter of whichwas professionally managed.3
Market size (2001) The combined market for solidwaste equipment and servicestotaled $505 million.3
The combined market forhazardous waste equipment andservices totaled $210 million3 andcomprised 873 firms.4
Trade (2000) (5) Available data reflect the volume ofMexican waste that is transferredto foreign markets for treatmentand disposal (exports) and thevolume of foreign waste that is sentto Mexico for treatment anddisposal (imports): exports- 97,000tons; imports- 276,000 tons.1
Nature of industry Highly fragmented; collection anddisposal services are predominantlyprovided free of charge bymunicipal governments, with limitedprivate participation.3
Rapid expansion in numbers offirms authorized to provideservices, especially treatmentservices.6 Bio-hazardous wastetreatment segment is moredeveloped than other segments ofhazardous waste management.3 Imports of hazardous wastes intoMexico are permitted only forrecycling.2
Key market participants (and location of parent)
Mexican-owned firms.2 Mexican-owned firms, primarily.2
Cement manufacturers are leadingproviders of hazardous wastemanagement services.7 Foreignparticipation to date has beenlargely technical assistance, withattempts at operation or ownershipof industry infrastructure havingbeen largely unsuccessful,3 exceptin the medical waste servicessegment, where Stericycle (U.S.)has established a presence.8
See footnotes at end of table.
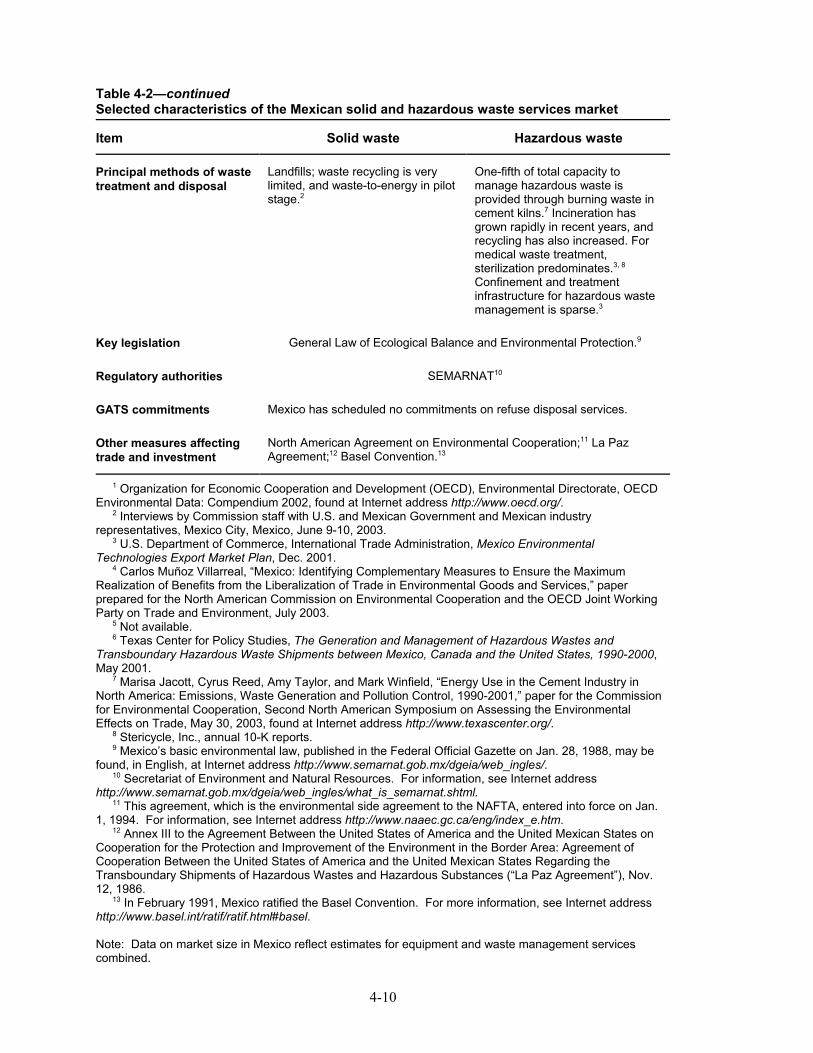
4-10
Table 4-2—continuedSelected characteristics of the Mexican solid and hazardous waste services market
Item Solid waste Hazardous waste
Principal methods of wastetreatment and disposal
Landfills; waste recycling is verylimited, and waste-to-energy in pilotstage.2
One-fifth of total capacity tomanage hazardous waste isprovided through burning waste incement kilns.7 Incineration hasgrown rapidly in recent years, andrecycling has also increased. Formedical waste treatment,sterilization predominates.3, 8
Confinement and treatmentinfrastructure for hazardous wastemanagement is sparse.3
Key legislation General Law of Ecological Balance and Environmental Protection.9
Regulatory authorities SEMARNAT10
GATS commitments Mexico has scheduled no commitments on refuse disposal services.
Other measures affectingtrade and investment
North American Agreement on Environmental Cooperation;11 La PazAgreement;12 Basel Convention.13
1 Organization for Economic Cooperation and Development (OECD), Environmental Directorate, OECDEnvironmental Data: Compendium 2002, found at Internet address http://www.oecd.org/. 2 Interviews by Commission staff with U.S. and Mexican Government and Mexican industryrepresentatives, Mexico City, Mexico, June 9-10, 2003. 3 U.S. Department of Commerce, International Trade Administration, Mexico EnvironmentalTechnologies Export Market Plan, Dec. 2001. 4 Carlos Muñoz Villarreal, “Mexico: Identifying Complementary Measures to Ensure the MaximumRealization of Benefits from the Liberalization of Trade in Environmental Goods and Services,” paperprepared for the North American Commission on Environmental Cooperation and the OECD Joint WorkingParty on Trade and Environment, July 2003. 5 Not available. 6 Texas Center for Policy Studies, The Generation and Management of Hazardous Wastes andTransboundary Hazardous Waste Shipments between Mexico, Canada and the United States, 1990-2000,May 2001. 7 Marisa Jacott, Cyrus Reed, Amy Taylor, and Mark Winfield, “Energy Use in the Cement Industry inNorth America: Emissions, Waste Generation and Pollution Control, 1990-2001,” paper for the Commissionfor Environmental Cooperation, Second North American Symposium on Assessing the EnvironmentalEffects on Trade, May 30, 2003, found at Internet address http://www.texascenter.org/. 8 Stericycle, Inc., annual 10-K reports. 9 Mexico’s basic environmental law, published in the Federal Official Gazette on Jan. 28, 1988, may befound, in English, at Internet address http://www.semarnat.gob.mx/dgeia/web_ingles/. 10 Secretariat of Environment and Natural Resources. For information, see Internet addresshttp://www.semarnat.gob.mx/dgeia/web_ingles/what_is_semarnat.shtml. 11 This agreement, which is the environmental side agreement to the NAFTA, entered into force on Jan.1, 1994. For information, see Internet address http://www.naaec.gc.ca/eng/index_e.htm. 12 Annex III to the Agreement Between the United States of America and the United Mexican States onCooperation for the Protection and Improvement of the Environment in the Border Area: Agreement ofCooperation Between the United States of America and the United Mexican States Regarding theTransboundary Shipments of Hazardous Wastes and Hazardous Substances (“La Paz Agreement”), Nov.12, 1986. 13 In February 1991, Mexico ratified the Basel Convention. For more information, see Internet addresshttp://www.basel.int/ratif/ratif.html#basel.
Note: Data on market size in Mexico reflect estimates for equipment and waste management servicescombined.
29 U.S. Department of Commerce, “Mexico Environmental Technologies Export MarketPlan,” p. 30. Cities listed as of December 2001 are Aqua Prieta, Cancun, Leon, Los Cabos,Los Mochis, Merida, Monterrey, Nuevo Laredo, Piedras Negras, Puebla, Queretaro, Reynosa,Tijuana, Tlalnepantla, and Torreon. 30 OECD, Environmental Directorate, OECD Environmental Data: Compendium 2002. 31 In 2000, about 8 percent of solid waste collected in large Mexican cities was recycled. Most households and businesses in Mexico reportedly do not separate wastes for recycling. U.S. Department of Commerce, International Trade Administration, “Mexico EnvironmentalTechnologies Export Market Plan,” Dec. 2001. 32 U.S. Department of Commerce, International Trade Administration, “MexicoEnvironmental Technologies Export Market Plan,” Dec. 2001. 33 Ibid. 34 Ibid. 35 U.S. Department of State, “Alternative Energy Use in Mexico,” message reference No.05989, prepared by U.S. Embassy, Mexico City, July 21, 2003. 36 Carlos Muñoz Villarreal, “Mexico: Identifying Complementary Measures to Ensure theMaximum Realization of Benefits from the Liberalization of Trade in Environmental Goodsand Services,” July 2003. 37 Includes industrial waste used as alternative fuel, and biologic-infectious waste. 38 U.S. Department of Commerce, International Trade Administration, “MexicoEnvironmental Technologies Export Market Plan,” Dec. 2001.
4-11
opted for private participation in waste management.29 The Mexican market for solidwaste services is also characterized by significant informal sector participation.
It is estimated that 84 percent of the population in Mexico is served by municipalwaste services.30 The rate of collection surpasses 90 percent in metropolitan areas,but is estimated at 70 percent or less in small cities, towns, and rural areas. The shareof solid waste that is professionally disposed of is estimated at more than 80 percentin metropolitan areas but falls below 50 percent elsewhere, especially outside ofmedium-sized cities. In 2000, about 98 percent of the managed solid waste streamwas disposed of in landfills and the remainder was recycled.31 Currently, landfillcapacity is inadequate to handle the solid waste generated in Mexico, and mostexisting landfills are open-air facilities that do not incorporate the latesttechnologies.32 Landfills are nearing capacity, especially in large cities. Marketobservers state that possible future closure of these facilities and the contracting ofnew sites, if realized, could promote greater consumer consciousness regardingrecycling and reuse.33 The city of Monterrey is in the process of tendering a landfillproject that would include a gas-to-energy component. If successful, this project maybe replicated in other large cities, including Guadalajara and Mexico City.34 Managed incineration and waste-to-energy technology are used to manage only anegligible amount of solid waste in Mexico. Currently, solid waste in Mexico is usedto produce about 11 megawatts of electrical capacity and hybrid fuel-oil/agriculturalwaste is used to produce about 400 megawatts of energy.35 Minimal use of solidwaste and agricultural waste as alternative fuels for electricity production is expectedto continue indefinitely.
In 2002, 873 companies were authorized to provide hazardous waste services inMexico.36 Of these, 411 companies are authorized for collection and transportation. Additional authorized suppliers of hazardous waste services provide recyclingservices (167 firms), temporary storage (124 firms), treatment (114 firms),incineration37 (44 firms), reuse (9 firms), and confinement (1 firm).38 The number of
39 USITC staff calculation based on data reported in U.S. Department of Commerce,International Trade Administration, “Mexico Environmental Technologies Export MarketPlan,” Dec. 2001 and Carlos Muñoz Villarreal, “Mexico: Identifying ComplementaryMeasures to Ensure the Maximum Realization of Benefits from the Liberalization of Trade inEnvironmental Goods and Services,” July 2003. 40 U.S. Department of Commerce, International Trade Administration, “MexicoEnvironmental Technologies Export Market Plan,” Dec. 2001. 41 Marisa Jacott, Cyrus Reed, Amy Taylor, and Mark Winfield, “Energy Use in the CementIndustry in North America: Emissions, Waste Generation and Pollution Control, 1990-2001,”paper for the Commission for Environmental Cooperation, Second North AmericanSymposium on Assessing the Environmental Effects of Trade, May 30, 2003, found atInternet address http://www.texascenter.org/, retrieved Dec. 4, 2003. 42 According to the Mexican definition classifying waste management methods, the burningof waste in cement kilns is considered recycling rather than incineration with energy recovery. 43 Biohazardous waste disposal facilities in Central Mexico are working below capacity,and some have closed or moved. 44 U.S. Department of Commerce, International Trade Administration, “MexicoEnvironmental Technologies Export Market Plan,” Dec. 2001.
4-12
companies authorized to provide such services increased by 32 percent during 2000-2002,39 with particularly rapid growth in the number of firms providing treatmentservices.
Approximately 26 percent of the hazardous waste stream in Mexico receivesprofessionally managed handling, treatment, disposal, or confinement. Hazardouswaste management is limited primarily owing to a lack of dedicated modernfacilities.40 Most hazardous waste is incinerated or treated, although hazardous wasterecycling capacity, including the ability to convert waste to energy, has increasedgreatly, from approximately 500,000 metric tons in 1995 to 2.5 million metric tons in2000. Mexico’s cement industry burns hazardous and other industrial wastes incement kilns as an inexpensive, alternate fuel source, and earns revenue as a wastemanager when burning waste supplied by external sources.41 Such cement kilnsrepresent about one-half of the total capacity to recycle42 hazardous wastes and aboutone-fifth of total capacity to manage hazardous waste in Mexico. The biohazardouswaste treatment segment is more highly developed than other hazardous wasteservices segments in Mexico, and capacity outstrips demand in most parts of thecountry.43 The main reason for this excess capacity is significant overestimation ofthe need for these services. Collected biohazardous waste is treated throughsterilization (39 percent), incineration (27 percent), the use of radio waves (25percent), and chemical treatment processes (9 percent).44
When the Fox administration took office in 2000, one of its first actions was thereorganization of the regulatory structure governing environmental services. Underthis new structure, the Secretariat of the Environment and Natural Resources
45 This restructuring shifted the regulatory and governance responsibilities of the InstitutoNacional de Ecologia (INE, National Institute of Ecology), to SEMARNAT, and recast INE asa research center under SEMARNAT’s jurisdiction. PROFEPA was also brought under theumbrella of SEMARNAT, and now focuses exclusively on inspections. 46 Current list of regulations available at www.hazmat.dot.gov/nomslst.htm/. 47 Leon Trakman, Nick Ranieri, and Lic. Marlon Omar Lopez Zapata, ed., Doing Businessin Mexico, vol. 2 (New York: Transnational Publishers, Inc., 2002). pp. 1-15 and 1-16. 48 An important exception is federal regulation NOM-083-ECOL-1996, which outlines therequirements for locations where final disposal facilities may be built. The regulation setsrules governing characteristics of the soil and minimum distances of the proposed facilityfrom underground aquifers and populated areas. 49 Mexican Government representative, interview by USITC staff, Mexico City, Mexico,June 9, 2003. 50 Under the amendment, waste management facilities and manufacturing firms must reporttoxic releases, air emission, hazardous waste generation, and wastewater discharges to apublicly available database, unlike the prior system that relied on voluntary reporting and wasdeemed incomplete. Marisa Jacott, et. al., “Energy Use in the Cement Industry in NorthAmerica: Emissions, Waste Generation and Pollution Control, 1990-2001.”
4-13
(SEMARNAT) is the lead agency for nearly all environmental services,45 includingsolid and hazardous waste services. The General Law of Ecological Balance andEnvironmental Protection is the primary piece of legislation governing solid andhazardous waste services in Mexico. This legislation, first enacted in 1988 andrevised in 1996, provides a general framework for biodiversity protection, assessmentof environmental risks and impacts, stewardship of natural resources, and preventionand control of pollution. Regulations are derived from the authority provided by thisact and codified as either mandatory regulations or voluntary regulations. The paceof issuing federal regulations on waste management has increased substantially inrecent years. As of early 2003, 25 hazardous waste regulations had been enacted ordrafted, up from 8 such regulations in 2000.46 Mexico’s environmental law issimilar in some respects to the RCRA in the United States, as both provide for a“cradle-to-grave” approach to regulating hazardous waste, although the twocountries’ laws differ somewhat as to the constituent elements of hazardous waste,and Mexico has only begun to implement its hazardous waste managementrequirements.47 The federal government plays a limited role in regulating theprovision of solid waste management services in Mexico, as such authority almostexclusively resides at the state and municipal government level.48 Primarily, federalenvironmental authorities provide technical support and capacity-building assistanceto municipalities, and coordinate with local governments seeking regional solutionswhere feasible.49
The Government of Mexico has established goals to decentralize authority overhazardous waste regulation. However, federal regulations continue to predominateand evolve with regard to hazardous waste services. For example, new hazardouswaste regulations require analysis of the hazardous properties of specific wastes. Recent amendments to the main Mexican environmental law include creation of amandatory pollution release and transfer registry similar to the toxic release inventoryrequired in the United States.50 The amendments are likely to improve public accessto important information concerning the impact of current and prospective wastemanagement operations. Additionally, in December 2002, the Federal Governmentapproved and published a new standard establishing maximum permissible emissions
51 The new Mexican emission standards are regarded as comparable to those established byEPA in the United States for portland cement plants, although proposed EU standards areconsidered more stringent. Marisa Jacott, et. al., “Energy Use in the Cement Industry in NorthAmerica: Emissions, Waste Generation and Pollution Control, 1990-2001.” 52 Industry association representative, interview by USITC staff, Mexico City, Mexico, June10, 2003; and Carlos Muñoz Villarreal, “Mexico: Identifying Complementary Measures toEnsure the Maximum Realization of Benefits from the Liberalization of Trade inEnvironmental Goods and Services,” July 2003. 53 Loan rates offered by the North American Development Bank (NADB) are as high ascommercial rates. 54 Industry representative, interview by USITC staff, Mexico City, Mexico, June 10, 2003. 55 U.S. Department of Commerce, International Trade Administration, “MexicoEnvironmental Technologies Export Market Plan,” Dec. 2001. 56 High-level environmental experts are replaced whenever a new mayor enters office. Mayoral elections are held every 3 years. 57 U.S. Department of Commerce, International Trade Administration, “MexicoEnvironmental Technologies Export Market Plan,” Dec. 2001.
4-14
for the cement industry, including those firms that burn hazardous waste.51 Nevertheless, industry representatives have noted concerns regarding omissions andinconsistencies in hazardous waste legislation and regulations, such as inadequatedefinitions of hazardous waste.52
Although environmental awareness is gradually developing in Mexico, severalfactors continue to hamper Mexican demand for waste services. For example,Mexico’s weak economic performance in the last few years and high interest rates onbank loans53 are believed to have significantly discouraged investment.54 Wastecollection and disposal services have historically been provided at no cost to citizens,so municipalities are reluctant to institute a fee, and citizens are frequently unwillingto pay, for these services, presenting a significant impediment to financing theprovision of high-quality waste services.55 Municipalities often are unable to financeenvironmental feasibility studies, which undermines progress toward developingwaste management projects. Additionally, the high turnover of technical expertsadministering environmental regulatory affairs at the municipal level makes long-term planning and project flow difficult.56
By contrast, demand for waste management services has been encouraged by theavailability of financing from the U.S. Export-Import Bank and internationaldevelopment banks. For example, in 2002, the U.S. Export-Import Bank announceda $100-million line of credit to Mexican public works bank BANOBRAS, whichidentified 80 potential municipal projects, including some in solid waste studies. Additional resources are available through the North American Development Bank(NADBank), created under the NAFTA, which provides loans and loan guarantees topublic and private sector environmental projects, the Inter-American DevelopmentBank, the World Bank, and other sources.57
Trade and Investment
Data specific to trade and investment in the Mexican solid and hazardous wasteservices industry are not available. Nevertheless, related data and anecdotalobservations suggest that such services trade, which takes place almost exclusivelywith the United States, is increasing. The Mexican Government estimated that
58 OECD, OECD Environmental Data: Compendium 2002. 59 Marisa Jacott, Cyrus Reed, and Mark Winfield, “The Generation and Management ofHazardous Wastes and Transboundary Hazardous Waste Shipments between Mexico, Canadaand the United States, 1990-2000,” Texas Center for Policy Studies, report, May 2001, foundat Internet address http://www.texascenter.org/. 60 Ibid. 61 U.S. Department of Commerce, International Trade Administration, “MexicoEnvironmental Technologies Export Market Plan,” Dec. 2001. 62 Jan Gilbreath and Janine Ferretti, “Mixing Environment and Trade Policies underNAFTA,” unpublished paper.
4-15
approximately 276,000 metric tons of hazardous waste were imported by Mexico in2000, while about 97,000 metric tons were exported.58 The majority of Mexico’shazardous waste imports were reportedly for the recycling of electric arc dustcontaining zinc and other metals.59 Hazardous waste exports from Mexico reflectedmaquiladora plants in Mexico returning wastes generated at the plants to the countryof origin, and non-maquiladora entities exporting hazardous waste that could not bemanaged in Mexico to the United States, in part owing to insufficient wastemanagement capacity.60
The volume of hazardous waste being transported between the United States andMexico, and thus U.S.-Mexican trade in hazardous waste services, is likely affectedby special NAFTA and non-NAFTA regulations, which apply in the border region ofthe two countries. For example, maquiladora plants operated by or for a U.S. firm,and producing goods with predominantly U.S. content, are obligated to exporthazardous waste to the United States for treatment or disposal. Since NAFTA wassigned, enforcement of these regulations on both sides of the border has beenstrengthened significantly, especially through HAZTRAKS, a consultativemechanism to facilitate information exchanges and the monitoring of hazardouswaste within a 100-kilometer radius of the U.S.-Mexican border.
Available information in the absence of official statistics suggests that few U.S. solidwaste management firms, with the exception of Waste Management Inc., operate inthe Mexican solid waste services market. Several U.S. firms, including CleanHarbors and Stericycle, operate in the Mexican hazardous waste services market. Aside from a few Mexican firms involved in transporting waste to the United Statesfor management, Mexican waste management firms are not known to operate in theU.S. market. It is likely that Mexican firms would be positioned to participate in thedevelopment of waste management capacity in other Latin American markets, asenvisioned by Mexican Government environmental officials, drawing on expertiseand experience gained in transboundary waste management circumstances betweenthe United States and Mexico.
Mexico made no specific commitments on environmental services under the GATS. Moreover, inconsistency and insufficient transparency in the federal, state, andmunicipal regulation of hazardous waste management have heightened the perceptionof potential risk among foreign investors.61 For example, the U.S.-based firmMetalclad made a multimillion-dollar investment to build a hazardous waste landfillin Mexico, obtaining all required federal licences and permits.62 However, after theplant was completed, the state government invoked its authority to designate the plantsite as an ecological preserve and the local government refused to grant a land use
63 “Hazardous Waste Incineration and Combustion: A Tabasco Case Study,” Texas Centerfor Policy Studies, English summary document, Oct. 2002, found at Internet addresshttp://www.texascenter.org/, retrieved Aug. 7, 2003. 64 Industry representative, telephone interview by USITC staff, Aug. 18, 2003. 65 Ibid. 66 Mexican industry and government officials, interviews by USITC staff, Mexico City,Mexico, June 9-10, 2003. 67 Carlos Muñoz Villarreal, “Mexico: Identifying Complementary Measures to Ensure theMaximum Realization of Benefits from the Liberalization of Trade in Environmental Goodsand Services,” July 2003.
4-16
permit, preventing the plant from opening.63 Arguing successfully before anarbitration panel that the Mexican state’s action amounted to expropriation,Metalclad was awarded the right to compensation under the investor-protectionmeasures found in Chapter 11 of the NAFTA. Additionally, Chemical WasteManagement (U.S.) built a $32- million incineration facility in Tijuana, but thefacility was closed following the Mexican federal government’s decision not to allowany hazardous waste incineration in Tijuana.
Future ProspectsThe Commission for Environmental Cooperation (CEC), the environmental forumcreated under the NAFTA, is facilitating efforts among NAFTA partners to movetoward greater harmonization of environmental regulations across North America andto increase information exchanges and capacity-building interaction in theenvironmental markets. The CEC is in the process of creating a simpler system totrack the transfer of hazardous waste across borders and ensure timely permitting. Industry sources have indicated that early efforts have significantly improved theprocess.
In Canada, a focus on implementation of the Kyoto Protocol will likely subsumemost federal environmental legislation in the near future, including legislationregarding solid and hazardous waste services. In addition, Canadian waste legislationlikely will be affected by efforts to create a separate regulatory structure for therecycling industry, autonomous from the current solid and hazardous wasteregulations.64 Although representatives from the Canadian Association of RecyclingIndustries (CARI) predict that this process may take 7 to 10 years, CCME has issuedseparate definitions for the recycling and waste industries, thus laying thegroundwork for eventual separation.65
The development of Mexico’s waste management services market will likely beaffected by a number of factors. Waste streams, especially for hazardous waste,appear to be increasing and are likely much more extensive than publicly reported.66 Such growth places urgency on the adoption of upgraded waste managementtechnologies, on changes in public attitudes and behavior toward waste management,and on tapping unprecedented levels of new funding to build capacity in wastemanagement expertise and infrastructure.67 Industry sources indicate thatopportunities for public-private partnerships in the development of new wastemanagement projects will likely increase, with the newly created Commission for
68 This consultative body includes representatives from the private, public, and socialsectors in Mexico.
4-17
Environmental Infrastructure68 engaged in collaborative efforts. Large multinationalfirms in Mexico are in the process of developing controls on waste generation in aneffort to reduce operating costs, although the trend has yet to engage small and mid-size firms. Significant growth in the hazardous waste management market is likely,depending on the pace of regulatory developments and the creation of effectiveenforcement capabilities.

1 For more information regarding the participation and withdrawal of U.S. wastemanagement firms in foreign markets, see chapter 3. 2 Government officials and industry representatives, interviews by USITC staff, Prague,Czech Republic, Brussels, Belgium, and Paris, France, Oct. 24 - Nov. 4, 2003. 3 EU-wide waste treatment strategies are proportioned as follows: land filling, 57 percent;incineration, 16 percent; recycling, 13 percent. In most EU member states, the average landfilling costs for nonhazardous wastes are below the costs of incineration. Consequently, inpractice, market mechanisms do not conform to the EC’s optimal waste management strategy. European Environmental Agency (EEA), Environmental Signals 2002, found at Internetaddress http://eea.eu.int/, retrieved Dec. 9, 2003. 4 Industry representatives, interviews by USITC staff, Prague, Czech Republic, Oct. 24 and27, 2003. 5 EU-acceding countries have replaced South East Asia as the second largest export marketfor European environmental services firms. The EU Eco-Industry’s Export Potential, finalreport to Director General XI of the European Commission, Sept. 1999, found at Internetaddress http://www.europa.eu.int/comm/environment/enveco/industry_employment/eco.pdf,retrieved Dec. 9, 2003.
5-1
CHAPTER 5EUROPEIntroduction
Europe is home to several of the largest solid and hazardous waste service companiesin the world. Non-European firms currently are not active in the market, mostnotably because the largest U.S. firms have withdrawn from the European market inrecent years.1 European companies, however, continue to operate worldwide,competing with, and at times, operating jointly with other European companies. TheEuropean Union (EU) is the largest market within Europe, and one of the world’slargest markets for solid and hazardous waste services. The EU is also the world’slargest exporter of environmental services, with most of those exports destined forthe United States.
Broadly speaking, the European market for solid and hazardous waste services can bedivided between EU countries and non-EU countries. EU countries reportedly havemore rigorous environmental standards and devote more resources to enforcing thosestandards.2 EU environmental priorities3 include taking measures to reduce wastegeneration associated with economic activity, so that increased prosperity will notlead to increased waste. Many of the non-EU countries are currently in the processof acceding to the EU, which requires them to acclimate their environmental policiesand legislation to that of the EU. This has served to create opportunities for manyEU waste services firms,4 as technology and resources are often limited in non-EUcountries.5
This chapter includes a brief overview of the European market for waste managementservices, and presents specific information on the solid and hazardous waste markets
6 Countries who are working towards membership in the EU include Bulgaria, Cyprus, Czech Republic, Estonia, Hungary, Malta, Latvia, Lithuania, Poland, Romania, Slovakia, andSlovenia. The EU is scheduled to expand from 15 to 25 member states in May 2004. 7 Environmental Business International Inc. (EBI), The Global Environmental Market byRegion, 2000, attachment to an e-mail message, received July 31, 2003. 8 Government officials, interviews by USITC staff, Brussels, Belgium, Oct. 30-31, 2003. 9 Industry representative, interview by USITC staff, Brussels, Belgium, Oct. 31, 2003. 10 Government official, interview by USITC staff, Paris, France, Nov. 3, 2003. 11 Industry representative, interview by USITC staff, Prague, Czech Republic, Oct. 24,2003. Hisashi Ogawa, Sustainable Solid Waste Management in Developing Countries,presentation at the 7th International Solid Waste Association (ISWA) International Congressand Exhibition, Oct. 1996.
5-2
of the EU and the Czech Republic, an aspirant to the European Union6 and one of themore-developed solid and hazardous waste markets in Eastern Europe.
Regional Market OverviewThe European market for solid and hazardous waste services is the second largest inthe world, having accounted for $41.2 billion, or 31.0 percent of the global marketfor such services in 2000. The vast majority of the European waste services marketis concentrated in Western Europe ($39.3 billion). Western Europe accounted for 29percent of the global market for solid waste management services in 2000, and for 34percent of the global market for hazardous waste management services.7 Bycomparison, Eastern Europe accounted for approximately 1 percent and 2 percent ofthe global solid and hazardous waste management markets, respectively.
Public sentiment among European countries generally favors increasedenvironmental protection.8 As a result, the pace of national environmental initiativesand public and private environmental spending is increasing, although enforcementreportedly varies among countries.9 Individual EU Member states develop their ownenvironmental initiatives, but the EU authorities in Brussels set overall environmentalpolicy through EU-wide directives, standards, norms, and goals. However,implementation of the EU rules is the responsibility of individual member states, soprocesses and procedures may vary from one country to another.10 Most of thecountries of Central and Eastern Europe (CEE) have reportedly enacted lessextensive environmental protection measures, although this is likely due to a lack ofcapital or appropriate technology.11 However, some of these countries have madeefforts to conform to EU directives on the environment in preparation for accessionto the Community. The Czech Republic, for example, has adopted several lawsspecifically for the purpose of conforming with EU environmental directives andrequirements.
12 In terms of data collection and analysis, the EU should be considered as 15 markets withunique characteristics, rather than as a single, homogeneous regional market. Aggregateinformation on the European environmental services industry is also difficult to compile ascountries generally do not share common definitions, terminology, or classifications. Reporting systems and formats are not harmonized among countries, and at times, even withincountries. Solid waste market information, for instance, originates most often at the locallevel, where management policies are defined and implemented, leading to differences fromregion to region. Hazardous waste statistics, trade data, and market information all facesimilarly inherent limitations. For example, countries and regions with data for both 1990 and1995 show an apparent increase (on average more than 60 percent) in hazardous wastequantities, but this is mainly due to changed definitions and new legislation. Also, there areconsiderable unexplained differences between hazardous waste generation and treatmentfigures. Consequently, data available at the country level are difficult to compare and data atthe EU-level should be viewed as estimates. 13 The Member states of the EU are: Austria, Belgium, Denmark, Finland, France,Germany, Greece, Ireland, Italy, Luxembourg, the Netherlands, Portugal, Spain, Sweden, andthe United Kingdom. 14 The data presented in table 5-1 are an approximation of EU total waste generation, as theavailable data are not based on a single common year. The data represent the latest year forwhich country statistics are available, and as a result, the EU total is inherently imprecise.EEA, Environmental Signals 2002. 15 MEA, Environmental Signals 2002. 16 European Commission, EU Focus on Waste Management, Luxembourg: 1999. 17 The EC’s goal of stabilizing municipal waste generation in the EU at 1985 levels by 2000was not met, and was significantly exceeded in almost all countries. European EnvironmentalAgency (EEA), Environmental Assessment Report 2003. 18 Landfilling is generally the least expensive disposal option, even after the introduction oflandfill taxes in some European counties. EEA, Europe's Environment - the SecondAssessment, Office for Official Publications of the European Communities, 2001.
5-3
European Union12
Market Overview
As a group, the 15 Member countries of the EU13 generated approximately 1.4 billionmetric tons of solid and hazardous waste annually during the late 1990s (table 5-1).14 Current estimates of annual waste generation range as high as 3 billion metric tons. Within the EU, the largest producers of waste are Germany, the United Kingdom,France, Italy, Spain, and the Netherlands.15 Along sectoral lines, agriculture,manufacturing, construction, and mining accounted for the bulk of waste generation. OECD/Eurostat data indicate that overall waste generation in the EU increased by 10percent per year during the late 1990s,16 despite efforts to minimize such generation.17 The increase may be explained by a direct relationship between economic growth andwaste generation, but also by increased activity in other environmental sectors, suchas wastewater purification and flue gas cleaning, that generate additional solidwastes.
Landfilling is the most prominent disposal method, especially in southern EUMember states, usually owing to its relatively low cost.18 Incineration, includingwaste-to-energy activities, is also a common method of waste disposal in the EU,despite slow public acceptance. Stronger emission controls are being employed on
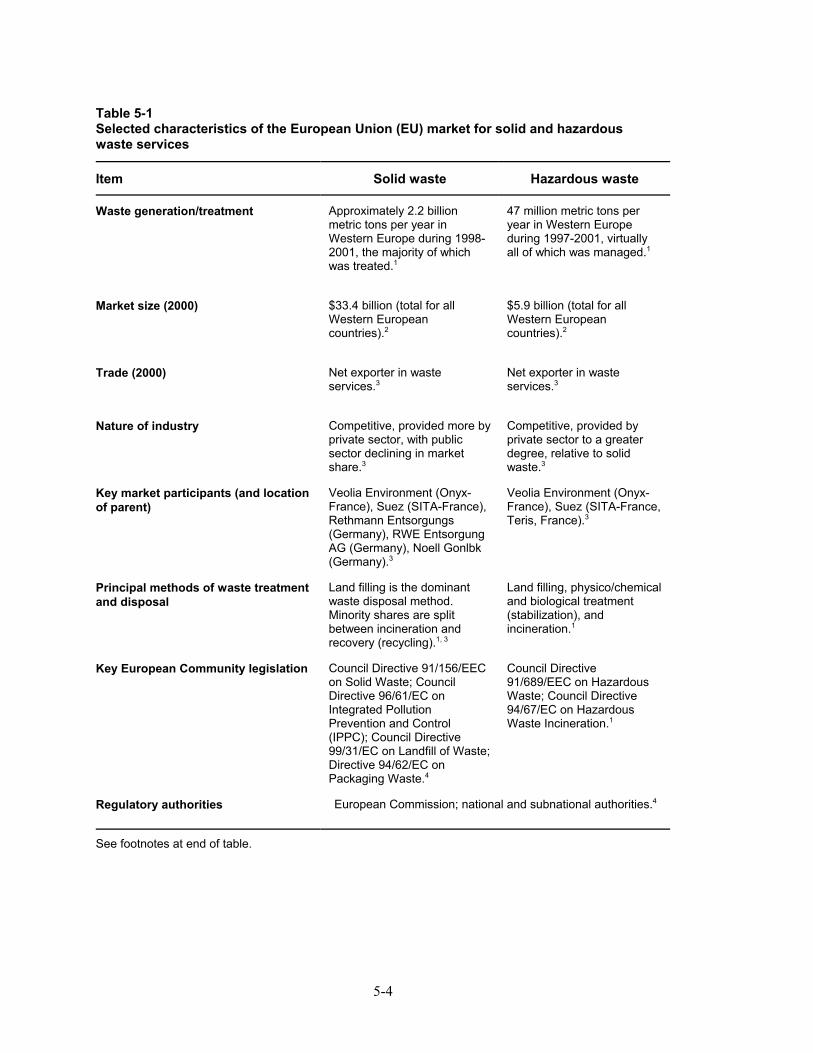
5-4
Table 5-1Selected characteristics of the European Union (EU) market for solid and hazardouswaste services
Item Solid waste Hazardous waste
Waste generation/treatment Approximately 2.2 billionmetric tons per year inWestern Europe during 1998-2001, the majority of whichwas treated.1
47 million metric tons peryear in Western Europeduring 1997-2001, virtuallyall of which was managed.1
Market size (2000) $33.4 billion (total for allWestern Europeancountries).2
$5.9 billion (total for allWestern Europeancountries).2
Trade (2000) Net exporter in wasteservices.3
Net exporter in wasteservices.3
Nature of industry Competitive, provided more by private sector, with publicsector declining in marketshare.3
Competitive, provided byprivate sector to a greaterdegree, relative to solidwaste.3
Key market participants (and locationof parent)
Veolia Environment (Onyx-France), Suez (SITA-France),Rethmann Entsorgungs (Germany), RWE EntsorgungAG (Germany), Noell Gonlbk(Germany).3
Veolia Environment (Onyx-France), Suez (SITA-France,Teris, France).3
Principal methods of waste treatmentand disposal
Land filling is the dominantwaste disposal method. Minority shares are splitbetween incineration andrecovery (recycling).1, 3
Land filling, physico/chemicaland biological treatment(stabilization), andincineration.1
Key European Community legislation Council Directive 91/156/EECon Solid Waste; CouncilDirective 96/61/EC onIntegrated PollutionPrevention and Control(IPPC); Council Directive99/31/EC on Landfill of Waste;Directive 94/62/EC onPackaging Waste.4
Council Directive91/689/EEC on HazardousWaste; Council Directive94/67/EC on HazardousWaste Incineration.1
Regulatory authorities European Commission; national and subnational authorities.4
See footnotes at end of table.
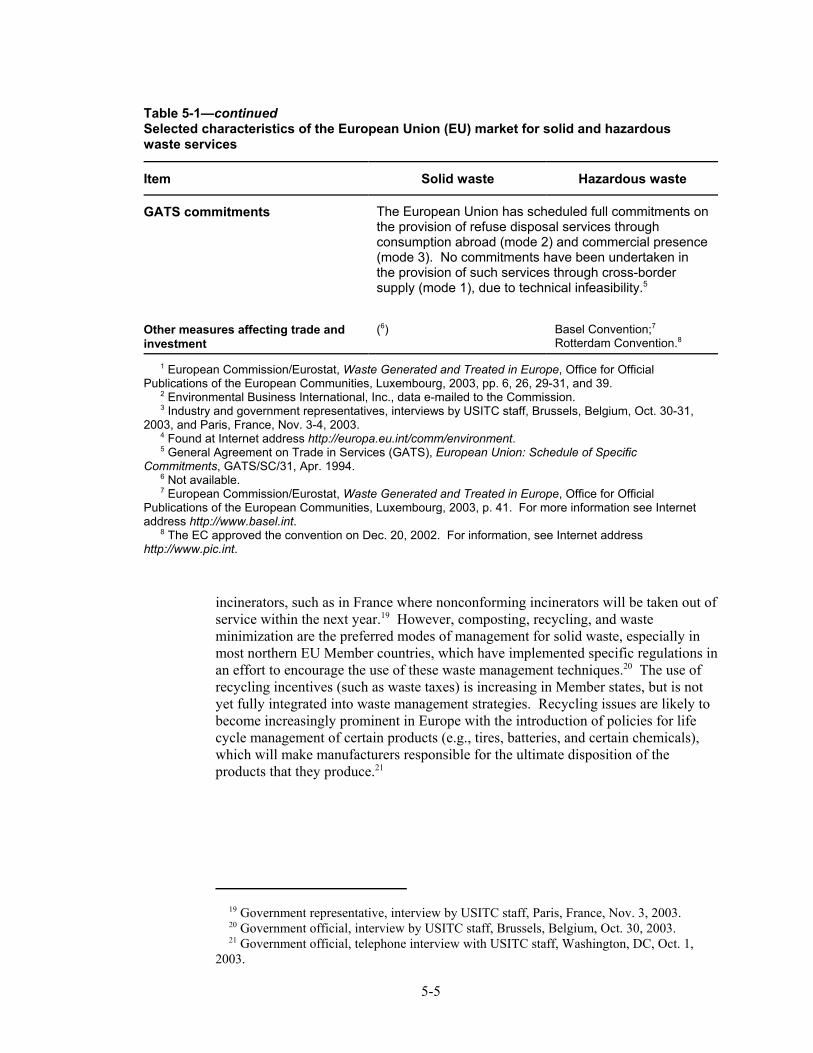
19 Government representative, interview by USITC staff, Paris, France, Nov. 3, 2003. 20 Government official, interview by USITC staff, Brussels, Belgium, Oct. 30, 2003. 21 Government official, telephone interview with USITC staff, Washington, DC, Oct. 1,2003.
5-5
Table 5-1—continuedSelected characteristics of the European Union (EU) market for solid and hazardouswaste services
Item Solid waste Hazardous waste
GATS commitments The European Union has scheduled full commitments onthe provision of refuse disposal services throughconsumption abroad (mode 2) and commercial presence(mode 3). No commitments have been undertaken inthe provision of such services through cross-bordersupply (mode 1), due to technical infeasibility.5
Other measures affecting trade andinvestment
(6) Basel Convention;7
Rotterdam Convention.8
1 European Commission/Eurostat, Waste Generated and Treated in Europe, Office for OfficialPublications of the European Communities, Luxembourg, 2003, pp. 6, 26, 29-31, and 39. 2 Environmental Business International, Inc., data e-mailed to the Commission. 3 Industry and government representatives, interviews by USITC staff, Brussels, Belgium, Oct. 30-31,2003, and Paris, France, Nov. 3-4, 2003. 4 Found at Internet address http://europa.eu.int/comm/environment. 5 General Agreement on Trade in Services (GATS), European Union: Schedule of SpecificCommitments, GATS/SC/31, Apr. 1994. 6 Not available. 7 European Commission/Eurostat, Waste Generated and Treated in Europe, Office for OfficialPublications of the European Communities, Luxembourg, 2003, p. 41. For more information see Internetaddress http://www.basel.int. 8 The EC approved the convention on Dec. 20, 2002. For information, see Internet addresshttp://www.pic.int.
incinerators, such as in France where nonconforming incinerators will be taken out ofservice within the next year.19 However, composting, recycling, and wasteminimization are the preferred modes of management for solid waste, especially inmost northern EU Member countries, which have implemented specific regulations inan effort to encourage the use of these waste management techniques.20 The use ofrecycling incentives (such as waste taxes) is increasing in Member states, but is notyet fully integrated into waste management strategies. Recycling issues are likely tobecome increasingly prominent in Europe with the introduction of policies for lifecycle management of certain products (e.g., tires, batteries, and certain chemicals),which will make manufacturers responsible for the ultimate disposition of theproducts that they produce.21
22 Eurostat, EU Generating 27 Million Tonnes of Hazardous Waste, news release, No.83/99, Aug. 19, 1999. In all of Western Europe, an estimated 47 million metric tons ofhazardous waste was generated annually between 1997 and 2001. European Commission/Eurostat, Waste Generated and Treated in Europe, Luxembourg: Office for OfficialPublications of the European Communities, 2003, p. 26. 23 Landfilling is decreasing in some EU member countries, while increasing significantly inothers, making it difficult to generalize about the overall region. European Commission /Eurostat, Waste Generated and Treated in Europe, Office for Official Publications of theEuropean Communities, Luxembourg: 2003, p. 30. 24 Hazardous waste recovery methods include separate collection and use as productioninputs. 25 Outside the EU, the situation is less clear, but several countries report low managementof hazardous waste, as measured by EU standards. 26 EIU Viewswire, “Vivendi exits Vizzavi,” Sept. 11, 2002, found at Internet addresshttp://www.viewswire.com/index.asp?layout=display_print&doc_id=208367/, retrieved Oct.17, 2003. 27 EIU Viewswire, “Recycling firm fined,” Feb. 3, 2003, found at Internet addresshttp://www.viewswire.com/index.asp?layout=display_print&doc_id=143092/, retrieved Oct.17, 2003. 28 EEA, Europe’s Environment: The Third Assessment, (Luxembourg: Office for OfficialPublications of the European Communities, 2003).
5-6
Eurostat estimates that the EU generated approximately 27 million metric tons ofhazardous waste annually in the mid-1990s.22 Although hazardous waste generallyaccounts for less than 5 percent of all waste generated in Europe, the sector garnersspecial attention owing to the significant risks that such wastes pose to theenvironment and human health. Principal management methods for hazardous wasteinclude landfilling23 (which often includes stabilization prior to disposal) andincineration. In addition, several EU Member states report hazardous wasterecovery24 rates in excess of 40 percent.25
EU firms rank among the world’s leading providers of solid and hazardous wasteservices and face virtually no competition from non-EU firms within their ownmarket. The leading companies currently active in the EU waste management marketinclude the waste divisions of the French companies Veolia Environment and SuezLyonnaise des Eaux (Sita and Teris), and German firms RWE and Rethmann. VeoliaEnvironment (formerly Vivendi Environment) is a recognized world leader in waterand waste management.26 Onyx, an affiliate of Veolia, is a market leader in wastemanagement in Europe with diversified operations in all sectors of wastemanagement, including waste collection, sorting, treatment, and landfill. In recentyears, the European waste management industry has been consolidating throughmergers and acquisitions. Germany is the only EU Member state in which oneprovider- RWE- dominates the country’s entire waste management system.27
The EU is a world leader in the development and implementation of laws, policies,and regulations regarding environmental protection, as the EU’s high populationdensity and limited land mass have led to a heightened recognition of the need formore effective solutions to the problems of waste treatment and disposal. TheCommunity’s 150-plus environmental statutes include some of the world’s moststringent environmental standards and regulations.28 Key EU directives affecting theprovision of solid and hazardous waste services include the Waste Framework
29 Council Directive 75/442/EEC requires Member states to establish an integrated andadequate network of disposal facilities that enables the Community as a whole to become self-sufficient in waste disposal. Further, the network must have capacity such that certain wastes,particularly hazardous waste, may not be generated in one country in quantities that warrantthe establishment of a dedicated disposal facility in that country. European Commission,Environment Policies, Waste Disposal, found at Internet addresshttp://europa.eu.int/scadplus/leg/en/lvb/l21197.htm/, retrieved Nov. 5, 2003. 30 Council Directive 91/689/EEC covers the management, recovery, and correct disposal ofhazardous waste. European Commission, Environment Policies, Controlled management ofhazardous waste, found at Internet addresshttp://europa.eu.int/scadplus/leg/en/lvb/l21199.htm/, retrieved Nov. 5, 2003. 31 In the EU Member states and accession countries, compliance with this directive is likelyto reduce the potential for environmental pollution from landfills. The directive imposesstringent operational and technical requirements on land filling and requires a reduction in thequantity of various waste streams entering landfills, as well as treatment of waste prior tolandfill. Council Directive 1999/31/EC entered into force on July 16, 1999. The deadline forimplementation by the Member states was July 16, 2001. European Commission,Environment Policies, Landfill of Waste, found at Internet addresshttp://europa.eu.int/comm/environment/waste/landfill_index.htm/, retrieved Nov. 5, 2003. 32 Council Directive 2000/76/EC entered into force on Dec. 29, 2000. From Dec. 28, 2002onward, new incinerators must comply with the provisions of the Directive, while the deadlinefor existing plants is Dec. 28, 2005. European Commission, Environment Policies, Wasteincineration, found at Internet addresshttp://europa.eu.int/comm/environment/wasteinc/index.htm/, retrieved Nov. 5, 2003. 33 Numerous directives focus on specialized topics including waste oils, titanium dioxide,batteries, disposal of PCBs and PCTs, end-of-life vehicles, and waste in electric and electronicproducts. 34 As part of the Commissions overall waste management strategy, several high-prioritywaste streams have been identified, including packaging, vehicles, batteries, electronic waste,and hazardous household waste. European Commission, EU Focus on Waste Management,Luxembourg: 1999. 35 One example of a waste prevention program is the promotion of intelligent productdesign that reduces the environmental impacts of products from their manufacture to the endof their useful life. 36 European Commission, Environment 2010: Our Future, Our Choice, 6th EU EnvironmentAction Programme, 2001-2010, 2001, p. 8.
5-7
Directive, as amended,29 the Directive on Hazardous Waste,30 the EU LandfillDirective,31 the Directive on Incineration of Waste,32 and the Directive on PackagingWaste.33 To improve monitoring and compliance, the Council Regulation on WasteManagement Statistics, adopted by the EU in November 2002, requires Memberstates to provide Eurostat with national statistics on the generation, recovery, anddisposal of waste beginning in 2004. Numerous EU policies also focus onenvironmental matters. For example, the Community Waste Management Strategystrives to establish an integrated waste management policy.34 Also, the sixthEnvironment Action Programme (EAP), which was approved by the Council in July2002, includes a waste management program that gives priority to waste prevention,35
followed by recycling, waste recovery and incineration, and landfilling. The EAP’starget is to achieve a 20-percent reduction in the quantity of waste destined fordisposal facilities (based on 2000 levels) by 2010, and a 50-percent reduction by2050.36
37 “Tied-aid” is project financing or other assistance to which certain conditions areattached. Recipients of tied-aid are often required to procure goods and services from firmsbased in the country that provides the aid. 38 The EU Eco-Industry’s Export Potential, final report to Director General XI of theEuropean Commission, Sept. 1999, found at Internet addresshttp://www.europa.eu.int/comm/environment/enveco/industry_employment/eco.pdf, retrievedDec. 9, 2003. 39 For example, prior to accession, a number of European waste management firms arealready established in the Czech Republic. Industry representative, interview by USITC staff,Prague, Czech Republic, Oct. 24, 2003. 40 After the acquisition of BFI by Allied Waste in 1999, the new company continued thedivestment program begun by BFI before the merger. BFI sold most of its non-NorthAmerican operations to Sita in 1998, and in 1999, Allied Waste sold its Sita holdings to SuezLyonnaise. 41 Beginning in 1999 and continuing throughout 2000, WMI sold the majority of itsinternational operations. Securities and Exchange Commission (SEC) Form 10_K, WasteManagement , Inc., Fiscal Year Ended Dec 31, 2000, found at Internet addresshttp://www.sec.gov/Archives/edgar/data/823768/000095012901001398/h84376e10-k.txt,retrieved Oct. 22, 2003. 42 Industry representative, interview by USITC staff, Prague, Czech Republic, Oct. 27,2003.
5-8
Trade and Investment
Anecdotal information suggests that the EU is a net exporter of both solid andhazardous waste services. While the home market is likely to remain the primaryfocus of EU waste management firms, some of the most promising growthopportunities for such firms are in newly industrializing nations. Some overseasexpansion by European environmental services firms takes place through “tied-aid”37
provided by the European Community and Member states. Tied-aid may account foras much as 40 percent of the EU’s environmental exports, and is most often appliedto aid projects in Southeast Asia, India, Africa, and South America.38 However, themajority of EU environmental exports go to markets where EU tied-aid is not a factor(e.g., the United States), indicating that EU suppliers are competitive in open marketconditions. Owing to geographic proximity, EU suppliers are in a particularly goodposition to capitalize on the expected increase in demand for solid and hazardouswaste disposal services in Central and Eastern Europe, as many of these countriesprepare for EU accession.39 French companies Onyx, Sita, and Teris, Germancompanies RWE and Rethmann, and smaller firms based in Austria and Germany --including Asa, Becker, Lobbe, Saubermacher, and Rumpold -- are particularly activein Central and Eastern Europe.
One significant market development was the withdrawal of the U.S. multinationalsBFI (now Allied Waste)40 and Waste Management, Inc. (WMI) from the EU marketand Central Europe. WMI had operations in most major European countries, but bythe end of March 2002 had sold all of its European subsidiaries to former rivals. In1999, WMI announced a shift in its strategic plan and refocused on the NorthAmerican solid waste management services market.41 Industry representatives alsoreport that European competitors of the U.S. firms likely gain some measure ofcompetitive advantage from their proximity to clients, as well as from their long-standing business relationships with clients in the region.42 Opportunities for U.S.
43 Industry representative, interview by USITC staff, Prague, Czech Republic, Oct. 27,2003. 44 General Agreement on Trade in Services (GATS), European Communities and theirMember States: Schedule of Specific Commitments, GATS/SC/31, Apr. 15, 1994. 45 European Commission, EU Focus on Waste Management, Luxembourg: 1999. 46 New definitions covering some areas of waste and waste services were introduced in2001, making time series analysis impossible. Czech Statistical Office, 2003. 47 In 2002, approximately 57 percent of the hazardous waste generated in the CzechRepublic was managed within the country. Industry representative, interview by USITC staff,Prague, Czech Republic, Oct. 24, 2003. 48 Industry representative, interview by USITC staff, Prague, Czech Republic, Oct. 24,2003. 49 Government official, interview by USITC staff, Prague, Czech Republic, Oct. 27, 2003.
5-9
and other firms exist in specialized niches of the European waste managementmarket, such as medical waste services.43
EU member countries seem to maintain few, if any, measures that specifically applyto the foreign provision of solid and hazardous waste services. Further, EUcommitments under the General Agreement on Trade in Services (GATS) grant fullmarket access and national treatment for the provision of refuse disposal servicesthrough modes 2 and 3.44 However, some waste-related provisions may have aparticularly significant impact on non-EU waste management firms. For example,EU policy dictates that, within Europe, waste disposal should occur as close aspossible to the site of waste generation. EU legislation also prohibits the transport ofall waste destined for disposal, as well as hazardous waste destined for recovery, tonon-OECD countries.45
Czech Republic
Market Overview
Compared to the other acceding countries, the Czech Republic generates a relativelylarge amount of solid and hazardous waste, especially in the mining, manufacturing,and power industries, and a relatively large share of the waste produced in thecountry is hazardous. The Czech Republic generated 28.2 million metric tons ofwaste in 2002, including 1.3 million metric tons of hazardous waste (table 5-2).46 The vast majority of generated waste is managed, and expenditures on wastemanagement have increased in recent years.47 Landfilling is the most prevalentmethod of waste disposal, accounting for 70 percent of the annual total, althoughsince August 1, 1996, landfilling has only been permissible in landfills that provideadequate technical measures to prevent environmental pollution. In response to agovernment policy that aims to discourage the use of hazardous waste landfillsthrough increased landfill disposal fees, Czech industry is minimizing hazardouswaste by treating it and converting it to nonhazardous waste, which is cheaper tomanage.48 Recycling of both solid and hazardous waste is increasing, and financialincentives to encourage the purchase of recycled products are under development.49 However, currently, waste is not widely used as a source of secondary inputs or for
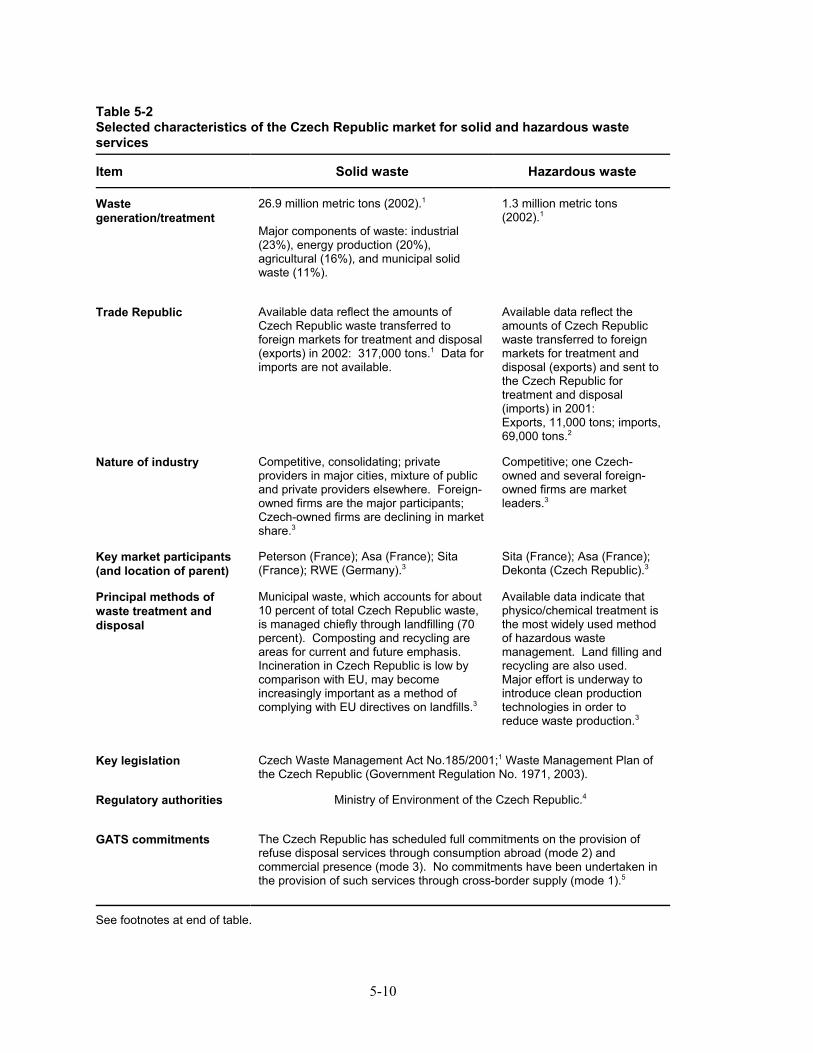
5-10
Table 5-2Selected characteristics of the Czech Republic market for solid and hazardous wasteservices
Item Solid waste Hazardous waste
Wastegeneration/treatment
26.9 million metric tons (2002).1
Major components of waste: industrial(23%), energy production (20%),agricultural (16%), and municipal solidwaste (11%).
1.3 million metric tons(2002).1
Trade Republic Available data reflect the amounts ofCzech Republic waste transferred toforeign markets for treatment and disposal(exports) in 2002: 317,000 tons.1 Data forimports are not available.
Available data reflect theamounts of Czech Republicwaste transferred to foreignmarkets for treatment anddisposal (exports) and sent tothe Czech Republic fortreatment and disposal(imports) in 2001: Exports, 11,000 tons; imports,69,000 tons.2
Nature of industry Competitive, consolidating; privateproviders in major cities, mixture of publicand private providers elsewhere. Foreign-owned firms are the major participants;Czech-owned firms are declining in marketshare.3
Competitive; one Czech-owned and several foreign-owned firms are marketleaders.3
Key market participants(and location of parent)
Peterson (France); Asa (France); Sita(France); RWE (Germany).3
Sita (France); Asa (France);Dekonta (Czech Republic).3
Principal methods ofwaste treatment anddisposal
Municipal waste, which accounts for about10 percent of total Czech Republic waste,is managed chiefly through landfilling (70percent). Composting and recycling areareas for current and future emphasis. Incineration in Czech Republic is low bycomparison with EU, may becomeincreasingly important as a method ofcomplying with EU directives on landfills.3
Available data indicate thatphysico/chemical treatment isthe most widely used methodof hazardous wastemanagement. Land filling andrecycling are also used. Major effort is underway tointroduce clean productiontechnologies in order toreduce waste production.3
Key legislation Czech Waste Management Act No.185/2001;1 Waste Management Plan ofthe Czech Republic (Government Regulation No. 1971, 2003).
Regulatory authorities Ministry of Environment of the Czech Republic.4
GATS commitments The Czech Republic has scheduled full commitments on the provision ofrefuse disposal services through consumption abroad (mode 2) andcommercial presence (mode 3). No commitments have been undertaken inthe provision of such services through cross-border supply (mode 1).5
See footnotes at end of table.
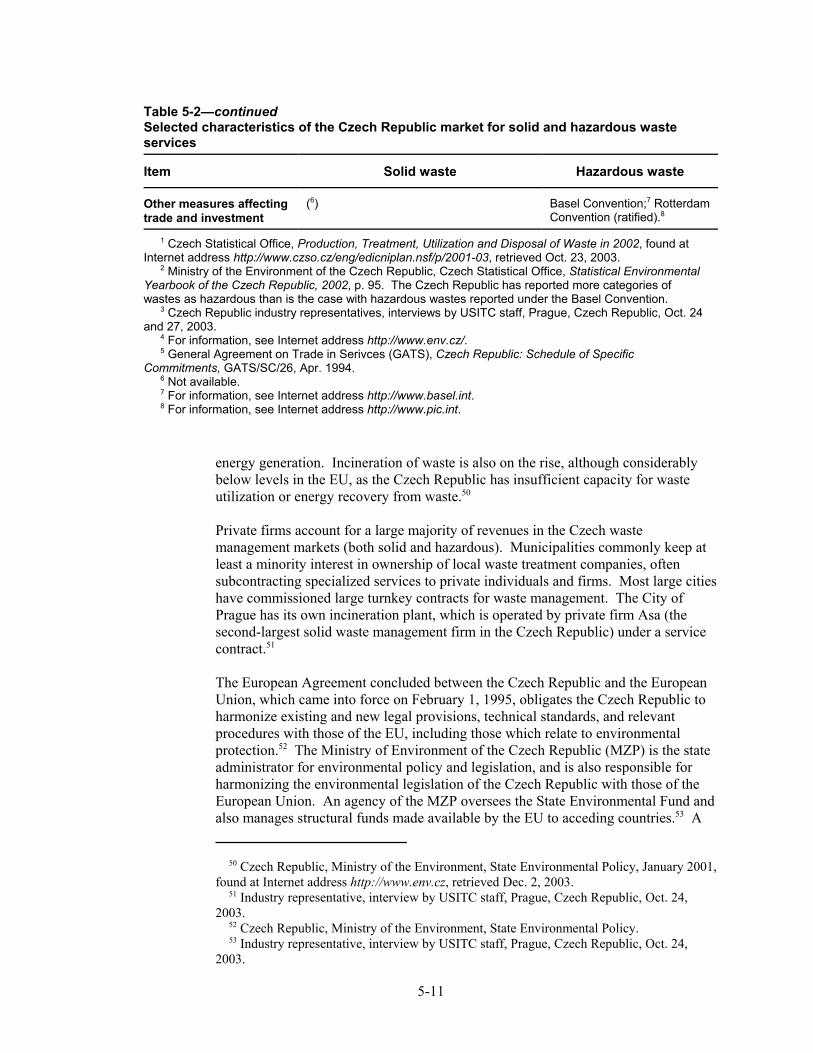
50 Czech Republic, Ministry of the Environment, State Environmental Policy, January 2001,found at Internet address http://www.env.cz, retrieved Dec. 2, 2003. 51 Industry representative, interview by USITC staff, Prague, Czech Republic, Oct. 24,2003. 52 Czech Republic, Ministry of the Environment, State Environmental Policy. 53 Industry representative, interview by USITC staff, Prague, Czech Republic, Oct. 24,2003.
5-11
Table 5-2—continuedSelected characteristics of the Czech Republic market for solid and hazardous wasteservices
Item Solid waste Hazardous waste
Other measures affectingtrade and investment
(6) Basel Convention;7 RotterdamConvention (ratified).8
1 Czech Statistical Office, Production, Treatment, Utilization and Disposal of Waste in 2002, found atInternet address http://www.czso.cz/eng/edicniplan.nsf/p/2001-03, retrieved Oct. 23, 2003. 2 Ministry of the Environment of the Czech Republic, Czech Statistical Office, Statistical EnvironmentalYearbook of the Czech Republic, 2002, p. 95. The Czech Republic has reported more categories ofwastes as hazardous than is the case with hazardous wastes reported under the Basel Convention. 3 Czech Republic industry representatives, interviews by USITC staff, Prague, Czech Republic, Oct. 24and 27, 2003. 4 For information, see Internet address http://www.env.cz/. 5 General Agreement on Trade in Serivces (GATS), Czech Republic: Schedule of SpecificCommitments, GATS/SC/26, Apr. 1994. 6 Not available. 7 For information, see Internet address http://www.basel.int. 8 For information, see Internet address http://www.pic.int.
energy generation. Incineration of waste is also on the rise, although considerablybelow levels in the EU, as the Czech Republic has insufficient capacity for wasteutilization or energy recovery from waste.50
Private firms account for a large majority of revenues in the Czech wastemanagement markets (both solid and hazardous). Municipalities commonly keep atleast a minority interest in ownership of local waste treatment companies, oftensubcontracting specialized services to private individuals and firms. Most large citieshave commissioned large turnkey contracts for waste management. The City ofPrague has its own incineration plant, which is operated by private firm Asa (thesecond-largest solid waste management firm in the Czech Republic) under a servicecontract.51
The European Agreement concluded between the Czech Republic and the EuropeanUnion, which came into force on February 1, 1995, obligates the Czech Republic toharmonize existing and new legal provisions, technical standards, and relevantprocedures with those of the EU, including those which relate to environmentalprotection.52 The Ministry of Environment of the Czech Republic (MZP) is the stateadministrator for environmental policy and legislation, and is also responsible forharmonizing the environmental legislation of the Czech Republic with those of theEuropean Union. An agency of the MZP oversees the State Environmental Fund andalso manages structural funds made available by the EU to acceding countries.53 A
54 Czech Republic, Ministry of the Environment, State Environmental Policy. 55 Czech Republic, Ministry of the Environment, State Environmental Policy. 56 Waste Management Inc. (U.S.) used to be in the Czech market, but has since withdrawn. 57 Government and industry representatives, interviews by USITC staff, Prague, CzechRepublic, Oct. 24, 2003. 58 Dollar values generated by USITC calculation. 59 Sita serves about 600,000 residential customers (less than 10 percent of the market) and12,000 commercial customers. The firm ranks third in the Czech Republic in solid waste, andfirst in hazardous waste and remediation. 60 Industry representative, interview by USITC staff, Prague, Czech Republic, Oct. 24,2003. 61 For example, waste tires are only imported for recycling; none are exported. Imports ofrefrigerators from Asia for recycling is another government priority program being put intoeffect. Industry representative, interview by USITC staff, Prague, Czech Republic, Oct. 27,2003.
5-12
Czech Parliament committee is responsible for regional environmental policy andprotection, while the oversight of waste management is to be transferred to theregional authorities.54
Recent progress has been achieved in the form of the development of a Stateadministration of waste management. Legal and institutional processes have beencreated for keeping records of waste generation, waste management, and wastedisposal; and the first wave of closures and reclamation of inadequate landfills hasbeen completed.55
Trade and Investment
The Czech Republic is a competitive market for European firms,56 however,development funds from the EU usually are tied-aid that awards projects to EUfirms.57 As such, many of the major waste management firms in the Czech Republicwere formerly Czech-owned, but subsequently were acquired by EU-owned firms,including Peterson (part of Veolia group, France; $56 million58 in revenues), Asa(owned by electricity firm EDP, France; $45 million), Sita (part of Suez group,France; $37 million),59 and RWE (Germany).60 The import and export of wastes forrecovery or disposal are permitted under current legal regulations in the CzechRepublic, as are the associated waste management services.61
Future ProspectsThe future prospects of the European solid and hazardous waste services markets willlikely be most heavily influenced by the accession of several Eastern Europeancountries to the EU in May 2004, the trend toward regulatory incentives for wastereduction and recovery within the EU, and the continuing privatization of publicwaste services across Europe. The increase in the size of the European market willundoubtedly create new opportunities for commerce, and accession is likely tocontribute to conditions that would support investment in technology andinfrastructure in the newer Member states. With anticipated higher levels ofeconomic growth in the new Member states following accession, a significant
62 Dollar value generated by USITC calculation.
5-13
increase in waste generation can be expected. According to European EnvironmentAgency (EEA) estimates, if quantities of solid and hazardous waste in the newMember states reach the average amount per capita for the EU, the total amount ofmunicipal waste in these countries will increase by 50 percent by 2010. In addition,acceding countries will be required to implement some 140 environmental directivesthat may have an impact on the solid and hazardous waste services industry. It hasbeen estimated by the European Court of Auditors that it will cost the accessioncountries up to $90 billion62 over the next decade to conform to the environmentalregulations of the European Union.

1 What a Waste: Solid Waste Management in Asia, World Bank, May 1999. According tothe report, official waste generation estimates are believed to be extremely conservative andcould be more than double these amounts. 2 State of the Environment in Asia and the Pacific 2000, Economic and Social Division forAsia and the Pacific, Asian Development Bank. Figures for hazardous waste generation areestimates and are considered to be conservative. The most common types of hazardous wastegenerated in the region include solvents and pesticides. 3 State of the Environment in Asia and the Pacific 2000, Economic and Social Division forAsia and the Pacific, Asian Development Bank.
6-1
CHAPTER 6ASIA AND THE PACIFIC
IntroductionSolid and hazardous waste services markets in Asia and the Pacific are highly varied,reflecting the diverse economic landscape of the region. Waste generation rates andthe ability to finance waste management efforts differ among low-, middle-, andupper-income countries. As per capita GDP rises in many Asian nations so, too, doconsumption, waste generation, and thus, demand for solid and hazardous wastemanagement services. While trade in waste management services seems to be in itsinfancy throughout the region, foreign investment in the construction of treatmentfacilities and related infrastructure is growing rapidly. It is likely that opportunitiesfor trade and investment will increase as the regulatory environments of Asia-Pacificnations mature, either through adoption of new laws or more consistent enforcementof existing regulations.
This chapter provides an overview of solid and hazardous waste services marketsacross the Asia-Pacific region, and presents specific information on the Australian,Chinese, Japanese, and Malaysian markets for such services. Australia and Japanwere selected for special emphasis owing to the relatively large size and maturity oftheir solid and hazardous waste services markets, China was selected owing to therapid growth of its environmental services market, and Malaysia was selected owingto its relatively long experience with environmental regulation.
Regional Market OverviewWaste generation in the Asia-Pacific region is generally increasing as economiesgrow and individual consumption rises. The Asia-Pacific region as a whole generatesan estimated 1.5 million metric tons of solid waste per day, and is expected toincrease its rate of solid waste generation to at least 3 million metric tons by 2025.1 The region as a whole generated an estimated 233 million metric tons of hazardouswaste2 in 2000, of which China accounted for the greatest share, 56 percent, followedby India and Indonesia with 35 percent and 5 percent, respectively.3 Industrial solidwaste accounts for an estimated 87 percent of all nonhazardous solid waste generatedin developed countries such as Japan and Australia. By contrast, in developing
4 Ibid. 5 Environmental Business International, Inc. (EBI), The Global Environmental Market byRegion, 2000, attachment to an e-mail message, received July 31, 2003. Of the $40.2 billionspent in 2000, $35.4 billion was devoted to solid waste services while $4.8 billion wenttoward hazardous waste management. 6 What a Waste: Solid Waste Management in Asia, World Bank. 7 The informal sector comprises individuals who pick through waste at dumpsites forreusable products and then find buyers for the materials. 8 State of the Environment in Asia and the Pacific 2000, Economic and Social Division forAsia and the Pacific, Asian Development Bank. 9 Ibid.
6-2
countries such as China, industrial solid waste accounts for an estimated 65 percentor less of solid waste generation.4
In 2000, the Asia-Pacific market for solid and hazardous waste management serviceswas valued at approximately $40.2 billion. Japan accounted for 85 percent of thatmarket, Australia and New Zealand an additional 4 percent, and the rest of Asiaaccounted for the remaining 11 percent.5 Resources spent on solid wastemanagement, accounting for 88 percent of the total market for solid and hazardouswaste services, greatly outweighed the 12 percent dedicated to hazardous wastemanagement. Urban areas in Asia together spend about $25 billion per year on solidwaste management, and are expected to double such expenditures by 2025.6
In the Asia-Pacific region, solid and hazardous waste management services aresupplied by governments, the private sector, and in many cases – especially in low-income countries – the informal sector.7 In high-income countries there is typicallya high degree of government regulation, but private-sector suppliers usually dominatethe market for waste management services. In developing countries where wastemanagement systems are less evolved, governments frequently maintain greatercontrol over the provision of such services or grant monopoly status to certaindomestic companies. Throughout the region, governments increasingly arecontracting out discrete waste management activities to private companies. Forexample, in 2000, over 20 percent of municipal solid waste collection services in theAsia-Pacific region were performed by private companies under contract, particularlyin Australia, China, Hong Kong, Malaysia, the Republic of Korea, Singapore, andThailand.8
Methods of waste treatment and disposal in the Asia-Pacific region are largelyinfluenced by regulation, land costs, and the evolution of waste managementprograms. Use of sanitary landfills is prevalent throughout Asia and the Pacific,employed by cities in low-, middle-, and high-income countries. Some countries inthe region, such as Japan and Australia, are using landfill gasses to generate electricalpower. Japan and Singapore are the only two countries in the region that employincineration as the predominant means of solid waste disposal (75 and 70 percent,respectively).9 Australia, Korea, Indonesia, and Hong Kong also have modernincineration facilities.
10 Ibid. 11 Based on interviews by USITC staff with industry and government sources, Beijing,China and Kuala Lumpur, Malaysia, Oct. 2003. 12 State of the Environment in Asia and the Pacific 2000, Economic and Social Divisionfor Asia and the Pacific, Asian Development Bank. 13 Signatories to the Basel Convention considered members of the Asia and Pacific regioninclude Bahrain, Bangladesh, Bhutan, Brunei Darussalam, Cambodia, China, Cyprus, India,Indonesia, Iran (Islamic Republic of), Japan, Jordan, Kazakhstan, Kiribati, Kuwait,Kyrgyzstan, Lebanon, Malaysia, Maldives, Marshall Islands, Micronesia (Federated Statesof), Mongolia, Nauru, Nepal, Oman, Pakistan, Papua New Guinea, Philippines, Qatar,Republic of Korea, Samoa, Saudi Arabia, Singapore, Sri Lanka, Syrian Arab Republic,Thailand, Turkmenistan, United Arab Emirates, Uzbekistan, Viet Nam, and Yemen.
6-3
Open dumping, which includes disposal in nonengineered, nonsanitary landfills, isreportedly the most common method of solid waste disposal in low-income countriesthroughout the region.10 This is likely due to weak regulation and an inability tofinance modern methods of waste management.
Methods of hazardous waste management throughout the region vary according tothe type of substance being treated and the sophistication of treatment facilities. Most countries have regulations addressing the storage and treatment of hazardouswaste, though the levels of compliance vary widely. Middle- and high-incomecountries are more likely to incinerate or chemically treat waste. In low- incomecountries where regulation and treatment options tend to be weaker, an unknown butbelieved to be significant portion of hazardous waste is released into theenvironment. However, it is not uncommon for governments in low- and middle-income countries to require that companies store their hazardous waste until suitablemethods of treatment become available.11
Throughout the 1990s, the rate of recycling grew significantly in the Asia-Pacificregion, from less than 10 percent in 1988 to 30 percent in 1998.12 Paper andpaperboard are the most commonly recycled materials, but glass, metal, and plasticsare recovered as well. In middle- and high-income countries, governments and theprivate sector frequently promote, fund, and/or operate recycling facilities. In theregion’s low-income countries, recycling is primarily carried out by the informalsector. Many countries in the region are signatories to the Basel Convention andMontreal Protocol, as well as members of the World Trade Organization, all of whichshape solid and hazardous waste management markets to some degree. For example,member nations of the Basel Convention13 are subject to controls on internationaltrade in hazardous waste. GATS commitments on refuse disposal services varywidely throughout the region, with certain economies such as Australia and Taiwanhaving scheduled full commitments on refuse disposal services provided throughmodes 2 and 3, and other economies such as Malaysia and New Zealand havingscheduled no commitments on this service sector.
14 EBI, data from The Global Environmental Market by Region, 2000 spreadsheet. 15 EBI, Report 2000 - Environmental Industry Overview. 16 Survey of Environmental Markets in APEC, Asia-Pacific Economic CooperationCommittee on Trade and Investment, June 2001. 17 State of the Environment in Asia and the Pacific 2000, Economic and Social Divisionfor Asia and the Pacific, Asian Development Bank. 18 Ibid. 19 EBI, Report 2000 - Environmental Industry Overview.
6-4
Australia
Market Overview
Australia has the second largest environmental market in the Asia-Pacific region,behind Japan, and the tenth largest market worldwide.14 Australian environmentalservices revenues totaled $7.1 billion in 2000, of which an estimated $1.3 billion wasdedicated to solid waste services and $260 million to hazardous waste services. Australia generates an estimated 14.4 million metric tons of solid waste per year, 95percent of which is managed (table 6-1). Approximately 96 percent of Australia’smanaged solid waste is disposed in landfills.15 Australia’s high rate of landfillingreflects the country’s abundance of affordable land and a public distaste forincineration, which was particularly acute during the late 1980s and early 1990s. Theunpopularity of incineration has reportedly prompted the country’s development ofcleaner, more advanced methods of waste disposal;16 however, these newtechnologies may be better suited to the hazardous waste management industry. Australia generated an estimated 275,000 metric tons of hazardous waste in 2000,17
almost all of which was managed.18
In recent years, the Australian Government has strongly encouraged wasteminimization and recycling efforts among citizens and industry. Further, theGovernment has undertaken an ambitious effort to reduce by 50 percent the amountof all solid waste destined for landfills.19 Such efforts may provide marketopportunities for suppliers of technologically advanced and efficient sorting,recycling, and incineration services.
Treatment of solid and hazardous waste in Australia is primarily regulated throughthe Environment Protection Act of 1970 and the Environment Protection (PrescribedWaste) Regulations. At the national level, the Environmental Protection Authorityestablishes waste management guidelines, but each state is responsible for craftingspecific regulations that are enforced by local governments. Regional WasteManagement Groups were created to develop a more consistent approach to wastemanagement in Australia by coordinating and harmonizing nation- and state-widewaste management regulations.
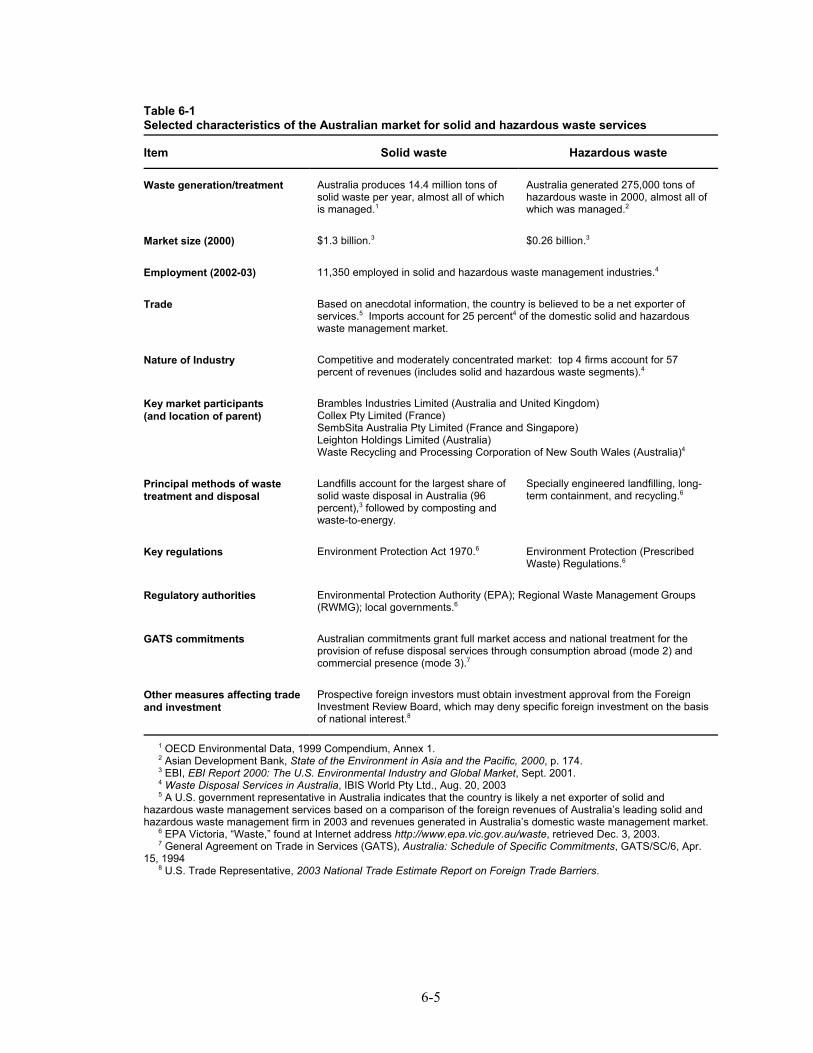
6-5
Table 6-1Selected characteristics of the Australian market for solid and hazardous waste services
Item Solid waste Hazardous waste
Waste generation/treatment Australia produces 14.4 million tons ofsolid waste per year, almost all of whichis managed.1
Australia generated 275,000 tons ofhazardous waste in 2000, almost all ofwhich was managed.2
Market size (2000) $1.3 billion.3 $0.26 billion.3
Employment (2002-03) 11,350 employed in solid and hazardous waste management industries.4
Trade Based on anecdotal information, the country is believed to be a net exporter ofservices.5 Imports account for 25 percent4 of the domestic solid and hazardouswaste management market.
Nature of Industry Competitive and moderately concentrated market: top 4 firms account for 57percent of revenues (includes solid and hazardous waste segments).4
Key market participants(and location of parent)
Brambles Industries Limited (Australia and United Kingdom)Collex Pty Limited (France)SembSita Australia Pty Limited (France and Singapore)Leighton Holdings Limited (Australia)Waste Recycling and Processing Corporation of New South Wales (Australia)4
Principal methods of wastetreatment and disposal
Landfills account for the largest share ofsolid waste disposal in Australia (96percent),3 followed by composting andwaste-to-energy.
Specially engineered landfilling, long-term containment, and recycling.6
Key regulations Environment Protection Act 1970.6 Environment Protection (PrescribedWaste) Regulations.6
Regulatory authorities Environmental Protection Authority (EPA); Regional Waste Management Groups(RWMG); local governments.6
GATS commitments Australian commitments grant full market access and national treatment for theprovision of refuse disposal services through consumption abroad (mode 2) andcommercial presence (mode 3).7
Other measures affecting tradeand investment
Prospective foreign investors must obtain investment approval from the ForeignInvestment Review Board, which may deny specific foreign investment on the basisof national interest.8
1 OECD Environmental Data, 1999 Compendium, Annex 1. 2 Asian Development Bank, State of the Environment in Asia and the Pacific, 2000, p. 174. 3 EBI, EBI Report 2000: The U.S. Environmental Industry and Global Market, Sept. 2001. 4 Waste Disposal Services in Australia, IBIS World Pty Ltd., Aug. 20, 2003 5 A U.S. government representative in Australia indicates that the country is likely a net exporter of solid andhazardous waste management services based on a comparison of the foreign revenues of Australia’s leading solid andhazardous waste management firm in 2003 and revenues generated in Australia’s domestic waste management market. 6 EPA Victoria, “Waste,” found at Internet address http://www.epa.vic.gov.au/waste, retrieved Dec. 3, 2003. 7 General Agreement on Trade in Services (GATS), Australia: Schedule of Specific Commitments, GATS/SC/6, Apr.15, 1994 8 U.S. Trade Representative, 2003 National Trade Estimate Report on Foreign Trade Barriers.
20 A U.S. government representative in Australia indicates that the country is likely a netexporter of solid and hazardous waste management services based on a comparison of theforeign revenues of Australia’s leading solid and hazardous waste management firm in 2003and revenues generated in Australia’s domestic waste management market. 21 Waste Disposal Services in Australia, IBISWorld Pty Ltd., Aug. 20, 2003. 22 Australian Trade Commission, news release found at Internet addresshttp://www.austrade.gov.au, retrieved Nov. 24, 2003. 23 For explanations of these modes of supply, see Appendix E. 24 EBI, data from The Global Environmental Market by Region, 2000 spreadsheet. Figures include environmental equipment, services, and resources such as water utilities. 25 EBI, Report 2000 - Environmental Industry Overview, pp.18-20. While data on theentire environmental market size are available through 2002, data on environmental market bysector are only available through 2000. 26 China has three basic classifications of waste: municipal waste, industrial solid waste,and hazardous waste.
6-6
Trade and Investment
Though trade data are not available, Australia is believed to be a net exporter of solidand hazardous waste management services.20 Although the heavy reliance onlandfilling reduces opportunities in other market segments, it is believed thatAustralian imports of waste management services account for 25 percent of thecountry’s solid and hazardous waste services market. The two most prominentforeign companies operating in the sector include Collex Pty Limited, whose largestshareholder is the French company Vivendi (Onyx); and SembSita Australia PtyLimited, which is 60-percent owned by the French company SITA, and 40-percentowned by SembCorp Waste Management of Singapore.21 Australian exporters ofsolid and hazardous waste management services focus largely on the Asia-Pacific andEuropean markets. Most recently, the Melbourne-based Cleanevent Group wasawarded an $80 million cleaning and waste management contract for the 2004Olympic Games in Athens, Greece.22 Australian GATS commitments grant fullmarket access and national treatment for the provision of refuse disposal servicesthrough consumption abroad and commercial presence.23
China
Market Overview
The environmental goods and services market in China is small, but has beengrowing at an impressive rate in recent years due in part to China’s increasedinvolvement in world markets and the country’s accession to the WTO. In 2002,China’s market for environmental goods and services totaled $7.15 million,24 whichrepresents a 117-percent increase over 1995 levels. Solid and hazardous wastemanagement services accounted for an estimated $890 million and $180 million,respectively, of China’s environmental goods and services industry revenues in 2000(table 6-2).25 While data on waste generation rates26 tends to be inconsistent, theChinese Government estimates that in 2002, the country generated 160 million
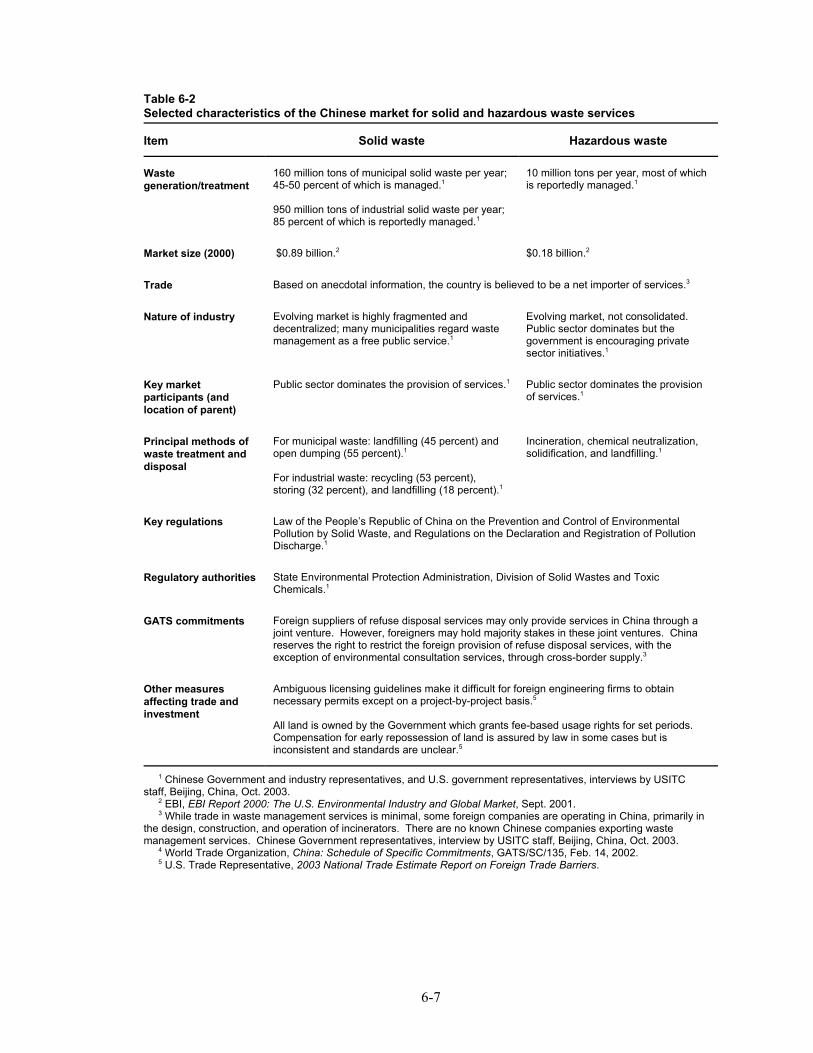
6-7
Table 6-2Selected characteristics of the Chinese market for solid and hazardous waste services
Item Solid waste Hazardous waste
Wastegeneration/treatment
160 million tons of municipal solid waste per year;45-50 percent of which is managed.1
950 million tons of industrial solid waste per year;85 percent of which is reportedly managed.1
10 million tons per year, most of whichis reportedly managed.1
Market size (2000) $0.89 billion.2 $0.18 billion.2
Trade Based on anecdotal information, the country is believed to be a net importer of services.3
Nature of industry Evolving market is highly fragmented anddecentralized; many municipalities regard wastemanagement as a free public service.1
Evolving market, not consolidated. Public sector dominates but thegovernment is encouraging privatesector initiatives.1
Key marketparticipants (andlocation of parent)
Public sector dominates the provision of services.1 Public sector dominates the provisionof services.1
Principal methods ofwaste treatment anddisposal
For municipal waste: landfilling (45 percent) andopen dumping (55 percent).1
For industrial waste: recycling (53 percent),storing (32 percent), and landfilling (18 percent).1
Incineration, chemical neutralization,solidification, and landfilling.1
Key regulations Law of the People’s Republic of China on the Prevention and Control of EnvironmentalPollution by Solid Waste, and Regulations on the Declaration and Registration of PollutionDischarge.1
Regulatory authorities State Environmental Protection Administration, Division of Solid Wastes and ToxicChemicals.1
GATS commitments Foreign suppliers of refuse disposal services may only provide services in China through ajoint venture. However, foreigners may hold majority stakes in these joint ventures. Chinareserves the right to restrict the foreign provision of refuse disposal services, with theexception of environmental consultation services, through cross-border supply.3
Other measuresaffecting trade andinvestment
Ambiguous licensing guidelines make it difficult for foreign engineering firms to obtainnecessary permits except on a project-by-project basis.5
All land is owned by the Government which grants fee-based usage rights for set periods. Compensation for early repossession of land is assured by law in some cases but is inconsistent and standards are unclear.5
1 Chinese Government and industry representatives, and U.S. government representatives, interviews by USITCstaff, Beijing, China, Oct. 2003. 2 EBI, EBI Report 2000: The U.S. Environmental Industry and Global Market, Sept. 2001. 3 While trade in waste management services is minimal, some foreign companies are operating in China, primarily inthe design, construction, and operation of incinerators. There are no known Chinese companies exporting wastemanagement services. Chinese Government representatives, interview by USITC staff, Beijing, China, Oct. 2003. 4 World Trade Organization, China: Schedule of Specific Commitments, GATS/SC/135, Feb. 14, 2002. 5 U.S. Trade Representative, 2003 National Trade Estimate Report on Foreign Trade Barriers.
27 Of the 950 million metric tons of industrial solid waste generated in 2002, 500 millionmetric tons were multi-utilized, 170 million metric tons treated, 300 million metric tons put instorage until a suitable means of disposal can be determined, and 26.35 million metric tonsreleased to the environment. Chinese Government representative, interview by USITC staff,Beijing, China, Oct. 15, 2003. 28 Estimates by Chinese government representative, interview by USITC staff, Beijing,China, Oct. 15, 2003. 29 For example, coal dust is often used to make bricks, and steel can be stripped fromwaste and recycled. Chinese Government representative, interview by USITC staff, Beijing,China, Oct. 15, 2003. 30 Chinese Government representative, interview by USITC staff, Beijing, China, Oct. 15,2003. 31 Ibid. 32 Ibid.
6-8
metric tons of municipal solid waste, of which an estimated 45-50 percent wasmanaged; 950 million metric tons of industrial solid waste, 85 percent of which wasreportedly managed;27 and 10 million metric tons of hazardous waste, most of whichwas reportedly treated.28
Until recently, the government was almost solely responsible for collecting anddisposing municipal waste, but is now encouraging private participation. At least 90percent of the municipal solid waste that is managed in China is disposed of inlandfills, largely owing to China’s abundance of inexpensive land and a shortage ofcapital with which to invest in more sophisticated technologies. Incineration, whilenot widely practiced, is becoming more acceptable as municipalities gain experiencewith that treatment method. However, a lack of capital for the construction of newincineration facilities and the absence of means by which to separate combustiblewaste from that which cannot be burned may serve as an obstacle to more widespreaduse of incineration.
The Chinese State Environmental Protection Agency (SEPA) encourages companiesto handle their industrial solid and hazardous waste by means of multiple-utilization,that is, by finding alternate uses for waste instead of sending it directly to landfills.29 The Government estimates that 45 percent of industrial solid waste and 50 percent ofhazardous waste is successfully reused. Hazardous waste is typically treated bymeans of chemical neutralization, incineration, or solidification, with much of thewaste ultimately ending up in landfills after treatment. However, because of limitedtechnology and funding, and thus limited capacity, companies are frequently unableto treat all of their hazardous waste so they must store it until treatment is possible. In response, the Government has planned to allocate approximately $1.94 billion forthe construction of hazardous waste treatment facilities throughout the country during2003-2005.30 Funding will come from local, state, and foreign governments, as wellas from local and foreign industry.31
SEPA drafts and supervises the implementation of China’s environmental laws andregulations at the national level, and coordinates with the Ministry of Construction,the Ministry of Health, and the Development and Reform Commission, who areresponsible for municipal, medical, and industrial waste, respectively. Provincial andlocal governments are responsible for the implementation of solid and hazardouswaste regulations.32
33 Chinese Government representative, interview by USITC staff, Beijing, China, Oct. 15,2003. 34 EBI, data from The Global Environmental Market by Region, 2000 spreadsheet. 35 Japan has two classifications of waste: generic, which includes all municipal solidwaste; and industrial, which includes both solid and hazardous waste generated in the processof industrial activity. 36 State of the Environment in Asia and the Pacific 2000, Economic and Social Divisionfor Asia and the Pacific, Asian Development Bank. 37 Japanese government representative, interview by USITC staff, Tokyo, Japan, Oct. 6,2003. Japan has approximately 2000 intermediary waste disposal facilities, mainlyincinerators, where waste is reduced before final disposal in one of nearly 2000 landfills. 38 Japanese government representative, interview by USITC staff, Tokyo, Japan, Oct. 3,2003. Official data on industrial waste includes both solid and hazardous waste. An estimateof the share of solid to hazardous waste contained in this category could not be provided.
6-9
Trade and Investment
Trade in solid and hazardous waste management services is believed to be minimal,although several international companies and donor agencies have designed and builtwaste treatment facilities in China. However, the Chinese Government is activelyencouraging foreign direct investment in the market through joint ventures withChinese companies. Foreign equity in Chinese waste management operations islimited to 50 percent.33 China’s GATS commitments grant national treatment for theprovision of refuse disposal services through modes 1, 2, and 3, and grant marketaccess through mode 2.
Japan
Market Overview
Japan’s solid and hazardous waste services market is the largest in the Asia-Pacificregion and the second largest worldwide behind the United States.34 Solid andhazardous waste management revenues in Japan respectively totaled $30.2 billionand $3.9 billion in 2000 (table 6-3), together accounting for 36 percent of Japan’senvironmental goods and services market. Japan generates an estimated 52.4 millionmetric tons of municipal solid waste each year, most of which is managed.35 Municipal governments are responsible for the construction of waste managementfacilities and the collection, transportation, and disposal of waste, although suchactivities are routinely contracted out to private companies. The construction ofwaste management facilities is usually subsidized in part by the central government,while waste management services are funded through waste disposal taxes leviedupon citizens. An estimated 75 percent36 of municipal solid waste in Japan isdisposed of through incineration, followed by landfilling as the second most favoreddisposal option.37
Japanese companies generate 406 million metric tons of industrial solid andhazardous waste per year,38 with the responsibility for treatment and disposal restingsolely with the individual firms generating the waste. Construction and operation ofindustrial waste management facilities are funded through private investment anddisposal fees paid by waste generating firms. Several large manufacturers have
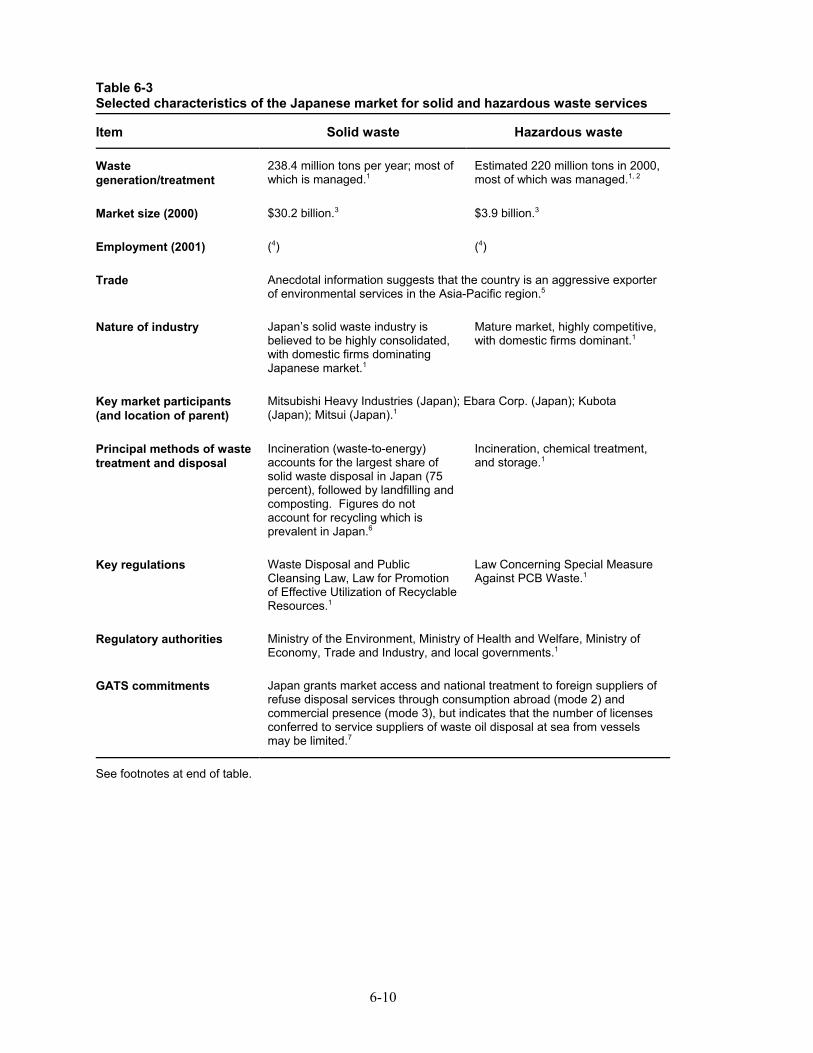
6-10
Table 6-3Selected characteristics of the Japanese market for solid and hazardous waste services
Item Solid waste Hazardous waste
Wastegeneration/treatment
238.4 million tons per year; most ofwhich is managed.1
Estimated 220 million tons in 2000,most of which was managed.1, 2
Market size (2000) $30.2 billion.3 $3.9 billion.3
Employment (2001) (4) (4)
Trade Anecdotal information suggests that the country is an aggressive exporterof environmental services in the Asia-Pacific region.5
Nature of industry Japan’s solid waste industry isbelieved to be highly consolidated,with domestic firms dominatingJapanese market.1
Mature market, highly competitive,with domestic firms dominant.1
Key market participants(and location of parent)
Mitsubishi Heavy Industries (Japan); Ebara Corp. (Japan); Kubota(Japan); Mitsui (Japan).1
Principal methods of wastetreatment and disposal
Incineration (waste-to-energy)accounts for the largest share ofsolid waste disposal in Japan (75percent), followed by landfilling andcomposting. Figures do notaccount for recycling which isprevalent in Japan.6
Incineration, chemical treatment,and storage.1
Key regulations Waste Disposal and PublicCleansing Law, Law for Promotionof Effective Utilization of RecyclableResources.1
Law Concerning Special MeasureAgainst PCB Waste.1
Regulatory authorities Ministry of the Environment, Ministry of Health and Welfare, Ministry ofEconomy, Trade and Industry, and local governments.1
GATS commitments Japan grants market access and national treatment to foreign suppliers ofrefuse disposal services through consumption abroad (mode 2) andcommercial presence (mode 3), but indicates that the number of licensesconferred to service suppliers of waste oil disposal at sea from vesselsmay be limited.7
See footnotes at end of table.
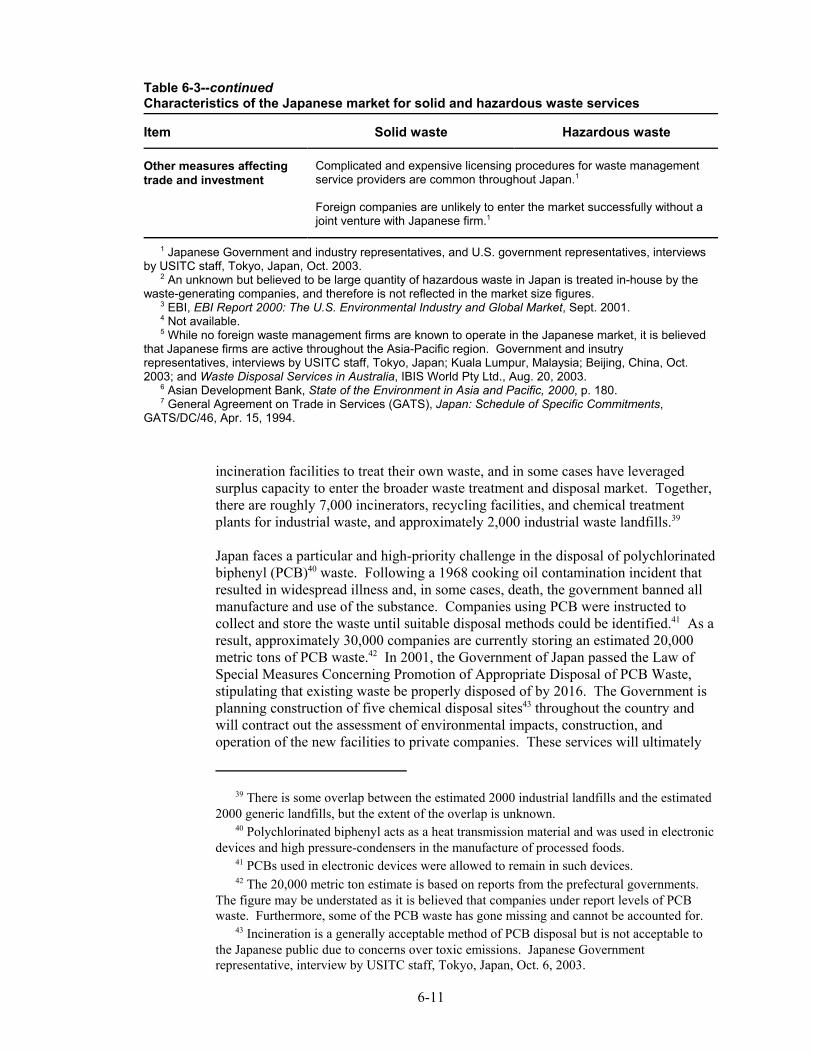
39 There is some overlap between the estimated 2000 industrial landfills and the estimated2000 generic landfills, but the extent of the overlap is unknown. 40 Polychlorinated biphenyl acts as a heat transmission material and was used in electronicdevices and high pressure-condensers in the manufacture of processed foods. 41 PCBs used in electronic devices were allowed to remain in such devices. 42 The 20,000 metric ton estimate is based on reports from the prefectural governments. The figure may be understated as it is believed that companies under report levels of PCBwaste. Furthermore, some of the PCB waste has gone missing and cannot be accounted for. 43 Incineration is a generally acceptable method of PCB disposal but is not acceptable tothe Japanese public due to concerns over toxic emissions. Japanese Governmentrepresentative, interview by USITC staff, Tokyo, Japan, Oct. 6, 2003.
6-11
Table 6-3--continuedCharacteristics of the Japanese market for solid and hazardous waste services
Item Solid waste Hazardous waste
Other measures affectingtrade and investment
Complicated and expensive licensing procedures for waste managementservice providers are common throughout Japan.1
Foreign companies are unlikely to enter the market successfully without ajoint venture with Japanese firm.1
1 Japanese Government and industry representatives, and U.S. government representatives, interviewsby USITC staff, Tokyo, Japan, Oct. 2003. 2 An unknown but believed to be large quantity of hazardous waste in Japan is treated in-house by thewaste-generating companies, and therefore is not reflected in the market size figures. 3 EBI, EBI Report 2000: The U.S. Environmental Industry and Global Market, Sept. 2001. 4 Not available. 5 While no foreign waste management firms are known to operate in the Japanese market, it is believedthat Japanese firms are active throughout the Asia-Pacific region. Government and insutryrepresentatives, interviews by USITC staff, Tokyo, Japan; Kuala Lumpur, Malaysia; Beijing, China, Oct.2003; and Waste Disposal Services in Australia, IBIS World Pty Ltd., Aug. 20, 2003. 6 Asian Development Bank, State of the Environment in Asia and Pacific, 2000, p. 180. 7 General Agreement on Trade in Services (GATS), Japan: Schedule of Specific Commitments,GATS/DC/46, Apr. 15, 1994.
incineration facilities to treat their own waste, and in some cases have leveragedsurplus capacity to enter the broader waste treatment and disposal market. Together,there are roughly 7,000 incinerators, recycling facilities, and chemical treatmentplants for industrial waste, and approximately 2,000 industrial waste landfills.39
Japan faces a particular and high-priority challenge in the disposal of polychlorinatedbiphenyl (PCB)40 waste. Following a 1968 cooking oil contamination incident thatresulted in widespread illness and, in some cases, death, the government banned allmanufacture and use of the substance. Companies using PCB were instructed tocollect and store the waste until suitable disposal methods could be identified.41 As aresult, approximately 30,000 companies are currently storing an estimated 20,000metric tons of PCB waste.42 In 2001, the Government of Japan passed the Law ofSpecial Measures Concerning Promotion of Appropriate Disposal of PCB Waste,stipulating that existing waste be properly disposed of by 2016. The Government isplanning construction of five chemical disposal sites43 throughout the country andwill contract out the assessment of environmental impacts, construction, andoperation of the new facilities to private companies. These services will ultimately
44 Two other significant bidders on the project were Tokyo Electric, which teamed withMitsui, and Konsai Electric, the first and second largest electric companies in Japan,respectively. Electric companies are some of the biggest generators of PCB waste. U.S.Government representative, interview by USITC staff, Tokyo, Japan, Oct. 6, 2003. 45 Japanese Government representative, interview by USITC staff, Tokyo, Japan, Oct. 6,2003. 46 U.S. Government representative, interview by USITC staff, Tokyo, Japan, Oct. 6, 2003. 47 Recycle Oriented Society: Toward Sustainable Development. Clean Japan Center. 48 According to a U.S. government official, services trade data is not readily available inJapan because most such business is done via joint venture where a contract is awarded to theJapanese partner and then a private deal is made for payment to the foreign partner.
6-12
be funded by disposal fees. While the government has not disclosed the estimatedcost of the entire project, it reportedly has awarded $260 million to Mitsubishi HeavyIndustries to construct the Tokyo facility.44 Japan has no regulations mandating thatthe facilities be built or operated by domestic firms.45 However, all prospectivebidders must construct a demonstration plant, at an estimated cost of $1 million, inorder to obtain approval from the Ministry of the Environment to enter a bid.46
Recycling in Japan is typically carried out by private companies without the benefitof government subsidies, except on an ad hoc basis. These companies generateearnings through recycling fees and resale of materials. Some Japanesemanufacturers are devising innovative applications for recycled materials, such assubstituting recycled plastics for coke in blast furnaces in steel mills. This practiceyields both economic and environmental benefits as the plastics emit fewer dioxinsthan coke when burned, recycled plastic is cheaper than coke, and steel companiescan receive compensation for removing the “waste” from municipalities.
Japan’s large solid and hazardous waste market is a product of that country’ssubstantial environmental regulations. Japan’s Basic Law on the Environment (1993)encourages environmental protection and sustainable development through numerousregulations that legislate, inter alia, waste disposal and recycling.47 Waste disposal isprimarily governed by the Law Concerning Disposal and Cleanup of DisposedWaste, which dictates a standard waste disposal plan. However, it is theresponsibility of individual prefectures to tailor the plan to accommodate local needs. Recycling is governed by the Ministry of Economy, Trade and Industry (METI). International treaties affecting waste management to which Japan is a signatoryinclude the Persistent Organic Pollutants Convention (POP Convention) and theBasel Convention.
Trade and Investment
Japanese Government sources report that data reflecting trade in solid and hazardouswaste services are not available.48 However, anecdotal information suggests thatJapan is an aggressive exporter of environmental services in general, and Japanesefirms are active in the design and construction of waste management facilitiesthroughout the Asia-Pacific region. It is reported that only domestic companiesprovide solid and hazardous waste management services in Japan, principallybecause it is not a highly profitable industry and it is difficult to obtain wastemanagement licenses from local governments due to complex technical
49 Japanese Government representative, interview by Commission staff, Tokyo, Japan,Oct. 7, 2003. 50 Ibid. 51 EBI, data from the Environmental Markets in the Asia-Pacific, 1995-2000 spreadsheet. 52 Industry representative, interview by USITC staff, Kuala Lumpur, Malaysia, Oct. 10,2003. 53 State of the Environment in Asia and the Pacific 2000, Economic and Social Divisionfor Asia and the Pacific, Asian Development Bank. 54 Malaysia has two classifications of waste: solid waste, which includes municipal andindustrial, and scheduled waste, which encompasses 107 types of hazardous waste. Small andmedium enterprises are more likely to under-report their waste and/or dispose of it illegally. Malaysian Government representative, interview by USITC staff, Kuala Lumpur, Malaysia,Oct. 10, 2003. 55 Environmental Quality Report 2001, Malaysian Ministry of the Environment.
6-13
requirements.49 Domestic and foreign contractors are required to register withmunicipalities in order to be eligible to operate.
Japan’s current GATS commitments grant full market access and national treatmentfor the foreign provision of refuse disposal services, with the exception of somelimitations regarding the disposal of waste oil at sea. However, according to aJapanese government official, joint ventures are widely viewed as the only way forforeign companies to enter the market, and there are currently no such businessarrangements in Japan’s solid and hazardous waste management industry.50
Malaysia
Market Overview
The environmental goods and services market in Malaysia – which includes the solidand hazardous waste services segment – has grown rapidly in recent years, totaling$840 million in 2002, a 40-percent increase over 1995 levels.51 The Malaysianenvironmental services market experienced a temporary downturn because of theAsian financial crisis. However, the Malaysian experience was comparatively lesssevere than that of some of its neighbors, and the environmental market reboundedafter a one-year decline in 1998. Malaysia generates an estimated 5.5 million metrictons52 of municipal and industrial solid waste per year, of which an estimated 45percent is managed (table 6-4).53 The country generated 363 thousand metric tons54
of hazardous waste in 2002, of which 90-95 percent was reportedly managed.55
The Malaysian Government has aggressively pursued privatization of infrastructurein the past decade to include the waste management industry. In 1995, theGovernment awarded a 15-year exclusive contract for the management of all ofpeninsular Malaysia’s hazardous waste to a single firm, Kualiti Alam. TheMalaysian company receives its revenue from waste collection and disposal fees paiddirectly by the companies that generate waste. Because Malaysian companies are
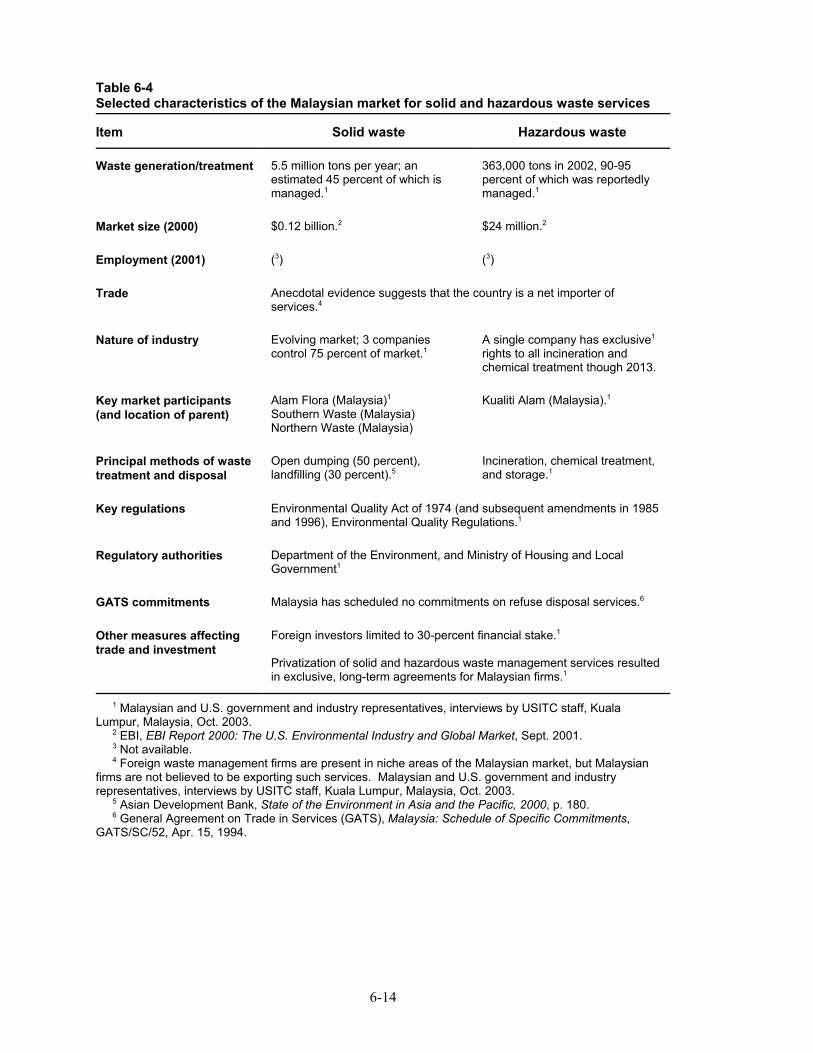
6-14
Table 6-4Selected characteristics of the Malaysian market for solid and hazardous waste services
Item Solid waste Hazardous waste
Waste generation/treatment 5.5 million tons per year; anestimated 45 percent of which ismanaged.1
363,000 tons in 2002, 90-95percent of which was reportedlymanaged.1
Market size (2000) $0.12 billion.2 $24 million.2
Employment (2001) (3) (3)
Trade Anecdotal evidence suggests that the country is a net importer ofservices.4
Nature of industry Evolving market; 3 companiescontrol 75 percent of market.1
A single company has exclusive1
rights to all incineration andchemical treatment though 2013.
Key market participants(and location of parent)
Alam Flora (Malaysia)1
Southern Waste (Malaysia)Northern Waste (Malaysia)
Kualiti Alam (Malaysia).1
Principal methods of wastetreatment and disposal
Open dumping (50 percent),landfilling (30 percent).5
Incineration, chemical treatment,and storage.1
Key regulations Environmental Quality Act of 1974 (and subsequent amendments in 1985and 1996), Environmental Quality Regulations.1
Regulatory authorities Department of the Environment, and Ministry of Housing and LocalGovernment1
GATS commitments Malaysia has scheduled no commitments on refuse disposal services.6
Other measures affectingtrade and investment
Foreign investors limited to 30-percent financial stake.1
Privatization of solid and hazardous waste management services resultedin exclusive, long-term agreements for Malaysian firms.1
1 Malaysian and U.S. government and industry representatives, interviews by USITC staff, KualaLumpur, Malaysia, Oct. 2003. 2 EBI, EBI Report 2000: The U.S. Environmental Industry and Global Market, Sept. 2001. 3 Not available. 4 Foreign waste management firms are present in niche areas of the Malaysian market, but Malaysianfirms are not believed to be exporting such services. Malaysian and U.S. government and industryrepresentatives, interviews by USITC staff, Kuala Lumpur, Malaysia, Oct. 2003. 5 Asian Development Bank, State of the Environment in Asia and the Pacific, 2000, p. 180. 6 General Agreement on Trade in Services (GATS), Malaysia: Schedule of Specific Commitments,GATS/SC/52, Apr. 15, 1994.
56 Industry representative, interview by USITC staff, Kuala Lumpur, Malaysia, Oct. 13,2003. 57 American Chamber of Commerce member companies contend that Kualiti Alam’sservices are limited, costs are rising each year, and they sometimes have to store or exportwaste because Kualiti Alam cannot handle it in a timely manner. Industry representative,interview by USITC staff, Kuala Lumpur, Malaysia, Oct. 10, 2003. 58 Industry representative, interview by USITC staff, Kuala Lumpur, Malaysia, Oct. 13,2003. 59 It is believed that the law will be signed in early 2004. 60 Southern Waste won the contract that covers Jahor state. 61 Industry representative, interview by USITC staff, Kuala Lumpur, Malaysia, Oct. 10,2003. 62 Percentage based on estimates of waste generation by Malaysian industry source.
6-15
legally obligated to obtain treatment for their hazardous waste, Kualiti Alam isassured steady revenue until its contract expires in 2013. Kualiti Alam employsmultiple hazardous waste treatment techniques, although incineration and chemicaltreatment are the most prevalent. While other modes of treatment operate atapproximately 40-50 percent56 of capacity, Kualiti Alam’s incinerator is stressed tofull capacity and the company is forced to refuse waste, and thus, some companies are storing their waste until Kualiti Alam can accept it.57 In response, Kualiti Alam isactively pursuing the addition of plasma technology to its portfolio of treatmentoptions. Kualiti Alam views oil waste, sludge, and other hazardous waste recyclingcompanies as its greatest competition. As a result, Kualiti Alam offers manufacturerscompetitive pricing to match what they would receive from recyclers or what theywould save by implementing waste-reducing technologies.58
The management of solid waste is also undergoing privatization, though the processis not yet complete. Treatment of solid waste in Malaysia, which is regulated by theMinistry of Housing and Local Government, is much less sophisticated than that ofhazardous waste, with most solid waste destined for open dumps. However, as theprivatization of the sector advances, more modern methods of handling and treatmentare emerging. In 1994, the Malaysian Government identified four domesticcompanies, which would each be given 20-year concessions to collect, store, anddispose of solid waste in one of the four geographic areas devised under the plan, butthe Government will not sign the concessions until the central government passes abill, which transfers authority over solid waste management from local governmentsto the central government.59 As such, two of the selected companies never fullybegan work, while two others – Alam Flora and Southern Waste60 – proceeded attheir own risk.61
Alam Flora was awarded the lucrative Pahang and Selang regions that include KualaLumpur and account for an estimated 54 percent of generated waste.62 Alam Floracurrently manages approximately 6,000 metric tons of waste per day, much of whichgoes into properly engineered landfills. The company is paid by the 24 municipalgovernments that it serves, a system that the company favors as it is believed that
63 There is unfavorable public sentiment associated with privatization due to a failed effortwith sewage privatization. In that case the company awarded the project began chargingsewage fees to the public and then did not follow through with the project. 64 Industry representative, interview by USITC staff, Kuala Lumpur, Malaysia, Oct. 10,2003. 65 The Government of Malaysia has instituted and promoted recycling programs, butindustry sources believe that efforts to date fall short of what is needed to generate widespreadparticipation. Industry representative, interview by USITC staff, Kuala Lumpur, Malaysia,Oct. 10, 2003. 66 Industry representative, interview by USITC staff, Kuala Lumpur, Malaysia, Oct. 10,2003. 67 Ibid. 68 Design and construction of waste treatment facilities by foreign firms, especiallyJapanese, is prevalent, but operation of such facilities by foreign firms is not.
6-16
direct billing would not be well received by residents.63 As the company’s operationsmature, it plans to build incinerators and more economical and environmentallysound landfills. Alam Flora predicts that in the next 20 years all local landfills willbe capped and the country will rely on two super-landfills, likely abandoned tinmines, and two high-volume incinerators. These projects are not currently viabledue, in part, to the fact that the trash volume generated in Malaysia is not highenough to justify the rail costs.64
Few companies provide recycling services in Malaysia as this industry segment is notbelieved to be lucrative due to a lack of participation by the public. Industry sourcesbelieve that more effective and consistent public awareness campaigns are needed tomotivate the population to recycle waste products.65 Currently there are no recyclinglaws in Malaysia, though the Government set a 3-percent recycling goal in 2003,which the country has reportedly met.66 The Government intends to increase thisrecycling goal by one percent per annum until it reaches 22 percent in 2023. According to a Malaysian industry source, the country will have difficultyestablishing a recycling industry because it is not poor enough to have an effectiveinformal recycling sector, but it is not yet developed enough to have a modern,efficient recycling system.67
Trade and Investment
Trade and investment in solid and hazardous waste management services in Malaysiais believed to be minimal owing to the monopolistic structure of both industrysegments.68 As monopoly contracts are phased out, opportunities may arise forforeign firms to enter the market. However, current regulations state that foreigninvestment in waste management firms is limited to a 30-percent equity stake. Despite the fairly closed market, a handful of foreign companies have found marketopportunities. For example, World Resources Company, which is U.S.-based, isactive in reclamation of precious metals from industrial waste. While the companyactually exports the waste to the United States before treating and recycling the
69 WRC recovers silver, copper, nickel, and gold from wastewater sludge (N151 – metalhydroxide sludge) from electronics manufacturers. However, it noted that its business isdeclining as many electronics companies are moving to China and/or becoming moretechnologically efficient, thereby reducing mineral waste. In 2000, the company exported2,000 metric tons of sludge, but exported only 300 metric tons during Jan.-Oct. 2003. 70 General Agreement on Trade in Services (GATS), Malaysia: Schedule of SpecificCommitments, GATS/SC/52, Apr.15, 1994. 71 Japanese Government representative, interview by USITC staff, Tokyo, Japan, Oct. 7,2003.
6-17
metals, it provides collection and transportation services in Malaysia.69 TheGovernment of Malaysia has not made any specific GATS commitments on refusedisposal services.70
Future ProspectsAs developing countries in the Asia-Pacific region continue to strengthen and enforceenvironmental regulations, the demand for proven, cost-effective treatment methodsis likely to increase. Japanese companies that have already invested in constructionof waste management infrastructure, feasibility studies, environmental impactassessments, etc., will likely be in a favorable position to seize upon emerging marketopportunities in those countries.
In Japan, demand for environmental services will likely grow, especially as publicawareness of environmental issues increases. While there is not currently anynotable competition within the domestic waste management market, owing to thepropensity toward long-term contracts with established companies, industrial wastemanagement is becoming more competitive as new technologies emerge.71 Marketsegments that may experience particularly rapid growth in the future includeenvironmental management consulting and pesticide disposal.

1 Established markets for solid and hazardous waste become saturated as industries areincreasingly able to employ advanced technologies to effectively control the disposal ofwaste, reduce waste output, and transfer waste into a usable commodity. To some extent,developing waste management markets such as those of Chile, Egypt, and South Africa maybenefit from already developed and proven technology used by the more established wastemanagement countries. 2 Environmental Business International, Inc. (EBI), EBI Report 2000, The U.S.Environmental Industry and Global Market, Sept. 2001, pp. 18-6 to 18-7; and industryrepresentative, interview by USITC staff, Washington, DC, Nov. 12, 2003.
7-1
CHAPTER 7OTHER DEVELOPING-COUNTRYMARKETSIntroduction
Although solid and hazardous waste management is in a very early stage ofdevelopment in Chile, Egypt, and South Africa, these three countries are among themore advanced within their respective regions in terms of identifying and addressingsolid and hazardous waste management problems relative to their current structuraland resource constraints. Apparent among these three countries is a growingrecognition at the national level that there is a critical link between sustainedeconomic development and an effective and comprehensive environmental programthat includes solid and hazardous waste management. Accordingly, each governmenthas recently been making a concerted effort to move its country toward the mostefficient solid and hazardous waste management program that can be achieved withavailable resources. Although these emerging waste management markets arecomparatively small, they have the potential of developing into significant tradeopportunities in the future as more established country-markets achieve saturation1
and decline in activity.2 This will likely be a long-term endeavor because Chile,Egypt, and South Africa are still in the process of developing regulations andstandards relating to the proper management of their waste streams.
This chapter includes a brief overview of solid and hazardous waste services marketsin Africa, Latin America, and the Middle East, followed by separate discussions onmarket conditions, trade, and investment in the solid and hazardous waste servicesindustries of Chile, Egypt, and South Africa.
Regional Market OverviewSolid and hazardous waste services markets in Africa, Latin America, and the MiddleEast are relatively small, as countries in these regions often have limited financial orregulatory capacity to address environmental concerns. In 2000, solid wastemanagement markets in Latin America, the Middle East, and Africa were valued at$1.6 billion, $1.0 billion, and $442 million, respectively, while hazardous waste
3 EBI, The Global Environmental Market by Region, 2000, attachment to an e-mailmessage, received July 31, 2003. 4 United Nations Environment Programme, Secretariat of the Basel Convention, “List ofParties to the Basel Convention,” found at Internet addresshttp://www.basel.int/ratif/ratif.html, retrieved Dec. 9, 2003. 5 U.S. Department of Commerce (USDOC), U.S. Foreign and Commercial Service(US&FCS), Research Reports, Chile, Environmental Technologies - Solid Waste, by IsabelValenzuela, Oct. 13, 2001, p. 2, found at Internet addresshttp://www.s...penDocument&sessID=A07A043F2913979/, retrieved Apr. 29, 2003. 6 Ibid. 7 Includes copper, iron ore, nitrates, precious metal, and molybdenum mining. 8 Includes waste generated by the metal manufacturing, chemicals, paper, and textilesindustries. 9 Allen Blakey, “The Locals Rule South of the Border,” International Waste, 1999, p. 78. 10 USDOC, Chile - Solid Waste Management - Summary - ISA 990901, 1999, p. 5.
7-2
management markets in these regions were valued at $239 million, $274 million, and$32 million, respectively. Together, these three regions account for less than 3percent of the global market for solid and hazardous waste management services.3 Existing environmental regulations in these regions typically address water and/or airpollution, but do not often address solid or hazardous waste. However, Chile, Egypt,South Africa, and a number of other countries in these regions are parties to the BaselConvention– an international environmental accord concerning the transboundarymovement and management of hazardous waste.4
Chile
Market Overview
Data on the size of Chile’s solid and hazardous waste services market is notavailable. However, industry sources have estimated that waste generation in Chiletotaled over 1.8 billion metric tons in 200l,5 34 percent of which was thought tocomprise hazardous waste (table 7-1).6 The mining industry7 generates the vastmajority of waste in Chile, with an estimated 1.8 billion metric tons. Municipalwaste was thought to account for 3.3 million metric tons of waste, industrial waste8
for 2.5 million metric tons, construction waste for 3.5 million metric tons, andmedical waste for 29,000 metric tons. Based on the anecdotal evidence outlinedbelow, it is believed that very little of the solid and hazardous waste generated inChile is handled and disposed of in a controlled manner.
Controlled municipal waste is collected, transported, and disposed of by bothmunicipalities and private companies. Most controlled municipal waste in Chile isdisposed of in landfills, 75 percent of which are operated by private companies.9 However, many landfills are reported to be poorly constructed, resulting inenvironmental contamination. There are three sanitary landfills in Chile: two in theSantiago Metropolitan Region and one in the city of Rancagua, located 50 milessouth of Santiago.10 In the Santiago Metropolitan Region, two companies—Empresa
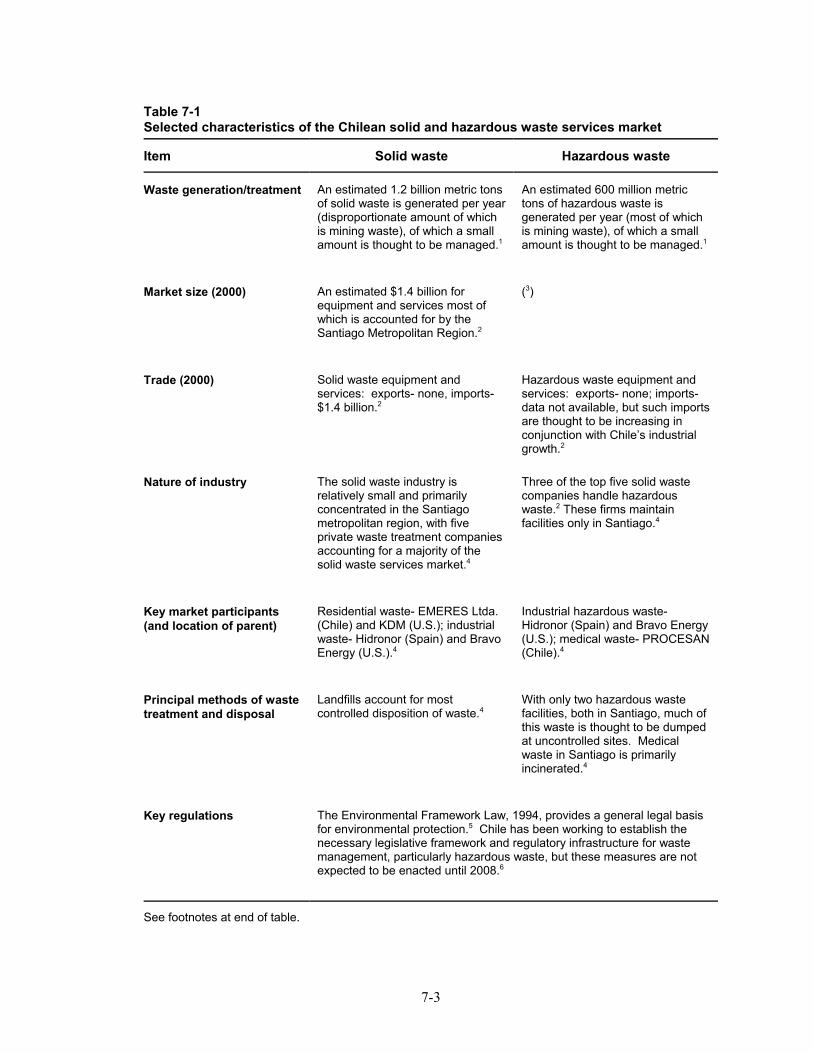
7-3
Table 7-1Selected characteristics of the Chilean solid and hazardous waste services market
Item Solid waste Hazardous waste
Waste generation/treatment An estimated 1.2 billion metric tonsof solid waste is generated per year(disproportionate amount of whichis mining waste), of which a smallamount is thought to be managed.1
An estimated 600 million metrictons of hazardous waste isgenerated per year (most of whichis mining waste), of which a smallamount is thought to be managed.1
Market size (2000) An estimated $1.4 billion forequipment and services most ofwhich is accounted for by theSantiago Metropolitan Region.2
(3)
Trade (2000) Solid waste equipment andservices: exports- none, imports-$1.4 billion.2
Hazardous waste equipment andservices: exports- none; imports-data not available, but such importsare thought to be increasing inconjunction with Chile’s industrialgrowth.2
Nature of industry The solid waste industry isrelatively small and primarilyconcentrated in the Santiagometropolitan region, with fiveprivate waste treatment companiesaccounting for a majority of thesolid waste services market.4
Three of the top five solid wastecompanies handle hazardouswaste.2 These firms maintainfacilities only in Santiago.4
Key market participants(and location of parent)
Residential waste- EMERES Ltda.(Chile) and KDM (U.S.); industrialwaste- Hidronor (Spain) and BravoEnergy (U.S.).4
Industrial hazardous waste-Hidronor (Spain) and Bravo Energy(U.S.); medical waste- PROCESAN(Chile).4
Principal methods of wastetreatment and disposal
Landfills account for mostcontrolled disposition of waste.4
With only two hazardous wastefacilities, both in Santiago, much ofthis waste is thought to be dumpedat uncontrolled sites. Medicalwaste in Santiago is primarilyincinerated.4
Key regulations The Environmental Framework Law, 1994, provides a general legal basisfor environmental protection.5 Chile has been working to establish thenecessary legislative framework and regulatory infrastructure for wastemanagement, particularly hazardous waste, but these measures are notexpected to be enacted until 2008.6
See footnotes at end of table.
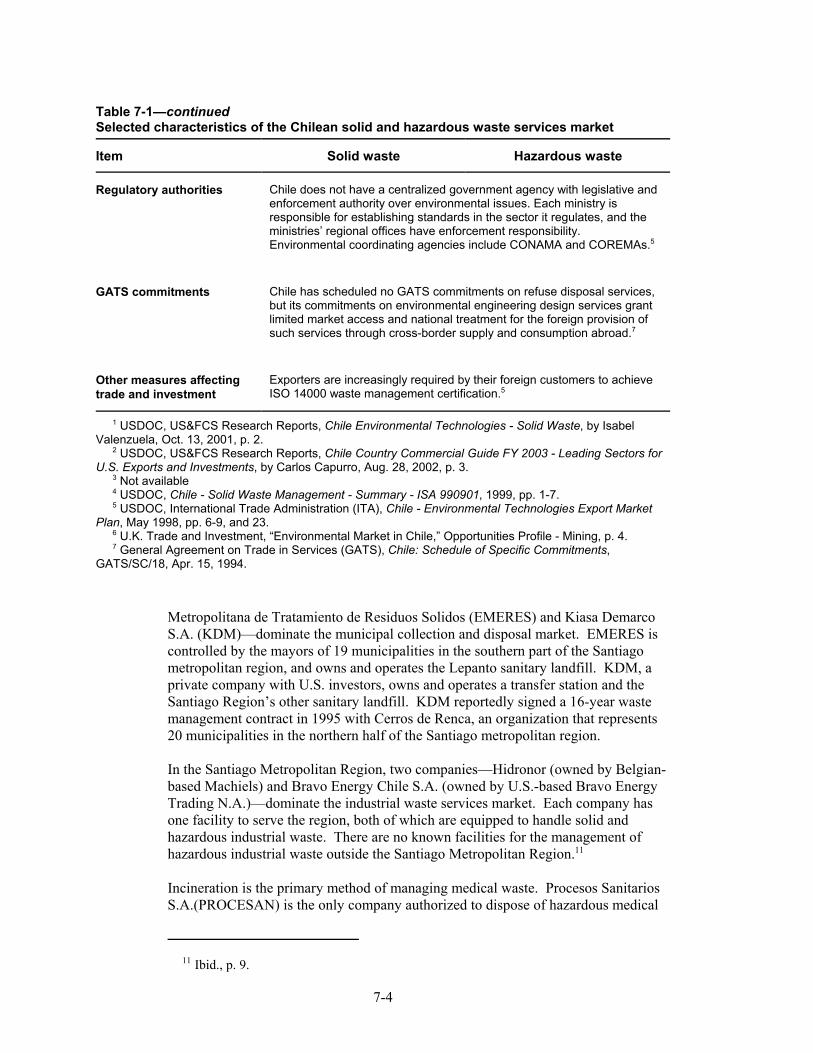
11 Ibid., p. 9.
7-4
Table 7-1—continuedSelected characteristics of the Chilean solid and hazardous waste services market
Item Solid waste Hazardous waste
Regulatory authorities Chile does not have a centralized government agency with legislative andenforcement authority over environmental issues. Each ministry isresponsible for establishing standards in the sector it regulates, and theministries’ regional offices have enforcement responsibility. Environmental coordinating agencies include CONAMA and COREMAs.5
GATS commitments Chile has scheduled no GATS commitments on refuse disposal services,but its commitments on environmental engineering design services grantlimited market access and national treatment for the foreign provision ofsuch services through cross-border supply and consumption abroad.7
Other measures affectingtrade and investment
Exporters are increasingly required by their foreign customers to achieveISO 14000 waste management certification.5
1 USDOC, US&FCS Research Reports, Chile Environmental Technologies - Solid Waste, by IsabelValenzuela, Oct. 13, 2001, p. 2. 2 USDOC, US&FCS Research Reports, Chile Country Commercial Guide FY 2003 - Leading Sectors forU.S. Exports and Investments, by Carlos Capurro, Aug. 28, 2002, p. 3. 3 Not available 4 USDOC, Chile - Solid Waste Management - Summary - ISA 990901, 1999, pp. 1-7. 5 USDOC, International Trade Administration (ITA), Chile - Environmental Technologies Export MarketPlan, May 1998, pp. 6-9, and 23. 6 U.K. Trade and Investment, “Environmental Market in Chile,” Opportunities Profile - Mining, p. 4. 7 General Agreement on Trade in Services (GATS), Chile: Schedule of Specific Commitments,GATS/SC/18, Apr. 15, 1994.
Metropolitana de Tratamiento de Residuos Solidos (EMERES) and Kiasa DemarcoS.A. (KDM)—dominate the municipal collection and disposal market. EMERES iscontrolled by the mayors of 19 municipalities in the southern part of the Santiagometropolitan region, and owns and operates the Lepanto sanitary landfill. KDM, aprivate company with U.S. investors, owns and operates a transfer station and theSantiago Region’s other sanitary landfill. KDM reportedly signed a 16-year wastemanagement contract in 1995 with Cerros de Renca, an organization that represents20 municipalities in the northern half of the Santiago metropolitan region.
In the Santiago Metropolitan Region, two companies—Hidronor (owned by Belgian-based Machiels) and Bravo Energy Chile S.A. (owned by U.S.-based Bravo EnergyTrading N.A.)—dominate the industrial waste services market. Each company hasone facility to serve the region, both of which are equipped to handle solid andhazardous industrial waste. There are no known facilities for the management ofhazardous industrial waste outside the Santiago Metropolitan Region.11
Incineration is the primary method of managing medical waste. Procesos SanitariosS.A.(PROCESAN) is the only company authorized to dispose of hazardous medical
12 USDOC, Chile - Solid Waste Management - Summary - ISA 990901, 1999, p. 9. 13 Ibid., p. 8. 14 USDOC, International Trade Administration, Chile - Environmental TechnologiesExport Market Plan, May 1998, p. 6. 15 USDOC, US&FCS Research Reports, Chile, Environmental Technologies - Solid Waste,pp. 2-4. 16 U.K. Trade and Investment, “Environment Market in Chile,” Crown copyright date 2003,found at Internet addresshttp://www.tradepartners.gov.uk/environment/chle/opportunities.shtml, retrieved Nov. 20,2003.
7-5
waste in Chile. However, the firm’s only facility, which is located in the SantiagoMetropolitan Region, manages only about five percent of all hazardous medicalwaste generated in Chile.12
Although recycling is not practiced on a large-scale basis, there is some formal andinformal recycling of aluminum, cardboard boxes, paper, and glass in Chile. Individuals collect small volumes of recyclable materials from homes and businessesand sell these items to small intermediary companies who, in turn, sell them tocompanies that recover the materials. Some industries sell recyclable materialdirectly to intermediaries or to paper and glass producing companies that userecovered materials as production inputs. However, recycled material is often moreexpensive than virgin material,13 reducing the demand for recycled material andassociated services.
Chile’s efforts to manage its solid and hazardous waste stream may be constrained bya lack of national standards and regulations that specifically address the collection,transportation, and disposal of such waste. Chile’s environmental regulatory systemis shaped primarily by its “Environmental Framework Law,” which was enacted inMarch 1994. This law provides a general legal basis for environmental protection inChile. Key regulatory elements—which apply to solid and hazardous wastemanagement together with all environmental issues— include a process forestablishing environmental standards, economic mechanisms for implementingstandards (e.g., tradeable permits, pollution charges, and user fees), and mandatoryenvironmental impact assessments for all major projects or activities.14
Much of the country’s industrial waste is dumped in uncontrolled areas, as manywaste generators simply pay a nominal fee to independent garbage collectors to haulit away. Chile’s Association of Professionals for the Environment estimated thatonly 10 percent of the country’s construction solid waste and 40 percent of itsindustrial solid waste are handled in a controlled manner.15 Only Santiago hasestablished a cradle-to-grave manifest system to track industrial hazardous waste. Although the Government of Chile has been working to establish a legislatedstandard and regulatory package that specifically addresses the collection,transportation, and disposal of solid waste, medical waste, and industrial hazardouswaste at the national level, business concerns and a lack of resources have stalled theeffort. The Chilean Government estimates that it could take another five years toestablish a national regulatory structure for industrial solid and hazardous wastemanagement.16 Chile also has not established national regulations regarding themanagement of solid and hazardous mining waste. However, starting around 1998,government agencies and mining companies drafted proposed regulations and
17 U.K. Trade and Investment, “Environment Market in Chile.” 18 USDOC, International Trade Administration, Chile - environmental Technologies ExportMarket Plan, pp. 6-9. 19 USDOC, US&FCS Research Reports, Solid Waste Management, by Isabel Valenzuela,Oct. 1, 2002, p. 2, found at Internet addresshttp://www.s...penDocument&sessID=90BB044D2903021/, retrieved Apr. 29, 2003. 20 The ISO series was developed to provide businesses with a structure for managingenvironmental impacts, and confers a “stamp of approval” on a company’s environmentalpractices. 21 USDOC, International Trade Administration, Chile - Environmental TechnologiesExport Market Plan, p. 24.
7-6
voluntary “good practice” standards for adoption by Chile’s mining industry. Thesemeasures, which are designed to safeguard the environment in mining areas, aregenerally enforced by waste generators themselves.17
There is no central government agency with legislative and enforcement authorityover environmental issues in Chile. Under the auspices of the EnvironmentalFramework Law, the National Environmental Commission (CONAMA) wasestablished to coordinate the country’s environmental policies. CONAMA’s Councilof Directors is composed of the General Secretary of the Presidency and the heads ofeach of the government’s 11 ministries, including the Ministries of Health, PublicWorks, Mining, and Agriculture. In addition to this national coordinating agency,there are similar agencies for each of Chile’s 12 regions called the RegionalEnvironmental Commissions (COREMA). Each COREMA includes the regionalgovernor and the regional representative of each of the 11 ministries. To ensurecoordination of national and regional policies, the director of each COREMA alsoserves on the executive unit of CONAMA. However, neither CONAMA nor theCOREMAs have the authority to enforce environmental regulations. Instead,CONAMA can suggest that a ministry take a particular course of action to correct aproblem within its specific jurisdiction. Likewise, the COREMAs rely on theregional ministries to handle the enforcement of regulations.18
In addition to the regulatory environment, factors affecting the demand for solidwaste management services in Chile include economic growth, increased industrialproduction, and rising consumption in the 1990s. Taken together, these factorsresulted in a rapid increase in the generation of solid and hazardous waste. Otherfactors that have produced some measure of demand for solid and hazardous wastemanagement services include the implementation of environmental educationprograms that have raised environmental consciousness, particularly among theuniversity population,19 and the development of international trade relationships. Thelatter is particularly important, as businesses interested in exporting are increasinglyrequired by potential international trade partners to adopt and become certified ininternational environmental management standards such as the InternationalStandardization Organization’s (ISO’s) 14000 series.20 Such requirements mayincrease demand for environmental services—including solid and hazardous wasteservices—among Chilean exporters.21
22 Ibid., pp. 20-23. 23 General Agreement on Trade in Services (GATS), Chile: Schedule of SpecificCommitments, GATS/SC/18, Apr. 15, 1994. 24 U.S. Trade Representative, 2003 National Trade Estimate Report on Foreign TradeBarriers, pp. 43-45. 25 USDOC, International Trade Administration, Egypt - Environmental TechnologiesExport Market Plan, Feb. 1999, pp. 21-22. 26 USDOC, US&FCS Market Research Reports, Egypt - Environmental Equipment andServices, by Heba Abdel Aziz, June 8, 2003, pp. 4-5, found at Internet addresshttp://www.stat-usa.gov/mrd.nsf/vwISA_Country/016F8FEED4C3B/, retrieved Aug. 26, 2003.
7-7
Trade and Investment
Although data on trade and investment in the Chilean waste management market donot exist, it is likely that Chile imports some solid and hazardous waste servicesthrough the foreign-owned waste management affiliates that have established apresence in the Chilean market. Foreign investment in Chilean waste managementfacilities includes Belgium-based Hidronor’s $25 million industrial and hazardouswaste plant,22 and a similar facility owned by U.S.-based Bravo Energy Trading. Japan established a channel for its companies to actively pursue opportunities in theChilean market by helping to finance a preliminary study on industrial solid waste inthe late 1990s.
Chile has made no commitments on refuse disposal services under GATS, and itscommitments on environmental engineering design services grant limited marketaccess and national treatment for the foreign provision of such services throughcross-border supply and consumption abroad.23 In addition, Chile’s GATS scheduleindicates that authorization of foreign investment in service industries may becontingent on such factors as employment generation and the use of local inputs. Much like the GATS, the U.S.-Chile Free Trade Agreement (FTA) covers both cross-border supply of services and the right to invest and establish a local presence in awide range of service sectors including environmental services, construction, andengineering. The U.S.-Chile FTA will protect all forms of investment and wouldremove certain restrictions on U.S. investors, such as requirements to buy Chileaninputs.24
Egypt
Market Overview
Industry sources estimate that Egypt’s market for municipal and industrial wastemanagement (goods and services) totaled $40 million in 1998, with the hazardouswaste management segment accounting for an estimated $30 million of the total.25 Itwas estimated that 20-30 million metric tons of municipal and industrial solid wasteand 100,000-300,000 metric tons of hazardous waste were generated in 2000 (table7-2).26 Egypt’s primary solid and hazardous waste generating industries include
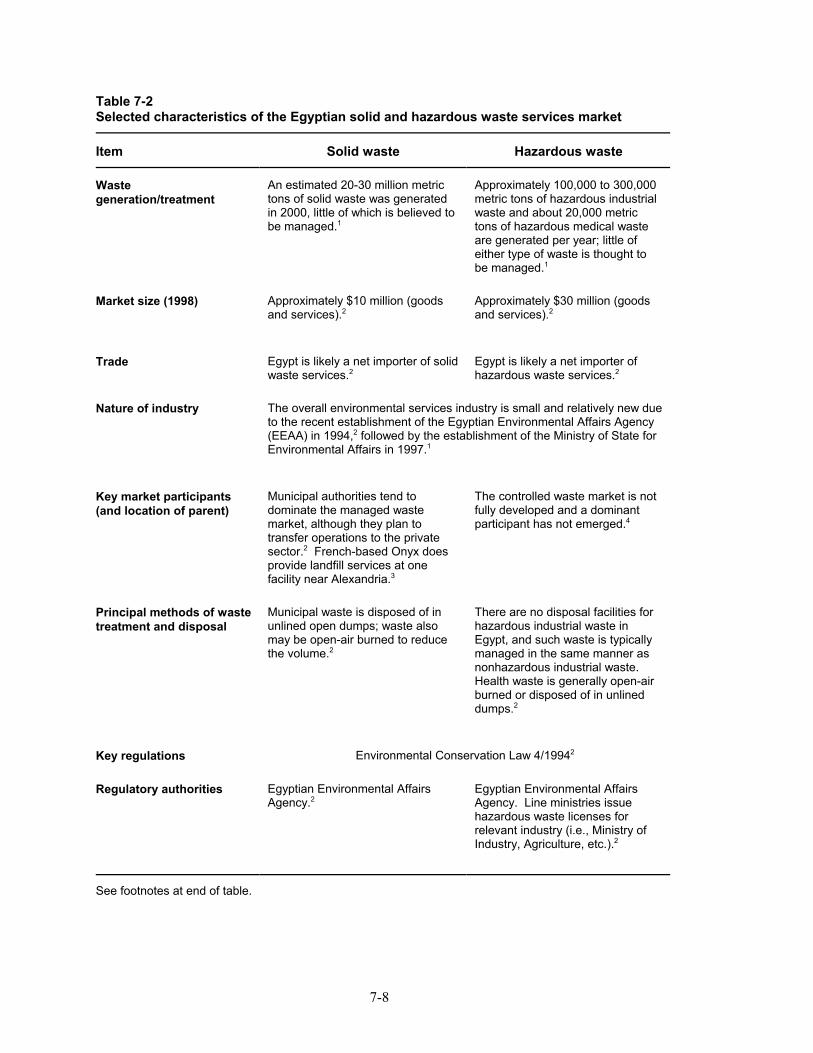
7-8
Table 7-2Selected characteristics of the Egyptian solid and hazardous waste services market
Item Solid waste Hazardous waste
Wastegeneration/treatment
An estimated 20-30 million metrictons of solid waste was generatedin 2000, little of which is believed tobe managed.1
Approximately 100,000 to 300,000metric tons of hazardous industrialwaste and about 20,000 metrictons of hazardous medical wasteare generated per year; little ofeither type of waste is thought tobe managed.1
Market size (1998) Approximately $10 million (goodsand services).2
Approximately $30 million (goodsand services).2
Trade Egypt is likely a net importer of solidwaste services.2
Egypt is likely a net importer ofhazardous waste services.2
Nature of industry The overall environmental services industry is small and relatively new dueto the recent establishment of the Egyptian Environmental Affairs Agency(EEAA) in 1994,2 followed by the establishment of the Ministry of State forEnvironmental Affairs in 1997.1
Key market participants(and location of parent)
Municipal authorities tend todominate the managed wastemarket, although they plan totransfer operations to the privatesector.2 French-based Onyx doesprovide landfill services at onefacility near Alexandria.3
The controlled waste market is notfully developed and a dominantparticipant has not emerged.4
Principal methods of wastetreatment and disposal
Municipal waste is disposed of inunlined open dumps; waste alsomay be open-air burned to reducethe volume.2
There are no disposal facilities forhazardous industrial waste inEgypt, and such waste is typicallymanaged in the same manner asnonhazardous industrial waste. Health waste is generally open-airburned or disposed of in unlineddumps.2
Key regulations Environmental Conservation Law 4/19942
Regulatory authorities Egyptian Environmental AffairsAgency.2
Egyptian Environmental AffairsAgency. Line ministries issuehazardous waste licenses forrelevant industry (i.e., Ministry ofIndustry, Agriculture, etc.).2
See footnotes at end of table.
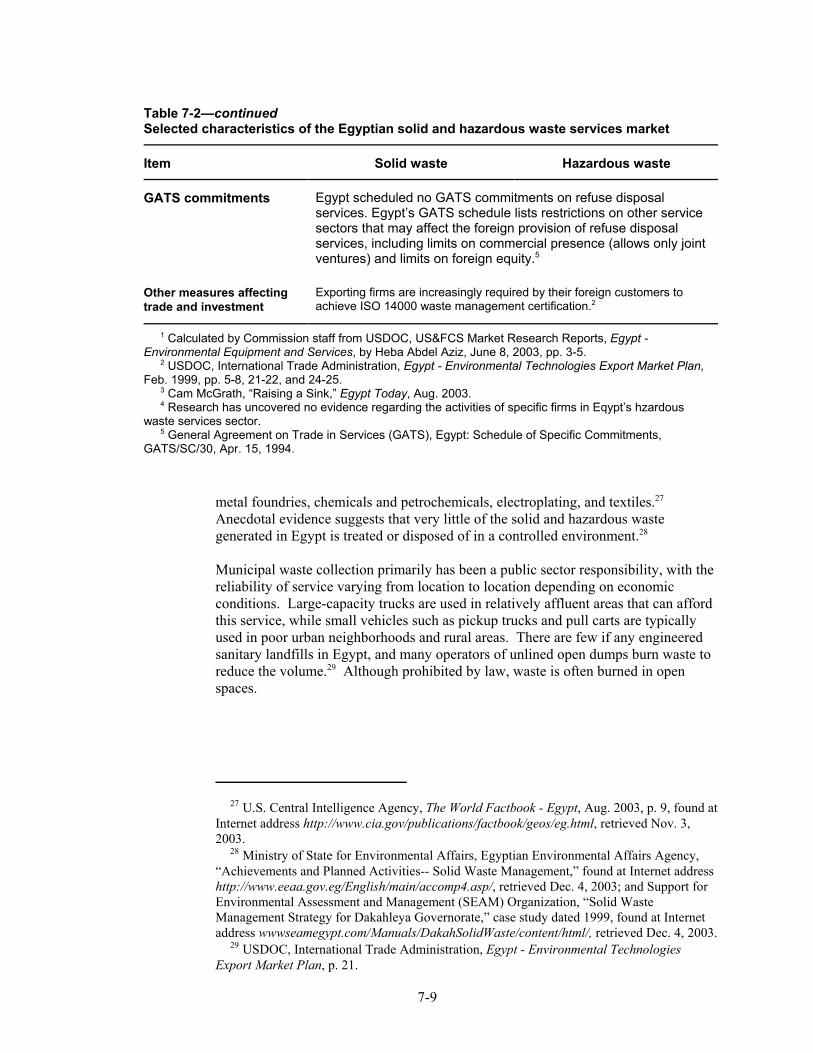
27 U.S. Central Intelligence Agency, The World Factbook - Egypt, Aug. 2003, p. 9, found atInternet address http://www.cia.gov/publications/factbook/geos/eg.html, retrieved Nov. 3,2003. 28 Ministry of State for Environmental Affairs, Egyptian Environmental Affairs Agency,“Achievements and Planned Activities-- Solid Waste Management,” found at Internet addresshttp://www.eeaa.gov.eg/English/main/accomp4.asp/, retrieved Dec. 4, 2003; and Support forEnvironmental Assessment and Management (SEAM) Organization, “Solid WasteManagement Strategy for Dakahleya Governorate,” case study dated 1999, found at Internetaddress wwwseamegypt.com/Manuals/DakahSolidWaste/content/html/, retrieved Dec. 4, 2003. 29 USDOC, International Trade Administration, Egypt - Environmental TechnologiesExport Market Plan, p. 21.
7-9
Table 7-2—continuedSelected characteristics of the Egyptian solid and hazardous waste services market
Item Solid waste Hazardous waste
GATS commitments Egypt scheduled no GATS commitments on refuse disposalservices. Egypt’s GATS schedule lists restrictions on other servicesectors that may affect the foreign provision of refuse disposalservices, including limits on commercial presence (allows only jointventures) and limits on foreign equity.5
Other measures affectingtrade and investment
Exporting firms are increasingly required by their foreign customers toachieve ISO 14000 waste management certification.2
1 Calculated by Commission staff from USDOC, US&FCS Market Research Reports, Egypt -Environmental Equipment and Services, by Heba Abdel Aziz, June 8, 2003, pp. 3-5. 2 USDOC, International Trade Administration, Egypt - Environmental Technologies Export Market Plan,Feb. 1999, pp. 5-8, 21-22, and 24-25. 3 Cam McGrath, “Raising a Sink,” Egypt Today, Aug. 2003. 4 Research has uncovered no evidence regarding the activities of specific firms in Eqypt’s hzardouswaste services sector. 5 General Agreement on Trade in Services (GATS), Egypt: Schedule of Specific Commitments,GATS/SC/30, Apr. 15, 1994.
metal foundries, chemicals and petrochemicals, electroplating, and textiles.27 Anecdotal evidence suggests that very little of the solid and hazardous wastegenerated in Egypt is treated or disposed of in a controlled environment.28
Municipal waste collection primarily has been a public sector responsibility, with thereliability of service varying from location to location depending on economicconditions. Large-capacity trucks are used in relatively affluent areas that can affordthis service, while small vehicles such as pickup trucks and pull carts are typicallyused in poor urban neighborhoods and rural areas. There are few if any engineeredsanitary landfills in Egypt, and many operators of unlined open dumps burn waste toreduce the volume.29 Although prohibited by law, waste is often burned in openspaces.
30 Ibid., p. 22. 31 USDOC, US&FCS Market Research Reports, Egypt - Environmental Equipment andServices, p. 5. 32 Ibid., P. 24. 33 Ibid., p. 5. 34 USDOC, International Trade Administration, Egypt - Environmental TechnologiesExport Market Plan, p. 25. 35 Ibid., pp. 22-23.
7-10
Industrial and hazardous waste collection and disposal are arranged by waste-generating firms. Owing to a lack of hazardous waste management facilities, suchwaste is generally mixed with industrial solid waste and disposed of in open dumps.30 Open burning and dumping are the prevailing methods for disposing of medicalwaste. Estimates suggest that a $350-million investment would be needed toproperly manage hazardous waste produced by Egyptian medical facilities, reducewaste-borne diseases and ailments, and establish a database on the quantity andcomposition of hazardous medical waste generated in Egypt.31
Despite the relatively small size of Egypt’s waste management market, there is a growing push to control its solid and hazardous waste generation as evidenced inrecent regulatory developments. Egypt’s current regulatory framework for solid andhazardous waste management is based on the “Law for the Environment” (Law 4enacted in 1994). This legislation provides for the development of standards,monitoring systems, environmental impact assessments, and enforcementmechanisms with respect to both air pollution and solid and hazardous waste. Thelegislation also prohibits the dumping, treating, or burning of solid waste inunauthorized locations, and established the Egyptian Environmental Affairs Agency(EEAA) as the national implementing authority. However, EEAA shares its wastemanagement responsibilities with as many as 15 sectoral ministries—including theMinistry of Health, Ministry of Industry and Mineral Resources, and Ministry ofHousing, Utilities, and New Communities—which has reportedly made it difficult todevelop and implement a national, integrated solid and hazardous waste managementplan.
Factors that may affect the provision of solid and hazardous waste services in Egyptinclude municipal government plans to transfer management operations to privateenterprises in an effort to improve efficiency,32 and Federal Government plans todevelop waste control programs in cooperation with businesses, nongovernmentorganizations, and consumer groups.33 One incentive spurring demand for solid andhazardous waste management services in Egypt is the growing pressure on exportingbusinesses to adopt and become certified in established environment managementstandards such as ISO 14000 series.34 In addition, a number of development agencieshave made funds available for the clean-up and protection of Egypt’s environment,including the International Bank for Reconstruction and Development (IBRD), theDanish International Development Agency (DANIDA), and the Finnish InternationalDevelopment Agency (FINNIDA). For example, FINNIDA funded a wastemanagement system and a licensed landfill in Alexandria for the collection,treatment, and disposal of certain types of industrial hazardous waste. IBRDsupports pollution abatement investments in Cairo, Alexandria, Suez, and Ismailia.35 Moreover, DANIDA completed a feasibility study for an industrial hazardous waste
36 USDOC, US&FCS Market Research Reports, Egypt - Environmental Equipment andServices, p. 4. 37 Cam McGrath, “Raising a Sink,” Egypt Today, Aug. 2003, found at Internet addresshttp://www.egypttoday.com/issues/0308/, retrieved Dec. 10, 2003. 38 Finland Ministry of Foreign Affairs, Projects in Egypt 1999, found athttp://global.finland.fi/english/projects/countries/egypt.htm/, retrieved Dec. 12, 2003; andInternational Consulting Services of the Finnish Environment Institute (SYKE), List of AllProjects, found at Internet addresshttp://www.vyh.fi/eng/intcoop/projects/consult/allproje.htm/, retrieved Dec. 17, 2003. 39 SCS Engineers, “Phase I: Solid Waste Privatization Assistance-- Alexandria, Egypt,2002,” found at Internet addresshttp://www.scsengineers.com/InternationalProjects_SWP_PIEgypt.html/, retrieved Dec. 4,2003. 40 General Agreement on Trade in Services (GATS), Egypt: Schedule of SpecificCommitments, GATS/SC/30, Apr. 15, 1994.
7-11
management project in Cairo and FINNIDA is funding an ongoing project for theintegrated management of dump sites.36
Trade and Investment
Although data on the extent of foreign trade and investment in Egypt are not readilyavailable, there is evidence that several foreign-owned companies provide solid andhazardous waste management services in the market. As of 2001, Onyx SA, asubsidiary of French-based Veolia Environment, provided waste collection servicesand landfill management in Egypt.37 During 1999-2002, Finland-based PlancenterLtd. reportedly provided consulting services for developing the FINNIDA hazardouswaste management project in Alexandria, Egypt, discussed above; this project ispending approval by appropriate government authorities.38 Also, U.S.-based SCSEngineers helped the governorate of Alexandria, Egypt to develop a privatizationprogram for its solid waste management and public cleaning system. This projectconsisted of developing a solid waste management and monitoring system, preparingtender evaluation criteria, developing scenarios for the unbundling of services,preparing the contract and a framework for implementing the project, establishing afinancial model for determining the least cost and present value of each component ofthe solid waste and public cleaning system, and developing a contract monitoringplan.39
Although Egypt was an active participant in the Uruguay Round negotiations onservices, it made no commitments on refuse disposal services under the GeneralAgreement on Trade in Services (GATS). Egypt’s GATS schedule lists restrictionson other service sectors that may affect the foreign provision of refuse disposalservices, including limits on commercial presence (allows only joint-venturecompanies) and limits on foreign equity.40
41 Includes gold, platinum, and chromium mining. 42 USDOC, US&FCS Market Research Reports, South Africa - Waste Management, byAveril Millard, Oct. 1, 2002, pp. 3-4, found at Internet addresshttp://www.s...penDocument&sessID=8017042029832F9/, retrieved Apr. 29, 2003. 43 U.S. Central Intelligence Agency, The World Factbook - South Africa, Aug. 2003, p. 7,found at Internet address http://www.cia.gov/publications/factbook/geos/eg.html/, retrievedNov. 3, 2003. 44 U.K. Trade and Investment, “Environment Market in South Africa,” Crown copyright2003, found at Internet addresshttp://www.tradepartners.gov.uk/environment/south_africa/profile/overview.shtml/, retrievedNov. 20, 2003. 45 USDOC, US&FCS Market Research Reports, South Africa - Waste Management,pp. 2-3. 46 Ibid., p. 5. 47 USDOC, International Trade Administration, South Africa - Environmental TechnologiesExport Market Plan, Oct. 1998, p. 17.
7-12
South Africa
Market Overview
Although data reflecting the size of South Africa’s solid and hazardous wasteservices market are not available, industry sources estimate that the country generatedapproximately 560-600 million metric tons of solid and hazardous waste in 2001(table 7-3). The mining sector41 alone is thought to account for 450-500 millionmetric tons, or 80 percent, of South African waste generation.42 Manufacturingindustries that generate a significant amount of waste in South Africa includemetalworking, machinery, iron and steel, and chemicals.43 Anecdotal evidencesuggests that very little of the solid and hazardous waste stream in South Africa istreated or disposed of in a controlled manner.44
Over half of South Africa’s communities do not have access to waste collectionservices, and municipal waste collection, where it exists, is reportedly irregular. Most collected waste is reportedly disposed of in landfills. There are about 540known landfill operations in South Africa, 61 percent of which operate underpermits. However, industry sources estimate that there could be as many as 15,000landfill sites in the country. A number of small communities burn waste inincinerators. The siting, construction, and operation of these small-scale incineratorswas accomplished to serve an urgent need with little apparent regard forenvironmental impact.45
There is very little information concerning the management of industrial solid andhazardous waste in South Africa. One hazardous waste landfill at Holfonteinreportedly serves the Gauteng, Mpumalanga, Free State, Northwest, and Northernprovinces. Hazardous waste facilities reportedly also exist in Western Cape, KwaZulu-Natal, and Eastern Cape.46 Solid waste from mining generally is deposited ontailing heaps or is used to backfill mines and rehabilitate sites.47 With regard tomedical waste, on-site incineration by hospitals is the prevailing method of disposal. For example, in the Province of Gauteng, there are 54 small-scale incinerators in
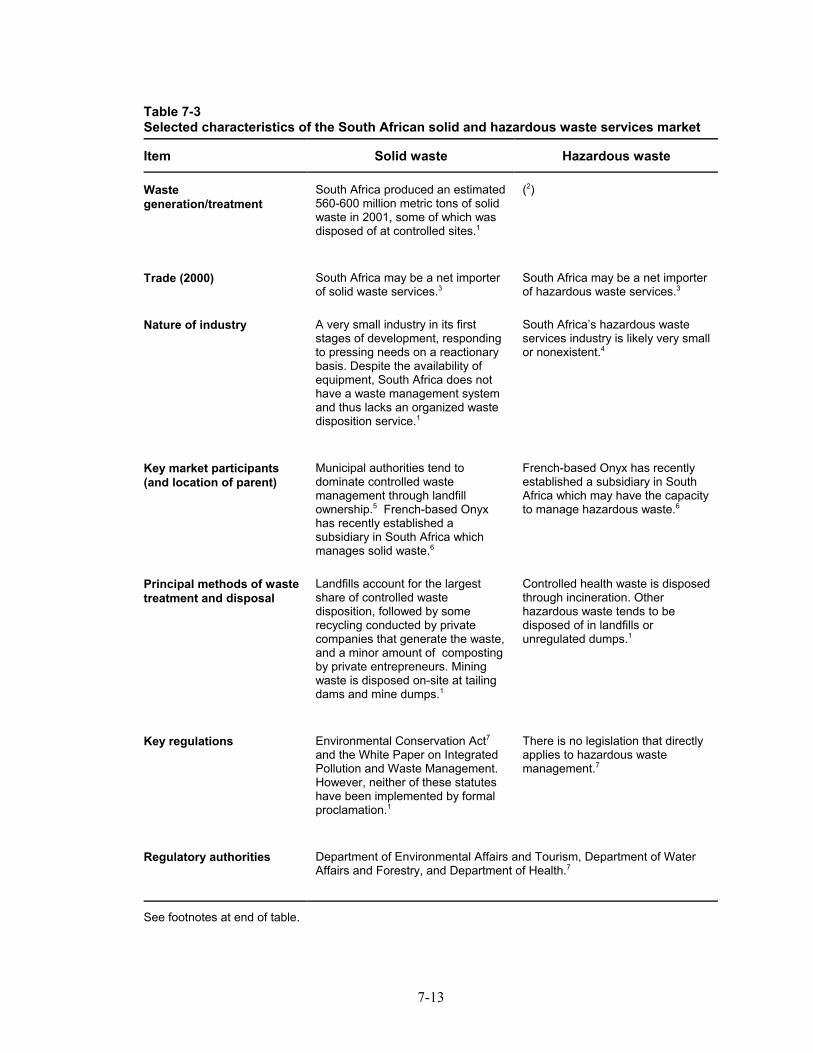
7-13
Table 7-3Selected characteristics of the South African solid and hazardous waste services market
Item Solid waste Hazardous waste
Wastegeneration/treatment
South Africa produced an estimated560-600 million metric tons of solidwaste in 2001, some of which wasdisposed of at controlled sites.1
(2)
Trade (2000) South Africa may be a net importerof solid waste services.3
South Africa may be a net importerof hazardous waste services.3
Nature of industry A very small industry in its firststages of development, respondingto pressing needs on a reactionarybasis. Despite the availability ofequipment, South Africa does nothave a waste management systemand thus lacks an organized wastedisposition service.1
South Africa’s hazardous wasteservices industry is likely very smallor nonexistent.4
Key market participants(and location of parent)
Municipal authorities tend todominate controlled wastemanagement through landfillownership.5 French-based Onyxhas recently established asubsidiary in South Africa whichmanages solid waste.6
French-based Onyx has recentlyestablished a subsidiary in SouthAfrica which may have the capacityto manage hazardous waste.6
Principal methods of wastetreatment and disposal
Landfills account for the largestshare of controlled wastedisposition, followed by somerecycling conducted by privatecompanies that generate the waste,and a minor amount of compostingby private entrepreneurs. Miningwaste is disposed on-site at tailingdams and mine dumps.1
Controlled health waste is disposedthrough incineration. Otherhazardous waste tends to bedisposed of in landfills orunregulated dumps.1
Key regulations Environmental Conservation Act7
and the White Paper on IntegratedPollution and Waste Management.However, neither of these statuteshave been implemented by formalproclamation.1
There is no legislation that directlyapplies to hazardous wastemanagement.7
Regulatory authorities Department of Environmental Affairs and Tourism, Department of WaterAffairs and Forestry, and Department of Health.7
See footnotes at end of table.
48 USDOC, US&FCS Market Research Reports, South Africa - Waste Management, pp. 7-8.
7-14
Table 7-3!continuedSelected characteristics of the South African solid and hazardous waste services market
Item Solid waste Hazardous waste
GATS commitments GATS commitments grant full market access and national treatment toforeign providers of refuse disposal services through cross-border supply(mode 1), consumption abroad (mode 2), and commercial presence (mode3). South Africa’s GATS schedule lists restrictions in other services thatmay affect the foreign provision of refuse disposal services, includingtechnical limitations on market access and national treatment throughcross-border supply for general construction work for civil engineering andlimitations on the size of building plans for market access through cross-border supply and consumption abroad.8
Other measures affectingtrade and investment
Exporting businesses are increasingly required by their foreign customersto achieve ISO 14000 waste management certification.7
1 USDOC, US&FCS Market Research Reports, South Africa - Waste Management, by Averil Millard,Oct. 1, 2002, p. 1-15. 2 Not available. 3 Anecdotal evidence indicated that at least one foreign owned firm is providing waste managementservices in South Africa. Research has uncovered no evidence of South African firms providing wastemanagement services in foreign markets. Onyx South Africa Waste Management Services website, homepage, found at Internet address http://www.onyxsa.com, retrieved Nov. 21, 2003. 4 Research has uncovered evidence of one firm that may provide hazardous waste services in SouthAfrica. Onyx South Africa Waste Management Services website, home page, found at Internet addresshttp://www.onyxsa.com, retrieved Nov. 21, 2003. 5 The World Bank, Urban Development Division, Waste Management Anchor Team, Observations ofSolid Waste Landfills in Developing Countries: Africa, Asia, and Latin America, by Lars MikkelJohannessen with Gabriel Boyer, June 1999, p. 11. 6 Onyx South Africa Waste Management Services website, home page, found at Internet addresshttp://www.onyxsa.com, retrieved Nov. 21, 2003. 7 USDOC, International Trade Administration, South Africa - Environmental Technologies Export MarketPlan, Oct. 1998, p. 4, 7, and 9. 8 General Agreement on Trade in Services (GATS), South Africa: Schedule of Specific Commitments,GATS/S/78, Apr. 15, 1994.
operation. Non-burn technologies reportedly are being introduced as an alternative tothe existing incinerators, possibly as a result of public pressure to address airpollution concerns.48
There is very little recycling activity in South Africa because the cost of recoveredmaterials is frequently higher than that of new materials. However, some recyclinginitiatives that were developed on an adhoc basis with private sector funding havemet with some success. Paper and fiber recycling is fairly well-developed and iscontrolled by SAPPI, Mondi, and Nampak, South Africa’s three largest papercompanies. Steel and aluminum cans are recycled by a company called Collect-a-Can, which has a detinning facility in Gauteng Province. Owing to the availability ofrecyclable materials at landfills, informal salvaging is widespread. Informalrecycling is particularly common in undeveloped areas, where some waste is
49 Ibid., pp. 5-7. 50 USDOC, International Trade Administration, South Africa - Environmental TechnologiesExport Market Plan, p. 9. 51 Ibid. 52 U.S. Central Intelligence Agency, The World Factbook - South Africa, p. 6. 53 Industry representative, interview by USITC staff, Washington, DC, Nov. 12, 2003. 54 Onyx South Africa Waste Management Services web site, home page, found at Internetaddress http://www.onyxsa.com/, retrieved Nov. 21, 2003.
7-15
converted into useable household items such as bags, mats, and toys. Composting isalso conducted on an informal basis by private entrepreneurs.49
South Africa does not have a central government agency with regulatory andenforcement authority over environmental issues. Since the dismantling of apartheidin 1994, the Government of South Africa has made some preliminary efforts toimprove the legal and regulatory framework for environmental management. Forexample, the new constitution emphasizes the importance of environmental healthand welfare, pollution control, nature conservation, and sustainable social andeconomic development. Also, the Department of Environmental Affairs and Tourismpublished the White Paper on Environmental Management Policy for South Africa inMay 1998 and a draft National Environmental Management Bill in June 1998,currently pending approval.50 In the meantime, the Government of South Africa isusing pre-1994 environmental regulations in order to meet immediate needs. SouthAfrica has a large body of environmental protection legislation on the books,including the country’s major environmental law, the Environment Conservation Act,and more than 30 statutes covering land-based pollution. However, these have neverbeen effectively implemented.51
Other factors that limit demand for solid and hazardous waste services in SouthAfrica include pressing social and economic issues such as the high unemploymentrate and growing HIV/AIDS infection rates. In addition, substantial economicproblems remain from the apartheid era, most notably the high level of poverty (anestimated 33 percent of households) and the lack of economic empowerment amongdisadvantaged groups.52 As long as these issues remain top government priorities,efforts to address environmental problems may not garner a substantial amount ofscarce public resources.53 Nevertheless, domestic businesses’ interest in exportingmay stimulate the demand for solid and hazardous waste management services inSouth Africa, as trade partners are increasingly pressing exporters to adopt andbecome certified in established environment management standards such as the ISO14000 series.
Trade and Investment
Evidence suggests that foreign participation in the South African solid and hazardouswaste management market is limited. French-based Veolia Environment has recentlyestablished a solid and hazardous waste subsidiary in South Africa called Onyx SouthAfrica Waste Management Services.54 Weston Solutions, Inc., a U.S.-based wastemanagement company, in partnership with Peacock Bay Environmental Services, aSouth African-based waste management company, recently concluded a two-yearbusiness development program in South Africa. However, the waste management
55 Pre-hearing written submission, Michael T. Werner, Esq., Client Services Manager,Weston Solutions, Inc., Oct. 6, 2003; and industry representative, interview by USITC staff,Washington, DC, Nov. 12, 2003. 56 General Agreement on Trade in Services (GATS), South Africa: Schedule of SpecificCommitments, GATS/SC/78, Apr. 15, 1994. 57 U.K. Trade and Investment, “Environment Market in Chile.”
7-16
proposal put forward by Weston and Peacock at the end of this program was notaccepted, likely due to South Africa’s resource constraints. In retrospect, the high-technology program offered in Weston’s original proposal may have been out-of-reach for the newly emerging South African waste management market. Oneindustry representative observed that South Africa’s leadership is in the difficultsituation of deciding which critical public needs to fund with very scarce publicresources in order to achieve the greatest public benefit in the least amount of time.55
South Africa’s commitments on refuse disposal services under the GATS grant fullmarket access and national treatment for the foreign provision of such servicesthrough cross-border supply, consumption abroad, and commercial presence. SouthAfrica’s GATS schedule lists restrictions in other services that may affect the foreignprovision of refuse disposal services, including technical limitations on market accessand national treatment through cross-border supply for general construction work forcivil engineering, as well as limitations on the size of building plans for marketaccess through cross-border supply and consumption abroad.56
Future ProspectsSolid and hazardous waste services markets in Africa, Latin America, and the MiddleEast are modest in both relative and absolute terms. Chile, Egypt, and South Africa,which are considered regional leaders, are just beginning the process of assessing thefull economic burdens associated with a lack of effective environmental legislation,regulation, and enforcement. As regulations and enforcement become more robust,the growth of industrial activity with its attendant solid and hazardous wastemanagement issues will likely expand at a rate slightly greater than the growth ofdomestic waste management capacity. During this developmental phase, thesecountries will likely be net importers of services, equipment, and capital toimplement solutions toward achieving adequate standards of solid and hazardouswaste management.
Chilean efforts to address the treatment and disposal of solid and hazardous waste areexpected to result in the construction of additional certified sanitary landfills to meetgrowing demand for waste disposal capacity. This increase in demand is driven bythe pending approval of regulations pertaining to the management of industrial andhazardous waste, the country’s goal to dispose of 80 percent of all solid waste incertified sanitary landfills, and the adoption of ISO standards and certificationprotocols by Chilean exporters.57
Egyptian Decree 338/1995 requires the licensing of hazardous waste generation,collection, storage, transport, treatment, and disposal operations. This actionestablishes a framework for the foreign provision of hazardous waste management
58 USDOC, International Trade Administration, Egypt - Environmental TechnologiesExport Market Plan, p. 6. 59 Egyptian Environmental Policy Program, found at Internet addresshttp://www.greencom.org/greencom/papers.asp?type=country&letter=E/, retrieved Dec. 4,2003. 60 U.S. Embassy in Cairo, “U.S., Egypt Put Hazardous Waste Management into Action,”press release, July 13, 2003, found at Internet addresshttp://cairo.usembassy.gov/usis/pr071303.html/, retrieved Dec. 4, 2003. 61 Vernon Mchunu, “World Bank Project Will Draw Power From Trash,” The Mercury,Jun. 27, 2003, found at Internet addresshttp://www.iol.co.za/index.php?click_id=13&art_id=vn2003062703..., retrieved Dec. 4, 2003. 62 John Sutter, “Fixing a Tyred Environment,” Apr. 6, 2003, found at Internet address http://www.news24.com/News24/South_Africa/News/0,,2-7-1442..., retrieved Dec. 4, 2003.
7-17
services.58 Further, the establishment and maturing of regional branch offices of theEgyptian Environmental Affairs Agency, as well as increasing standardization inplanning cycles, work plans, budgets, operating procedures, and staff skill levels,should enhance opportunities in the Egyptian waste management market.59 Lastly,the completion of a $1.3 million USAID-funded project to develop guidelines for theclassification and safe handling of hazardous wastes and a system to license entitiesthat generate, handle, or dispose of such waste will likely provide a commonstructure for managing hazardous wastes and create commercial opportunities forwaste management firms.60
It appears that near-term trade opportunities in South Africa’s solid and hazardouswaste management market are somewhat limited owing to a variety of resourceconstraints. However, there may be selected opportunities for developing nichewaste management markets. For example, the World Bank has initiated a pilotproject to harness methane gas emissions from three landfills in Durban to use in thegeneration of electricity. Development of the project is anticipated to start sometimein 2004, following an environmental impact assessment.61 The recycling of tires,which is reportedly required by the Department of Environmental Affairs andTourism, is also expected to provide additional market opportunities in the solid andhazardous waste services sector.62

1 Municipal solid waste generation rates are used in this comparison, as the definition ofmunicipal solid waste tends to be more comparable across countries than definitions of otherwaste streams. 2 The World Bank Group defines lower-middle income countries (China, Egypt, and SouthAfrica) as those with per capita GDP of $736– $2,935, upper-middle income countries (Chile,Czech Republic, Malaysia, and Mexico) $2,936– $9,075, and high income (Australia, Canada,European Union, Japan, and United States) $9,076 or more. Municipal waste generation datawere not available for Australia, Canada, Egypt, Malaysia, or South Africa.
8-1
CHAPTER 8SUMMARY
A cross-country comparison of the information presented throughout this reportsuggests that there is a significant relationship between income and the characteristicsof national solid and hazardous waste services markets. Among the countriesdiscussed in this report, high-income economies typically generate more solid wastethan middle-income economies. High-income countries manage a greater share oftheir waste, are more likely to employ modern waste management techniques, and aremore likely to maintain and enforce strict waste management regulations thandeveloping economies. Trade and investment in the solid and hazardous wasteservices sector is also more prevalent among developed economies than developingcountries. However, some market characteristics, including hazardous wastegeneration and private participation in hazardous waste management markets, may beunrelated to per capita income levels.
This chapter provides an overview of the country-specific information presented inthe preceding chapters, and compares this information in an effort to identify trendsin the global markets for solid and hazardous waste services and in the provision ofsuch services across national borders.
Market Conditions
Solid Waste Management
An analysis of the information presented in this investigation suggests that high-income countries tend to generate more solid waste than developing countries (table8-1). A direct comparison of per capita municipal solid waste1 generation rates andper capita income levels across the subject countries indicates that there is a positiverelationship between waste generation and income: waste generation tends to grow asper capita income increases (figure 8-1). Thus, for example, middle-incomeeconomies such as China, Chile, the Czech Republic, and Mexico are observed asgenerating less waste per capita than high-income countries.2 The stringencyand enforcement of solid waste management regulations also seem to beclosely related to per capita income levels.
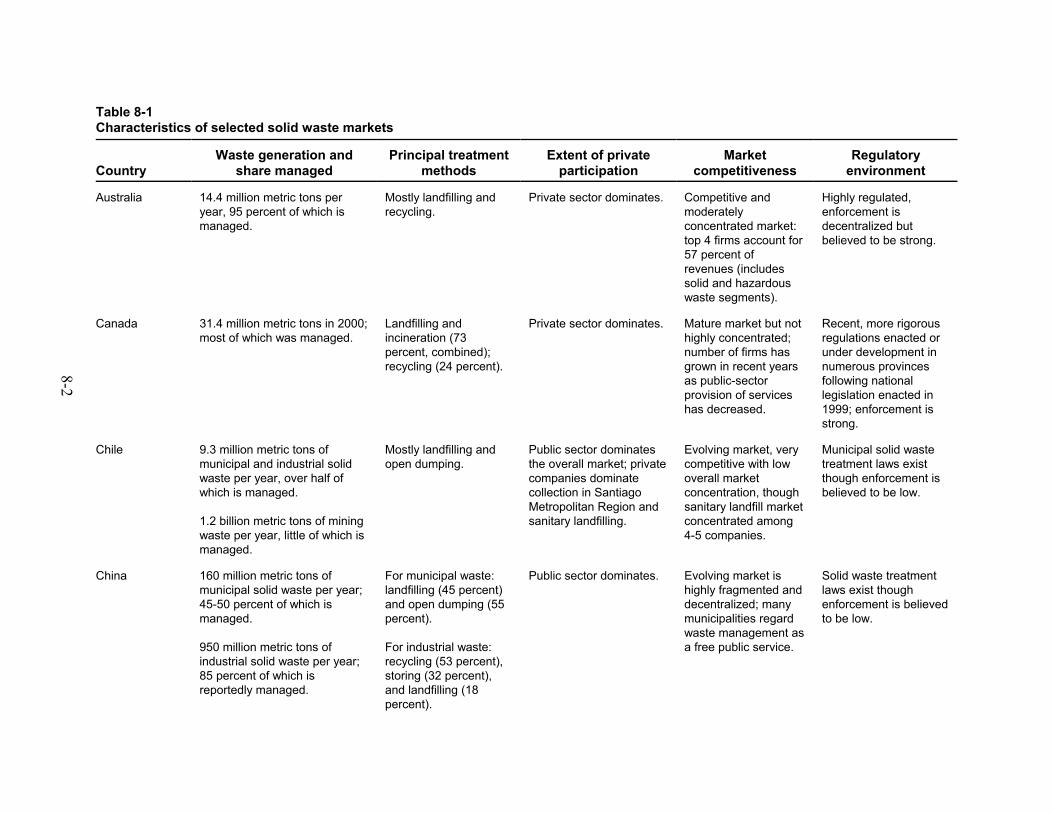
8-2
Table 8-1Characteristics of selected solid waste markets
CountryWaste generation and
share managedPrincipal treatment
methodsExtent of private
participationMarket
competitivenessRegulatory
environment
Australia 14.4 million metric tons peryear, 95 percent of which ismanaged.
Mostly landfilling andrecycling.
Private sector dominates. Competitive andmoderatelyconcentrated market: top 4 firms account for57 percent ofrevenues (includessolid and hazardouswaste segments).
Highly regulated,enforcement isdecentralized butbelieved to be strong.
Canada 31.4 million metric tons in 2000;most of which was managed.
Landfilling andincineration (73percent, combined);recycling (24 percent).
Private sector dominates. Mature market but nothighly concentrated;number of firms hasgrown in recent yearsas public-sectorprovision of serviceshas decreased.
Recent, more rigorousregulations enacted orunder development innumerous provincesfollowing nationallegislation enacted in1999; enforcement isstrong.
Chile 9.3 million metric tons ofmunicipal and industrial solidwaste per year, over half ofwhich is managed.
1.2 billion metric tons of miningwaste per year, little of which ismanaged.
Mostly landfilling andopen dumping.
Public sector dominatesthe overall market; privatecompanies dominatecollection in SantiagoMetropolitan Region andsanitary landfilling.
Evolving market, verycompetitive with lowoverall marketconcentration, thoughsanitary landfill marketconcentrated among4-5 companies.
Municipal solid wastetreatment laws existthough enforcement isbelieved to be low.
China 160 million metric tons ofmunicipal solid waste per year;45-50 percent of which ismanaged.
950 million metric tons ofindustrial solid waste per year;85 percent of which isreportedly managed.
For municipal waste:landfilling (45 percent)and open dumping (55percent).
For industrial waste:recycling (53 percent),storing (32 percent),and landfilling (18percent).
Public sector dominates. Evolving market ishighly fragmented anddecentralized; manymunicipalities regardwaste management asa free public service.
Solid waste treatmentlaws exist thoughenforcement is believedto be low.
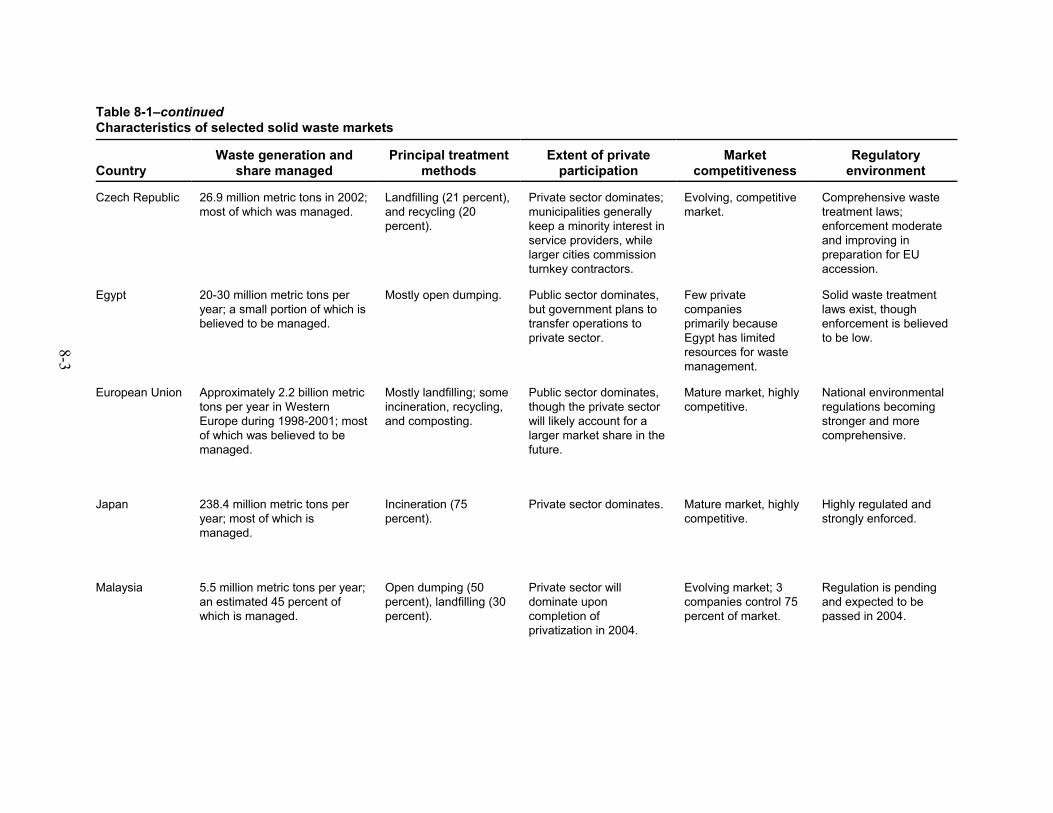
8-3
Table 8-1–continuedCharacteristics of selected solid waste markets
CountryWaste generation and
share managedPrincipal treatment
methodsExtent of private
participationMarket
competitivenessRegulatory
environment
Czech Republic 26.9 million metric tons in 2002;most of which was managed.
Landfilling (21 percent),and recycling (20percent).
Private sector dominates; municipalities generallykeep a minority interest inservice providers, whilelarger cities commissionturnkey contractors.
Evolving, competitivemarket.
Comprehensive wastetreatment laws;enforcement moderateand improving inpreparation for EUaccession.
Egypt 20-30 million metric tons peryear; a small portion of which isbelieved to be managed.
Mostly open dumping. Public sector dominates,but government plans totransfer operations toprivate sector.
Few privatecompaniesprimarily becauseEgypt has limitedresources for wastemanagement.
Solid waste treatmentlaws exist, thoughenforcement is believedto be low.
European Union Approximately 2.2 billion metrictons per year in WesternEurope during 1998-2001; mostof which was believed to bemanaged.
Mostly landfilling; someincineration, recycling,and composting.
Public sector dominates,though the private sectorwill likely account for alarger market share in thefuture.
Mature market, highlycompetitive.
National environmentalregulations becomingstronger and morecomprehensive.
Japan 238.4 million metric tons peryear; most of which ismanaged.
Incineration (75percent).
Private sector dominates. Mature market, highlycompetitive.
Highly regulated andstrongly enforced.
Malaysia 5.5 million metric tons per year;an estimated 45 percent ofwhich is managed.
Open dumping (50percent), landfilling (30percent).
Private sector willdominate uponcompletion of privatization in 2004.
Evolving market; 3companies control 75percent of market.
Regulation is pendingand expected to bepassed in 2004.
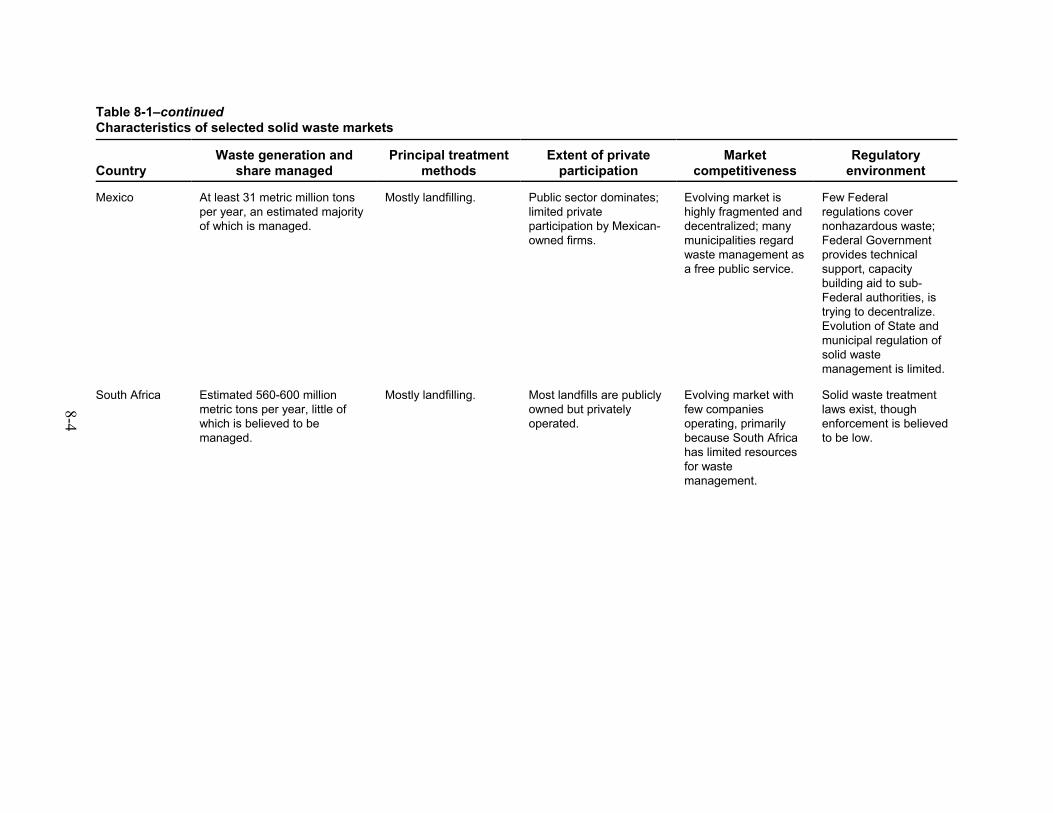
Table 8-1–continuedCharacteristics of selected solid waste markets
CountryWaste generation and
share managedPrincipal treatment
methodsExtent of private
participationMarket
competitivenessRegulatory
environment
8-4
Mexico At least 31 metric million tonsper year, an estimated majorityof which is managed.
Mostly landfilling. Public sector dominates;limited privateparticipation by Mexican-owned firms.
Evolving market ishighly fragmented anddecentralized; manymunicipalities regardwaste management asa free public service.
Few Federalregulations covernonhazardous waste;Federal Governmentprovides technicalsupport, capacitybuilding aid to sub-Federal authorities, is trying to decentralize. Evolution of State andmunicipal regulation ofsolid wastemanagement is limited.
South Africa Estimated 560-600 millionmetric tons per year, little ofwhich is believed to bemanaged.
Mostly landfilling. Most landfills are publiclyowned but privately operated.
Evolving market withfew companies operating, primarilybecause South Africahas limited resourcesfor wastemanagement.
Solid waste treatmentlaws exist, thoughenforcement is believedto be low.
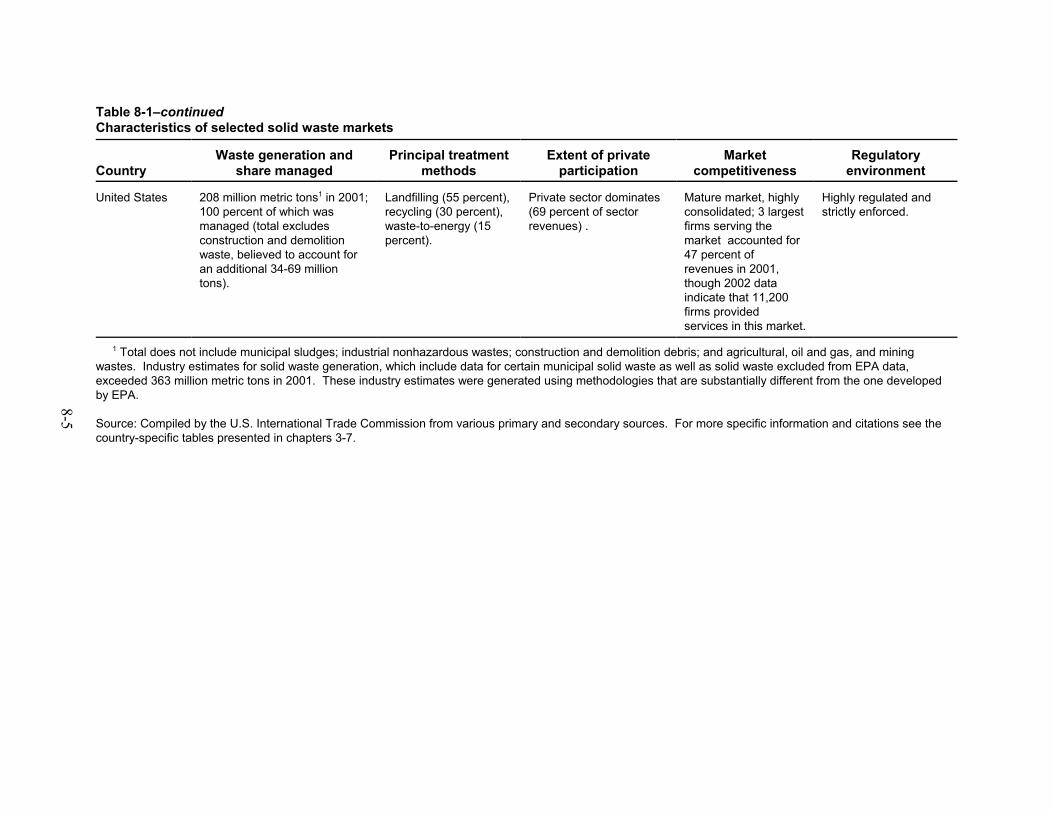
Table 8-1–continuedCharacteristics of selected solid waste markets
CountryWaste generation and
share managedPrincipal treatment
methodsExtent of private
participationMarket
competitivenessRegulatory
environment
8-5
United States 208 million metric tons1 in 2001;100 percent of which wasmanaged (total excludesconstruction and demolitionwaste, believed to account foran additional 34-69 milliontons).
Landfilling (55 percent),recycling (30 percent),waste-to-energy (15percent).
Private sector dominates(69 percent of sectorrevenues) .
Mature market, highlyconsolidated; 3 largestfirms serving themarket accounted for47 percent ofrevenues in 2001,though 2002 dataindicate that 11,200 firms providedservices in this market.
Highly regulated andstrictly enforced.
1 Total does not include municipal sludges; industrial nonhazardous wastes; construction and demolition debris; and agricultural, oil and gas, and miningwastes. Industry estimates for solid waste generation, which include data for certain municipal solid waste as well as solid waste excluded from EPA data,exceeded 363 million metric tons in 2001. These industry estimates were generated using methodologies that are substantially different from the one developedby EPA.
Source: Compiled by the U.S. International Trade Commission from various primary and secondary sources. For more specific information and citations see thecountry-specific tables presented in chapters 3-7.
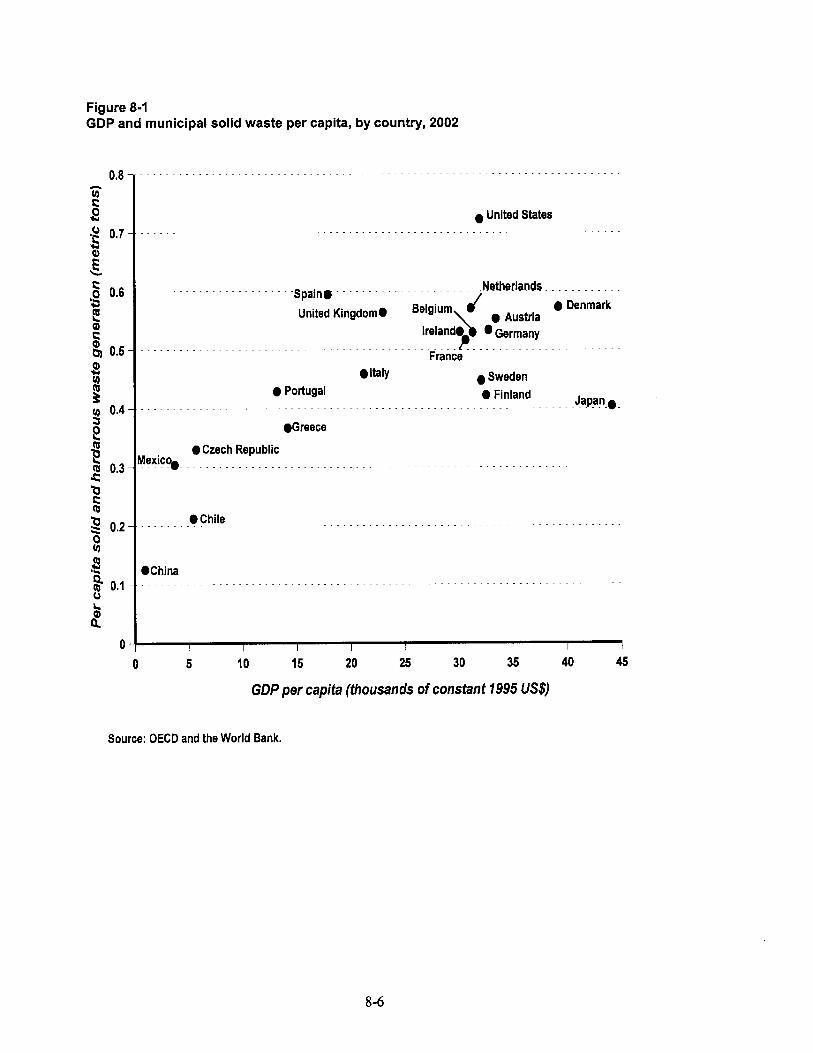
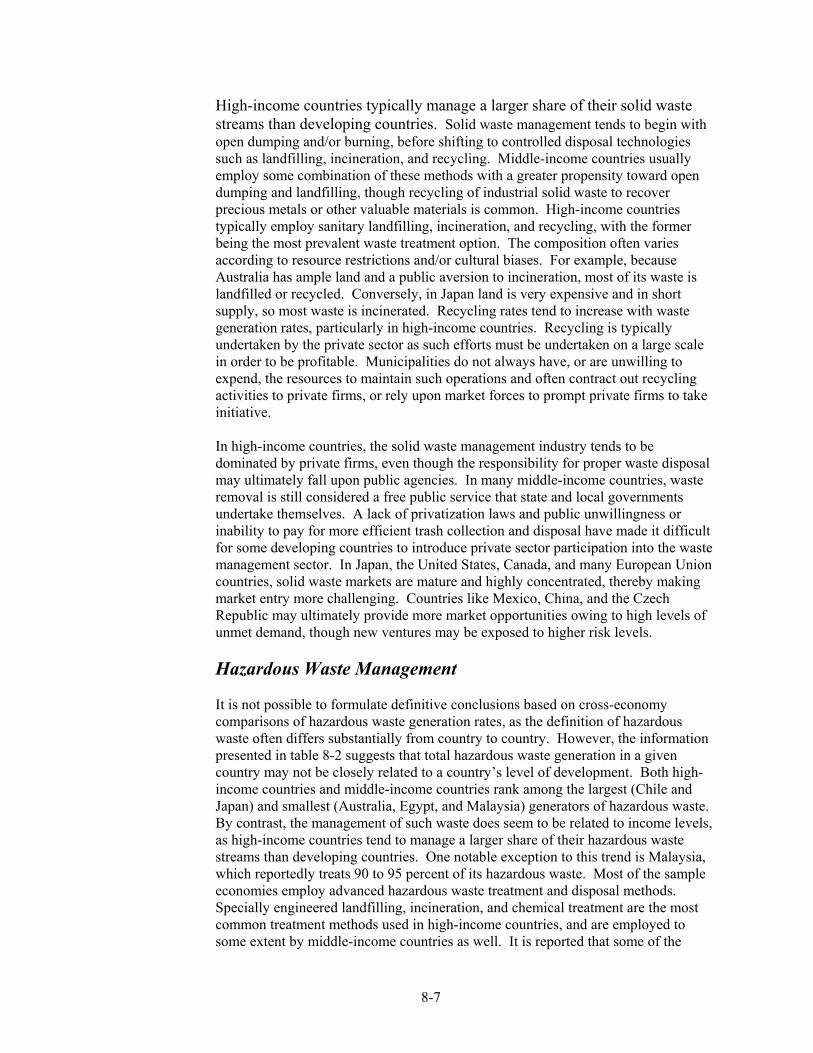
8-7
High-income countries typically manage a larger share of their solid wastestreams than developing countries. Solid waste management tends to begin withopen dumping and/or burning, before shifting to controlled disposal technologiessuch as landfilling, incineration, and recycling. Middle-income countries usuallyemploy some combination of these methods with a greater propensity toward opendumping and landfilling, though recycling of industrial solid waste to recoverprecious metals or other valuable materials is common. High-income countriestypically employ sanitary landfilling, incineration, and recycling, with the formerbeing the most prevalent waste treatment option. The composition often variesaccording to resource restrictions and/or cultural biases. For example, becauseAustralia has ample land and a public aversion to incineration, most of its waste islandfilled or recycled. Conversely, in Japan land is very expensive and in shortsupply, so most waste is incinerated. Recycling rates tend to increase with wastegeneration rates, particularly in high-income countries. Recycling is typicallyundertaken by the private sector as such efforts must be undertaken on a large scalein order to be profitable. Municipalities do not always have, or are unwilling toexpend, the resources to maintain such operations and often contract out recyclingactivities to private firms, or rely upon market forces to prompt private firms to takeinitiative.
In high-income countries, the solid waste management industry tends to bedominated by private firms, even though the responsibility for proper waste disposalmay ultimately fall upon public agencies. In many middle-income countries, wasteremoval is still considered a free public service that state and local governmentsundertake themselves. A lack of privatization laws and public unwillingness orinability to pay for more efficient trash collection and disposal have made it difficultfor some developing countries to introduce private sector participation into the wastemanagement sector. In Japan, the United States, Canada, and many European Unioncountries, solid waste markets are mature and highly concentrated, thereby makingmarket entry more challenging. Countries like Mexico, China, and the CzechRepublic may ultimately provide more market opportunities owing to high levels ofunmet demand, though new ventures may be exposed to higher risk levels.
Hazardous Waste Management
It is not possible to formulate definitive conclusions based on cross-economycomparisons of hazardous waste generation rates, as the definition of hazardouswaste often differs substantially from country to country. However, the informationpresented in table 8-2 suggests that total hazardous waste generation in a givencountry may not be closely related to a country’s level of development. Both high-income countries and middle-income countries rank among the largest (Chile andJapan) and smallest (Australia, Egypt, and Malaysia) generators of hazardous waste. By contrast, the management of such waste does seem to be related to income levels,as high-income countries tend to manage a larger share of their hazardous wastestreams than developing countries. One notable exception to this trend is Malaysia,which reportedly treats 90 to 95 percent of its hazardous waste. Most of the sampleeconomies employ advanced hazardous waste treatment and disposal methods. Specially engineered landfilling, incineration, and chemical treatment are the mostcommon treatment methods used in high-income countries, and are employed tosome extent by middle-income countries as well. It is reported that some of the
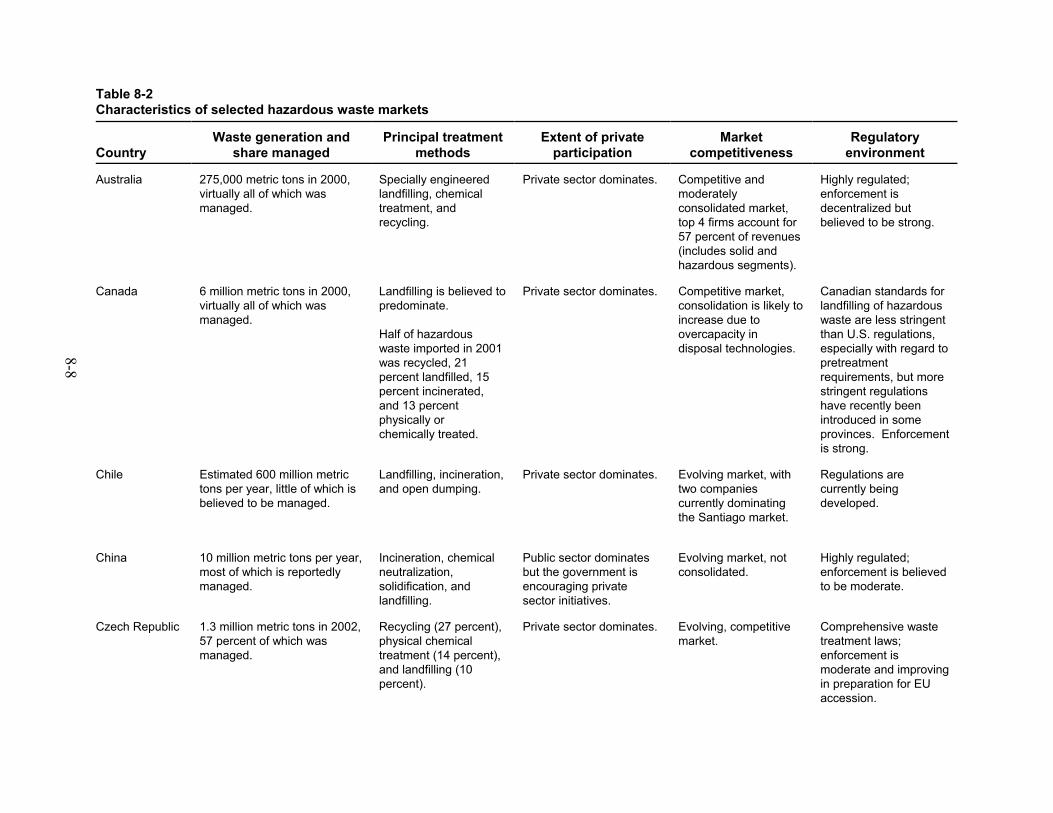
8-8
Table 8-2Characteristics of selected hazardous waste markets
CountryWaste generation and
share managedPrincipal treatment
methodsExtent of private
participationMarket
competitivenessRegulatory
environment
Australia 275,000 metric tons in 2000,virtually all of which wasmanaged.
Specially engineeredlandfilling, chemicaltreatment, andrecycling.
Private sector dominates. Competitive andmoderatelyconsolidated market,top 4 firms account for57 percent of revenues(includes solid andhazardous segments).
Highly regulated;enforcement isdecentralized butbelieved to be strong.
Canada 6 million metric tons in 2000,virtually all of which wasmanaged.
Landfilling is believed topredominate.
Half of hazardouswaste imported in 2001was recycled, 21percent landfilled, 15percent incinerated,and 13 percentphysically or chemically treated.
Private sector dominates. Competitive market,consolidation is likely toincrease due toovercapacity indisposal technologies.
Canadian standards forlandfilling of hazardouswaste are less stringentthan U.S. regulations,especially with regard topretreatmentrequirements, but morestringent regulationshave recently beenintroduced in someprovinces. Enforcementis strong.
Chile Estimated 600 million metrictons per year, little of which isbelieved to be managed.
Landfilling, incineration,and open dumping.
Private sector dominates. Evolving market, withtwo companiescurrently dominatingthe Santiago market.
Regulations arecurrently beingdeveloped.
China 10 million metric tons per year,most of which is reportedlymanaged.
Incineration, chemicalneutralization,solidification, andlandfilling.
Public sector dominatesbut the government isencouraging privatesector initiatives.
Evolving market, notconsolidated.
Highly regulated;enforcement is believedto be moderate.
Czech Republic 1.3 million metric tons in 2002,57 percent of which wasmanaged.
Recycling (27 percent), physical chemicaltreatment (14 percent),and landfilling (10percent).
Private sector dominates. Evolving, competitivemarket.
Comprehensive wastetreatment laws;enforcement ismoderate and improvingin preparation for EUaccession.
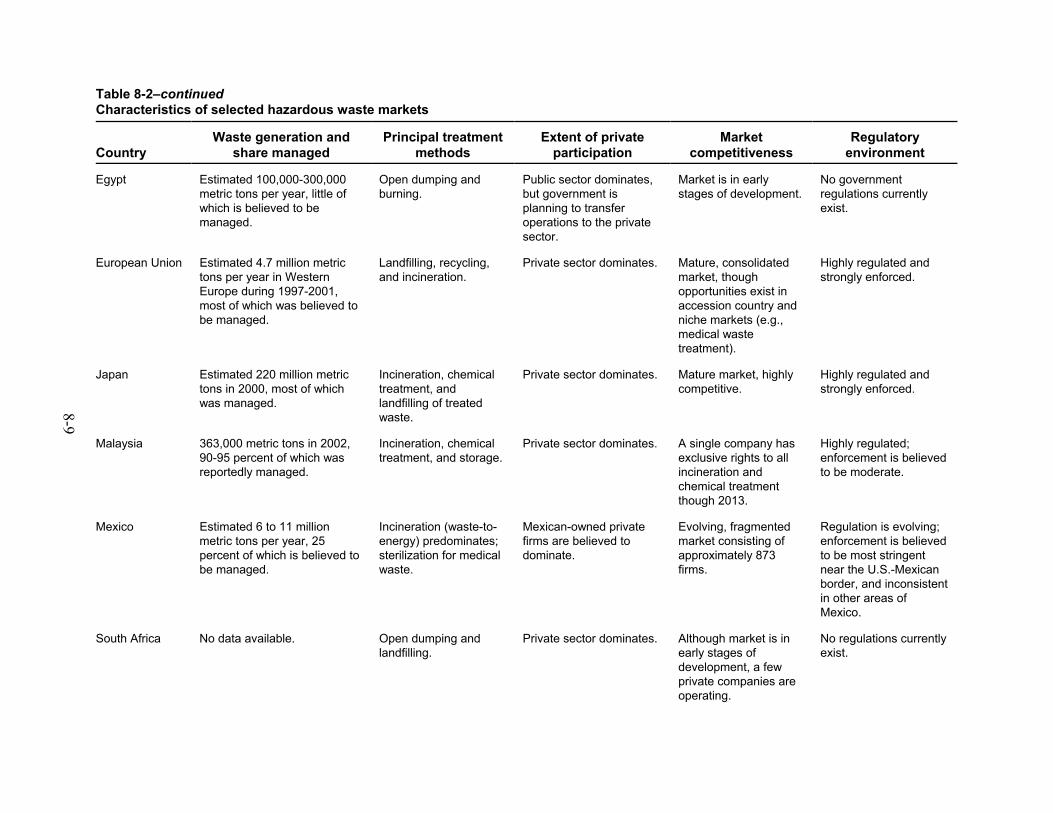
8-9
Table 8-2–continuedCharacteristics of selected hazardous waste markets
CountryWaste generation and
share managedPrincipal treatment
methodsExtent of private
participationMarket
competitivenessRegulatory
environment
Egypt Estimated 100,000-300,000metric tons per year, little ofwhich is believed to bemanaged.
Open dumping andburning.
Public sector dominates,but government isplanning to transferoperations to the privatesector.
Market is in earlystages of development.
No governmentregulations currentlyexist.
European Union Estimated 4.7 million metrictons per year in WesternEurope during 1997-2001,most of which was believed tobe managed.
Landfilling, recycling,and incineration.
Private sector dominates. Mature, consolidatedmarket, thoughopportunities exist inaccession country andniche markets (e.g.,medical wastetreatment).
Highly regulated andstrongly enforced.
Japan Estimated 220 million metrictons in 2000, most of whichwas managed.
Incineration, chemicaltreatment, andlandfilling of treatedwaste.
Private sector dominates. Mature market, highlycompetitive.
Highly regulated andstrongly enforced.
Malaysia 363,000 metric tons in 2002,90-95 percent of which wasreportedly managed.
Incineration, chemicaltreatment, and storage.
Private sector dominates. A single company hasexclusive rights to allincineration andchemical treatmentthough 2013.
Highly regulated;enforcement is believedto be moderate.
Mexico Estimated 6 to 11 millionmetric tons per year, 25percent of which is believed tobe managed.
Incineration (waste-to-energy) predominates;sterilization for medicalwaste.
Mexican-owned privatefirms are believed todominate.
Evolving, fragmentedmarket consisting ofapproximately 873firms.
Regulation is evolving;enforcement is believedto be most stringentnear the U.S.-Mexicanborder, and inconsistentin other areas ofMexico.
South Africa No data available. Open dumping andlandfilling.
Private sector dominates. Although market is inearly stages ofdevelopment, a fewprivate companies areoperating.
No regulations currentlyexist.
Table 8-2–continuedCharacteristics of selected hazardous waste markets
CountryWaste generation and
share managedPrincipal treatment
methodsExtent of private
participationMarket
competitivenessRegulatory
environment
8-10
United States 36 million metric tonsgenerated by large-quantitygenerators in 1999, which,according to industry sources,account for approximately 60percent of hazardous wastegeneration; 100 percent ofwhich was managed.
Land disposal, mainlydeep-well orunderground injection(69 percent), thermaltreatment (11 percent),and recovery (8percent).
Private sector dominates. Mature market withapproximately 1,200firms operating. CleanHarbors holds thelargest share of thehazardous wastemarket (12 percent),while Stericycle holdsthe largest share (25percent) of the medicalwaste market.
Highly regulated andstrongly enforced;extensive liability lawsrelated to cleanup ofcontaminated sitesprovide strong incentivefor effective wastemanagement.
Source: Compiled by the U.S. International Trade Commission from various primary and secondary sources. For more specific information and citations see thecountry-specific tables presented in chapters 3-7.
8-11
developing economies also engage in open dumping and uncontrolled landfilling andburning of hazardous waste. However, as is the case with solid waste, many of thosecountries also take measures to recover potentially useful materials from the wastestream prior to disposal. The hazardous waste management industry is dominated bythe private sector in almost all of the sample countries, regardless of income level. Inmost cases, state and local governments require industry to bear the burden oftreating its hazardous waste.
The stringency of hazardous waste regulations and the ability of governments tomonitor and enforce those laws differ widely among the sample economies. Hazardous waste regulation and enforcement is typically more stringent in high-income economies than that in developing economies. A comparison of per capitaincome levels and industry perceptions regarding the stringency of national toxicwaste regulations reinforces the positive relationship between the stringency ofregulations and per capita income (figure 8-2): toxic waste regulations are generallyconsidered to be more stringent in high-income countries and less stringent incountries with lower per capita income levels. In developing countries such asChina, Mexico, Chile, and South Africa, toxic waste disposal regulations may existbut are perceived as weak, and therefore noncompliance and illegal disposal may bemore common than in high-income countries. Alternately, in some instances,developing countries may be able to enforce the laws but lack adequate treatmentcapacity, thus requiring companies to store hazardous waste until treatment optionsbecome available.
Trade and Investment
The extent of cross-border trade and investment in solid and hazardous wastemanagement services differs dramatically among the countries examined in this study(table 8-3). Such activity is most common among high-income countries wherestringent regulation and consistent enforcement create steady demand for wastemanagement services and encourage the development of waste management capacity. In the European Union, Japan, and the United States, markets for waste managementservices are mature and highly competitive. Thus, many firms in these economiesseek new market opportunities abroad. Although trade accounts for a substantialportion of Canadian waste management activities, there are also substantialopportunities within that country’s domestic market as the industry is onlymoderately concentrated and new regulations have recently emerged. Australia iscurrently believed to be a net exporter of waste management services, though importlevels may rise as the country attempts to lessen its reliance on landfilling. Amongthe selected middle-income countries, trade can be sporadic reflecting immediate,short-term needs rather than long-term service solutions. In Chile, China, andMalaysia, imports of equipment and technology are more common than services, asthose countries work toward establishing waste management infrastructure. As theregulatory environment and the technology in those countries continue to evolve,opportunities for trade will likely increase.
Few of the countries selected for discussion in this report have explicit restrictions ontrade in solid and hazardous waste management services. However, regulations
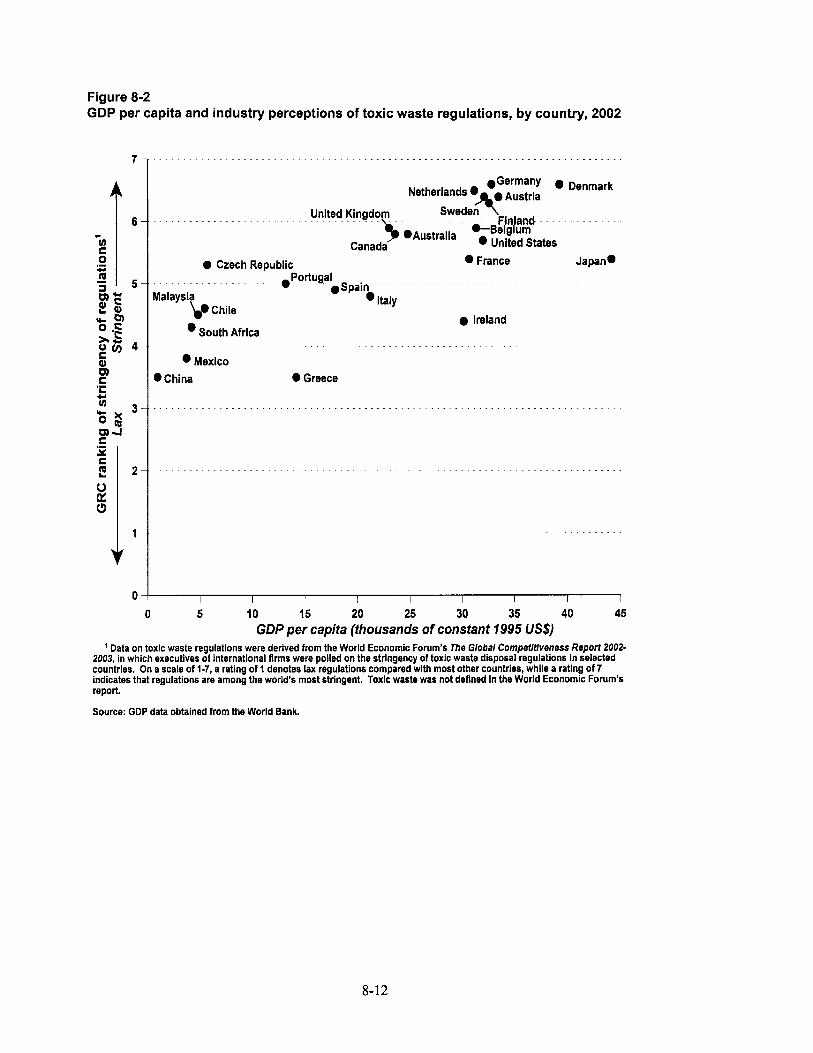
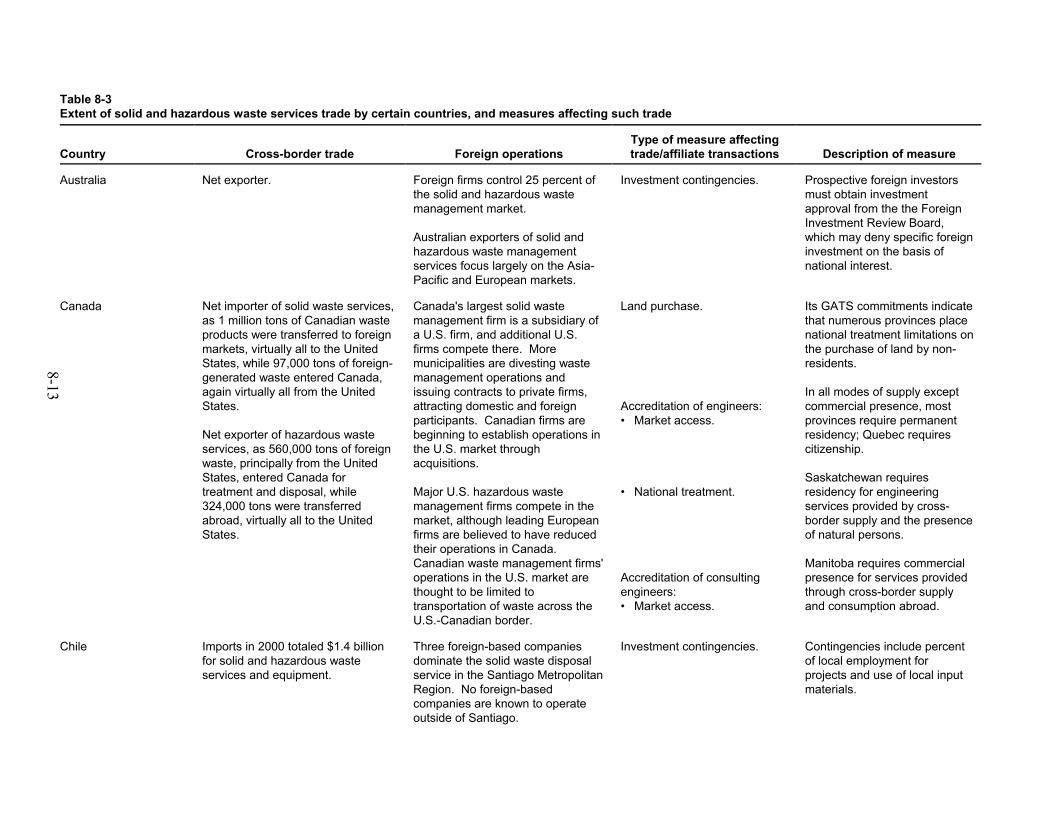
8-13
Table 8-3Extent of solid and hazardous waste services trade by certain countries, and measures affecting such trade
Country Cross-border trade Foreign operationsType of measure affectingtrade/affiliate transactions Description of measure
Australia Net exporter. Foreign firms control 25 percent ofthe solid and hazardous wastemanagement market.
Australian exporters of solid andhazardous waste management services focus largely on the Asia-Pacific and European markets.
Investment contingencies. Prospective foreign investorsmust obtain investmentapproval from the the ForeignInvestment Review Board,which may deny specific foreigninvestment on the basis ofnational interest.
Canada Net importer of solid waste services,as 1 million tons of Canadian wasteproducts were transferred to foreignmarkets, virtually all to the UnitedStates, while 97,000 tons of foreign-generated waste entered Canada,again virtually all from the UnitedStates.
Net exporter of hazardous wasteservices, as 560,000 tons of foreignwaste, principally from the UnitedStates, entered Canada fortreatment and disposal, while324,000 tons were transferredabroad, virtually all to the UnitedStates.
Canada's largest solid wastemanagement firm is a subsidiary ofa U.S. firm, and additional U.S.firms compete there. Moremunicipalities are divesting wastemanagement operations andissuing contracts to private firms,attracting domestic and foreignparticipants. Canadian firms arebeginning to establish operations inthe U.S. market throughacquisitions.
Major U.S. hazardous wastemanagement firms compete in themarket, although leading Europeanfirms are believed to have reducedtheir operations in Canada. Canadian waste management firms'operations in the U.S. market arethought to be limited totransportation of waste across theU.S.-Canadian border.
Land purchase.
Accreditation of engineers: • Market access.
• National treatment.
Accreditation of consultingengineers:• Market access.
Its GATS commitments indicatethat numerous provinces placenational treatment limitations onthe purchase of land by non-residents.
In all modes of supply exceptcommercial presence, mostprovinces require permanentresidency; Quebec requirescitizenship.
Saskatchewan requiresresidency for engineeringservices provided by cross-border supply and the presenceof natural persons.
Manitoba requires commercialpresence for services providedthrough cross-border supplyand consumption abroad.
Chile Imports in 2000 totaled $1.4 billionfor solid and hazardous wasteservices and equipment.
Three foreign-based companiesdominate the solid waste disposalservice in the Santiago MetropolitanRegion. No foreign-basedcompanies are known to operateoutside of Santiago.
Investment contingencies. Contingencies include percentof local employment forprojects and use of local inputmaterials.
8-14
Table 8-3–continuedExtent of solid and hazardous waste services trade by certain countries, and measures affecting such trade
Country Cross-border trade Foreign operationsType of measure affectingtrade/affiliate transactions Description of measure
China Minimal, though believed to be a netimporter.
Few foreign companies operate inChina’s solid and hazardous wastemanagement market.
Equity limitations.
Licensing requirements.
Land ownership.
Foreign investors limited to 50percent financial stake.
Ambiguous licensing guidelinesmake it difficult for foreignengineering firms to obtainnecessary permits except on aproject-by- project basis.
All land owned by thegovernment, which grants fee-based usage rights for setperiods. Compensation forearly repossession of land isassured by law in some casesbut is inconsistent andstandards are unclear.
Czech Republic Net importer. Czech firms primarily operatedomestically, where they competewith EU firms.
Full market access. No known restrictions.
Egypt Net importer. Several foreign-based companieshave provided various solid wastemanagement services, includingcollection and disposal of solidwaste, and consulting services fordeveloping a hazardous wastemanagement program and forprivatizing the solid wastemanagement system. No singlecompany is known to dominateEgypt’s emerging solid andhazardous waste market.
Equity limitations.
Land purchase.
Limitations apply toconstruction services.
Limitations apply to acquisitionof land for commercialpurposes.
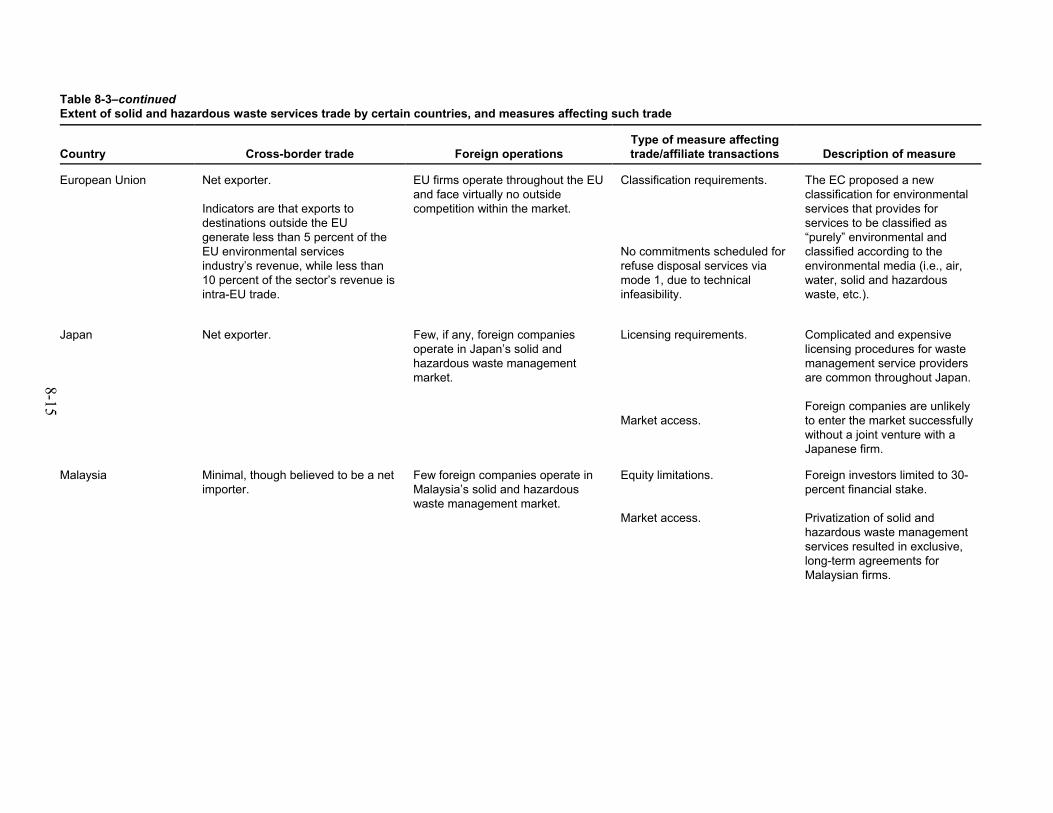
Table 8-3–continuedExtent of solid and hazardous waste services trade by certain countries, and measures affecting such trade
Country Cross-border trade Foreign operationsType of measure affectingtrade/affiliate transactions Description of measure
8-15
European Union Net exporter.
Indicators are that exports todestinations outside the EUgenerate less than 5 percent of theEU environmental servicesindustry’s revenue, while less than10 percent of the sector’s revenue isintra-EU trade.
EU firms operate throughout the EUand face virtually no outsidecompetition within the market.
Classification requirements.
No commitments scheduled forrefuse disposal services viamode 1, due to technicalinfeasibility.
The EC proposed a newclassification for environmentalservices that provides forservices to be classified as“purely” environmental andclassified according to theenvironmental media (i.e., air,water, solid and hazardouswaste, etc.).
Japan Net exporter. Few, if any, foreign companiesoperate in Japan’s solid andhazardous waste managementmarket.
Licensing requirements.
Market access.
Complicated and expensivelicensing procedures for wastemanagement service providersare common throughout Japan.
Foreign companies are unlikelyto enter the market successfullywithout a joint venture with aJapanese firm.
Malaysia Minimal, though believed to be a netimporter.
Few foreign companies operate inMalaysia’s solid and hazardouswaste management market.
Equity limitations.
Market access.
Foreign investors limited to 30-percent financial stake.
Privatization of solid andhazardous waste managementservices resulted in exclusive,long-term agreements forMalaysian firms.
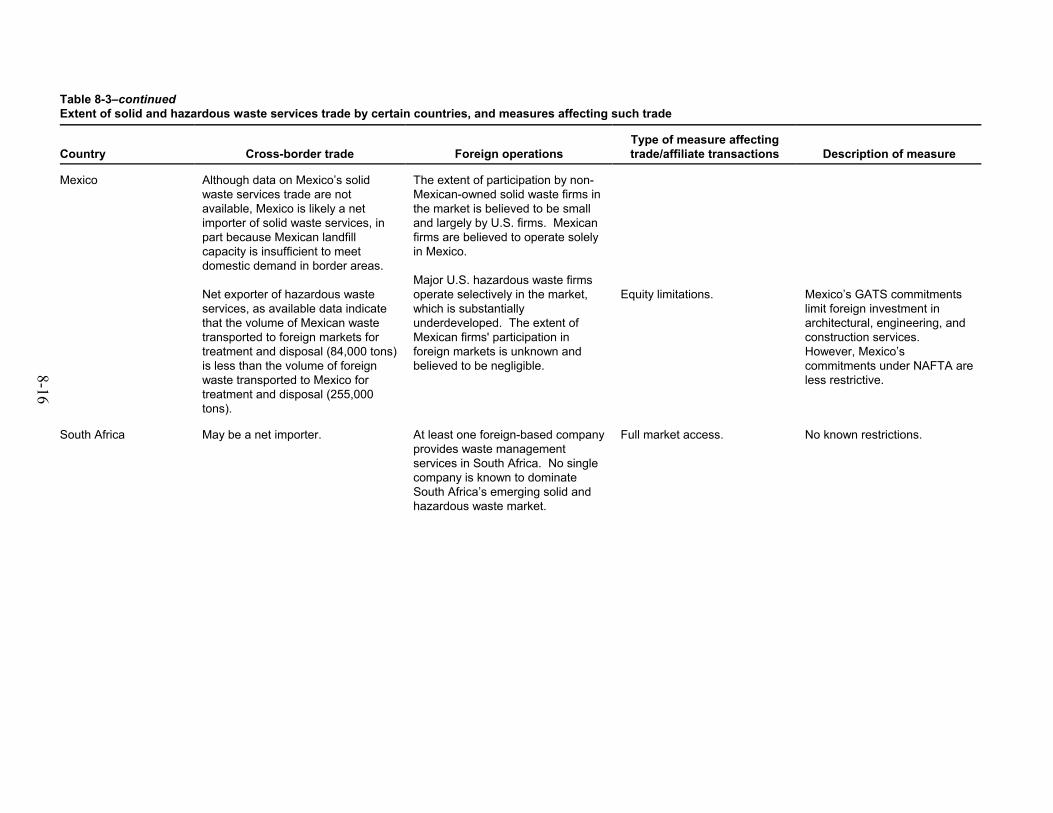
Table 8-3–continuedExtent of solid and hazardous waste services trade by certain countries, and measures affecting such trade
Country Cross-border trade Foreign operationsType of measure affectingtrade/affiliate transactions Description of measure
8-16
Mexico Although data on Mexico’s solidwaste services trade are notavailable, Mexico is likely a netimporter of solid waste services, inpart because Mexican landfillcapacity is insufficient to meetdomestic demand in border areas.
Net exporter of hazardous wasteservices, as available data indicatethat the volume of Mexican wastetransported to foreign markets fortreatment and disposal (84,000 tons)is less than the volume of foreignwaste transported to Mexico fortreatment and disposal (255,000tons).
The extent of participation by non-Mexican-owned solid waste firms inthe market is believed to be smalland largely by U.S. firms. Mexicanfirms are believed to operate solelyin Mexico.
Major U.S. hazardous waste firmsoperate selectively in the market,which is substantiallyunderdeveloped. The extent ofMexican firms' participation inforeign markets is unknown andbelieved to be negligible.
Equity limitations. Mexico’s GATS commitmentslimit foreign investment inarchitectural, engineering, andconstruction services. However, Mexico’scommitments under NAFTA areless restrictive.
South Africa May be a net importer. At least one foreign-based companyprovides waste managementservices in South Africa. No singlecompany is known to dominateSouth Africa’s emerging solid andhazardous waste market.
Full market access. No known restrictions.
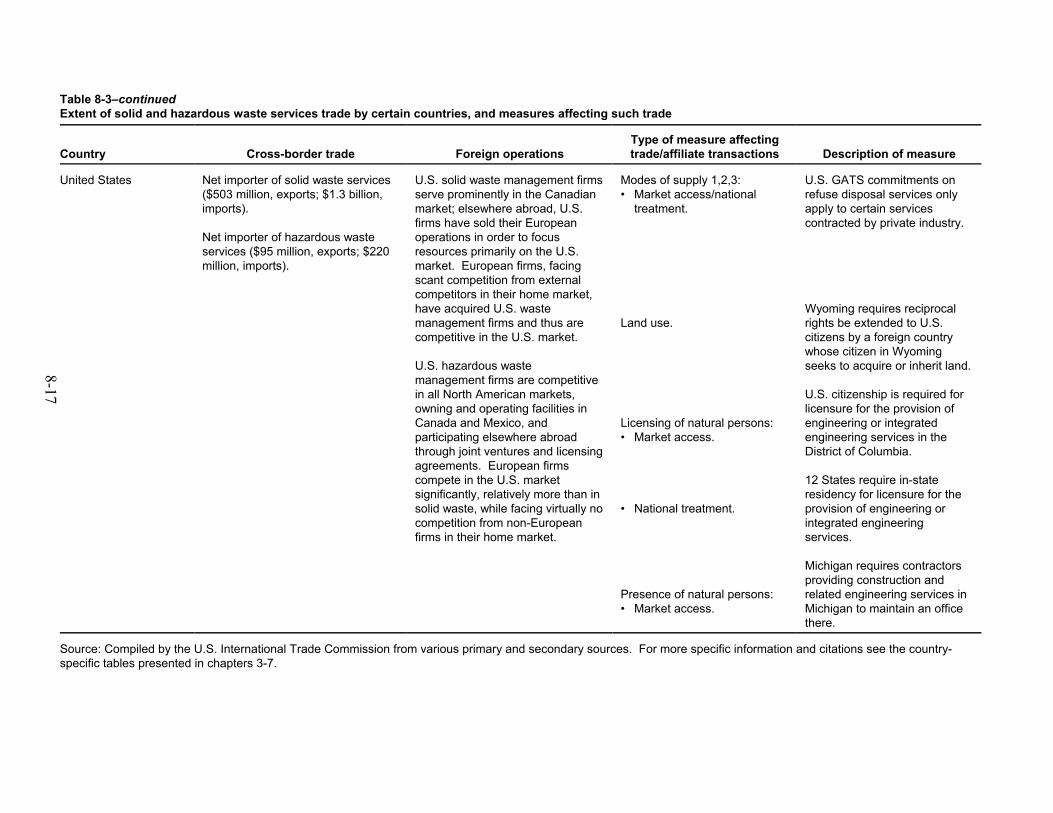
Table 8-3–continuedExtent of solid and hazardous waste services trade by certain countries, and measures affecting such trade
Country Cross-border trade Foreign operationsType of measure affectingtrade/affiliate transactions Description of measure
8-17
United States Net importer of solid waste services($503 million, exports; $1.3 billion,imports).
Net importer of hazardous wasteservices ($95 million, exports; $220million, imports).
U.S. solid waste management firmsserve prominently in the Canadianmarket; elsewhere abroad, U.S.firms have sold their Europeanoperations in order to focusresources primarily on the U.S.market. European firms, facingscant competition from externalcompetitors in their home market,have acquired U.S. wastemanagement firms and thus arecompetitive in the U.S. market.
U.S. hazardous wastemanagement firms are competitivein all North American markets,owning and operating facilities inCanada and Mexico, andparticipating elsewhere abroadthrough joint ventures and licensingagreements. European firmscompete in the U.S. marketsignificantly, relatively more than insolid waste, while facing virtually nocompetition from non-Europeanfirms in their home market.
Modes of supply 1,2,3:• Market access/national
treatment.
Land use.
Licensing of natural persons:• Market access.
• National treatment.
Presence of natural persons:• Market access.
U.S. GATS commitments onrefuse disposal services onlyapply to certain servicescontracted by private industry.
Wyoming requires reciprocalrights be extended to U.S.citizens by a foreign countrywhose citizen in Wyomingseeks to acquire or inherit land.
U.S. citizenship is required forlicensure for the provision ofengineering or integratedengineering services in theDistrict of Columbia.
12 States require in-stateresidency for licensure for theprovision of engineering orintegrated engineeringservices.
Michigan requires contractorsproviding construction andrelated engineering services inMichigan to maintain an officethere.
Source: Compiled by the U.S. International Trade Commission from various primary and secondary sources. For more specific information and citations see the country-specific tables presented in chapters 3-7.
8-18
and practices that pertain to all sectors, or to related sectors such as architecture andengineering, can potentially limit trade in the waste management industry. The most commontrade barriers maintained by developing economies are equity limitations. Specifically, China,Egypt, Malaysia, and Mexico limit the share of equity that foreign investors can hold in anygiven enterprise. Additionally, complex licensing requirements and limitations on landownership are prevalent among both developing and high-income countries.

APPENDIX AREQUEST LETTER


APPENDIX BFEDERAL REGISTER NOTICE

APPENDIX CCHOICE OF DISPOSAL METHOD: ACOMPARISON OF COUNTRY- ANDU.S. STATE-SPECIFIC DATA

1 Austria, Belgium, Denmark, France, Germany, Hungary, Japan, Korea, Luxembourg,Mexico, the Netherlands, Poland, Slovakia, Spain, Sweden, the United States, and the UnitedKingdom. 2 In making these comparisons it should be borne in mind that national definitions differ.OECD Environmental Data Compendium 2002: Waste (Paris: OECD), p. 11; and USITCcalculations. 3 OECD Environmental Data Compendium 2002, p. 9. 4 Ibid., p. 13.
C-3
Origin of Disposed Materials As mentioned above, a large share of industrial hazardous waste is generated by thechemical and petrochemical industries. MSW comes from a broader variety ofsources. In most countries, a majority of MSW is produced by households. OECDdata for the most recent year available (generally 2000) enables a comparison ofhousehold MSW as a share of total MSW for 21 countries. For 17 of thesecountries1 household MSW accounts for between 60 and 90 percent of total MSW,and for the other four (Finland, Iceland, Ireland, and Norway) household MSWaccounts for between 30 and 60 percent of total MSW.2 In most countries, the largestindividual waste stream is construction and demolition wastes, with packagingmaterials ranking second. Not all of these wastes are classified as MSW though theymay sometimes be managed in similar ways.3 Across OECD countries, organicmaterial accounts for between 20 and 52 percent of MSW; paper and paperboardaccount for between 14 and 38 percent; plastics account for between 0.5 and 13percent; glass accounts for between 3 and 13 percent; metals account for between 2and 8 percent; and textiles and other materials account for between 7 and 51percent.4
Choice of Disposal Method
Geographic Comparisons
International comparisons
Even at the high levels of income characteristic of most OECD members, the entirepopulation may not be served by municipal waste services, indicating marketopportunities for the extension of basic household and commercial service. Amongmiddle-income OECD members, the share of the population not yet served by MSWservices was 14.9 percent in Hungary (2000), 15.0 percent in Greece (1997), 16.5percent in Mexico (2000), 27.0 percent in the Russian Federation (1992), and 28.1percent in Turkey (1998).
Table C-1 provides information on the share of MSW destined for different disposalmethods across OECD member countries. The share of MSW destined for landfillsranged from 17 percent (Denmark) to a high of 100 percent (New Zealand). Countries with high landfill use (between 90-100 percent of MSW) include Hungary,Iceland, Ireland, Mexico, New Zealand, Poland, and Turkey. Countries with low
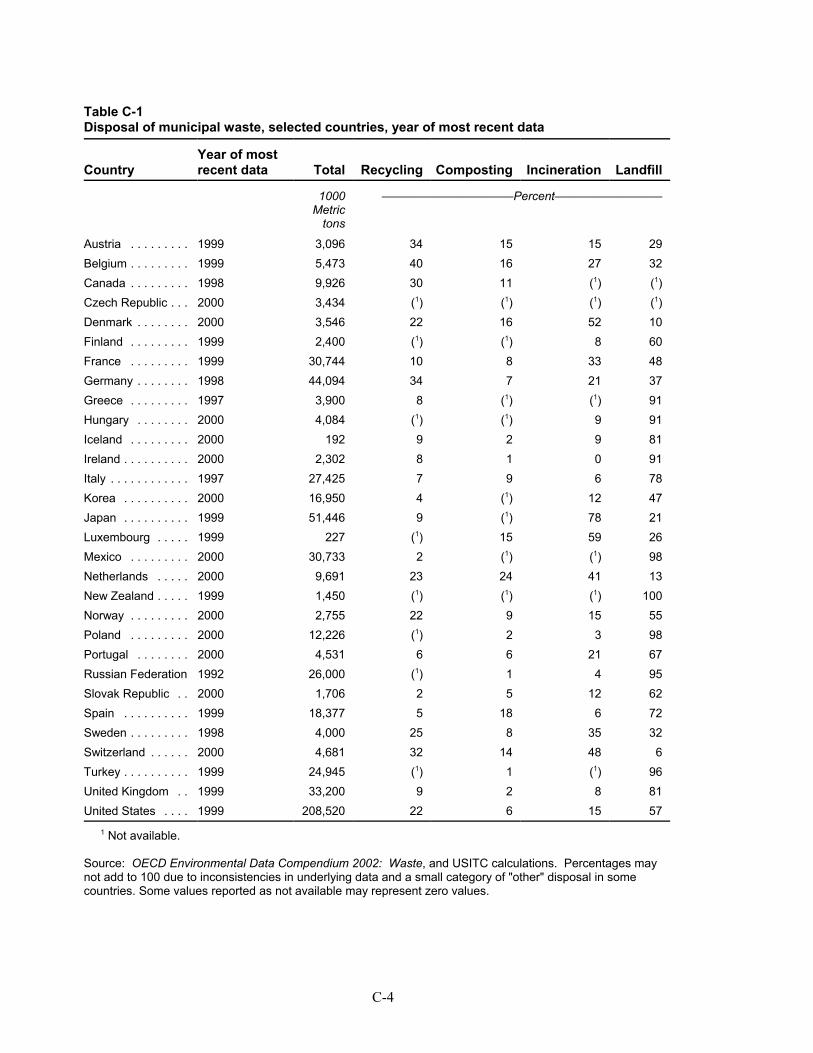
C-4
Table C-1Disposal of municipal waste, selected countries, year of most recent data
CountryYear of mostrecent data Total Recycling Composting Incineration Landfill
1000Metric
tons
———————————Percent—————————
Austria . . . . . . . . . 1999 3,096 34 15 15 29Belgium . . . . . . . . . 1999 5,473 40 16 27 32Canada . . . . . . . . . 1998 9,926 30 11 (1) (1)Czech Republic . . . 2000 3,434 (1) (1) (1) (1)Denmark . . . . . . . . 2000 3,546 22 16 52 10Finland . . . . . . . . . 1999 2,400 (1) (1) 8 60France . . . . . . . . . 1999 30,744 10 8 33 48Germany . . . . . . . . 1998 44,094 34 7 21 37Greece . . . . . . . . . 1997 3,900 8 (1) (1) 91Hungary . . . . . . . . 2000 4,084 (1) (1) 9 91Iceland . . . . . . . . . 2000 192 9 2 9 81Ireland . . . . . . . . . . 2000 2,302 8 1 0 91Italy . . . . . . . . . . . . 1997 27,425 7 9 6 78Korea . . . . . . . . . . 2000 16,950 4 (1) 12 47Japan . . . . . . . . . . 1999 51,446 9 (1) 78 21Luxembourg . . . . . 1999 227 (1) 15 59 26Mexico . . . . . . . . . 2000 30,733 2 (1) (1) 98Netherlands . . . . . 2000 9,691 23 24 41 13New Zealand . . . . . 1999 1,450 (1) (1) (1) 100Norway . . . . . . . . . 2000 2,755 22 9 15 55Poland . . . . . . . . . 2000 12,226 (1) 2 3 98Portugal . . . . . . . . 2000 4,531 6 6 21 67Russian Federation 1992 26,000 (1) 1 4 95Slovak Republic . . 2000 1,706 2 5 12 62Spain . . . . . . . . . . 1999 18,377 5 18 6 72Sweden . . . . . . . . . 1998 4,000 25 8 35 32Switzerland . . . . . . 2000 4,681 32 14 48 6Turkey . . . . . . . . . . 1999 24,945 (1) 1 (1) 96United Kingdom . . 1999 33,200 9 2 8 81United States . . . . 1999 208,520 22 6 15 57
1 Not available.
Source: OECD Environmental Data Compendium 2002: Waste, and USITC calculations. Percentages maynot add to 100 due to inconsistencies in underlying data and a small category of "other" disposal in somecountries. Some values reported as not available may represent zero values.
5 Ibid., p. 14; and USITC calculations. 6 This compares to Biocycle’s estimate for the United States of 61 percent landfilled, 31percent recycled or composted, and 7 percent incinerated in 2001. “The State of Garbage inAmerica,” Biocycle, vol. 42, No. 12, Dec. 2001, p. 43. 7 OECD Environmental Data 2002: Waste, p. 14; and USITC calculations. 8 “The State of Garbage in America,” p. 45.
C-5
landfill use (between 17-39 percent of MSW) include Denmark, Japan, Luxembourg,the Netherlands, and Sweden. Incineration is particularly prevalent where land isscarce, with the share of total MSW incinerated reaching 78 percent in Japan, 59percent in Luxembourg, 52 percent in Denmark, and 48 percent in Switzerland. Thereported recycling rate is over one-third of total MSW in Austria, Belgium, andGermany, and less than 10 percent in Iceland, Ireland, Korea, Mexico, Portugal, andthe United Kingdom.5 The United States ranks near the middle in terms of the shareof its MSW that is landfilled (57 percent), recycled (22 percent), composted (6percent), and incinerated (15 percent).6 However, the total quantity of MSWlandfilled in the United States, as measured in metric tons, is four times larger than inJapan, the OECD runner-up in this category.7
Figures C-1 through C-3 show the relationship among the shares of MSW disposedof by landfilling, incineration, and recycling for OECD countries, using data for 2000or the most recent year available. Figure C-1 shows that less densely populatedcountries are more likely to rely on landfilling, while Figure C-2 shows that moredensely populated countries are more likely to rely on incineration.
Figure C-3 shows that there is no apparent relationship between population densityand the recycling rate, which may in part be due to the definition of recycling beingless standardized between countries than for the other methods of disposal.
In the United States State-level U.S. data for 2001 confirm the general pattern that incineration tends to beused in land-scarce jurisdictions, while landfills dominate in land-rich jurisdictions. Landfills account for over 85 percent of MSW disposal in Colorado, Kansas, Nevada,New Mexico, North Dakota, Oklahoma, Utah, and Wyoming. Incineration ratesreach a maximum of 79 percent in the District of Colombia and 65 percent inConnecticut, while Hawaii, Maine, Maryland, Massachusetts, and Minnesota eachincinerate between 20 and 50 percent of MSW. Bearing in mind definitionaldifferences, reported recycling rates reach a level of 59 percent in Delaware andbetween 40 and 50 percent in Arkansas, California, Maine, Minnesota, and NewYork. 8
A comparison of U.S. data on tipping fees, which provide a direct measure of landfilldemand relative to supply, reinforces the positive relationship between landfill
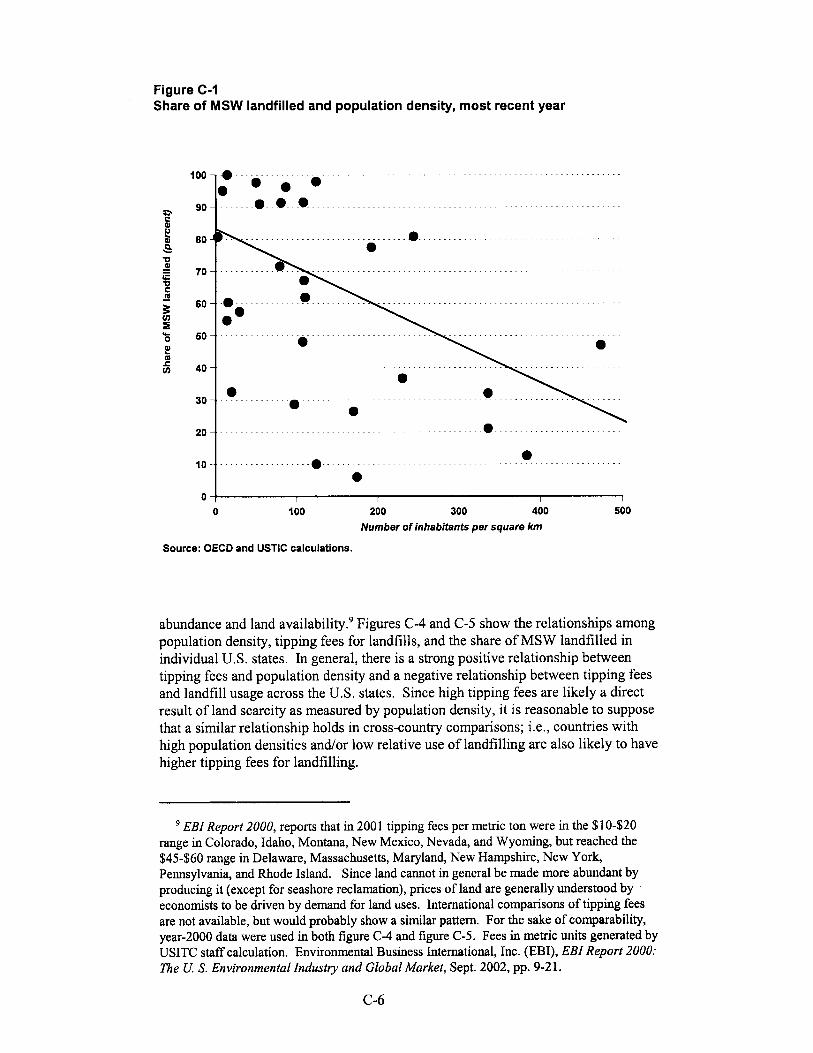
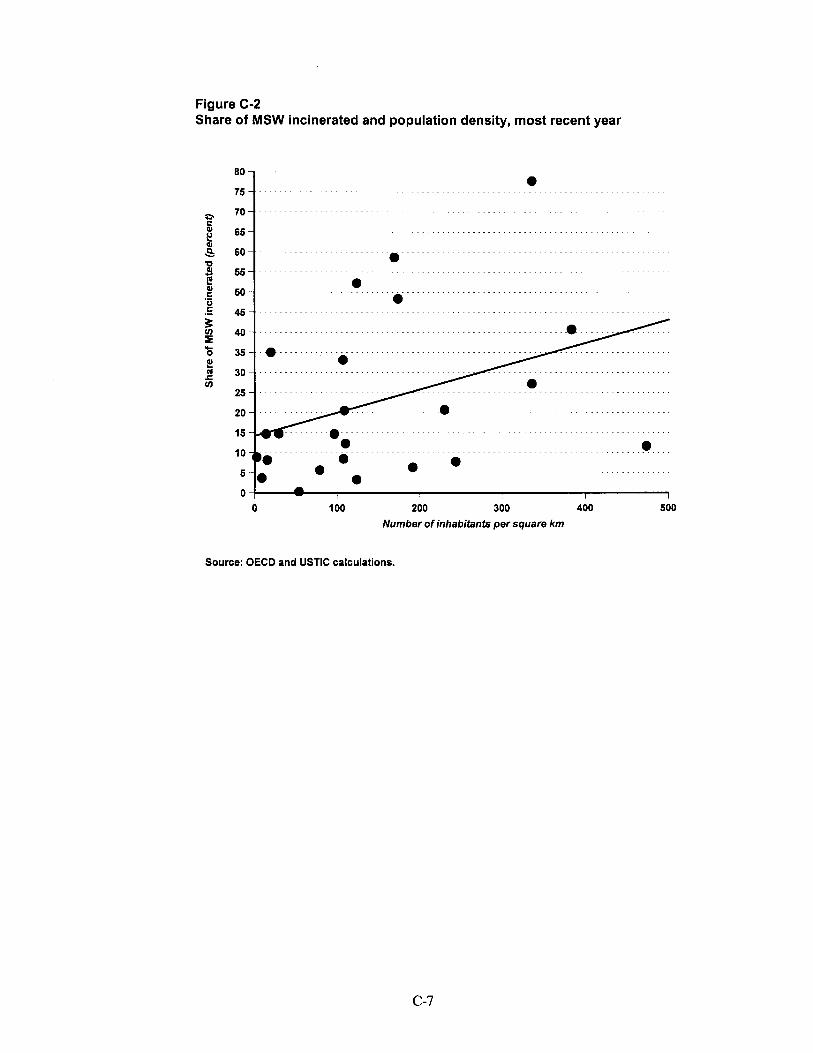
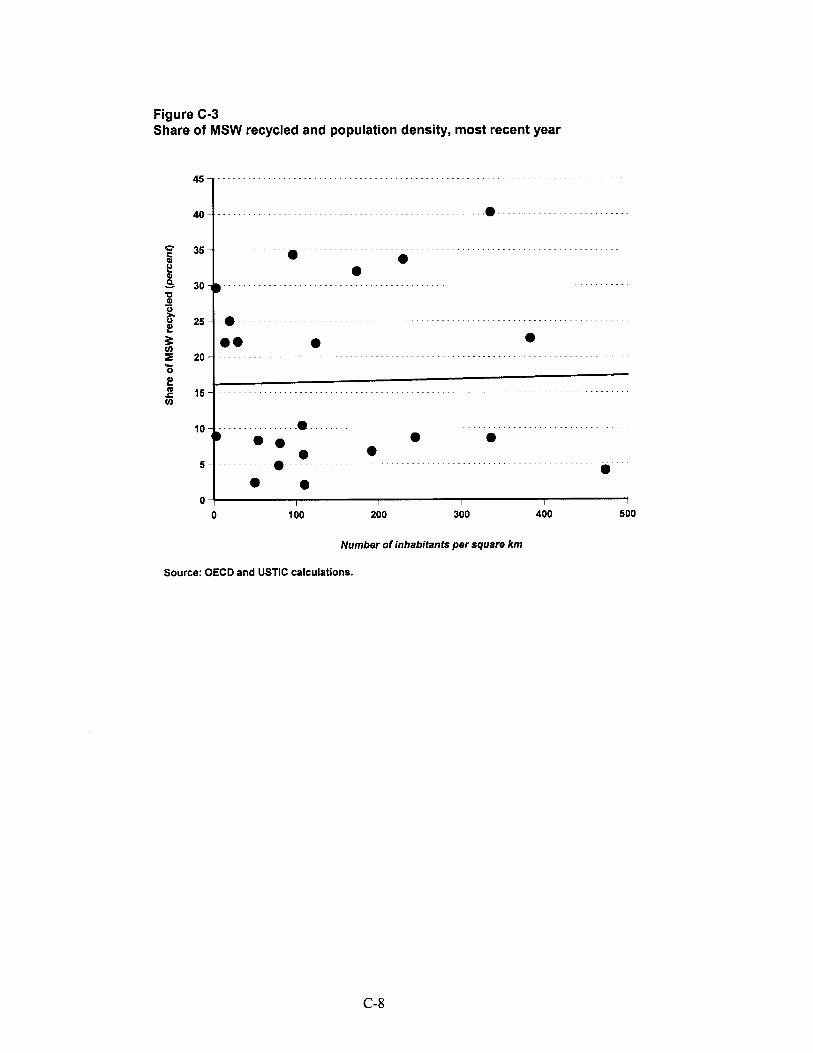
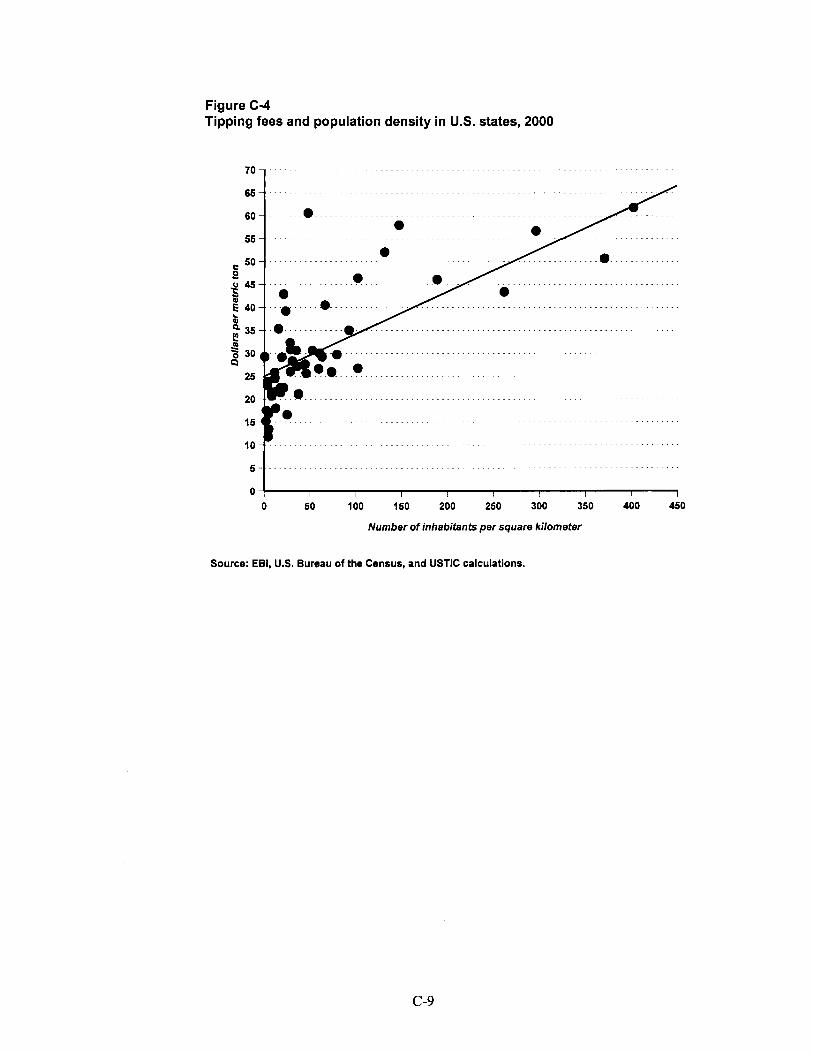
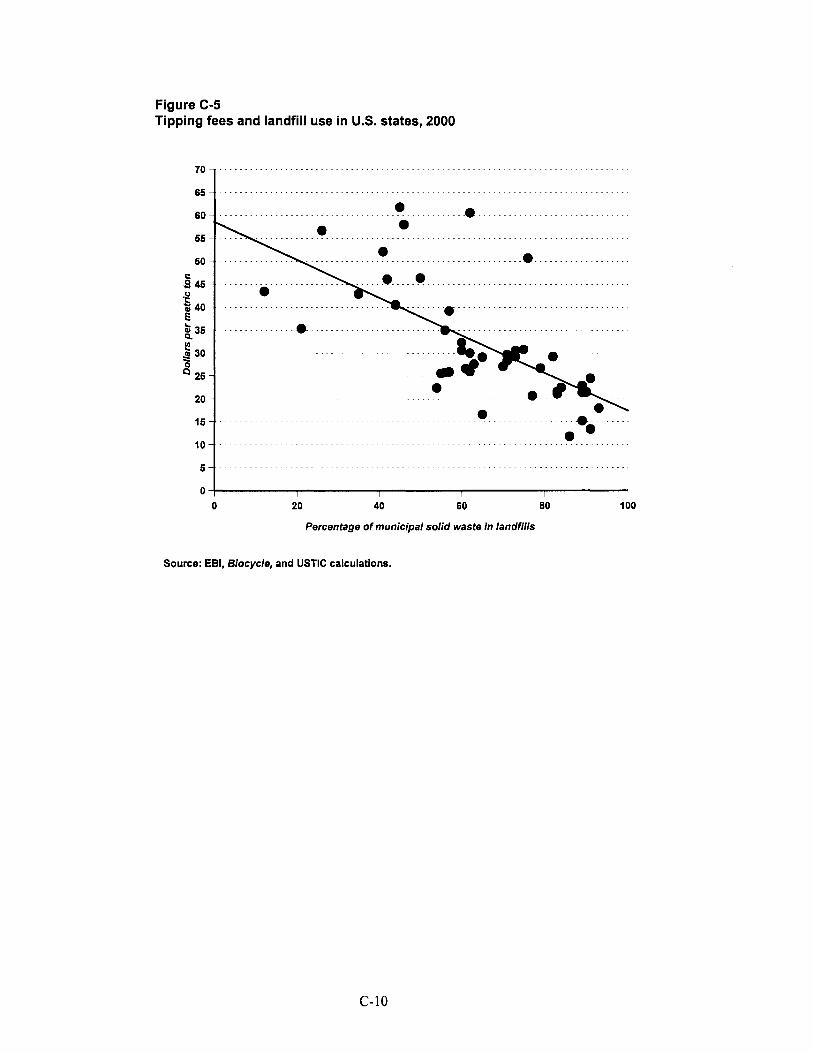
APPENDIX DSOLID AND HAZARDOUS WASTESERVICES IN THE GENERALAGREEMENT ON TRADE INSERVICES (GATS)

1 Under a “positive-list” agreement, members are only bound by those commitments thatthey specifically list within their schedules which comprise part of the agreement. Bycontrast, a “negative-list” agreement binds member countries to all provisions covered by theagreement unless otherwise specified. 2 World Trade Organization (WTO), “Services Sectoral Classification List,”MTN.GNS/W/120, July 10, 1991. 3 WTO, “Background Note by the Secretariat,” S/C/W/46, July 6, 1998, footnote 6, page 2. 4 One of four possible modes of delivering services to foreign consumers, whereby theconsumer, or the consumer’s property, receives a service outside the territory of the homecountry, either by moving or being situated abroad. 5 One of the four possible modes of delivering services to foreign consumers, whereby aservice supplier establishes any type of business or professional establishment in the foreignmarket. Commercial presence comprises entities such as corporations, trusts, joint ventures,partnerships, sole proprietorships, associations, representative offices, and branches.
D-3
The General Agreement on Trade in Services (GATS) was signed in April of 1994 andentered into force in January of 1995. The GATS is the first multilateral, legallyenforceable agreement covering trade and investment in the service sector. Modeledafter the agreement on goods, the GATS is a “positive-list” agreement1 which bindssignatories to provide foreign firms with market access and nondiscriminatorytreatment, subject to defined exemptions. The primary purpose of the agreement is toreduce or eliminate measures that prevent services from being provided across bordersor that discriminate against locally established service providers with foreignownership. The agreement is organized in four parts: the main text containing generalprinciples and obligations; annexes dealing with rules for specific sectors; individualcountries’ specific commitments; and lists indicating temporary exemptions from themost-favored-nation principle of nondiscrimination.
Country-Specific CommitmentsCountry-specific commitments typically are organized based on the Services SectoralClassification List,2 which organizes services industries into 12 broad sectoralcategories and provides corresponding numbers from the United Nations ProvisionalCentral Product Classification (CPC). Under this classification scheme, theenvironmental services sector includes four subsectors: sewage services (CPC 9401);refuse disposal services (CPC 9402); sanitation and similar services (CPC 9403); andother environmental services, which are generally presumed to include cleaning ofexhaust gasses (CPC 9404), noise abatement (CPC 9405), nature and landscapingprotection services (CPC 9406), and other environmental services (CPC 9409). Wastemanagement services, excluding the sale of wastes, are captured in the “RefuseDisposal Services” subcategory, which the World Trade Organization (WTO) definesas “...services to collect, transport, treat and dispose of waste from homes,municipalities, commercial establishments and manufacturing plants.”3
Fifty-one countries have scheduled specific commitments in the environmentalservices sector, and 43 countries have scheduled commitments on refuse disposalservices. Of these, 29 countries have scheduled commitments granting full marketaccess and national treatment to foreign service suppliers that provide refuse disposalservices through consumption abroad (mode 2)4 or a commercial presence (mode 3)5
(table D-1). Limitations listed by the remaining 14 countries include, inter alia,
6 One of four possible modes of delivering services to foreign consumers, whereby theservice is transported beyond the home country of the services supplier to the foreignconsumer. Cross-border supply may entail transportation by mail, telecommunications, or thephysical movement of merchandise embodying service (e.g., a diskette storing information)from one country to another. The mode is “cross-border” when the service supplier is notpresent within the territory where the service is delivered. 7 One of four possible modes of delivering services to foreign consumers, whereby oneindividual, acting alone or as an employee of a service supplier, provides a service whilepresent in a foreign market. 8 Article XIX of the GATS requires WTO member economies to initiate a new round ofservices negotiations no later than five years after the entry into force of the WTO agreement. 9 WTO, “List of 2000 Service Proposals,” found at Internet addresshttp://www.wto.org/english/tratop_e/serv_e/s_propnewnegs_e.htm/, retrieved July 14, 2003.
D-4
licensing restrictions, provisions requiring approval for the establishment of acommercial presence, a provision requiring foreign firms to form a joint venture(listed in China’s schedule), and a measure limiting foreign equity participation in therefuse disposal sector to 49 percent (listed in Thailand’s schedule). Several membercountries have not scheduled bindings on refuse disposal services provided throughcross-border supply (mode 1)6 as they consider such transactions technicallyinfeasible, and most measures regarding the supply of services through the presence ofnatural persons (mode 4)7 are addressed in a member country’s horizontalcommitments.
With regard to scope, 29 countries have scheduled commitments that cover the fullrange of services in the refuse disposal sector. Among the countries that committed topartial coverage of the sector, eight countries include an overall exemption limitingtheir refuse disposal commitments to services supplied and/or purchased by privateentities. Provisions that limit the range of activities covered under refuse disposalcommitments also appear in eight schedules of commitments. For example, bothLesotho and South Africa indicate that their refuse disposal commitments apply onlyto consultancy services.
Current GATS NegotiationsIn keeping with Article XIX of the GATS,8 a new round of services negotiationsbegan in January 2000. WTO Member economies submitted over 100 negotiatingproposals to the GATS Council for Trade in Services,9 in preparation for thenegotiations. In these proposals, member economies outlined their positions regardingspecific service sectors and various issues that affect multiple service sectors, such astransparency and autonomous liberalization. The negotiations themselves, which arecurrently underway, are being conducted through a request-offer approach. Under thisapproach, WTO Member economies have submitted initial requests, formally askingother WTO Members to make specific changes to their schedules of commitments. Following the receipt of these requests, WTO Members submitted initial offers. Thesenonbinding offers are presented in redline-strikeout format, illustrating the changesthat member economies may be willing to make in their schedules of commitments inresponse to other members’ requests.
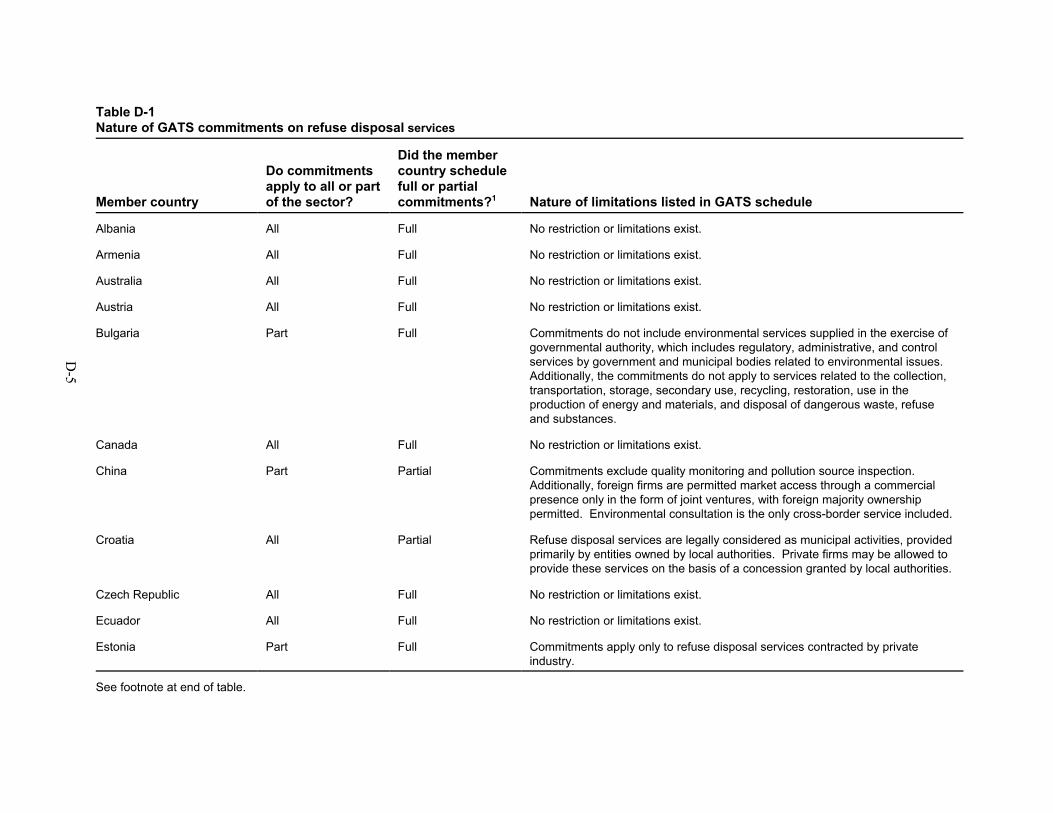
D-5
Table D-1Nature of GATS commitments on refuse disposal services
Member country
Do commitmentsapply to all or partof the sector?
Did the membercountry schedulefull or partialcommitments?1 Nature of limitations listed in GATS schedule
Albania All Full No restriction or limitations exist.
Armenia All Full No restriction or limitations exist.
Australia All Full No restriction or limitations exist.
Austria All Full No restriction or limitations exist.
Bulgaria Part Full Commitments do not include environmental services supplied in the exercise ofgovernmental authority, which includes regulatory, administrative, and controlservices by government and municipal bodies related to environmental issues. Additionally, the commitments do not apply to services related to the collection,transportation, storage, secondary use, recycling, restoration, use in theproduction of energy and materials, and disposal of dangerous waste, refuseand substances.
Canada All Full No restriction or limitations exist.
China Part Partial Commitments exclude quality monitoring and pollution source inspection.Additionally, foreign firms are permitted market access through a commercialpresence only in the form of joint ventures, with foreign majority ownershippermitted. Environmental consultation is the only cross-border service included.
Croatia All Partial Refuse disposal services are legally considered as municipal activities, providedprimarily by entities owned by local authorities. Private firms may be allowed toprovide these services on the basis of a concession granted by local authorities.
Czech Republic All Full No restriction or limitations exist.
Ecuador All Full No restriction or limitations exist.
Estonia Part Full Commitments apply only to refuse disposal services contracted by privateindustry.
See footnote at end of table.
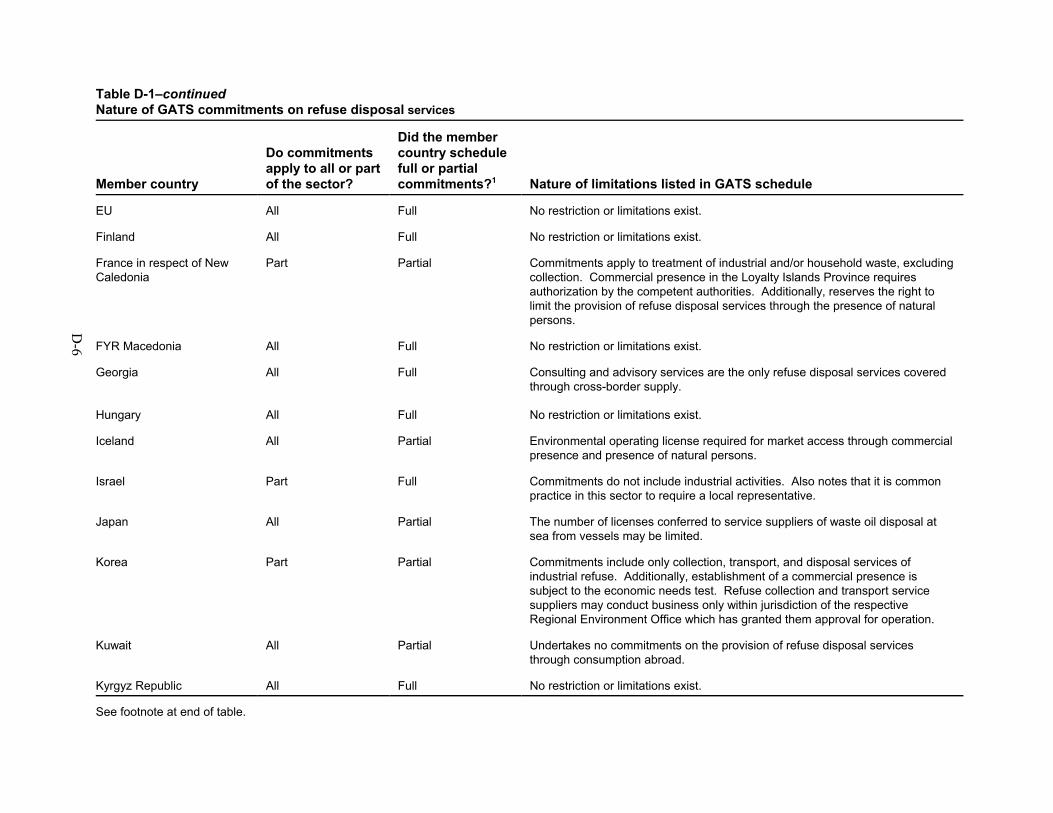
D-6
Table D-1–continuedNature of GATS commitments on refuse disposal services
Member country
Do commitmentsapply to all or partof the sector?
Did the membercountry schedulefull or partialcommitments?1 Nature of limitations listed in GATS schedule
EU All Full No restriction or limitations exist.
Finland All Full No restriction or limitations exist.
France in respect of NewCaledonia
Part Partial Commitments apply to treatment of industrial and/or household waste, excludingcollection. Commercial presence in the Loyalty Islands Province requiresauthorization by the competent authorities. Additionally, reserves the right tolimit the provision of refuse disposal services through the presence of naturalpersons.
FYR Macedonia All Full No restriction or limitations exist.
Georgia All Full Consulting and advisory services are the only refuse disposal services coveredthrough cross-border supply.
Hungary All Full No restriction or limitations exist.
Iceland All Partial Environmental operating license required for market access through commercialpresence and presence of natural persons.
Israel Part Full Commitments do not include industrial activities. Also notes that it is commonpractice in this sector to require a local representative.
Japan All Partial The number of licenses conferred to service suppliers of waste oil disposal atsea from vessels may be limited.
Korea Part Partial Commitments include only collection, transport, and disposal services ofindustrial refuse. Additionally, establishment of a commercial presence issubject to the economic needs test. Refuse collection and transport servicesuppliers may conduct business only within jurisdiction of the respectiveRegional Environment Office which has granted them approval for operation.
Kuwait All Partial Undertakes no commitments on the provision of refuse disposal servicesthrough consumption abroad.
Kyrgyz Republic All Full No restriction or limitations exist.
See footnote at end of table.
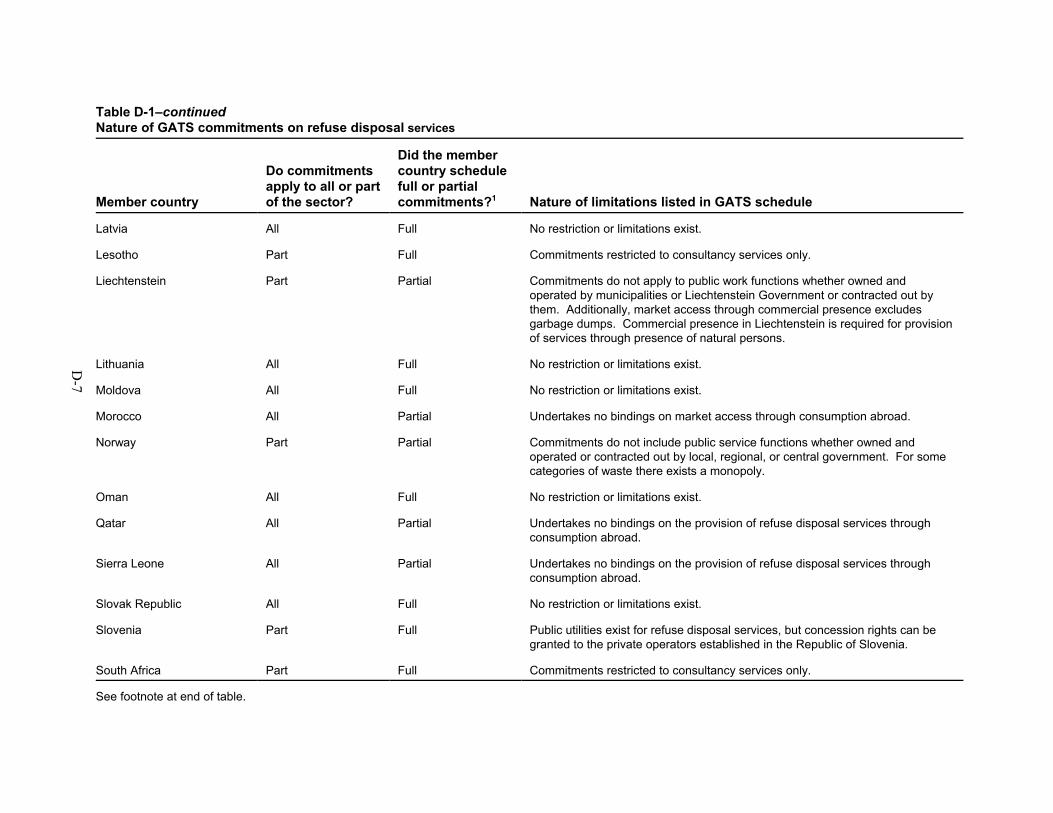
Table D-1–continuedNature of GATS commitments on refuse disposal services
Member country
Do commitmentsapply to all or partof the sector?
Did the membercountry schedulefull or partialcommitments?1 Nature of limitations listed in GATS schedule
D-7
Latvia All Full No restriction or limitations exist.
Lesotho Part Full Commitments restricted to consultancy services only.
Liechtenstein Part Partial Commitments do not apply to public work functions whether owned andoperated by municipalities or Liechtenstein Government or contracted out bythem. Additionally, market access through commercial presence excludesgarbage dumps. Commercial presence in Liechtenstein is required for provisionof services through presence of natural persons.
Lithuania All Full No restriction or limitations exist.
Moldova All Full No restriction or limitations exist.
Morocco All Partial Undertakes no bindings on market access through consumption abroad.
Norway Part Partial Commitments do not include public service functions whether owned andoperated or contracted out by local, regional, or central government. For somecategories of waste there exists a monopoly.
Oman All Full No restriction or limitations exist.
Qatar All Partial Undertakes no bindings on the provision of refuse disposal services throughconsumption abroad.
Sierra Leone All Partial Undertakes no bindings on the provision of refuse disposal services throughconsumption abroad.
Slovak Republic All Full No restriction or limitations exist.
Slovenia Part Full Public utilities exist for refuse disposal services, but concession rights can begranted to the private operators established in the Republic of Slovenia.
South Africa Part Full Commitments restricted to consultancy services only.
See footnote at end of table.
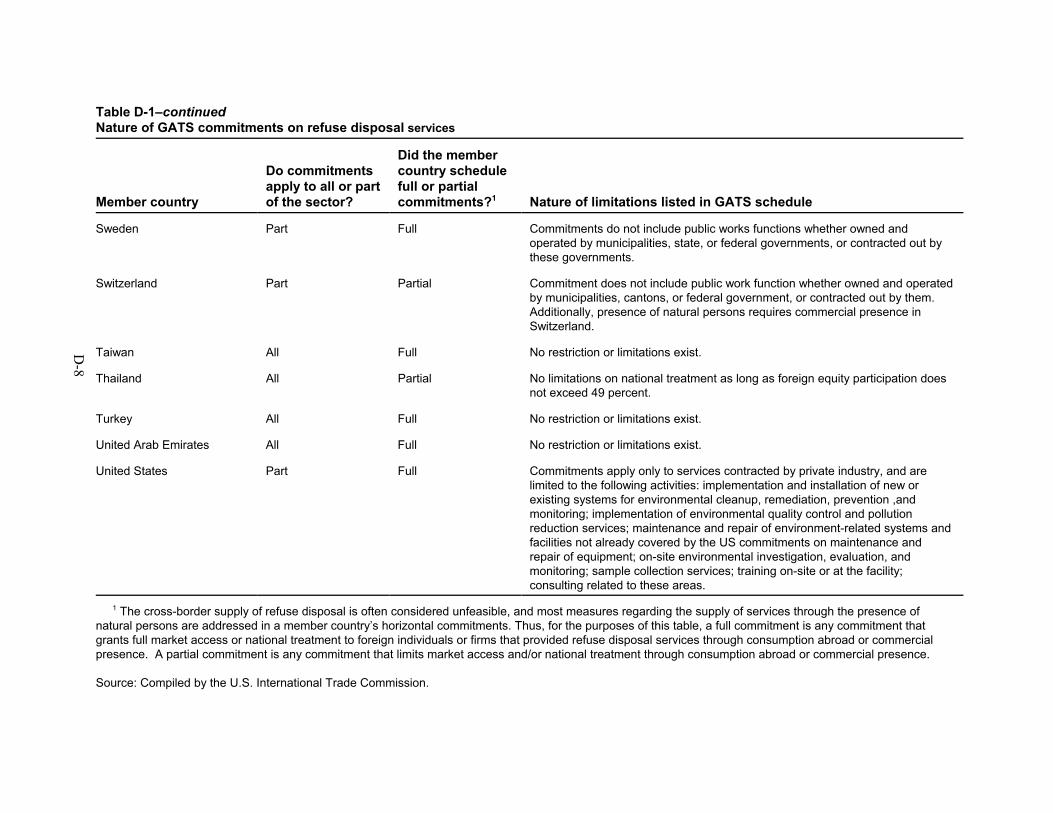
Table D-1–continuedNature of GATS commitments on refuse disposal services
Member country
Do commitmentsapply to all or partof the sector?
Did the membercountry schedulefull or partialcommitments?1 Nature of limitations listed in GATS schedule
D-8
Sweden Part Full Commitments do not include public works functions whether owned andoperated by municipalities, state, or federal governments, or contracted out bythese governments.
Switzerland Part Partial Commitment does not include public work function whether owned and operatedby municipalities, cantons, or federal government, or contracted out by them. Additionally, presence of natural persons requires commercial presence inSwitzerland.
Taiwan All Full No restriction or limitations exist.
Thailand All Partial No limitations on national treatment as long as foreign equity participation doesnot exceed 49 percent.
Turkey All Full No restriction or limitations exist.
United Arab Emirates All Full No restriction or limitations exist.
United States Part Full Commitments apply only to services contracted by private industry, and arelimited to the following activities: implementation and installation of new orexisting systems for environmental cleanup, remediation, prevention ,andmonitoring; implementation of environmental quality control and pollutionreduction services; maintenance and repair of environment-related systems andfacilities not already covered by the US commitments on maintenance andrepair of equipment; on-site environmental investigation, evaluation, andmonitoring; sample collection services; training on-site or at the facility;consulting related to these areas.
1 The cross-border supply of refuse disposal is often considered unfeasible, and most measures regarding the supply of services through the presence ofnatural persons are addressed in a member country’s horizontal commitments. Thus, for the purposes of this table, a full commitment is any commitment thatgrants full market access or national treatment to foreign individuals or firms that provided refuse disposal services through consumption abroad or commercialpresence. A partial commitment is any commitment that limits market access and/or national treatment through consumption abroad or commercial presence.
Source: Compiled by the U.S. International Trade Commission.
10 WTO, “Communication from Australia, Negotiating Proposal for EnvironmentalServices,” S/CSS/W/112, Oct. 1, 2001; “Communication from Canada, Initial NegotiatingProposal on Environmental Services,” S/CSS/W/51, Mar. 14, 2001; “Communication fromColombia: Environmental Services,” S/CSS/W/12, Nov. 27, 2001; “Communication fromCuba, Negotiating Proposal on Environmental Services,” S/CSS/W/142, Mar. 22, 2002;“Communication from the European Communities and their Member States, GATS 2000:Environmental Services,” S/CSS/W/38, Dec. 22, 2000; “Communication from Switzerland,GATS 2000: Environmental Services,” S/CSS/W/76, May 4, 2001; and “Communication fromthe United States, Environmental Services,” S/CSS/W/25, Dec. 18, 2000, all found at Internetaddress http://www.wto.org/, retrieved June 20, 2003. 11 The proposal submitted by Cuba does not address classification issues.
D-9
The environmental services sector, including the solid and hazardous waste servicessegment, is one of many industries under discussion in the ongoing WTO servicesnegotiations. This section discusses environmental services proposals submitted to theWTO, provides an overview of initial requests and offers that specifically address therefuse disposal segment, and presents a general overview of the current status of WTOservices negotiations.
Environmental Services Submissions
Australia, Canada, Colombia, Cuba, the European Union (EU), Switzerland, and theUnited States have submitted negotiating proposals on environmental services.10 These proposals focus primarily on the environmental services sector as a whole,though refuse disposal services are specifically mentioned in certain proposals withrespect to classification issues. Only Australia’s proposal includes a specific referenceto refuse disposal services (landfills) when listing barriers to trade. Six proposals11
suggest that the current WTO classification of the environmental services sector doesnot adequately cover all activities of the industry. Nearly identical proposals from theEU and Switzerland include modifications to the current environmental servicesclassifications, as well as the addition of a specific list of related services - such asconstruction, engineering, and research and development. Among other changes, theproposals suggest combining refuse disposal services (CPC 9402, currentlycategorized as 6B) with sanitation and similar services (CPC 9403, currentlycategorized as 6C) to create a broader category 6B entitled solid/hazardous wastemanagement. Australia endorses the EU/Switzerland approach, but does notspecifically list services that should be addressed within these negotiations. Colombiaalso favors the EU classification and proposes that environmental impact assessment,monitoring, and auditing, as well as the design of environmental technologies, beincluded. The United States and Canada propose the consideration of both coreenvironmental services, consisting primarily of the currently classified environmentalservices sectors, and an expansion to include environmentally related services,although neither proposes a specific list of such related services.
The principal objective of the proposals submitted by Australia, Canada, the EU,Switzerland, and the United States is the reduction and removal of barriers to trade inenvironmental services. Each paper supports the liberalization of a similar list of tradeimpediments, including restrictions on the provision of services through a foreign-invested commercial presence (mentioned in all five papers), limitations on thetemporary entry and stay of foreign personnel (included in papers submitted byCanada, the EU, Switzerland, and the United States), and a lack of regulatory
12 United States Trade Representative (USTR), “U.S. Proposals for Liberalizing Trade inServices: Executive Summary,” press release, July 1, 2002, found at Internet addresshttp://www.ustr.gov/, retrieved Oct. 23, 2003. 13 European Commission (EC), “Summary of the EC’s Initial Requests to Third Countriesin the GATS Negotiations,” July 1, 2002, found at Internet address http://europa.eu.int/,retrieved Oct. 27, 2003.
D-10
transparency (included in papers submitted by Australia, Canada, the EU, and theUnited States). The EU and Switzerland also propose the liberalization of barriersrelating to the provision of environmental services through cross-border supply orconsumption abroad. Each of these papers recognizes that some of these objectives,such as increased transparency and reduction of certain restrictions on commercialpresence, will require liberalization of those trade measures that apply to serviceproviders in all industry sectors.
The proposal from Colombia indicates that the commercial presence of foreignenterprises in the provision of environmental services may be beneficial fordeveloping countries, and commitments should be evaluated based on the membercountry’s level of economic development. In addition, the paper proposes thatmember countries evaluate the professional qualification of foreign service providersusing the same criteria applied to domestic service providers. The proposal submittedby Cuba also focuses on the interests of developing countries, indicating that suchcountries should be able to engage in environmental services trade liberalization onterms that will enable them to realize the benefits of such liberalization.
Requests for Commitments on Refuse Disposal Services
Paragraph 15 of the Doha Development Agenda established a schedule for the initialrequest-offer phase of the services negotiations. According to this schedule, WTOMember countries were asked to submit their first specific requests of other membercountries by June 30, 2002. These requests are not publically available. However,summaries issued by several countries indicate that there have been a number ofrequests on the environmental services sector as a whole, and on solid and hazardouswaste services specifically. For example, a summary of the U.S. requests indicatesthat the United States has asked other WTO member countries to liberalize a numberof environmental services segments, including solid and hazardous wastemanagement.12 The EU states that it has requested the elimination of restrictive anddiscriminatory measures facing EU providers of environmental services. The EUsummary also indicates that EU requests are modeled after the environmental servicesclassification included in its proposal (see above), which lists waste managementservices among other environmental services activities.13 Canada defines theenvironmental services sector to include several activities, such as refuse disposal
14 “Description of Requests Presented by Canada to its WTO Partners,” Mar. 31, 2003,found at Internet address http://strategis.ic.gc.ca/, retrieved Oct. 27, 2003. 15 Ministry of Foreign Affairs (MOFA), “WTO Services Trade Negotiations Submission ofInitial Requests,” June 2002, found at Internet address http://www.mofa.go.jp/, retrieved Oct.27, 2003. 16 WTO, “Services: Negotiations, The New Negotiations,” found at Internet addresshttp://www.wto.org/, retrieved Nov. 17, 2003. 17 WTO, “Report of the Meeting Held on 19-22 May 2003,” June 30, 2003, p. 30, and“Report of the Meeting Held on 4 and 10 July and 3 September 2003,” Sept. 29, 2003, p. 40,found at Internet address http://www.wto.org/, retrieved Nov. 18, 2003.
D-11
services, and indicates that it has requested the elimination of local partnership andlicensing requirements.14 Further, Japan’s summary states that it has made requests onall environmental services subsectors.15
Offers Regarding Refuse Disposal Services
Paragraph 15 of the Doha Development Agenda established March 31, 2003 as thedue date for the submission of initial services offers. As of October 30, 2003, 39economies had submitted offers to the WTO,16 and 12 of these offers had beenderestricted and made available to the public. Among the 12 economies thatsubmitted derestricted offers, only a small number have proposed substantial changesto their commitments on refuse disposal services (table D-2), largely due to the factthat many of these economies had already undertaken substantial bindings on refusedisposal services during the Uruguay Round. Although six of these economies choseto recast their Uruguay Round commitments using the classification scheme outlinedin the EU proposal, none of the derestricted offers proposed substantive changes to thescope of refuse disposal commitments scheduled during the Uruguay Round. This ispartially due to the fact that five of these derestricted offers were submitted byeconomies that had already made Uruguay Round commitments on the entire refusedisposal category.
With regard to the content of the commitments themselves, six of the economies thatsubmitted publically available offers already maintain full commitments on theprovision of refuse disposal services through modes 2 and 3, and thus, did not proposesignificant liberalization in their offers. This includes the European Union, whichmade some minor alterations to its mode 4 commitments on refuse disposal services. Four of the publically available offers do propose some measure of liberalization inthe refuse disposal segment. New Zealand, which did not schedule any commitmentson refuse disposal services during the Uruguay Round, is proposing to schedule fullcommitments on consultancy services related to refuse disposal. Moreover, the offerssubmitted by Iceland, Japan, and Norway propose to eliminate certain restrictionsaffecting the provision of refuse disposal services through mode 3 or 4. Chilesubmitted the only publically available offer that neither contained Uruguay Roundcommitments on refuse disposal services nor offered to schedule commitments on thisindustry segment during the current negotiating round.
Minutes from recent meetings of the WTO Council for Trade in Services suggest thatat least two additional countries– Mexico and the Slovak Republic– have submittedoffers on the environmental services sector.17 However, the minutes do not provide
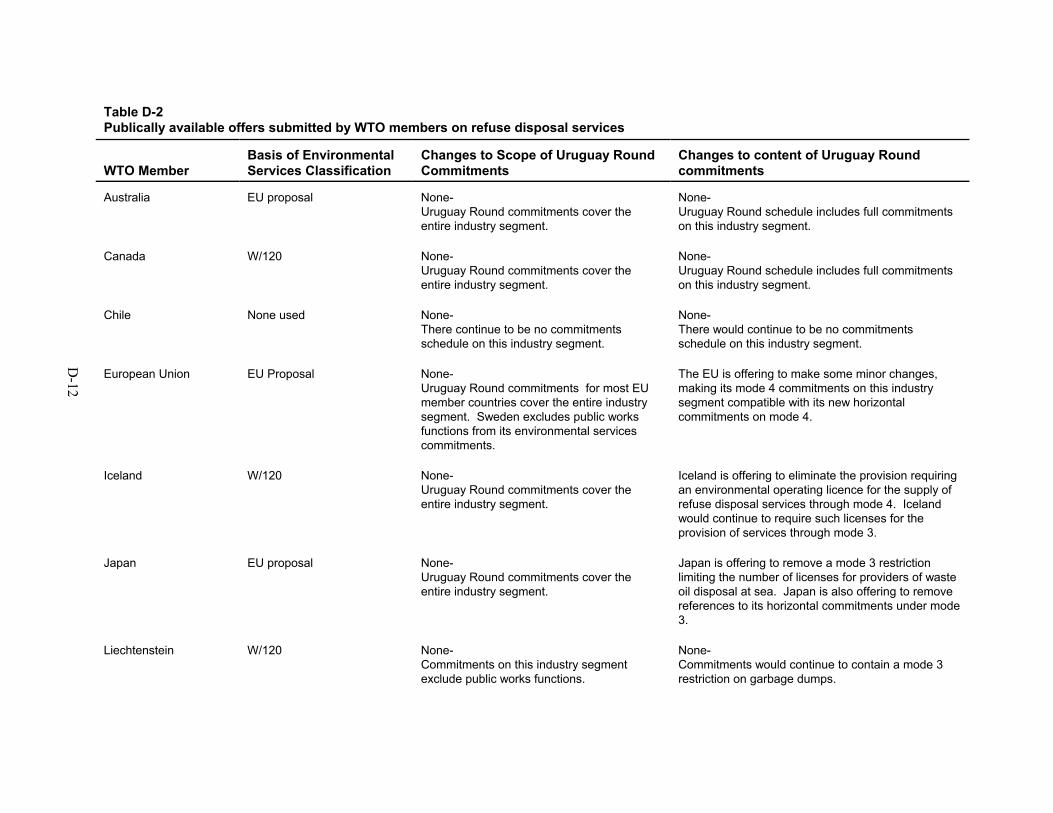
D-12
Table D-2 Publically available offers submitted by WTO members on refuse disposal services
WTO MemberBasis of EnvironmentalServices Classification
Changes to Scope of Uruguay RoundCommitments
Changes to content of Uruguay Roundcommitments
Australia EU proposal None- Uruguay Round commitments cover theentire industry segment.
None- Uruguay Round schedule includes full commitmentson this industry segment.
Canada W/120 None- Uruguay Round commitments cover theentire industry segment.
None- Uruguay Round schedule includes full commitmentson this industry segment.
Chile None used None-There continue to be no commitmentsschedule on this industry segment.
None-There would continue to be no commitmentsschedule on this industry segment.
European Union EU Proposal None-Uruguay Round commitments for most EUmember countries cover the entire industrysegment. Sweden excludes public worksfunctions from its environmental servicescommitments.
The EU is offering to make some minor changes,making its mode 4 commitments on this industrysegment compatible with its new horizontalcommitments on mode 4.
Iceland W/120 None-Uruguay Round commitments cover theentire industry segment.
Iceland is offering to eliminate the provision requiringan environmental operating licence for the supply ofrefuse disposal services through mode 4. Icelandwould continue to require such licenses for theprovision of services through mode 3.
Japan EU proposal None-Uruguay Round commitments cover theentire industry segment.
Japan is offering to remove a mode 3 restrictionlimiting the number of licenses for providers of wasteoil disposal at sea. Japan is also offering to removereferences to its horizontal commitments under mode3.
Liechtenstein W/120 None-Commitments on this industry segmentexclude public works functions.
None-Commitments would continue to contain a mode 3restriction on garbage dumps.
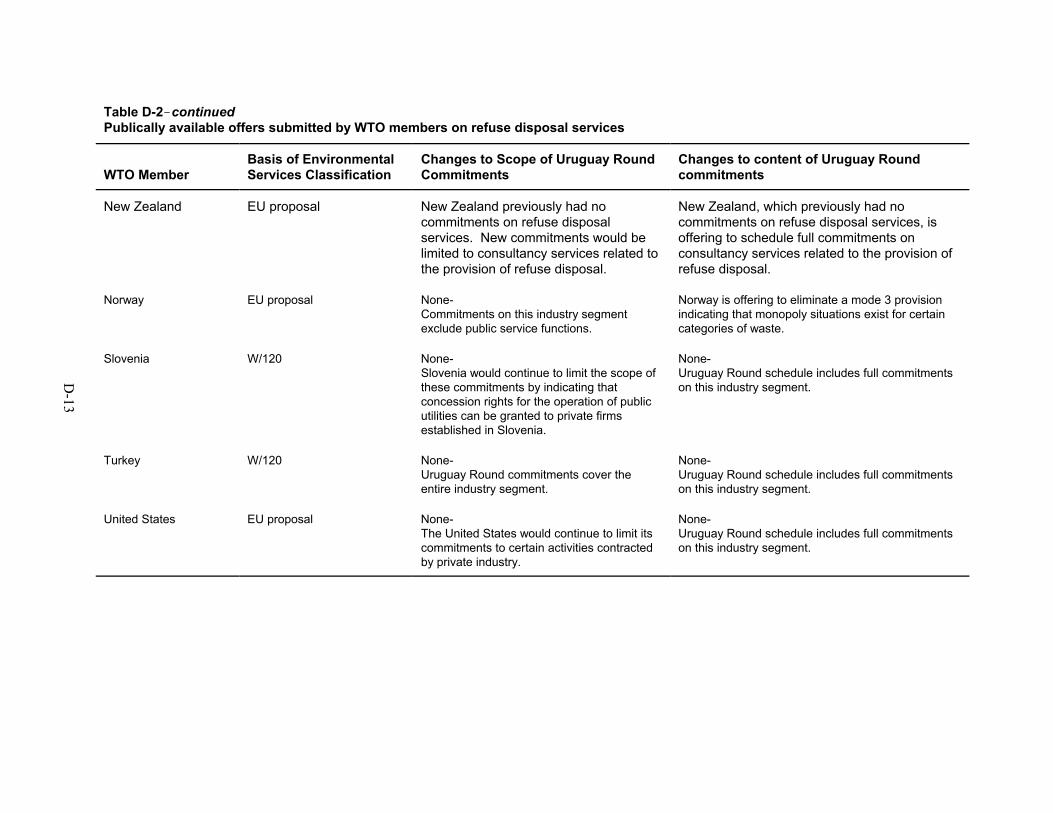
D-13
Table D-2!continuedPublically available offers submitted by WTO members on refuse disposal services
WTO MemberBasis of EnvironmentalServices Classification
Changes to Scope of Uruguay RoundCommitments
Changes to content of Uruguay Roundcommitments
New Zealand EU proposal New Zealand previously had nocommitments on refuse disposalservices. New commitments would belimited to consultancy services related tothe provision of refuse disposal.
New Zealand, which previously had nocommitments on refuse disposal services, isoffering to schedule full commitments onconsultancy services related to the provision ofrefuse disposal.
Norway EU proposal None-Commitments on this industry segmentexclude public service functions.
Norway is offering to eliminate a mode 3 provisionindicating that monopoly situations exist for certaincategories of waste.
Slovenia W/120 None-Slovenia would continue to limit the scope ofthese commitments by indicating thatconcession rights for the operation of publicutilities can be granted to private firmsestablished in Slovenia.
None-Uruguay Round schedule includes full commitmentson this industry segment.
Turkey W/120 None-Uruguay Round commitments cover theentire industry segment.
None- Uruguay Round schedule includes full commitmentson this industry segment.
United States EU proposal None-The United States would continue to limit itscommitments to certain activities contractedby private industry.
None- Uruguay Round schedule includes full commitmentson this industry segment.
18 Ibid. 19 WTO, “Services: Negotiations, The New Negotiations,” found at Internet addresshttp://www.wto.org/, retrieved Nov. 17, 2003.
D-14
any details regarding the content of these offers and thus, they cannot be compared tothe publically available offers that are discussed above.
Current Status of Services Negotiations
WTO member economies continue to conduct services negotiations through theCouncil for Trade and Services, which met several times during 2003, and throughbilateral consultations.18 To date, the WTO has not established any further interimdeadlines for these negotiations. The current round of services negotiations isscheduled to conclude by January 1, 2005.19

APPENDIX EPOSITION OF INTERESTED PARTIES

1 Scott L. Slesinger, Vice-President for Governmental Affairs, Environmental Technology Council,Washington, DC, written submission to the Commission, Nov. 6, 2003. 2 David Waskow, International Policy Analyst and Trade Policy Coordinator, Friends of the Earth-USA, Washington, DC, written submission to the Commission, Nov. 5, 2003.
E-3
Environmental Technology CouncilThe Environmental Technology Council (ETC)1 is an association of hazardous and industrialwaste management firms that provide waste treatment, disposal, and recycling services underU.S. and Canadian regulations. ETC believes that U.S. hazardous waste facilities are highlyadvanced, particularly with regard to the management of wastes containing polychlorinatedbiphenyls (PCBs). ETC also contends that the United States and Canada generally do notrestrict the transfer of hazardous wastes between their countries. However, ETC indicatesthat the United States does not allow the cross-border transfer of PCB-contaminated wastes. ETC further notes that despite the U.S. Senate’s likely ratification of the Stockholm Treaty onPersistent Organic Pollutants, which allows the cross-border transfer of PCBs and otherpollutants destined for proper disposal, ETC does not expect the United States to approve orimplement those portions of the treaty that allow such transfers. ETC argues that the inabilityto import such waste for treatment may not be consistent with the United States’ internationalobligations. ETC also argues that this prohibition has an economically deleterious effect onthe U.S. hazardous waste industry and increases the probability that such waste will beimproperly disposed. ETC contends that if the United States does not import PCB-contaminated wastes for disposal, air currents may transfer these pollutants to the UnitedStates, contaminating U.S. land and water. ETC requests the USITC investigate whetherthere are inconsistencies between U.S. international obligations and the U.S. ban on PCB-contaminated waste trade.
Friends of the Earth - USAFriends of the Earth - USA2 is the U.S. arm of a global network of environmental groups. Thegroup was founded in San Francisco in 1969 and has voiced its opinion on manyenvironment-related issues. Friends of the Earth submitted an article entitled “EnvironmentalServices Liberalization: A Win-Win or Something Else Entirely?, ” which is to be publishedin International Lawyer’s Fall 2003 edition. The article states that environmental servicesnegotiations, instead of being a win-win solution for trade and the environment, may actuallyharm environmental goals. Friends of the Earth claims that the definition of environmentalservices used in these negotiations is too broad, including service activities that are actuallyharmful to the environment. The submission raises possible conflicts between theenvironmental services negotiations, GATS fundamentals such as the nondiscriminationprinciple, the Basel Convention on the Control of Transboundary Movements of HazardousWastes and their Disposal, and other government efforts to protect the environment. TheGATS environmental exceptions must also be revised, according to the submission. Althoughboth the GATT and GATS provide exceptions when “necessary to protect human, animal orplant life or health,” the GATS exceptions in Article XIV are missing a vital environmentalexception that can be found in GATT Article XX, namely “(g) relating to the conservation ofexhaustible natural resources if such measures are made effective in conjunction withrestrictions on domestic production or consumption.” Friends of the Earth voices twoprincipal concerns: that a number of nonliving exhaustible natural resources are left
3 Michael T. Werner, Esq., Client Service Manager, Weston Solutions, Inc., West Chester, PA,written submission to the Commission, Oct. 6, 2003.
E-4
unprotected in GATS and that the word “necessary” may make the exception that has beenincluded in the GATS more susceptible to narrow interpretation. The submission asserts that,at a minimum, an exception equal to GATT Article XX(g) should be incorporated into theGATS. Friends of the Earth cautions WTO Member countries to assess the impacts of theseenvironmental services negotiations before proceeding any further.
Weston Solutions, Inc.Weston Solutions, Inc.3 is a leading environmental engineering firm with over 1800employees in more than 60 offices worldwide. The firm actively promotes international tradein a variety of environmental technologies and services. Weston believes that whilesignificant opportunities exist worldwide for environmental services firms, the demand forsuch services is often limited. For example, Weston has evaluated the hazardous wastetreatment markets in numerous countries and believes that significant volumes of hazardouswastes are continually being added to substantial stockpiles. Weston believes that thissituation needlessly threatens the local environment, as solutions are available in theinternational marketplace. However, constructive solutions often fail to reach fruition due tofactors such as vague project application, approval, and appeal processes, and a lack ofdevelopment capital. When interacting with local governments, Weston reportedly has alsoencountered difficulties relating to project administration, often resulting from a lack oftechnical expertise. Consequently, timely decisions are not made as to the feasibility ofWeston’s proposed technology or any of the alternatives evaluated. Another factor thatfrequently limits the international demand for Weston’s services is the less-than-stringentenforcement of hazardous waste management regulations, which often results from aninadequate enforcement budget, and standards that are imposed arbitrarily or withoutreference to clear standards of conduct. In spite of these hurdles, Weston believes thatsubstantial markets exist for services and technologies for solid and hazardous wastetreatment.

APPENDIX FGLOSSARY

F-3
Autoclave: Steam-heated machine used for sterilization.
Characteristic waste: Waste characterized as hazardous by RCRA because it exhibitsignitability, corrosive activity, reactivity, and/or toxicity.
Collection: Picking up solid waste at its point of generation or storage and putting it in a solidor hazardous waste vehicle.
Commercial presence (mode 3): A service supplier establishes a type of business orprofessional enterprise in a foreign market.
Composting: The biological process involving aerobic decomposition of organic waste undercontrolled conditions to treat putrescible waste and/or sewage sludge.
Construction and demolition waste (C&D): Debris from new structures and debris fromrenovated or demolished existing structures.
Consumption abroad (mode 2): A consumer, or the consumer’s property, receives a serviceoutside the territory of the consumer’s country.
Cross-border supply (mode 1): A service is transported beyond the country of the servicesupplier to a foreign consumer (the service supplier is not present within the territory of theconsumer).
Deep-well injection (or underground injection): The process of placing raw or treated,filtered hazardous waste in the pores of permeable subsurface rock by pumping it into deepwells.
Dioxins: Impurities (i.e., any carcinogenic or teratogenic heterocyclic hydrocarbons) inpetroleum-derived herbicides.
Disposal: The final disposition of solid or hazardous waste.
Energy recovery: Recovery of heat or the creation of steam through the burning of waste.
Food-to-people program: A program under which food that may otherwise be destined fordisposal is redirected towards consumption. For example, produce stored in warehouses thatcan no longer be sold may be destined for such programs.
Gasification: 1) The process of converting a substance to gas through the use of chemicals andhigh heat. 2) The production of gaseous fuels by combining carbonaceous materials with air,steam, or oxygen and subjecting the combination to very high temperatures. The end product isa mixture of particles, tar compounds, combustible gases, and water vapor. The proportion ofmixture components varies depending on the process, but common to all processes is the need topurify the resulting gas before commercial use.
Generic waste: General solid and/or hazardous waste that is not the result of a specific productor process.
Hazardous waste: Any waste material that can cause serious illness, injury, or death, andenvironmental damage if improperly managed.
Incineration: A method for the volume reduction and disposal of solid waste and for sewagesludge through controlled combustion.
F-4
Industrial waste: Waste consisting of a wide variety of nonhazardous materials subject toSchedule D of the RCRA that result from the production of goods. Most of these wastes are inthe form of waste waters.
Informal recycling sector: Individuals that work independently to collect recyclable materialsfrom businesses, households, or waste disposal sites. These individuals sell the collectedrecyclable materials to intermediaries, or to facilities that reprocess the material for use.
Landfill: Disposal site for refuse that is on or below ground level.
Large quantity generators: Facilities that generate more than 1,000 kg of hazardous waste ormore than 1 kg of acutely hazardous waste per calendar month.
Leachate: Contaminated liquid by-product of solid waste that has percolated through the soilor some other medium.
Listed waste: Waste that is considered hazardous under RCRA because it meets specificcriteria.
Low-level radioactive waste: Less hazardous wastes than most of those associated with anuclear reactor; includes those generated by hospitals, research laboratories, and certainindustries. In the United States, the Department of Energy, Nuclear Regulatory Commission,and EPA share responsibilities for managing them.
Material recovery facility: Facility at which recyclable products are sorted for sale and reuseas production inputs.
Medical waste: Waste from healthcare facilities that came into contact or is contaminated withdiseased tissues or infectious microorganisms. May also be referred to as infectious waste,defined as hazardous waste with disease contaminating characteristics, including animal waste,human blood and blood products, pathological waste, and discarded sharp objects (e.g., needles,scalpels, and broken medical instruments).
Mixed waste: Radioactive waste that is also a hazardous waste. Mixed waste is jointlyregulated by RCRA and Atomic Energy Act.
Municipal solid waste: Nonhazarous waste generated through household and communityactivities.
Open dump: A disposal site where waste is simply placed on top of the ground.
Persistent Organic Pollutants: A variety of potential food and water supply contaminants,including pesticides such as DDT and chlordane, and industrial chemicals such as PCBs anddioxin.
Plasma technology: 1) A common phrase for a variety of industrial applications using plasma,an electrically neutral matter also known as the fourth state of matter—solid, liquid, gas, plasma. Plasma applications include etching semiconductor chips; depositing silicon to produce solarcells; depositing silicon dioxide on chemically active surfaces to put them in a passive state or,in contrast, to activate surfaces; and melting or welding with plasma arcs as well as plasmachemistry. 2) Plasma technology constitutes minute gas-filled cells that emit light with thepassage of an electric current.
F-5
Polychlorinated biphenyl (PCB): A generic term for a family of man-made chemicalcompounds produced by replacing hydrogen atoms on a biphenyl molecule with chlorine atomsresulting in a clear, pale yellow, viscous fluid. Although no longer produced, characteristicsthat made PCBs desirable for industry also made them persistent in the environment, includingchemical stability, ability to withstand high temperatures without degradation, and insolubilityin water. Consequently, they remain in the atmosphere, landfill sites, and waterways. PCBs areeasily consumed by aquatic animals where they enter the food chain. They are fat-soluble andtherefore easy to consume but difficult to excrete. Common industrial uses included electricalequipment such as transformers and capacitors, heat transfer and hydraulic systems, fluorescentlight ballasts, paints, glues, waxes, carbonless copy paper, newspaper inks, dust-control agentsfor dirt roads, solvents for spreading insecticides, and additives in lubricating and cutting oils.
Presence of natural persons (mode 4): One individual, acting alone or as an employee of aservice provider, provides a service while present in a foreign market.
Putrescible: Organic matter liable to decompose or pass into a state of foul decay.
Reclamation: Treating material to recover a usable product, or to regenerate material. Forexample, recovery of lead values from spent batteries, regeneration of spent solvents, andremoval of impurities from spent solvents or other hazardous wastes to render them usable asfuels.
Recovery: Reclaiming materials from the solid waste stream to use for composting andrecycling purposes. This does not include reuse and source reduction activities, such as reusingyard trimmings for on-site compost, refilling beverage containers, and repairing wood pallets.
Recycling: The recovery, reprocessing, and reuse of certain waste materials.
Remanufacturing: The process of making a finished product from used material.
Reuse: Using certain municipal solid waste products in their original form more than once,such as refilling glass or plastic bottles, repairing wood pallets, using corrugated or plasticcontainers for storage, and returning milk crates.
Sanitary landfill: A facility for solid waste disposal that is designed, constructed, and operatedin such a way as to minimize public nuisances (e.g., windblown litter and unpleasant odors) andnot pose a threat to public health or safety. Three important characteristics distinguish a sanitarylandfill from an open dump: (1) an appropriately selected and prepared (lined with animpermeable material) landfill site, (2) deposited waste is spread out and compacted, and (3)each day a soil cover is placed over the waste and compacted.
Slag: Partially fused or vitrified nonmetallic material released and formed by chemical action athigh temperatures during the smelting and refining of metals.
Solid Waste: Refuse and trash that requires routine or irregular collection and transport to aprocessing and/or disposal site.
Source reduction (waste minimization): The reduction of waste, through processing changesor recycling at the source.
Special waste: Any of the industrial process, pollution control, or hazardous waste materials,including potentially infectious medical waste, except as may be in conformity applicable laws.with Section 22.9 of the Resource Conservation and Recovery Act (RCRA).
F-6
Stabilization process: Altering an active substance into inert, harmless material. Also, limitingthe further spread of contamination without actual reduction of toxicity at a given site.
Storage: Holding waste for a temporary period, after which the waste is treated, disposed of, orstored elsewhere.
Surface impoundment: Any natural or man-made topographic depression, hole, orembankment that is composed primarily of earth materials and used to treat, store, or dispose ofhazardous waste.
Tipping: The discharge of waste from the collection vehicle.
Tipping fee: Fees charged to haulers for delivering waste at recovery or disposal facilities.
Transfer station: A facility that receives solid waste from individual collection trucks andconsolidates the waste into larger shipping containers, such as tractor-trailer units, for long-distance shipping to waste processing plants. Typically such waste processing plants are locatedmore than 12 miles from the community in which the waste was collected.
Treatment: (1) A systematic process for removing solids and/or pollutants from solid waste,waste-streams, effluents, and air emissions. (2) Any method used to remove or reduce potentialdisease-causing components from regulated medical waste by changing the biologicalcomposition of that waste material.
Underground injection (or deep-well injection): The process of placing raw or treated,filtered hazardous waste in the pores of permeable subsurface rock by pumping it into deepwells.
Waste generation: The weight or volume of material entering the waste stream before saidwaste is disposed of or recycled. The phrase can be applied to the amount of waste produced bya specific source or category of sources.
Waste management: The process of collection, storage, treatment, or disposal of waste, notincluding hauling or transport.
Waste minimization (source reduction): The reduction of waste, through processing changesor recycling) at the source.
Waste stream: The flow of all solid waste from point of generation to method of disposal, suchas incineration, depositing in landfills, or recycling. The term may also apply to segments of thewaste flow, such as “residential waste stream” or “recyclable waste stream.”
Waste-to-energy: A usable form of energy that is manufactured (primarily by combustion)from solid waste.