Embed Size (px)
DESCRIPTION
A project i am working on
Citation preview

URBAN ROAD INFORMATION SYSTEM
FOR WARANGAL USING GISBy
D. Siddhartha(UG101218)C. Mrudula(UG101217)
Ch. Loknath rao(UG101215)Mahram Hussain(UG101132)
Saquib Suhail(UG101149)
Under the guidance ofProf. C.S.R.K Prasad

INTRODUCTION
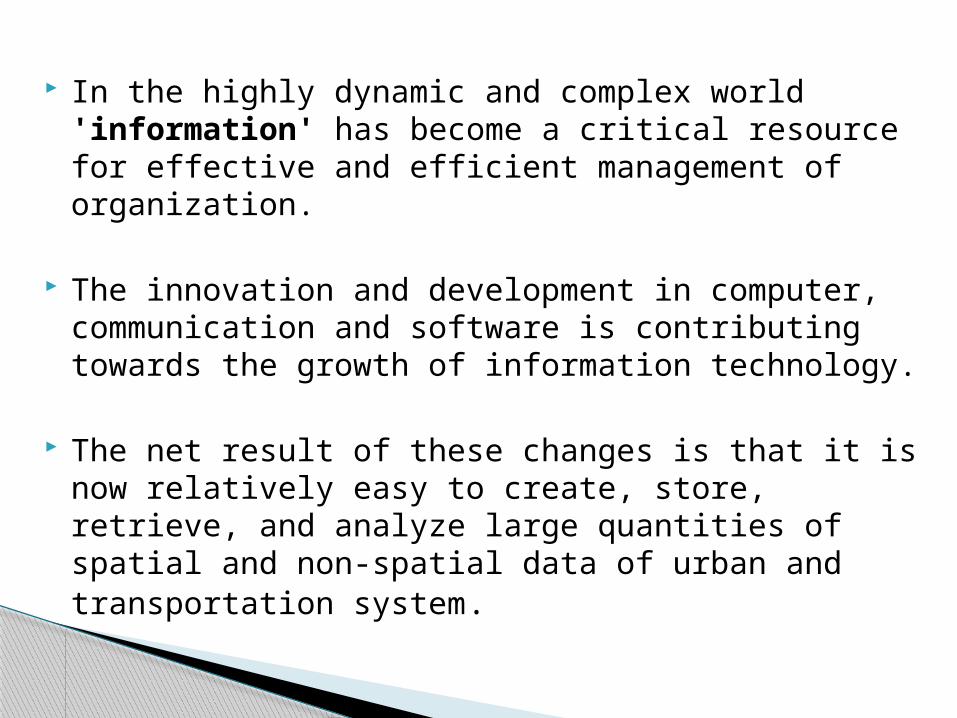
In the highly dynamic and complex world 'information' has become a critical resource for effective and efficient management of organization.
The innovation and development in computer, communication and software is contributing towards the growth of information technology.
The net result of these changes is that it is now relatively easy to create, store, retrieve, and analyze large quantities of spatial and non-spatial data of urban and transportation system.
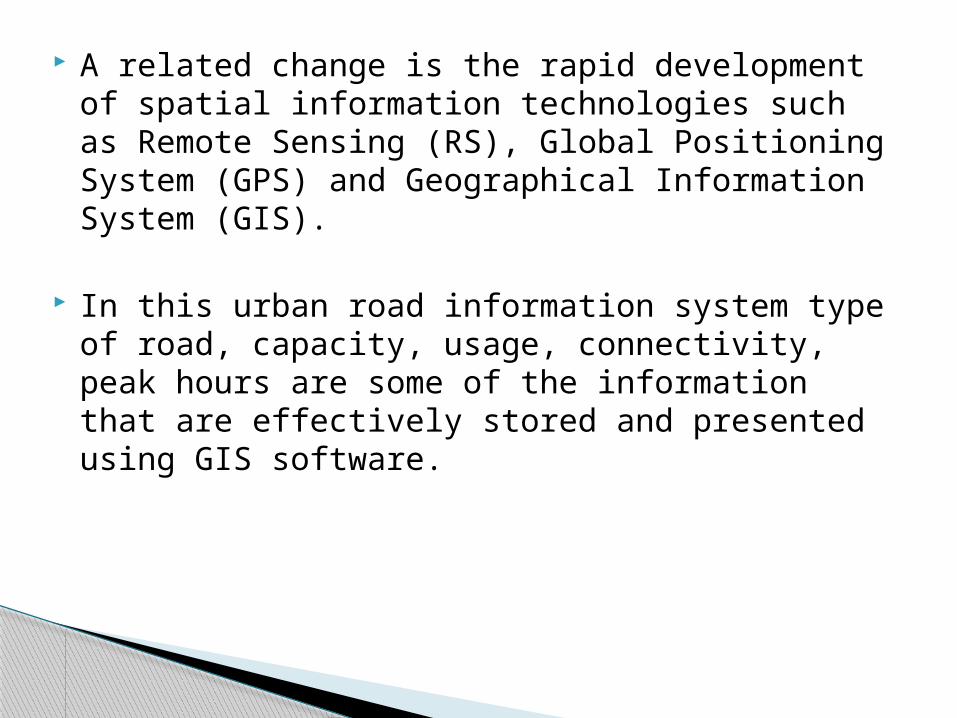
A related change is the rapid development of spatial information technologies such as Remote Sensing (RS), Global Positioning System (GPS) and Geographical Information System (GIS).
In this urban road information system type of road, capacity, usage, connectivity, peak hours are some of the information that are effectively stored and presented using GIS software.
GEOGRAPHIC INFORMATION SYSYTEM
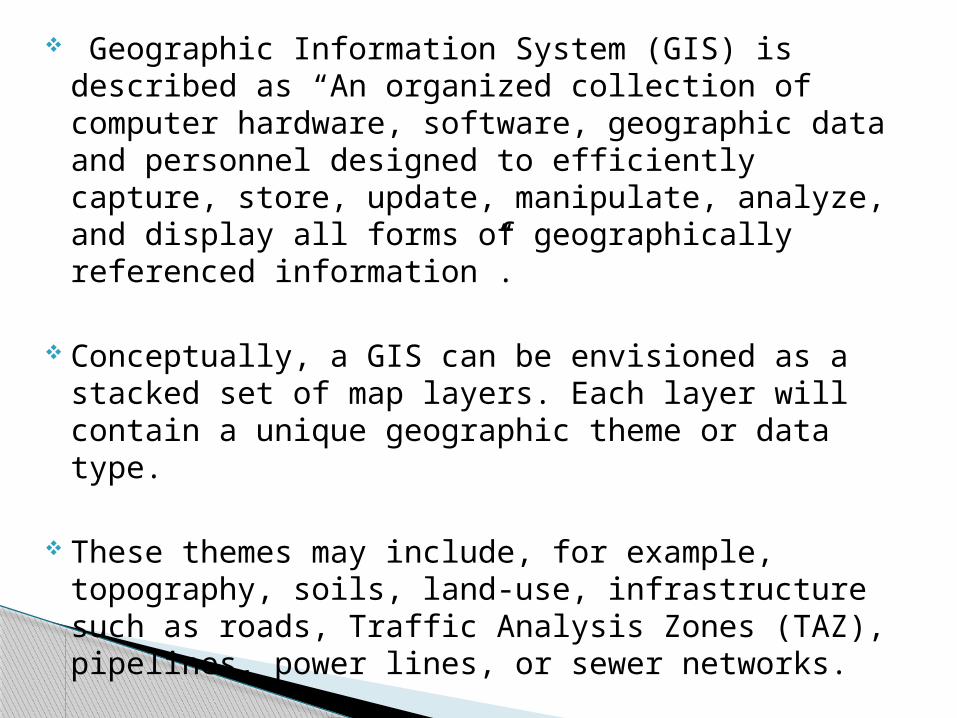
Geographic Information System (GIS) is described as “An organized collection of computer hardware, software, geographic data and personnel designed to efficiently capture, store, update, manipulate, analyze, and display all forms of geographically referenced information”.
Conceptually, a GIS can be envisioned as a stacked set of map layers. Each layer will contain a unique geographic theme or data type.
These themes may include, for example, topography, soils, land-use, infrastructure such as roads, Traffic Analysis Zones (TAZ), pipelines, power lines, or sewer networks.

1.MAPPING LAYERS IN GISSource : www.esri.com/
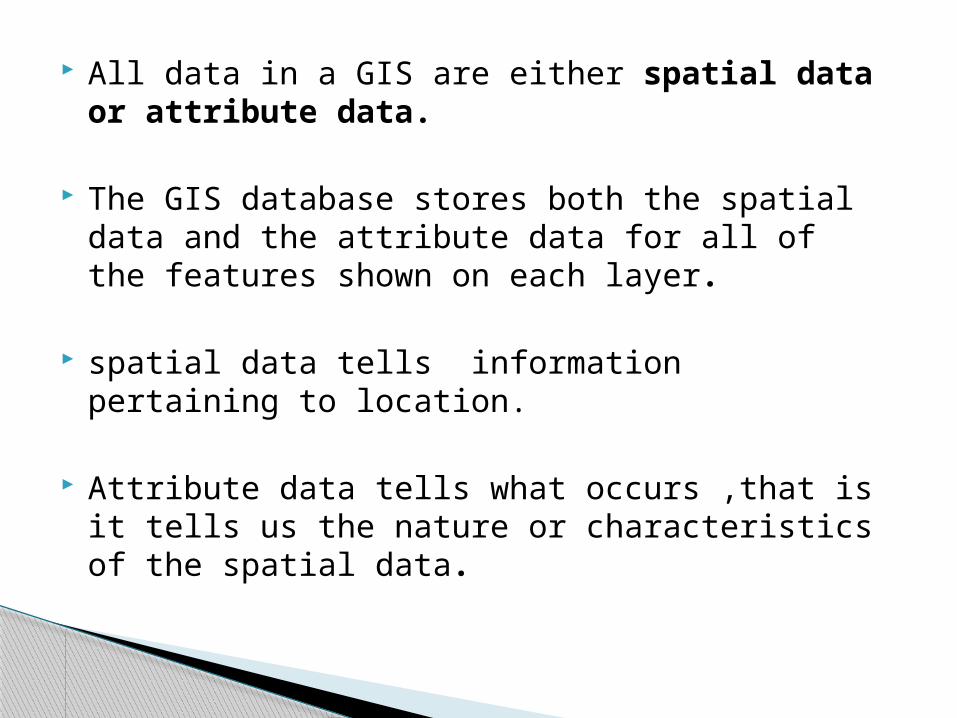
All data in a GIS are either spatial data or attribute data.
The GIS database stores both the spatial data and the attribute data for all of the features shown on each layer.
spatial data tells information pertaining to location.
Attribute data tells what occurs ,that is it tells us the nature or characteristics of the spatial data.
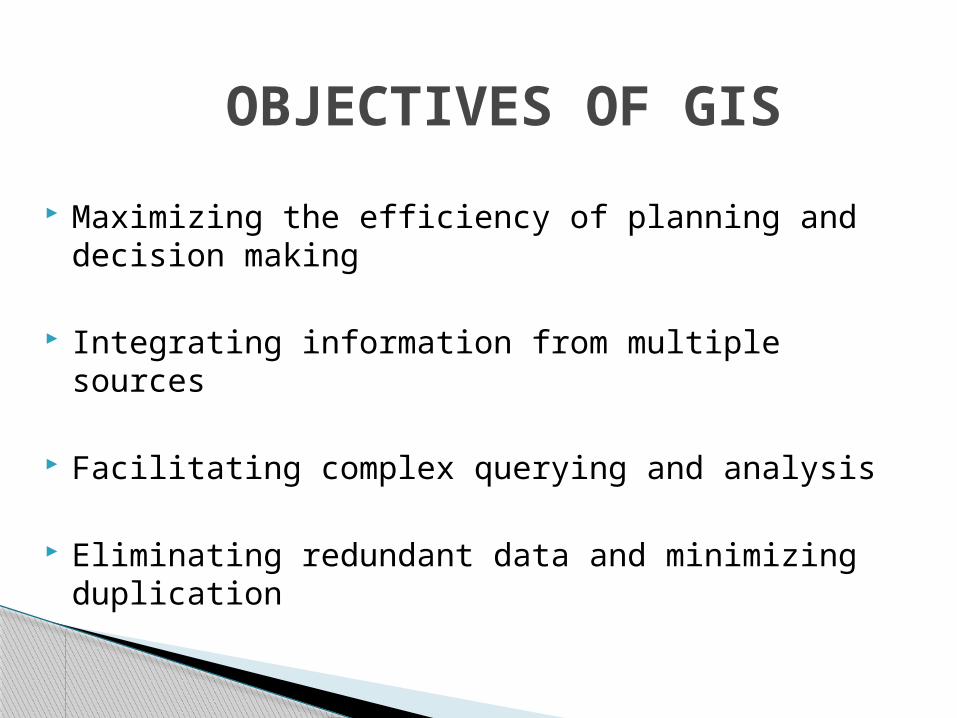
Maximizing the efficiency of planning and decision making
Integrating information from multiple sources
Facilitating complex querying and analysis
Eliminating redundant data and minimizing duplication
OBJECTIVES OF GIS

There are four components of GIS 1.data, 2.hardware, 3.software, and 4.users.
1.DATA
Data tends to be at the center of any GIS system, while the computer components of the system support the data management and analysis. Every GIS provides the ability to store and manipulate both the spatial data and the associated attribute data
COMPONENTS OF GIS
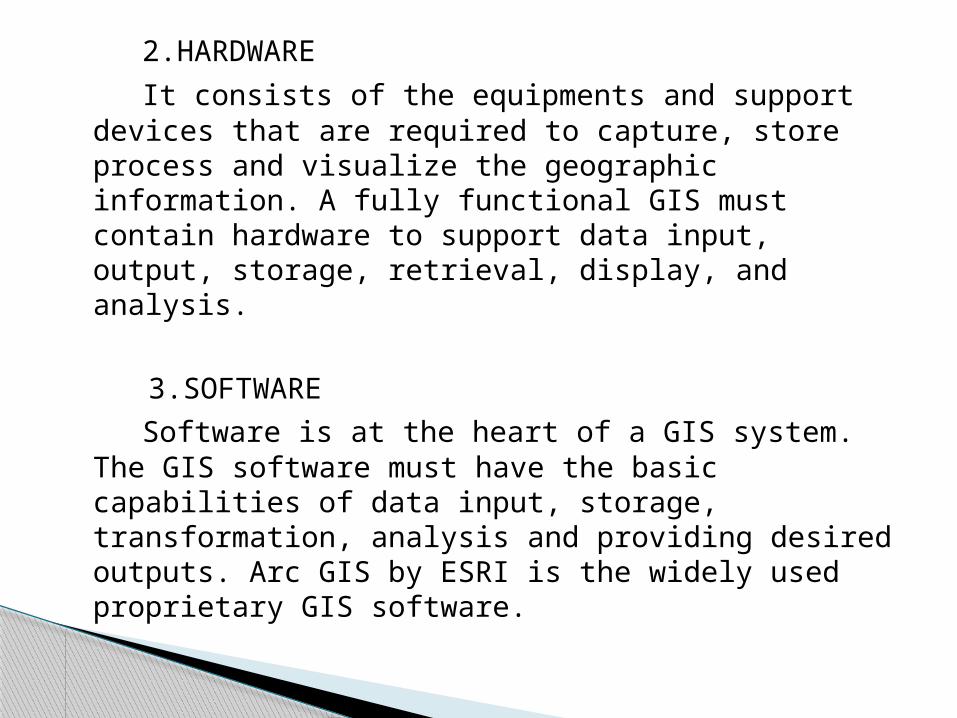
2.HARDWARE
It consists of the equipments and support devices that are required to capture, store process and visualize the geographic information. A fully functional GIS must contain hardware to support data input, output, storage, retrieval, display, and analysis.
3.SOFTWARE
Software is at the heart of a GIS system. The GIS software must have the basic capabilities of data input, storage, transformation, analysis and providing desired outputs. Arc GIS by ESRI is the widely used proprietary GIS software.
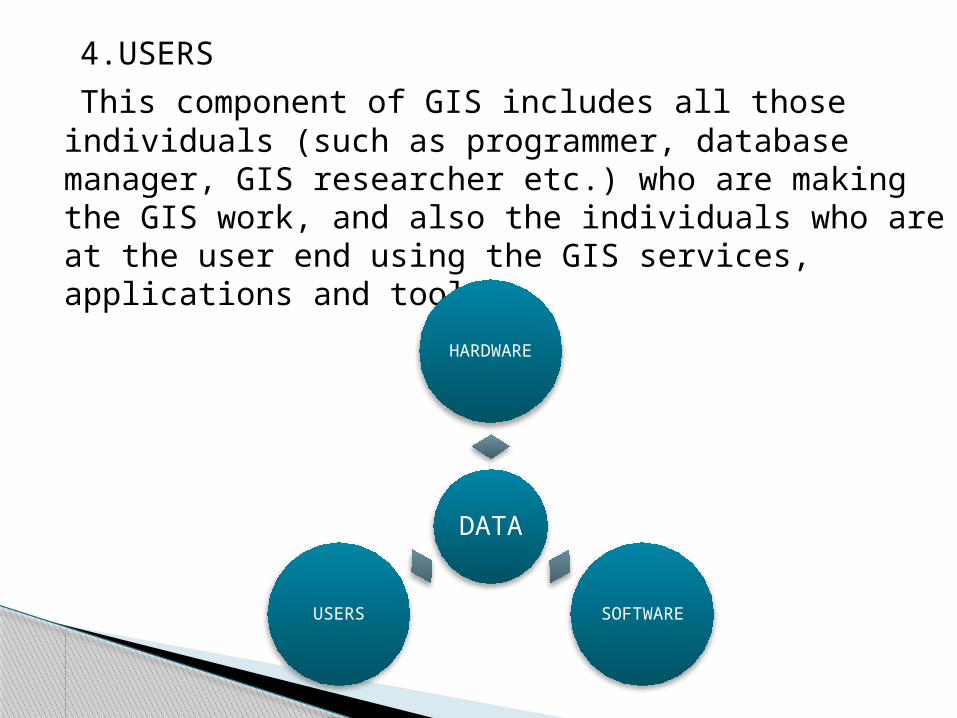
4.USERS
This component of GIS includes all those individuals (such as programmer, database manager, GIS researcher etc.) who are making the GIS work, and also the individuals who are at the user end using the GIS services, applications and tools.
DATA
HARDWARE
SOFTWAREUSERS

Fundamental GIS concepts are closely linked to maps and their contents. In fact, map concepts form the basis for understanding GIS more fully.
The primary map element is the map frame, and it provides the principal display of geographic information.
Within the map frame, geographical entities are presented as a series of map layers that cover a given map extent for example, map layers such as roads, rivers, place names, buildings, political boundaries, surface elevation, and satellite imagery.
MAP CONCEPTS
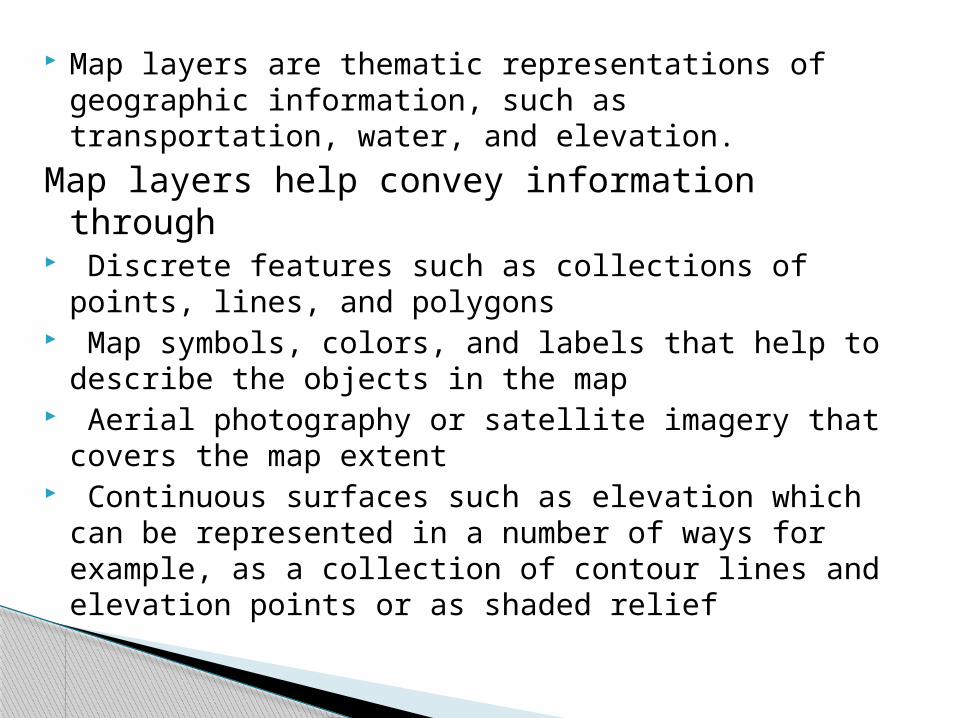
Map layers are thematic representations of geographic information, such as transportation, water, and elevation.
Map layers help convey information through Discrete features such as collections of points,
lines, and polygons Map symbols, colors, and labels that help to
describe the objects in the map Aerial photography or satellite imagery that covers
the map extent Continuous surfaces such as elevation which can
be represented in a number of ways for example, as a collection of contour lines and elevation points or as shaded relief
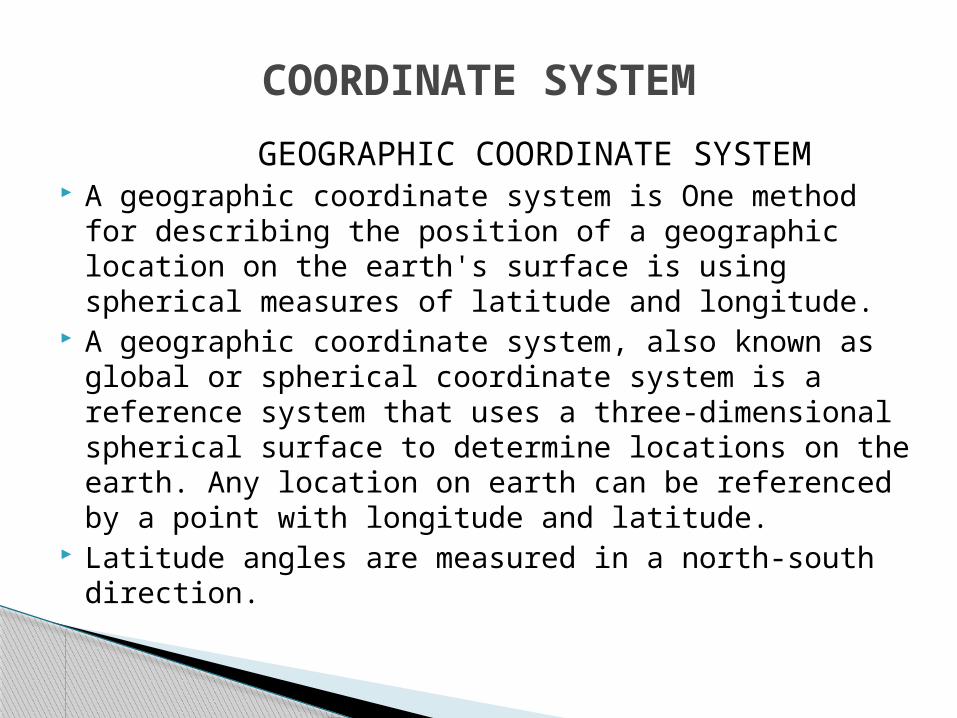
GEOGRAPHIC COORDINATE SYSTEM A geographic coordinate system is One method for
describing the position of a geographic location on the earth's surface is using spherical measures of latitude and longitude.
A geographic coordinate system, also known as global or spherical coordinate system is a reference system that uses a three-dimensional spherical surface to determine locations on the earth. Any location on earth can be referenced by a point with longitude and latitude.
Latitude angles are measured in a north-south direction.
COORDINATE SYSTEM
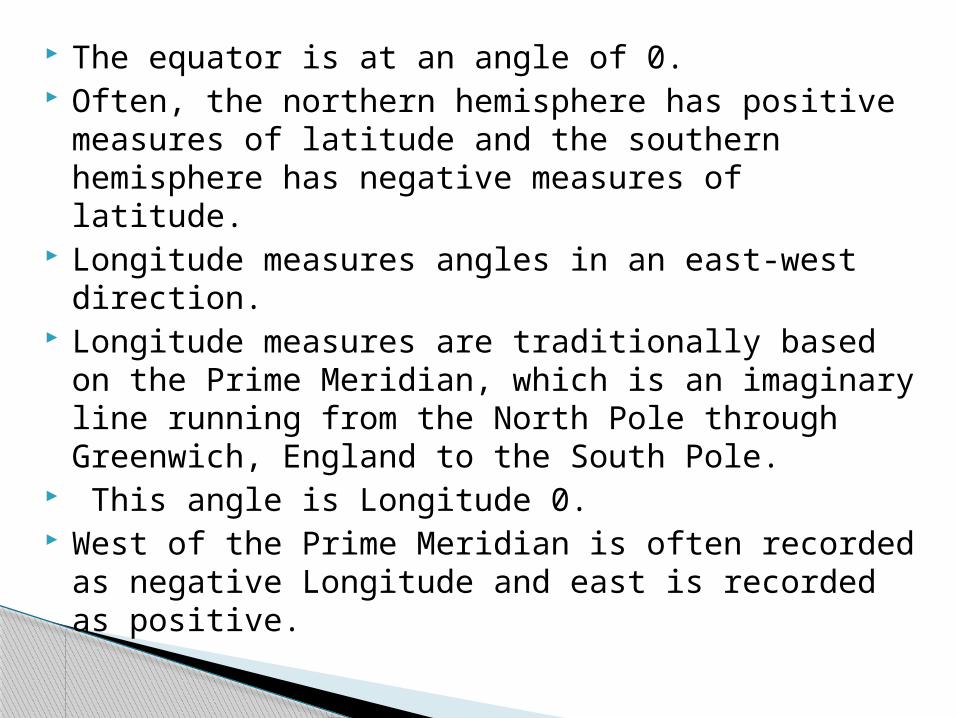
The equator is at an angle of 0. Often, the northern hemisphere has positive
measures of latitude and the southern hemisphere has negative measures of latitude.
Longitude measures angles in an east-west direction.
Longitude measures are traditionally based on the Prime Meridian, which is an imaginary line running from the North Pole through Greenwich, England to the South Pole.
This angle is Longitude 0. West of the Prime Meridian is often recorded as
negative Longitude and east is recorded as positive.
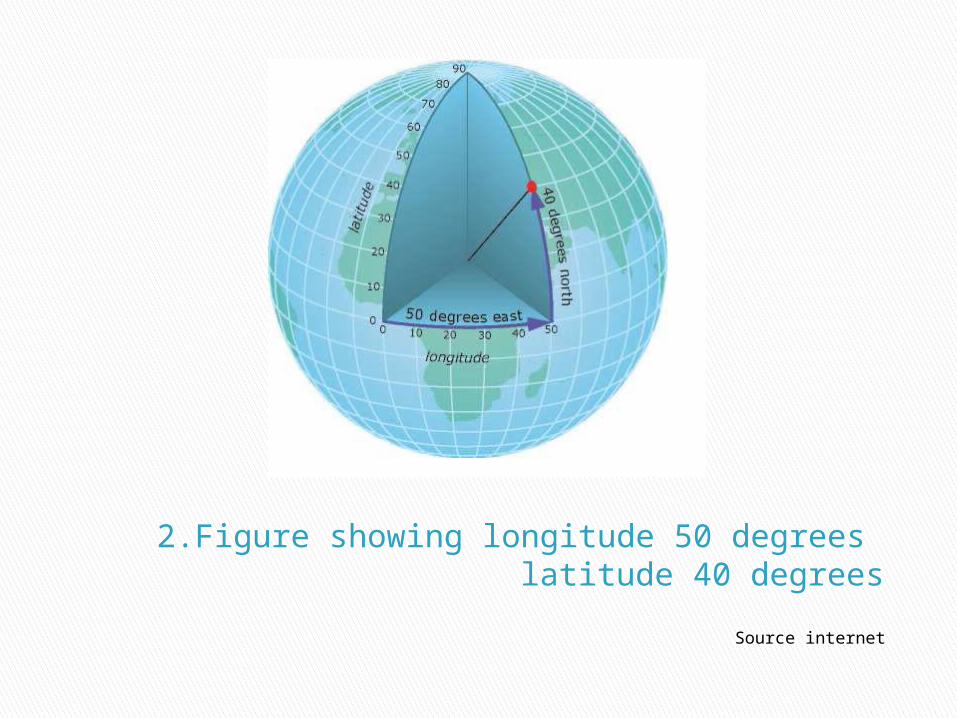
2.Figure showing longitude 50 degrees latitude 40 degrees
Source internet

Map projection is a mathematical expression using which the three dimensional surface of earth is represented in a two dimensional plane. The process of projection results in distortion of one or more map properties such as shape, size, area or direction.
Generally there are three classes or families of map projections.
1. Cylindrical Projection2. Conic Projection3. Azimuthal Projection
PROJECTION SYSTEMS

UTM is one of the cylindrical projection system in which cylinder wrapped around the globe.
cylinder has line of tangency to the meridian. UTM projection divides the surface of the Earth into
a number of zones, each zone having a 6 degree longitudinal extent, Transverse Mercator projection with a central meridian in the center of the zone.
Universal Transverse Mercator (UTM)

3.Figure showing UTM system
Source : internet
It is a process of locating an entity in real world coordinates.
To georeference a geographic data or raster data(map), the positions of known points, called control points, are required.
The Ground Control Points (GCPs) are defined as the points with known geographical location, whose positions on map correspond to their positions on earth.
At least three control points are required for georeferencing a data or a raster data(map).
GEOREFERENCING

Digitization is a simplification process that converts all spatial data to a point , a line a polygon formed by a closed, complex line or a grid cell.
Point Feature For a transportation system a point feature may
correspond to traffic intersection, bus stop, rail transit station, airport etc. Depending on the size of the study area
DIGITALIZATION

Line Feature A line feature in GIS may correspond to
transportation features like; a road link between two intersections, a rail link between two stations, an air link between two airports, a water transport link between two terminals, or a bus route link between two bus stops.
Polygon Feature Polygon feature are those whose boundary
encloses a homogeneous area represented by a closed string of co-ordinates which encompass an area.
APPLICATIONS OF GIS IN TRANSPORTATION ENGINEERING
Integrating the Existing Systems and Data with GIS
GIS plays a pivotal role in integrating the numerous applications and system that manage the current data and information of large transportation organizations.
GIS and the use of modern service-oriented architecture (SOA) bring together information, such as traffic counts, pavement conditions, and accident statistics, into a single application for complex analysis.

GIS software emphasizes inter-operability and easy integration with commercial solutions such as CAD data resulting into a blue-line drawings in an environment where they maintain their correct spatial characteristics.
GIS delivers powerful spatial analytics, allowing us to discover patterns and gain intelligence to better understand travel behaviors and perform accident analysis.
Through detailed GIS maps, this information can be easily conveyed to decision makers and the public.

Collecting Information from the Field with Mobile GIS
By using GPS and GIS-enabled devices, transportation maintenance and inspection crews accurately collect information from the field and seamlessly update corporate databases located in the office in real time even from remote locations.
Through GPS technology, we can track resources and assets in real time, allowing a quick response to any event that requires immediate attention.
We can also more effectively manage mobile resources by instantly seeing the location of any work or inspection crew on a map, then redeploy resources as needed.
GIS Solutions for Highway and Roadway Management
To effectively manage today’s complex roadways, Highway managers must draw on a wide array of data, technologies and systems.
Optimizing scheduling and routing maintenance and inspection teams, not only boosts productivity but also results in significant fuel savings.
This even allows modern highway managers to efficiently direct their mobile workforces and ensure that resources are most effectively utilized.
GIS Integrates the Transportation Infrastructure Life CycleGIS aids in analysis and support through the infrastructure life cycle giving transportation professionals the ability to comprehensively manage their infrastructure
Planning: Identify deficiencies and determine optimal solutions.
Design: Integrate GIS with most design tools, including CAD, bringing greater analytic and cost-estimation capabilities to your infrastructure design process.

Survey: Manage and store GPS data and survey measurements more effectively.
Construction: Integrate project and financial management software with GIS to better manage infrastructure projects. GIS can provide a single point of entry for all construction-related documents and files.
Operations: Incorporate GIS into business processes to improve your operational performance.
Maintenance: Easily manage disparate assets. Integrate your asset inventory with inspection history and work order management to maintain your critical investments in a cost-effective manner

Infrastructure
Life Cycle

Highway Asset Management
GIS integrates asset mapping with project management and budgeting tools so that construction, operational, and maintenance expenses can be centrally managed and accounted for.
GIS helps to efficiently and equitably allocate scarce resources among competing objectives.
Field personnel can take detailed GIS information with them on mobile devices and quickly locate relevant facilities and perform detailed inspections identifying repairs and deficiencies.

Maintenance and Work Order Management
Integrating maintenance and work order management systems with GIS , allow more efficient scheduling of maintenance activities and tracking of work tasks, personnel, equipment, and material usage and help Highway managers understand and report their complete maintenance activities.
Traffic Operations The capabilities to integrate data feeds and share
dashboard views make GIS ideal for viewing a comprehensive picture of current traffic conditions and in developing effective traffic management strategies
For example, Traffic managers can visually monitor bottlenecks and related information to quickly respond to vehicle incidents.
In addition, these views can be shared with the public over the web, giving drivers the latest information on road closures and current travel conditions
Transportation Planning GIS technology provides rich analytic and visual
tools to help finding the right balance between the need to accommodate demand on public infrastructure and the responsibility to preserve quality of life and environmental sustainability in our community
GIS provides a framework to inform models, such as those used to forecast travel demand and plan capital improvements, and to support strategic decision making.
In addition, GIS applications that perform environmental evaluations shed light on the consequences of various transportation alternatives.
Transportation Safety Analysis GIS allows highway departments to accurately
capture and analyze traffic accident information as well as identify dangerous highway segment locations with high accident rates.
GIS, combined with complex statistical analysis and business intelligence tools, helps highway engineers better understand the causes of accidents at these locations and find ways of reducing them.
Environmental Management GIS is capable of assisting transportation
professionals to understand the impacts that transportation activities have on the environment and select the most environmentally sensitive solutions.
With GIS, transportation planners can understand the impact of land-use decisions and evaluate smart-growth alternatives, leading to more livable communities.
GIS integrates environmental factors with land-use and housing and employment density analysis to help communities address growth issues.
List of GIS-T Applications
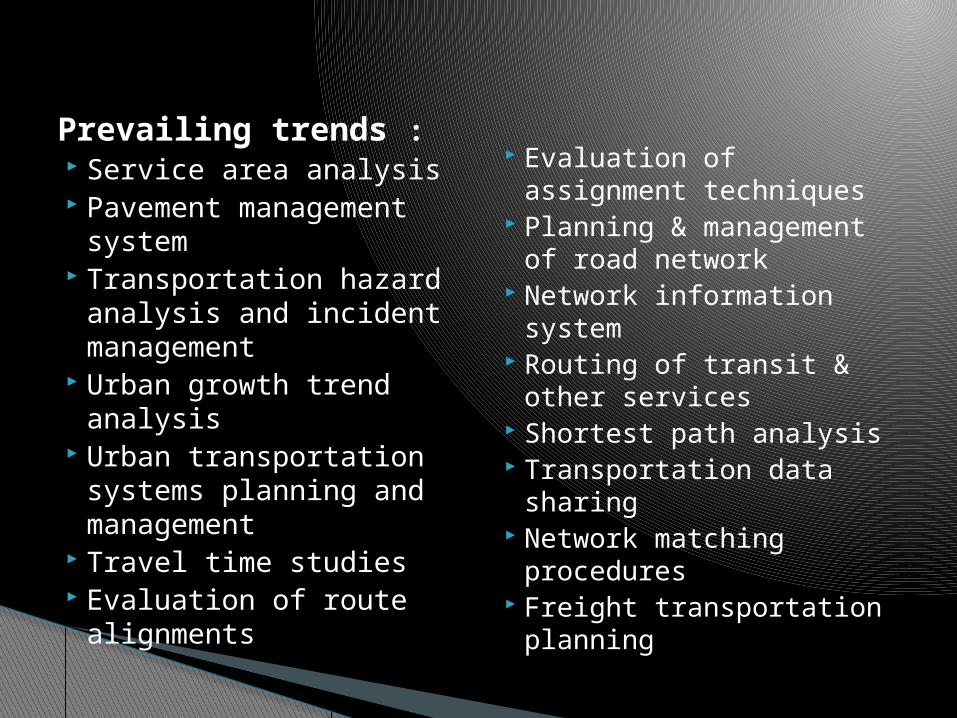
Prevailing trends : Service area analysis Pavement management
system Transportation hazard
analysis and incident management
Urban growth trend analysis
Urban transportation systems planning and management
Travel time studies Evaluation of route
alignments
Evaluation of assignment techniques
Planning & management of road network
Network information system
Routing of transit & other services
Shortest path analysis Transportation data
sharing Network matching
procedures Freight transportation
planning
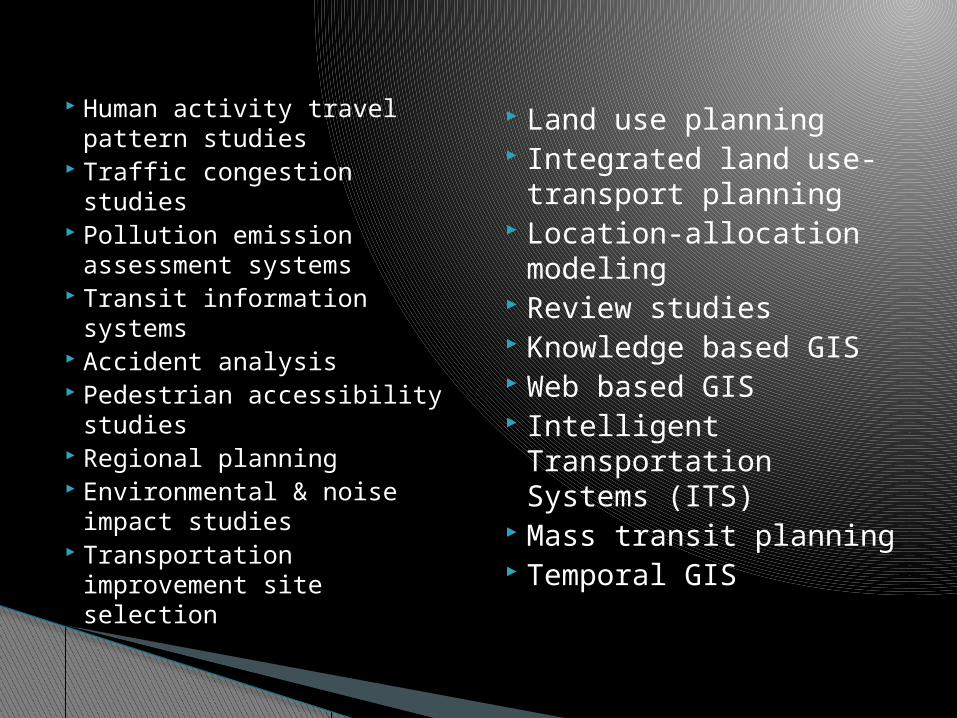
Human activity travel pattern studies
Traffic congestion studies Pollution emission
assessment systems Transit information
systems Accident analysis Pedestrian accessibility
studies Regional planning Environmental & noise
impact studies Transportation
improvement site selection
Land use planning Integrated land use-
transport planning Location-allocation
modeling Review studies Knowledge based GIS Web based GIS Intelligent
Transportation Systems (ITS)
Mass transit planning Temporal GIS
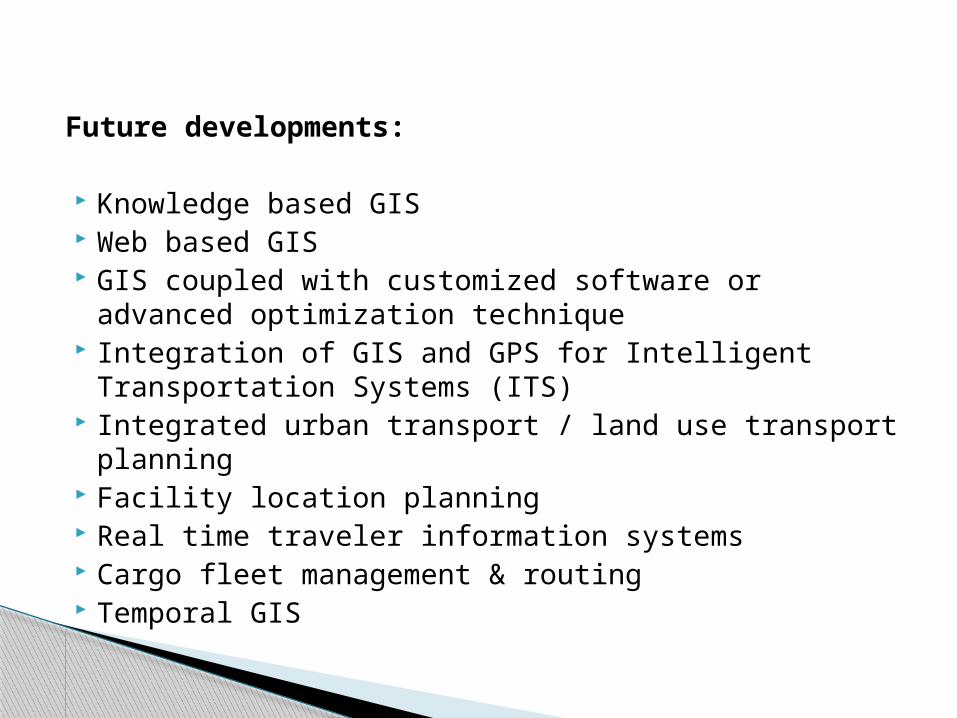
Future developments:
Knowledge based GIS Web based GIS GIS coupled with customized software or advanced
optimization technique Integration of GIS and GPS for Intelligent
Transportation Systems (ITS) Integrated urban transport / land use transport
planning Facility location planning Real time traveler information systems Cargo fleet management & routing Temporal GIS
URBAN ROAD INFORMATION SYSTEM

Proper urban transportation planning and decision making and implementation by a town planner call for generation of comprehensive urban transportation information system.
This information system should include some of the key areas like type of road , width and capacity, usage, connectivity, peak hours etc
Urban road information system helps traffic management, operation and maintenace of infrastructure, future planning etc

Methodology to develop Urban Road Information System

Keeping in view the primary objective of developing an urban data base to build an information system this methodology is proposed involving the following steps…
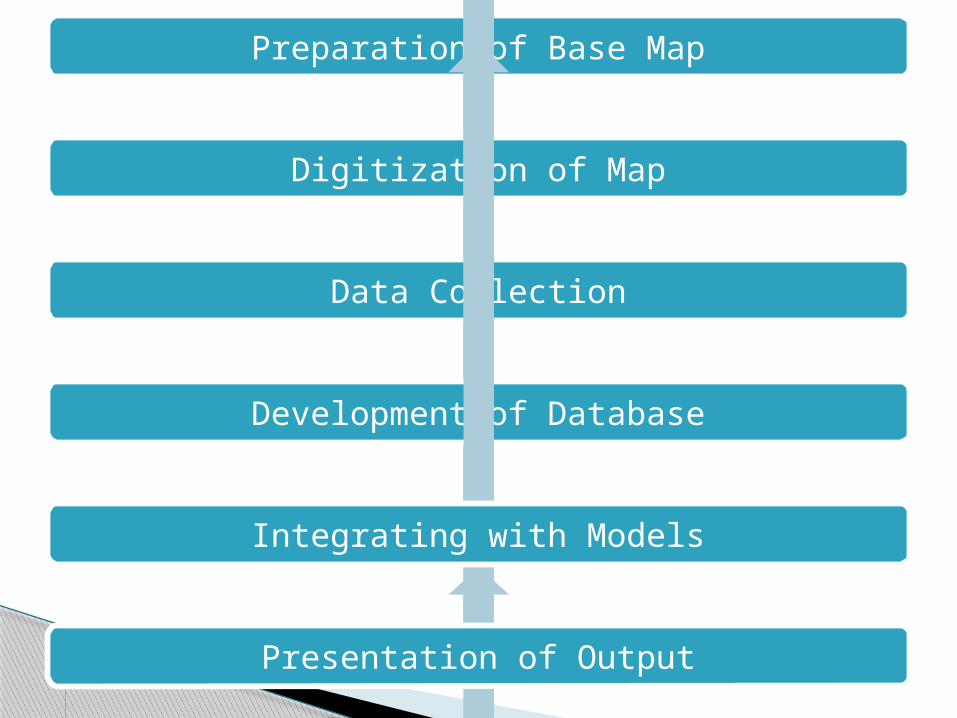
Preparation of Base Map
Digitization of Map
Data Collection
Development of Database
Integrating with Models
Presentation of Output

1)Collection of base maps :
Topo sheets prepared by Survey of India are to be collected for the whole urban area.
All the topo sheets are scanned with high precision scanners and all the scanned maps are georeferenced in ARCGIS interface by fixing the ground control points.
2) Digitization of maps: Various shapes files are created in Arccatalog and
each layer are digitized carefully by tracing over the base map. All the errors are rectified and topology is created subsequently .Legend of each layer can be customized according to the requirements.
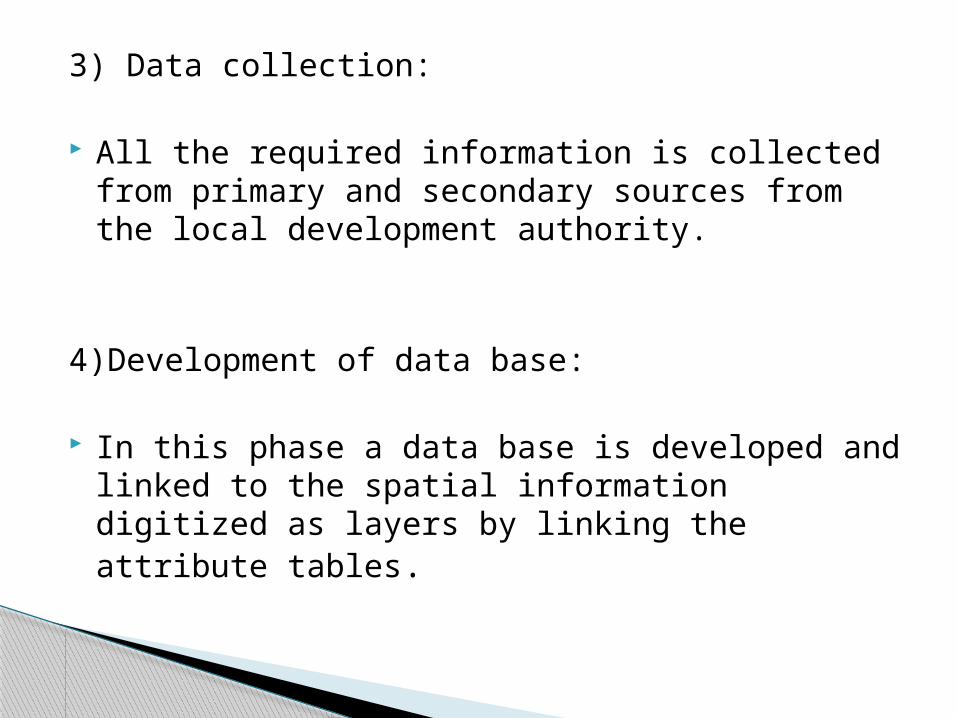
3) Data collection:
All the required information is collected from primary and secondary sources from the local development authority.
4)Development of data base:
In this phase a data base is developed and linked to the spatial information digitized as layers by linking the attribute tables.

5)Integrating with models:
In this phase a Data base management System has to be chosen which can handle mathematical models and can be integrated to GIS interface.
6)Presentation of output:
The output is presented by switching to Lay out view and by adding all the required map elements like North arrow ,Scale bar ,Scale text ,Legend ,grid lines, etc.

Current Status of Our Project

Software is at the heart of a GIS system. As a part of project we have learned ARCGIS software. Arc GIS by ESRI is the widely used proprietary GIS software.
We have learned these topics in Arc GIS software Basics in ArcCatalog Basics in ArcMap and Animation in ArcMap Geo referencing and projection of Maps Digitalization of Map and Creating Shape Files Spatial Data and attribute data input and editing Trial map of Warangal is digitalized

STEP 1
Map of Warangal is downloaded from maps of india for trial purpose shown in figure.
This map shows all features like major road network , railway, river etc
STEPS INVOLVED IN DIGITALIZATION OF WARANGAL MAP

4.Fig showing warangal map Source: www.mapsofindia.com
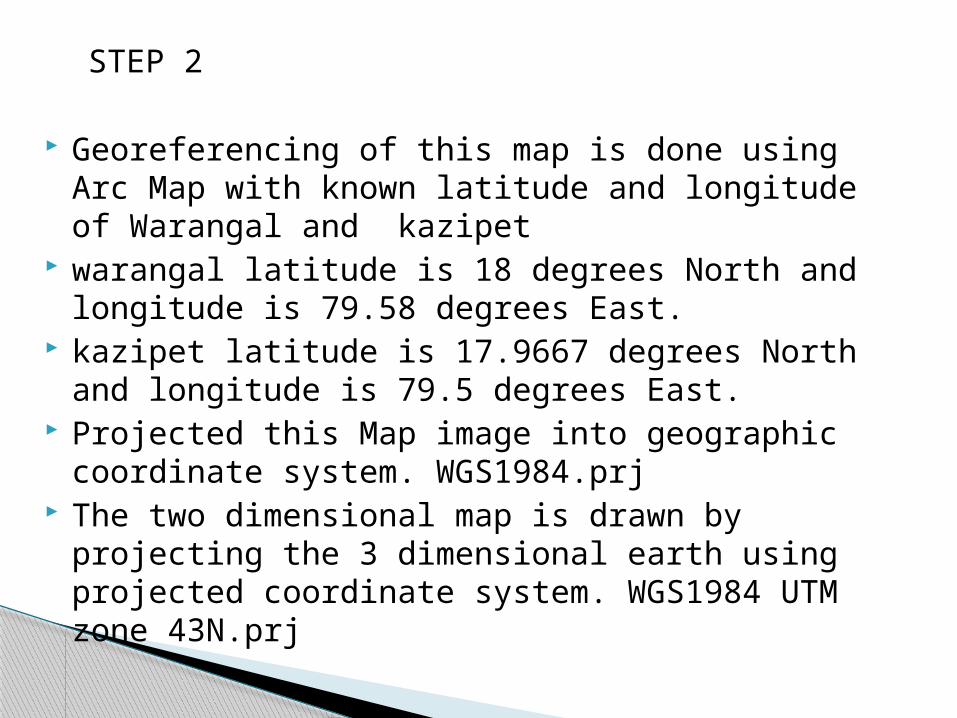
STEP 2
Georeferencing of this map is done using Arc Map with known latitude and longitude of Warangal and kazipet
warangal latitude is 18 degrees North and longitude is 79.58 degrees East.
kazipet latitude is 17.9667 degrees North and longitude is 79.5 degrees East.
Projected this Map image into geographic coordinate system. WGS1984.prj
The two dimensional map is drawn by projecting the 3 dimensional earth using projected coordinate system. WGS1984 UTM zone 43N.prj

STEP 3
Digitalization of projected map is done by creating shape files using Arc catalog.
These shape files are also projected into the same coordinate system.
The output is presented by switching to Lay out view and by adding all the required map elements like North arrow ,Scale bar ,Legend etc.
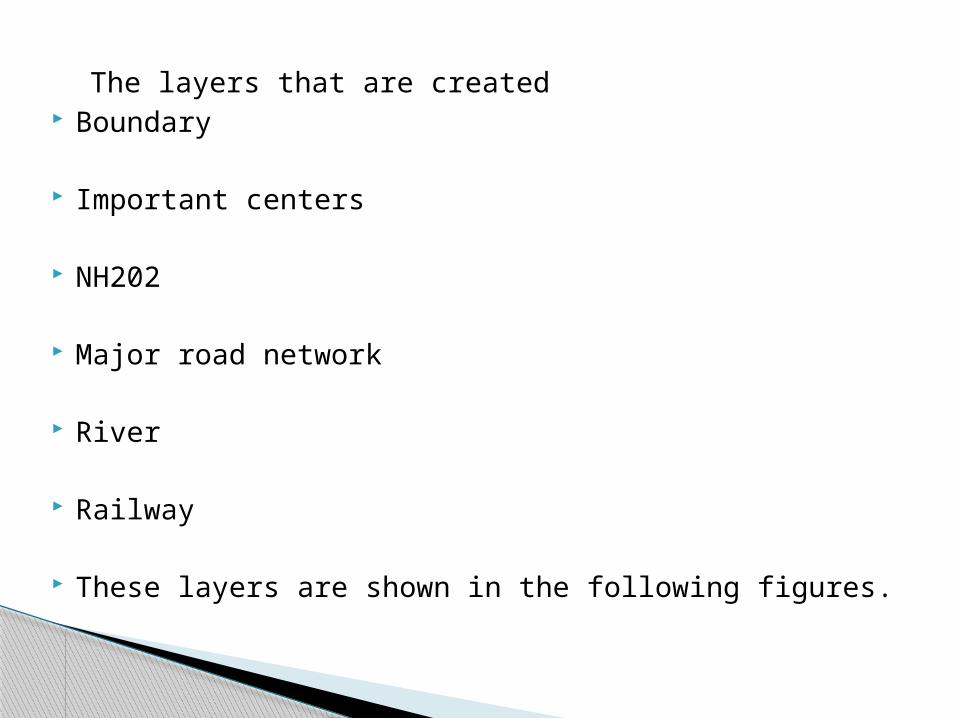
The layers that are created Boundary
Important centers
NH202
Major road network
River
Railway
These layers are shown in the following figures.
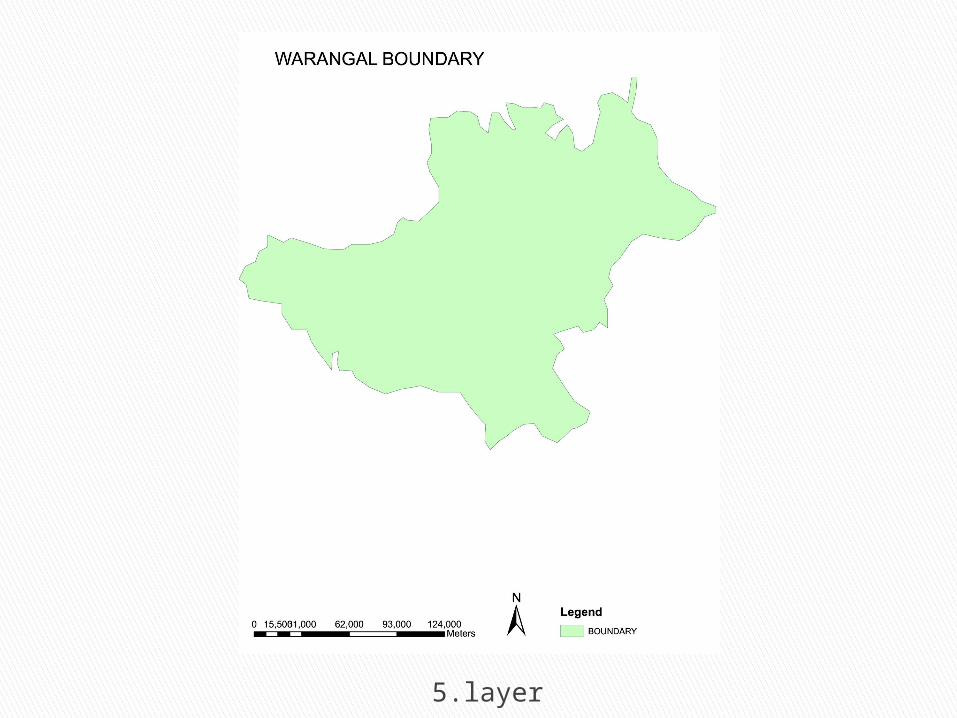
5.layer
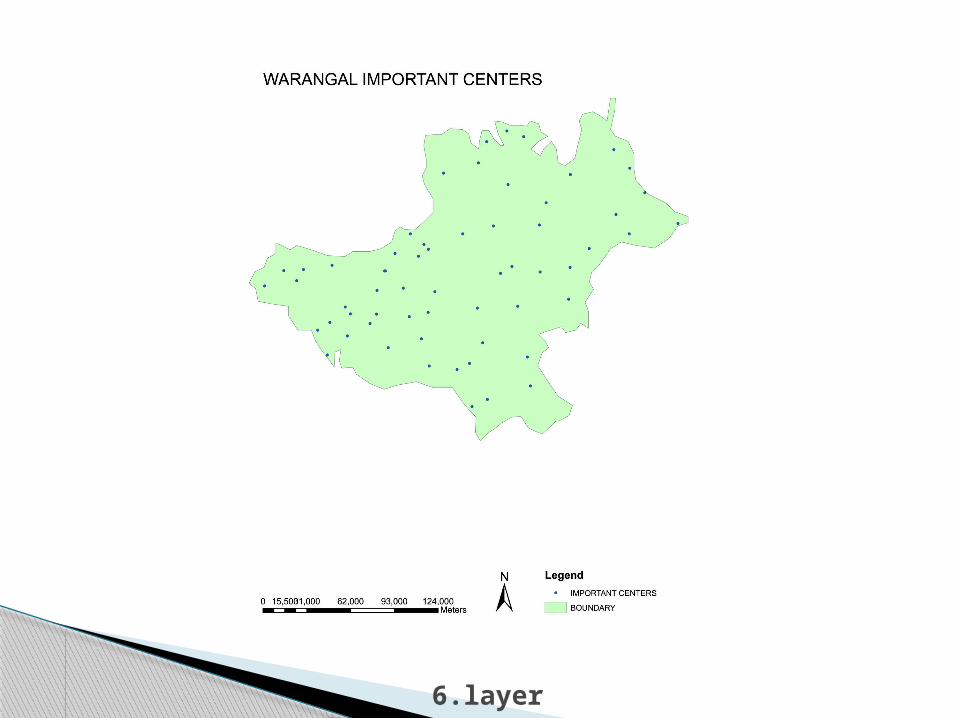
6.layer

7.layer
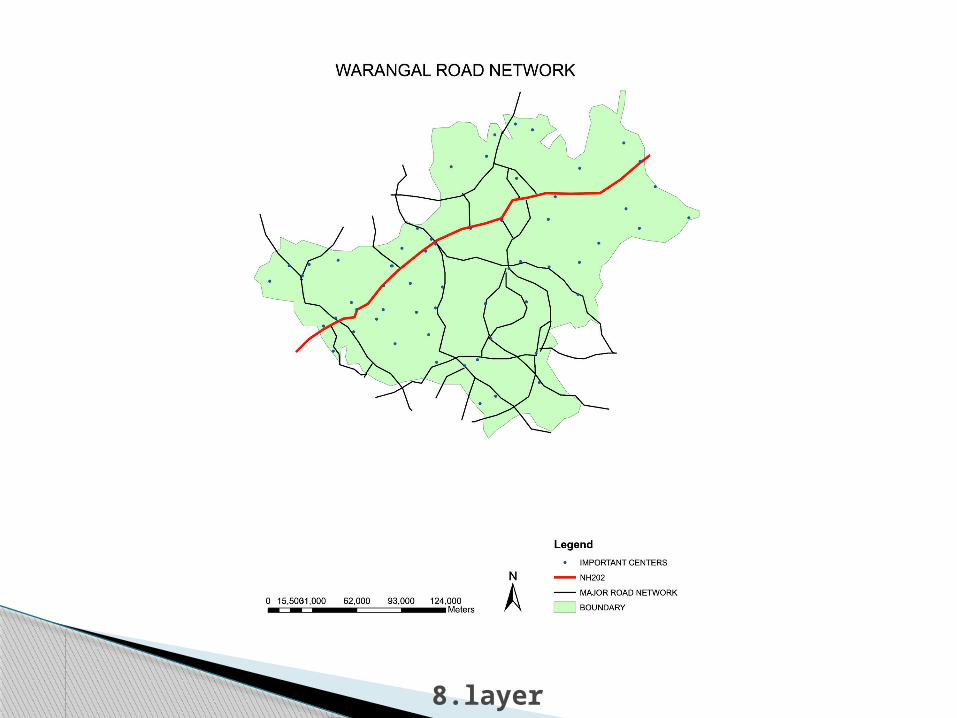
8.layer
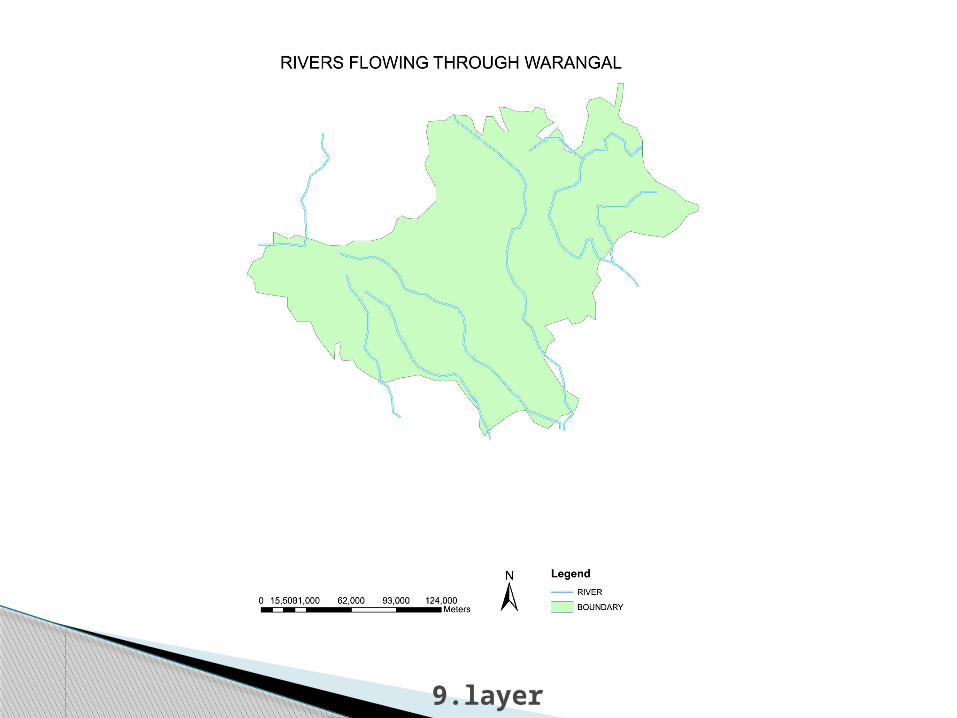
9.layer
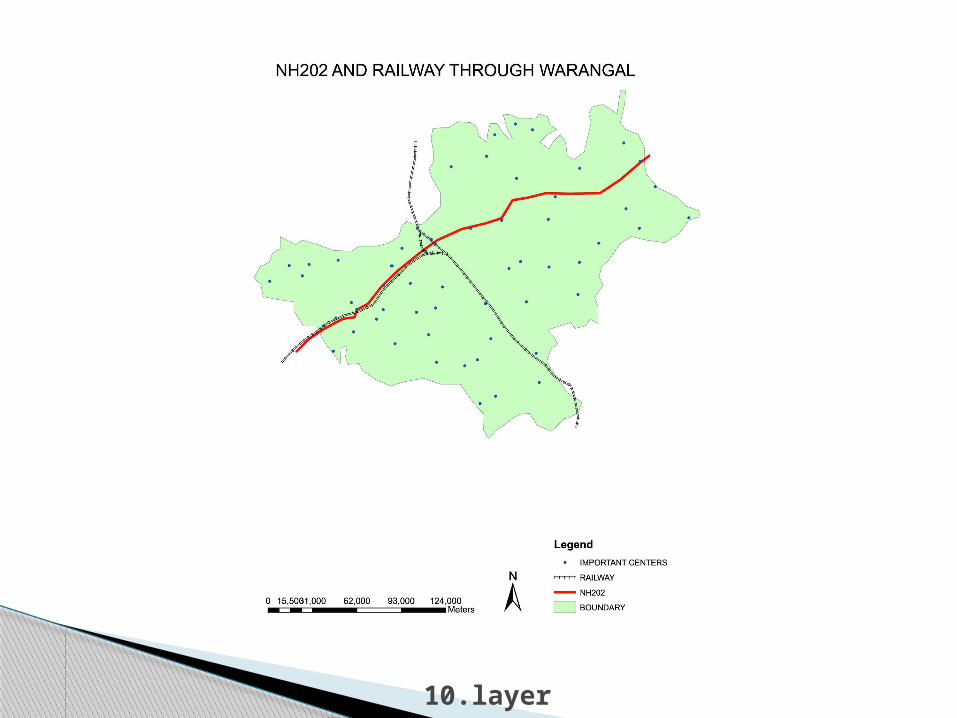
10.layer

11.layer

THANK YOU