Embed Size (px)
Citation preview
Pertanika J. Soc. Sci. & Hum. 25 (S): 291 - 300 (2017)
ISSN: 0128-7702 © Universiti Putra Malaysia Press
SOCIAL SCIENCES & HUMANITIESJournal homepage: http://www.pertanika.upm.edu.my/
E-mail addresses: [email protected] (Nurul Amirah Isa),[email protected] (Wan Mohd Naim Wan Mohd),[email protected] (Siti Aekbal Salleh),[email protected] (Nur Atikah Md Nasrudin)* Corresponding author
Article history:Received: 15 September 2016Accepted: 30 January 2017
ARTICLE INFO
Urban Climatic Analysis Mapping of Kuala Lumpur City
Nurul Amirah Isa*, Wan Mohd Naim Wan Mohd, Siti Aekbal Salleh and Nur Atikah Md NasrudinCentre of Studies for Surveying Science and Geomatics, Faculty of Architecture, Planning and Surveying, Universiti Teknologi MARA, 40450 Shah Alam, Selangor, Malaysia
ABSTRACT
As Malaysia envisions its cities to be environmentally-friendly the concept of Urban Climatic Mapping should be introduced as a guide in assisting urban planners. This paper aims to generate the Urban Climatic Analysis Map (UC-AnMap) of Kuala Lumpur City. It uses the Geographical Information System as the analysis platform together with available data sets of Kuala Lumpur to generate the urban climatic map. To generate UC-AnMap two main analyses involved are Thermal Load and Dynamic Potential were used. Using the combination of the two key analyses, the UC-AnMap of Kuala Lumpur is produced and climatically sensitive areas of the city produced.
Keywords: Dynamic Potential, Thermal Load, Urban Climatic Analysis Map, urban planning, urbanization
INTRODUCTION
Rapid urbanization has taken place all over the world especially after World War 2, without a proper planning, urbanization can lead to environment degradation. The urban climate condition in Malaysia’s cities
is degraded due to rapid and uncontrollable urbanization. Thus, many cities in Malaysia experience the negative effects of urban heat islands, and the country is projected to experience urbanization process of about 0.84% by 2020 (Yuen & Kong, 2009).
The effects of UHI phenomenon in Malaysia is not new as several cities in Malaysia have reported and documented heat islands (Elsayed, 2012; Karsono & Wahid, 2010; Kubota & Ossen, 2009). The UHI phenomenon increases the risk of climatic hazards such as heat stress and exposure to air pollutants (Arifwidodo & Tanaka, 2015).

Nurul Amirah Isa, Wan Mohd Naim Wan Mohd, Siti Aekbal Salleh and Nur Atikah Md Nasrudin
292 Pertanika J. Soc. Sci. & Hum. 25 (S): 291 - 300 (2017)
To inject the urban climatic information in urban planning, the gap between meteorology field and urban planning must be filled. The UC-Map is a climatic information and evaluation tool that helps planners to understand the urban climate conditions and formulate them in their urban design (Ren et al., 2012).
The UC-Map has two main components: the Urban Cl imat ic Analys is Map (UC-AnMap) and the Urban Climatic Recommendation Map (UC-RecMap) (Ren et al., 2010). UC-AnMap presents the urban climatic characteristics of different regions which used the analysis and evaluation of their urban climatic factors and their effects on thermal condition and dynamic potential as the basis. The wind information layer is also included in order to ensure the information is adequate (Acero et al., 2015; Baumuller et al., 2009; Burghard et al., 2010; Eum, Scherer, Fehrenbach, Koppel, & Woo, 2013; Houet & Pigeon, 2011; Mora, 2010; Morris, 2016; Ng, Chao, Katzschner, & Yau, 2009; Ren, Lau, Yiu, & Ng, 2013; Ren et al., 2012; Tanaka, Ogasawara, Koshi, & Yoshida, 2009). The UC-ReMap portrays the spatial evaluation of current climatic conditions and characteristics and identifies areas which are climatically sensitive, requiring planning attention (Acero et al., 2015; Baumuller et al., 2009; Burghard et al., 2010; Eum et al., 2013; Houet & Pigeon, 2011; Mora, 2010; Morris, 2016; Ng et al., 2009; Ren et al., 2013; Ren et al., 2012; Tanaka et al., 2009).
This study aims to generate one of the main components of UC-Map called UC-
AnMap to examine the climate condition in Kuala Lumpur city. By utilizing the readily available data sets, this study employs the same model used by a study in Hong Kong (Ng et al., 2009; Ren, Ng, & Katzschner, 2007) to generate the UC-AnMap of Kuala Lumpur. Geographical Information System (GIS) is used as the analysis platform to prepare and analyse the information layers as well as to produce the maps.
METHODS
This study focuses on Kuala Lumpur city. It takes its different characteristics to identify how the urban climate varies. Kuala Lumpur city has regions which are dominated by high-rise buildings and skyscrapers, compact business areas such as Bukit Bintang, residential areas, highly vegetated areas such as Bukit Tunku and Mont Kiara and other areas suitable for this study.
This study used the readily-available datasets consisting two vector data layers i.e. building.shp and landuse.shp, and two raster data layer i.e. Digital Elevation Model (DEM) and satellite image. Building.shp stores building footprints and building height information whereas landuse.shp layer stores land use information i.e. land use classes which are very important for this study. DEM layer used in this study is derived from Light Detection and Ranging (LiDAR) data set which has been captured in 2014. The satellite image, Landsat 8 OLI/TIRS, used in this study is an open source data provided by U.S Geological Survey website.

Urban Climatic Analysis Mapping of Kuala Lumpur City
293Pertanika J. Soc. Sci. & Hum. 25 (S): 291 - 300 (2017)
In this study, a model used to study the situation in Hong Kong (Ng et al., 2009) was utilised to produce the UC-AnMap of Kuala
Lumpur. The methodology adopted of this study can be seen in Figure 1.
Preparation of Data Sets
In this study, readily-available data sets of Kuala Lumpur are used to produce the UC-AnMap. The data consists of two vector data layers (i.e., building and land use) and two raster data layers (i.e. Digital Elevation Model and satellite image). Building layer which contains building footprints and building heights is used to calculate the building volume and building coverage. Land use is needed to separate built-up areas from vegetated areas and used to calculate the building volume (for no building and pavement areas), building coverage, proximity to water bodies and open space. Elevation variation and slope layer are obtained from DEM layer. A satellite image
(Landsat 8 OLI/TIRS) dated 24th March 2014 is used to derive the Normalized Difference Vegetation Index (NDVI) layer. The selected date also provides a clear sky view image which is very suitable to extract the NDVI information easily. The data sets and information prepared are needed to generate six urban parameter layers which store the impact value of each urban parameter that influence the urban climate condition.
Generation of Urban Parameter Layers
The urban climate of the city can be characterized with a balanced consideration of “negative” Thermal Load effects due to building bulks and building layouts and
Figure 1. Methodology adapted for this study

Nurul Amirah Isa, Wan Mohd Naim Wan Mohd, Siti Aekbal Salleh and Nur Atikah Md Nasrudin
294 Pertanika J. Soc. Sci. & Hum. 25 (S): 291 - 300 (2017)
“positive” Dynamic Potential and mitigate effects (Ng, Katzschner, Cheng, & Lau, 2008). The study examines six urban parameters to analyse their contribution to Thermal Load and Dynamic Potential and therefore to the urban climate. Every layer is classified into specific classes (with classification values) which indicate the impact value of the urban parameters on Thermal Load and Dynamic Potential. The study maps the six urban parameters spatially (into spatial data layers) using the GIS technique. The urban parameter layers are combined and classified either positively or negatively vis a vis their effect on urban climate. All of the six layers are prepared in raster layer with a resolution of 30 m x 30 m.
Using the building footprints and information on height the buildings’ volumes are computed, which is combined with land use information to identify the areas without buildings and also pavements such as roads. The volume information is then converted into raster data layer with percentage and classified into six classes based on a field observatory study (Zhao, Fu, Liu, & Fu, 2011) in a tropical country. The classes range from 0 to 6. By utilizing the DEM layer, the topography of Kuala Lumpur is classified (Topographical Height). Using the classification based on a study of Hong Kong (CUHK, 2012), this study classified the layer into four classes ranging from -3 to 0. Using NDVI layer prepared, this study separates vegetated areas from non-vegetated areas in Kuala Lumpur using the threshold value of 0.1. Using the building and land use layers, this study identifies
and separates the built-up areas from the non-built-up areas. The built-up areas hold a value of 1 and 0 for the non-built-up areas. The layer is then converted into raster data layer with 1m resolution. The layer is then aggregated into 30 m resolution with sum option. The percentage of built-up areas within a pixel (30m x 30m) is calculated and classified based on a study (Middel, Hab, Brazel, Martin, & Guhathakurta, 2014). In this study, the proximity from water bodies, the proximity from open space and the proximity from slope areas are used to assess the Dynamic Potential of Kuala Lumpur. These three aspects have different effects on the urban climate. In this study, these three aspects are combined and the maximum value is selected to present the openness of the study areas.
Generation of Thermal Load layer, Dynamic Potential layer and UC-AnMap
Thermal Load and Dynamic Potential play important roles in influencing the climate in an urban area. The balance between Thermal Load and Dynamic Potential is used to derive the UC_AnMap which represents the climatic condition of an area in eight different classes. Through six urban parameter layers generated from the previous stage, the Thermal Load and Dynamic Potential of Kuala Lumpur are derived, and then, the two important layers are combined together to produce the UC-AnMap of Kuala Lumpur. The Thermal Load layer is generated using three urban parameter layers produced earlier; Building
Urban Climatic Analysis Mapping of Kuala Lumpur City
295Pertanika J. Soc. Sci. & Hum. 25 (S): 291 - 300 (2017)
Volume layer, Topographical Height layer and Green Space layer. By adding the pixel values (classification values) of the three layers involved, Thermal Load layer of Kuala Lumpur is produced. The resulted pixel values represent the impact of Thermal Load (warming effects) on the urban climate of Kuala Lumpur. Using three urban parameter layers generated from the previous stage - Building Coverage layer, Natural Landscape layer and Proximity to Openness layer - the Dynamic Potential layer is produced. Similar to Thermal Load layer, Dynamic Potential layer is portrayed by the sum of pixel values (classification values) stored in the layers involved. The resulted pixel values represent the impact values of Dynamic Potential (cooling effects) on the urban climate of Kuala Lumpur. UC-AnMap is a map that portrays the climatic information (condition) of an urban area using the collation of important climatic information through assessments made on Thermal Load and Dynamic Potential. In this study, the UC-AnMap of Kuala Lumpur is generated by simply adding the impact values of Thermal Load and Dynamic Potential. The values obtained represent the impacts of six urban parameters on the urban climate condition of Kuala Lumpur. The values are then reclassified into eight classification system (CUHK, 2012).
RESULTS AND DISCUSSION
Urban Parameter Layers
This study examined six urban parameters in order to analyse the two key issues: Thermal Load and Dynamic Potential. The study
maps the urban parameters into six different layers; building volume map, topographical height map, green space map, building coverage map, natural landscape map and openness map. In order to analyse the impact of the urban parameters, classification values were assigned to indicate their impact on the urban climate condition of Kuala Lumpur. Positive values of the layers involved in the generation of Thermal Load indicate negative impacts on the urban climate condition. On the other hand, the negative values of the layers involved in the generation of Dynamic Potential indicate positive impacts on the urban climate condition.
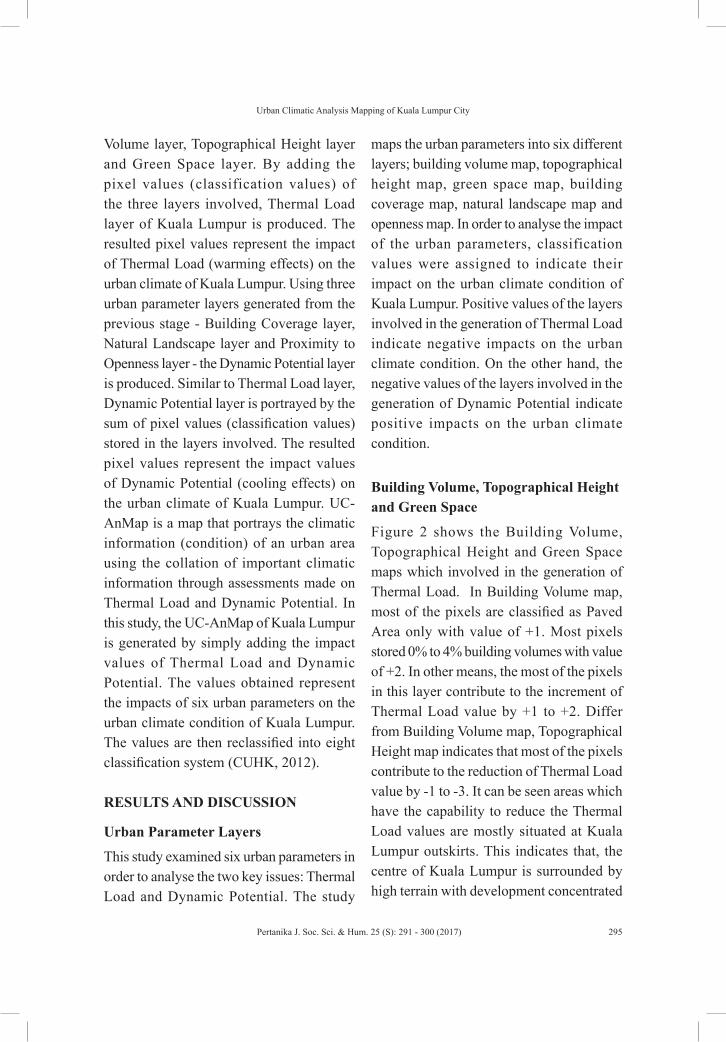
Building Volume, Topographical Height and Green Space
Figure 2 shows the Building Volume, Topographical Height and Green Space maps which involved in the generation of Thermal Load. In Building Volume map, most of the pixels are classified as Paved Area only with value of +1. Most pixels stored 0% to 4% building volumes with value of +2. In other means, the most of the pixels in this layer contribute to the increment of Thermal Load value by +1 to +2. Differ from Building Volume map, Topographical Height map indicates that most of the pixels contribute to the reduction of Thermal Load value by -1 to -3. It can be seen areas which have the capability to reduce the Thermal Load values are mostly situated at Kuala Lumpur outskirts. This indicates that, the centre of Kuala Lumpur is surrounded by high terrain with development concentrated
Nurul Amirah Isa, Wan Mohd Naim Wan Mohd, Siti Aekbal Salleh and Nur Atikah Md Nasrudin
296 Pertanika J. Soc. Sci. & Hum. 25 (S): 291 - 300 (2017)
in the lower altitude. Green Space map clearly shows that Kuala Lumpur is mostly covered by vegetated areas. Therefore, most
of the pixels in this layer contribute to the reduction of Thermal Load values with a value of -1.
Figure 2. Building Volume map, Topographical Height map and Green Space map
covered by vegetated areas. Therefore, most of the pixels in this layer
contribute to the reduction of Thermal Load values with a value of -1.
Figure 2. Building Volume map, Topographical Height map and Green Space
map
Ground Coverage, Natural Landscape and Proximity to Openness
contribution to Dynamic Potential
Figure 3 shows the maps of urban parameters to generate the Dynamic
Potential. Ground Coverage map indicates that most pixels of the areas in
Kuala Lumpur are not covered with built-up areas which increase the
Dynamic Potential values by -2. Natural Landscape map portrays that most
of the areas have high Dynamic Potential. Most pixels of the areas in Natural
Contribute to Thermal Load
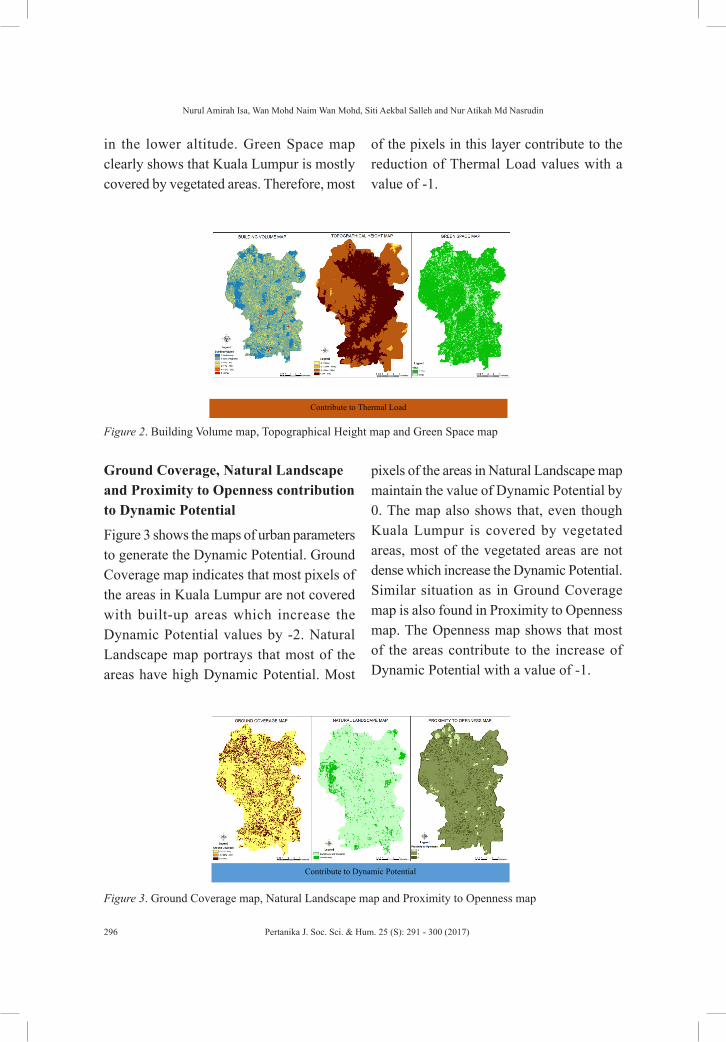
Ground Coverage, Natural Landscape and Proximity to Openness contribution to Dynamic Potential
Figure 3 shows the maps of urban parameters to generate the Dynamic Potential. Ground Coverage map indicates that most pixels of the areas in Kuala Lumpur are not covered with built-up areas which increase the Dynamic Potential values by -2. Natural Landscape map portrays that most of the areas have high Dynamic Potential. Most
pixels of the areas in Natural Landscape map maintain the value of Dynamic Potential by 0. The map also shows that, even though Kuala Lumpur is covered by vegetated areas, most of the vegetated areas are not dense which increase the Dynamic Potential. Similar situation as in Ground Coverage map is also found in Proximity to Openness map. The Openness map shows that most of the areas contribute to the increase of Dynamic Potential with a value of -1.
Figure 3. Ground Coverage map, Natural Landscape map and Proximity to Openness map
Landscape map maintain the value of Dynamic Potential by 0. The map also
shows that, even though Kuala Lumpur is covered by vegetated areas, most of
the vegetated areas are not dense which increase the Dynamic Potential.
Similar situation as in Ground Coverage map is also found in Proximity to
Openness map. The Openness map shows that most of the areas contribute to
the increase of Dynamic Potential with a value of -1.
Figure 3. Ground Coverage map, Natural Landscape map and Proximity to
Openness map
Thermal Load Layer and Dynamic Potential Layer
As mentioned earlier, Thermal Load has a negative influence on the urban
climate condition. Figure 4 shows the Thermal Load map of Kuala Lumpur.
Contribute to Dynamic Potential

Urban Climatic Analysis Mapping of Kuala Lumpur City
297Pertanika J. Soc. Sci. & Hum. 25 (S): 291 - 300 (2017)
Thermal Load Layer and Dynamic Potential Layer
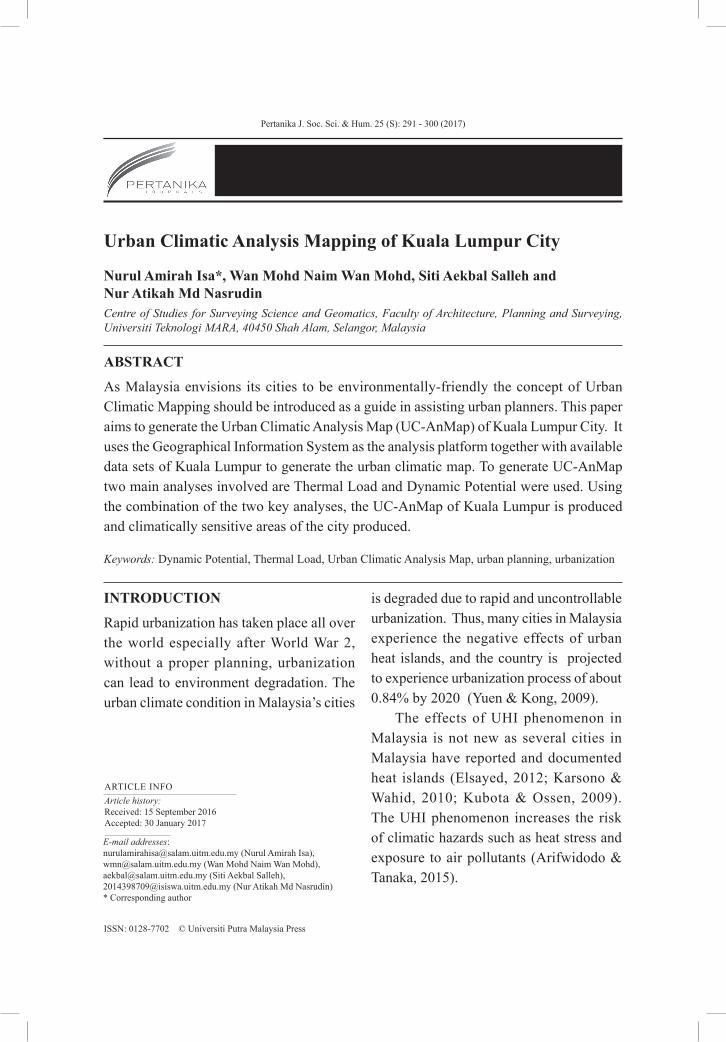
As mentioned earlier, Thermal Load has a negative influence on the urban climate condition. Figure 4 shows the Thermal Load map of Kuala Lumpur. The Thermal Load value ranged between -4 to 5; -4 indicates lowest value and 5 the highest value of Thermal Load. Based on the Thermal Load map, it can be concluded that the areas which have high Thermal Load are located
in the central part of Kuala Lumpur such as Bukit Bintang, areas are highly developed.
Figure 4 shows the Dynamic Potential layer of Kuala Lumpur. The Dynamic Potential value ranged between -4 to 1; -4 indicates highest value and 5 which indicates lowest value of Dynamic Potential. Even though the highest value of Dynamic Potential covers only a small area in Kuala Lumpur, it can clearly be seen that the city still allows air flow especially in northern regions of Kuala Lumpur such as Jinjang.
Figure 4. (a) The Thermal Load layer; and (b) Dynamic Potential layer of Kuala Lumpur (right)
The Thermal Load value ranged between -4 to 5; -4 indicates lowest value
and 5 the highest value of Thermal Load. Based on the Thermal Load map, it
can be concluded that the areas which have high Thermal Load are located in
the central part of Kuala Lumpur such as Bukit Bintang, areas are highly
developed.
Figure 4 shows the Dynamic Potential layer of Kuala Lumpur. The
Dynamic Potential value ranged between -4 to 1; -4 indicates highest value
and 5 which indicates lowest value of Dynamic Potential. Even though the
highest value of Dynamic Potential covers only a small area in Kuala
Lumpur, it can clearly be seen that the city still allows air flow especially in
northern regions of Kuala Lumpur such as Jinjang.
(a) (b)
Urban Climatic Analysis Map of Kuala Lumpur
The generated UC-AnMap is shown in Figure 5. Based on the result, the study proved that most of the areas in Kuala Lumpur can be classified as Neutral which covers approximately 48% of the study area. The areas which are classified as warming and cooling cover approximately 21% and 31% of the study area respectively. From the UC-AnMap produced, some regions
in Kuala Lumpur need proper mitigation measures. Based on the generated UC-AnMap, the climatically most sensitive areas (classified as Class 8) are within Kuala Lumpur City such as Bukit Bintang, Puduraya, Mid Valley City, KL Central and Jalan Raja Chulan. Therefore, urban planners and policy makers must take proper measures to mitigate critical climatically sensitive areas within the study area.
The map also indicated that the areas classified as warming areas are located in

Nurul Amirah Isa, Wan Mohd Naim Wan Mohd, Siti Aekbal Salleh and Nur Atikah Md Nasrudin
298 Pertanika J. Soc. Sci. & Hum. 25 (S): 291 - 300 (2017)
the central part of Kuala Lumpur which is also highly built-up. On the other hand, the cooling areas are mostly located within the outskirts of Kuala Lumpur city centre. Based on the results (UC-AnMap), it is clearly evident that Kuala Lumpur suffers urban heat island. The neutral areas surround warming areas forming coat-like regions and a boundary between warming areas and cooling areas.
CONCLUSION AND RECOMMENDATION
This study aims to generate UC-AnMap of Kuala Lumpur based on the study that was done in Hong Kong. Eight-class UC-AnMap was produced to highlight the climatically sensitive areas in Kuala Lumpur. Based on the result, this study proved that 21% of the study areas are categorized as warming classes, 31% of the areas categorized as cooling areas and 48% of the areas are neutral. It suggests some regions require mitigation to improve the climate condition
Figure 5. UC-AnMap of Kuala Lumpur, Malaysia
evident that Kuala Lumpur suffers urban heat island. The neutral areas
surround warming areas forming coat-like regions and a boundary between
warming areas and cooling areas.
Figure 5. UC-AnMap of Kuala Lumpur, Malaysia
CONCLUSION AND RECOMMENDATION
This study aims to generate UC-AnMap of Kuala Lumpur based on the study
that was done in Hong Kong. Eight-class UC-AnMap was produced to
highlight the climatically sensitive areas in Kuala Lumpur. Based on the
result, this study proved that 21% of the study areas are categorized as
warming classes, 31% of the areas categorized as cooling areas and 48% of
the areas are neutral. It suggests some regions require mitigation to improve
the climate condition and some regions should be preserved and maintained.
and some regions should be preserved and maintained. Through the generated UC-AnMap, the urban climatic condition of Kuala Lumpur is portrayed and can be used as a guide for urban planning especially for a better future development and sustainability.
This study employed the model which is designed to suit Hong Kong’s urban scenario. Even though both cities experience similar climate, there are several differences in terms of urban scenarios between these two cities. Therefore, a model which suits the City of Kuala Lumpur should be developed. A UC-AnMap should be able to translate the complex meteorological and climatological data into a simpler form of “language” to be easily understood by urban planners and policy makers.
ACKNOWLEDGEMENTS
The authors would like to express their gratitude to the Universiti Teknologi MARA (UiTM) for funding this project under Research Acculturation Grant Scheme (RAGS) 600-RMI/RAGS 5/3 (66/2015). The Landsat 8 OLI data was available from the U.S. Geological Survey (USGS).
REFERENCES Acero, J. A., Kupski, S., Arrizabalaga, J., &
Katzschner, L. (2015). Urban Climate Multi-Scale Modelling in Bilbao (Spain): a review. Procedia Engineering, 115, 3-11.
Arifwidodo, S. , & Tanaka, T. (2015). The Characteristics of Urban Heat Island in Bangkok, Thailand. Procedia - Social and Behavioral Sciences, 195, 423-428.

Urban Climatic Analysis Mapping of Kuala Lumpur City
299Pertanika J. Soc. Sci. & Hum. 25 (S): 291 - 300 (2017)
Baumuller, J., Esswein, H., Hoffman, U., Reuter, U., Weidenbacher, S., Nagel, T., & Flassak, T. (2009). Climate Atlas of A Metropolitan Region in Germany Based on GIS. Paper presented at the The Seventh International Conference on Urban Climate, Yokohama, Japan.
Burghard, R., Katzschner, L., Kupski, S., Chao, R., & Spit, T. (2010). Urban Climatic Map of Arnhem City. Retrieved from http://www.future-cities.eu/uploads/media/05_report_Heat_Map_of_Arnhem_2010_ENG.pdf
Buyadi, S. N. A., Mohd, W. M. N. W., & Misni, A. (2014). Impact of Vegetation Growth on Urban Surface Temperature Distribution. Paper presented at the 8th International Symposium of the Digital Earth, Sarawak, Malaysia.
Cavan, G., Lindley, S., & Smith, C. (2015). Urban Climatic Map Studies in UK: Greater Manchester. In E. Ng & C. Ren (Eds.), The Urban Climatic Map for Sustainable Urban Planning. United States of America: Routledge.
CUHK. (2012). Urban Climatic Map and Standards for Wind Environement - Feasibility Study (S. o. Architecture, Trans.). Hong Kong: Chinese University of Hong Kong.
Elsayed, I. (2012). Mitigating of the Urban Heat Island of the City of Kuala Lumpur, Malaysia. Middle-East Journal of Scientific Research, 11, 1602-1613.
Eum, J.-H., Scherer, D., Fehrenbach, U., Koppel, J., & Woo, J.-H. (2013). Integrating Urban Climate Into Urban Master Plans Using Spatially Distributed Information - The Seoul Example. Land Use Policy, 34, 223-232.
Houet, T., & Pigeon, G. (2011). Mapping Urban Climate Zones and Quantifying Climate Behaviors - An Application on Toulouse Urban Area (France). Environmental Pollution, 159, 2180-2192.
Ibrahim, I., Samah, A. A., & Fauzi, R. (2014). The Review for the Use of Urban Climatic Map in the Land Use Plan for Urban Planning. Urban Planning and Local Governance, 3, 95-110.
IPCC. (2014). Summary for Policy Makers. In: Climate Change 2014: Impacts, Adaptation and Vulnerability. (pp. 1-32). Cambridge: Cambridge University Press.
Karsono, B., & Wahid, J. (2010). The Issues of Urban Heat Island in the City. The Case of Tanjong City Marina and Jetty Districts, Penang Island, Malaysia. 1st International Conference of Sustainable Architecture and Urban Design, 1, 1-4.
Katzschner, L., & Burghardt, R. (2015). Urban Climatic Map Studies in Vietnam. In E. Ng & C. Ren (Eds.), The Urban Climatic Map for Sustainable Urban Planning. United States of America: Routledge.
Kubota, T., & Ossen, D. R. (2009). Spatial Characteristics of Urban Heat Island in Johor Bahru City, Malaysia. Paper presented at the 3rd Symposium of South East Asian Technical University Consortium (SEATUC), Johor, Malaysia.
Middel, A., Hab, K., Brazel, A., Martin, C., & Guhathakurta, S. (2014). Impact of Urban Form and Design on Mid-Afternoon Microclimate in Pheonix Local Climate Zones. Landscape and Urban Planning, 122, 16-28.
Mora, C. (2010). A Synthetic Map of the Climatopes of the Serra da Estrela (Portugal) Journal of Maps, 591-608.
Morris, K. I. (2016). Effect of Vegetation and Water Body on the Garden CIty Concept: An Evaluation Study Using a Newly Developed City, Putrajaya, Malaysia. Computers, Environment and Urban Systems, 58, 39-51.

Nurul Amirah Isa, Wan Mohd Naim Wan Mohd, Siti Aekbal Salleh and Nur Atikah Md Nasrudin
300 Pertanika J. Soc. Sci. & Hum. 25 (S): 291 - 300 (2017)
Ng, E., Chao, R., Katzschner, L., & Yau, R. (2009). Urban Climatic Studies for Hot and Humid Tropical Coastal City of Hong Kong. Paper presented at the The Seventh International Conference on Urban Climate Yokohama, Japan.
Ng, E., Katzschner, L., Cheng, V., & Lau, C. (2008). Urban Climate - an Experience from Hong Kong. Paper presented at the 25th Conference on Passive and Low Energy Architecture, Dublin, Ireland.
Ren, C., Lau, K. L., Yiu, K. P., & Ng, E. (2013). The Application of Urban Climatic Mapping to the Urban Planning of High-Density Cities: the Case of Kaohsiung, Taiwan. Cities, 31, 1-16.
Ren, C., Ng, E., & Katzschner, L. (2007). An Investigation Into Developing an Urban Climatic Map for High Density Living-Initial Study in Hong Kong. Paper presented at the 2nd PALENC Conference and 28th AIVC Conference on Building Low Energy Cooling and Advanced Ventilation Technologies in the 21st Century, Crete Island, Greece.
Ren, C., Ng, E., & Katzschner, L. (2010). Urban Climatic Map Studies: A Review. International Journal of Climatology.
Ren, C., Spit, T., Lenzholzer, S., Yim, H. L. S., Heusinkveld, B., Hove, B. v., . . . Katzschner, L. (2012). Urban Climate Map System for Dutch Spatial Planning. International Journal of Applied Earth Observation and Geoinformation, 18, 207-221.
Salleh, S. A., Latif, Z. A., Pradhan, B., Mohd, W. M. N. W., & Chan, A. (2013). Functional Relation of Land Surface Albedo with Climatological Variables: a Review on Remote Sensing Techniques and Recent Research Development. Geocarto International, 1-17.
Tanaka, T., Ogasawara, T., Koshi, H., & Yoshida, S. (2009). Urban Environmental Climate Maps for Supporting Urban-Planning Related Work of Local Governments in Japan: Case Studies of Yokohama and Sakai. Paper presented at the The Seventh International Conference on Urban Climate, Yokohama, Japan.
Wienert, U., & Kuttler, W. (2005). The Dependence of the Urban Heat Island Intensity on Latitude - A Statistical Approach. Meteorologische Zeitschrift, 14(5), 677-686.
Wong, N.-H., Jusuf, S. K., Katzscher, L., & Ng, E. (2015). Urban Climatic Map Studies in Singapore. In E. Ng & C. Ren (Eds.), The Urban Climatic Map for Sustainable Urban Planning. United States of America: Routledge.
Yoda, H. (2009). Climate Atlas in Fukuoka City. Paper presented at the The Seventh International Conference on Urban Climate, Yokohama, Japan.
Yuen, B., & Kong, L. (2009). Climate Change and Urban Planning in Southeast Asia. Paper presented at the Fifth Urban Research Symposium, Marseille, France
Zhao, C., Fu, G., Liu, X., & Fu, F. (2011). Urban Planning Indicators, Morphology and Climate Indicators: A Case Study For a North-South Transect of Beijing, China. Building and Environment, 46, 1174-1183.