Embed Size (px)
Citation preview
URBAN CLIMATE ACTION IMPACTS FRAMEWORKA Framework for Describing and Measuring the Wider Impacts of Urban Climate Action

>03URBAN CLIMATE ACTION IMPACTS FRAMEWORK
>>>>>>>>>>>>>>>>>>>>>>>>>ACKNOWLEDGEMENTSThis project was delivered by a team composed of C40 and Ramboll experts. Experts from other organisations and city representatives contributed to the project by providing input and feedback at several stages of the process. We would like to thank the organisations who contributed to the development of the Urban Climate Action Impacts Framework, by providing advice and feedback to the team.
>>>>>>>>>>>>>>>>>>>>>>>>>AUTHORSRamboll:
Samy Porteron
Jonathan Leonardsen
Fredrik Hahn
Karin Attström
Henrik Stener Pedersen
Ramboll is a leading engineering, design and consultancy company founded in Denmark in 1945. We employ 13,000 experts and have a strong presence in the Nordics, North America, the UK, Continental Europe, Middle East and India, supplemented by a significant representation in Asia, Australia, South America and Sub-Saharan Africa.
With almost 300 offices in 35 countries, we emphasise local experience combined with a global knowledge-base. We constantly strive to achieve inspiring and exacting solutions that make a genuine difference to our customers, end-users and society.
Ramboll acknowledges that there is a need for a global evidence base to enable cities to develop and implement climate actions, that benefit the wider society and environment. By supporting the development of a common framework for building a global evidence base on impacts of climate action, Ramboll hopes that cities will take a data and evidence based approach to urban climate actions.
For more information, visit http://www.ramboll.com
Two organisations who have funded and led this work. The work was also supported by staff from fourteen cities, including:
Athens
Barcelona
Buenos Aires
Cape Town
Chennai
Johannesburg
New York
Paris
Quezon City
Santiago
Seattle
Seoul
Sydney
Wuhan
C40 Cities Climate Leadership Group:
Tom Bailey
Sabrina Gander
Rachel Huxley
Caterina Sarfatti
The C40 Cities Climate Leadership Group connects more than 90 of the world’s greatest cities, representing over 650 million people and one quarter of the global economy.
Created and led by cities, C40 is focused on tackling climate change and driving urban action that reduces greenhouse gas emissions and climate risks, while increasing the health, wellbeing and economic opportunities of urban citizens.

>05URBAN CLIMATE ACTION IMPACTS FRAMEWORK
TABLE OF CONTENTS
OVERVIEW 06
0I INTRODUCTION 081.1 Background 10
1.2 Methodology 12
02 THE URBAN CLIMATE ACTION IMPACTS FRAMEWORK I42.1 Overview of the Framework 16
2.2 Glossary 17
2.3 Principles for using the Framework 18
2.3 Limitations of the Framework 21
03 CLIMATE ACTION IMPACTS TAXONOMY 223.1 Introducing the Taxonomy as a common language for impacts of urban climate actions 24
3.2 Structure of the Taxonomy 24
3.3 How to use the Taxonomy 27
3.4 Taxonomy tables 28
3.5 Prioritising Impacts for Data Collection 33
04 CLIMATE ACTION IMPACTS PATHWAYS 344.1 Introducing Pathways as an evidence based approach to identifying impacts 36
4.2 The first map of urban complexity 39
4.3 Structure of the Pathways 40
4.4 How to develop Pathways 43
4.5 Detailed example of a Pathway: Bus Rapid Transit 46
05 IMPACTS MEASUREMENT IN CITIES: A PRACTICAL GUIDE 525.1 Introduction 54
5.2 The approach to measuring impacts 54
5.3 Action and impact selection 57
5.4 Data collection 57
5.5 Data analysis 60
5.6 Summary of ‘watch outs’ for the measurement of climate action impacts 61
06 THE WAY FORWARD 62
ANNEXES 66Annex I - Reference material provided by the Expert Review Group 68
Annex II - Climate Action Tool Map 68
Annex III - Suggested indicators for the Climate Action Impacts Taxonomy 71
>07URBAN CLIMATE ACTION IMPACTS FRAMEWORK
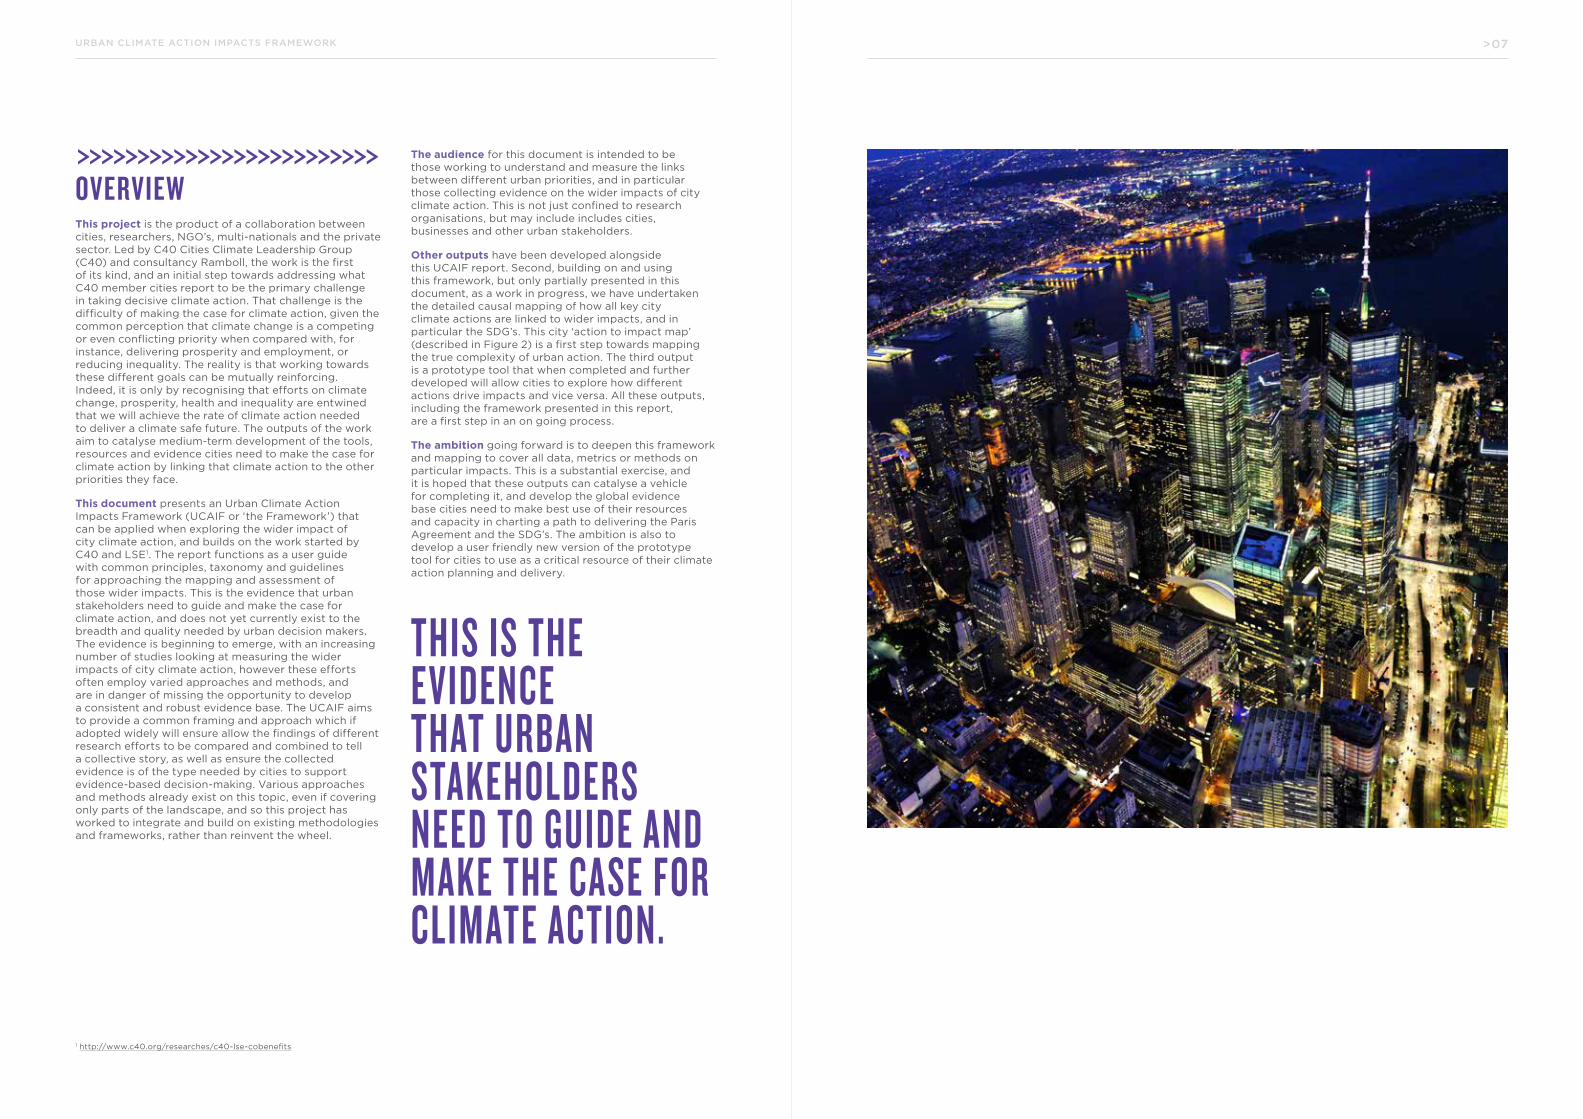
>>>>>>>>>>>>>>>>>>>>>>>>>OVERVIEWThis project is the product of a collaboration between cities, researchers, NGO’s, multi-nationals and the private sector. Led by C40 Cities Climate Leadership Group (C40) and consultancy Ramboll, the work is the first of its kind, and an initial step towards addressing what C40 member cities report to be the primary challenge in taking decisive climate action. That challenge is the difficulty of making the case for climate action, given the common perception that climate change is a competing or even conflicting priority when compared with, for instance, delivering prosperity and employment, or reducing inequality. The reality is that working towards these different goals can be mutually reinforcing. Indeed, it is only by recognising that efforts on climate change, prosperity, health and inequality are entwined that we will achieve the rate of climate action needed to deliver a climate safe future. The outputs of the work aim to catalyse medium-term development of the tools, resources and evidence cities need to make the case for climate action by linking that climate action to the other priorities they face.
This document presents an Urban Climate Action Impacts Framework (UCAIF or ‘the Framework’) that can be applied when exploring the wider impact of city climate action, and builds on the work started by C40 and LSE1. The report functions as a user guide with common principles, taxonomy and guidelines for approaching the mapping and assessment of those wider impacts. This is the evidence that urban stakeholders need to guide and make the case for climate action, and does not yet currently exist to the breadth and quality needed by urban decision makers. The evidence is beginning to emerge, with an increasing number of studies looking at measuring the wider impacts of city climate action, however these efforts often employ varied approaches and methods, and are in danger of missing the opportunity to develop a consistent and robust evidence base. The UCAIF aims to provide a common framing and approach which if adopted widely will ensure allow the findings of different research efforts to be compared and combined to tell a collective story, as well as ensure the collected evidence is of the type needed by cities to support evidence-based decision-making. Various approaches and methods already exist on this topic, even if covering only parts of the landscape, and so this project has worked to integrate and build on existing methodologies and frameworks, rather than reinvent the wheel.
1 http://www.c40.org/researches/c40-lse-cobenefits
The audience for this document is intended to be those working to understand and measure the links between different urban priorities, and in particular those collecting evidence on the wider impacts of city climate action. This is not just confined to research organisations, but may include includes cities, businesses and other urban stakeholders.
Other outputs have been developed alongside this UCAIF report. Second, building on and using this framework, but only partially presented in this document, as a work in progress, we have undertaken the detailed causal mapping of how all key city climate actions are linked to wider impacts, and in particular the SDG’s. This city ‘action to impact map’ (described in Figure 2) is a first step towards mapping the true complexity of urban action. The third output is a prototype tool that when completed and further developed will allow cities to explore how different actions drive impacts and vice versa. All these outputs, including the framework presented in this report, are a first step in an on going process.
The ambition going forward is to deepen this framework and mapping to cover all data, metrics or methods on particular impacts. This is a substantial exercise, and it is hoped that these outputs can catalyse a vehicle for completing it, and develop the global evidence base cities need to make best use of their resources and capacity in charting a path to delivering the Paris Agreement and the SDG’s. The ambition is also to develop a user friendly new version of the prototype tool for cities to use as a critical resource of their climate action planning and delivery.
THIS IS THE EVIDENCE THAT URBAN STAKEHOLDERS NEED TO GUIDE AND MAKE THE CASE FOR CLIMATE ACTION.

0IINTRODUCTION
>09URBAN CLIMATE ACTION IMPACTS FRAMEWORK

>11URBAN CLIMATE ACTION IMPACTS FRAMEWORK
>>>>>>>>>>>>>>>>>>>>>>>>>I .I BACKGROUNDCities must be at the forefront of efforts to deliver the Paris agreement and avoid the worst of climate change, as they will bear the brunt of its effects. As our climate changes, cities, with their high populations, often being coastal, sometimes remote from water or food supplies, are particularly exposed to the increased frequency of storms, floods, droughts and heat waves. Cities are also the global hubs for economic growth and so account for over 70% of global energy emissions2. When emissions associated with consumption are included, it is clear cities are a primary driver of GHG emissions globally. Without urgent and transformative city climate action, delivering a climate safe future, as defined and committed to internationally with the signing of the COP21 Paris Agreement, will be impossible. This is why the C40 Cities Climate Leadership Group (C40) is committed to delivering that agreement, and has established the C40 Deadline 2020 Program, which aims to support every C40 city in establishing a Climate Action Plan (CAP) to put the city on a trajectory consistent with the ambition of the Paris Agreement. This includes the aim of limiting global temperatures to the only climate safe level of 1.5 degrees.
As the urban population continues to bloom, cities leaders must deal with multiple urgent priorities. Achieving the ambition of the Paris Agreement will require deep transformation in all cities, and yet climate change is far from the only topic on the agenda for citizens and their leaders. With 1.4 million extra citizens added to the urban population every week3, cities are increasingly at the confluence of multiple pressures and challenges. Overpopulation, aging and overstretched infrastructure, frustrated employment expectations, growing inequality, lack of adequate and affordable housing, deteriorating air quality or insufficient access to sanitation and amenities, to name but a few. Maintaining and improving conditions for citizens will be crucial to meeting the Sustainable Development Goals. Rates of urbanisation, and their associated challenges, are particularly acute for cities in the developing world. In global cities, inequality increasingly manifests as sprawling slums where the urban majority face an acute lack of access to land, housing, basic services and livelihoods. According to UN-Habitat, one in eight people – or approximately one billion people – presently live in slum conditions. Action on these various agendas must be transformative, but also urgent, to avoid locking in negative trajectories.
In the context of all these complex challenges, making the case for decisive action on climate change can be difficult. Indeed, the evidence behind C40’s report, Unlocking Climate Action in Megacities, demonstrates that the leading challenge C40 cities face in delivering transformative climate action is winning support in the face of these competing agendas. When considering how to address these myriad challenges, it can be tempting for city leaders, and for citizens and communities as well, to see climate action as separate from other priorities such as inclusion, growth or health. In some cases, these are even seen to be in direct conflict with each other in terms of deciding where to focus attention, resources and action. This instinctual prioritisation of other agendas over climate can mean city stakeholders are not open to considering or supporting climate action, and is often a strong challenge in global south cities, where other urban challenges are particularly prevalent. This is despite the reality that the human and economic costs of significant levels of global warming will be tremendous.
There is however, a very strong case to be made, with climate action delivering multiple wider benefits. To ensure a climate safe future this challenge must be overcome, quickly. Ambitious climate action must be presented to city stakeholders in a way that can help open the door for a huge ramping up of delivery. Happily, a city leader needn’t choose between a climate safe future tomorrow and prosperity today. A city needn’t eradicate all poverty before considering taking action on climate change. Increasingly, the evidence is that the most prosperous urban development approach is a sustainable one, as shown in the recent New Climate Economy report Seizing the Global Opportunity, which demonstrates that cities investing in low carbon development will raise living standards faster and embed stronger economic growth than those that stick with the old fossil fuel model. As outlined by Pope Francis in his 2015 encyclical Laudate si, and in many speeches since, climate change is not solely an environmental issue, but is inextricably linked to challenges of eradicating poverty and increasing prosperity. As C40’s report – Benefits of Climate Action – shows, many climate actions can produce multiple benefits, including improved health outcomes (and lower healthcare costs), reduced expenses, improved air quality, job opportunities, liveability, economic competitiveness, etc. These benefits of climate action – if fairly distributed and accessible to all segments of the population – can become powerful tools for more and better designed climate actions in cities and are critical to reducing barriers to action.
The lack of evidence and support available to cities on how climate change relates to health and prosperity must be addressed. This complexity makes taking decisive action very challenging, in terms of understanding the interlinkages between urban agendas, and then comparing and prioritising them. There is yet no framework on how to relate the wide range of priorities city leaders are working towards to understand where the cross overs are, the best ways to deliver multiple objectives, or the trade-offs. These remain the biggest barriers for cities. Even in cases where generally climate action is accepted as a priority, cities, their leaders and staff, often do not have the locally specific tools and evidence to, one, design action plans that maximize these benefits and are equitable, and two, then persuade all stakeholders of these benefits. For instance, a city may be considering a congestion charge, recognising that it can be an effective climate action, and also deliver significant other benefits such as productivity improvements from reduced congestion, or improved citizen health through better air quality. However, without evidence on how significant these impacts are likely to be for that city, cities cannot make a firm case, or counter opposition to the action.
This project aims to take the first and vital step towards providing cities with the resources they need to understand and make the case for climate action. From 2015-2016, C40 undertook two studies investigating whether there is solid evidence on these wider benefits. The first work was conducted with several C40 cities to consider what evidence is available within city authorities themselves4. The findings indicate that most cities have little or no such data, that they have limited conventional data on their own city operations and functions which complicates attempts to establish local impacts, and even if data exists, cities often can lack the resources, tools and expertise to use it to guide decision making processes. The second study, in partnership with LSE Cities, examined the status of the evidence across academia5. The findings were universal. While there may be lots of anecdotal evidence of the wider impact of climate action, there has been far from sufficient assessment of the wider impacts, and we remain some way from a global, thematically comprehensive, robust evidence base. Where evidence and methods do exist, they see huge variation in the frameworks, methods, indicators and metrics, often lack robustness, are inaccessible to cities (not published or in a format not appropriate for non-specialists), and are mostly ex-ante. The evidence is not in the form needed by city leaders and policy makers to make the wider case and effect proper action.
It is clear there is an urgent need to establish such an evidence base, and this project aims to take the first step in responding to this challenge. The Urban Climate Action Impacts Framework (UCAIF or ‘the Framework’) presented in this report, builds on the work started by C40 and LSE Cities, to provide a response to this challenge. It is a first attempt at providing a structure for the collection of evidence on the wider impacts of climate policies and in shedding light on the process by which they occur. As mentioned above, the Framework is composed of a Climate Action Impacts Taxonomy (‘the Taxonomy’) and a set of intervention logics mapping the Climate Action Impacts Pathways (‘the Pathways’) that describe the causal chains from cities’ actions to their possible positive and negative impacts.
As this is a first step, the work will be on-going and continue to involve a broad range of experts and stakeholders contributing to making this Framework complete and fit for purpose. This entails further refining the Taxonomy and delving deeper into each Pathway, establishing methods, and gathering indicators, example case studies and statistics. These are aimed to be made available to cities and researchers.
2 http://www.c40.org/why_cities3 https://www.pwc.co.uk/sustainability-climate-change/assets/cities-and-urbanisation-brochure-final-v2.pdf
4 The Co-Benefits of Sustainable City Projects5 Co-benefits of urban climate action: A framework for cities
THE EVIDENCE IS THAT THE MOST PROSPEROUS URBAN DEVELOPMENT APPROACH IS A SUSTAINABLE ONE.

>13URBAN CLIMATE ACTION IMPACTS FRAMEWORK
>>>>>>>>>>>>>>>>>>>>>>>>>I .2 METHODOLOGYThe box below provides a summary of the methodology used to develop the Framework.
METHODOLOGY FOR DEVELOPING THE URBAN CLIMATE ACTION IMPACTS FRAMEWORK
The project is a joint effort between C40 and Ramboll in developing the UCAIF, supported by an Expert Review Group (ERG) and City Advisory Group (CAG). The ERG was composed of experts from sixteen NGOs, international governmental organisations, consultancies, and think tank organisations, and all are currently active in addressing urban issues today. The CAG was composed of public servants from fourteen C40 member cities. Another six cities (Boston, Los Angeles, Mexico City, London, Durban, Melbourne) were consulted during a workshop on inclusive climate action on the Framework and the prototype tool.
At several stages of the project, the two review groups were consulted for input and feedback to the work. The aim of the consultative process was to make sure the UCAIF becomes a relevant and helpful framework for researchers and policymakers, by addressing their different needs.
The project started from a review of 17 frameworks and studies already used by the ERG members (see Annex I - Reference material provided by the Expert Review Group). These existing frameworks were selected because of their focus on the ‘co-benefits’ of climate action in cities and served as an input to developing a Climate Action Impacts Taxonomy and Pathways (presented in sections 3 and 4).
The review of literature and expert opinions provided the evidence for conceptualising and structuring the elements of the Taxonomy and the Pathways. The end objective being to ensure coherence, comprehensiveness and relative ease of understanding for practitioners using, as well as contributing to, the Framework. The tables below introduce these elements in the logical order of scale (for the Taxonomy; for larger to smaller categories) and in the order of reading (for the Pathways; from top to bottom). They are described in more detail in the respective sections (3 and 4).
1. Studies were reviewed and coded systematicallyusing qualitative data analysis. Using qualitativedata analysis made it possible to highlight andextract pieces of text from documents andlabel them under predefined coding categories.Coding supported the definition of frameworkconcepts as well as the identification of potentialimpacts of cities’ climate actions.
2. The coded text was then extracted andtransposed into a database to help data sortingand identify elements of the intervention logicfrom the text. The main elements sought were8:types of city actions; types of C40 sectorsthe actions fall under; immediate results ofthe actions (outputs); behavioural changes oreffects from the actions (outcomes); or impactsof the actions.
3. The data originating from the reviewedstudies and stakeholder and workshop inputwas organised in an intervention logic (thePathways). The intervention logic is a largeflowchart which maps the causal chain ofimpacts resulting from climate interventions.
4. A prototype tool was created, which is aninteractive version of the intervention logicwhere the Pathways are navigable andcontain additional information including casestudies, references, indicators, best practiceand methods, and considerations on equity.This prototype was presented by C40 in twoinstances for feedback.
Climate Action Impacts Taxonomy elements
Theme
Impact group
Impact
Specific impact
Indicator
Climate Action Impacts Pathways elements
Sector: based on C40 networks6
Action: based on Deadline 2020 report list7
Output
Outcome
Impact
Final impact categories
The Urban Climate Action Impacts Framework aims to develop a global evidence base and to map the process by which a climate action or policy translate into a change for the society, economy, or environment. It is based on tools commonly used in policy analysis:
• The cost-benefit analysis (CBA) and impactassessment (IA), where impacts are identified,assessed, measured and quantified,
• The intervention logic, where causal links betweenactions and impacts are mapped in pathways,(see section 3).
At the time of writing, a prototype tool has been established as an example of how the Framework can be developed into an interactive map designed to host expert research and practical city experiences on the wider impacts of climate action (see section 4). Such a tool should aim to support the development of a global evidence base on the wider impacts of climate action, informing policy planning of the wider impacts of climate action and enabling cities to make the case to their stakeholders and to plan and prioritise action.
The Framework is a first effort of its kind. As such, the process faced the challenge of creating a common terminology based on the reviewed literature and previous C40 work. To address this challenge, expert input was crucial. The review of the ERG and CRG has thus facilitated the development of a clear Framework for both experts and cities.
The Framework was developed using an iterative approach, whereby the development of the Framework’s structure, its concepts and the creation of first intervention logics (Pathways) and the prototype tool were conducted in parallel, using the literature and discussions with partners. This work should be seen as a first step towards a unified Framework, which will continue to evolve and develop as the body of evidence on the impacts of urban climate action grows. The literature reviewed did not include a wide range of individual case studies but rather broad reviews. All the elements of the Framework are expected to be refined and potentially evolve to become even more comprehensive, coherent and useful.
The following sections detail the Framework by summarising the key concepts and the architecture, before describing it in more detail in sections 2 and 3.
6 http://www.c40.org/networks7 Deadline 2020 – How cities will get the job done – ‘Assumptions and Inputs’, C40 & ARUP, 2016. See http://www.c40.org/other/deadline_2020 and Annex V of this report.8 See Table 3 in section 4.3 for definitions and examples for each of these terms.

02THE URBAN CLIMATE ACTION IMPACTS FRAMEWORK
>15URBAN CLIMATE ACTION IMPACTS FRAMEWORK

>17URBAN CLIMATE ACTION IMPACTS FRAMEWORK
>>>>>>>>>>>>>>>>>>>>>>>>>2.I OVERVIEW OFTHE FRAMEWORKThe different components of the Framework’s architecture are briefly described below, before being presented in more detail in later sections of the report.
By using the Framework, cities, experts and other stakeholders will be able to explore and provide evidence on how urban climate action translates into wider impacts for society, health, the economy and the environment. The Framework can be used from top to bottom, or from bottom to top: a user can choose an action and trace its pathway down to its impacts, or start from the bottom with impacts and find the actions that can lead to it.
The key elements of the framework include:
• The Deadline 2020 Climate Actions list: Providesa catalogue or repository of urban climate actionsdeveloped for the Deadline 2020 report (see AnnexV)9.This is the action typology used by C40 membercities in their work on mitigation and adaptation.
• The Climate Action Impacts Taxonomy: Provides aunified approach to defining and measuring impactsof urban climate actions. The Climate Action ImpactsTaxonomy is the main output offered by the frameworkto provide this common language globally: it is aproposed classification of the impacts of urban climateactions, and offers indicators to enable a coherentapproach to measuring impacts (listed in Annex II).
• The Climate Action Impacts Pathways: Identifyand illustrate how urban climate actions translateinto impacts, with the intermediary steps andinter-relations. It is based on available evidence onoutputs, outcomes and impacts of urban climateaction. Pathways are inspired by the ‘interventionlogic’, designed to support the information needsof commonly used policy analysis tools such asthe cost-benefit analysis (CBA) and the impactassessment (IA).
This UCAIF is an effort to provide a common language and a common approach for cities and researchers who, when monitoring and assessing the effects of climate actions, can contribute to a global evidence base by reporting data in a standardised manner (following the same terminology, taxonomy, methods and tools). The benefit of standardised approaches and data is that it enhances the comparability of findings between cities. At the same time, the Framework is applicable in all cities and their different urban contexts. Nevertheless, it is crucial to say that the Framework is not a new compulsary reporting system for cities. Cities may use it as useful for them and it does not imply and never will a new reporting mandatory request under their C40 membership.
When conducting a CBA or an IA, users of the Framework can choose existing—or develop their own—indicators tailored to measuring the impacts of an action. The Framework offers a set of quantitative indicators adapted to measuring variables of impacts (listed in Annex II). Indicators can be used to understand the extent of a problem before any action is taken, but also to monitor its evolution, and evaluate the impact of policies after their implementation.
>>>>>>>>>>>>>>>>>>>>>>>>>2.2 GLOSSARYTable 1 outlines the key concepts and the main elements articulating the Framework. For example, equity is a core concept of this framework as well as one of its guiding principles. These concepts are based on common definitions but operationalised for this framework.
Figure 1. The Urban Climate Action Impacts Framework
Table 1. Key terms and concepts
NET-IMPACT
The effects of an action on the economy, environment, society. This project focuses on the additional non-climate impacts of urban climate actions. A full impact, or net impact, is only understood when both of the following are considered,
• Negative impacts, or costs,
• Positive impacts, or benefits.
EX-ANTE & EX-POST
Ex-ante is the term used to refer to impact studies or CBA conducted prior to the intervention, or city action in the context of this Framework. Ex-post refers to impact studies or CBA conducted after the intervention or city action. The Framework prefers the use of ex-post studies, as these contain actual data on the impacts of an action (rather than models and predictions).
INDICATOR
Indicators are means of measuring the state or level of an impacted phenomenon. They are expressed using metrics which define their units of measurement. For example, air quality is measured in the concentration of certain particles or molecules in the air, such as milligrams of particulate matters per cubic meter of air, or parts-per-million (ppm).
CONTINGENCYContextual factors which affect the outcomes and impacts of an action implemented in a city, due to the city’s characteristics (for example its political context, social issues, economic development, climatic conditions, etc.).
EQUITY
According to the World Health Organization, equity is the absence of avoidable or remediable differences among groups of people, whether those groups are defined socially, economically, demographically, or geographically10. In the context of city climate action, creating equity means ensuring the fair distribution of negative and positive impacts of climate action across different groups of a city’s population. See section 2.4 for more details on how equity, or the distribution of impacts, is core to any assessment of the wider benefits of climate action.
INCLUSIVITY
The practice of including relevant stakeholders in the policy-making and urban governance process, particularly disadvantaged groups, in order to create equity and ensure a fair policy process with successful outcomes. Three important pillars of inclusive urban climate action include:
• the wider benefits of climate action and their distribution (inclusivity of the impact/equity);
• fairness and accessibility of urban climate strategies and services (inclusivity of the output/fairness)
• capacity to engage inhabitants and stakeholders (inclusivity of the process/inclusion).
Note: C40 sectors are based on the C40 Initiatives and Networks. http://www.c40.org/networks
9 Deadline 2020 – How cities will get the job done – ‘Assumptions and Inputs’, C40 & ARUP, 2016. See http://www.c40.org/other/deadline_2020 10 World Health Organization, Equity.
CL
IMA
TE
AC
TIO
NIM
PA
CT
S P
AT
HW
AY
ACTION
OUTPUTS
OUTCOMES
IMPACTS(costs and benefits)
PATHWAYS STEPS FRAMEWORK ARCHITECTURE
C40 Sectors
(Listing and grouping urban climate actions)
C40 Sectors
(Linking actions to impacts)
Climate Actions Impacts Taxonomy
(Classifying impacts into categories)

>19URBAN CLIMATE ACTION IMPACTS FRAMEWORK
>>>>>>>>>>>>>>>>>>>>>>>>>2.3 PRINCIPLES FOR USING THE FRAMEWORKContributors and users of the UCAIF are encouraged to adhere to the following set of principles. These principles are key to comprehensively inform policymaking towards successful and equitable climate action.
The distribution of an impact (whether it is equitable) is primary. A leading principle in making the case for climate action is to properly understand and communicate not just the magnitude of the impacts of action, but how they are distributed. In many cases, to only measure the net magnitude of an impact, for instance the creation of new jobs across a city, is a limited and potentially unhelpful framing. For instance, if the net growth in jobs was focused on a part of the population where employment is already high, such as high skilled workers, but detracts from those in areas
of high unemployment, this could be an inequitable and possibly damaging action. Furthermore, the same impact can have a different significance for different segments of the population. For instance, savings on energy bills resulting from a housing retrofit program will be of far greater significance for lower income households for whom energy is a large portion of monthly outgoings, particularly those currently experiencing “fuel poverty”. For wealthier households with much larger disposable incomes, the significance of the same cost saving would be far lower. As a city leader working to support citizens and make the case for action, this information is critical if the right case is going to be made to the right people. For these reasons, it is considered vital in all cases to assess the distribution of expected impacts across different segments of the urban population. There are a wide range of different groups within a city, as outlined in Table 2 below. It is key that evidence collection considers which of these groups will be of significance from an equity standpoint for a given climate action, and works to capture the distribution.
Table 2. Relevant population categories for assessing impacts distribution.
STAKEHOLDER TYPE
Households, private sector, public sector, civil society.
INCOME LEVEL Income categories (defined relative to the local/national economy).
RACE AND ETHNICITY
Majority and minority cultural or ethnic groups, including religious backgrounds.
AGE CATEGORY
Segmented along ages and depending on the type of impact measured, for example employment among the young adult category may be set between 15-24 years of age.
SEX Biological sex, differentiated between male and female.
GENDER AND SEXUALITY
Categories of gender and sexual identities (lesbian, gay, bisexual, transsexual and intersex)11, beyond biological sex.
DISABILITY State of mental or physical health.
ECONOMIC ACTIVITY
Economically inactive (children, pensioners) or economically active (employed, unemployed) populations; and their occupation or sector of activity.
AREAS OF THE CITY
Spatial distribution across neighbourhoods, districts, axes, or other delimitation.
MIGRATION STATUS
Locals, expatriates, documented or undocumented migrants, refugees and asylum seekers.
11 Defined in the United Nations’ Free and Equal programme: https://www.unfe.org/

CLIMATE ACTIONS ARE NOT IMPLEMENTED IN A VACUUM, AND THEIR OUTCOMES NATURALLY DEPEND ON A RANGE OF LOCAL FACTORS. OFTEN, DIFFERENT CITIES WILL IMPLEMENT THE SAME ACTION WHICH RESULTS IN DIFFERENT IMPACTS.
>21URBAN CLIMATE ACTION IMPACTS FRAMEWORK
Considering both positive and negative impacts of actions. As outlined in the introduction, the medium term aim is to provide mayors and city officials with the resources to robustly make the non-climate case for climate action. For this case to be genuinely robust, C40 cities report that it is insufficient to only present the positive story, and that demonstrating that there is a “net-benefit”, considering both costs and benefits, is key. CBA and IA should factor in all costs and benefits rather than a selected few to provide a balanced and comprehensive assessment. By doing so, policymakers can understand both the possible positive and negative impacts of urban climate actions. The Framework can help understand the factors that lead to success of an action, and allows city planners to design actions which maximise benefits over costs.
Real data is more powerful than estimates. As with the above point, the more robust the evidence available when making the case for climate action the better. The ideal form of evidence to be used is therefore ex-post direct measurement of impacts associated with an action. As outlined in the report, Unlocking City Action12 this data is often not available. In the complex context of a city, a causal relationship between action and impact can be difficult to determine. However this type of evidence should always be prioritised if available.
Encourage a full systems approach. The Taxonomy and the UCAIF overall encourage stakeholders to approach urban climate action with a systemic perspective. Urban life is highly interconnected as the environment, society and the economy all impact each other in complex dynamics. People’s health and prosperity are intimately dependent on environmental management and biodiversity. Safety and fairness of jobs enhances physical and mental health. Good governance and social participation can improve all aspects of life in a city, from community-scale projects that enhance neighbourhood liveability to the better design and monitoring of policy. The aesthetic quality and cultural heritage of a city are a driver of tourism, migration and therefore economic prosperity. Improved equality is directly related to trust, civic participation, social cohesion and sustainability.
>>>>>>>>>>>>>>>>>>>>>>>>>2.4 LIMITATIONS OF THE FRAMEWORKAs described in the paragraph above on contingencies, urban climate action and the impacts produced are context dependent and similar actions may generate different impacts depending on the specific environment. In the literature, research on positive impacts of urban climate actions is often confined to a certain country or a specific city (for example Washington DC in Kats & Glassbrook (2016); DAMVAD (2015)13, as a part of evaluations and studies. Hence, the current Framework is a starting point to which new and additional evidence should be added. By continuously adding knowledge, the Framework will serve as a means to explore and gather evidence on similar climate actions carried out in a range of different contexts. As the scale of the evidence grows, it will enable cities and stakeholders to explore the causal linkages and impacts generated in different contexts.
Currently most countries or funding organisations have their own guidelines for conducting cost-benefit analyses in the preparatory stage of investments. The Urban Climate Action Impacts Framework is not intended to replace or duplicate these instruments. However, the Framework supports the development of an evidence base which allows for the collection and identification of tools and methods to calculate and quantify impacts (positive impacts vs. negative impacts) of climate actions, and strives towards establishing a more unified and comprehensive approach to cost-benefit analysis of urban climate actions.
The Framework does not yet provide detail on how to measure the scale or magnitude of the impacts, or provide evidence directly: it supports identifying relevant impacts and which population groups might be more affected. Impacts can be large or small and affect stakeholder groups differently, which is both a function of a city’s resources and objectives when planning an action and of the city’s context. However cities and stakeholders can build on information in the Framework to carry out their own CBA and IA to learn about the possible scale of impacts in their city. It also provides access to experiences from different cities, whenever indicator results and case studies are available.
12 C40 (2016). Unlocking Climate Action in Megacities. 13 See Annex I for the full list of references used for this project.
Taking into account contingencies affecting the success of climate action. Climate actions are not implemented in a vacuum, and their outcomes naturally depend on a range of local factors. Often, different cities will implement the same action which results in different impacts. These differences are due to all the contextual factors which define the conditions in which the action is implemented and how the action is implemented. These can be for instance political, social, economic or institutional. For a city leader or policy maker, this context is key in assessing whether a given action will be likely to have a similar impact as in other cases. While not setting out a detailed approach for dealing with these contingencies, the Framework encourages the identification of contingencies which affect the success of that action, by learning from previous related experience via case studies. Contingencies should be identified and analysed in case study research and ex-post CBA and IA: what were the factors which contributed to success or failure?
The example Pathways presented in this report do not elaborate on the factors that can affect the success or failure of city actions, however this exercise is common to many city-level research efforts and should be normal practice for all work reported under the UCAIF. Contigencies should be framed along different types of factors, for example governance modes, age structure of the urban population, level of political interest and support in the action, economic stability, and many other possible contingencies.
A non-biased framework. The Framework aims to be inclusive of all the possible impacts of city action. This includes but is not limited to climate impacts, both adaptation and mitigation. In this sense the framework has no “preference” or starting point amongst the different benefits, and all are considered evenly. This is opposed to starting from the intent to deliver climate change outcomes, and then aiming to discern the “co-benefits” that are delivered additionally to the main desired outcome, which is the approach of a number of other frameworks that exist. The intention is to maintain impartiality, and to avoid the impression that the framework, and hence any data collected with it, are biased in favour of climate action. The feedback from the cities of the CAG is that this would be the most compelling appraoch in making the case for action. Therefore the Taxonomy and causal Pathways place climate mitigation or adaptation impacts on the same level as all other impacts. Some actions will lead to strong climate impacts, some not, as is the case for any of the benefit groups. In this sense the Framework could be used to assess any type of city policy, however to be consistent with the scope of this project (unlocking climate action through providing cities with the evidence to make the case), only actions which have some climate impact (for mitigation and / or adaptation) are considered. This means that the Framework does not preclude the main objective of an action, for example whether it should drastically reduce greenhouse gas emissions or contribute more to economic prosperity.

03CLIMATE ACTION IMPACTS TAXONOMY
>23URBAN CLIMATE ACTION IMPACTS FRAMEWORKURBAN CLIMATE ACTION IMPACTS FRAMEWORK

>25URBAN CLIMATE ACTION IMPACTS FRAMEWORK
>>>>>>>>>>>>>>>>>>>>>>>>>3.I INTRODUCING THETAXONOMY AS A COMMON LANGUAGE FOR IMPACTS OF URBAN CLIMATE ACTIONSEfforts to collect data on the non-climate impacts of urban climate action have so far been fragmented. The terminology used to name different impacts, as well as the indicators and metrics employed14, have not allowed for cumulative knowledge generation. The Climate Action Impacts Taxonomy (‘the Taxonomy’) supports the objective of establishing a global evidence base on the wider impacts of urban climate actions by providing a coherent approach to collecting data. This will support researchers, consultants and impact analysts in their work and contributions to the Framework, but also ultimately help cities initially inform their impact assessments and make the case for climate action towards their stakeholders and funders as they gain access to a unified global evidence database.
In short, the Taxonomy aims at fulfilling four purposes:
• Provide a comprehensive classification of impactsof city action, and associate specific indicators toeach impact.
• Offer a common terminology for cities and experts tocommunicate to other experts and city stakeholdersabout the wider impacts of city action.
• Offer a common terminology and high-level,qualitative structure for cities assessing andunderstanding the wider impacts of theirclimate actions
• Focus data collection efforts towards identifyingimpacts from city actions which, will allow creatinga global database of relevant information (see section3.5 below on Prioritising Impacts for Data Collection).
The Climate Action Impacts Taxonomy is meant to be a dynamic repository of categorised impacts and indicators. The Taxonomy should develop to cover all possible impacts of urban climate action and provide means to measure them. The work presented here was based on literature reviewed and definitions offered from various sources. This has also led to developing a preliminary list of indicators, presented in Annex II. The project’s Expert Review Group and the City Advisory Group have also provided feedback to ensure that experts’ and cities’ perspectives or needs are reflected.
>>>>>>>>>>>>>>>>>>>>>>>>>3.2 STRUCTURE OF THE TAXONOMYThe Taxonomy systematically classifies impacts into four levels, going from overall themes of impact to specific impacts which is the most detailed level. By breaking down impacts from the broader to the more specific, it also facilitates the identification of indicators to measure specific impacts. A long list of proposed indicators collected during the project can be found in Annex II of this report. This list is expected to expand and become more exhaustive.
Figure 2. Extract from the Climate Action Impacts Taxonomy.
THEMEIMPACT GROUP
IMPACT (examples)
SPECIFIC GROUP (examples)
INDICATORS (examples)
SOCIAL
Health
Physical health
Healt hazards and death Life expectancy at birth
Disability Disability adjusted life years
Physical activityShare of time spent doing physical activity
Mental health
Stress Suicide rate
Dementia Incidence of dementia
Quality of life and urban liveability
HousingHousing affordability
Cost of rent as share of disposable income
Housing quality Living area per household
ECONOMICWealth and economy
Economic prosperity
Economic production Total city income (GDP)
Labour productivity GDP per job
EmploymentEmployment figures Unemployment rate
Job quality Earnings quality
Economic innovation
Innovation Number of patents created
Local sector develpoment Number of start-ups
ENVIRONMENTALEnvironmental quality
Biodiversity
Biodiversity protectionProportion of natural areas under protection
Ecosystem servicesDaily volume of natural freshwater extracted
Air quality
Indoor pollution Types of cooking fuels used
Outdoor air pollutionNumber of days above WHO pollutants recommendations
NoiseIndoor noise Indoor noise levels (dB)
Outdoor noise Noise level from traffic (dB)
14 A definition of ‘indicator’ is provided in Table 1 above. The list of proposed indicators can be found in Annex II.

>27URBAN CLIMATE ACTION IMPACTS FRAMEWORK
The classification in the Taxonomy begins with three themes: social impacts, economic impacts, and environmental impacts. The three themes are based on the commonly used ‘three pillars’ of sustainability15. These themes were chosen since they cover all areas of urban life and can therefore potentially encompass all the possible and relevant impacts of urban climate action. It is important to note that impacts tend to be cross-cutting, with effects into other themes than where they are categorised. For example, health has impacts on labour productivity.
Many examples can be given that highlight the interconnectivity of different aspects of urban life. This is captured by the UCAIF in the Climate Action Impacts Pathways (see next section). The classification of impacts offered in the Taxonomy aims to support systems thinking by acknowledging interconnections yet assigning impacts to separate categories so that they are bounded objects of measurement.
Description of the themes:
Social impacts relate to citizens’ health, urban life quality and liveability, culture and institutions. The impacts in this theme focus on people and their well-being, as well as the social and political structures that affect their lives, and their interaction with the urban environment.
Economic impacts relate to wealth, growth and the economy. The impacts in this theme focus on economic prosperity and sustainability, innovation and competitiveness, employment and private wealth, as well as public budgets. These impacts are easiest to monetise and tend to have a lot of importance when business cases for urban climate action are developed.
Environmental impacts relate to environmental quality. This term relates to the health of the urban environment, species and ecosystems. This group comprises types of impacts for different natural elements that are affected by human activities (species and ecosystems, air, noise, soil, light, water, temperature, and climate change).
The themes are further divided into three levels:
• Impact groups are the overall categorization ofthe impacts.
• Impacts are what a city is trying to achieve throughits actions. Impacts in the Taxonomy are also linkedwith the SDGs by their number.
• Specific impacts are operationalised sets of specificimpacts within each impact.
>>>>>>>>>>>>>>>>>>>>>>>>>3.3 HOW TO USE THE TAXONOMYThe Taxonomy is structured to be comprehensive and avoid overlap at the theme, impact group and impact level. Users of the Taxonomy should therefore avoid introducing new themes, impact groups, or impacts when reporting the results of their work. However, the definitions of the specific impacts are expected to change or vary as disciplines (for example social sciences, life sciences, and physical sciences) can offer different interpretations based on the methodology and basic assumptions of a study. Consequently, the Taxonomy is expected to evolve and certain specific impacts may become redundant or new ones added.
For each specific impact, indicators need to be identified by researchers. Some example indicators are provided in Annex II – Suggested indicators for the Climate Action Impacts Taxonomy that were discussed with the ERG and CAG. Over time, a common set of indicators should be developed which facilitates inter-city comparisons. SDG indicators are also provided at the level of specific impact which were selected from the UN Final list of proposed SDG indicators16. These UN indicators were designed to be used at a national level, and in some cases they may need to be adapted to a municipal level. A key issue to identifying this common set is the availability of data for the indicators. This needs to be reflected upon in future improvements of the UCAIF.
15 The three pillars are notably mentioned in Resolution 60/1 of the UN General Assembly during the 2005 World Summit. See http://data.unaids.org/topics/universalaccess/worldsummitoutcome_resolution_24oct2005_en.pdf 16 See the Report of the Inter-Agency and Expert Group on Sustainable Development Goal Indicators (E/CN.3/2016/2/Rev.1), Annex IV - Final list of proposed Sustainable Development Goal indicators.

>29URBAN CLIMATE ACTION IMPACTS FRAMEWORK
THEMEIMPACT GROUP
IMPACT SDG #SPECIFIC GROUP
DESCRIPTION
Environmental and health awareness and behaviour
5
Waste educationCitizens' awareness and behaviour with regard to waste, including littering, recycling habits, home composting, and others.
Energy use education
Citizens' awareness and behaviour with regard to energy use, including habits for energy efficiency and knowledge of efficient and clean household energy solutions.
Water use education
Citizens' awareness and use of water, including habits for efficient water use and knowledge of efficient household water solutions.
Hygiene and sanitation education
Citizen's awareness and habits with regards to hygiene and sanitation, including basic sanitation methods such as hand-washing and toilet usage.
Travel behaviour
Citizens' awareness and habits with regard to travel and commuting, including use of active transport modes, public transport, personal vehicles, car sharing, and other relevant modes or services.
Sex educationCitizens' awareness and habits with regard to sex and family planning, with impacts on a city's population.
Food consumption and diet education
Citizens' awareness and habits with regard to food consumption and diets, including healthy eating, food environmental impacts, and other relevant aspects.
Social participation
11
Civic participation
Citizens' participation in civic associations related to all areas and to climate action.
Community cohesion
Sense of community among citizens with impacts related to safety, solidarity, success of community-scale projects, and others.
Good governance
11, 12, 14, 16, 17
InclusivityInclusion of key stakeholders in the policy-making process.
JusticeFairness, impartiality and independence of justice and law enforcement.
Local democracyAdherence to principles of democracy and citizen participation in cities.
Evidence-based policy-making
Adherence to principles of and use of tools for evidence-based policy.
Transparency and accountability
Adherence to principles of transparency and accountability in policy and the private sector, including sharing of information, the ability to hold institutions and firms accountable, the prevalence of corruption.
Cu
ltu
reIn
stit
uti
on
s
SO
CIA
L I
MP
AC
TS
THEMEIMPACT GROUP
IMPACT SDG #SPECIFIC GROUP
DESCRIPTION
Physical health
2, 3
Healt hazards and death
Measures of the incidence of hazards to health (such as injury, traffic accidents and diseases) and of improvements to the ability to live long and healthy lives such as healthcare, healthy food and vaccination in relation to issues such as premature mortality, cardiovascular and respiratory health, child health.
DisabilityPrevalence of disability in the population and impacts on life quality.
Mental health 3 Physical activityPrevalence of physical activity in the population and impacts of physical activity.
Housing 7, 11Housing affordability
Cost of housing to urban populations relative to total income or spending.
Work-life balance
1, 5, 8, 11
Housing availability
Availability of decent and affordable housing to urban populations.
Peace and security
5, 10, 11, 16
Housing qualitySize of the living area and access to infrastructure, services and basic amenities.
Attractiveness 11City attractiveness
Aspects of the city contributing to its attractiveness, such as access to infrastructure and services, public space, aesthetics, cultural heritage, economic opportunities, and others. Can be evidenced by changes in a city’s population and tourism or visits.
Cultural richness and heritage
4, 11
Cultural diversityDiversity of cultural activities to engage in for citizens.
Cultural heritage protection
Measures for and extent of cultural heritage protection. Can be evidenced by the public budget for cultural heritage.
Education 4, 8, 12
Education affordability
Cost of education provision (for public or private sector) and of access to education (for households, relative to total income or spending).
Education availability
Proximity to affordable educational institutions, facilities and resources (including schools, universities, libraries).
Education quality
Provision of education and of attention by trained staff.
SO
CIA
L I
MP
AC
TS
He
alt
hQ
uality
of
life
an
d
urb
an liv
eab
ilit
yC
ult
ure
>>>>>>>>>>>>>>>>>>>>>>>>>3.4 TAXONOMY TABLESThe following tables outline in detail the Taxonomy. This Taxonomy is a first suggestion from Ramboll and C40, discussed with the ERG and CAG for this project, and to be further developed as the UCAIF evolves. A suggested list of indicators is provided in Annex II – Suggested indicators for the Climate Action Impacts Taxonomy. The list should also expand as the Taxonomy develops further.

>31URBAN CLIMATE ACTION IMPACTS FRAMEWORK
THEMEIMPACT GROUP
IMPACT SDG #SPECIFIC GROUP
DESCRIPTION
Biodiversity14, 15, 11
Biodiversity protection
Protection of ecosystems and species.
Ecosystem services
Value of services offered by ecosystems, and impact on these ecosystems and services.
Biological diversity
""Biological diversity" means the variability among living organisms from all sources including, inter alia, terrestrial, marine and other aquatic ecosystems and the ecological complexes of which they are part; this includes diversity within species, between species and of ecosystems." (Convention on Biological Diversity, Article 2). This impact relates to changes to biological diversity and urban green surface.
Species population
(Changes to) the size of a species population.
Climate Change
7, 11, 13Greenhouse gas emission
Volume of greenhouse gases, which drive global warming, emitted from man-made sources
Air quality 3, 11, 15
Indoor air pollution
Air pollution in buildings and households.
Outdoor air pollution
Air pollution in cities.
Olfactory pollution
"Pollution produced by gaseous emissions in the atmosphere that, even in very small amounts, may cause injuries or a condition of general unease or sickness to persons living in the vicinity." (European Environment Information and Observation Network)
NoiseNo related SDG
Indoor noise Noise in buildings.
Outdoor noise Noise due to traffic and other urban activities.
Soil quality3, 11, 12, 15
Soil pollution
Contamination of the soil due to the presence of pollutants such as heavy metals and chemicals (herbicides, industrial wastes, and others).
Soil degradation
"Change in the soil health status resulting in a diminished capacity of the ecosystem to provide goods and services for its beneficiaries." (Food and Agricultural Administration)
Soil textureSize and type of soil particles composing the land, and its impact in land subsidence and stability.
EC
ON
OM
IC I
MP
AC
TS
Envir
on
me
nta
l qu
ality
THEMEIMPACT GROUP
IMPACT SDG #SPECIFIC GROUP
DESCRIPTION
Environmental and health awareness and behaviour
1, 8, 17
Economic production
City income from and production of goods and services.
Labour productivity
Production and value-added from jobs and working time.
Employment1, 8, 9, 11
Employment figures
State of (un)employment and the creation or loss of jobs. Employment be looked at per sector, for example 'green jobs', or informal employment.
Earnings quality Quality of earnings.
Quality of the working environment
Quality of the working environment
Job security Risk of job loss.
Job safety Hazards related to job or task performance.
Economic innovation, dynamism and competitive-ness
8, 9
Innovation
State of business research and development, for example in terms of patent creation, and support to R&D from financial institutions (access to credit) and the public sectors.
Local sector development and new industries
Appearance and growth of new sectors and industries evidenced by new business activity and, for example, the creation of start-ups.
Private wealth 10
Value of assets Value of a household's assets or net worth.
Economic empowerment
Households' ability to accumulate assets, purchase goods and services, in relation to disposable income.
Public budget 17
Available municipal budget
Cities' budgets for policies and projects.
Available regional/State budget
Regions or States' budgets for policies and projects.
Tax revenuePublic revenue from property and other forms of taxation.
Non-tax revenuePublic revenue from State aid and other sources.
Sustainable production and consumption
2, 6, 8, 9, 11, 12, 13
Natural resources depletion
Rate of natural resources exploitation in relation to biocapacity.
Waste production and management
Measures of waste prevention improvement and re-utilisation of materials compared to total municipal solid waste produced, collected, recycled, composted, landfilled, burned, or other form of disposal or re-use.
EC
ON
OM
IC I
MP
AC
TS
We
alt
h a
nd
eco
no
my
>33URBAN CLIMATE ACTION IMPACTS FRAMEWORK
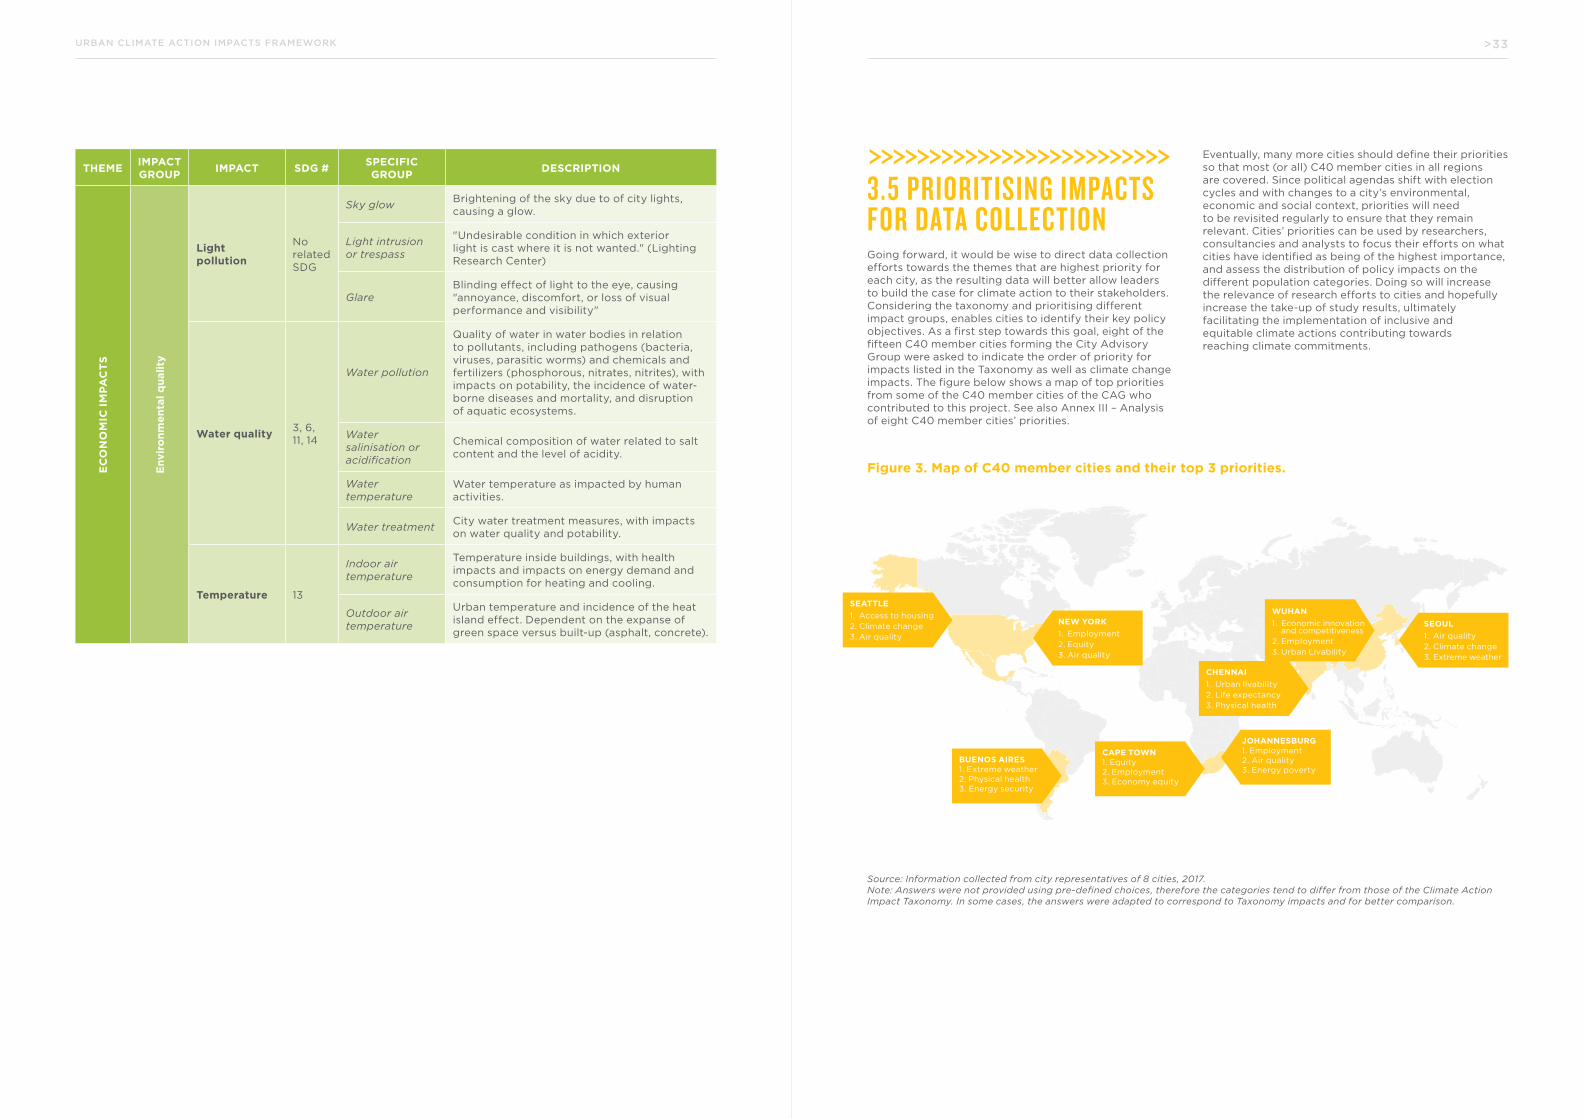
>>>>>>>>>>>>>>>>>>>>>>>>>3.5 PRIORITISING IMPACTS FOR DATA COLLECTIONGoing forward, it would be wise to direct data collection efforts towards the themes that are highest priority for each city, as the resulting data will better allow leaders to build the case for climate action to their stakeholders. Considering the taxonomy and prioritising different impact groups, enables cities to identify their key policy objectives. As a first step towards this goal, eight of the fifteen C40 member cities forming the City Advisory Group were asked to indicate the order of priority for impacts listed in the Taxonomy as well as climate change impacts. The figure below shows a map of top priorities from some of the C40 member cities of the CAG who contributed to this project. See also Annex III – Analysis of eight C40 member cities’ priorities.
Eventually, many more cities should define their priorities so that most (or all) C40 member cities in all regions are covered. Since political agendas shift with election cycles and with changes to a city’s environmental, economic and social context, priorities will need to be revisited regularly to ensure that they remain relevant. Cities’ priorities can be used by researchers, consultancies and analysts to focus their efforts on what cities have identified as being of the highest importance, and assess the distribution of policy impacts on the different population categories. Doing so will increase the relevance of research efforts to cities and hopefully increase the take-up of study results, ultimately facilitating the implementation of inclusive and equitable climate actions contributing towards reaching climate commitments.
Figure 3. Map of C40 member cities and their top 3 priorities.
SEATTLE
1. Access to housing2. Climate change3. Air quality
CHENNAI
1. Urban livability2. Life expectancy3. Physical health
WUHAN
1. Economic innovation and competitiveness
2. Employment3. Urban Livability
BUENOS AIRES1. Extreme weather2. Physical health3. Energy security
CAPE TOWN1. Equity2. Employment3. Economy equity
JOHANNESBURG1. Employment2. Air quality3. Energy poverty
NEW YORK
1. Employment2. Equity3. Air quality
SEOUL
1. Air quality2. Climate change3. Extreme weather
Source: Information collected from city representatives of 8 cities, 2017. Note: Answers were not provided using pre-defined choices, therefore the categories tend to differ from those of the Climate Action Impact Taxonomy. In some cases, the answers were adapted to correspond to Taxonomy impacts and for better comparison.
THEMEIMPACT GROUP
IMPACT SDG #SPECIFIC GROUP
DESCRIPTION
Light pollution
No related SDG
Sky glowBrightening of the sky due to of city lights, causing a glow.
Light intrusion or trespass
"Undesirable condition in which exterior light is cast where it is not wanted." (Lighting Research Center)
GlareBlinding effect of light to the eye, causing "annoyance, discomfort, or loss of visual performance and visibility"
Water quality3, 6, 11, 14
Water pollution
Quality of water in water bodies in relation to pollutants, including pathogens (bacteria, viruses, parasitic worms) and chemicals and fertilizers (phosphorous, nitrates, nitrites), with impacts on potability, the incidence of water-borne diseases and mortality, and disruption of aquatic ecosystems.
Water salinisation or acidification
Chemical composition of water related to salt content and the level of acidity.
Water temperature
Water temperature as impacted by human activities.
Water treatmentCity water treatment measures, with impacts on water quality and potability.
Temperature 13
Indoor air temperature
Temperature inside buildings, with health impacts and impacts on energy demand and consumption for heating and cooling.
Outdoor air temperature
Urban temperature and incidence of the heat island effect. Dependent on the expanse of green space versus built-up (asphalt, concrete).
EC
ON
OM
IC I
MP
AC
TS
Envir
on
me
nta
l qu
ality

04CLIMATE ACTION IMPACTS PATHWAYS
>35URBAN CLIMATE ACTION IMPACTS FRAMEWORK
>37URBAN CLIMATE ACTION IMPACTS FRAMEWORK
>>>>>>>>>>>>>>>>>>>>>>>>>4.I INTRODUCING PATHWAYSAS AN EVIDENCE BASEDAPPROACH TO IDENTIFYINGIMPACTSCentral to the Urban Climate Action Impacts Framework’s approach is identifying the links between a city’s action and its wider (non-climate) impacts. The Framework builds on a theory based approach, where ‘intervention logics’ are used to illustrate Climate Action Impacts Pathways (‘Pathways’).
The intervention logic, sometimes also called ‘theory of change’ or ‘logic model’, clearly defines what an intervention or action aims to achieve and how change will occur. It is frequently used in different stages of the policy cycle to support the planning, implementation, monitoring and follow-up of intervention. The intervention logic presents the causal chains for change to take place, and helps identify operationalised indicators, targets and milestones. It is widely used to identify all possible positive impacts and negative impacts of an intervention when conducting an impact analysis and policy evaluation17.
Following the rationale of the intervention logic, Climate Action Impacts Pathways detail the causal steps that link a policy intervention (or action) to its possible impacts (both positive and negative). The following two boxes and figures provide illustrative examples of Pathways. The examples are not exhaustive of all possible impacts and relationships, and simply serve to illustrate.
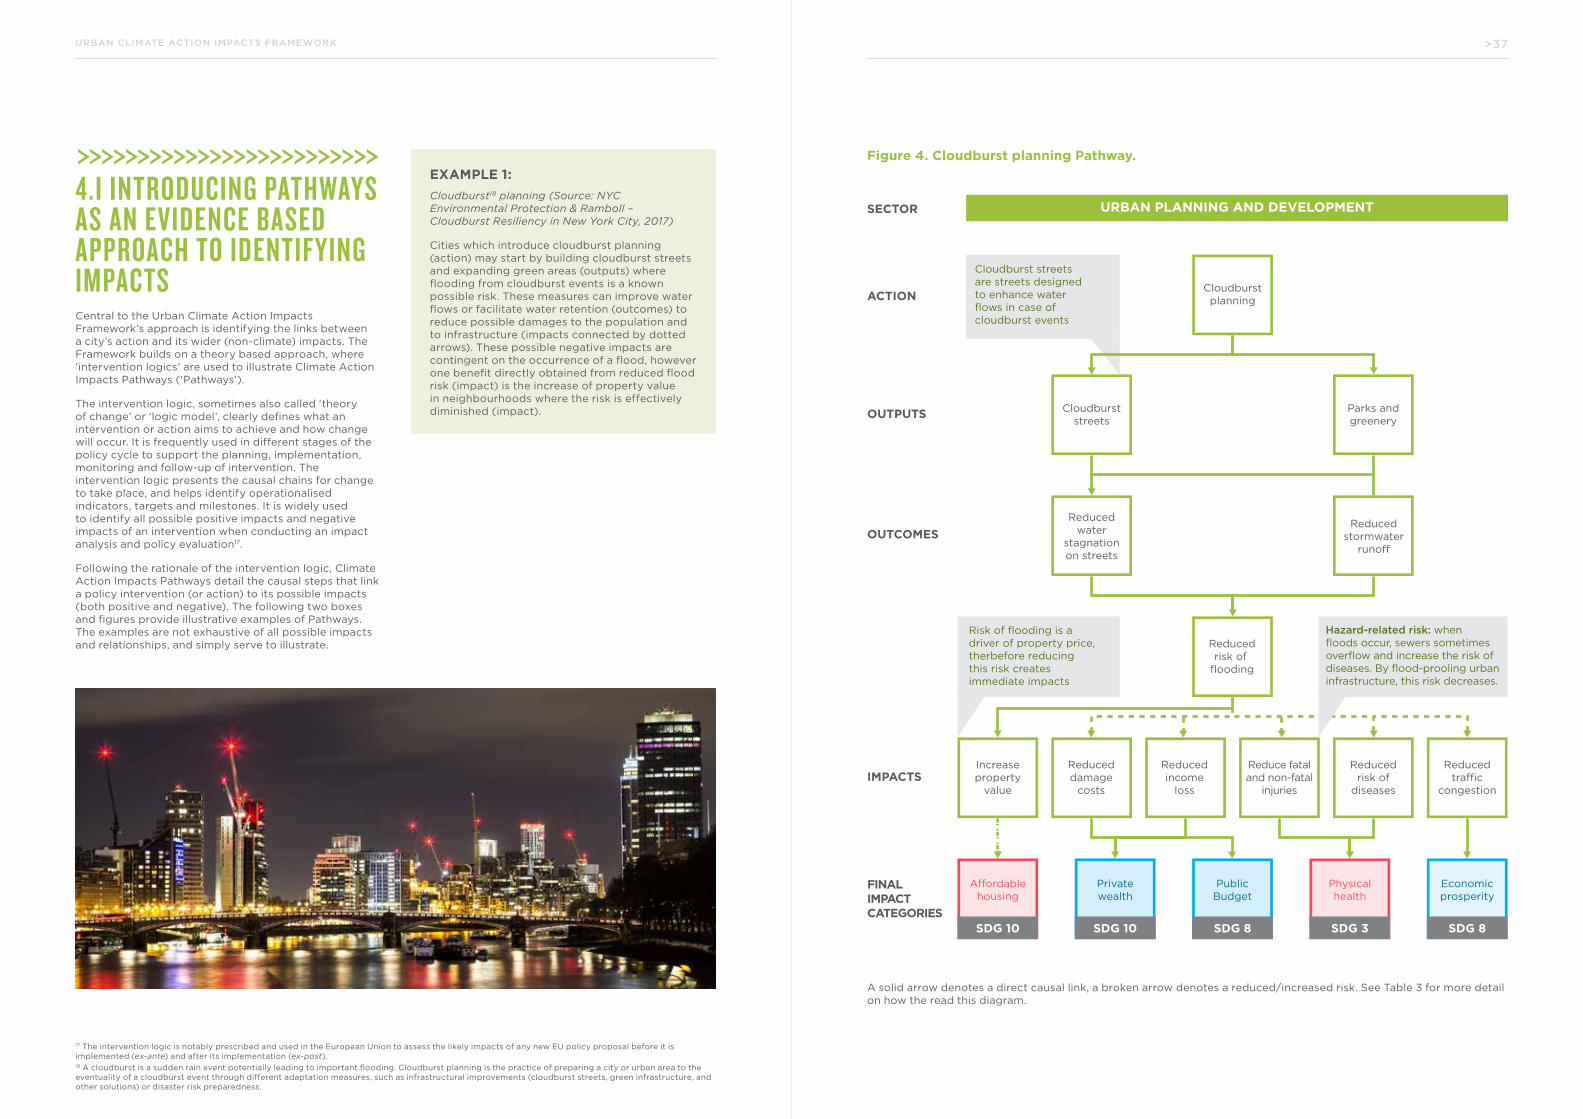
A solid arrow denotes a direct causal link, a broken arrow denotes a reduced/increased risk. See Table 3 for more detail on how the read this diagram.
EXAMPLE 1:
Cloudburst18 planning (Source: NYC Environmental Protection & Ramboll – Cloudburst Resiliency in New York City, 2017)
Cities which introduce cloudburst planning (action) may start by building cloudburst streets and expanding green areas (outputs) where flooding from cloudburst events is a known possible risk. These measures can improve water flows or facilitate water retention (outcomes) to reduce possible damages to the population and to infrastructure (impacts connected by dotted arrows). These possible negative impacts are contingent on the occurrence of a flood, however one benefit directly obtained from reduced flood risk (impact) is the increase of property value in neighbourhoods where the risk is effectively diminished (impact).
Figure 4. Cloudburst planning Pathway.
17 The intervention logic is notably prescribed and used in the European Union to assess the likely impacts of any new EU policy proposal before it is implemented (ex-ante) and after its implementation (ex-post). 18 A cloudburst is a sudden rain event potentially leading to important flooding. Cloudburst planning is the practice of preparing a city or urban area to the eventuality of a cloudburst event through different adaptation measures, such as infrastructural improvements (cloudburst streets, green infrastructure, and other solutions) or disaster risk preparedness.
IMPACTS
OUTCOMES
OUTPUTS
ACTION
SECTOR URBAN PLANNING AND DEVELOPMENT
Increaseproperty
value
Reduceddamage
costs
Reducedtraffic
congestion
Reducedrisk of
flooding
Reduce fataland non-fatal
injuries
Cloudburstplanning
Cloudburststreets
Parks andgreenery
Reducedwater
stagnationon streets
Reducedstormwater
runoff
Affordablehousing
Privatewealth
SDG 10
PublicBudget
SDG 8
Physicalhealth
SDG 3
Economicprosperity
SDG 8SDG 10
Cloudburst streets are streets designed to enhance water flows in case of cloudburst events
Risk of flooding is a driver of property price,therbefore reducing this risk creates immediate impacts
Reducedincome
loss
Reducedrisk of
diseases
Hazard-related risk: whenfloods occur, sewers sometimesoverflow and increase the risk of diseases. By flood-prooling urbaninfrastructure, this risk decreases.
FINALIMPACTCATEGORIES

>39URBAN CLIMATE ACTION IMPACTS FRAMEWORKINCLUSIVE CLIMATE ACTION IN CITIES
>>>>>>>>>>>>>>>>>>>>>>>>>4.2 THE FIRST MAP OF URBAN COMPLEXITYPathways can be built which connect many actions together by their common types of impacts. As such, Pathways are excellent tools to illustrate all the interconnections between the sectors and impact themes of the Taxonomy. Pathways can also be represented for only one action and its multiple impacts, or one impact and the actions that can lead to it. Interactive navigation of Pathways, where users can view the links that branch out from one specific element via an online Platform, is a key objective for further development of the UCAIF.
A key output of this work has been to undertake a preliminary mapping of pathways incorporating a large part of the Taxonomy of impacts. The Pathways presented in this report were developed based on the review of the 17 studies listed in Annex I using qualitative data analysis (coding) and were discussed during workshops with the Expert Review Group.
This is the first time such a broad mapping has been attempted, and it will need substantial further work to test, verify and expand the relationships identified. In that sense, this work is also a first step of an organic process of developing Pathways.
It is this mapping of urban actions’ impacts that sets the overall structure for the Framework, and will guide and drive the development of the evidence base. It is hoped that in due course cities will be able to explore this mapping and access extensive data sets behind its various links and nodes. A prototype interactive tool developed and presented in Annex IV showcases this possibility but needs to be developed further.
EXAMPLE 2:
LED lighting programme19 (Source: DAMVAD - The Co-Benefits of Sustainable City Projects, 2015).
Replacing conventional street lighting with LED lights (action) is a highly cost-effective measure to increase energy efficiency and reduce energy consumption (outcome). This has positive economic effects related to energy savings (impacts). In previously poorly lit neighbourhoods, LED lighting can reduce crime during night time (impacts).
This action offers potential to increase employment with the creation of low-skilled jobs on the short term for the installation of the infrastructure (impacts). Positive equity impacts are that LED lighting can improve the situation of low-income communities affected by unemployment and in some cases improve street safety for different population groups disproportionately affected by crimes, including minorities, women and men, the elderly, etc. depending on different urban contexts.
Figure 5. LED lighting programme Pathway.
19 Categorised as “More efficient luminaires (e.g. LED)” under C40’s list of actions (see Annex V).
FINALIMPACTCATEGORIES
IMPACTS
OUTCOMES
OUTPUTS
ACTION
SECTOR ENERGY
LED lightingprogramme
LED streetlighs areinstalled
Reducedpublic
spending
Reducedenergy
consumptionand demand
Lowerenergy-related
spending
Publicbudget
SDG 17
Temporarylow-skilled
jobs creation
Employment
SDG 8,9,11
Reducedcrime
Improvedlighting
poorly litneighbourhood
Improvedvisibility
Peace andsecurity
SDG 5,10,11,16

>41URBAN CLIMATE ACTION IMPACTS FRAMEWORK
>>>>>>>>>>>>>>>>>>>>>>>>>4.3 STRUCTURE OF THE PATHWAYSPathways link four stages of an intervention: actions, outputs, outcomes, and impacts20. The causality in the Pathway implies that each stage directly causes or contributes to the occurrence of the next. Although examples can appear similar, their formulation helps signal their exact category, as further explained in Section 4.4 on How to develop Pathways.
Table 3 below provides descriptions of each element of the pathways. Note that the visual representation of the elements may evolve as the Framework develops.
Table 3. Elements of the pathways, following the theory-based approach.
PATHWAY ELEMENT
DESCRIPTION EXAMPLESVISUAL
REPRESENTATION
SectorThe area of the action, based on C40 Networks21.
Sectors include Buildings, Energy, Urban Planning and Development, Solid Waste Management, Transport, Water.
Action
Any policy, programme, or investment initiated by urban public officials with the intention to provide some contribution to climate mitigation or adaptation.
Expansion of public transport, strengthened legislation on energy efficiency in new buildings, development of a waste management plan.
Output (first link)
What an action produces, such as a provided service, facility, infrastructure, or a financial tool. It should be under the direct control of the project, e.g. if the action is implemented the output will occur.
A congestion tax is introduced, building codes are introduced, new waste collection vehicles enter into service.
Outcome (second link)
The change generated by the output. It is necessary for the intended impact to occur, and is generally not under direct control of the project/intervention.
Behavioural outcomes: Increased public transport use by urban population, building of energy efficient private dwelling by developers.
Non-behavioural outcomes: Waste is diverted from landfills towards recycling plants.
ImpactThe medium- or long-term effect of the outcome.
Reduced traffic congestion, reduced energy bills for households, reduced ground level ozone.
Final impact category and corresponding SDG (last link)
Final impact categories appear in the impact category of the Taxonomy and have an SDG number attached.
Air quality, Private wealth, Physical health. See section 3.4 on the Climate Action Impacts Taxonomy.
Positive causal link
Positive direct causal relationship, or the effect of an initiative, output, outcome or impact.
Expansion of public transport services leads to increased use of public transport by urban populations
Negative causal link
Direct causal relationship where the cause has a negative effect on the following output, outcome or impact.
Reduced income from fuel taxes negatively affects public revenues and the public budget.
Hazard event, or risk related link
Causal link between a hazard event and the risk of an outcome or impact, contingent on the occurrence of that hazard. This is used specifically to identify the risk of possible impacts resulting from hazards.
Actions which reduce the negative impact of droughts on a city’s water resources (such as creating emergency water reserves) only yield positive impacts when a drought occurs.
Additional information
Data collected and to be added from the literature.
Case study examples (including quantitative data examples), explanation of causality.
The Pathways use the climate actions defined as part of C40’s Deadline 2020 work and listed in Annex V22.Outputs and outcomes should be identified based on available empirical data. Impacts are taken from the Taxonomy. Links to the SDGs are made by indicating the SDG number in the final impact category box. Final impact category boxes are also coloured (green, blue or red) based on the themes of the Taxonomy (environmental, economic or social).
Pathways specify whether the relationship between two elements is positive or negative. They show whether and how different actions yield the same impacts, but also how an impact in one pathway may cause another chain of impacts. Overall, the Pathways facilitate a comprehensive mapping of how one action translates into multiple impacts, but also how multiple actions across different sectors may contribute to the same impact. As such, the Pathways can be read from top to bottom or from bottom to top. This means that a reader can start from an action he or she is interested in, such as cloudburst planning, to find out about its potential impacts; or start from an impact related to a problem encountered in a city, such as flooding (expressed as ‘reduced flood risk’ in the Pathway), and trace its path up to the different actions that lead to this impact and address the problem.
The Pathways support the data collection process for monitoring the implementation of an action by helping to identify relevant indicators to measure the variables of interest (outputs, outcomes and impacts). The UCAIF and its online platform will serve as a database for these indicators, supporting users in choosing how to monitor the implementation of an action. Examples of indicators are provided in this report at the impact level (see Annex II – Suggested indicators for the Climate Action Impacts Taxonomy). Other examples at the output and outcome levels are also provided in some of the example pathways presented below.
The model in Figure 6 below shows the different elements of the Pathways as described in the previous paragraphs.
20 Definitions can also be found in the Glossary of Key Terms in Evaluations and Results Based Management, OECD, 2010. Note that the term used for an ‘action’ in the OECD Glossary is ‘activity’. Other terms may differ slightly as they were adapted to the scope and needs of the UCAIF.21 http://www.c40.org/networks
22 Deadline 2020 – How cities will get the job done – ‘Assumptions and Inputs’, C40 & ARUP, 2016. See http://www.c40.org/other/deadline_2020
Outcome
Output
Action
Finalimpact
Economicimpact
SDG #
SocialImpact
SDG #
Environmentalimpact
SDG #
Sector

>43URBAN CLIMATE ACTION IMPACTS FRAMEWORK
Figure 6. Model figure of Pathways for two actions of different sectors.
See Table 3 for more detail on how to read this diagram
>>>>>>>>>>>>>>>>>>>>>>>>>4.4 HOW TO DEVELOP PATHWAYSThe next paragraphs describe in more detail the logic of the Pathways and principles for developing them. With due consideration to the complexity of the exercise, these principles should be adhered to as much as possible to develop Pathways that are comprehensible, concise, relevant and informative.
Pathways are simplifications of reality: they are models of the observed situations which inform their theoretical causality links, but should express contingencies where possible. Pathways are not context-specific; meaning that they illustrate pathways of actions implemented anywhere23. However the Pathways are based on empirical information: data collected and analysed in case studies, cost-benefit analysis and impact assessment reports where full Pathways are described and their elements can be identified to create a Pathway figure (such as Figure 6). In other words, the Pathways developed using the UCAIF should be based on actual evidence of causal chains of impacts observed following real interventions (ex-post). Where possible, every step of a pathway should include an assessment of the key contingencies that determine the viability or outcome of that link. In particular, links may be positive or negative depending on contingencies as they will influence the success or failure of an action.
To ensure robustness of the causal links, sufficient time should have passed so that impacts are observable and can be properly attributed to the action. The robustness of the evidence base used should be described. This may be done by citing the sources for the modelled situation and relating the source study’s limitations.
The labels of elements in the Pathways are, by necessity, adaptations of text presented in the source material (including the material used for this project). Some degree of rephrasing is necessary to ensure that an action, output, outcome, or impact described in different ways in different sources is reported in the same manner using the terminology of the Framework.
Pathways can show the interlinkages between sectors, highlighting the possibility of implementing action that is coordinated across policy fields. One impact can be linked to multiple actions in different sectors. This is represented in the Pathways as arrows move across sectors to link different actions and impacts. Note that, as it is shown in Figure 6, sector pathways have a distinct colour. Impacts which are common to multiple sectors are illustrated as neutral (black).
Pathways should aim to unpack the ‘black box’ of action-impact causal relationships. While it is important to avoid overly complex pathways with too many causal steps, Pathways should, to the extent possible, sufficiently describe the outputs, outcomes and impacts that lead to an effect avoiding ‘jumps’ and creating ‘black boxes’. This is achieved by ensuring that each Pathway contains all elements (action, output, outcome and impacts) as they are described in Table 3. In particular, the measurable variables that determine the causal chain within the Pathway should be elements of the pathway to which indicators can be attached.
When creating Pathways based on existing material, all the steps may not be clearly detailed. Researchers should develop Pathways at the same time as they produce case studies, so that black boxes in the case study appear more clearly and be uncovered early on.
EXAMPLE 3:
Waste-to-energy programme (Source: World Bank - Climate Smart Development, 2014)
In this example, the action is a waste-to-energy programme aiming to capture energy from waste in the form of biogas. In the first Pathway, the links from action to impact are made clear at each stage of the Pathway. In the second Pathway, two impacts are missing. These impacts provide the links leading from the outcome of capturing methane gas from waste to produce energy, to the impact which is reduced ground-level ozone. The reason for the reduction in ground-level ozone is that methane is normally emitted during waste decomposition. In a ‘typical’ landfill, methane is not captured but is released into the atmosphere, facilitating the formation of ozone, an atmospheric pollutant with impacts on health and therefore air quality (final impact category).
23 However the contingencies that contribute to the occurrence of impacts in a Pathway must be described when using the Framework, as explained above in section 2.4.
CL
IMA
TE
AC
TIO
N IM
PA
CT
PA
TH
WA
Y
ME
AS
UR
AB
LE
VA
RIA
BL
ES
IMPACTS
OUTCOMES
OUTPUTS
ACTIONS
SECTORSBased on C40Networks
Based on C40Deadline 2020Actions
Climate ActionImpacts Taxonomy
Link with Sustainable Development Goals
SECTOR
Impact Impact Impact Impact
Action Action
Outcome OutcomeOutcome
Output Output
Impact Impact
Final Impactcategory
SDG #
Final Impactcategory
SDG #
Final Impactcategory
SDG #
Final Impactcategory
SDG #
SECTOR
Impact

>45URBAN CLIMATE ACTION IMPACTS FRAMEWORK
Figure 7. Example of ‘black box’ A key difference in the categorisation of a Pathway element (action, output, outcome or impact) is the formulation used in the box24. Actions have the name of the type of programme, policy or intervention. It should easily tell a reader what the action is about. Outputs are direct, tangible results of the action. Outcomes and impacts may appear similar: the main difference is that the outcome should normally refer to the action or behaviour of an actor or the output aimed at by the action, while the impact is formulated such that the text first indicates the direction of the effect (see also the example in Figure 8, and the next paragraph on qualifying Pathway elements).
Pathway elements must be qualified positively or negatively. Some of the impacts listed in the Taxonomy have neutral, positive or negative connotations by definition, for example ‘Public budget’, ‘Physical health’ and ‘Noise pollution’. The phrasing of the impact has to be taken into account when defining the relationships in the causal pathways, as any outcome or impact can positively or negatively affect the following impact. In the Pathway this can be done by stating the direction of the impact, with adjectives such as ‘improved’, ‘enhanced’ or ‘reduced’ and ‘decreased’, and in the positive or negative relationship that links the two (identified by the type of arrow used, see Table 3 above). There is always the possibility that one action can have an impact in both directions. In this case, two boxes should be created for both possibilities. For example, an action can lead to both jobs creation and unemployment at the same time for different stakeholder groups, or over a certain time frame. Case studies should shed light on the causes and document the occurrence of these impacts.
The strength of a relationship between an action and its impact(s), in other words the likely effectiveness of an action, is not stated in a Pathway. The degree of impact (high or low, measured quantitatively) is dependent on contingencies as well as on the available evidence found in documented cases. For these two reasons, it is not possible to suggest the strength of any one relationship. The Framework however acknowledges that combined action and careful planning are more likely to lead to high impacts. Case studies should to the extent possible provide quantified results and an analysis of contingencies which have affected an action’s impacts in a specific case. Subject to careful interpretation (cases in context are rarely transposable to other contexts), this can give an indication to UCAIF users of the possible strength of a relationship between an action and its impacts.
Climate adaptation yields two types of impacts, illustrated using different arrow elements. When working with an action that improves the adaptation or resilience of cities to climate hazards25 the main positive impacts are reaped when the hazard occurs and its harmful impacts are effectively mitigated by the action. These actions are therefore beneficial in their mitigation of climate-related risk, as well as potentially for any other positive impact more directly reaped26. This is represented in the pathways by using a specific type of arrow.
24 See also Table 3 for definitions of the Pathway elements.25 See ARUP and C40’s City Climate Hazard Taxonomy for a typology of these events. 26 The Framework identifies all the other and more directly bankable benefits of actions that improve climate adaptation, such as improved increased property value from the reduction of flood risk to housing and people.
ACTION
OUTPUTS
OUTCOMES
IMPACTS
FINAL IMPACTCATEGORIES
SECTOR
Indicators: numberof plants
Indicators: energyproduce from waste
Indicators: volume of waste landfileld
Indicators: volume of methane emissions from landfills
Indicators: averageexposure toatmosphericozone
Waste toemergy
progamme
Reduced airpollution
Solid wasteManagement
Bioenergyplans arecreated
Methane gasfrom waste isused for energyproduction inwaste facilities
Decreasedwaste being
landfilled
Reducedmethaneemissions
Reducedground-level
ozone
AirQuality
SDG 3, 11, 15
Waste toemergy
progamme
Reduced airpollution
Solid wasteManagement
Bioenergyplans arecreated
Methane gasfrom waste isused for energyproduction inwaste facilities
Reducedground-level
ozone
?
AirQuality
SDG 3, 11, 15
black box
THE FRAMEWORK ACKNOWLEDGES THAT COMBINED ACTION AND CAREFUL PLANNING ARE MORE LIKELY TO LEAD TO HIGH IMPACTS.

>47URBAN CLIMATE ACTION IMPACTS FRAMEWORK
As the UCAIF continues to be developed, principles for the development of Pathways will be elaborated on so that an increasingly consistent approach is used which enables different stakeholders to contribute to the development of Pathways. The goal would be to make the Pathway-making process as straightforward as possible.
>>>>>>>>>>>>>>>>>>>>>>>>>4.5 DETAILED EXAMPLE OF A PATHWAY: BUS RAPID TRANSITThis section goes in more detail through an example of a Pathway which was developed as part of this project. It describes a few elements of the Pathway for a policymaker to understand the causal chains which lead the action (a bus rapid transit programme) to its multiple impact. Relevant indicators are given which can help researchers and analysts monitor these impacts. Sources for the Pathway are also cited.
Bus rapid transit (BRT) is an efficient urban transport solution with large positive climate mitigation impacts and multiple other impacts27. This example is mainly informed by two sources containing case studies:
• DAMVAD Analytics, 2015. The Co-Benefits ofSustainable City Projects, s.l.: C40.
o Case 1: Bus rapid transit in Bogotà
o Case 2: Bus rapid transit in Istanbul
• The World Bank, ClimateWorks Foundation, 2014.Climate-Smart Development, Washington, D.C:World Bank Group28.
In addition, the following sources discuss the positive impacts of public transport and were therefore also used:
• OECD, 2010. Cities and Climate Change, Paris:OECD Publishing.
• OECD, 2013. Mobilising Private Investment inSustainable Transport, Paris: OECD Publishing.
The literature review conducted for this project shows that, on the one hand, BRT can have positive impacts on employment, air quality, physical health, noise, and work-life balance in a city; and on the other hand, negative impacts on housing and particularly housing affordability.
The figure below shows the causal chain for this Pathway. There are many documented impacts to BRT programmes and this figure does not contain all of them, it focuses on the impacts which could be identified in the sources reviewed. A few of the impacts mapped in the Pathway are discussed in the text following the table. A list of indicators is also given.
27 See ARUP and C40’s City Climate Hazard Taxonomy for a typology of these events. http://www.c40.org/researches/city-climate-hazard-taxonomy28 The Framework identifies all the other and more directly bankable benefits of actions that improve climate adaptation, such as improved increased property value from the reduction of flood risk to housing and people.
The need to measure and understand equity is ubiquitous, and does not appear directly in the Pathway diagrams since it is highly context-dependent: it must be detailed in case studies and material provided with the Pathway. Because Pathways are simplified models of reality which do not depict specific situations, the issue of how the impacts are distributed across the population needs to be addressed in the context of specific cities. Case studies, CBA and IA should cite the population categories to whom impacts were distributed. The information reported in the UCAIF must include this aspect.
In summary, concise but informative Pathways should be developed by following the set of principles detailed above and summarised here:
SUMMARY OF PRINCIPLES FOR DEVELOPING PATHWAYS
• Use real cases and evidence, create simplifiedmodels of reality, and state the quality ofyour data.
• Create interlinkages between sectors, tohighlight the possibility of combining multipleactions across policy fields.
• Avoid black boxes, Pathways should unpackthe full chain from action to impact.
• Formulate Pathway elements such that theycan be clearly categorised as either actions,outputs, outcomes or impacts.
• Qualify the positive or negative nature of eachPathway element by stating its direction.
• Use a different type of arrow to representhazard-related impact relationships.
• Provide quantified results to case studies andanalyse the contingencies which have affectedthe success of an action in its context.
• Always consider equity when developingcase studies as evidence base to Pathways,the distribution of impacts must be givenin the evidence base

>49URBAN CLIMATE ACTION IMPACTS FRAMEWORK
Figure 8. Bus rapid transit programme Pathway (non-exhaustive)
See Table 3 for more detail on how to read this diagram.
ACTION
SECTOR
OUTPUTS
OUTCOMES
IMPACTS
FINAL IMPACTCATEGORIES
TRANSPORT
Property price
increases
More atractive urban
neighbourhoods
Bus rapidtransit
programme
Designatedbus lanes
created. Newbuses enter
service
Increaseattractiveness
of publictransport
Increasedpublic
transport use byurban
populations
Improvedmobility of
urbanpopulations
Improvedemplyment
opportunities
Reduced airpollution
Reduced risk of
diseases
Reducednoise
pollution
Reducedfatal and non-fatalinjuries
Reducedtravel time
Higherdisponsableincome forhouseholds
Improvedtransport
safety
Reducedcongestion
Reducedspendingrelated topersonal vehicle
maintenance
Reduced traffic
Reduced exposure of citizens to
hamfulparticulates
Reduced fuel use
Lower personal
vehicle use
Employment
SDG 1,8,9,11
Physicalhealth
SDG 2,3
Work-lifebalance
SDG 1,5,8,11
Physicalhealth
SDG 2,3
Housing
SDG 7,11
Air quality
SDG 3,11,15
Noise
No relatedSGD
Privatewealth
SDG 1,8,9,11
TRANSPORTT R A N S P O R T

>51URBAN CLIMATE ACTION IMPACTS FRAMEWORK
1.1.2. Impact: More attractive urban neighbourhoods
OECD - Cities and Climate ChangeNet flow of tourists, net changes in the resident population (people per year)
1.1.2.1. Impact: Property price increases
OECD - Cities and Climate ChangeAverage cost of housing relative to income or overall spending (currency unit)
1.2. Outcome: Lower personal vehicle use
DAMVAD - The Co-Benefits of Sustainable City Projects; World Bank - Climate Smart Development
Modal split (time per transport modes)
1.2.1. Impact: Reduced traffic
OECD - Mobilising Private Investment in Sustainable Transport
Annual average daily traffic (number of vehicles)
1.2.1.1. Impact: Improved transport safety
DAMVAD - The Co-Benefits of Sustainable City Projects
Incidence of traffic injuries and deaths (per year)
1.2.1.1.1. Impact: Reduced fatal and non-fatal injuries
DAMVAD - The Co-Benefits of Sustainable City Projects
Incidence of traffic injuries and deaths (per year)
1.2.1.1.2. Impact: Reduced noise pollution
Mayrhofer and Gupta - The science and politics of co-benefits in climate policy
Noise levels (in decibels)
1.2.1.2. Impact: Reduced congestion
OECD - Mobilising Private Investment in Sustainable Transport
Travel time (unit of time); travel time reliability
1.2.1.2.1. Impact: Reduced travel time
DAMVAD - The Co-Benefits of Sustainable City Projects
Travel time (unit of time)
1.2.2. Impact: Reduced fuel use
World Bank - Climate Smart Development
Fuel use per capita (unit of volume per unit of length)
1.2.2.1. Impact: Reduced air pollution
World Bank - Climate Smart Development
Emissions per year, per traveller (unit of volume)
1.2.2.1.2. Impact: Reduced exposure of citizens to harmful particles
World Bank - Climate Smart Development
Emissions per year (unit of volume)
1.2.2.1.2.1. Impact: Reduced risk of diseases
World Bank - Climate Smart Development
Incidence of diseases per year (number of cases)
In conclusion, this example has shown how a Pathway could be sourced and explained based on real case studies. It has laid out in writing the ‘story’ of the causal chain represented in the Pathway figure, including its equity aspects, and which should come clear either through the figure itself and / or in any accompanying work. The example also shows how each Pathway
element and particularly the outcomes and impacts should be approached as a variable with attached indicators, and which the action and its outputs aim to influence. Both the Pathway figure and the table of indicators can be used to plan and monitor the implementation of an action.
Table 4. Elements, sources and indicators for the ‘BRT programme’ Pathway
Action and output:
In this Pathway, the action is the implementation of a bus rapid transit (BRT) programme. This has, as a main output, the creation of designated bus lanes and entry into service of new buses.
Outcomes:
The main desired outcome of BRT programmes is the modal shift, characterised by increased use of public transport by the urban population and lower personal vehicle use29. Case studies show that BRT has this effect because it can be a more efficient mode of transport than conventional public and private transport, thanks to the use of dedicated bus lanes30. Wherever congestion is a problem, BRT is faster than traditional buses and can even be faster than personal vehicles (cars) which all transit on the same lane.
Impacts:
One of the main impacts of BRT programmes is the improvement in people’s mobility. People who suffered from lack of transport options (such as non-drivers: the elderly, low-income populations, etc.) or people often stuck in traffic jams can move through the city more efficiently. A main resulting positive impact of increased mobility is the increased access to jobs and therefore increased employment31. Where unemployment is an issue among disadvantaged populations, BRT offers potential to increase equity by improving access to employment opportunities.
BRT may also have negative impacts. One of these noted in the literature includes the increase in property price in neighbourhoods which benefit from access to the new BRT network32. While this is positive for property owners, it is costlier for tenants. The possibility of this negative impact should be carefully considered to avoid disproportionately affecting the poor, for whom decent housing may become unaffordable.
Environmental impacts of BRT relate to the success of the modal shift, reducing the number of cars on the road and therefore the volume of emissions per traveller. City policy-makers should however consider the fuel used by buses must be taken into consideration: diesel buses still emit harmful particulates. Electric buses do not pollute the air, however they tend to be involve much higher investment costs.
Overall, BRT is a useful option for cities aiming to reduce the externalities of cars, including air and noise pollution, respiratory diseases, traffic injuries and deaths, sedentary behaviour, road congestion and climate change from carbon emissions.
The outputs, outcomes and impacts of BRT programmes can be measured using different indicators. A number of these indicators are listed in the table below. The indicators are examples selected based on desk research and discussions with the ERG. For each indicator, users should consider the distribution of impacts to most disadvantaged groups, based on Table 2. All indicators should ideally be measured in order to measure a maximum number of impacts of the action.
PATHWAY ELEMENT33 CITED INEXAMPLE INDICATORS (MEASUREMENT UNIT IN PARENTHESES)
1. Output: Designated buslanes created, new busesenter service
DAMVAD - The Co-Benefits of Sustainable City Projects; World Bank - Climate Smart Development
Length of designated lanes created (in miles or kilometres); number of new buses in service (vehicles)
1.1. Outcome: Increased public transport use by urban population
DAMVAD - The Co-Benefits of Sustainable City Projects; World Bank - Climate Smart Development
Passenger traffic per year (number of users)
1.1.1. Impact: Improved mobility of urban populations
DAMVAD - The Co-Benefits of Sustainable City Projects
Travel time (unit of time)
1.1.1.1. Impact: Improved employment opportunities
OECD - Cities and Climate ChangeUnemployment rate (share of employed to unemployed individuals)
29 DAMVAD - The Co-Benefits of Sustainable City Projects; World Bank - Climate Smart Development.30 DAMVAD - The Co-Benefits of Sustainable City Projects.31 OECD - Cities and Climate Change.32 OECD - Cities and Climate Change.33 Elements appear in the order in of the causal chain in the Pathway. Outputs are level 1 (1.), outcomes are level 2 (1.1.), impacts level 3 (1.1.1.), and so on.

05IMPACTS MEASUREMENT IN CITIES: A PRACTICAL GUIDE
>53URBAN CLIMATE ACTION IMPACTS FRAMEWORK

>55URBAN CLIMATE ACTION IMPACTS FRAMEWORK
It is important to note that where this approach is used to estimate impacts from an action that has not yet been taken it does not intend to replace a full CBA or IA. It provides a first order estimate of impacts that cities can use to inform planning and optioneering, and critically a viably approach that can be readily and widely deployed.
This guidance uses the causal pathway as a foundation for measuring impact. The aim is to directly collect data for each action, output, outcome and impact ‘box’ in the pathway (See Figure 6). Where this is not viable because directly measured data is not available, then the approach sets out options for using substitute data or combining data with existing research to estimate impacts. Essentially the guidance works through the pathway: starting with direct data collection for action boxes; moving to a mix of direct measurement and proxy data for output and outcome boxes; and finally to a mix of direct data collection, proxy data and combining data with multipliers from existing research to calculate impact boxes.
The box to the right addresses some key issues around developing the most compelling evidence within the constraints of available data.
>>>>>>>>>>>>>>>>>>>>>>>>>5.I INTRODUCTIONChapters 2, 3 and 4 have offered a high-level framework for measuring the wider impacts of climate action, a clear taxonomy for describing them in a standardised manner, and guidance on using a methodological approach for linking actions to their possible impacts via causal pathways. Ideally at this point, we are in a position to consider how to move forward towards measurement. That is we are able to specify the action we aim to deliver, the associated impact we are interested in (Chapter 3) and the a pathway linking the two (Chapter 4). Furthermore being aware now that this ideally includes measuring the distribution of impacts, considering both costs and benefits, noting any obvious contingencies, and so on (Chapter 2).
The next step, which is addressed in this chapter, is the practical business of actually measuring the impacts of those actions, for which there are varied approaches depending on need and context. C40 has already undertaken a significant amount of work to measure the impacts of climate action at a local city and action level. For the past two years C40 and our partners have been first developing and piloting, and then consolidating and rolling out a global approach to measuring impacts on the ground in our cities34. The learning from this work are presented here in this chapter.
>>>>>>>>>>>>>>>>>>>>>>>>>5.2 THE APPROACH TO MEASURING IMPACTSFrom scoping research with LSE35, and preliminary consultation with C40 cities, the following factors were identified as key drivers for the research to develop a global approach for measuring local impacts:
• There is a significant gap, at both the city level and theaction level, in readily available data to measure impacts(as elaborated on in the introduction to this report)
• There is potential that this data exists at the city levelbut is not being effectively utilised
• There is demand from cities for a standard approachto measuring the impacts of climate action in orderto support a stronger business case for action
Given these drivers, the measurement approach is framed around two key questions:
1. In practical terms, what impacts can be measurednow, based on best available data globally and in thespecific city that is aiming to make the case for action?
2. How can gaps in data and research be filled andwhat methods can be employed to improve themeasurement of impacts in the future?
MEASUREMENT PREFERENCES: BALANCING THE IDEAL EVIDENCE WITH THE AVAILABLE DATA
The approach outlined in this chapter has been developed to support cities to measure impact, both evaluation after an action has been implemented (ex-post) and to forecast impacts before action implementation (ex-ante). As previously stated in Chapter 2 the framework recommends the use of ex-post measurement as the strongest level of evidence. However, this is obviously not possible when forecasting impacts ex-ante for planned actions – yet this is often when making the case is most crucial. In addition it is not always practically feasible to directly measure ex-post impacts and significant gaps exist for this data. The guide is designed with this in mind; a preference for measurement is set out that prioritises ex-post, directly measured data but guidance is provided for a viable, robust approach where such data does not exist.
Ex-post vs ex-ante – ex-post is preferable to ex-ante, but as above for planned action obviously cities will need to use ex-ante.
Directly measured vs calculated impact – wherever possible and practical cities should use direct measurement. Cities will need to collect a range of data from across actions, outputs, outcomes and impacts. Ease of data collection will vary greatly, generally action data is the easiest, through to impact data as the hardest to collect. It should be noted that it is not always efficient to directly measure impacts, and robust, widely used approaches exist to turn directly measured outcome data into impacts. These will be outlined further in section 5.2.3.
Proxy data – where directly measured city data is not available then proxy data from other cities and actions can be considered as a substitute. Proxy data should always be from always be from a similar context to ensure it is as representative a substitute as possible. The same measurement preferences apply for proxy data as above; i.e. ex-post, directly measured is the strongest level of evidence. Further details on proxy data are provided in section 5.2.2.
Multiple vs single measurements – multiple measurements are preferable as they provide a greater degree of certainty, be it multiple direct measurements by the city or multiple proxy data sources.
It is important that cities exercise good judgement as to the best balance between efficient use of resources and breadth of data collection. It is not always necessary to invest huge resource in data collection and direct measurement – focusing resources on the most important data is preferable.
34 As previously noted in section 2 C40 thinking and research has evolved from co-benefits, to benefits, to impacts and previous publications reflect this process, and terminology. See www.c40.org/benefits for impacts measurement research to date.35 http://www.c40.org/researches/c40-lse-cobenefits
IT IS IMPORTANT THAT CITIES EXERCISE GOOD JUDGEMENT AS TO THE BEST BALANCE BETWEEN EFFICIENT USE OF RESOURCES AND BREADTH OF DATA COLLECTION.

>57URBAN CLIMATE ACTION IMPACTS FRAMEWORK
>>>>>>>>>>>>>>>>>>>>>>>>>5.3 ACTION AND IMPACT SELECTIONBefore any data collection and analysis can be undertaken there must be a clear understanding and definition of what it is to be measured and why. This has been covered in previous sections, but is purposefully reiterated here as it is such an important stage.
Key steps include:
1. Defining and describing target action, impactand analysis
First it is key to identify the action and impacts to be measured. It is important to define the boundary of the climate action, outlining the scale and scope of the action, for example is the action to be measured a single cycle lane or a whole cycle network? In addition it is important to define the boundary of the analysis, as outlined in Chapter 2. This will involve: determining whether the analysis is ex-ante or ex-post; setting out the time-frame for the analysis; and deciding whether or not distribution of impacts will be included in scope. At this stage thought should also be given to the baseline (generally a ‘no change’ or ‘business as usual’ scenario). The action scenario should then also be defined which will be compared to the baseline. Is it a straight-forward before and after snapshot measurement, or are a number of action scenarios being considered? A number of action scenarios might be considered for example for different sizes of a Zero Emission Zone, or comparing upgrading a bus fleet to either natural gas or electric. Considering several action scenarios can be an effective way of making the case for a bigger and better scale of action.
2. Pathway mapping to identify all potential impacts
Next, it is necessary to map all potential impacts that could result from the action using a causal pathway approach. Chapter 4 on causal pathways already provides guidance and a process for mapping actions and their impacts. A prototype tool is also in development by the project partners guide this. These templates can be used as a starting point for this process. This material will also soon be on-line on the C40 website for ease of use.
As outlined in Chapter 2, it is important to include both positive and negative, and outputs, outcomes and impacts. Furthermore understanding system change requires careful consideration of how the action will impact on other elements of the system or other related systems. However, comprehensiveness and complexity of mapping needs to be balanced to make sure the process and the results are manageable. Judgement from local stakeholders is a reliable guide for what level of complexity is required.
3. Identifying priority impacts
Once mapping has been done it is important to identify the priority impacts, as explored in Chapter 4. In many cases this may be self-evident, for instance in the case of a city looking to address a particular issue such as air quality or low employment. However in other cases this may not be clear, and the choice of wider impact will depend on a number of points. For example which impacts are the most significant in terms of actual impact and perceived impact? Who are the key stakeholders and what are their priorities and concerns, both for and against the proposed climate action? These points should be considered when choosing which impact to prioritize for measurement.
This is a critical stage in order to ensure that the efforts invested in measurement provide results that have maximum impact in the decision making process. The aim is to ensure analysis is focused on the impacts that align with the city’s needs and objectives and stakeholder priorities.
4. Initial high-level impact estimate
At this stage, before commencing full impact measurement, a high-level estimate of impact could be calculated as (1) an early check of the action and impact selection process to make sure the most impactful actions and significant impacts are being selected; and (2) for identifying the most critical stages of the causalpathway (i.e. which stages might affect final impacts)- this indicates where where it is most important toensure effective data collection in order to ensurerobust measurement.
>>>>>>>>>>>>>>>>>>>>>>>>>5.4 DATA COLLECTIONHaving defined exactly what is to be measured, the next step is to plan and undertake data collection. Key steps include:
1. Determining data required and data available
The causal pathway should be used to help identify what action, output, outcome and impact data is required; i.e. what data is needed for each box in the pathway in order to enable measurement of final impacts. Data collection should focus on the most important data, but where possible it is ideal to balance focused and efficient data collection with an exploration of what data is available more widely that might be useful.
A key principle to note at the outset of any data collection is to always use best available data. Data should be as robust as practically possible, but cities should not be held back by imperfect data - there will always be data gaps and limitations.
The following diagram outlines the three main steps for doing any measurement or estimate. These are expanded then expanded on in sections 5.2.2., 5.2.3 and 5.2.4.
Figure 9. Three key steps in quantifying the impact of city climate action
DATA COLLECTION
Step 1
Determine data
required and available
Collect data
Step 2 Step 3
Address data gaps
DATA ANALYSIS
Step 1Use multipliersfrom existingresearch to calculate impacts
Use economicmultipliers to
monetise impacts
Step 2 Step 3Use existing research to
illustrate and corroborate
impacts
ACTION AND IMPACT SELECTION
Step 1Define and describe
target, action, impact and
analysis
Pathway mapping to identify all potential impacts
Step 2 Step 3
Identify priority impacts

>59URBAN CLIMATE ACTION IMPACTS FRAMEWORK
2. Collecting data
Action, output, outcome and impact data should be collected through direct measurements wherever possible and practical. As indicated above, action data is generally the most readily available, however it should be aimed to have data at all levels. Increasing data gaps occur as data collection progresses to output and then outcome measurement. Addressing these gaps will be covered in the steps below.
Data collection efforts should engage not just the direct city team, but also wider city teams and departments, as well as external organisations and partners, in order to identify all the available data. Key stakeholders to engage might be the health or finance department and smart city or data lab teams. Consideration should be given to the best way to engage stakeholders - partner meetings, individual interviews, e-mail request or online survey are all effective depending on the existing relationship with the stakeholder and the level of data requested.
3. Undertaking a gap analysis
Once data has been collected a gap analysis should be undertaken to compare the data available with the data required. This gap analysis should be used to stimulate further data collection (presenting the gap analysis to city stakeholders is an effective way to unearth additional data), as well as to work out what proxy data or assumptions are required.
4. Addressing data gaps
There are several approaches for addressing the inevitable gaps in data:
Proxy data - the first option for addressing data gaps is to use proxy data. Local proxy data should be prioritised, this should ensure contextual variables are similar. Where local proxy data is not available consider using regional, national or international proxy data from similar cities and/or actions. It is important to sense-check that proxy data is from a comparable context. Parameters such as GDP, population, health profile, scale and type of action, wider action culture, e.g. low or high levels of recycling, should be considered. For example if using proxy data for a BRT intervention, is the proxy data from a similar system - is it an open or closed BRT system, is it part of an extensive, established network, or part of a new system of lines? It is important to determine what data manipulation and assumptions were used in order to be able to assess whether the proxy data is sufficiently robust.
Judgement based assumptions - where proxy data is not available then judgement based assumptions can be considered. For example, if the number of days people are cycling on average is not known, but it is known that the majority of cyclists are commuting to work, then it could be reasonably assumed that people are cycling on average five days a week. Additional assumptions around days not cycled due to holidays, poor weather, etc, can be made to provide a more refined assumption. Local experience and judgement is critical for this process and discussion of assumptions with key stakeholders can greatly increase robustness.
Scenario based approach - scenarios are useful where there is little information and high levels of uncertainty, i.e. no data or proxy data is available and judgement based assumptions are hard to make. This approach provides a post-action scenario that can be used to measure benefits, in this way still enabling a demonstration of the potential impacts of undertaking a climate action. It is important to be very clear when presenting results that they are based on scenarios, e.g. if this action is taken and if it leads to theseoutcomes then these would be the resulting impacts.Scenarios could be based upon city goals and targetsor on optimistic, realistic and pessimistic forecasts.
For all the above options judgement should be used to determine what degree of robustness is required and what level of uncertainty is acceptable, always making sure to be transparent about any uncertainties and assumptions. Direct data collection should be undertaken as soon as practically possible to replace any proxy, assumptions and scenario data.
RECORDING DATA COLLECTION DETAILS
It is vital that details, uncertainties and assumptions are recorded throughout the process. This is in order both to explain and defend data and results to external stakeholders but also to ensure that key information is captured for internal records. Details may include:
• Direct data collection: when and how was thedata collected, who by? It is important to notethe day, date and time of any surveys or countdata, including additional relevant details forexample if a cycle survey is undertaken whilstit is snowing this is likely to impact results.
• Proxy data: what source is proxy data takenfrom? What data collection methods wereused? Any differences in context and/oruncertainties in the source data shouldbe recorded.
• Judgement based assumptions: whatassumptions have been made, and bywhom? Any assumptions made should berecorded, including calculations involvedand stakeholders consulted.
• Identification and validation: whatstakeholder communication and collaborationwas used to identify and validate data?
• Manipulation: what manipulation was requiredto get the data in the correct format?For example unit conversion or weighting.

>61URBAN CLIMATE ACTION IMPACTS FRAMEWORK
Where existing research is not sufficiently robust to use as multipliers, findings can, and should, still be used to illustrate and corroborate potential impacts from climate action.
Illustration – when calculation of impacts is not appropriate then directly referencing findings from existing research (stating the specific city and action context) can still be effective. This evidence of impacts from similar situations is a good option for illustrating potential impacts and making a case for action.
Corroboration - where a city has initial measurements of impacts, these can be backed-up by drawing on findings from similar city and action examples. This provides greater confidence that the impact is not an anomaly. For example in Mexico City a 30% increase in commercial activity and a 96% reduction in crime were measured as a result of pedestrianisation of a busy city-centre street39. Results from elsewhere corroborate these findings: a UK Livings Streets study found an increase in footfall and trading of up to 40% across a number of pedestrianisation projects40; evaluation of pedestrian project in New York showed a 49% decrease in commercial vacancies41; a Washington DC study showed increased walkability led to an 80% increase in retail sales42; research from Kansas City showed a 74% reduction in crime due to car-free weekends and the resulting increase in park users43.
>>>>>>>>>>>>>>>>>>>>>>>>>5.6 SUMMARY OF ‘WATCH OUTS’ FOR THE MEASUREMENT OF CLIMATE ACTION IMPACTSThe following section summarises some of the key learnings, caveats and conditions that must be considered when measuring the impact of climate action in cities.
Understanding critical data gaps
Cities have a significant amount of data that can be used, however critical data gaps remain. Key gaps identified through C40’s work to date are:
1. the availability of pre- and post-action data
2. the availability of data at the granularity thatcorresponds to a climate action, i.e. is the area of datacollection the same as the area of the climate action
3. a lack of context specific research from a similarcity setting, especially for Low and Middle IncomeCountries (LMIC)
4. insufficient data to enable a good understandingof how equitably the impacts are distributed
Furthermore, some data will have a much greater impact on results. Identifying the most critical data gaps and focusing data collection and research efforts on this will help cities and researchers make the most of the limited resources for monitoring and evaluation.
Integrating data sources to fill gaps
When using proxy data or multipliers from non-city or action specific research to fill data gaps it is important to consider contextual differences. For example, if using data from other cities to estimate the increase in biking following the introduction of bike lanes, geographic factors such as distance and topography, and climatic factors such as extreme seasonal rain or heat, should be accounted and adjusted for. Another example is using national level socio-demographic data to fill city data gaps, here differences between e.g. age or gender should be accounted and adjusted for.
>>>>>>>>>>>>>>>>>>>>>>>>>5.5 DATA ANALYSISEven after all the efforts described above have been undertaken to harvest all the data possible, gaps will likely remain. Analysis then needs to be undertaken to fill any remaining data gaps. This is where approaches from existing research can be used in combination with outcome data to calculate impacts.
1. Using multipliers from existing research tocalculate impacts
Impact measurement should be a mix of direct data collection and calculation. Direct measurement of impacts such as crime rates or commerce can, and wherever possible should, be undertaken. However for some impacts, for example health, direct measurement might require large-scale, long-term studies and this is not practically viable. Furthermore research might already exist that has established a robust relationship between outcome and impact, providing an efficient alternative to direct measurement. For example extensive, peer-reviewed epidemiological studies have established standard dose-response functions36 that can be used to determine health impacts based on directly measured physical activity outcomes.
Care needs to be taken to understand when and how multipliers should, or should not, be used. Methodology might not be straight-forward or easily or directly transferable to a different city or action context. If in doubt expert advice should be sought to support the process, and wherever possible it is recommend that expert review is used to quality assure analysis undertaken.
Use of existing tools can support this process as these provide a ready developed methodology that can be applied with confidence. The box on the right gives an example of two such tools.
2. Using multipliers from existing research tomonetise impacts
Economic multipliers can be used to calculate the wider economic and financial impacts resulting from climate actions using the same approach as above. C40 acknowledges the challenges associated with placing a financial value on environmental and social ‘goods’, however our consultation with cities indicates that this is a key part of the decision-making process and hence monetisation of results is extremely important. It is therefore advised that monetisation of impacts is undertaken wherever possible and appropriate but that cities are mindful of, and transparent about, the limitations involved.
3. Using existing research to illustrate andcorroborate impacts
IMPACT MEASUREMENT TOOLS
To assess the impact of walking and cycling on health, the World Health Organisation (WHO) coordinated the development of the Health Economic Assessment Tool (HEAT37). It is a widely deployed online tool that is easy to use and does not require input of a lot of data. The impact of an increase in physical activity is used to calculate health impacts, measured as a reduction in the risk of premature death. The economic impact of this health benefit is then calculated using the Value of Statistical Life (VSL).
I-TREE TOOL FOR MEASURING IMPACT OF URBAN TREES
i-Tree38 is a globally recognised tool for measuring the impact of trees in urban environments. The aim of the tool is to demonstrate the value of trees and to increase awareness of the array of benefits that trees provide. By providing insight into local and tangible ecosystem services provided by trees, users can ensure that environmental quality and community liveability are taken into account in forest management decisions.
The peer-reviewed tool has been based on years of research and development by the US Forest Service, the Pacific Southwest Research Station and other academics.
Assumptions and confidence
The results of most impacts measurement will involve a number of assumptions throughout the analyses to help arrive at feasible conclusions. It is critical that these are documented in detail. Findings will also be based on a variable quantity and quality of data sources. It is important to be transparent about this and present results with varying degrees of confidence according to the sources of data, strength of correlations and potential confounding factors. This framework research aims to build an evidence base of assumptions and data sources that can be built on to provide a consistent and robust approach.
Causation vs correlation
It is vital to note the difference between correlations and causal relationships between actions and impacts. Demonstrating causality is particularly challenging and resource intensive. Therefore, it is especially important to focus and coordinate research efforts regarding causation on the most critical data gaps and across the key city contexts. Furthermore, where this research does exist it should be made available to cities to use as widely as possible.
Distinguishing between individuals and the general population
It is important to distinguish between the impacts experienced by an individual affected by the action, compared with the impacts spread across the city population. This affects decision making and facilitates communication for different audiences. For instance, per capita health gains for bike share users are much larger than population wide health benefits, and therefore much more convincing to an individual citizen considering bike sharing. However, local government stakeholders might be more interested in population level impacts, and how the community as a whole is benefiting.
Confounding factors, disaggregating actions/impacts
It can be challenging to completely disaggregate actions and the associated impacts. A city will generally be delivering numerous actions, which could have overlapping impacts. For example, a city may roll out cycle lanes and start taxing polluting vehicles. In this instance, it can be difficult to determine how much each of those actions have contributed to an improvement in air quality.
Collaboration
Cross-departmental and organisational working is critical for impact measurement and making a stronger case for climate action. The impacts of climate action are not limited to one sector or institution. By working together, city departments and organisations can more effectively measure impacts and make a more persuasive case for city-wide climate action, leveraging greater political and financial support while also improving the efficient use of departmental budgets.
36 Dose-response functions measure the relationship between exposure to a ‘dose’ of e.g. pollution, or in this example physical activity, and specific outcomes, e.g. impact on health, as an effect or ‘response’.37 www.heatwalkingcycling.org38 www.itreetools.org39 Benefits of Climate Action: Piloting a Global Approach to Measurement, C40 2016
40 The pedestrian pound: The business case for better streets and places, Living Streets, 201541 New York City Department of Transportation, 201342 Walk this Way: The Economic Promise of Walkable Places in Metropolitan Washington, D.C. Brookings 201243 From Fitness Zones to the Medical Mile: How Urban Park Systems Can Best Promote Health and Wellness, The Trust for Public Land, Harnik and Welle, 2011

06THE WAY FORWARD
>63URBAN CLIMATE ACTION IMPACTS FRAMEWORK

>65URBAN CLIMATE ACTION IMPACTS FRAMEWORK
By utilising and filling a global database of actions and impact pathways, case studies, indicators and information sources, the intention is to put the arguments for inclusive climate action in the hands of the cities, in order to ensure that cities will be able to take the necessary climate actions needed to play their part in the world staying on the 1.5-degree Celsius pathway. As a result C40 aims to develop such a database. We invite and encourage all cities, researchers, NGO’s and any others working to make the case for ambitious urban climate action join in this effort.
This project is the first step towards unlocking accelerated city climate action by providing cities with the resources and evidence needed to make the case for that action. This is one of our best chances for delivering on the Paris Agreement and delivering a climate safe future, it is also pivotal to doing so in a way that is inclusive of all citizens and their needs. It is crucial to delivering the Sustainable Development Goals.
It is hoped that the outputs of this work, including the principles of the UCAIF (section 2.4) outlined in this document, can serve as helpful guideless as we move to develop that suite of tools and resources needed by cities. The UCAIF is still in an early stage of development, but provides a broad unifying framework for relating climate action to any impact, and vice versa. The next step will be two-fold.
First, in the short term, to establish a tool or platform to allow cities to start to work with and access the thinking behind the framework and its tools. While the full pathway mapping is displayed in Figure 2, its complexity and size makes it unfit for full presentation in a report. This mapping is the first of its kind to be attempted, and C40 cities have already confirmed that making it available to cities to explore will be of tremendous value. Cities have also suggested that printing out the full pathway mapping and share it across city departments is a way of facilitating horizontal integration when planning climate action and when making the case for it. C40 will continue to work on developing the Framework into an interactive tool to enable cities to learn from each other and inform their policy decisions. A pilot interactive model for such as tool has been developed in this study and is described in Annex IV.
Second, to systematically deepen the content establishing methods, metrics, data and case studies for each of the pathway, and where relevant each step of the pathway. This would be expanded until we have robustly filled out the evidence base across all key climate actions, for all relevant benefits, and ideally with data developed for a wide range of cities. This will ensure that any city considering developing an ambitious climate action will be able to explore the likely wider impacts by comparing to similar cities that have already tried it, and then access metrics, methods and multipliers (including the ones developed directly by C40) to support in undertaking an assessment of what the possible local impact would be. The framework will certainly also need expanding laterally over time, with more and more pathways added to include new actions and benefits.
THE UCAIF IS STILL IN AN EARLY STAGE OF DEVELOPMENT, BUT PROVIDES A BROAD UNIFYING FRAMEWORK FOR RELATING CLIMATE ACTION TO ANY IMPACT, AND VICE VERSA.

ANNEXES
>67URBAN CLIMATE ACTION IMPACTS FRAMEWORK

>69URBAN CLIMATE ACTION IMPACTS FRAMEWORK
>>>>>>>>>>>>>>>>>>>>>>>>>ANNEX I – REFERENCE MATERIAL PROVIDED BY THE EXPERT REVIEW GROUPThe Framework builds on an extensive knowledge base that was provided in close cooperation with the Expert Review Group. All partners were asked to submit reference material on systematic approaches to working with benefits of urban climate projects. The below list summarises the reviewed reference material.
Ang, G. & Marchal, V., 2013. Mobilising Private Investment in Sustainable Transport: The Case of Land-Based Passenger Transport Infrastructure. OECD Environment Working Papers, Volume 56.
Clayton Whitmore-Williams, S., Manning, C., Krygsman, K. & Speiser, M., 2017. Mental Health and Our ChangingClimate: Impacts, Implications, and Guidance,Washington, D.C: American Psychological Association,and ecoAmerica.
DAMVAD Analytics, 2015. The Co-Benefits of Sustainable City Projects, s.l.: C40.
Foxon, T. J. et al., 2014. Low carbon infrastructure investment: extending business models for sustainability. Infrastructure Complexity, 2(4).
GBPN Global Centre, 2014. Briefing Note – Metrics for Accounting for Multiple Benefits of Building Energy Efficiency, Paris: C40 – PBSEEN and Green Growth Networks.
Hoornweg, D., Hosseini, M., Kennedy, C. & Behdadi, A., 2016. An urban approach to planetary boundaries. Ambio, Issue 45, p. 567–580.
International Energy Agency, 2014. Capturing the Multiple Benefits of Energy Efficiency, Paris: IEA Publications.
Kats, G. & Glassbrook, K., 2016. Achieving Urban Resilience: Washington DC, Washington, D.C: District Department of Energy and the Environment - Washington DC.
LSE Cities, 2016. Co-benefits of urban climate action: A framework for cities, London: C40 Cities.
Mayrhofer, J. P. & Gupta, J., 2016. The science and politics of co-benefits in climate policy. Environmental Science & Policy, Issue 57, p. 22–30.
OECD, 2010. Cities and Climate Change, Paris: OECD Publishing.
OECD, 2010. Glossary of Key Terms in Evaluations and Results Based Management, Paris: OECD.
OECD, 2014. Report on the OECD Framework for Inclusive Growth, Paris: OECD Publishing.
OECD, 2015. Aligning Policies for a Low-carbon Economy, Paris: OECD Publishing.
OECD, 2016. Making Cities Work for All, OECD Publishing: Paris.
PwC, 2013. Measuring and managing total impact – strengthening business decisions for business leaders, s.l.: PwC.
Rashidi, K., Stadelmann, M. & Patt, A., 2017. Valuing co-benefits to make low-carbon investments in cities bankable: the case of waste and transportation projects. Sustainable Cities and Society, Volume 34, pp. 69-78.
The Rockefeller Foundation, Arup, 2014. City Resilience Index, s.l.: The Rockefeller Foundation, Arup.
The World Bank, ClimateWorks Foundation, 2014. Climate-Smart Development, Washington, D.C: World Bank Group.
>>>>>>>>>>>>>>>>>>>>>>>>>ANNEX II – CLIMATE ACTION TOOL MAP
As part of this project, a prototype of the interactive tool was developed, named the Climate Action Tool Map (CATM). CATM is structured based on the Taxonomy and allows visualising and navigating Pathways in a user-friendly layout. The information is layered such that CATM makes it navigable and searchable.
Different types of information are accessible on CATM: a map of climate actions and their impacts, literature references supporting the links between actions and their impacts, case studies and statistics showcasing examples of actions implemented in different cities and their successes, best practices for effective action, methodologies and indicators to support cities in calculating impacts of their actions, including UN SDG indicators to help cities find how they can contribute to the Goals.
CATM maps city actions along with their resulting impacts (based on impacts listed in the Taxonomy). This mapping follows the intervention logic format described above, meaning that it outlines the process by which actions within a certain sector can result in different impacts (positive or negative impacts), detailing the cause-effect chain of outcomes leading to these impacts.
The Tool contains the six sectors of action described in section 4.3:
URBAN PLANNING AND DEVELOPMENT
TRANSPORT ENERGY
BUILDINGSSOLID WASTE MANAGEMENT
WATER
Links between elements are represented by arrows, which differ based on the type of link. There are positive or negative links, meaning that the element leads to or mitigates the following outcome or impact. A third type of arrow identifies hazard-related links, which link an event to an outcome, contingent on the occurrence of that event. This is used specifically to identify the possible impacts resulting from hazards (such as floods). Each type of link is represented by a different arrow.
Positive link
Negative link
Hazard-related link
Climate Action Tool Map

>71URBAN CLIMATE ACTION IMPACTS FRAMEWORK
The sectors, actions, causal links and impacts are interlinked. These interlinkages can be observed all at once, however to facilitate research and navigation, the tool also allows to isolate one element and its interlinkages. For example, it is possible to only look at one sector, one action, one outcome, or one impact and its interlinkages only, by simply clicking on the element of the map.
The future of CATM should be a much more advanced tool, supported with information contained in the database populated as part of the UCAIF project. New information could be entered into the database by the users directly, but moderated by experts before publication on CATM. The information must be structured following the Climate Action Impact Taxonomy. CATM would enable visualising the information.
While the architecture of the Framework is meant to remain mostly unchanged, data in CATM is expected to evolve so that researchers and users of CATM can contribute to its expansion. To maximize the utility of the tool to cities, CATM supports the identification of information which should be prioritized for inclusion. To do so, cities can identify the list of priority goals based on the list of impacts in the Taxonomy. This list will be used to identify where data is particularly needed to support cities in their actions.
> Contributors and next steps for the UrbanClimate Action Impacts Framework
Due to the organic nature of the project, which allows the Framework and evidence base to continue to evolve and improve (along the principles defined), the UCAIF’s success will depend on having active contributors and users. Contributors to the Framework can provide case study data, Pathways, and help the Framework develop; while users of the Framework will consult the information provided under the Framework and provide feedback on the functionality of it. In the next paragraphs, the roles of contributors and users are described. Note that, as the UCAIF is still in development, the precise means for data sharing and visualisation are still to be determined.
Expert contributors to the UCAIF
Expert contributors are researchers, policy evaluators, economists, consultants, city networks and other policy analysts who conduct or review impact assessments and CBA of urban climate actions in case study formats. Expert contributors will ensure that information included
on the Platform is aligned with the Framework’s structure and principles (described in further detail in the following chapters), and contributes to its development. This means that contributors should use the Taxonomy to refer to different types of impacts, document impacts by linking them to city actions, develop Pathways to visually represent the links between actions and impacts, support and document identified causal links with sources, statistical or quantitative data as well as information regarding contingencies, and discuss how these contingencies have affected the success of the action analysed are provided from case studies. This information is shared with C40 Platform managers in a common and accessible format.
City contributors to the UCAIF
City contributors are city policy advisors and city officials working closely with policy-makers or supporting their functions. City contributors support the development of the Platform from their city’s point of view by providing information to C40 and managers of the Platforms regarding actions undertaken in cities and their results. This information is shared with C40 and Platform managers in a common and accessible format (templates will be provided). City contributors also identify the priority issues on the policy agenda of their city in order to help guide future urban research and so that the information available on the Platform becomes more relevant. All city contributions are and will be voluntary.
Users of the UCAIF
Users of the UCAIF could be any city stakeholders wishing to learn more about the potential impacts of urban climate actions, or in reverse, about which actions can lead to certain desired (or undesired) impacts. This can also of course include contributors. Users could include non-governmental organisations, citizens, urban services providers, businesses, and other stakeholders with an interest in seeing improvements in the social, economic and environmental state of a city. Users are able to consult and search for information on the Platform. Searching is for example will be possible by using key words referring to an action, a type of impact (using the terms of the Taxonomy), a city or geographical region. Searching will allow isolation of particular Pathways, case studies and other data which contain the key words of interest. Both users and contributors will have access to all the information of the Platform.
>>>>>>>>>>>>>>>>>>>>>>>>>ANNEX III – SUGGESTED INDICATORS FOR THE CLIMATE ACTION IMPACTS TAXONOMYSource for SDG indicators: Official UN SDG proposed list of indicators
IMPACT SDG INDICATORSSPECIFIC IMPACT
EXAMPLES OF INDICATORS
Physical health
2.1.1 Prevalence of undernourishment
2.1.2 Prevalence of moderate or severe food insecurity in the population, based on the Food Insecurity Experience Scale (FIES)
2.2.1 Prevalence of stunting (height for age <-2 standard deviation from the median of the World Health Organization (WHO) Child Growth Standards) among children under 5 years of age
2.2.2 Prevalence of malnutrition (weight for height >+2 or <-2 standard deviation from the median of the WHO Child Growth Standards) among children under 5 years of age, by type (E35wasting and overweight)
3.3.1 Number of new HIV infections per 1,000 uninfected population, by sex, age and key populations
3.3.2 Tuberculosis incidence per 1,000 population
3.3.3 Malaria incidence per 1,000 population
3.3.4 Hepatitis B incidence per 100,000 population
3.3.5 Number of people requiring interventions against neglected tropical diseases
3.4.1 Mortality rate attributed to cardiovascular disease, cancer, diabetes or chronic respiratory disease
3.5.2 Harmful use of alcohol, defined according to the national context as alcohol per capita consumption (aged 15 years and older) within a calendar year in litres of pure alcohol
3.9.3 Mortality rate attributed to unintentional poisoning
3.a.1 Age-standardized prevalence of current tobaccouse among persons aged 15 years and older
4.2.1 Proportion of children under 5 years of age who are developmentally on track in health, learning and psychosocial well-being, by sex
11.5.1 Number of deaths, missing persons and persons affected by disaster per 100,000 people
Health hazards and death
Life expectancy at birth;
Mortality rates (from various causes, e.g. disease, city hazards);
Rate of injuries (from various causes, e.g. crash);
Average healthy/productive years per capita;
Death rate from preventable diseases;
Number of vector-borne diseases;
Vaccination coverage
DisabilityDisability adjusted life years (DALY);
Physical activity
Share of time spent doing physical activity;
Mental health
3.4.2 Suicide mortality rate StressSuicide rate; Perceived stress;
Dementia
SE
CT
OR
1
SGD #
SGD #
SGD # SGD #
SE
CT
OR
1

>73URBAN CLIMATE ACTION IMPACTS FRAMEWORK
IMPACT SDG INDICATORSSPECIFIC IMPACT
EXAMPLES OF INDICATORS
Housing11.1.1 Proportion of urban population living in slums, informal settlements or inadequate housing
Housing affordability
Cost of rent as share of disposable income;
Share of median income required to afford rental;
Number of evictions / repossessions;
Housing availability
Housing quality
Sufficient living area;
Share of population living in permanent housing;
Share of population living in precarious housing;
Share of population living in informal settlements;
Work-life balance
5.4.1 Proportion of time spent on unpaid domestic and care work, by sex, age and location
Available personal time
Proportion of time spent working;
Proportion of time spent doing unpaid domestic and care work;
Proportion of time spent commuting;
Proportion of time for leisure;
Peace and security
5.1.1 Whether or not legal frameworks are in place to promote, enforce and monitor equality and non-discrimination on the basis of sex
5.2.1 Proportion of ever-partnered women and girls aged 15 years and older subjected to physical, sexual or psychological violence by a current or former intimate partner in the previous 12 months, by form of violence and by age
5.2.2 Proportion of women and girls aged 15 years and older subjected to sexual violence by persons other than an intimate partner in the previous 12 months, by age and place of occurrence
10.3.1 Proportion of the population reporting having personally felt discriminated against or harassed within the previous 12 months on the basis of a ground of discrimination prohibited under international human rights law
11.7.2 Proportion of persons victim of physical or sexual harassment, by sex, age, disability status and place of occurrence, in the previous 12 months
16.1.1 Number of victims of intentional homicide per 100,000 population, by sex and age
16.1.2 Conflict-related deaths per 100,000 population, by sex, age and cause
16.1.3 Proportion of population subjected to physical, psychological or sexual violence in the previous 12 months
16.1.4 Proportion of population that feel safe walking alone around the area they live
Crime and violence
Homicide rate per 100,000;
Theft rate;
Conflict
Discrimination and harassment
IMPACT SDG INDICATORSSPECIFIC IMPACT
EXAMPLES OF INDICATORS
Peace and security (continued)
16.2.1 Proportion of children aged 1-17 years who experienced any physical punishment and/or psychological aggression by caregivers in the past month
16.2.2 Number of victims of human trafficking per 100,000 population, by sex, age and form of exploitation
16.2.3 Proportion of young women and men aged 18-29 years who experienced sexual violence by age 18
16.3.1 Proportion of victims of violence in the previous 12 months who reported their victimization to competent authorities or other officially recognized conflict resolution mechanisms
16.3.2 Unsentenced detainees as a proportion of overall prison population
16.4.1 Total value of inward and outward illicit financial flows (in current United States dollars)
16.4.2 Proportion of seized small arms and light weapons that are recorded and traced, in accordance with international standards and legal instruments
16.10.1 Number of verified cases of killing, kidnapping, enforced disappearance, arbitrary detention and torture of journalists, associated media personnel, trade unionists and human rights advocates in the previous 12 months
16.b.1 Proportion of population reporting havingpersonally felt discriminated against or harassedin the previous 12 months on the basis of a groundof discrimination prohibited under internationalhuman rights law
Discrimination and harassment
AttractivenessCity attractiveness
Yearly population growth from migration;
Perceived aesthetics;
Cultural richness and heritage
11.4.1 Total expenditure (public and private) per capita spent on the preservation, protection and conservation of all cultural and natural heritage, by type of heritage (cultural, natural, mixed and World Heritage Centre designation), level of government (national, regional and local/municipal), type of expenditure (operating expenditure/investment) and type of private funding (donations in kind, private non-profit sector and sponsorship)
Cultural diversity
Cultural heritage protection
Education
4.1.1 Proportion of children and young people:(a) in grades 2/3; (b) at the end of primary; and (c) at the end of lower secondary achieving at least a minimum proficiency level in (i) reading and (ii) mathematics, by sex
4.2.2 Participation rate in organized learning (one year before the official primary entry age), by sex
4.3.1 Participation rate of youth and adults in formal and non-formal education and training in the previous 12 months, by sex
4.5.1 Parity indices (female/male, rural/urban, bottom/top wealth quintile and others such as disability status, indigenous peoples and conflict affected, as data become available) for all education indicators on this list that can be disaggregated
Education affordability
Ratio of household income to education costs;
Level of education-related debt;

>75URBAN CLIMATE ACTION IMPACTS FRAMEWORK
IMPACT SDG INDICATORSSPECIFIC IMPACT
EXAMPLES OF INDICATORS
Education
4.6.1 Percentage of population in a given age group achieving at least a fixed level of proficiency in functional (a) literacy and (b) numeracy skills, by sex
4.a.1 Proportion of schools with access to: (a)electricity; (b) the Internet for pedagogical purposes;(c) computers for pedagogical purposes; (d) adaptedinfrastructure and materials for students withdisabilities; (e) basic drinking water; (f) singlesexbasic sanitation facilities; and (g) basic handwashingfacilities (as per the WASH indicator definitions)
4.b.1 Volume of official development assistance flowsfor scholarships by sector and type of study
4.c.1 Proportion of teachers in: (a) pre-primary;(b) primary; (c) lower secondary; and (d) uppersecondary education who have received at least theminimum organized teacher training (e.g. pedagogicaltraining) pre-service or in-service required forteaching at the relevant level in a given country
8.6.1 Proportion of youth (aged 15-24 years) not in education, employment or training
12.8.1 Extent to which (i) global citizenship education and (ii) education for sustainable development (including climate change education) are mainstreamed in (a) national education policies; (b) curricula; (c) teacher education; and (d) student assessment
Education availability
Number of schools and universities;
Government investment in education;
Level of education in the population;
Literacy rate;
Man-years of schooling;
Early childhood education;
Net enrolment rate in higher education;
Education quality
Student level of knowledge after graduation;
Student performance;
See also ‘Health, hygiene and environmental awareness and behaviour’
Environmental and health awareness and behaviour
4.7.1 Extent to which (i) global citizenship education and (ii) education for sustainable development, including gender equality and human rights, are mainstreamed at all levels in: (a) national education policies, (b) curricula, (c) teacher education and (d) student assessment
5.6.1 Proportion of women aged 15-49 years who make their own informed decisions regarding sexual relations, contraceptive use and reproductive health care
12.8.1 Extent to which (i) global citizenship education and (ii) education for sustainable development (including climate change education) are mainstreamed in (a) national education policies; (b) curricula; (c) teacher education; and (d)student assessment
13.3.1 Number of countries that have integrated mitigation, adaptation, impact reduction and early warning into primary, secondary and tertiary curricula
Waste education
Proportion of household waste that is recycled (tonnes);
Volume of waste collected from littering;
Energy use education
Energy consumption per capita;
Water use education
Water consumption per household or per capita;
Hygiene and sanitation education
Travel behaviour
Modal split
Sex education Birth rate;
Food consumption and diet education
Quality of diets;
Calories consumed per day;
Social participation
11.3.2 Proportion of cities with a direct participation structure of civil society in urban planning and management that operate regularly and democratically
Civic participation
Ratio of adults to persons engaged in civic associations (related to all areas and to climate action);
Community
cohesion
IMPACT SDG INDICATORSSPECIFIC IMPACT
EXAMPLES OF INDICATORS
Good governance
11.a.1 Proportion of population living in cities thatimplement urban and regional development plansintegrating population projections and resourceneeds, by size of city
11.3.2 Proportion of cities with a direct participation structure of civil society in urban planning and management that operate regularly and democratically
12.7.1 Number of countries implementing sustainable public procurement policies and action plans
14.2.1 Proportion of national exclusive economic zones managed using ecosystem-based approaches
14.5.1 Coverage of protected areas in relation to marine areas
14.6.1 Progress by countries in the degree of implementation of international instruments aiming to combat illegal, unreported and unregulated fishing
14.b.1 Progress by countries in the degree ofapplication of a legal / regulatory / policy /institutional framework which recognizes and protectsaccess rights for small-scale fisheries
14.c.1 Number of countries making progress inratifying, accepting and implementing through legal,policy and institutional frameworks, ocean-relatedinstruments that implement international law, asreflected in the United Nation Convention on theLaw of the Sea, for the conservation and sustainableuse of the oceans and their resources
15.2.1 Progress towards sustainable forest management
15.6.1 Number of countries that have adopted legislative, administrative and policy frameworks to ensure fair and equitable sharing of benefits
15.8.1 Proportion of countries adopting relevant national legislation and adequately resourcing the prevention or control of invasive alien species
16.3.2 Unsentenced detainees as a proportion of overall prison population
16.5.1 Proportion of persons who had at least one contact with a public official and who paid a bribe to a public official, or were asked for a bribe by those public officials, during the previous 12 months
16.5.2 Proportion of businesses that had at least one contact with a public official and that paid a bribe to a public official, or were asked for a bribe by those public officials during the previous 12 months
16.6.1 Primary government expenditures as a proportion of original approved budget, by sector (or by budget codes or similar)
16.6.2 Proportion of the population satisfied with their last experience of public services
16.7.1 Proportions of positions (by sex, age, persons with disabilities and population groups) in public institutions (national and local legislatures, public service, and judiciary) compared to national distributions
16.7.2 Proportion of population who believe decision making is inclusive and responsive, by sex, age, disability and population group
Inclusivity
Justice
Local democracy
Evidence-based policy-making
Transparency and accountability

>77URBAN CLIMATE ACTION IMPACTS FRAMEWORK
IMPACT SDG INDICATORSSPECIFIC IMPACT
EXAMPLES OF INDICATORS
Good governance (continued)
16.10.1 Number of verified cases of killing, kidnapping, enforced disappearance, arbitrarydetention and torture of journalists, associated media personnel, trade unionists and human rights advocates in the previous 12 months
16.10.2 Number of countries that adopt and implement constitutional, statutory and/or policy guarantees for public access to information
16.a.1 Existence of independent national human rights institutions in compliance with the Paris Principles
16.b.1 Proportion of population reporting having personally felt discriminated against or harassed in the previous 12 months on the basis of a ground of discrimination prohibited under international human rights law
17.14.1 Number of countries with mechanisms in place to enhance policy coherence of sustainable development
17.15.1 Extent of use of country-owned results frameworks and planning tools by providers of development cooperation
17.16.1 Number of countries reporting progress in multi-stakeholder development effectiveness monitoring frameworks that support the achievement of the sustainable development goals
17.17.1 Amount of United States dollars committed to public-private and civil society partnerships
17.18.1 Proportion of sustainable development indicators produced at the national level with full disaggregation when relevant to the target, in accordance with the Fundamental Principles of Official Statistics
17.18.2 Number of countries that have national statistical legislation that complies with the Fundamental Principles of Official Statistics
17.18.3 Number of countries with a national statistical plan that is fully funded and under implementation, by source of funding
17.19.1 Dollar value of all resources made available to strengthen statistical capacity in developing countries
17.19.2 Proportion of countries that (a) have conducted at least one population and housing census in the last 10 years; and (b) have achieved 100 per cent birth registration and 80 per cent death registration
Transparency and accountability
IMPACT SDG INDICATORSSPECIFIC IMPACT
EXAMPLES OF INDICATORS
Economic prosperity
1.a.1 Proportion of resources allocated by the government directly to poverty reduction programmes
2.3.1 Volume of production per labour unit by classes of farming/pastoral/forestry enterprise size
8.1.1 Annual growth rate of real GDP per capita
8.2.1 Annual growth rate of real GDP per employed person
17.3.1 Foreign direct investments (FDI), official development assistance and South-South Cooperation as a proportion of total domestic budget
17.3.2 Volume of remittances (in United States dollars) as a proportion of total GDP
Economic production
Total city income (GDP);
City product per capita;
Mean household income;
Labour productivity
GDP/GVA per job;
GDP per hour worked
Employment
5.5.1 Proportion of seats held by women in national parliaments and local governments
5.5.2 Proportion of women in managerial positions
8.3.1 Proportion of informal employment in non-agriculture employment, by sex
8.5.1 Average hourly earnings of female and male employees, by occupation, age and persons with disabilities
8.5.2 Unemployment rate, by sex, age and persons with disabilities
8.6.1 Proportion of youth (aged 15-24 years) not in education, employment or training
8.7.1 Proportion and number of children aged 5-17 years engaged in child labour, by sex and age
8.8.1 Frequency rates of fatal and non-fatal occupational injuries, by sex and migrant status
8.8.2 Increase in national compliance of labour rights (freedom of association and collective bargaining) based on International Labour Organization (ILO) textual sources and national legislation, by sex and migrant status
8.9.2 Number of jobs in tourism industries as a proportion of total jobs and growth rate of jobs, by sex
8.b.1 Total government spending in social protection and employment programmes as a proportion of the national budgets and GDP
9.2.2 Manufacturing employment as a proportion of total employment
10.4.1 Labour share of GDP, comprising wages and social protection transfers
10.4.1 Labour share of GDP, comprising wages and social protection transfers
10.7.1 Recruitment cost borne by employee as a proportion of yearly income earned in country of destination
16.7.1 Proportions of positions (by sex, age, persons with disabilities and population groups) in public institutions (national and local legislatures, public service, and judiciary) compared to national distributions
Employment figures
Employment/unemployment rate;
Number of jobs created and jobs lost;
Job-years created;
Number of ‘green jobs’;
Employment to population ratio;
informal employment;
Job quality Earnings quality;
Job security Contract modality;
Job safety
Rate of fatal and non-fatal occupational injuries;

>79URBAN CLIMATE ACTION IMPACTS FRAMEWORK
IMPACT SDG INDICATORSSPECIFIC IMPACT
EXAMPLES OF INDICATORS
Economic innovation, dynamism and competitive-ness
8.9.1 Tourism direct GDP as a proportion of total GDP and in growth rate
8.9.2 Number of jobs in tourism industries as a proportion of total jobs and growth rate of jobs, by sex
8.10.1 Number of commercial bank branches and automated teller machines (ATMs) per 100,000 adults
8.a.1 Aid for Trade commitments and disbursements
9.2.1 Manufacturing value added as a proportion of GDP and per capita
9.2.2 Manufacturing employment as a proportion of total employment
9.3.1 Proportion of small-scale industries in total industry value added
9.3.2 Proportion of small-scale industries with a loan or line of credit
9.5.1 Research and development expenditure as a proportion of GDP
9.5.2 Researchers (in full-time equivalent) per million inhabitants
9.a.1 Total official international support (officialdevelopment assistance plus other official flows)to infrastructure
9.b.1 Proportion of medium and high-tech industryvalue added in total value added
12.a.1 Amount of support to developing countrieson research and development for sustainableconsumption and production and environmentallysound technologies
14.a.1 Proportion of total research budget allocatedto research in the field of marine technology
17.6.1 Number of science and/or technology cooperation agreements and programmes between countries, by type of cooperation
Innovation
Number of patents created;
Access to credit;
Public investment in R&D;
Local sector development and new industries
Number of start ups;
Private wealth
10.1.1 Growth rates of household expenditure or income per capita among the bottom 40 per cent of the population and the total population
10.2.1 Proportion of people living below 50 per cent of median income, by age, sex and persons with disabilities
Value of assets Household net worth;
Economic empowerment
Annual asset accumulation power;
Purchasing power;
Disposable income;
Access to financial services;
Public budget
6.a.1 Amount of water- and sanitation-relatedofficial development assistance that is part ofa government-coordinated spending plan
17.1.1 Total government revenue as a proportion of GDP, by source
17.1.2 Proportion of domestic budget funded by domestic taxes
Available municipal budget
Available regional/State budget
Tax revenue Property tax revenue;
Non-tax revenue
State aid
IMPACT SDG INDICATORSSPECIFIC IMPACT
EXAMPLES OF INDICATORS
Sustainable production and consumption
2.4.1 Proportion of agricultural area under productive and sustainable agriculture
6.4.1 Change in water-use efficiency over time
6.4.2 Level of water stress: freshwater withdrawal as a proportion of available freshwater resources
6.5.1 Degree of integrated water resources management implementation (0-100)
6.5.2 Proportion of transboundary basin area with an operational arrangement for water cooperation
6.6.1 Change in the extent of water-related ecosystems over time
8.4.1 Material footprint, material footprint per capita, and material footprint per GDP
8.4.2 Domestic material consumption, domestic material consumption per capita, and domestic material consumption per GDP
9.4.1 CO2 emission per unit of value added
11.3.1 Ratio of land consumption rate to population growth rate
11.6.1 Proportion of urban solid waste regularly collected and with adequate final discharge out of total urban solid waste generated, by cities
12.1.1 Number of countries with sustainable consumption and production (SCP) national action plans or SCP mainstreamed as a priority or a target into national policies
12.2.1 Material footprint, material footprint per capita, and material footprint per GDP 12.2.2 Domestic material consumption, domestic material consumption per capita, and domestic material consumption per GDP
12.3.1 Global food loss index
12.4.2 Hazardous waste generated per capita and proportion of hazardous waste treated, by type of treatment
12.4.2 Hazardous waste generated per capita and proportion of hazardous waste treated, by type of treatment
12.5.1 National recycling rate, tons of material recycled
12.6.1 Number of companies publishing sustainability reports
12.a.1 Amount of support to developing countrieson research and development for sustainableconsumption and production and environmentallysound technologies
12.c.1 Amount of fossil-fuel subsidies per unit of GDP(production and consumption) and as a proportionof total national expenditure on fossil fuels
14.4.1 Proportion of fish stocks within biologically sustainable levels
14.7.1 Sustainable fisheries as a percentage of GDP in small island developing States, least developed countries and all countries
15.2.1 Progress towards sustainable forest management
Natural resources depletion
Waste production and management
Share of municipal solid waste produced/collected/reused/recycled/landfilled;
Share of food solid waste produced/collected/composted;

>81URBAN CLIMATE ACTION IMPACTS FRAMEWORK
IMPACT SDG INDICATORSSPECIFIC IMPACT
EXAMPLES OF INDICATORS
Soil quality
3.9.3 Mortality rate attributed to unintentional poisoning
15.3.1 Proportion of land that is degraded over total land area
Soil pollution
Presence of contaminants (e.g. heavy metals, chemicals; milligrams per cubic metre);
Surface of urban land that is contaminated / considered as brownfield (square metres);
Share of the population with soil pollution-related diseases
Soil degradation
Soil textureType of soil;
Size of soil particles;
Light pollution No related SDG
Sky glow
Light intrusion or trespass
Glare
Water quality
3.9.2 Mortality rate attributed to unsafe water, unsafe sanitation and lack of hygiene (exposure to unsafe Water, Sanitation and Hygiene for All (WASH) services)
3.9.3 Mortality rate attributed to unintentional poisoning
6.1.1 Proportion of population using safely managed drinking water services
6.3.2 Proportion of bodies of water with good ambient water quality
6.a.1 Amount of water- and sanitation-relatedofficial development assistance that is partof a government-coordinated spending plan
6.b.1 Proportion of local administrative units withestablished and operational policies and proceduresfor participation of local communities in water andsanitation management
14.1.1 Index of coastal eutrophication and floating plastic debris density
14.3.1 Average marine acidity (pH) measured at agreed suite of representative sampling stations
Water pollution
Level of dissolved oxygen (DO), Level of phosphorous, nitrates, nitrites, faecal matter;
Incidence of water-borne diseases;
Water salinisation or acidification
Water temperature
Water treatment
Compliance with WHO guidelines for water treatment
Temperature
Indoor air temperature
Building energy demand and consumption for heating/cooling;
Outdoor air temperature
Urban temperature;
Number of days with extreme heat exceedance;
% of urban area that is green space;
% of urban area that is asphalt / building;
IMPACT SDG INDICATORSSPECIFIC IMPACT
EXAMPLES OF INDICATORS
Biodiversity
2.5.1 Number of plant and animal genetic resources for food and agriculture secured in either medium or long-term conservation facilities
2.5.2 Proportion of local breeds classified as being at risk, not-at-risk or at unknown level of risk of extinction
14.1.1 Index of coastal eutrophication and floating plastic debris density
14.4.1 Proportion of fish stocks within biologically sustainable levels
14.2.1 Proportion of national exclusive economic zones managed using ecosystem-based approaches
14.5.1 Coverage of protected areas in relation to marine areas
15.1.1 Forest area as a proportion of total land area
15.1.2 Proportion of important sites for terrestrial and freshwater biodiversity that are covered by protected areas, by ecosystem type
15.4.1 Coverage by protected areas of important sites for mountain biodiversity
15.5.1 Red List Index
15.7.1 Proportion of traded wildlife that was poached or illicitly trafficked
15.8.1 Proportion of countries adopting relevant national legislation and adequately resourcing the prevention or control of invasive alien species
15.9.1 Progress towards national targets established in accordance with Aichi Biodiversity Target 2 of the Strategic Plan for Biodiversity 2011-2020
15.a.1 Official development assistance and publicexpenditure on conservation and sustainable useof biodiversity and ecosystems
Biodiversity protection
Proportion of natural areas under protection
Ecosystem services
Biological diversity
Number of endemic species who need intact natural habitat that might be displaced by urban growth
Species population
Air quality
3.9.1 Mortality rate attributed to household and ambient air pollution
3.9.3 Mortality rate attributed to unintentional poisoning
11.6.2 Annual mean levels of fine particulate matter (e.g. PM2.5 and PM10) in cities (population weighted)
Indoor air pollution
Types of cooking fuels used in households
Outdoor air pollution
Number of days above WHO recommendations for various pollutants (e.g. Ground-level ozone);
Mean average exposure to PM2.5 concentrations (milligrams per cubic metre);
Mean average exposure to NO
2
concentrations (milligrams per cubic metre);
Olfactory pollution
Incidence of airborne diseases, injuries and sickness due to olfactory pollution
Noise No related SDG
Indoor noise Indoor noise levels (dB)
Outdoor noiseNoise levels due to traffic and other urban activities (dB)

C40
3 Queen Victoria Street, City London EC4N 4TQ United Kingdom
www.c40.org