Embed Size (px)
Citation preview

Prepared by UW-Stout Applied Research Center 11/23/2009 Contact:
Susan Greene Jenna Acker
Joshua Hachmeister
Survey Developed by: Susan Greene
Wendy Marson
Report Prepared for Dr. Charles Sorensen
Chancellor, University of Wisconsin-Stout
University of Wisconsin-Stout Applied Research Center
Downtown Menomonie Assessment: UW-Stout, Fall 2009
Wisconsin’s Polytechnic University

2
Downtown Menomonie Assessment: UW-Stout Fall 2009 EXECUTIVE SUMMARY
This is a report of the survey results for the assessment of UW-Stout faculty/staff and student downtown Menomonie use and their ideas for downtown improvement. The survey was conducted during the month of October, 2009. The faculty/staff survey response rate was 60% and the student survey response rate was 39%. This report describes: the study methodology including the demographic characteristics of the survey participants; frequency of use of downtown and current levels of satisfaction; features that brought participants downtown and features that kept people from visiting downtown; participant suggestions for changes to downtown and how UW-Stout could assist with these changes; and the influence of downtown on the decision to come to UW-Stout. The authors believe the data support the following conclusions:
1. Nearly all of the UW-Stout survey participants had visited downtown at least once in the month prior to taking the survey, and the majority had visited at least once a week.
2. The most frequently visited areas of downtown were
a. On Broadway between 5th Avenue and Main Street b. Area bordered by Main Street, 5th Avenue, 2nd Street and 3rd Street
3. UW-Stout participants most frequently visit downtown at least once a week for dining
and drinking alcohol. 4. Overall, those who visited downtown were satisfied with their visits. The top three rated
areas were banking, post office, and dining.
5. Aspects of downtown that attracted visits included: convenient to campus, easy to get around, and the atmosphere. Convenience and atmosphere were also mentioned as downtown strengths in the community survey conducted in 2006 by students from Chippewa Valley Technical College (CVTC).
6. Aspects of downtown that detracted from visits included: lack of goods and services,
smell of Lake Menomin, and the lack of parking. Lack of variety and lack of parking were also mentioned as weaknesses in the 2006 CVTC study.
7. When asked what they would like to see in downtown Menomonie, participants
responded a. When rating the importance of retail stores, the top choices were convenience
store and clothing store. Clothing store was also a top choice in a community survey conducted in 2006 by CVTC.
b. When asked to provide short answer suggestions

3
i. Retail: the most frequent themed comments were clothing, food, and grocery store
ii. Services: the most frequent themed comments were personal services, transportation, and repair services
iii. Improvements: the most frequent themed comments were parking, more stores, clean Lake Menomin, and improve the appearance of downtown
8. When asked which ideas UW-Stout should help with, participants most frequently chose
clothing store and parking. As a group, retail opportunities were most frequently chosen, with shopping as the predominant theme followed by food venues.
9. Participants were asked how UW-Stout could help implement their suggestions for
improvement. The most frequent theme was to provide consumer support for the new businesses, and to collaborate with downtown to effect improvements. There were many suggestions on how this collaboration could occur
a. General: volunteer groups, class projects, capstone/internships b. Student run businesses c. Help with Lake Menomin clean-up: volunteer groups, class projects d. Advertising e. Cleaning up downtown and keeping it clean f. Fund raising g. Fixing up and/or repairing the buildings
10. Participants were asked if they had any other comments about downtown. For those who
responded, the most frequent theme was that they liked downtown the way it is. For those who offered suggestions for change, the most frequent overall themes were making structural changes – making physical and parking improvements; and having more stores – general and student-centered.
11. Participants were asked to rate the level of influence downtown Menomonie had on their
decision to come to UW-Stout. The most frequent response was that it had a low level of influence.

4
Table of Tables Table 1. Demographic Information* .............................................................................................................................. 7 Table 2. Frequency of response to In the past month, how often have you visited downtown? .................................. 8 Table 3. Frequency of Visits to Downtown Menomonie Areas by Group ....................................................................... 9 Table 4. Frequency of responses to In the past month, how often have you visited downtown Menomonie for… .... 11 Table 5. Distribution of Satisfaction Ratings for Downtown Visits, Overall and by Group .......................................... 12 Table 6. Frequency of Responses to Please select your top three reasons for visiting downtown Menomonie, All
Responses And By Group ............................................................................................................................... 15 Table 7. Frequency of Responses to Please select your top three reasons for not visiting downtown Menomonie, All
Responses And By – Group ............................................................................................................................ 16 Table 8. Frequency of Responses to Similar Question from 2006 CVTC Community Survey. ...................................... 17 Table 9. Distribution of Responses to How important would it be to have the following retail opportunities in
downtown Menomonie? All Responses ......................................................................................................... 17 Table 10. Frequency of Response to Please list up to three specific types of retail opportunities you would like to see
in downtown Menomonie by Category ......................................................................................................... 18 Table 11. Frequency of Response to Please list up to three specific types of services you would like to see in
downtown Menomonie by Category ............................................................................................................. 20 Table 12. Frequency of Response to Please list up to three specific examples of how downtown Menomonie could
be improved by Category .............................................................................................................................. 21 Table 13. Of these suggestions, which three would you like to see the UW‐Stout Community be involved with? ..... 22 Table 14. Themed Responses to What do you see as the UW‐Stout Community’s role in carrying out your
suggestions (responses from 768 participants) ............................................................................................. 23 Table 15. Themed responses to What other comments do you have about downtown Menomonie? (comments
from 516 participants) ................................................................................................................................... 27 Table 16. Frequency of Responses for level of influence that your impression of downtown Menomonie had on your
decision to come to UW‐Stout ....................................................................................................................... 31
Table of Figures Figure A. Total Number of Times Downtown Area Chosen ............................................................................................ 8 Figure B. Average Satisfaction Ratings for Downtown Visits, All Responses .............................................................. 12 Figure C. Frequency of Choices for Top Three Reasons Visit Downtown, All Responses ............................................. 13 Figure D. Frequency of Choices for Top Three Reasons Do Not Visit Downtown, All Responses ................................. 14 Figure E. Average Ratings for Importance of Retail Opportunities by Group ............................................................. 17 Figure F. Average Ratings for Level of Influence of Downtown in Decision to Come to UW‐Stout by Group ............. 31

5
Downtown Menomonie Assessment: UW-Stout Fall 2009 FULL REPORT
OVERVIEW The UW-Stout Downtown Menomonie Assessment project resulted from meetings between Chancellor Sorensen and the mayor of Menomonie. The primary interest was to discover how UW-Stout faculty, staff and students currently use downtown, why they do and do not visit downtown, what improvements they would like to see, and how UW-Stout could be involved in making these changes. The results of this report will be used in the redevelopment efforts of downtown Menomonie.
METHOD The survey was developed by staff in the Budget, Planning and Analysis office. The survey was pilot tested on a group of UW-Stout staff and students, and revisions were made based on their comments. To increase the survey response rate of students, incentives were provided to a random sample that completed the survey. In order to accommodate these incentives, the student and faculty/staff surveys were administered separately. Both surveys were web-based and administered via the university supported survey tool Qualtrics. The surveys had UW-Stout Institutional Review Board approval. Instrument Each survey began with a filtering question to exclude respondents that did not physically come to campus for school/work in the current academic year. For those who did travel to campus, the next survey question further filtered by downtown visitation habits. Participants who indicated visiting downtown at least once in the past month were asked how many times a particular retail/service had been used in the past month and the level of satisfaction with the retail/service experience; they were also asked to choose the top three reasons they visited downtown. All respondents answered the next set of questions regarding reasons they did not visit downtown, what types of retail/services/improvements they would like to see in downtown, and how they thought UW-Stout could help carry out these suggestions. For all quantitative questions, question presentation was randomized so that no one item predominantly appeared as the first or last selection for each section. All respondents were also given the opportunity to make additional comments. Basic demographic information was collected on each group. A copy of the survey is in Appendix A. Sample To gather the most informative opinions of downtown usage, the populations of interest were limited to persons who had been at UW-Stout for at least one year. The faculty/staff sample consisted of a 50% random sample of all faculty/staff from the fall 2008 October payroll

6
database. The student sample consisted of a 50% random sample of all current students that were not a new student in fall 2009 (i.e. excluded new freshman and transfer students). Sample Administration To enhance survey response rates, publicity efforts included:
• Email from Chancellor Sorensen urging faculty/staff to take the survey; • Email letter from SSA president urging students to take the survey; • Messages in the daily email -- student and faculty/staff -- prior to survey
implementation; • Slide on UW-Stout-TV that rotated regularly throughout the day while the survey was
active; • Student incentives in the form of five $100 Menomonie Chamber gift cards.
The student survey was open from October 5 to October 30; the faculty/staff survey was open from October 6 to October 30. Two follow-up reminders were sent to the students, and two reminders were sent to faculty/staff. The survey was successfully sent to 3003 students and 1160 students responded to at least the first question of the survey for a response rate of 39%. After removing distance education students and those who did not answer more the first two survey questions, the final sample size for the students was 1024. The survey was successfully sent to 555 faculty and staff, and 333 faculty/staff responded to at least the first question of the survey for a response rate of 60%. After removing faculty/staff that did not work in Menomonie and those who did not answer more the first two survey questions, the final sample size for the faculty and staff was 304. There are two ways to examine the representativeness of the sample. One is the response rate. There is no standard for an acceptable response rate, however, the higher the rate, the better. The second is comparing the demographic profiles of the people invited to take the survey. If the profiles are similar, it is an indication that the sample is representative of the population. Data Analysis Quantitative data was analyzed using SPSS (Statistics Package for the Social Sciences). Qualitative responses were analyzed using SPSS and Excel. Themes were identified after an initial reading, and verified by a second reader. Responses were coded into the themes and coding was verified by a second reader.

7
Demographics The preliminary filtering question resulted in sample sizes of 1024 students and 304 faculty/staff eligible to respond to the remainder of the survey. Both groups were asked a set of questions about themselves. A summary of the responses are in Table 1. Faculty/staff gender distribution was representative of UW-Stout faculty/staff population, as was the student gender distribution. Minority faculty/staff respondents were slighted underrepresented; minority student respondents were similar to the overall UW-Stout student population. Senior respondents were slightly overrepresented compared to the overall UW-Stout student population and graduate students were underrepresented.1 The majority of faculty and staff respondents worked at UW-Stout for 4 or more years, with the largest percentage for 10 or more years. Half of the faculty/staff live in Menomonie, and 70% of the student respondents lived on or near campus.
1 UW-Stout student and faculty/staff population statistics from 2008-2009 Fact Book.
Table 1. Demographic Information*
Demographic Total Faculty
and Staff Student
N (% of Total)
N (% of Total)
N (% of Total)
Gender
Male 435 (32.8%) 98 (32.2%)
337 (32.9%)
Female 713 (53.7%) 177 (58.2%)
536 (52.3%)
EthnicityAmerican Indian or other Native American 6 (0.5%) 1 (0.3%) 5 (0.5%) Asian, Asian American, or Pacific Islander 34 (2.6%) 7 (2.3%) 27
(2.6%)Black or African American 4 (0.3%) 3 (1.0%) 1 (0.1%)
White (non-Hispanic) 1024 (77.1%) 241 (79.3%)
783 (76.5%)
Mexican or Mexican American 1 (0.1%) 0 (0%) 1 (0.1%) Hispanic or Latino/a 6 (0.5%) 3 (1.0%) 3 (0.3%)Multiracial 12 (0.9%) 3 (1.0%) 9 (0.9%)
Faculty and Staff specific questions Student specific questions
Demographic N (% of Total) Demographic N (% of
Total) Years worked at UW-Stout Years in school Less than 1 year 1 (0.3%) Freshman 2 (0.2%)1-3 years 55 (18.1%) Sophomore 204 (19.9%)4-10 years 89 (29.3%) Junior 200 (19.5%)More than 10 years 132 (43.4%) Senior 385 (37.6%)
Graduate 63 (6.2%) Live in Menomonie Live on or near campusYes 154 (50.7%) Yes 712 (69.5%)No 122 (40.1%) No 163 (15.9%)*Percentages may not add to 100% due to non-response.

8
RESULTS
Results from the survey responses are presented in four sections: downtown visitation habits for the months of September/October; features that brought people to visit downtown and that prevented people from visiting downtown; suggestions for changes to downtown; and the influence of downtown on UW-Stout choice. Visitation Habits Participants were asked in the past month, how often have you visited downtown? Table 2 shows that 94% of all the participants had visited downtown at least once. The most frequent number of visits to downtown in the past month was 1-3 times. However, 59% of the participants indicated they had visited downtown at least once per week in the past month (September and/or October, depending on when the survey was taken). Comparison of faculty/staff and student frequency of responses revealed statistical differences. Table 2 shows that students were the most frequent visitors to downtown; in fact 63% of students visited at least once per week whereas 46% of faculty/staff visited at least once per week, and nearly twice as many students visited downtown daily compared to faculty/staff. Participants that visited downtown If responses to In the past month, how often have you visited downtown? were more than never, then participants received the next set of questions. First, they were shown a map of downtown Menomonie that had several business delimited for orientation purposes, and they were asked to click on the map areas that they had visited in past month. A summary of the frequency of clicks is presented in Figure A and Table 3. The frequencies represent responses from 1248 participants. Note that on the survey, Area 6 and Area 8 did not have businesses displayed.
Table 2. Frequency of response to In the past month, how often have you visited downtown?
Total Faculty and Staff Students
Number of Responses
(% of Total)
Number of Responses
(% of Total)
Number of Responses
(% of Total)
Never 80 (6.0%) 29 (9.5%) 51 (5.0%) 1-3 times 465 (35.0%) 136 (44.7%) 329 (32.1%) Once per week 301 (22.7%) 58 (19.1%) 243 (23.7%)
2-4 times per week 321 (24.2%) 60 (19.7%) 261 (25.5%)
Daily 157 (11.8%) 21 (6.9%) 136 (13.3%)
Figure A. Total Number of Times Downtown Area Chosen
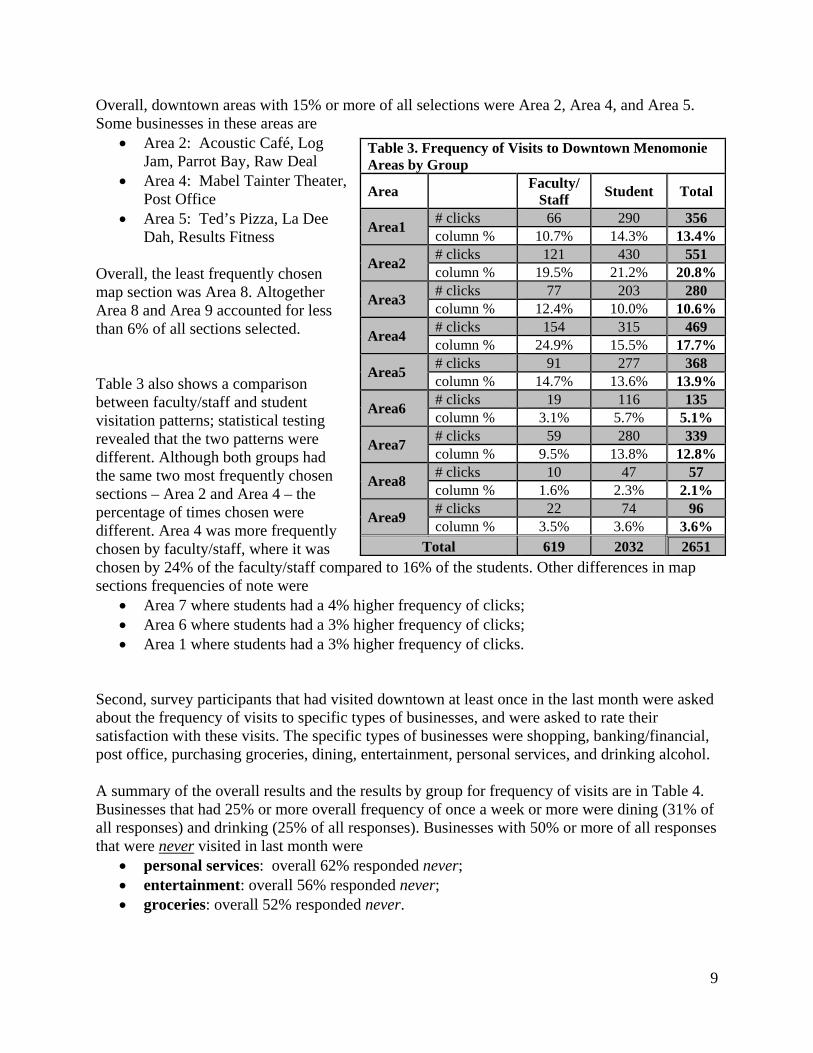
9
Overall, downtown areas with 15% or more of all selections were Area 2, Area 4, and Area 5. Some businesses in these areas are
• Area 2: Acoustic Café, Log Jam, Parrot Bay, Raw Deal
• Area 4: Mabel Tainter Theater, Post Office
• Area 5: Ted’s Pizza, La Dee Dah, Results Fitness
Overall, the least frequently chosen map section was Area 8. Altogether Area 8 and Area 9 accounted for less than 6% of all sections selected. Table 3 also shows a comparison between faculty/staff and student visitation patterns; statistical testing revealed that the two patterns were different. Although both groups had the same two most frequently chosen sections – Area 2 and Area 4 – the percentage of times chosen were different. Area 4 was more frequently chosen by faculty/staff, where it was chosen by 24% of the faculty/staff compared to 16% of the students. Other differences in map sections frequencies of note were
• Area 7 where students had a 4% higher frequency of clicks; • Area 6 where students had a 3% higher frequency of clicks; • Area 1 where students had a 3% higher frequency of clicks.
Second, survey participants that had visited downtown at least once in the last month were asked about the frequency of visits to specific types of businesses, and were asked to rate their satisfaction with these visits. The specific types of businesses were shopping, banking/financial, post office, purchasing groceries, dining, entertainment, personal services, and drinking alcohol. A summary of the overall results and the results by group for frequency of visits are in Table 4. Businesses that had 25% or more overall frequency of once a week or more were dining (31% of all responses) and drinking (25% of all responses). Businesses with 50% or more of all responses that were never visited in last month were
• personal services: overall 62% responded never; • entertainment: overall 56% responded never; • groceries: overall 52% responded never.
Table 3. Frequency of Visits to Downtown Menomonie Areas by Group
Area Faculty/Staff Student Total
Area1 # clicks 66 290 356 column % 10.7% 14.3% 13.4%
Area2 # clicks 121 430 551 column % 19.5% 21.2% 20.8%
Area3 # clicks 77 203 280 column % 12.4% 10.0% 10.6%
Area4 # clicks 154 315 469 column % 24.9% 15.5% 17.7%
Area5 # clicks 91 277 368 column % 14.7% 13.6% 13.9%
Area6 # clicks 19 116 135 column % 3.1% 5.7% 5.1%
Area7 # clicks 59 280 339 column % 9.5% 13.8% 12.8%
Area8 # clicks 10 47 57 column % 1.6% 2.3% 2.1%
Area9 # clicks 22 74 96 column % 3.5% 3.6% 3.6%
Total 619 2032 2651

10
Table 4 shows that there were no apparent differences between the faculty/staff and student responses for the three listed areas of never visited. Statistical differences between faculty/staff and students responses for how often have you visited downtown Menomonie for …. occurred for
• Banking/financial, where twice as many students responded never visited than did faculty/staff (55% vs. 28%);
• Post office, where nearly three times as many students responded never visited than did faculty/staff (39% vs. 14%);
• Purchasing groceries, where almost twice as many students indicated they shopped once a week or more than did faculty/staff (16% vs. 9%);
• Dining, where 10% more students indicated they dined downtown once a week or more than did faculty/staff (33% vs. 23%);
• Personal services, where more than twice as many students indicated they use once a week or more than did faculty/staff (8% vs. 3%);
• Drinking alcohol, where 32% of students indicated once a week or more use compared to 5% of faculty/staff.

11
Table 4. Frequency of responses to In the past month, how often have you visited downtown Menomonie for…
Total Faculty/Staff Students N (% of Total) N (% of Total) N (% of Total)
Shopping Never 472 (35.5%) 95 (31.2%) 377 (36.8%) 1-3 times 564 (42.5%) 129 (42.4%) 435 (42.5%) Once per week 109 (8.2%) 17 (5.6%) 92 (9.0%) 2-4 times per week 32 (2.4%) 6 (2.0%) 26 (2.5%) Daily 1 (0.1%) 1 (0.3%) 0 (0%)
Banking/financial Never 650 (48.9%) 84 (27.6%) 566 (55.3%) 1-3 times 355 (26.7%) 129 (42.4%) 226 (22.1%) Once per week 149 (11.2%) 40 (13.2%) 109 (10.6%) 2-4 times per week 40 (3.0%) 8 (2.6%) 32 (3.1%) Daily 4 (0.3%) 0 (0%) 4 (0.4%)
Post Office Never 438 (33.0%) 41 (13.5%) 397 (38.8%) 1-3 times 663 (49.9%) 184 (60.5%) 479 (46.8%) Once per week 82 (6.2%) 25 (8.2%) 57 (5.6%) 2-4 times per week 21 (1.6%) 14 (4.6%) 7 (0.7%) Daily 3 (0.2%) 2 (0.7%) 1 (0.1%)
Purchase Groceries Never 688 (51.8%) 162 (53.3%) 526 (51.4%) 1-3 times 303 (22.8%) 58 (19.1%) 245 (23.9%) Once per week 149 (11.2%) 15 (4.9%) 134 (13.1%) 2-4 times per week 37 (2.8%) 11 (3.6%) 26 (2.5%) Daily 4 (0.3%) 2 (0.7%) 2 (0.2%)
Dining Never 96 (7.2%) 41 (13.5%) 55 (5.4%) 1-3 times 712 (53.6%) 150 (49.3%) 562 (54.9%) Once per week 272 (20.5%) 36 (11.8%) 236 (23.0%) 2-4 times per week 122 (9.2%) 30 (9.9%) 92 (9.0%) Daily 13 (1.0%) 5 (1.6%) 8 (0.8%)
Entertainment (movies, theater, art exhibits)Never 739 (55.6%) 172 (56.6%) 567 (55.4%) 1-3 times 398 (30.0%) 74 (24.3%) 324 (31.6%) Once per week 35 (2.6%) 1 (.3%) 34 (3.3%) 2-4 times per week 10 (0.8%) 0 (0%) 10 (1.0%) Daily 1 (0.1%) 0 (0%) 1 (0.1%)
Personal services (salons, spas, exercise) Never 826 (62.2%) 189 (62.2%) 637 (62.2%) 1-3 times 263 (19.8%) 48 (15.8%) 215 (21.0%) Once per week 36 (2.7%) 3 (1.0%) 33 (3.2%) 2-4 times per week 39 (2.9%) 5 (1.6%) 34 (3.3%) Daily 12 (0.9%) 0 (0%) 12 (1.2%)
Drinking Alcohol Never 559 (42.1%) 155 (51.0%) 404 (39.5%) 1-3 times 286 (21.5%) 72 (23.7%) 214 (20.9%) Once per week 195 (14.7%) 12 (3.9%) 183 (17.9%) 2-4 times per week 142 (10.7%) 3 (1.0%) 139 (13.6%) Daily 8 (0.6%) 1 (0.3%) 7 (0.7%)

12
Participants were asked to rate their level of satisfaction with visits in the eight areas of shopping, banking/financial, post office, purchasing groceries, dining, entertainment, personal services, and drinking alcohol. Figure B shows that average responses ranged from 3.33 to 4.05 on the 5-point scale. Visits with average ratings of 4.0 or higher included dining, post office, and banking. Visits with average ratings lower than 3.5 included shopping and entertainment. Table 5 contains a summary of the results overall and by group. Figure B. Average Satisfaction Ratings for Downtown Visits, All Responses
3.39
4.05 4.043.60
4.00
3.333.68 3.84
1
2
3
4
5
Comparisons between groups revealed that faculty/staff had higher average ratings for all categories with the exception of drinking alcohol. These differences were statistically significant for
• banking/financial, where the average difference was 0.50 on the 5-point scale, and 87% of faculty/staff had ratings of 4 or 5 while 71% of students had ratings of 4 or 5;
• groceries, where the average difference was 0.50 on the 5-point scale, and 75% of faculty/staff had ratings of 4 or 5 while 58% of students had ratings of 4 or 5;
• entertainment, where the average difference was 0.50 on the 5-point scale, and 65% of faculty/staff had ratings of 4 or 5 while 47% of students had ratings of 4 or 5.
Table 5. Distribution of Satisfaction Ratings for Downtown Visits, Overall and by Group
Rate your level of satisfaction with these visits
Total Faculty and Staff Students Average Rating
% rated 4
% rated 5
Average Rating
% rated 4
% rated 5
Average Rating
% rated 4
% rated 5
Shopping 3.39 28.2% 20.8% 3.52 29.1% 25.4% 3.35 27.9% 19.6% Banking/financial 4.05 33.6% 41.8% 4.42* 29.4% 57.3% 3.90 35.2% 35.8% Post Office 4.04 34.7% 39.7% 4.16 27.1% 48.8% 4.00 37.4% 36.6% Purchase Groceries 3.60 32.1% 28.4% 4.01* 25.0% 50.0% 3.52 33.4% 24.4% Dining 4.00 42.5% 32.1% 4.08 36.9% 39.7% 3.98 43.9% 30.2% Entertainment 3.33 31.9% 18.1% 3.74* 33.8% 30.9% 3.26 31.5% 15.7% Personal services 3.68 33.8% 29.0% 3.77 32.1% 35.7% 3.66 34.1% 27.8% Drinking Alcohol 3.84 40.0% 27.8% 3.72 30.3% 31.6% 3.86 41.6% 27.2% Average ratings on a 5-point scale from low = 1 to high = 5. Average ratings and percentages reflect responses from eligible participants. * Indicates statistically higher average rating

13
Features That Influenced Downtown Visits Community Study A study of the Menomonie community’s opinions of downtown was conducted in spring 2006 by a group of Chippewa Valley Technical College students. The students conducted phone surveys of 65 Menomonie community members. As part of this survey, participants were asked to specify downtown’s strengths and weaknesses. The primary specific strengths mentioned were convenience, historical/cultural/traditional, and beautiful/attractive/lake view. The three primary specific weaknesses mentioned were parking, lack of variety, and lack of hours. Participants were also asked for additional comments, and the most common theme was that downtown needed better parking. Results from this study were used to inform categories for the UW-Stout survey. UW-Stout: reasons visit downtown Participants were provided a list of downtown features, and asked to choose and rank their top three reasons for visiting downtown. This list along with a summary of the results is displayed in Table 6. Similar to the community study result, convenient to campus was chosen most frequently as the number one rating (553 number 1 ratings). Figure C shows that convenient to campus was also most frequently selected in the top 3 (896 total choices). Easy to walk around had the second highest total number of selections (556), and had 130 number 1 choices. Four additional features – small town atmosphere, friendly service, unique shops, and variety of goods/services – had 250 or more total top 3 choices and over were chosen over 50 times as number one. Downtown atmosphere (small town atmosphere, friendly service, I feel known) accounted for 755 total or 23% of all top 3 choices. Features that were infrequently chosen included easy to park with 7 number 1 ratings and 53 total choices, and Lake Menomin with 18 number 1 ratings and 60 total choices. Figure C. Frequency of Choices for Top Three Reasons Visit Downtown, All Responses
5360
869091
112116
265296302
363556
896
0 100 200 300 400 500 600 700 800 900 1000
Easy to parkLake Menomin
Easy to use bicycleI feel known
Streets and sidewalks look cleanHistoric buildings
Good valueVariety of goods/services
Unique shopsFriendly service
Small town atmosphereEasy to walk around
Convenient to campus
Total Number of Times Chosen in Top 3
The only statistical difference between faculty/staff and student distribution of rankings was for small town atmosphere, where 9% more students ranked this as number 1 and 7% more students

14
ranked this as number 2 compared to faculty/staff. Statistical testing could not be performed on categories that had very few faculty/staff choices – easy to park, Lake Menomin, easy to use bicycle. UW-Stout: reasons do not visit downtown Participants were provided a list of downtown features, and asked to choose and rank their top three reasons for not visiting downtown. This list along with a summary of the results is displayed in Table 7. Figure D and Table 7 shows that the feature with the most overall top 3 choices was they don’t have what I need, with 269 number 1 choices and 689 total top 3 choices. Other features chosen in the top 3 for 450 or more times were the lake smells bad and lack of parking. Lack of parking was chosen as number one 242 times, and the lake smells bad was chosen as number one 228 times. Lack of variety had over 400 total top 3 choices, primarily as the number 2 and number 3 ranks. The community study also cited parking and lack of variety as downtown weaknesses. Overall, the lack of product availability accounted for 1,101 or 32% of total top 3 choices. Overall, the physical appearance of downtown accounted for 215 or 6% of total top 3 choices. Features chosen in the top 3 less than 100 times included streets and sidewalks look dirty, not easy to use bicycle, inside of buildings look dirty, I don’t feel welcome, and I don’t feel safe. Figure D. Frequency of Choices for Top Three Reasons Do Not Visit Downtown, All Responses
7
22
33
62
78
104
118
148
169
184
211
232
412
488
507
689
0 100 200 300 400 500 600 700 800
I don't feel safe
I don’t feel welcome
Inside of buildings look dirty
Not easy to use bicycle
Streets and sidewalks look dirty
Buildings look old or outdated
Lack of public transportation
Products/services not a good …
Too much traffic
I live out of town
Hours of operation are too …
I don’t know what is available
Lack of variety
Lack of parking
The lake smells bad
They don’t have what I need
Total Number of Times Chosen in Top 3
The only statistical difference between faculty/staff and student distribution of rankings was for lack of parking, where 60% of faculty/staff chose this as number 1 compared to 47% of students. Statistical testing could not be performed on categories that had very few faculty/staff choices – hours of operation are too limited, lack of public transportation, streets and sidewalks look dirty, inside of buildings look dirty, I don’t feel welcome, and I don’t feel safe.

15
Table 6. Frequency of Responses to Please select your top three reasons for visiting downtown Menomonie, All Responses And By Group
Please select your top three reasons for visiting downtown
Menomonie
Total Faculty and Staff Students
Total # Times Chosen
as #1
# Times Chosen
as #2
# Times Chosen
as #3
# Times Chosen
as #1
# Times Chosen
as #2
# Times Chosen
as #3
# Times Chosen
as #1
# Times Chosen
as #2
# Times Chosen
as #3 Convenient to campus 553 212 131 131 45 20 422 167 111 896Easy to walk around 130 253 173 21 39 29 109 214 144 556Small town atmosphere 92 124 147 12 19 36 80 105 111 363Friendly service 62 110 130 13 38 33 49 72 97 302Unique shops 88 105 103 21 21 23 67 84 80 296Variety of goods and services offered 65 106 94 14 16 8 51 90 86 265Historic buildings 28 25 59 7 6 7 21 19 52 112Good value 22 37 57 4 7 10 18 30 47 116Streets and sidewalks look clean 13 29 49 2 4 7 11 25 42 91I feel known 21 39 30 6 15 10 15 24 20 90Easy to use bicycle 27 27 32 4 2 3 23 25 29 86Lake Menomin 18 20 22 3 1 2 15 19 20 60Easy to park 7 19 27 3 7 8 4 12 19 53Other -- Bars 16 3 8 0 0 0 16 3 8 27Other -- Necessary 7 2 4 4 1 5 3 2 3 13Other -- Food/Coffee 4 3 6 1 3 4 4 2 3 13
Total 1153 1114 1072 246 224 205 908 893 872 3339

16
Table 7. Frequency of Responses to Please select your top three reasons for not visiting downtown Menomonie, All Responses And By – Group
Please select your top three reasons for not visiting downtown Menomonie
Total Faculty and Staff Students
Total # Times Chosen
as #1
# Times Chosen
as #2
# Times Chosen
as #3
# Times Chosen
as #1
# Times Chosen
as #2
# Times Chosen
as #3
# Times Chosen
as #1
# Times Chosen
as #2
# Times Chosen
as #3 They don’t have what I need 269 261 159 75 60 34 194 201 125 689 The lake smells bad 228 156 123 36 14 22 192 142 101 507 Lack of parking 242 148 98 63 29 13 179 119 85 488 Lack of variety 101 148 163 23 48 37 78 100 126 412 I don’t know what is available 48 94 90 4 10 14 44 84 76 232 Hours of operation are too limited 54 70 87 3 2 1 51 68 86 211 I live out of town 114 39 31 44 19 10 70 20 21 184 Too much traffic 41 59 69 8 16 14 33 43 55 169 Products and services offered are not a good value 27 55 66 4 16 15 23 39 51 148 Lack of public transportation 35 36 47 1 3 7 34 33 40 118 Buildings look old or outdated 24 35 45 6 6 6 18 29 36 104 Streets and sidewalks look dirty 24 24 30 3 2 6 21 22 24 78 Not easy to use bicycle 15 23 24 11 18 20 4 5 4 62 Inside of buildings look dirty 9 12 12 3 1 1 6 11 11 33 I don’t feel welcome 3 8 11 0 0 0 3 8 11 22 I don't feel safe 2 4 1 0 0 0 2 4 1 7 Other -- No Time 4 3 3 0 2 0 4 1 3 10 Other -- No Money 2 4 6 0 0 0 2 4 6 12 Other --Meters 1 2 2 0 0 0 1 2 2 5
Total 1243 1181 1067 284 246 200 959 935 864 3491

17
Suggestions for Change Businesses to Add to Downtown: Rating Scale Results The 2006 Community Survey also asked Menomonie community members what businesses they would add to downtown. A summary of the results is in Table 8. The options chosen by over half of the participants were hardware store and a new clothing store. A version of this question was also asked on the UW-Stout survey. Results are summarized in Table 9. Average ratings ranged from 3.27 to 3.87 on the 6 point scale, where 1 indicated that it would not be important to have this type of store in downtown, and 6 indicated that it would be extremely important. The retail opportunities with ratings above 3.5 included convenience store and new clothing store. Note that in the Community Survey, convenience store was the least frequent choice. Figure E shows the average ratings by faculty/staff and students. Students had statistically higher ratings on all retail opportunities. The largest difference occurred for video rental store, where students had a 1 point higher average rating on the 6-point scale. Figure E. Average Ratings for Importance of Retail Opportunities by Group
3.3 3.5 3.32.8 2.7 2.4
4.0* 3.9*3.5* 3.6* 3.5* 3.5*
1
2
3
4
5
6
Conveniencestore
New clothingstore
Hardware store
Electronicsstore
Music store Video rentalstore
FACULTY/STAFF STUDENT * statistically higher average rating
Table 8. Frequency of Responses to Similar Question from 2006 CVTC Community Survey. From the following choices, if you had to improve upon downtown Menomonie in anyway which would you choose (choose all that apply)
Store Type Number of
Times Chosen
% of Respondents Who Chose
Option Convenience store 17 26% New clothing store 46 71% Hardware store 37 57% Electronics store 20 31% Music store 26 40% Video rental store 18 28%
Table 9. Distribution of Responses to How important would it be to have the following retail opportunities in downtown Menomonie? All Responses
Store Type Average Rating
% chose Very Important
% chose Extremely Important
Convenience store 3.87 27.2% 11.5% New clothing store 3.77 19.6% 11.6%
Hardware store 3.48 14.7% 6.0% Electronics store 3.43 14.3% 5.4% Music store 3.32 13.2% 6.5% Video rental store 3.27 16.3% 4.8% Rating scale: 1=not at all important to 6=extremely important

18
Businesses to Add to Downtown: Participant Short Answer Results UW-Stout survey participants were asked to list up to three specific types of retail, three specific types of services, and three specific types of improvements they would like to see in downtown. Participants responded by entering their responses across all three questions – i.e. there were retail responses in the retail, services and improvement questions. Therefore, responses were read and coded into common themes across all nine suggestions for change. A total of 1,006 participants entered at least one suggestion, and of these 27% entered suggestions into all 9 response options; the average number of suggestions was 6. Responses that did not fit any of these three types of changes were coded as not applicable, and were not included in the analysis that follows. Responses from these three questions were carried through to the next question that asked participants to choose three items that UW-Stout could help with. For purposes of analysis, the themed responses were carried through and are reported in the tables that follow. The original responses are available upon request.
Retail opportunities for downtown. UW-Stout survey participants were asked Please list up to three specific types of retail opportunities you would like to see in downtown Menomonie. The responses were read and coded into common themes. The category names, definitions, and a summary of the number of responses are listed in Table 10. There were 28 types of retail businesses mentioned, and a small group of participants that said no new retail was needed for a total of 3,237 comments. Similar to the rating scale results, clothing stores were mentioned most frequently, with 16% of all retail comments. Food was a frequently mentioned opportunity; fast food, sit down restaurant, and specialty foods together accounted for 672 or 21% of the all retail comments. A grocery store was mentioned 244 times, or 9% of the total retail comments. Although convenience store was the highest rated option for new business in Table 9, it had 3% of all retail comments. Of note was that over three-quarters of the discount department store comments referred to Target (83 comments). Table 10. Frequency of Response to Please list up to three specific types of retail opportunities you would like to see in downtown Menomonie by Category
Retail Category Category Definition Number of Comments
% of Total
Clothing* References to clothing store, boutique, specific clothing stores 503 15.5%
Food Fast food; general “food” or “dining”; café; specific fast food establishments 298 9.2%
Grocery Grocery store 244 7.5% Sit down/restaurant
Restaurant; diner; fine dining; specific restaurant establishments 226 7.0%
Video* Video rental, movie rental, game rental 170 5.3%

19
Retail Category Category Definition Number of Comments
% of Total
Specialty Foods Bakery; Panera, bagels; ice cream shop; deli; coffee shop; specific specialty food establishments
148 4.6%
Hardware/paint store*
Hardware store; paint store; Fleet Farm; Menards 137 4.2%
Electronics* Electronics, computers, cell phone, Best Buy, Radio Shack 132 4.1%
Music* Music store; musical instrument store; place to buy CDs 125 3.9%
Specialty shop Gift shop; card shop; specialty shops; jewelry; accessories 124 3.8%
Movies Movies; movie theater 124 3.8%
Sporting goods Place to purchase sporting goods; hunting equipment, outdoors supplies, skate shop; snowboard shop, etc
115 3.6%
Discount department store Discount store, Target, Wal-Mart 105 3.2%
Entertainment Under-age venues; dance club; arcade; live bands; pool hall; entertainment 104 3.2%
Convenience store* Convenience store; Kwik Trip 99 3.1%
Shoes Shoe store 80 2.5%
Crafts/fabric Hancock fabrics; apparel fabric; scrapbooking; hobby 74 2.3%
Department store Department store; Kohl’s; Penny’s; home décor and furniture 69 2.1%
Bookstore Includes references to new and used books; Borders 65 2.0%
Thrift store Goodwill; vintage clothing; pawn shop 58 1.8%
Art/Office supplies
Place to purchase art supplies, school supplies, office-type supplies; also includes comments about UPS store
50 1.5%
Bar More bars 41 1.3% Dollar/variety Store Dollar store, Ben Franklin 34 1.1%
Pharmacy Pharmacy 27 0.8% Quality printing Place to do quality printing 25 0.8% Local crafts/food Venue for local products 20 0.6% Mall Put in a mall 17 0.5% Photo development Photo development store 14 0.4%
No retail needed Does not need any more/new retail 9 0.3% Total 3237 100.0% * Indicates item was included on the rating scale question in Table 9 and Figure E.

20
Services for downtown. UW-Stout survey participants were asked Please list up to three specific types of services you would like to see in downtown Menomonie. The responses were read and coded into common themes. The category names, definitions, and a summary of the number of responses are listed in Table 11. There were 10 services categories, a group of participants that indicated no services were needed, and a group of service related responses that were too dissimilar to create themed categories for a total of 641 comments. The services categories with more than 10% of all service comments were personal services (tanning, haircut, etc), transportation, and repair services. Table 11. Frequency of Response to Please list up to three specific types of services you would like to see in downtown Menomonie by Category
Services Category Category Definition Number of Comments
% of Total
Personal services Tanning, haircut, nails, massage; pet grooming; valet; spa 133 20.7%
Transportation Drunk bus; city bus; taxi service 115 17.9%
Repair services Repairs for bikes, shoes, computers, autos; also includes comments on car wash 88 13.7%
Laundry Laundry; dry cleaning; seamstress; tailor 42 6.6%
Medical Health, dental, chiropractor, orthodontics; psychological; eye glasses 38 5.9%
Recreation Indoor pool; lake activities 30 4.7% Fitness Fitness; exercise; yoga; Pilates 29 4.5% Financial Banking/taxes/loan/real estate 28 4.4%
Culture References to museum, art gallery, more or diverse culture 26 4.1%
No services needed No services needed; none 18 2.8% Lessons/classes Lessons, tutoring 13 2.0%
Other - Services Services that were too dissimilar to theme: hotel; library; housing; better customer service 81 12.6%
Total 641 100.0%
Improvements for downtown. UW-Stout survey participants were asked Please list up to three specific how downtown Menomonie could be improved. The responses were read and coded into common themes. The category names, definitions, and a summary of the number of responses are listed in Table 12. There were 15 improvement categories, a group of participants that indicated no improvements were needed, and a group of improvement related responses that were too dissimilar to create themed categories for a total of 1,839 comments. The most frequently mentioned area for improvement was parking, with 21% of all improvement comments. Some of the parking related issues that participants mentioned were more parking, free overnight parking, and fewer parking meters. Participants also indicated that they would like more stores (12% of all improvement comments), to clean up Lake Menomin (11% of all improvement comments), and for downtown to be cleaner. When all of the physical improvements are combined – cleaner downtown, updated

21
buildings, outside atmosphere, fix the sidewalks and streets – they total to 497 comments or 27% of all the improvement comments. Table 12. Frequency of Response to Please list up to three specific examples of how downtown Menomonie could be improved by Category
Improvements Category Category Definition Number of Comments
% of Total
Parking More parking; free parking; overnight parking; less meters 388 21.1%
More stores More stores; fill vacant stores ;fix up old theatre; fix up old grocery store; more unique stores; more variety
220 12.0%
Clean lake Clean up Lake Menomin 194 10.5% Cleaner Cleaner; clean streets; clean sidewalks 183 10.0% Update buildings Update buildings exteriors and/or interiors 143 7.8%
Outside atmosphere Lighting/street décor/music; modernize; keep old town feel; parks; green space 129 7.0%
Advertising More marketing; promotions; discounts for Stout & students; coupons; store fronts; store signs/signage
84 4.6%
Walk/bike friendly Bike lane, bike path, bike racks, walkways, overpass, crosswalks 69 3.8%
Traffic Too much traffic 61 3.3%
More hours Have stores and services be open longer hours and more consistent hours 55 3.0%
Cater stores/services to college
Have more stores and services that cater to college students 47 2.6%
Street/Sidewalk repair Fix the streets and/or sidewalks 42 2.3% More community events Festivals; parades; block parties; street dances 42 2.3% Fewer bars Fewer bars 36 2.0% Lower prices Lower prices, less expensive 31 1.7% No improvements needed
No improvements needed; none; like it the way it is 10 0.5%
Other - Improvements Improvements that were too dissimilar or generic to theme: nicer, better, bigger, no smoking, friendly
105 5.7%
Total 1839 100.0%
Three suggestions UW-Stout could help with. Participants were asked to choose up to three of the nine previous suggestions that they would like to see the UW-Stout Community be involved with. 932 participants responded (739 students and 193 faculty/staff) with at least one choice, and 69% of those who responded selected 3 suggestions. Table 13 contains a summary of the categories chosen. Similar to the findings in Table 10, clothing store was the most frequently chosen option with 15% of all comments. Parking was selected 130 times, for 6% of all options chosen.

22
Other categories with 40 or more responses centered on • shopping totals to 677 comments or 33% of all options chosen • food totals to 227 comments or 11% of all options chosen • physical improvements & lake cleanup total to 170 comments or 8% of all
options chosen
Category Total % of all options
Clothing 310 15.0% Parking 130 6.3% Grocery 85 4.1% Food 85 4.1% More stores 75 3.6% Sit down/restaurant 74 3.6% Specialty Foods 68 3.3% Cleaner 68 3.3% Music 61 3.0% Video 56 2.7% Clean lake 53 2.6% Personal services 51 2.5% Update buildings 49 2.4% Discount dept. store 46 2.2% Electronics 44 2.1% Transportation 43 2.1% NA (responses that could not be coded) 41 2.0%
Repair services 38 1.8% Specialty shop 37 1.8% Crafts/fabric 36 1.7% Movies 36 1.7% Bookstore 35 1.7% Convenience store 31 1.5% Hardware store 30 1.5% Sporting goods 29 1.4% Outside atmosphere 29 1.4% Advertising 27 1.3% Thrift store 25 1.2% Department store 25 1.2% Art/Office supplies 25 1.2% Other - Services 24 1.2% Entertainment 23 1.1% Other Improvements 23 1.1%
Category Total % of all options
Traffic 18 0.9% Walk/bike friendly 18 0.9% More hours 17 0.8% Medical 15 0.7% Laundry 15 0.7% Bar 14 0.7% Cater to college 14 0.7% Shoes 13 0.6% No services needed 12 0.6% Street/Sidewalk repair 12 0.6%
Quality printing 11 0.5% Pharmacy 10 0.5% Dollar/variety Store 9 0.4% Fitness 8 0.4% Lower prices 8 0.4% More community events 8 0.4%
local crafts/food 7 0.3% Mall 6 0.3% Photo development 6 0.3% Financial 6 0.3% No improvements 6 0.3% Fewer bars 5 0.2% Culture 4 0.2% Recreation 4 0.2% No retail needed 3 0.1% Lessons/classes 2 0.1%
Total 2063 100.0%
Table 13. Of these suggestions, which three would you like to see the UW-Stout Community be involved with?

23
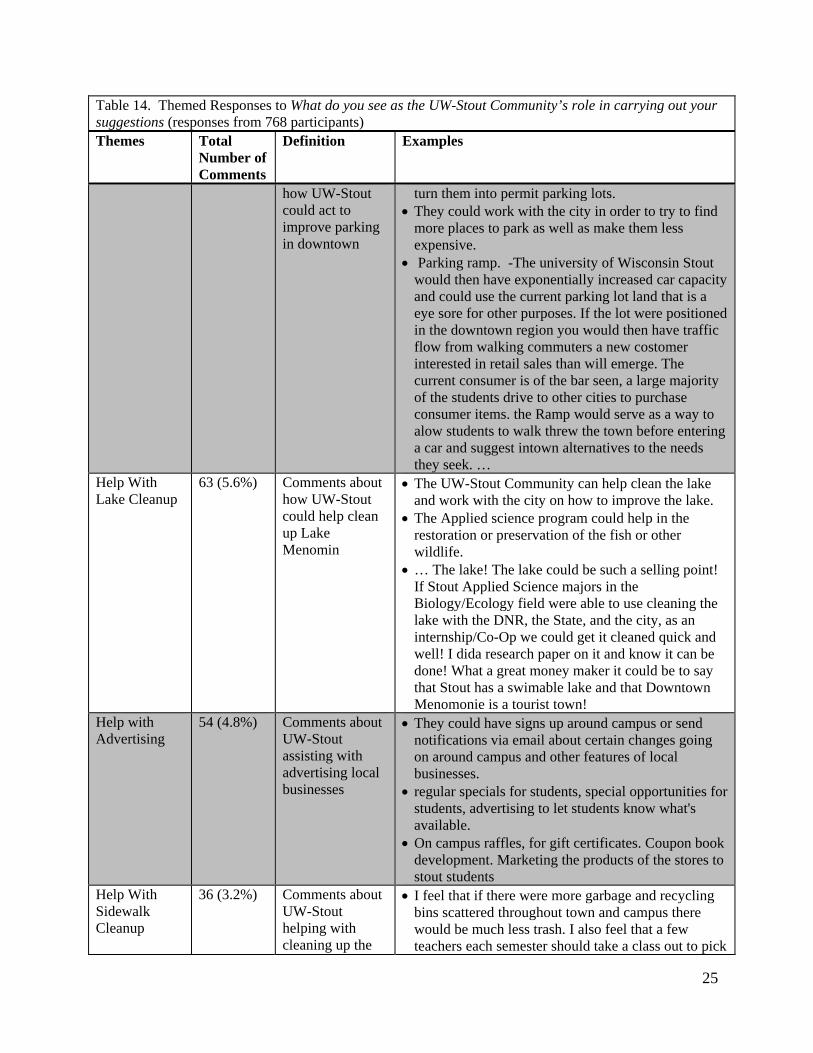
How can UW-Stout help. Regarding these selected suggestions, participants were asked what do you see as the UW-Stout Community’s role in carrying out your suggestions. There were 768 participant responses provided for this question with a total of 1,124 themed comments. Participant responses may have been placed into more than one theme; therefore, the total number of themed comments is more than the total number of responses. The most frequent theme with 183 comments (16% of all comments) involved UW-Stout providing consumer support for downtown. The second most frequent theme with 169 responses (15% of all comments) was general suggestions that UW-Stout could collaborate with downtown Menomonie to effect change. Suggestions for collaboration included class projects, volunteer efforts, capstone projects, and taking advantage of UW-Stout’s knowledge/expertise. Other themes with 10% or more of the total comments included UW-Stout acting in the role of advising, advocating, and lobbying for improvements in downtown. An additional 10% of the comments regarded actions for improvement that were not related to UW-Stout. Specific areas mentioned for UW-Stout to assist in improving downtown Menomonie included
• Create and run student led businesses (84 comments, or 7.5%); • Parking (66 comments, or 5.9%); • Lake Menomin clean up (63 comments, 5.6%); • Advertising (54 comments, 4.8%); • Cleaning up downtown (36 comments, 3.2%); • Fund raising (28 comments, 2.5%); • Fix up/repair buildings (24 comments, 2.1%).
(See Table 14 for a complete listing of themes; comments are listed verbatim and uncorrected. All verbatim comments are listed in Appendix B). Table 14. Themed Responses to What do you see as the UW-Stout Community’s role in carrying out your suggestions (responses from 768 participants) Themes Total
Number of Comments
Definition Examples
Consumer Support
183 (16.3%)
Comments about UW-Stout supporting the downtown businesses as consumers
• UW-Stout's community would have to be dedicated to using these resources enough to keep them afloat. I truly believe that this would happen with the suggestions made
• uw-stout community should spend $ at these places and make them profitable
• It would be great to have a nice clothing store close to campus especially if they do not have a car. Menomonie also does have very limited selection on shopping for clothes.
Collaborate - General
169 (15.0%)
Comments about general collaboration between UW-Stout, small businesses and the township of
• They can all be incorporated into clubs on campus. Art students could repaint the mural in giving back to the community, the dance club could be utilized by on campus organizations such as Housing Events Committees (HEC) etc. and the movie theater can be utilized by BlueDevil Productions (BDP).
• Volunteer groups could be created or use

24
Table 14. Themed Responses to What do you see as the UW-Stout Community’s role in carrying out your suggestions (responses from 768 participants) Themes Total
Number of Comments
Definition Examples
Menomonie organizations already on campus to help put these into action. Make it a program they can do.
• Using the knowledge of the students to find solutions to the problems. It will help have fresh ideas as well as provide experience for students.
Advise / Lobby / Advocate
114 (10.1%)
Comments about UW-Stout advising and advocating for the improvement of downtown Menomonie
• UW-Stout should be very supportive in trying to improve downtown Menomonie by listening to people's suggestions and making changes
• The UW-Stout Community can make it known what it is they, as a market, look for from the stores they choose to shop at.
• Showing support for stores that UW-Stout Students would be interested in.
Not Related To Stout Actions
110 (9.8%) Comments about actions for downtown Menomonie that do not involve UW-Stout
• [transportation] some solution that has a regular schedule and connects all of Menomonie from north to south and services most of Broadway and Main
• … there is no where to park for free or leave a car overnight
• …more parking-so its more convienent and less stressful for people to come downtown...
UW-Stout Applied Business
84 (7.5%) Comments about creating a business in downtown Menomonie run and operated by UW-Stout or UW-Stout students.
• A student class could run a downtown store - retail management. By doing so they could make use of some empty buildings, ex. the state theater. This store could be similar to that of the niche in the home economics building. Also, an organization or several could be involved with local bars in offering a community street dance. This could be a once a year event to raise money for organizations or local charities.
• You could have management students help run a building, and say how much we could use it. Could get other ideas from stout students to say what could go in that abandoned building. And take some of the cooking kids and have a class to run a bakery with donuts and breads. We really need one around.
• There are a lot of fashion majors at stout. they could bring the niche to downtown
Student Employment
68 (6.0%) Comments about providing employment for students in downtown Menomonie
• … employ stout students • … Students could be employed at the visitors center
as well as helping to preserve the historic buildings • They could work there as employees. It would be a
close job that they wouldn't need a car to get to. College students always need money!
Parking 66 (5.9%) Comments about • UW-Stout's role is to purchase more empty lots and
25
Table 14. Themed Responses to What do you see as the UW-Stout Community’s role in carrying out your suggestions (responses from 768 participants) Themes Total
Number of Comments
Definition Examples
how UW-Stout could act to improve parking in downtown
turn them into permit parking lots. • They could work with the city in order to try to find
more places to park as well as make them less expensive.
• Parking ramp. -The university of Wisconsin Stout would then have exponentially increased car capacity and could use the current parking lot land that is a eye sore for other purposes. If the lot were positioned in the downtown region you would then have traffic flow from walking commuters a new costomer interested in retail sales than will emerge. The current consumer is of the bar seen, a large majority of the students drive to other cities to purchase consumer items. the Ramp would serve as a way to alow students to walk threw the town before entering a car and suggest intown alternatives to the needs they seek. …
Help With Lake Cleanup
63 (5.6%) Comments about how UW-Stout could help clean up Lake Menomin
• The UW-Stout Community can help clean the lake and work with the city on how to improve the lake.
• The Applied science program could help in the restoration or preservation of the fish or other wildlife.
• … The lake! The lake could be such a selling point! If Stout Applied Science majors in the Biology/Ecology field were able to use cleaning the lake with the DNR, the State, and the city, as an internship/Co-Op we could get it cleaned quick and well! I dida research paper on it and know it can be done! What a great money maker it could be to say that Stout has a swimable lake and that Downtown Menomonie is a tourist town!
Help with Advertising
54 (4.8%) Comments about UW-Stout assisting with advertising local businesses
• They could have signs up around campus or send notifications via email about certain changes going on around campus and other features of local businesses.
• regular specials for students, special opportunities for students, advertising to let students know what's available.
• On campus raffles, for gift certificates. Coupon book development. Marketing the products of the stores to stout students
Help With Sidewalk Cleanup
36 (3.2%) Comments about UW-Stout helping with cleaning up the
• I feel that if there were more garbage and recycling bins scattered throughout town and campus there would be much less trash. I also feel that a few teachers each semester should take a class out to pick

26
Table 14. Themed Responses to What do you see as the UW-Stout Community’s role in carrying out your suggestions (responses from 768 participants) Themes Total
Number of Comments
Definition Examples
sidewalks in downtown Menomonie
up trash for extra credit. • Clean Streets: UW-Stout could encourage student
organizations to form volunteer clean-up groups fter weekends and special downtown events. Stout could offer incentives such as coupons or prizes for participation.
• Have volunteers or clubs help clean up the streets everyday (alternating groups with different days/weeks etc. depending on how many get involved)
Stout Should Do Nothing
32 (2.8%) Comments about UW-Stout not being responsible for the improvement of downtown Menomonie
• I do not believe UW-Stout has a role but any business will have success if they decided to partner or get input from the students or staff.
• I don't see any role. We have issues with our own campus that need to be addressed, that we don't need to be sticking our fingers in other areas.
• I think that it is not a large role of the UW-Stout Community, but rather the city of Menomonie to clean up the lake and make it decent to be around in the fall.
Not Sure 30 (2.7%) Comments about respondents being unsure as to what would improve downtown Menomonie
• I'm not sure what we can do but I'm sure there could be a volunteer group that would work the city to help clean the lake.
• I am unsure of what would all be involved with a process such as this
• Actually I'm not sure how the Stout Community would be involved... other than people actively getting involved with the people who may be able to do something, government agencies, city council and the like.
Help With or Do Fund Raising
28 (2.5%) Comments about UW-Stout helping raise and allocated funds for the improvement of downtown Menomonie
• To raise awareness and funding. • Start organizations that raise money to support these
issues. Gather volunteers to help with the process. • More funding, donation of land for parking purposes,
advertising
Fix / Update Storefronts
24 (2.1%) Comments about UW-Stout collaborating to update and improve the storefronts in downtown
• Stout could help in the restoration process of the more run down buildings.
• Involve Stout students and faculty in developing plans for building renovation and attracting businesses (i.e., marketing, construction, business expansion etc).

27
Table 14. Themed Responses to What do you see as the UW-Stout Community’s role in carrying out your suggestions (responses from 768 participants) Themes Total
Number of Comments
Definition Examples
Menomonie • We are a design school- design students could get involved in coming up with new looks.design for stores
Other 63 (5.6%) Other comments about how UW-Stout could help to improve downtown Menomonie
• I understand it is a college town, but it appears the act of drinking is actually condoned. I would rather see some sort of ban on it than have so many people drinking on a regular basis, aside from being unhealthy it is disruptive to those that do not drink.
• Students could use the buses, and they could be used at night to prevent drunk driving.
• smoking ban on campus could maybe help expedite a Menomonie-wide smoking ban
Participants were asked What other comments do you have about downtown Menomonie? There were 516 participant responses provided for this question with a total of 718 themed comments. Participants’ responses may have contributed to more than one theme; therefore, the total number of themed comments provided is more than the total number of responses. The most frequent theme with 132 responses (18.4% of all themed comments) involved comments about how respondents like the way Menomonie downtown already is. Themes with 10% or more of total comments include liking Menomonie downtown but felt it still needs improvement (77 comments), and in general having more stores (75 responses). Summarizing across all the themes,
• Structural changes – making physical improvements and improving parking – accounted for 17% or all comments;
• Having more stores – general and student-centered – accounted for 14% of all comments.
(See Table 15 for a complete listing of themes; comments are listed verbatim and uncorrected. All verbatim comments are listed in Appendix C). Table 15. Themed responses to What other comments do you have about downtown Menomonie? (comments from 516 participants)
Themes
Total themed comments (%)
Definition
Examples
I Like Menomonie The Way It Is
132 (18.4%)
Comments about how respondents like the way Menomonie downtown already is
• I think the downtown "girls night out", community cookout, MGT Oktoberfest and Winter Daze parade are great events to draw people downtown.
• Downtown Menomonie is set up wonderfully already and offers a great array of stores and services to the

28
Table 15. Themed responses to What other comments do you have about downtown Menomonie? (comments from 516 participants)
Themes
Total themed comments (%)
Definition
Examples
students of this university as well as the citizens of this town.
• I think it is cute and quaint and needs to continue to have a small-town feel.
I Like Menomonie But…
77 (10.7%)
Comments about liking the Menomonie downtown but feel it still needs improvements
• Downtown is great, but I wish there were more clothing options in Menomonie. The movie theater is a MUST!!!!
• I find it quite pretty. But it needs to make the theatre more known, because I know many people who still don't know what it is.
• I think Menomonie is a quaint town. i would love to see more places to chill, a bookstore, coffee bars. where people can gather for cheap but to stay a while.
More Stores-General
75 (10.4%)
Comments about getting more store stores for the general public
• I grew up in Menomonie, so my views might be different. The stores need to be tailored more to everyone, not just specific groups of people.
• It would be nice if it was bigger and had more variety, but I do think it is a very pretty area.
• Nice city, maybe more restaurants, and legitimate business. Such as quiznos, or taco bell, that look kind of cool. And then have insurance companies move in and law firms set up shop in the down town.
Physical Improvement 70 (9.7%)
Comments about physically improving the sidewalks, buildings and other infrastructure in downtown Menomonie
• Downtown Menomonie is great, but not very attractive, it kind of looks run down, and extremely old, as opposed to historical
• I think that it is very run down from the outside and it makes window shopping or just stopping in random stores very unappealing.
• I love the area, but would like to see it get revitalized.
Parking 52 (7.2%)
Comments about parking in downtown Menomonie
• It is generally a friendly place but traffic and parking make it undesirable at times.
• One of the biggest problems with just going downtown is the parking. There are usually very few places to park to make it convenient to stop in at some of the shops/businesses.
• the metered parking is the biggest deterrent to my shopping downtown.
Clean the Lake 43 (6.0%)
Comments about the need to clean Lake Menomin
• the smell from the lake is probably the biggest problem, because no one wants to be outside when wind is blowing off the lake
• the lake does smell bad at times and is an

29
Table 15. Themed responses to What other comments do you have about downtown Menomonie? (comments from 516 participants)
Themes
Total themed comments (%)
Definition
Examples
embarrassment for the community • Overall, a very nice downtown, the main problem that
overshadows the rest is the smell of the lake.
Improve Atmosphere 37 (5.2%)
Comments about improving downtown Menomonie’s atmosphere
• It seems very touristy and more for the elderly community.... I don't know how you can change that so you can attract both types of ppl
• People go to where they see other people...need to make people visible downtown so it looks vibrant
• Revive it!!! Make it more friendly to college students, make us want to come there. Put on small venue concerts, add more coffeehouses, make it more lounge friendly and convenient.
Vacant Buildings; Empty Super Market
32 (4.5%)
Comments about the vacant buildings in downtown Menomonie
• Downtown Menomonie has much potential. The vacant storefronts detract from the businesses that are open.
• For the most part I like it. It feels historic and safe and beautiful. there are a few buildings that are eyesores (abandoned grocery store?). If those few ugly spots are cleaned up it will be thoroughly lovely.
• I would use it more but there are alot of stores that are not attracting people and empty store fronts are not good.
More Activities 28 (3.9%)
Comments about getting more activities in downtown Menomonie
• Downtown menomonie is a nice place to be when there are things going on. Possibly having events would make people more likely to attend downtown than they do right now.
• more variety of things to see and do. • Not enough entertainment around for students under 21.
More Stores-Student Centered
26 (3.6%)
Comments about getting more stores centered toward the student population in Menomonie
• It would be nice to have stores and services that apply more to students.
• Most of the stores are old and places where college students would not typically go to. Stout has 9000 students now, how about we have some updated place where we can go and hang out, which doesn't have to mean a bar. What about a club or dance hall, moe bowling allies, etc.
• The stores are kind of lame. College students don't care for the shops much.
Has A Lot Of Potential 25 (3.5%)
Comments about downtown Menomonie’s potential to improve
• It has a lot of potential. … • I believe it is a growing community and has a lot of
room to grow and expand • Downtown Menomonie has much potential. …
Traffic 20 (2.8%) Comments about • There is lots of congestion in the flow of traffic.

30
Table 15. Themed responses to What other comments do you have about downtown Menomonie? (comments from 516 participants)
Themes
Total themed comments (%)
Definition
Examples
the traffic in downtown Menomonie
• Either commit to a downtown or eliminate the downtown. The truck traffic through downtown is dangerous to walkers and people on bikes. Have four-way traffic stops at the lights to allow for all-way pedestrian traffic. Establish bike paths/lanes downtow.
• Too many cars and seems very crowded.
Advertising 16 (2.2%)
Comments about advertising the store and events in downtown Menomonie
• Downtown Menomonie can be a thriving business community by marketing themselves in new ways--both to potential customers, and also to potential new business owners
• I dont know whats up there. Shops need to advertise more and the city needs to help so people know what is in Downtown Menomonie.
• I love the small town feel with antique shops, I just feel that the new stores that come in are not advertised well.
Fewer Bars 11 (1.5%)
Comments about the number of bars in downtown Menomonie
• Clean it up. All that Downtown MenoMOnie has is BARs. It's disgusting. You want to have higher hopes for people to come to stout to make something of them... give us opportunities to do so- rather then only enabling students to drink because that is all o what downtown menomoie offers.
• I like it and have utilized it for 4.5 years now. Maybe not having so many bars would encourage people to use other Menomonie services.
• Its all bars... There's nothing to do, it makes me want to leave Menomonie and never come back.
Don’t Live in Menomonie 9 (1.3%)
Comments about not living in Menomonie
• I am not that familiar because I do not live in Menomonie.
• If I lived in Menomonie, I would probably visit downtown more often.
• It's really a pretty downtown. If I didn't live in Eau Claire, I would hang out there more. As it is, I just want to get home after work.
Other 65 (9.1%) Other comments about downtown Menomonie
• I'd like to see us have public transportation in Menomonie, which could encourage more people to come downtown.
• To me. I feel downtown Menomonie has many useless stores available now.
• I have lived here for 6 years through college and like the smaller town atmosphere but think the maturity level up students could increase with more strict rules/requlations.

31
Influence of Downtown Participants were asked to rate the level of influence that your impression of downtown Menomonie had on your decision to come to UW-Stout. Overall, the average rating was 2.12 on the 5-point scale, where 1 indicated low level of influence and 5 indicated high level of influence. Table 16 displays the frequency of responses – less than 15% of the participants had ratings of 4 or 5. When examined by group, faculty/staff (average of 1.85) had a statistically lower average rating compared to students (average of 2.20). Figure F displays the distribution of responses by group. Figure F. Average Ratings for Level of Influence of Downtown in Decision to Come to UW-Stout by Group
56%
17% 18%
5% 4%
39%
21% 23%
13%
4%
0%
20%
40%
60%
80%
100%
1 (Low) 2 3 4 5 (High)
Faculty/Staff
Student
Table 16. Frequency of Responses for level of influence that your impression of downtown Menomonie had on your decision to come to UW-Stout
Rating Frequency % of Total
1 (Low) 465 43.2% 2 216 20.1% 3 237 22.0% 4 119 11.0%
5 (High) 40 3.7% Total 1077 100%
32
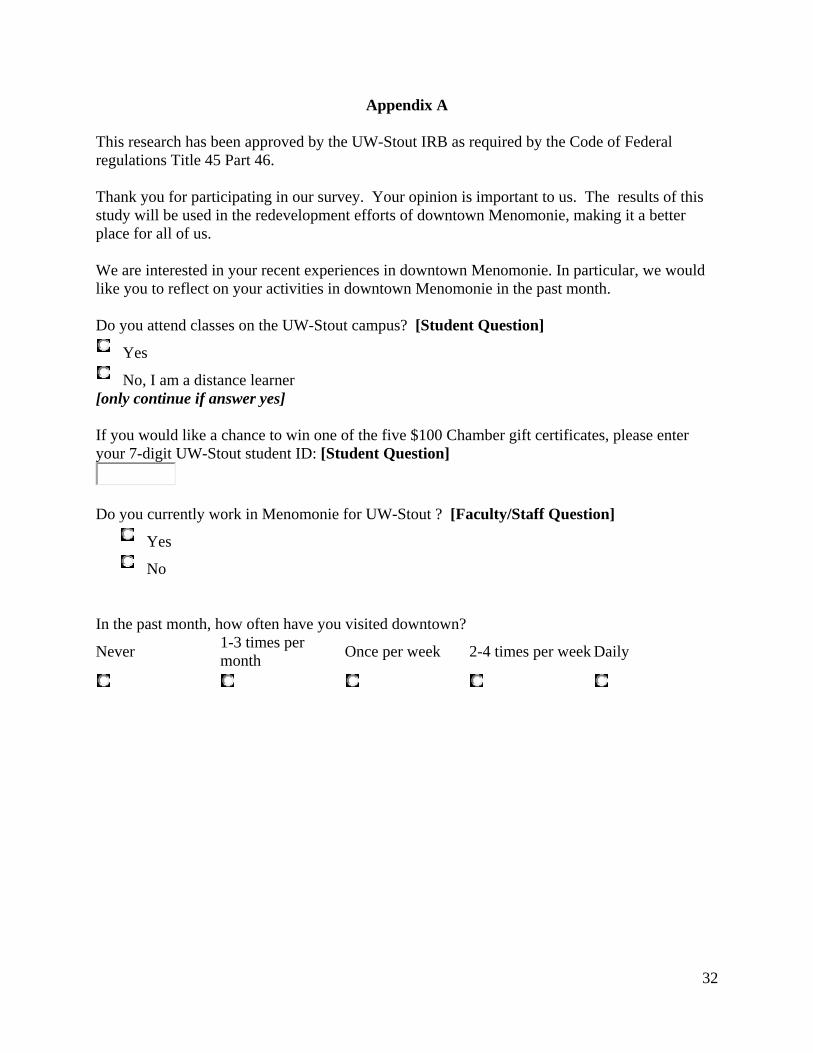
Appendix A This research has been approved by the UW-Stout IRB as required by the Code of Federal regulations Title 45 Part 46. Thank you for participating in our survey. Your opinion is important to us. The results of this study will be used in the redevelopment efforts of downtown Menomonie, making it a better place for all of us. We are interested in your recent experiences in downtown Menomonie. In particular, we would like you to reflect on your activities in downtown Menomonie in the past month. Do you attend classes on the UW-Stout campus? [Student Question]
Yes
No, I am a distance learner [only continue if answer yes] If you would like a chance to win one of the five $100 Chamber gift certificates, please enter your 7-digit UW-Stout student ID: [Student Question]
Do you currently work in Menomonie for UW-Stout ? [Faculty/Staff Question]
Yes
No In the past month, how often have you visited downtown?
Never 1-3 times per month Once per week 2-4 times per week Daily

33
[if indicated visiting at least once, receive the next 3 questions] As you can see in the map, downtown Menomonie is the area bounded on the north by Subway/Fortune Cookie, on the south by Parrot Bay Tanning, on the west by Broadway Street, and on the east by the west side of 9th Street. Please click on the areas in the map below where you have visited downtown Menomonie in the last month. A few businesses are marked on the map for orientation purposes only.
Please indicate how often you participated in each of the following activities in downtown Menomonie in the past month, and rate your overall level of satisfaction with your experiences.
Number of times visited downtown Menomonie in the past month
Rate your overall level of satisfaction with these visits
never 1-3 times in month
once a week
2-4 times per week daily Low
1 2 3 4 High 5 NA
Shopping Banking/financial Post Office Purchase Groceries Dining Entertainment (movies, theater, art exhibits)
Personal services (salons, spas, exercise)
Drinking Alcohol Other, please specify
34
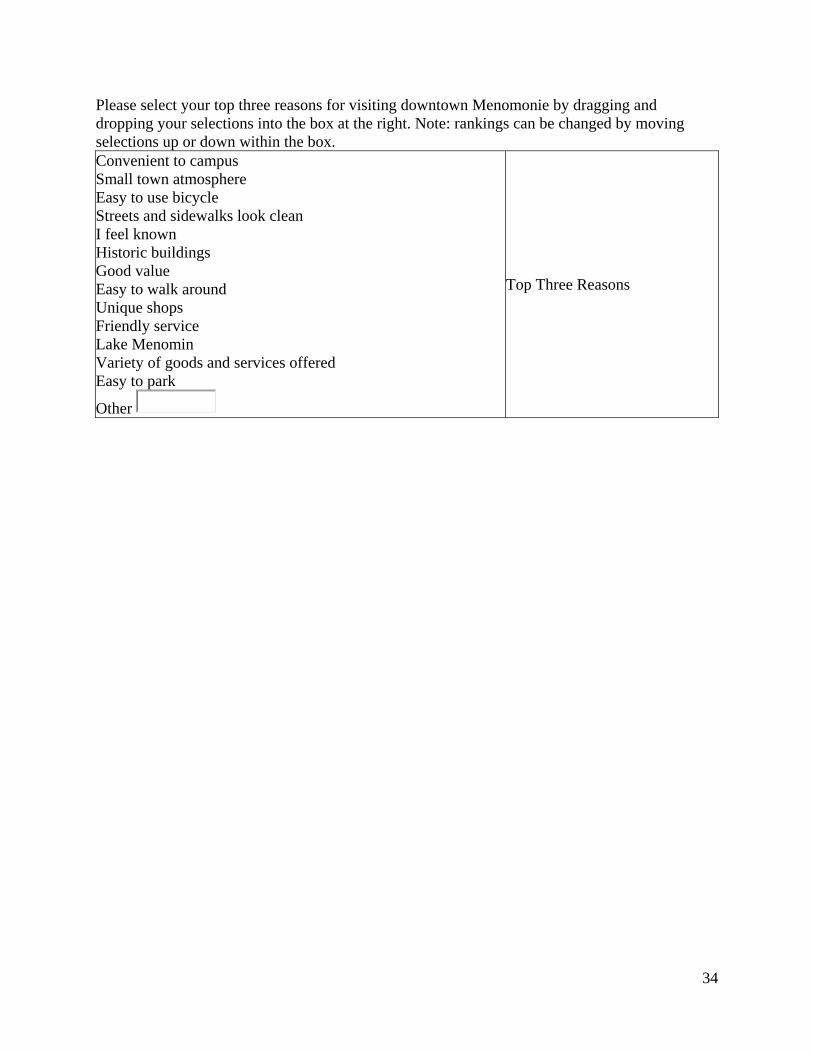
Please select your top three reasons for visiting downtown Menomonie by dragging and dropping your selections into the box at the right. Note: rankings can be changed by moving selections up or down within the box. Convenient to campus Small town atmosphere Easy to use bicycle Streets and sidewalks look clean I feel known Historic buildings Good value Easy to walk around Unique shops Friendly service Lake Menomin Variety of goods and services offered Easy to park
Other
Top Three Reasons

35
[every on campus student received the rest of the survey] Below is a map of downtown Menomonie -- a few businesses are marked on the map for orientation purposes only.
Please select your top three reasons for not visiting downtown Menomonie by dragging and dropping your selections into the box at the right. Note: rankings can be changed by moving selections up or down within the box. Streets and sidewalks look dirty They don’t have what I need Buildings look old or outdated Inside of buildings look dirty Lack of parking I don't feel safe I live out of town I don’t know what is available Products and services offered are not a good value Too much traffic Lack of variety Hours of operation are too limited Not easy to use bicycle The lake smells bad I don’t feel welcome Lack of public transportation
Other
Top Three Reasons

36
How important would it be to have the following retail opportunities in downtown Menomonie?
Not at all Important
Very Unimportant
Somewhat Unimportant
Somewhat Important
Very Important
Extremely Important
New clothing store Electronics store Video rental store Hardware store Convenience store Music store Please list up to three specific types of retail opportunities you would like to see in downtown Menomonie. Choice 1 Choice 2 Choice 3 Please list up to three specific types of services you would like to see in downtown Menomonie. Choice 4 Choice 5 Choice 6 Please list up to three specific examples of how downtown Menomonie could be improved. Choice 7 Choice 8 Choice 9 Of these suggestions, which three would you like to see the UW-Stout Community be involved with?
Choice 1 Choice 4 Choice7
Choice 2 Choice 5 Choice 8
Choice 3 Choice 6 Choice 9 What do you see as the UW-Stout Community’s role in carrying out your suggestions of [listed in three choices selected above]? What other comments do you have about downtown Menomonie? Please rate the level of influence that your impression of downtown Menomonie had on your decision to come to UW-Stout. 1 (Low) 2 3 4 5 (High)

37
Next, please answer a few questions about yourself. What is your gender?
Male
Female
Self-identify What is your racial or ethnic identification?
American Indian or other Native American
Asian, Asian American, or Pacific Islander
Black or African American
White (non-Hispanic)
Mexican or Mexican American
Hispanic or Latino/a
Multiracial
Other
I prefer not to respond [Students] What is your current year in school?
Freshman
Sophomore
Junior
Senior
Graduate Student
Other Do you live on or near campus?
Yes
No
[Faculty/Staff] How many years have you worked at UW-Stout?
Less than 1 year
1-3 years
4-10 years
More than 10 years Do you live in Menomonie?
Yes
No