Embed Size (px)
Citation preview
Dietary Intake and Nutritional Status of University of Wisconsin-Stout Students
Living Off and On the Campus
by
Jacent Kamuntu Asiimwe
A Research Paper Submitted in Partial Fulfillment of the
Requirements for the Master of Science Degree
III
Food and Nutritional Sciences
1ter Credits7L:
Approved: {i'/ ?/---...
c··~?
1/ Esther G. Fa , hD, RD, CFCS Research Advisor
Thesis Committee Members:
Carol Seaborn, PhD, RD, CD, CFCS
~ Yll fiLC!,;rr~ Ann M. Parsons, PhD
The Graduate School
University of Wisconsin-Slout
December, 2008

11
The Graduate School
University of Wisconsin-Stout
Menomonie, WI
Author: Jacent Kamuntu Asiimwe
Title: Dietary Intake and Nutritional Status ofUniversity of Wisconsin-Stout
Students Living Offand On the Campus
Graduate Degree/ Major: Food and Nutritional Sciences
Research Adviser: Esther G. Fahm, PhD, RD, CFCS
MonthlYear: December 2008
Number of Pages: 68
Style Manual Used: American Psychological Association, 5th edition
ABSTRACT
Research shows college students' diets as being largely high in fats, low in fiber and
micronutrients; and this is of concern to nutritional professionals. At UW-Stout, most
students reside off-campus with only freshmen and sophomores being required to live in
residence halls. This study was carried out to examine the dietary intake of the five major
MyPyramid food groups, iron, calorie and fat by students residing on and off the campus
to determine ifthere was a significant difference as well as compare the students' intake
to recommended national standards. Also this study aimed to compare and contrast
students' physical activity levels and their Body Mass Index (BMI) as a factor of weight
status.

11l
Of the 147 participants in this study, one-half resided off-campus and the other
half resided on-campus. They completed a three-day food record (two week days and one
weekend day) of all the foods and beverages consumed and were also required to state
their age, gender, weekly level of physical activity, residence (on/off-campus), body
weight and height.
There was no significant difference in intake for the five food groups for on
campus and off-campus students apart from the meat and beans group where off-campus
students had a lower consumption, Students consumed more grains than recommended
but fell short for the fruit, vegetable and milk food groups. The average daily iron intake
for females was 14.21 mg compared to the recommended 18 mg. However, off-campus
females had a significantly higher intake than on-campus females. Based on BMI values,
most students were within the normal weight range with 8.8% being overweight/obese
and 2.7% underweight. Nearly 41 % of the students were sedentary; 45,6% were
moderately active while 13.6% were physically active.
From these results, it was concluded that living arrangements may influence food
choice and nutrient content of the diet as well as physical activity patterns hencc affecting
dietary intake and nutritional status of college students.

IV
The Graduate SchooI
University of Wisconsin-Stout
Menomonie, WI
Acknowledgments
I would like to thank my father who left no stone unlurned to ensure that 1 got the
best possible education that he could afford. His constant belief in my abilities has been
the driving force in most of my academic achievements and this master's program has
been no exception.
I am also indebted to my research committee chair, Dr. Esther Fahrn, who
willingly agreed to serve as my research advisor. Despite her busy schedule, Dr. Fahrn
always found time to meet with me whenever possible and where not, she always
responded with promptness through electronic mail to all my queries. Her constant
concern about my health and well-being always humbled me.
My sincere thanks also go to my program advisor, Dr. Carol Seaborn, for her
constant help, guidance, and moral support and for agreeing to serve on my research
committee. As a foreign student right out of Africa, my journey to UW-Stout started with
anxicty and fear of the unknown but upon meeting and talking with Dr. Seaborn, almost
all my fears were allayed. Dr. Seaborn was more thanjust an advisor; I believe that 1
speak for most students when 1 say she was also a friend.
I would also like to thank Dr. Ann Parsons for agreeing to serve as my committee
member and for all the help she rendered to me.
My sincere thanks also go out to Susan Green who graciously agreed to run the
necessary statistical analysis for this research. She was always available whenever I

v
needed her and was willing to put in extra time just to make sure that we got all the
statistics right.

VI
TABLE OF CONTENTS
........................................................................Page
Abstract .ii
Research Questions " , 5
Assumptions ofthe Study. , 6
Limitations " 6
Introduction , 8
List of Tables ix
Chapter I: Introduction 1
Problem Statement.. '" 4
Definition ofTerms 6
Chapter II: Review of Literature 8
Body Mass Index 8
Energy Intake 10
Nutrient and Food Group Intakes ofCollege Students 11
Physical Activity. 16
Alcohol Consumption and Health Effects 17
Chapter III: Methodology 19
Introduction , 19
Subject Selection and Description 19
Instrumentation. 21
Data Collection Procedures 21
Data Analysis 22

Vll
Limitations 24
Chapter IV: Results 25
Definition ofSample 25
Figure 1. Age distribution ofsample 26
Food Group Intake 26
Iron Intake 28
Calorie Intake 29
Fat Intake 30
Weight Status (BMI) 30
Physical Activity 31
Alcohol Intake 31
Chapter V: Discussion 33
Food Group and Nutrient Intakes 33
Calorie Consumption 36
Body Mass Index (BMI) 37
Physical Activity 38
Alcohol Consumption 40
Conclusiolls 40
Recommendations 40
Limitations and Inferences for Further Study. 42
References 43
Appendix A: Institutional Review Board Approval 50
Appendix B: Daily Food Record Fornl Instructions 51

Vl1l
Appendix C: Consent to Participate in UW-Stout Approved Research 55
Appendix D: CDC Body Mass Index-for-Age Growth Chart: Girls 2 to 20 years 58
Appendix E: CDC Body Mass Index-for-Age Growth Chart: Boys 2 to 20 years 59

IX
List of Tables
Table I: Mean Food Group Intakes for Off-Campus and On-Campus Subjects 27
Table 2: Mean Daily Intakes from Food Groups for all Subjects vs. Recommended
Intakes _ 28
Table 3: Mean Iron Intakes for Off-Campus and On-Campus Female Subjects 29
Table 4: Mean EMI ofSubjects by Residence , 31
Table 5: MyPyramid Calorie Levels by Gender for Age and Physical Activity Levels 37

Chapter I: Introduction
College students comprise a group whose dietary practices and nutritional status are of
concern to nutrition professionals (Selkowitz, 2000). These concerns are based on research that
characterizes the diets of college students as low in fiber, calcium, iron, vitamin A and
carotenoids. and high in fat (Trockel, l3ames & Egget, 2000).
When students enter college, their dietary habits often deteriorate and they often gain
weight. The weight gain can be related to stress, sedentary lifestyle, and changes in eating
patterns and food intake (Selkowitz, 2000). On the other hand, eating disorders such as anorexia
and bulimia nervosa prevalent among college female students may also lead to undesirable loss
of weight. A study to assess obesity and nutritional status of college students carried out at the
University of Tehran in Iran found that of the 1,150 participants, 12.4% had a body mass index
(BMI) of over 25 and were therefore considered overweight/obese (Nojomi & Najambadi, 2006).
About 18 % of students aged 23 years and older had BMI values over 25 versus the 7.7% of
students aged less than 18 years. Most of those students aged 23 years and over who were obese
in this study tended to live off-campus. The same study found that 10% of the participants had a
BMI of less than 18 and were therefore considered to be underweight. There was also a
significant association between BMI and smoking habits, age, sex, and place of residence. Most
students who resided off the university campus smoked, and were relatively older and tended to
be overweight compared to their campus resident counterparts. Females were more likely to be
overweight compared to males.
Selkowitz (2000) reported that college students also tended to have a low intake of
dietary fiber and high intake of carbohydrates and fats. They also had a low vitamin C status that
was associated with low fruit and vegetable consumption. In terms of minerals, low calcium,

2
zinc, and iron were reported, while the consumption of sodium was much higher than
recommended (Selkowitz, 2000). Hanson and Engs (1992), in their study to assess folic acid
intake by women in a small private college in western North Carolina, found that only 33.3% of
the sample (n= 42) were taking daily multivitamins. They concluded that there was inadequate
folic acid intake in young women between the ages of 18-24 years, and that these young women
frequently have poor nutritional habits.
A study designed to determine the energy expenditure of both male and female college
students found that on average male students expended about 2706 calories per day compared to
the 2373 expended by the females (Li, 1991). Overall, the male students seem to consume more
food than females and therefore have a higher energy intake. Li also stated that males are more
likely to meet their dietary recommendation for meat, poultry, fish, beans, and nut groups
compared to females.
College students tend to face problems of alcohol abuse. Wechsler, Davenport and Baer
(1999) reported that college students consume an average of 1.5 drinks per week. Hanson and
Engs (1992) also reported that about 80% of all college students consume alcohol at least once a
month with males consuming more than females. Twenty percent are heavy drinkers. Alcohol
can compromise one's food intake and thus nutritional status. Alcohol use leads to risks of
developing liver problems and therefore further compromising nutritional and health status
(Trockel, Barnes & Egget, 2000). Engs and Marlene (1995) conducted a study at Indiana
University Bloomington to assess effects of alcohol consumption on the risk of contracting
infectious diseases. They found that students drinking twenty-eight or more alcoholic drinks per
week had significantly more health problems in the aggregate, and those drinking more than
twenty-two drinks per week had more upper respiratory infections compared to the other
3
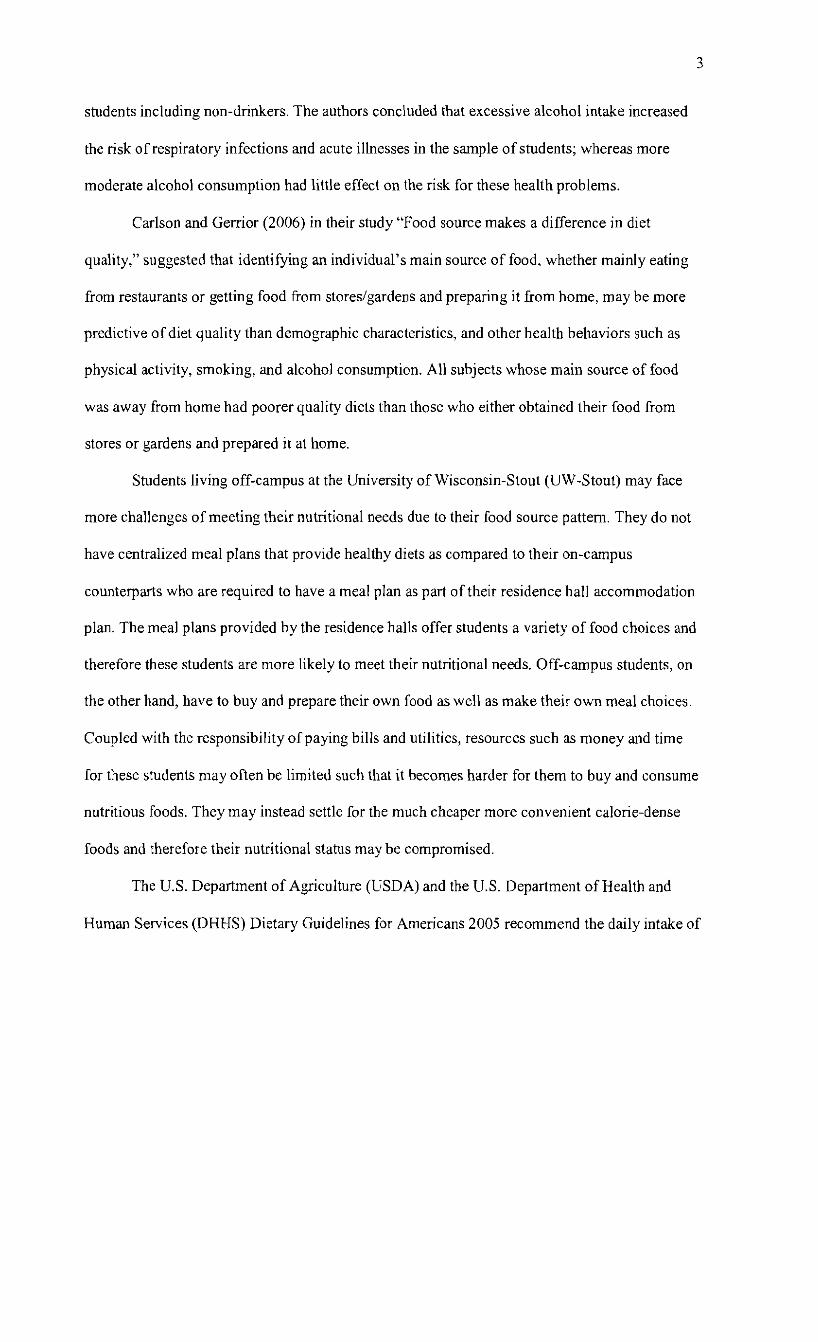
students including non-drinkers. The authors concluded that excessive alcohol intake increased
the risk of respiratory infections and acute illnesses in the sample of students; whereas more
moderate alcohol consumption had little effect on the risk for these health problems.
Carlson and Gerrior (2006) in their study "Food source makes a difference in diet
quality," suggested that identifying an individual's main source of food, whether mainly eating
from restaurants or getting food from stores/gardens and preparing it from home, may be more
predictive of diet quality than demographic characteristics, and other health behaviors such as
physical activity, smoking, and alcohol consumption. All subjects whose main source of food
was away from home had poorer quality diets than those who either obtained their food from
stores or gardens and prepared it at home.
Students living off-campus at the University of Wisconsin-Stout (UW-Stout) may face
more challenges of meeting their nutritional needs due to their food source pattern. They do not
have centralized meal plans that provide healthy diets as compared to their on-campus
counterparts who are required to have a meal plan as part of their residence hall accommodation
plan. The meal plans provided by the residence halls offer students a variety of food choices and
therefore these students are more likely to meet their nutritional needs. Off-campus students, on
the other hand, have to buy and prepare their own food as well as make their own meal choices.
Coupled with the responsibility of paying bills and utilities, resources such as money and time
for these students may often be limited such that it becomes harder for them to buy and consume
nutritious foods. They may instead settle for the much cheaper more convenient calorie-dense
foods and therefore their nutritional status may be compromised.
The U.S. Department of Agriculture (uSDA) and the U.S. Department of Health and
Human Services (DHHS) Dietary Guidelines for Americans 2005 recommend the daily intake of

4
2 cups of fruits, 2.5 cups of vegetables, 6 ounces of grains, 3 cups of milk, 5.5 ounces lean
meatslbeans and about six teaspoonfuls of oils for an average 2000 calorie (kcal) diet. The same
Dietary Guidelines recommend at least 30-60 minutes of regular moderate-intense physical
activity above usual activity at work or home to reduce the risk of chronic disease and weight
gain. These guidelines are incorporated in the USDA MyPyramid which replaced the 1992 Food
Guide Pyramid (American Dietetic Association, 2008). MyPyramid combines the guidelines and
recommendations into five major food groups which are fruit, vegetables, milk, grains and meat
and beans (USDA & DHHS, 2005). MyPyramid also translates the Institute of Medicine's
Dietary Reference Intakes (DRIs) into food based recommendations. The purpose of developing
MyPyramid was to provide a series of eating patterns that would be compatible with
recommended levels of all dietary components for age, sex and physical activity. Apart from the
five food groups and oils, MyPyramid also allows for discretionary calories (Reedy & Krebs
Smith, 2008).
For women of childbearing age, the DRIs recommend a daily consumption of 18 mg of
iron to prevent development of iron-deficiency anemia and associated neonatal malformation
risks. Also, the DRIs recommend an Acceptable Macronutrient Distribution Range (AMDR) of
20-35% of calories from total fat (10M, DRls, 200 I).
Problem Statement
The purpose of this research was to investigate food group consumption of students
living on-campus compared to those living off-campus at the University of Wisconsin-Stout to
find out if they are meeting the food intakes as recommended by the USDA MyPyramid. The
research also aimed to investigate if a significant difference existed between the iron status of
on-campus female students versus off-campus female students.

5
The research was carried out from January 2008 to April 2008 at UW-Stout campus.
Participants were 18-24 year old students living in the university residence halls as well as those
Iiving off-campus.
The parameters that were used to assess the participants' food group consumption and
hence nutritional status were BMI, calorie intake, iron intake and dietary intake from the five
major USDA MyPyramid food groups, alcohol consumption and level of physical activity.
Research Questions
This study attempted to answer the following questions:
1. Are there differences in the consumption of the five major USDA MyPyramid food
groups, total calories and fat grams between students who live on or off campus?
2. Are there differences in the BMI of students who live on or off campus?
3. Are there differences in physical activity of students who live on or off campus?
4. Are there differences in iron consumption between female students who Ii ve on or off
campus?
5. For all students, are their consumption of the five major MyPyramid food groups,
total calories, and total fat the same as those recommended by the USDA-DHHS
2005 Dietary Guidelines for Americans?
6. For all students, how do their BMI values compare to the national recommended
standards?
6
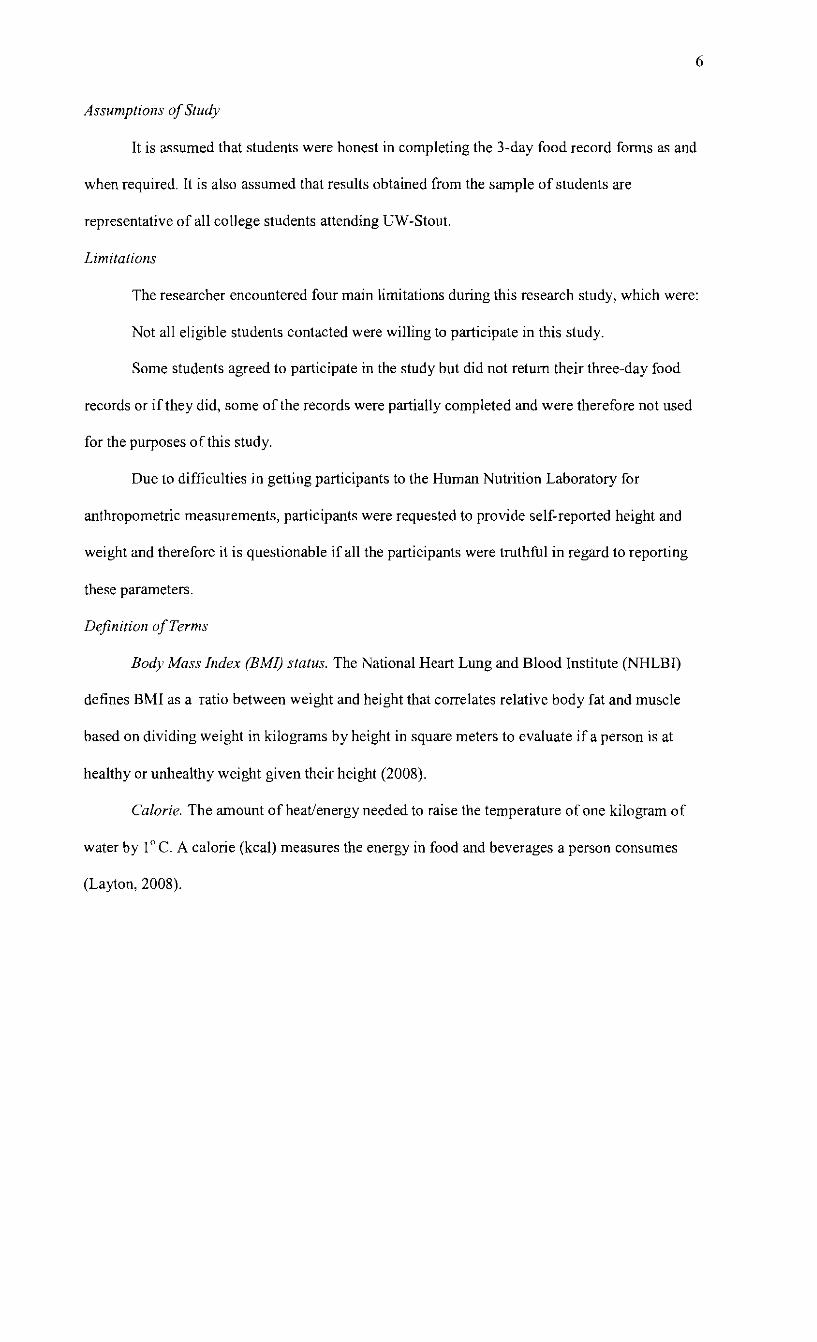
Assumptions ofStudy
It is assumed that students were honest in completing the 3-day food record forms as and
when required. It is also assumed that results obtained from the sample of students are
representative of all college students attending UW-Stout.
Limitations
The researcher encountered four main limitations during this research study, which were:
Not all eligible students contacted were willing to participate in this study.
Some students agreed to participate in the study but did not return their three-day food
records or if they did, some of the records were partially completed and were therefore not used
for the purposes of this study.
Due to difficulties in getting participants to the Human Nutrition Laboratory for
anthropometric measmements, participants were requested to provide self-reported height and
weight and therefore it is questionable if all the participants were truthful in regard to reporting
these parameters.
Definition ofTerms
Body Mass Index (BMf) status. The National Heart Lung and Blood Institute (NHLBI)
defines BMI as a ratio between weight and height that correlates relative body fat and muscle
based on dividing weight in kilograms by height in square meters to evaluate if a person is at
healthy or unhealthy weight given their height (2008).
Calorie. The amount of heat/energy needed to raise the temperature of one kilogram of
water by 1° C. A calorie (kcal) measures the energy in food and beverages a person consumes
(Layton, 2008).

7
Physical activity. Any bodily movement produced by skeletal muscles resulting in energy
expenditure (USDA, USDHHS, 2005).
Moderate-vigorous intensity physical activity. Any physical activity that burns 3.5 to 7
kcal or more per minute (USDA, USDHHS, 2005).

8
Chapter II: Review of Literature
Introduction
This chapter will include the discussion of Body Mass Index (BMI), followed by
energy/calorie intake of college students. In addition, there will be discussion of the five major
food group intakes as designated by the USDA MyPyramid as well as discussion of physical
activity. The chapter will conclude with the discussion of level of alcohol consumption and its
effect on the nutritional status and health of college students.
When students first enter college, their diets often deteriorate and they often gain weight.
There are many factors responsible for these changes. The term "freshman 15" refers to the
number of pounds many students gain during their first year in college. This weight gain is
related to stress, a sedentary lifestyle, and changes in food intake and dietary patterns, and it is
not unique to American college students. International students attending American universities
become heavier, too (Anding, Suminski & Boss, 2000).
Body Mass Index (BMI)
The most common and popular method of determining an individual's weight status is by
use of the body mass index (BMI) (Racette, Desinger & Dessinger, 2003). BMI is determined by
measuring an individual's weight in kilograms and dividing it by height in meters squared.
Numerical classification is determined as follows: the numbers 18-24.9 denote normal weight;
25-29.9 denote overweight, whilst those with numbers over 30 are classified as obese (Racette,
Desinger & Dessinger, 2003). Extreme obesity is the classification for those with BMI values
over 40 and those with values below 18 are considered underweight. According to the Centers
for Disease Control and Prevention (CDC) adults (21 years or older) are considered underweight
when they have BMI values of 18.5 and below (1997). Those with values 18.5-24.9 are normal

9
weight; those with values 25-29.9 are overweight while those with values above 30 are tenned as
being obese. For persons 2 to 20 years old, the CDC categorizes weight status using gender
specific BMI-for-age growth charts. Those who fall below the 5th percentile are underweight;
nonnal weight falls between the 5th and 85 th percentile; at risk of overweight is at the 85 th and
less than the 95 th percentile; while the overweight category is at the 95 th percentile and above.
For the purpose of this study, the CDC BMI categories were used.
Adults with a BMI of 25 or more are considered at risk of various cardiovascular and
other diseases as a consequence of overweight or obesity, and the risk increases as the BMI
reaches and surpasses 30 (National Institutes of Health, 1998). Because obesity is becoming a
serious issue in the United States, public health associations have strongly recommended the
general population to maintain a healthy body weight, regardless of age, gender, or ethnicity
(USDA & USDHHS, 2005). Findings by Lowry et aI., (2000) showed that 35% of United States
undergraduate college students were overweight or obese. Other studies have shown that as age
increases amongst students, so does the tendency to be overweight (Robertson et aI., 1977;
Daniels, Khoury, & Morrison, 1997). However, eating disorders such as anorexia and bulimia
nervosa have become more prevalent among college students especially females than among the
general population. This circumstance is because some students who are underweight, as
measured by their body mass index (BMI), sometimes consider themselves to be overweight. As
a result of dissatisfaction with their bodies, these students tend to avoid food and sometimes
resort to binge eating and purging. The incidence of anorexia and bulimia may increase when
there is excessive preoccupation with other things, such as academic achievement, and during
stressful periods like final exams (Schwitser, Bergholz, Dore & Salimi, 1998).
The BMI method to ascertain weight status is popular because it can be perfonned easily
10
by measuring height and weight of the individual (Moyad, 2004). However, BMI results cannot
distinguish between fat and muscle and therefore muscular individuals who have increased body
mass due to their lean muscle mass could easily be incorrectly judged as being overweight
(Moyad, 2004). Even with this limitation, BMI is still used as a quick and cost effective method
of assessing an individual's weight status which can be performed even at home.
Energy Intake
Between male and female college students, there are differences in dietary
atherogenicities, energy balance, and physical activity levels (Stevens, Jacobs & White, 1985).
Li (1991) at the Department of Nutrition and Food Hygiene, School of Public Health, Shanghai
Medical University, China detennined that the energy (calorie) cost and the total energy
expenditure per day of college students was 2706 kcal and 2373 kcal for males and females,
respectively. Of the three nutrients that provide calories (carbohydrates, proteins, and fats),
carbohydrate (particularly sugar) and fat intake often exceeded recommended levels. Because
college students tend to consume more fast foods than recommended, they usually consume
more energy. Generally, males seem to consume more food overall and thus have higher energy
intakes compared to females (Anding, Suminski & Boss, 2000).
When caloric intakes exceed individual needs, weight gain results. Consistent excessive
caloric intakes may lead to overweight/obesity and associated health risk factors such as high
blood pressure, Type 2 diabetes, and coronary heart disease. Almost fifteen million young adults
are enrolled in college today and of these, 35% are already overweight or obese (Lowry et aI.,
2000). This increasing rate of weight gain among college students has been attributed to their
excessive intakes of sweetened beverages such as soda and other juices (Lowry et al., 2000).

II
Nutrient and Food Group Intakes o/College Students
Fruit and vegetables. The researcher was not able to find enough up-to-date literature on
intakes offruits or vegetables alone and will therefore discuss fruits and vegetables combined.
A diet high in fruits and vegetables is associated with reduced risk of chronic discases,
and since these foods are low in energy density, they can bc bencficial in a reduced calorie diet
and hence prevention of weight gain (Rolls, Ello-Martin, & Tohill, 2000). When encouraged to
increase consumption of fruits and vegetables and reduce fat intake, a women's health and living
study showed that 74% of the participants maintained weight while 11 % lost weight (Rock,
Thomson & Caan, 2001). Fruits and vegetables have also been shown to confer protection
against some cancers because of their high level of antioxidants and phytonutrients (Law &
Morris, 1998). The Dietary Guidelines for Americans 2005 recommend a daily intake of2 cups
of fruit and 2.5 cups of vegetables for adults requiring a 2000 kcal diet. The Behavioral Risk
Factor Surveillance System (BRFSS, 2002), which assessed a national level offruits and
vegetable consumption, reported that people who were not overweight or ohese had the highest
prevalence of eating vegetables and fruits. They consumed fruits and vegetables thrcc or more
times per day. However, the same report indicated that only 20.9% of the 18-24 year olds
consumed fruits and vegetables at least three or more times per day. Most college students fall
within this agc group. Despite the dietary health benefits that fruits and vegetables confer, many
college students still consume inadequate amounts of the fruits and vegetables as recommended
in the USDA Food Guide. In tenns of vitamins, a low vitamin C status has been associated with
college students' low intake of fruits and vegetables, with levels of vitamin C being even lower
among smokers (Johnston, Solomon & Conte, 1998). Johnson, Solomon and Conte (1998) also

12
reported that the 1995 National College Health Risk Behavior Survey revealed that 74% of
college students did not cat five or more servings of fruits and vegetables per day.
Grains. Grains are the seed bearing fruits of grasses. They form the basis of a healthy dict
and nutritionists and other health experts encourage people of all age groups to incorporate
cereals and grains in their diet as part of a healthy lifestyle. The Dietary Guidelines for
Americans (USDA, DHHS, 2005) released by the USDA, recommends that people should eat at
least half of their recommended servings of grains from whole grains. The \\Thole Grains Council
(WGC) defincs wholc grains as those grains or foods made from grains that contain all the
essential parts and naturally occurring nutrients of the entire grain seed (2004). A grain is
considered "whole" when all the three main components of the seed (endosperm, germ and bran)
are present. During the refining process, the bran and germ which contain most of the nutrients
are removed leaving only the endosperm. Unfortunately, almost half of the fiber and almost three
quarters of the nutrients in the grain are found in the germ and bran so refining depletes all these
nutricnts (Hornick & Yamell, 2006). The endosperm contains mostly carbohydrates, proteins and
B vitamins and a little fiber.
Whole grains in particular are recommended because they are generally high in fiber and
low in fats. This means that they give a feeling of satiety and may prevent over eating. In so
doing, whole grains may help in reducing calorie intake and may prevent the associated weight
gain. \\Thole grains are also a good source of antioxidants especially vitamin E and other
micronutrients including vitamin B complex, magnesium and iron (Tsang, 2005).
Whole grains have been associated with reduced risk of several chronic discases
including diabetes, heart disease, certain cancers and gastrointestinal troubles. They have also
been shown to reduce blood cholesterol levels. A long-term research study by the Agricultural

13
Research Services (ARS) in May 2003 found that diets high in barley reduced total blood
cholesterol level. This result was attributed to the soluble fiber in barley which helped to reduce
total and low-density lipoproteins (LDLs). The levels of high density lipoproteins (HDL) either
increased or remained the same hence increasing the HDLlLDL ratio. In reference to females,
this study showed that results were more pronounced in post-menopausal than pre-menopausal
women. The study also showed that increased consumption of barley and other whole grains
reduced high blood pressure in males (USDA, ARS, 2007).
Despite the strong proven scientific evidence of increased health benefits from increased
consumption of whole grains, only about eight percent of the US population aged over two years
is estimated to be consuming at least three daily servings of whole grains (Cleveland et aI.,
2000). Cleveland et a!., (2000) are in agreement with Chen (2005), who found that a large
portion of grain products consumed in the United States today is highly refined with an average
of one serving of whole grains per day per person, which falls well below the above
recommendation.
Milk. The milk group includes cheeses, yogurt and all food products made from them as
long as they retain their calcium. Foods made from milk that do not retain or retain little calcium
such as cream cheese and butter are not considered part of this group. Milk and other dairy foods
when fat-free are nutrient dense, providing calcium and vitamin Bl2 as well as vitamins A, and
D. When fortified, these foods also provide potassium, riboflavin and niacin in addition to high
quality protein (USDA, ARS, 2007). Inclusion of fat-free dairy foods in the diet therefore
improves the overall nutritional quality of the diet. The USDA MyPyramid recommends that for
2000 kcal diet, an adult person should consume at least three cups of milk/equivalents per day.
Research studies have shown that the calcium in milk and other dairy foods supported the

14
development and maintenance of strong bones. A cross-sectional study of healthy Norwegian
women 19-35 years old associated lack of intake of milk to reduced foreann bone mineral
density. The study also revealed a positive relationship between calcium intake and bone mineral
density of the wrist and foreann and increased dairy consumption (Proulx, Teegarden & Lyle,
1999).
Dairy foods have been shown to play an important role in reducing the risk of diseases
such as hypertension, osteoporosis and obesity. Because these foods have been associated with
reduced body fat and weight gain, they may be a huge factor in the prevention of obesity later in
life if consumption is started early in life (USDA ARS, 2007).
Several studies have shown an inverse relationship between calcium intake and body
weight or BMI. Other studies have linked increased consumption oflow fat milk and dairy to
reduced risks of certain types of cancers such as colorectal and breast cancer. A clinical trial of
40 adults at risk of colon cancer found that increasing calcium intake by consuming at least three
servings of low fat dairy per day for four months reduced the abnonnal growth of cells which
may lead to the development of colon cancer (Heany, 2000).
Calcium from dairy foods has also been shown to reduce the risk of kidney stones,
especially calcium oxalate. It has also been shown that dairy foods especially milk and cheeses
may have oral health protective capacities by reducing the development of dental caries and
periodontal disease. These foods act by reducing acid demineralization and enhancing re
mineralization of the tooth enamel (Miller, Jarvis & McBean, 2000).
Despite the numerous health studies showing the health benefits of consuming low fat
dairy, there is still a public health concern that Americans are not consuming the recommended
three cups of milk/equivalents for adults per day. Inadequate intake in turn leads to decreased
IS
intakes of calcium, the chief nutrient in dairy foods. Data from the Continuing Survey of Food
Intakes by Individuals showed that less than 15% of adults consumed the recommended calcium
intakes. Men consumed more calcium than women (National Dairy Council, 2003). The same
data also showed that for women ages 20-29 years, only 16% were meeting the adequate intakes
of calcium (National Dairy Council, 2003). This is the age group in which most of the college
students fall.
Meat and Beans. This group of foods consists ofmeat, poultry, fish, eggs, nuts, dry
beans/peas, soy beans and other seeds (USDA, DHHS, 2005). Most Americans consume enough
food from this group but they are encouraged to make leaner and more varied selections. These
foods are usually the main source ofproteins in the diet and are therefore essential in the
building and repair of body tissues such as cartilage, skin, muscles, bones and blood. Apart from
carbohydrates and fats. proteins also supply the body with energy. Studies have also shown that
eating beans and making them part of ones regular diet may help to reduce the risk of developing
diabetes, high blood pressure, stroke and many other chronic diseases. This is because beans
contain high levels of fiber with one serving providing 20% or more fiber of the estimated (25-38
g) daily requirements. It is the effects of fiber (i.e., early satiety and regulation of blood sugar
levels) that confers on beans their health benefits (Food and Fitness Advisor, 2008). Beans in
particular have a low glycemic index because of their high content of soluble fiber. A low
glycemic index implies that carbohydrates are absorbed over a long period of time and this effect
helps to maintain blood sugar levels within nomlallimits (Edwards, 2004)
Meats are also an excellent source of heme-iron, B-complex vitamins, vitamin E, and
magnesium. The B-complex vitamins play an important role in energy release, aid in the
fomlation of red blood cells and in the normal functioning of the nervous system. Iron is

16
particularly important for oxygen transportation in the blood. The heme-iron in the blood is
readily absorbable compared to non-heme iron in plant sources. However, to avoid anemia,
women of child-bearing age and teenage girls who are at increased risk are also encouraged to
increase their consumption of non-heme iron from plant sources. Vitamin C when consumed
with such foods has been shown to increase the absorption of non-heme iron.
Using a variety of foods from the meat and beans group can help to increase the intake of
the essential fatty acids, monounsaturated fatty acids (MUFAs) and polyunsaturated fatty acids
(PUFAs) which the body cannot create on its own. Fish consumption particularly salmon, trout
and herring are encouraged because of their high content of the PUFA omega-3 fatty acids that
have been shown to reduce the risk of cardiovascular diseases.
Most Americans consume enough foods from the meat and beans group; however, they
tend to choose foods that are high in saturated fats and cholesterol such as luncheon meats,
sausages and fatty cuts of beef, pork and lamb. The saturated fats in these foods raise the level of
LDL cholesterol in the blood which increases ones risk of heart and other chronic diseases.
Americans are encouraged to limit the amount of these foods in their diet and instead include
more fish, nuts and seeds (USDA, DHHS, 2005).
Physical Activity
Regular physical activity is a major component of one's overall well-being and health.
People who engage in regular physical activity are at a reduced risk of developing chronic
diseases such as high blood pressure, stroke, coronary artery disease, osteoporosis, and Type 2
diabetes. The Dietary Guidelines for Americans 2005 also note that the overall mortality rates
from all causes of death are lower in physically active people than sedentary ones and that
physical activity may also aid in managing moderate depression and anxiety.

17
Regular physical activity in combination with control of caloric intake has also been
shown to aid in achieving and maintaining a healthy body weight and preventing the
accumulation of excess weight in adulthood. To achieve this, the Dietary Guidelines for
Americans 2005 and the 2008 Physical Activity Guidelines for Americans (CDC, 2008)
recommend at least 30 minutes or more of moderate-vigorous intensity exercise on most days of
the week. For college students, physical activity is particularly very important in enabling the
students to manage stress, increasing energy levels and promoting deeper and sounder sleep
(Barke, 2002).
In 2002, the Behavioral Risk Factor Surveillance System showed that 25% ofAmerican
adults had not participated in any leisure time physical activities in the past month. Most of these
adults gave lack of time as the main reason they did not engage in any physical activity. Stevens,
Jacobs and White (1985) noted that physical inactivity most rapidly increases in late adolescence
and early adulthood. The Centers for Disease Control and Prevention (1997) and Dinger (1999)
also noted that most college students do not meet their current physical activity
recommendations and a large proportion leads a sedentary lifestyle (Pinto & Marcus, 1995).
Alcohol Consumption and Health Effects
Alcohol refers to the intoxicating ingredients found in wine, beer and hard liquor. It arises
naturally from carbohydrates when certain microorganisms metabolize them during fermentation
(National Council on Alcoholism and Drug Dependence, 2007). Alcohol remains the favored
substance of abuse on college campuses by far, according to the study released by the National
Center on Addiction and Substance Abuse (CASA, 2007) at Columbia University. It was
estimated that about ten percent of college students drink more than fifteen alcoholic beverages
per week, and this impairs the quality of their diet as well as academic success. Students on some

18
college campuses use alcohol to signify their emerging adulthood, to enhance social gatherings,
and to cope with stress (Shore & Rivers, 1985). According to the Canadian Campus Survey
conducted in the fall of 1998 and published by the Center for Addiction and Mental Health
(2004),92% of students consumed alcohol at some point in their lives, 87% drank in the 12
months previous to the survey, and 85% drank during the eight to twelve weeks from September
until the survey was published.
A study to assess the effect of alcohol consumption on the diet of Asian American
students found that of the students who reported drinking at least three or more days per month,
only 11.9% consumed fi ve or more servings of fruits and vegetables. Eighty-eight percent ate
more than two servings of high-fat foods, while 37.6% consumed tofu, soymilk, or other soy
food (Arliss, 2007).
Because college students have been shown to consume a vast amount of alcohol, their
dietary intake and health can be adversely affected. Alcohol causes euphoria, which depresses
appetite, so that heavy drinkers tend to eat poorly and become malnourished. To make nJatters
worse, alcohol abuse not only displaces foods supplying needed nutrients, but also interferes
with the body's metabolism of nutrients, leading to damage of the liver, digestive system, and
nearly every bodily organ (National Council on Alcoholism and Drug Dependence, 2007).
19
Chapter III: Methodology
Introduction
This chapter will include a discussion of the sample selection procedures. It will also
describe the instruments that were used, and data collection and analysis procedures. In addition,
there will be a discussion of methodological limitations.
Subject selection and data collection only began after gaining approval from the
University of Wisconsin-Stout Institutional Review Board (IRB). (See Appendix A).
Subject Selection and Description.
The sample was selected from students (males and females) enrolled at the University of
Wisconsin-Stout in the 2008 spring semester. To participate in this study, students had to be
above 18 years of age or older. The researcher requested professors who had large classes (30 or
more students) to allow her ask students to volunteer to participate in this study. These classes
were selected from the UW-Stout registration and records web page for the spring semester.
After identifying these classes, the researcher sent out e-mails to the course instructors to allow
her to ask students to participate in this study. Where possible, the researcher met individually
with instructors to seek permission for student participation. The classes that were sampled
included Nutrition for Healthy Living (FN-I02), Statistical Methods (STATS-320/520),
Nutrition Counseling (FN-320/520) and International Economic Trends in Textiles and Clothing
(BURTL-519). In return as an incentive, the researcher asked that these students be given extra
credit for participation.
The researcher also visited the student cafeteria (Memorial Student Center) at least three
times a week and randomly requested students to participate in this study. In this case, the
researcher would approach all students seated at the different tables at the Terrace Cafe during
20
the lunch break period (11:00 am-l :30 pm) and would ask students' pennission to talk to them
about this study and requested those who would be interested to participate. In addition to this,
the researcher approached fellow student workmates and friends at the University Dining
Services and requested them to participate in the study. These were about 45 in total. For those
who desired, incentives in the fonn offree nutrition brochures and snacks (fruit salads) from the
University Dining Services (UDS) were also given to the participating subjects to show
appreciation and also help them make healthy food choices whenever they visited the cafeteria.
All subjects were orally infonned by the researcher about the purpose, risks, procedures
and requirements of this study, and how to complete the survey instrument. Before filling out the
survey instrument (Appendix B), subjects were given consent fornls (Appendix C) to read in
order to show that they had agreed to participate in this study and that they fully understood the
purpose of this research and their role as participants. All students who read and consented to
complete the survey were selected as subjects for this study.
In the case of students sampled from classes, the consent fonns were given to students a
class period before the survey instruments were administered. The next class period, the survey
instrument was then given to those students who had read and consented to complete the survey.
For all the other subjects, after reading the infonned consent fonns, they would then be given the
survey instmment to fill out. By completing and returning the survey, participants gave their
consent for participation in the study.
Participation was entirely voluntary. Subjects had the option of withdrawing at any time
during the course of this research without any adverse consequences. They were not obligated to
give any reasons as to why they chose to drop out of the study.

21
Instrumentation
Since there was no instrument which seemed to meet the specific needs of this study, the
researcher developed an original self-reported three-day food record survey to be filled out by
the subjects in this study. The subjects were requested to list all the food and drinks including
alcohol they consumed for three specified days of the week, one ofwhich had to be a weekend
day. The instrument also requested subjects to record their age, place of residence, i.e. off
campus or on-campus, gender, level of physical activity, height and body weight. A copy of the
instrument is presented as Appendix B. The instrument was specifically developed for this
research and as such, there are no documented measures ofreliability or validity.
Data Collection Procedures
Data was collected over a period of approximately six weeks from March to mid-April
2008. After reading and signing the informed consent statement, subjects were instructed by the
researcher on how to complete the three-day food record and other sections of the instrument
(Appendix B). They were asked to record all the foodlbeverages (alcohol included) they
consumed for a period of three days in a week as per the instructions in the survey instrument.
Subjects were given a period of two weeks in which to fill the survey instrument. Although the
researcher sent email reminders through instructors at least twice a week, some subjects took
longer than was expected to fill out the instrument.
For those students that were sampled from the cafeteria and fellow workmates, the
completed survey instruments were dropped offby the cash register in a sealed box which the
researcher asked permission from the dining services to use for the purposes of this research. The
researcher asked the students sampled from class to hand in their filled instruments to the
instructors from whom they would then be collected. In addition the researcher sent out soft

22
copies of the survey instrument via electronic mail to some ofthe participating subjects so that
they could send the filled instrument via the same in case they were unable to physically bring
the hard copy forms to the designated points of collection. For purposes of confidentiality, the
researcher printed copies of these completed instruments and deleted all e-mails received from
these subjects.
Data from the three-day records were used to estimate the daily intakes from the United
States Department of Agriculture (USDA) MyPyramid food groups (grains, fruit, vegetables,
meat/beans and milk), and daily intakes of energy (calories), iron, fat and alcohol.
Data Analysis
To determine the mean daily intakes of the above mentioned food groups and nutrients,
raw data from the three-day food records were entered into the MyPyramid Tracker software
available on the USDA website. 8MI was detem1ined from the self-reported height and weight
status of the subjects by dividing the subjects' weight in kilograms by the height in square
meters. For those students who were below 20 years of age, their 8MI was correlated with the
CDC BMI-for-Age growth charts for both girls and boys (Appendix D and E) to determine their
category of weight status. For the older students, the set CDC BMI values for weight status were
used. Physical activity levels were left as those self reported by the subjects with sedentary levels
corresponding to less than 30 minutes of moderate-vigorous exercise per day, moderately active
was set at 30-60 minutes of moderate-vigorous exercise per day, and active students were
considered as those who engaged in more than 60 minutes of moderate-vigorous activity per day.
The data was then statistically analyzed using the Statistical Program for Social Sciences (SPSS),
version 15.0, to estimate the subject mean daily intakes of the food groups, nutrient intakes, BMI
values, and physical activity levels.

23
Group statistics were run to determine the mean and standard deviation of the different
food groups, iron, fat, and energy intakes, and BMI for both groups of students (i.e., off-campus
and on-campus). Cross tabulations were run for physical activity levels of students to determine
the number of off-campus and on-campus students who were engaged in different levels of
physical activity, i.e. sedentary, moderately active, and active. Frequencies were also run for
gender, residence (oft~campus and on-campus), and physical activity. Independent sample t-tests
were run to compare BMl values and intakes of iron, calories, fat and the MyPyramid food
groups between off-campus and on-campus students. One sample t-tests were then run to analyze
how subjects compared to the United States Department of Agriculture (USDA) daily intake
recommendations for the different MyPyramid food groups based on a 2000 kcal diet. Mean
nutrient intakes were compared with the standards set by the Institute of Medicine's (lOM),
Dietary Reference Intakes (ORIs). Iron intake for female subjects was compared with the
Recommended Dietary Allowance (RDA) of 18 mg per day for non-pregnant females aged 19
30 years (lOM, ORIs, 200 I). Mean total fat intake for all students was compared with the
Acceptable Macronutrient Distribution Range (AMDR) of 20-35 percent of calories (lOM, ORIs,
2001/2002). For purposes of this study, 65 grams of total fat (30% of 2000 calories) was used for
the evaluation of fat intakes. A one sample t-test was also run to compare the subject BMI
categories against those set by the Centers for Disease Control and Prevention (CDC). The
Pearson correlation coefficient (Chi-Square) was used to analyze the physical activity of students
against set CDC standards. Results were considered to be significant at ap ~ 0.05. Energy was
based on 2000 calories which are recommended by the Food and Drug Administration (FDA) as
the amount that would be needed by an adult I32-pound woman to maintain her weight. The
2000-calorie level is also the reference level used in the 2005 Dietary Guidelines for Americans.
24
Limitations
Some of the subjects did not complete the three-day food records as per the instructions
and as such twenty responses were found to be invalid.
Due to time constraints and inability to take anthropometric measurements, subjects were
asked to self report height and weight and this could have had an effect on the final results.
It was also hard to tell the level of physical activity of the participants from the survey
responses.

25
Chapter IV: Results
This chapter will discuss the findings of the data collected. It will discuss how the
analyzed results compare for off-campus and on-campus students as well as with the general
MyPyramid food group recommendations, the Institute of Medicine standards for nutrient
intakes (ORIs) and recommended CDC BMI categories as well as levels of physical activity.
Of the 355 questionnaires given out by the researcher, only 167 were returned and 147
were considered valid. Twenty were considered invalid because they were either incomplete or
the respondents did not include their height, weight or residence status. The response rate was
therefore 41 .41 %.
D€'flnition ofSample
Of the 147 respondents, 34 (23%) were male and 113 (77 %) were female. The mean age
was 20.39 years (SD=1.811). The age ranged from 18-24 years with 21 year olds being the most
frequent (28%). The residence status of the two student groups was almost split into two equal
halves. Seventy four (50.3%) students resided on-campus while 73 (49.7%) resided off-campus.
Figure I shows the percentage distribution of the subjects by age.

26
30
<J\ 25 .... v<lJ
20
'is::J
15 V"l 10 ~
5
o 18 19 20 21 22 23 24 25 27
Age (Years)
Figure I. Age distribution of the sample (n=147).
Food Group Intake
Table I shows the mean intakes of the five MyPyramid food groups for off-campus and
on-campus students. Ounces of grains consumed were 6.97 and 7.53 grams for on-campus and
off-campus students, respectively. Fruit consumption was 1.56 cups and 1.74 cups while
vegetable consumption was 1.37 cups and 1.64 cups for on-campus and off-campus students,
respectively. The mean meat and beans consumption for on-campus students was 6.17 ounces
and 4.33 ounces for off-campus students.

27
Table I
Meall Food Group Illtakes/or Off-Campus alld Oil-Campus Subjects
Food group Residence Mean Standard Deviation p-Value
Grains (oz)
Milk (cups)
Fruits (cups)
Vegetables (cups)
Meat and Beans (oz)
On-Campus
Off-Campus
On-Campus
Off-Campus
On-Campus
Off-Campus
On-Campus
Off-Campus
On-Campus
Off-Campus
6.97
7.53
2.264
2.35
1.56
1.74
1.37
1.64
6.17
4.33
3.03
3.84
1.6
1.7
1.13
1.61
1.13
1.53
3.30
3.32
>0.05
>0.05
>0.05
>0.05
<0.001
Independent sample t-tests (alpha level 0.05) showed no significant differences in the
average daily intakes from the five major MyPyramid food groups between on-campus and off
campus students, apart from the meat and bean food group. Here, there was a significant
difference, 1(145) = 3.36, p < 0.001 with on-campus students consuming nearly one and one
half times the amount of meats and beans than that consumed by the off-campus students.

28
When intake of the different food groups of this sample of students was compared to the
recommended intakes by the USDA MyPyrarnid based on a 2000 kcal diet, the results shown in
Table 2 below were obtained. The results show that the average grain consumption by all
subjects was significantly higher than the recommended daily intakes, while the daily intakes of
fruits, vegetables, and milk were significantly lower. The only food group that students were at
par with the recommended daily intake was the meat and beans group. However as noted above,
the Stout students residing off the campus were consuming less per day (4.33 oz) from the meat
and beans group than the recommended 5.5 ounces.
Table 2
Mean Daily Intakes from Food Groups for All Subjects vs, Recommended Intakes
Food Group Recommended Amount Mean Subject p-Value
Grains 6 ounces 7.25 <0.001
Milk 3 cups 2.304 <0.001
Meat and Beans 5.5 ounces 5.26 0.386
Fruits 2 cups 1.65 <0.001
Vegetables 2.5 cups 1.503 <0.001
Iron Intake
In terms of iron intakes, there was no significant difference between the mean daily
intakes for on-campus and off-campus students t(145) = -1 ,78,p = 0.077. However, when female

29
students were compared, there was a significant difference between the mean daily intake of iron
for the two groups of female students t (Ill) = -2.24,p = 0.03. Off-campus females consumed
more iron than the on-campus females. Table 3 shows the average iron intake for both the on
campus and off-campus female students. However, both groups of students failed to consume the
recommended daily intake of 18 mg per day of iron for this age group. A one sample t-test
comparing the iron intake for all females against recommended standards showed that the UW
Stout female students were consuming significantly lower amounts of iron (p<0.001) with the
average iron intake for all subjects being 14.21 mg.
Table 3
Mean Daily Iron Intakes for Ofr-Campus and On-Campus Female Subjects
Residence N Mean iron intake (mg) Standard Deviation p-Value
On-Campus 57 12.423 3.758 0.026
Off-Campus 56 16.002 11.358
Calorie Intake
The average energy intake for on-campus students was 2124 kcal and that of off-campus
students was 2225 kcal. There was no statistical significant difference in energy intake between
off-campus and on-campus students, 1(145) = -.858 p > 0.05. There was a significant difference
t(145) = 1.83 P = 0.045 in energy consumption due to gender. Males consumed an average of
2369 calories and females had a significantly lower average consumption of 2115 calories. When
generally compared, the average daily energy intake for all sampled students was 2174 kcal. This

30
average was significantly higher t(l46) = 2.946,p = 0.004 than the 2000 kcal standard used in
this study.
Fat Intake
On average, the off-campus students consumed 70.13 grams of total fat in their diet while
on-campus students consumed a slightly higher amount of79.82 grams. An independent sample
t-test showed no significant difference (p> 0.05) in total fat consumption between off-campus
and on-campus students. The overall mean intake of total fat for all the sampled students was
75.01 grams and this amount was not significantly different t(l46) = 1.61, P = 0.111 from the
amount of not more than 65 grams for a 2000 kcal diet used in this evaluation.
Weight Status (BM!)
When the BMls of the students was compared to the set CDC values, 88.4% (n=130) of
all students were within the normal weight category (18.5-24.9), 8.8% (n= I 3) were categorized
as being overweight (25-29.5),2.7 % (n=4) were underweight «18.5), and only one student had
a BMI of31.0 and was therefore considered obese. The lowest BMI value was 16.7 and the
highest was 31.0. There were no underweight students living off-campus and therefore no
meaningful statistical analysis could be carried out. Of the thirteen subjects who were
overweight, five were 21 years old, 2 were 22 years old. 3 were 23 years old, and 3 were 24
years old. Of the four underweight students, 2 were 18 years old, I was 19, and I was 20 years
old. Table 4 shows the mean BMI for off-campus and on-campus students.

31
Table 4
Mean EMI ofSubjects bv Residence
Residence N MeanBMI Standard Deviation p-Value
On-Campus 74 22.8 2.931 >0.05
Off-Campus 73 22.7 2.542
Physical Activity
Generally, 45.6% (n=67) of the sampled students reported being moderately active.
Nearly 41 % (n=60) lead a sedentary lifestyle while only 13.6% (n=:!O) reported being physically
active. Of the 74 students who resided on campus, 36.5% (n=27) reported being sedentary,
51.4% (n=38) were moderately active, and only 12.2% (n=9) lead an active lifestyle. Nearly half
of off-campus students (45.2%) reported being sedentary; 39.7% (n=29) were moderately active
while 15.1 % (n= 11) were physically active. A Pearson correlation coefficient (xl) test for
significance of physical activity revealed no significant difference in physical activity for both
off-campus and on-campus students / (2, n = 147) = 0.367 p>0.05. However, a one sample t-test
showed a significant difference in physical activity levels between all sampled students and the
set recommended 30-60 minutes of moderate-vigorous physical activity levels on most days of
the week, 1(146) = -4.8,p=0.
Alcohol Intake
Of the 147 students sampled, there were only three students who reported having
consumed alcohol in their food record and this was not on daily basis. Of those students who
consumed alcohol, two lived on-campus and the third lived off-campus. One of the students
reported having consumed at least two 16 fluid ounce cans of beer per day during the period of

32
data collection while the other two reported having consumed one beer during the period of data
collection. This sample was not large enough for any meaningful statistical analysis in terms of
alcohol consumption.

33
Chapter V: Discussion
This chapter will discuss the results of this study and try to relate these results to other
studies in order to answer the questions that were raised in Chapter 1. There will also be
discussion of the implications of this study, limitations and recommendations for further studies.
Food Group and Nutrient Intakes
The results of this study concurred with some results from previous studies and some
results did not entirely concur. Compared to the Dietary Guidelines for Americans 2005, students
were not meeting the recommended food group intake for milk, fruits and vegetables but
exceeded their intake of the grains group. The students only met their recommendations for the
meat and beans food group. Although the study did not specifically determine the consumption
of whole grains versus processed grains or the proportion of saturated fats to unsaturated fats, it
is likely that most students were not consuming enough whole grains (Chen, 2005) and may have
exceeded their recommendations for saturated fats. Their mean fat intake of 75.01 grams was at
the higher end of the recommended range and much higher than the 65 grams that were used in
this evaluation. This intake is in agreement with findings by Li (1991) who noted that fat intake
for college students often exceeded recommended levels. The high saturated fat intake could be
due to the fact that college students often tend to consume more fast foods than recommended as
noted by Anding, Suminski and Boss (2000). The low intake of milk concurs with Dura (2008)
who found that college students had a low intake of milk in his study to determine the intake of
milk and dairy products in a college population (19-24 year oJds). He found no significant
difference between students who resided off-campus and on-campus and also found that on
average, all students consumed 2.07 servings of milk per day. Males consumed a significantly

34
higher amount of milk and other dairy products (p < 0.05) than females with 2.32 servings and
1.99 servings for males and females, respectively. Studies have shown that females are very
concerned about the intake of fat because of fear to gain weight (Dura, 2008). Since milk and
other dairy products may contain fat, females may find it desirable to avoid these foods. Low
consumption of milk especially among females should be of concern because this practice
increases their risk of developing osteoporosis, osteomalacia and other complications.
The low intake ofthe fruit and vegetable food groups also is in agreement with findings
by Johnson, Solomon and Conte (\998) who reported a low vitamin C status for college students
due to insufficient consumption of fruits and vegetables. There are numerous reasons that have
been advanced to explain the poor intake of fruits and vegetables. The USDA in 2000 estimated
the "at-home market" to have accounted for about 90% of fruit consumption by Americans (Lin,
2004). College students spend an enormous amount of time away from home either in class
and/or other social gatherings. Based on the above findings by the USDA, it would not therefore
be surprising that UW-Stout students are not consuming enough fruits and vegetables. In
addition, most eating places in and around the UW-Stout campus are fast food restaurants,
convenience stores and coffee shops. There are very few if any fresh fruit and vegetable
vendors/stores. Even if students were at home and wanted to order fruits and vegetables for
delivery it is hard for them to find an establishment that will do this. In most cases these
restaurants deliver foods like pizzas, sub-sandwiches, breads and soda. These foods are usually
high in saturated fat and refined grains. This could partly explain the high levels of grain and fat
intakes by the subjects in this study. The students therefore, have to go out of their way to buy
fresh fruits and vegetables from stores or at the biweekly farmers' market which does not even
operate during the winter months. Because oflack of time added to the fact that fruits and

35
vegetables have a short shelf life and therefore spoil easily, students will most probably not go
shopping for fresh fruits and vegetables. They may just settle for the easier to order foods such as
pizzas and other convenience foods which they can even re-heat and eat should they have any
leftovers. The insufficient intake of foods from the vegetable and fruit groups could reduce their
body levels of antioxidants and phytonutrients which have been shown to play an important role
in the prevention of certain cancers and heart disease (Law & Morris, 1998).
The inadequate intake of meat and beans by off-campus students could be attributed to
the fact that foods from this group are rather expensive when compared to the already prepared
convenience foods. Most students, especially those living off the campus in addition to having
limited time for food preparation may not have enough money to buy these foods and will most
probably settle for the more filling and calorie dense convenience foods. For example it is
cheaper to buy a can of cola instead of buying the more expensive cut of sirloin steak. The meal
plan for on-campus students on the other hand provides the students with a variety offoods from
the meat and bean group so it is up to the students to choose what to eat without necessarily
worrying about the cost and time of preparation.
In terms of iron, there was a significantly higher intake of iron for off-campus female
students as compared to their on-campus counterparts. It was hard to explain why these females
were consuming a significantly higher amount of iron than their on-campus counterparts.
However, since the study did not specifically differentiate food group intakes on the basis of
gender, chances are that these off-campus female students being older are more likely to be
planning on having families, and could have actually been consuming more iron-containing
foods such as fortified cereals.

36
However, just like most studies have proven, both groups of female students were not
consuming enough iron as recommended. Studies have shown that women in this age group are
very concerned about their weight image and as such are most likely to cut out foods such as
meats which are good sources of iron from their diet because they believe that these foods will
make them fat (Dura, 2005).
Since women in this study are of child-bearing age and they lose blood through their
monthly menstruation cycles, they are at an increased risk of developing iron deficiency anemia.
The fact that they also consume significantly lower than recommended amounts of fruits and
vegetables may also contribute to their increased risk of developing iron deficiency anemia due
to low intakes of vitamin C-rich foods which aid iron absorption from non-heme sources.
The above findings of low intakes of fruits, vegetables, milk, and iron in the case of
female subjects, and the high intake of fats by the students predispose them to the development
of chronic diseases such as coronary heart disease, obesity, hypertension and the associated
complications of these diseases later on in life.
Calorie Consumption
There was no significant difference in calorie intake between off-campus students and
on-campus students. However, the overall average intake of2174 kcal by all students was
significantly higher than the reference standard of 2000 kcal. Since this research did not
particularly study the different caloric needs of each individual participant, it was difficult to
conclude whether high or low caloric intake occurred for the individual subjects. Table 5 shows
the recommended calorie intakes for different age groups in which the subjects in this research
fell according to the different physical activity level recommendations. However, it is important
to note that these calorie estimates do not take into consideration individual height and weight.

37
Some individuals could require significantly less or more calories than what is suggested in this
table.
Table 5
MyPyramid Calorie Levels by Gender for Age and Physical Activity Levels
Age (Years) Gender Sedentary Moderately Active Active
19-20 Male 2400 2600-2800 3000
Female 2000 2000-2200 2400
21-25 Male 2400 2600-2800 3000
Female 2000 2000-2200 2400
Calorie levels are based on the Estimated Energy Requirements (EER) and activity levels from the Institute of Medicine Dietary Reference Intakes Macronutrients Report, 2002.
The results from this study therefore show that both genders on average were consuming
less than what is suggested for their age group. This tendency differs from previous studies
which show that most college students consume more than their recommended amounts of
calories because of increased intake of carbohydrates and saturated fats (Li, 1991).
Based on the reference diet of 2000 kcal used, the average calorie intake for all students
was higher than this reference, and therefore could still place some students at the risk of weight
gain and/or obesity and the associated health problems such as heart disease, hypertension and
Type 2 diabetes as well as increased risk of mortality due to the complications resulting from
these diseases.
Body Mass Index (BMI)
Most of the students in this study had BMI values within a normal range although a few
were overweight. These findings were in contrast to most studies in terms of overweight/obesity

38
amongst college students. This study showed that about 8.8% of the students were
overweight/obese while 2.7% were underweight. This finding is in contrast with most reports
which have put the average level of overweight/obesity in terms of BMI for college students at
about 35% (Lowry et aI., 2000). Since height and weight of the subjects in this study were self
reported, chances are that some subjects may not have been entirely accurate about their weight
and height and this error could have had an effect on BMI values and hence weight status ofthe
subjects. However, it must also be noted that that although the average caloric intake of2174
kcal for all students was significantly higher than reference value of2000 kcal, many individual
students could have required more calories than this reference value. Therefore the fact that
most students were within normal weight status in terms of BMI would be the expected outcome.
Although the majority of the students were within the normal weight status range in
terms of BMI, the remaining percentage who were overweight face an increased risk to the
development of obesity-related diseases such cardiovascular diseases, Type 2 diabetes,
hypertension and early mortality as a result of these diseases and associated complications.
There should also be concern for the small percentage of students who were underweight.
These students are at an increased risk of developing diseases such as osteoporosis, and
decreased immunity to a variety of diseases. There is also a risk of developing Type I diabetes,
anemia, and in the case of women, the cessation of menstrual periods (Life Tips, 2008).
Physical Activitv
The students generally led a sedentary lifestyle and these findings were in agreement with
Dinger (1999) who noted that most college students did not usually meet their current physical
activity recommendations. The physical activity levels of the subjects in this study were
significantly lower than nationally recommended standards with 41 % of the participants leading

39
sedentary lifestyles. This percentage of sedentary students is slightly lower than the 46.7%
reported by Suminski, Petosa, Utter and Zhang (2002) but higher than the 28% reported by
Brevard and Ricketts (1996). Although there was no significant difference between physical
activity for both off-campus and on-campus students, a higher percentage of on-campus students
were more likely to be moderately active compared to off-campus students. This tendency could
be attributed to the fact that on-campus students have easier access to the fitness center and other
recreational facilities at UW-Stout unlike their off-campus counterparts. All residence halls at
UW-Stout have workout rooms which residents are free to use at their own convenience not to
mention the fact that the fitness center on the southern campus is easily accessed especially for
the residents on the southern part of the campus. Off-campus students may not have such
facilities in their places of abode and therefore have to pay to join fitness centers. These centers
are usually more expensive and may be far away from their residences and as such students may
not easily be able to join them. In addition to cost and distance, college students lead a very
hectic lifestyle. They have to meet their academic requirements, work to pay bills especially in
the case of off-campus students as well as create time to socialize. These demands leave the
students with heavy schedules and therefore exercise/physical activity may be the last thing on
their minds unless they are involved in athletic activities.
The above trend of high physical inactivity by the students places them at a risk of
developing diseases such as high blood pressure, stroke, Type 2 diabetes, obesity and other
associated complications later on in life. 11 has also been shown that physical activity may aid in
managing stress, moderate anxiety and depression (Barke, 2002). Students are prone to stress
especially during exam periods and therefore lack of physical activity may also lead to increased
levels of stress for them.

40
Alcohol Consumption
Only 2% of the sampled students reported having consumed alcohol during the period of
the study. This percentage is much lower than that reported by other studies such as that
conducted by Clement (1999) who found that 15.7% of the sampled college students (n =306)
consumed alcohol. However, it should be noted that 48% of the subjects in this study were below
the legal drinking age of 21 years and the period of data collection (3 days) may not have been
long enough to adequately assess alcohol intake. There is also a possibility that some subjects
may not have felt comfortable with reporting their alcohol consumption and failed to report their
intake for the purposes of this study.
Although the percentage of students who consumed alcohol in this study is low, there
should be concern for the health implications that these students may face due to prolonged use
of alcohol such as liver complications and increased stress and depression.
Conclusions
UW- Stout students were not meeting their recommended daily intakes for the dairy,
fruits and vegetable food groups and were consuming more fat and grains than recommended.
Generally, there was no significant difference between off-campus and on-campus students for
all tested parameters apart from the meatlbean food group. Off-campus students consumed less
meat than their on-campus counterparts. Off-campus females consumed significantly higher
amounts of iron than their on-campus counterparts. Residence may therefore have had an effect
on food and nutrient intake of college students.
Recommendations
The results of this research revealed inadequate consumption of foods such as fruits and
vegetables, milk, and high consumption of processed foods and fats as well as a high rate of

41
physical inactivity. This lifestyle practice may put the students at increased risk of developing
disease complications such as Type 2 diabetes, cardiovascular disease, hypertension, obesity, as
well as early mortality.
It is therefore recommended that students be given ample information on the dangers of
living such a lifestyle and how they can overcome it. Promotion of nutrition education in the
cafeterias and other areas such as weekly email reminders about recommended dietary intakes or
holding of "nutrition months" should be enhanced so that these young adults have such
information at their finger tips. It has been observed that eating habits developed during college
often follow through to adulthood after school. This being the case, nutrition education is of
paramount importance at this stage of the students' lives.
Where possible, the university should offer off-campus students an alternative meal plan
that includes a variety of foods and at a cheaper price so that students are able to have a well
balanced diet. The current meal plan where off-campus students pay 3.90 dollars for a meal at
the university is not viable because there is very little variety of foods that students can get at this
rate. Consequently, off-campus students have to either pay extra money for other foods they get
above this price or they just make do with the monotonous choices that this money can purchase,
hence compounding the problem of poor food intake.
It is also recommended that where possible the university make available ample and
various recreational facilities at affordable prices for off-campus residents so that they are able to
more physically active. Organizing sporting competitions between off-campus and on-campus
residents could also be another way to encourage students to be involved in sports/exercise and
therefore physical activity.

42
Female students in particular need to be encouraged to eat more iron fortified foods in
order to meet their recommended daily intakes. Another way of improving their iron intake is to
encourage a multivitamin supplement that contains iron.
LimItations and Inferences for Further Study
This research did not study the intake by the subjects ofwhole grains versus processed
grains and unsaturated fats in contrast to saturated fat. It would have been useful to find out how
much of these foods students were consuming since most research has shown that most
Americans do not consume enough whole grains and also consume a higher than desired range
for saturated fat.
One calorie level (2000 kcal) was selected as a reference for all subjects participating in
this study. It would have been valuable to have selected different calorie levels for age, gender
and level of physical activity and then compared results with recommended calorie intakes.
Self-reports of height, weight and level ofphysical activity by subjects may not have
been entirely truthful and could therefore have affected the results in this study. It is
recommended that a study in which qualified professionals take these measurements be carried
out. This method could give more valid results and it would be interesting to find out how such
results compare with those of this study.

- -
43
References
American Dietetic Association. (2008). Mypyramid. Retrieved on August 10, 2008 from
http://www.eatright.orglcps/rde/xchgiada/hs.xsl/nutrition_fgp_ENU_HTML.htm
Anding, J. D., Suminski, R. R., & Boss, 1. (2000). Dietary intake, body mass index, exercise,
and alcohol: Are college women following the dietary guidelines for Americans? Journal
ofAmerican College Health, 49, 167-171.
Arliss, M. (2007). Binge drinking and diet in 138 Asian American college students in Brooklyn,
New York. Journal ofCommunity Nutrition, 32, 71-84.
Barke, S. (2002). Fittingfitness into busy college life. Retrieved on June 15,2008 from
http://www.snac.uc1a.eduipageslResources/Handouts/HOPhysicalactivity.pdfMP
Behavioral risk factor surveillance system, surveillance for certain health behaviors among
selected local areas-United States, behavioral risk factor surveillance system, 2002,
Morbidity and Mortality Weekly Report, 53, (SS-05). Retrieved on June 19,2008 from
http://www.cdc.govlbrfss/
Brevard, P. B., & Ricketts, C. D. (1996). Residence of college students affects dietary
intake, physical activity, and serum lipid levels. Journal ofthe American Dietetic
Association, 96, 35-38.
Carlson, A., & Gerrior, M. (2006). Food source makes a difference in diet quality. Journal of
Nutrition Education and Behavior, 38(4),238-43.
Center for Addiction and Mental Health. (2004). The Canadian campus survey, 1998. Retrieved
on August 24, 2008 from
http://www.camh.netlResearch/Areas_oCresearch/Population_Life_Course_Studies/CCS
2004 report.pdf

44
Centers for Disease Control and Prevention. (2008). Physical activity for everyone. Retrieved on
November 10, 2008 from
http://www.cdc.gov/physicalactivity/everyone/guidelines/adults.html
Centers for Disease Control and Prevention. (2007). Fruit and vegetable consumption among
adults, United States, 2005. Morbidity and Mortality Report, 56(10), 213-217.
Centers for Disease Control and Prevention. (1997). Youth risk behavior surveillance, national
college health risk behavior survey, United States, 1995. Morbidity and Mortality Weekly
Report, 4.
Chen, P. L. (2005). Health benefits ofwhole grain foods. Retrieved on May 20 2008 from
http://www.tc.umn.edul-chenx088/research.php?topic=wholegrain
Clement, R. (1999). Prevalence of alcohol disorders and alcohol-related problems in a
college student sample. Journal ofAmerican College Health, 48(3), 111-118.
Cleveland, L. E., Moshfegh A. J., Albertson A.M., & Goldman J. D. (2000). Dietary intake of
whole grains. Journal ofAmerican College Nutrition, 19,331-338.
Daniels, S. R., Khoury, P. R., & Morrison, 1. A. (1997). The utility of body mass index as a
measure of body fatness in children and adolescents; differences by race and gender.
Journal of Pediatrics, 99, 804-807.
Dinger, M. K. (1999). Physical activity and dietary intake among college students. American
Journal ofHealth StlIdies, 15(3), 139-148.
Dura, T. T. (2008). Intake of milk and dairy products in a college population. Journal of
Nutrition Hospitality, 23(2), 89-94.

45
Edwards, J. U. (July 2004). Beans: Agriculture to health. Leader' Guide. Retrieved on June 18,
2008 from http://www.ag.ndsu.edu/foodlfactsheet/bean-ag2health.pdf
Engs, R. c., & Marlene, A. (1995). The association of alcohol consumption with self reported
illness. Psychological Reports, 76, 727-736.
Food and Fitness Advisor. (February, 2008). Little beans, big benefits: Beans prOVide a
from http://findarticies.com/p/articies/mi_mOZRRlis_2_111ai_n25337490
Hanson, D. J., & Engs, R. C. (1992). College students' drinking problems: A national study,
1982-1991. Psychological Reports, 71, 39-42.
healthbenefits-of grainsga.htm
Heaney, R. P. (2000). Calcium, dairy products and osteoporosis. Journal ofAmerican College
Nutrition, 19, 83s-99s.
heart healthy, protein-rich alternative to meat. Retrieved on June 17, 2008
Hornick, B., & Yarnell, E. (March 24, 2006). Health benefits ofgrains. Retrieved on
Institute of Medicine. (2001). Dietary reference intakes: Recommended intakes for individuals,
elements. Retrieved on November 11, 2008 from
http://www.iom.edu/Object.File/Master121 /3 72/0,pdf
Institute of Medicine. (September 05, 2002). Dietary reference intakes for energy, carbohydrate,
fiberJatJattyacids, cholesterol, protein and amino acids. Retrieved on October 25,
2008 from http://www.iom.edu/?id=54342
Johnston, C. S., Solomon, E., & Conte, C. (1998). Vitamin C status of a campus population:
College students get a C minus. Journal ofAmerican College Health, 46,209-213.
June 15,2008 from HowStuffWorks.com.<http://recipes.howstuffworks.com/

46
Law, M. R., & Morris, J. K. (1998). By how much does fruit and vegetable consumption reduce
the risk of ischemic heart disease? European Journal ofClinical Nutrition, 52, 549-556.
Layton, J. (2008). How calories work. Retrieved on August 11,2008 from
http://www.howstuffworks.comlcaloriel.htm
Li, J. (1991). The energy expenditure and nutritional status of college students. Journal of
Biomedical and Environmental Sciences, 4(3),295-303.
Life Tips. (2008). Health risks ofbeing underweight tips. Retrieved July 19,2008 from
http://weightgain.lifetips.comlcat/61224lhealth-risks-of-beingunderweight/
Lin, B. (October, 2004). Fruit and vegetable consumption: Looking ahead to 2020. USDA
Agriculture Information Bulletin, 792-7.
Lowry, R., Galuska, D. A., Fulton, J., Wechsler, H., Kann, 1., & Collins, J. (2000). Physical
activity, food choice and weight management goals and practices among US college
students. American Journal ofPreventive Medicine. 18, 18-27.
Miller, G. D., Jarvis, J. K., & McBean, L.D. (2000). Handbook ofdairy foods and nutrition.
Boca Raton, FL: CRC Press.
Moyad, M. A. (April 2004). Fad diets and obesity. Measuring weight in a clinical setting.
Urologic Nursing. 24(2), 114-119.
National Center for Chronic Disease Prevention and Health Promotion, Division of Nutrition and
Physical Activity. (2008). About BMffor adults. Retrieved on May 20, 2008 from
http://www.cdc.gov/nccdphp/dnpalbmi/adult_BMIIabout_adult_BMLhtm#Interpreted
National Center on Alcohol and Substance Abuse at Columbia University. (2007). Annual
Reports. Retrieved on August 24, from
47
http://www.casacoIumbia.org!absolutenmltemplateslAnnualReports.aspx?artideid=526&
zoneid=15
National Council on Alcoholism and Drug Dependence. (2007). Alcohol and your health.
Retrieved on April 23, 2007 from www.healthchecksystems.comlalcohol.htm
National Dairy Council. (2003). 3-A-day ofdairy campaign. Retrieved on November 12, 2008
from http://www.nationaldairycouncil.orglNationalDairyCouncillHealthlDigestldcd74
IPage2.htm
National Heart, Lung and Blood Institute. (2008). Calculate your body mass index. Retrieved on
August II, 2008 from http://www.nhlbisupport.comlbmilbmi-m.htm
National Institute of Health. (June 17, 1998). Firstfederal obesi~v clinical guidelines released.
Retrieved April 19, 2007, from www.nhlbi.nih.gov/new/press/obereI4f.htm
Nojomi, M., & Najambadi, S. (2006). Obesity among university students. Asia Pacific Journal of
Clinical Nutrition, 15 (4), 516-520.
Pinto, B. M., & Marcus, B. H. (1995). Stages of change approach to understanding college
students' physical activity. Journal ofAmerican College Health, 44, 27-31.
Proulx W. R., Teegarden, D., & Lyle R.M. (1999). Previous milk consumption is associated with
greater bone density in young women. American Journal ofClinical Nutrition, 69, 1014.
Racette, S. 8., Desinger, S. S., & Desinger, R. II. (2003). Obesity: Overview ofprevalence,
etiology and treatment. Journal ofPhysical Therapy, 83(3), 276-288.
Reedy, J., & Krebs-Smith, S. M. (2008). A comparison of food-based recommendations and
nutrient values of three food guides: USDA's MyPyramid, NHLBI's dietary approaches
to stop hypertension eating plan, and Harvard's healthy eating pyramid. Journal ofthe
American Dietetic Association, 108 (3).

48
Robertson, T. 1., Kato, H., Rhoads, G. G., Kagan, A., Marmot, M., Syme, S. 1., Gordon, T.,
Worth, R. M., Belsky, J. 1., Docks, D. S., Miyanishi, M., & Kawamoto, S.(l977).
Epidemiologic studies of coronary heart disease and stroke in Japanese men living in
Japan, Hawaii and California: Incidence ofmyocardial infarction and death from
coronary heart disease. American Joumal o/Cardiology, 39,239-243.
Rock, C. 1., Thomson, c., & Caan B J. (2001). Reduction in fat intake is not associated with
weight loss in most women after breast cancer diagnosis. Journal o/Cancer, 91,25-34.
Rolls, B. J., Ello-Martin, J. A., & Tohill, B. C. (2000).What can intervention studies tell us about
the relationship between fruit and vegetable consumption and weight management?
Journal 0/Nutrition, 62, 1-17.
Schwitser, A. M., Bergholz, K., Dore, T., & Salimi, 1. (1998). Eating disorders among college
women: Prevention, education, and treatment responses. Journal o/American College
Health, 46(5), 199-207.
Selkowitz, A. (2000). The college student's guide to eating well on campus. Bethesda, MD: Tulip
Hill Press.
Shore, E. R., & Rivers, P. C. (1985). Peer pressure to drink: Implications for university
administration and planning. Journal 0/Alcohol and Drug Education, 30, 22-31,282,
323.
Stevens, T., Jacobs, D. R., & White, C. C. (1985). A descriptive epidemiology ofleisure time
physical activity. Public Health Reports, 100(2), 147-158.
Suminski, R. R., Petosa, R., Utter, A.C., & Zhang J. J. (2002). Physical activity among ethnically
diverse college students. Journal 0/American College Health, 51 (2), 75-80.
49
Tam, C. F., Martinez, E., Tsai, S., Chang, L.C., Calderon, L., Davis, R., & Yeh, 1. (1996). A
comparison of dietary atherogenicities, energy balance, and physical activity levels of
male and female college students. Journal ofNutrition Research, 16, 1861-1880.
Trockel, M. T., Bames, M. D., & Egget, D. L. (2000). Health related variables and academic
performance among first-year college students: Implications for sleep and other
behaviors. Journal ofAmerican College Health, 49(3), 125-131.
Tsang, G. (December 2005). Whole grains guide. Retrieved on June 13, 2008 from
http://www.healthcastle.com/whole-grains.shtml
U.S. Department of Agriculture, Agricultural Research Service. (2007). USDA nutrient database
for standard reference. Accessed June 4,2008, from: www.nal.usda.gov/fnic/foodcomp
U.S. Department of Agriculture and U.S. Department of Health and Human Services. (2005).
Dietary guidelines for Americans 2005. Retrieved on April 19,2007, from
www.healthierus.gov/dietaryguidelines
Wechsler, H., Davenport, A. E., & Baer, J. S. (1999). College alcohol use: A full or empty glass?
Journal ofAmerican College Health, 47, 247-252.
Whole Grains Council. (2004). Definition ofwhole grains. Retrieved on August 24, 2008 from
http://www.wholegrainscouncil.orglwhole-grains-lOlldefinition-of-whoIe-grains

50
Appendix A: Institutional Review Board Approval
152 Vac Rehab Building
Ur, cd \iI'.,c nn',,') <;1('11\s'rOUT !'.U Fk>A f",1'c'I()'I\(/)Il! V... , 'j,~ -")1-(17Qn
715/232-1'126 715/232-1749 (fax) !:~ttk:'_'__,!Ni!~ U,!~>,~',)1_,1 1"', r-~
Date: November 25.2008
To: Jacent Asiim we
Cc: Esther Fahm
From: Sue Foxwell, Research Administrator and Human Protections AdmlnJstrator, UW-Stout Institutional Review Board for the Protection of Human Subjects in Research (IRB)
Subject: Protection of Human Subjects in Research
Your project, "Dietmy Intake and Nutritional Status ofUW-Stout Students Living O/rand On the Campus, " IS Exempt from review by the Institutional Review Board for the Protection of Human Subjects. The project IS exempt under Category I, 2/3 of the Federal Exempt Guidelines and holds for 5 years.
Please copy and paste the following message to the top of your survey form before dissemination:
: This project has heen revIewed by the UW-StoUiI IRD a.'i required by lhe Code ofi Fcd"ral Regul:ations Title 45 Pan 46
r i
Please contact the IRE if the plan ofyourresearch changes. Thank you for your cooperation with the IRE and best wishes with your project.
*NOTE: This is the only notice you will receive - no paper copy will be sent.
SF:cb

51
Appendix B: Daily Food Record Form Instructions
Please follow the instructions below to help ensure a complete and accurate food record. Please record all foods and drinks that you have for three days: two weekdays and one weekend day if possible. Do not change your eating habits for this food record. Be sure to include any late night meals, snacks or drinks.
List foods and drinks (alcohol inclusive) as soon as possible after consuming them to prevent forgetting to include something you ate or drank.
Be specific about how the food was prepared. Write down anything added while cooking or at the table in the description section of this form. This could include: butter, oil, sugar, salt, cheese or others.
When possible, please measure your food. The amount of food and drink that you consume is just as important as the type of food and drink that you consume. To help estimate the amount you eat please the attached handout.
Please write down brand names of the products that you eat so they can be matched up exactly in the database 0 f foods.
If you eat food from a restaurant, plcase include the name of the restaurant. Remember to record the size of your serving (e.g., supersize, large, medium, small) and how your meal was prepared (e.g., fried, baked, broiled).
If possible, include the nutrition labels from products that you eat when you return the food record.
Example of a food record.
Meal Food Amount Tvpe Description Breakfast English muffin Yi muffin Toasted raisin
Milk I cup Skim (fat-free) -
Margarine I teaspoon Canola Apple lmedium fresh

52
Residence: Residence hall, Off-campus (circle one) Sex: M or F (circle one)
Level of physical activity/day: Less than 30 minutes, 30-60 minutes, more than 60 minutes (circle one) Age: _ Date: _ Height _ Weight _ Day I Meal Food Amount Type I Description
~~-
C ==l
=t= =dI

-------
--------------
----
--
53
Residence: Residence hall, Off-campus (circle one) Sex: M or F (circle one) Level of physical activity/day: Less than 30 minutes, 30-60 minutes, more than 60 minutes (circle one) Age: _ Date: Height _ Weight _ Day 2
1,
, Type 1 Description
I,
-- '---
I----
~ ~ F --r--
~ t,
AmonntI Meal fFOOd ,
F--=T r ---- r_-=+=--~ f-
~-~--_+_-==t--=±= I ~ =f---=f-- --~
I
~--=i= F-=t=----=- ~ 1L
I
±=I
~ 1
==1 f--
1--
1
I
I------~ ~

54
Residence: Residence hall, Off-campus (circle one) Sex: Mar F (circle one)
Level of physical activity/day: Less than 30 minutes, 30-60 minutes, more than 60 minutes (circle one) Age: _ I)ate: _ Height. _ Weight. _ I)ay 3 Meal Food I Amount Tvpe Description
L
F~
,
.t== -
~ I
f--
= ± F
I~ -=J
55
Appendix C:
Consent to Participate In UW-Stout Approved Research
Title: Dietary Intake and Nutritional Status ofUW-Stout Students Living Off and On the Campus
Investigator: .Tacent Kamuntu Asiimwe.
Sponsor: Esther Glover Fahm, PhD, RD, CFCS Department of Food and Nutrition Home Economics Building 342 University of Wisconsm-Stout Menomonie, WI 54751 Phone: 715-232-2550
Description: In this study, the above investigator will be carrying out a nutritional status assessment ofUWStout students living in the residence halls on campus and comparing it to that of studento living off the campus to find out if there are any significant disparities between the two groups. The parameters that will be used to assess nutritional status will include height, weight iron intake, percent body fat and dietary intake ofthe different food groups as recommended in the My Pyramid food guide. In addition you will be requested to self-report your age, gender and level of physical activity which are necessary for dietary comparisons.
Risks and Benefits: There will be minor risks for those involved in this study. You will be asked to provide information about your food and beverage intake including alcohol intake. Some participants might not feel comfortable divulging such information. Participants will also be measured for height and weight as well as percent body fat. You might get some emotional discomfort and feel some shyness upon reception of this information in relation to what it means for your nutritional status. These measurements utilize equipment similar to what may be used in your doctor's office.
To reduce the impact and occurrence of risks, researcher has undertaken training in nutrition assessment practices and will conduct all assessments in the laboratory under the supervision of a trained employee ofthe Department of Food and Nutrition. Laboratory measurements win be made in private a room and the researcher win also endeavor to maintain confidentiality at all times. In addition, laboratory equipment will be sanitized between measurements ofeach individual using alcohol swabs.

56
Benefits: Your individual findings as a participant in this study may be beneficial for assisting you to make life style and dietary changes that will improve your general health status and quality of life.
The researcher also hopes that the collective (group) research findings wil1 be used by the university and other colleges to find ways of improving nutrition of all students both living on and off campus colleges.
The researcher hopes that findings of this study will be published in the students journal of research and will be posted on the UW-Stout website and will be accessible to a worldwide audience and may be used to improve or advocate for public health concerns of not only college students but people who may be in similar situations especially in terms of nutrition.
Time Commitment and Payment: This study will be conducted during the period of February 8 and March 8, 2008. You will be requested to fill in a 3-day food record form on any three days of your choice during this period, one of which should be a weekend day. Once you have completed your food records, you will also be measured for height, weight, and body fat. These measurements will be performed in the Food and Nutrition Assessment Laboratory, Department of Food and Nutrition. The researcher estimates that these measurements will take about fifteen minutes per individual.
As a form of incentive, you will be free to ask the researcher any questions regarding nutrition and related topics that may be of concern to you. The researcher is happy to offer any form of nutrition education as requested by participants.
For those who would like, information about your nutritional status will be provided and explained in detail as to what it means. Where there is need for improvement, the researcher will offer recommendations.
Confidentiality: Your name will not be included on any data collection instrument. The researcher therefore, does not believe that you can be identified from any information given. This informed consent will not be kept with any of the other documents completed with this project and all documents in regard to this project will be destroyed after the study.
Right to Withdraw: Your participation in this study is entirely voluntary. You may choose not to participate without any adverse consequences to you. Should you choose to participate and later wish to withdraw from the study, you may discontinue your participation at this time without incurring adverse consequences.
IRB Approval: This study has been reviewed and approved by The University of Wisconsin-Stout's Institutional Review Board (IRE). The IRE has determined that this study meets the ethical obligations required by federal law and University policies. If you have questions or concerns regarding this

57
study please contact the Investigator or Advisor. If you have any questions, concerns, or reports regarding your rights as a research subject, please contact the IRB Administrator
Investigator: Jacent Kamuntu Asiimwe IRB Administrator 715-309-8104, [email protected] Sue Foxwell, Director, Research
Services 152 Vocational Rehabilitation Bldg. UW-Stout
Advisor: Dr. Esther Fahm Menomonie, WI 54751 715-232-2550, [email protected] 715-232-2477 [email protected]
Statement of Consent: By completing the following surveys you agree to participate in the project entitled: Dietary Intake and Nutritional Status of UW-Stout Students Living Offand On the Campus

58
Appendix D: CDC Body Mass Index-far-Age Growth Chart: Girls 2 to 20 years
CDC Growth Charts: United States
I I I I~BtJ!1 8MI
f--,Body index-far-age percentiles: 97th -mass - 34 Girls, 2 to 20 years 34
f- 32 9!'l111 32
- 3O 30
I.- 26 ~'" " 85th
- 20 ,
20 ,
, , 7511">
-2' - 24
./
-22 .
22 SCtr
I
20 + 20 . ,
- ,18th
-18 _.-' . ,
5th - = " . ..
,
, -/ ..- , 3rc
, - ., , - ,-
-lC, - " I "
. .-. ,,. -.
, -.
-' .-'"
, ,,', , - . , " , -' " " .' ..' -, , , -
-12 12
kg:m> kg:',"'"
5 l1 9 10 ~1 12 '3 1,1 ;5 ,G 17 1f1 19 20
Age (years)
I'd"j"IlC M,', :J~ ;lX.\)
SOlIRGl: D,:""\()QlL~ 111' thO t11l ",'-J' ::;""!l1' J* rIEI<lll" SI~I,',\,;::; " "'"'·jlbnnllD" ""1)) ("0 NJL~' JI CR"I(" 10' c",~",~ D,';f!~!,'t> PWV\,"k,'" o"C H~~~I' P'0'11Q('::>r' ~()(.":i e;I\FI:,., Ht:ALTfllll:R' Pt:OPL.It·

S9
Appendix E: CDC Body Mass Index-far-Age Growth Chart: Boys 2 to 20 years
CDC Growth Charts: United States
8 9 10 1 \ 12 13 14 15 Itl l? 18 19 2:)G2 3
r- OMI BMI
Body index-far-age1-" - H mass percentiles: " H- Boys, 2 to 20 years 97th
f-12 32
'J5lh
~3C 30
gJm1--28 1/ 28
851h -
f--- 2f; /
7dn, 26
/
,
" j r- 24
SOlh c-,,
r- 22 ,
22
-.' 25
1
0\ c-
, /
1~1I"f- 28 - 20
, / Sit· f---Jrd
'" - / / -,
-10 . , 18,
- - ,,' - , /
" - ,
, , /
I-- IG 16
- - .,- - -'-. , , - ..
. -, - ././
1-" - .. - "- -, - - , .-- - - ,
f-- 12 12
I-:g;m' klJrn' -
Age (years)
Pur:.c~"·"·d Mil'" :x ~~~~,
sour'CE ('f",:O<A:: lJj" l~p. N\:lNY'(lJ C,,'lll'" 10' Ilrol') Sllll"h~ 'c"i\t)\')'~<'" wU> IN: NJlc.'-· iJI c.:,"["~ frY Cr).~';~ D>ooal;a P'e·..~nNw an:: [-tnil'" P'c~r(jl,o~ CiG".x:.' ~A"l!:Pl' HEALTI'HI:R- pr;OJ'LIiI'