Embed Size (px)
Citation preview

Spectral Organization of the Human Lateral Superior Temporal Gyrus Revealed byIntracranial Recordings
Kirill V. Nourski1,, Mitchell Steinschneider3,4, Hiroyuki Oya1, Hiroto Kawasaki1, Robert D. Jones2 and Matthew A. Howard 1
1Department of Neurosurgery, 2Department of Neurology, The University of Iowa, Iowa, IA 52242, USA 3Department ofNeurology, 4Department of Neuroscience, Albert Einstein College of Medicine, New York, NY 10461, USA
K.V.N. and M.S. contributed equally to this work.
Address correspondence to: Kirill V. Nourski, Department of Neurosurgery, The University of Iowa, 200 Hawkins Dr. 1815 JCP, Iowa, IA 52242,USA. Email: [email protected]
The place of the posterolateral superior temporal (PLST) gyruswithin the hierarchical organization of the human auditory cortex isunknown. Understanding how PLST processes spectral informationis imperative for its functional characterization. Pure-tone stimuliwere presented to subjects undergoing invasive monitoring forrefractory epilepsy. Recordings were made using high-density sub-dural grid electrodes. Pure tones elicited robust high gamma event-related band power responses along a portion of PLST adjacent tothe transverse temporal sulcus (TTS). Responses were frequencyselective, though typically broadly tuned. In several subjects,mirror-image response patterns around a low-frequency centerwere observed, but typically, more complex and distributed patternswere seen. Frequency selectivity was greatest early in theresponse. Classification analysis using a sparse logistic regressionalgorithm yielded above-chance accuracy in all subjects. Classifierperformance typically peaked at 100–150 ms after stimulus onset,was comparable for the left and right hemisphere cases, and wasstable across stimulus intensities. Results demonstrate that rep-resentations of spectral information within PLST are temporallydynamic and contain sufficient information for accurate discrimi-nation of tone frequencies. PLST adjacent to the TTS appears to bean early stage in the hierarchy of cortical auditory processing. Pure-tone response patterns may aid auditory field identification.
Keywords: classification analysis, electrocorticography, high gammaactivity, human auditory cortex, pure tones
Introduction
The functional organization of the human auditory cortex isincompletely understood. This deficiency hampers our abilityto clarify the mechanisms underlying the normal cortical pro-cessing of speech and other complex sounds, which is a pre-requisite to thoroughly understand the pathophysiology ofcertain speech and hearing disorders. A fundamental organiz-ational feature of classical auditory pathways is the orderlyrepresentation of sound frequency (Rose et al. 1963; Aitkinand Webster 1971). The auditory cortex in Old Worldmonkeys is characterized by orderly frequency gradients thathelp define specific fields, both within the core regions onthe superior temporal plane and along adjacent belt regions,including those on the lateral surface of the superior temporalgyrus (STG; Merzenich and Brugge 1973; Morel et al. 1993;Kaas et al. 1999; Rauschecker and Tian 2004; Tian andRauschecker 2004; Romanski and Averbeck 2009).
While maps of frequency representation are used exten-sively in experimental animals to gain insights into the organ-ization of auditory cortical fields, obtaining comparable data
in human subjects is quite challenging. Noninvasive methodssuch as functional magnetic resonance imaging (fMRI) andmagnetoencephalography have limitations in their capacity toresolve cortical activity in the time and space dimensions, anddirect recordings can only be obtained in neurosurgicalpatients who require the placement of electrodes as part oftheir clinical treatment plan. Such direct recordings from theposteromedial Heschl’s gyrus (HG), the putative location ofprimary auditory cortex in the human (Hackett et al. 2001),have demonstrated spectral specificity of neuronal responses,but have not examined in detail the spatial extent of orderlyfrequency representations (Howard et al. 1996; Bittermanet al. 2008). fMRI studies have promoted several views con-cerning tonotopicity, with mirror-image representations de-scribed as oriented along the long axis of the HG (Formisanoet al. 2003) or more perpendicular to the HG (Talavage et al.2004; Woods et al. 2009, 2010; Humphries et al. 2010; DaCosta et al. 2011; Striem-Amit et al. 2011; Langers and vanDijk 2012).
The representation of sound frequency in the non-primaryauditory cortex located on posterolateral superior temporal(PLST) gyrus has been even more difficult to define, leadingto contradictory interpretations. Results from fMRI studieshave ranged from an absence of spatially organized tonotopicgradients (Formisano et al. 2003; Lewis et al. 2009; Woodset al. 2009, 2010), to small gradients on the portions of PLST(Talavage et al. 2004; Humphries et al. 2010), to large-scale,mirror-image tonotopic patterns (Striem-Amit et al. 2011).Clarifying this issue is especially important given that thisregion of auditory cortex is crucial for acoustic-to-phonetictransformation of speech (Hickok and Poeppel 2004) andauditory scene analysis (Goll et al. 2010; Schadwinkel andGutschalk 2010, 2011; Shamma and Micheyl 2010; Kashinoand Kondo 2012). In the monkey, tonotopicity-based field de-lineation has contributed to a framework, wherein distinctareas are postulated to preferentially represent sound attri-butes such as location, identity, and relevance for communi-cation (Recanzone et al. 2000; Tian et al. 2001; Rauscheckerand Tian 2004).
Intracranial recordings demonstrate that PLST is responsiveto a wide range of acoustic stimuli, including clicks, tones,and speech (Howard et al. 2000; Crone et al. 2001; Edwardset al. 2005; Chang et al. 2010; Steinschneider et al. 2011;Pasley et al. 2012) and is modulated by attention (Besle et al.2011; Gomez-Ramirez et al. 2011; Mesgarani and Chang2012) and visual input (Reale et al. 2007). Limited under-standing of how PLST is organized hampers the developmentof conceptual frameworks for clarifying how these diverse
© The Author 2012. Published by Oxford University Press. All rights reserved.For Permissions, please e-mail: [email protected]
Cerebral Cortex February 2014;24:340–352doi:10.1093/cercor/bhs314Advance Access publication October 9, 2012
at University of Iow
a Libraries/Serials A
cquisitions on January 15, 2014http://cercor.oxfordjournals.org/
Dow
nloaded from

sounds are represented in the auditory cortex. To better un-derstand how this acoustically responsive region of the cortexmay relate to multifield models of the human auditory cortex,it is important to determine how basic spectral acoustic infor-mation is represented within PLST. The results of earlierhuman intracranial and fMRI studies demonstrate that PLSTresponds robustly to acoustically complex stimuli, includingspeech. Less is known about how this region of cortex re-sponds to less spectrally complex stimuli, such as pure tones,and whether patterns of basic functional organization can bediscerned based on responses to these stimuli (Obleser et al.2007; Chang et al. 2010; Leaver and Rauschecker 2010;Steinschneider et al. 2011; Pasley et al. 2012).
In this report, we present our findings from experimentsperformed to study how pure-tone stimuli are representedwithin PLST, both across cortical space and time. Recordingswere obtained from electrode arrays implanted in neurosurgi-cal patients. We demonstrate that PLST cortical responsescontain stimulus frequency-specific information, which changesover time and is largely unaffected by sound intensity.
Materials and Methods
SubjectsExperimental subjects were 13 neurosurgical patients (7 male, 6 female,age 20–56 years old, median age 33 years old). The subjects had beendiagnosed with medically refractory epilepsy and were undergoingchronic invasive electrocorticography (ECoG) monitoring to identifypotentially resectable seizure foci. Research protocols were approvedby the University of Iowa Institutional Review Board and by the Na-tional Institutes of Health. Written informed consent was obtained fromeach subject. Participation in the research protocol did not interferewith acquisition of clinically required data. Subjects could rescindconsent at any time without interrupting their clinical evaluation.
The patients initially remained on their antiepileptic medications,but were typically weaned from these drugs during the monitoringperiod at the direction of the patients’ treating neurologists. Exper-imental sessions were suspended for at least 3 h if a seizure occurred.Further, the patient had to be alert and willing to participate for theresearch activities to resume.
Eleven subjects had left-hemispheric language dominance, as de-termined by intracarotid amytal (Wada) test results; subject L162 hadbilateral, and R139 had right language dominance. In 6 subjects, theelectrodes were implanted on the left side, while in 7 others record-ings were from the right hemisphere. The side of implantation is indi-cated by the letter prefix of the subject code (L for left and R forright). The hemisphere of recording was language dominant in 8 sub-jects (L130, L138, R139, L146, L151, L162, and L178) and nondomi-nant in 6 subjects (R136, R142, R153, R175, R180, and R186).
All subjects underwent audiometric and neuropsychological evalu-ation before the study, and none were found to have hearing or cogni-tive deficits that could impact the findings presented in this study(median full-scale intelligence quotient = 97, range 77–115). All subjectswere native English speakers. Intracranial recordings revealed that theauditory cortical areas on the STG were not epileptic foci in any of thesubjects.
Experiments were carried out in a dedicated electrically shieldedsuite in The University of Iowa General Clinical Research Center. Theroom was quiet, with lights dimmed. Subjects were awake and reclin-ing in a hospital bed or an armchair. Stimuli were presented in apassive-listening paradigm, without any task direction. Typically, a re-cording session was 10–20 min in duration. After each recordingsession, conversation with the subject ensued to confirm their awakestate and willingness to continue with another experimental protocol.
Stimulus PresentationExperimental stimuli were tones presented at 6 frequencies between250 and 8 kHz in 1-octave steps (300 ms duration, 5-ms rise–fall time,2-s interstimulus interval). An interleaved presentation paradigm wasused, where the 6 tones were presented 50 times each in a randomorder. The stimuli were presented at a comfortable level, approxi-mately 50 dB above hearing threshold. This paradigm was used in allsubjects except R175. In subject L162, this experiment was repeated 4times with the stimuli presented at 4 different intensities (26, 41, 56,and 71 dB SPL).
In 4 subjects (R175, L178, R180, and R186), an additional, ex-tended stimulus set was also used to examine the degree in whichresponse patterns were influenced by stimulus intensities. In this set,12 tone frequencies between 250 and 8 kHz were presented at 6different levels (11–61 dB SPL) in 10 dB steps in a random interleavedsequence. Tone duration, rise-fall time, and interstimulus interval inthis set were 200 ms, 5 ms, and 1.2 s, respectively. Each stimulus waspresented 24 times. In subject R175, only this extended stimulus setwas presented. Because of the limited number of trials (24) at anygiven intensity, we pooled together trials corresponding to the 2highest tone intensities (51 and 61 dB SPL) for each of the 6 frequen-cies used in the main experimental set for classification analysis (seebelow).
Stimuli were delivered via insert earphones (ER4B, Etymotic Re-search, Elk Grove Village, IL, United States of America) that were inte-grated into custom-fit earmolds. Stimulus delivery and dataacquisition were controlled by a TDT RX5 or RZ2 real-time processor(Tucker-Davis Technologies, Alachua, FL, United States of America)with a sampling rate of 24 414 Hz.
Response RecordingDetails of electrode implantation have been described previously (re-viewed in Howard et al. 2012). In brief, ECoG data were recordedfrom multicontact subdural grid electrodes (AdTech, Racine, WI,United States of America) placed over the perisylvian cortex. The re-cording arrays consisted of platinum–iridium disc electrodes (2.3 mmdiameter, 5-mm interelectrode distance), embedded in a silicon mem-brane. The electrodes were arranged in an 8 × 12 grid, yielding a3.5 × 5.5 cm array of 96 contacts. A subgaleal contact was used as areference. Electrode grids were placed solely on the basis of clinicalrequirements and were part of a more extensive set of recordingarrays meant to identify seizure foci. Consequently, the number ofauditory-responsive recording sites varied across subjects. Recordingelectrodes remained in place for a period ranging from 7 to 28 days(median 14 days) under the direction of the patients’ treating neurol-ogists. The ECoG data were amplified, filtered (0.7–800 Hz bandpass,12 dB/octave rolloff), digitized at a sampling rate of 2034.5 Hz, andstored for subsequent offline analysis.
Subjects underwent whole-brain high-resolution T1-weighted struc-tural MRI (resolution 0.78 × 0.78 mm, slice thickness 1.0 mm, 2volumes for averaging) scans before electrode implantation to locaterecording contacts. Averaging 2 volumes improved the signal-to-noiseratio of the MRI data sets and minimized the effects of movement arti-fact on image quality. Preimplantation MRIs and postimplantationthin-sliced volumetric computed tomography (CT) scans (resolution0.51 × 0.51 mm, slice thickness 1.0 mm) were coregistered using a3-dimensional rigid fusion algorithm (Analyze version 8.1 software,Mayo Clinic, MN, United States of America). Coordinates for each elec-trode contact obtained from postimplantation CT volumes were trans-ferred to preimplantation MRI volumes. Results were compared withintraoperative photographs to ensure reconstruction accuracy.
Data AnalysisECoG data obtained from each recording site were downsampled to arate of 1000 Hz and analyzed in the time–frequency plane asevent-related band power (ERBP). Prior to the calculation of ERBP,individual trials were screened for possible contamination from elec-trical interference, epileptiform spikes, high-amplitude slow-waveactivity, or movement artifacts. To that end, individual trial waveforms
Cerebral Cortex February 2014, V 24 N 2 341
at University of Iow
a Libraries/Serials A
cquisitions on January 15, 2014http://cercor.oxfordjournals.org/
Dow
nloaded from

with voltage peaks or troughs greater than 2.5 standard deviationsfrom the mean of the 50 stimulus presentations were rejected fromfurther analysis. To minimize contamination with power-line noise,ECoG waveforms were notch-filtered at 60 Hz (10th order ChebyshevType II filter, stopband 58–62 Hz, stopband ripple 2 dB down fromthe peak passband value). Data analysis was performed using customsoftware written in MATLAB Version 7.12.0 programming environ-ment (MathWorks, Natick, MA, United States of America).
Time–frequency analysis of the ECoG was performed usingwavelet transforms based on complex Morlet wavelets following theapproach of Oya et al. (2002). Center frequencies ranged from 20 to200 Hz in 5 Hz increments. ERBP was calculated for each frequencyon a trial-by-trial basis and normalized to median baseline power,measured using wavelets centered between 200 and 100 ms prior tothe stimulus onset. ERBP values were then log-transformed and aver-aged across trials.
Quantitative analysis focused on the high gamma ECoG frequencyband, which has been shown to be a sensitive and specific indicatorof auditory cortical activation (Crone et al. 2001; Brugge et al. 2009;Edwards et al. 2009; Steinschneider et al. 2008, 2011; Mesgaraniand Chang 2012; Pasley et al. 2012). High gamma band was definedin the present study as the range of center frequencies between 75and 150 Hz.
ERBP changes were first averaged within the following 3 bands:75–90, 95–115, and 125–150 Hz, followed by averaging across the 3bands. The purpose of binning together 5-Hz wide frequency bandsinto these larger bands was to avoid the over-contribution that thehighest frequencies (125–150 Hz) would have if the 5-Hz wide bandswere simply averaged together across the entire range of interest.
The wavelet constant ratio used for time–frequency analysis wasdefined as f0/σf = 9, where f0 is the center frequency of the wavelet,and σf is its standard deviation in frequency. For f0 = 75 Hz, thisyielded a wavelet with a standard deviation in the frequency of 8.33Hz and in the time of 19.1 ms. The wavelet with f0 = 150 Hz wascharacterized by a standard deviation in frequency and time of 16.7Hz and 9.55 ms, respectively. Contribution of energy from the poststi-mulus onset interval to the estimate of baseline power—the “edgeeffect”—was negligible for the range of center frequencies thatcorresponded to the high gamma frequency band.
For display purposes, average high gamma ERBP changes inresponse to a given tone frequency within a given 50-ms wide timebin across all 8 × 12 grid contacts were smoothed using triangle-basedcubic interpolation with an upsampling factor of 16 to produce corti-cal activation maps.
Average ERBP values were calculated for each recording sitewithin 50-ms time windows with a 50% overlap, from 100 ms beforestimulus onset to 725 ms after stimulus onset. Statistical significanceof changes in responses from the baseline were determined viapaired t-tests comparing average ERBP values within each timewindow versus that within an equal duration reference interval span-ning 175–125 ms before stimulus onset. Correction for multiplecomparisons was done by controlling the false discovery rate follow-ing the method of Benjamini and Hochberg (1995) and Benjaminiet al. (2001) (q < 0.01).
Activation patterns across the 8 × 12 recording grid in each subjectwere analyzed using multivariate pattern analysis, whereby record-ings from all recording contacts are provided to a classifier on asingle-trial basis. The classifier was trained to discriminate the fre-quency of each pure-tone stimulus based on the brain responses re-corded simultaneously from all contacts. The performance of thetrained classifier in discriminating the frequency of pure-tone stimuliof unknown frequency provided an objective measure of the presenceof stimulus-specific information in the aggregate brain response.
A sparse binomial logistic regression model was used as a baseclassification algorithm. Both l1 and l2 norm regularization wereimposed on the weights during parameter estimation. As a result, thisalgorithm had advantages in the preservation of sparsity and corre-lated features. We used component-wise updating procedure(Shevade and Keerthi 2003; Cawley and Talbot 2005, 2006; Krishna-puram et al. 2005; Ryali et al. 2010). The classifier was applied to thedata in a pairwise fashion (one vs. one scheme), and code words
were assigned to each class based on the classifier outputs usingerror-correcting output coding (Dietterich and Bakiri 1995). Decodingwas done by computing Hamming distances (Allwein et al. 2001)between the coding matrix, M = (−1, 0, 1), and the code words fromthe classifier’s output for each trial. The trials were assigned to theclass which had the shortest Hamming distance to its correspondingrow within the coding matrix, M.
The classification algorithm was applied for each time window toinvestigate the time course of the tone frequency discriminationpattern of the responses. Only contacts that had an average ERBP ofat least 0.5 dB above baseline levels were selected for classificationanalysis. This thresholding procedure effectively reduced the numberof features for the classification while avoiding potential over-fitting.Input to the classification algorithm was therefore a matrix of single-trial ERBP values for each contact and a time window, normalized interms of its column mean and variance, and the vectors that assignedthe class labels for each trial. The 2 regularization parameters (for l1and l2 norm) were set by a grid in a common logarithmic scale tooptimize its cross-validated classification accuracy.
Classification performance was assessed as a 5-fold cross-validatedtone frequency identification accuracy. Average absolute values ofweights adjusted for the accuracy of the final model (cross-validated)were calculated (overall weights; W) to as a measure of the overallcontribution for the discriminative pattern formation provided byeach recording site:
W ¼ KðK � 1Þ2
X
1�i�K ; iþ1�j�K
Ai;j jwi;j j
where Ai,j is the classification accuracy between classes i and j, and Kis the number of classes. Classification confusion matrices and pair-wise classification results were also generated and presented.
The effects of stimulus level on tone-elicited cortical activity wereexamined as frequency–intensity receptive fields that characterizedindividual recording sites. This was done by plotting high gammaERBP values, averaged within 50-ms time intervals, as functions ofstimulus frequency and intensity. In addition, classification analysis ofsingle-trial responses to the 6 frequencies used in the main exper-imental set was done for data subsets containing responses to pairs ofadjacent tone intensities and responses pooled across all intensities(except the lowest, 11 dB SPL).
Results
General Response PropertiesRobust gamma-band responses were elicited in PLST in a tonefrequency-specific manner. This enhanced activity, maximalin the high gamma range (75–150 Hz), is exemplified bytone-elicited responses recorded from a subdural grid in oneof the subjects (Fig. 1). The presentation level in this case was46 dB SPL. The recording grid covered PLST with extensiononto the middle temporal gyrus (Fig. 1A). Examples ofresponses to low- and high-frequency tones (0.5 and 4 kHz,respectively) from 2 contacts on PLST are shown in Figure 1B.At contact X, the 0.5 kHz tone elicited the largest response,whereas at contact Y, the largest responses were elicited bythe 2 highest frequencies (4 and 8 kHz). Typically, highgamma ERBP elicited by tone stimuli had onset latencies ofabout 50 ms and reached its maximum between 100 and 200ms. This timing is similar to that observed for responses eli-cited by speech sounds (Steinschneider et al. 2011).
Tone-elicited responses recorded from lateral surface gridswere confined almost exclusively to PLST and typically wereobserved in close proximity to the transverse temporal sulcus(TTS). In Figure 1C, ERBP measured in the high gamma
342 Spectral Organization of Human Auditory Cortex • Nourski et al.
at University of Iow
a Libraries/Serials A
cquisitions on January 15, 2014http://cercor.oxfordjournals.org/
Dow
nloaded from

frequency range is depicted for all 96 recording contacts andcolor-coded for the tone frequency of stimulation. Only stat-istically significant increases above the baseline levels areplotted. In this example, ERBP was averaged over the timeinterval of 100–150 ms after stimulus onset. Maximal activityoccurred within circumscribed areas of PLST located immedi-ately adjacent to the TTS. Responses were also observed at asmall number of recording sites located more anteriorly alongthe STG.
Individual sites typically exhibited broadly tuned frequencyselectivity at suprathreshold stimulus levels with frequencyresponse areas often spanning several octaves (Fig. 1C). Thisbroad tuning seen at individual sites could be the result of lowspatial specificity inherent to low impedance subdural contactsrecording ECoG. However, marked differences in tuning oc-curred at the adjacent recording sites, indicating spatial resol-ution better than the 5-mm interelectrode distances.
Frequency–Intensity Receptive FieldsTo determine if frequency tuning becomes more specific atlower intensities, frequency–intensity receptive fields acrossthe entire recording grid in 5 subjects were examined. Clini-cally, feasible durations of experimental sessions placed alimit on the number of tone frequencies that could be pre-sented and on the number of stimulus presentations for eachfrequency–intensity combination. For instance, tone frequen-cies above 8 kHz were not examined. It was reasoned thatstimuli with frequencies above this range are less importantfor human communication (Gelfand 1998), and therefore ofsomewhat less interest than frequencies within the range ofspeech. These limits preclude quantitatively accurate esti-mates of tuning properties such as tuning width at thresholdand at suprathreshold intensities. Instead, qualitatively accu-rate properties of tuning typically observed are described.
Magnitude and bandwidth of excitatory responses recordedfrom individual cortical sites typically increased with stimulusintensity. Figure 2 presents a representative data set obtainedfrom 1 subject (R180; grid placement shown in Fig. 2A).Shown is the time interval (125–175 ms) determined by classi-fication analysis as providing the peak performance for tonediscrimination (see below). The increase in magnitude andbandwidth of excitatory responses can be observed in the fre-quency–intensity receptive fields that characterized 2 repre-sentative recording sites, X and Y (Fig. 2B).
At site X, maximal activation occurred at 4 kHz and was in-variant to changes in stimulus intensity. However, as intensityincreased, a progressive broadening of activation developed
Figure 1. Tone-elicited responses recorded from the lateral STG in a representativesubject (R153). (A) Location of the 96-contact subdural electrode grid (TTS:transverse temporal sulcus; SF: Sylvian fissure; STG: superior temporal gyrus; STS:superior temporal sulcus; MTG: middle temporal gyrus). X and Y denote the locationsof 2 sites those detailed response properties are shown in panel B. (B) Time–frequency analysis of cortical activity elicited by pure-tone stimuli between 0.25 and8 kHz (top to bottom), recorded from 2 sites on the STG (left and right panels).Stimulus schematic is shown on top. ERBP was calculated relative to baseline powermeasured in the reference period between 100 and 200 ms prior to stimulus onset.(C) High gamma ERBP in response to tone stimuli presented at different frequencies(color bars), simultaneously recorded from the 96-contact grid (individual plots). Highgamma band (75–150 Hz) ERBP was averaged within the time window of 100–150ms after stimulus onset.
Cerebral Cortex February 2014, V 24 N 2 343
at University of Iow
a Libraries/Serials A
cquisitions on January 15, 2014http://cercor.oxfordjournals.org/
Dow
nloaded from

for low frequencies. The absence of tone stimulation above 8kHz precludes determining whether this response broadeningwould have occurred at higher tone frequencies. Regardless,this pattern was observed in multiple subjects and at manysites that were maximally responsive to high frequencies atlow intensities.
A completely different frequency–intensity receptive fieldalso commonly observed is exemplified by the responsepattern shown at site Y. Here, responses at the lowest stimulusintensity were confined to the midrange frequencies (1.6 kHz)and also became more responsive to low-frequency tones athigher stimulus intensities. In contrast to the receptive fieldseen at the site X, maximal excitation was not invariant to in-tensity and instead was characterized by a downward shift inthe tone frequencies that evoked the largest magnitude ERBPresponses as stimulus intensity increased.
Other shapes of frequency–intensity receptive fields ob-served include those referred to as “mixed multipeaked”(Sutter 2000), a pattern characterized by broad and complexpeaks of activation across frequencies and intensities.“Circumscribed” response patterns (Sutter 2000), character-ized by tuning to selective frequencies at a selective range ofsubmaximal stimulus intensities, were not observed. Overall,there was considerable variability in response patterns as afunction of stimulus intensity (Fig. 2C), and this finding wascharacteristic of all 5 subjects, in whom frequency–intensityreceptive fields were examined.
To ensure replicability of the activation patterns that charac-terized responses to pure-tone stimuli, response distributionselicited by a set of tones presented at 66 dB SPL in a separateexperimental session were performed 2 days later (Fig. 2D).Consistent with the activation pattern obtained from the moreextensive data set shown in Figure 2C, the region immediatelyposterior to the TTS remained maximally responsive to lowfrequencies, while ERBP preferentially elicited by high-frequency tones remained distributed anterior and posteriorto this region.
Spatiotemporal OrganizationSpectral specificity of PLST responses was temporallydynamic and was greatest at earlier portions of the neuralresponses. In these earlier time periods, an orderly spatialrepresentation of tone frequency along PLST could often beobserved (Fig. 3; subject R153, 50–100, 100–150 ms afterstimulus onset). High gamma ERBP elicited by low-frequencystimuli was maximal immediately ventral to the TTS (Fig. 3A,left-hand columns). As tone frequency increased, maximalactivity occurred at sites more anterior and posterior to thoselocations maximally excited by low-frequency tones. Highertone frequencies failed to elicit significant responses at re-cording sites maximally activated by low frequencies, yieldingmirror-image patterns of spectral specificity (Fig. 3B). Anadditional region maximally activated by low-frequency toneswas observed at an even more anterior location, though limit-ations of grid coverage precluded more detailed mapping ofthis area.
While an orderly representation of tone frequency could bediscerned in some cases (Figs 2D and 3B), spatial patterns ex-hibited significant variability across subjects. In the majorityof subjects, clear mirror-image patterns were not observed,
Figure 2. Frequency tuning properties of PLST in a representative subject (R180).(A) Location of the 96-contact subdural electrode grid (TTS: transverse temporalsulcus; SF: Sylvian fissure; STG: superior temporal gyrus; STS: superior temporalsulcus; MTG: middle temporal gyrus). X and Y denote the locations of 2 sites thosedetailed response properties are shown in panel B. (B) Examples of frequency–intensity receptive fields for 2 sites in a representative subject. (C) Frequency–intensity receptive fields across the entire recording grid. Sulcal patterns are indicatedby gray lines. (D) 50th, 75th, and 95th percentile contours of cortical responses totones of 5 frequencies presented at 66 dB SPL. Sulcal patterns are shown by graylines. Results shown in panels (B–D) are based on the analysis of ERBP averagedwithin 125–175 ms after stimulus onset.
344 Spectral Organization of Human Auditory Cortex • Nourski et al.
at University of Iow
a Libraries/Serials A
cquisitions on January 15, 2014http://cercor.oxfordjournals.org/
Dow
nloaded from
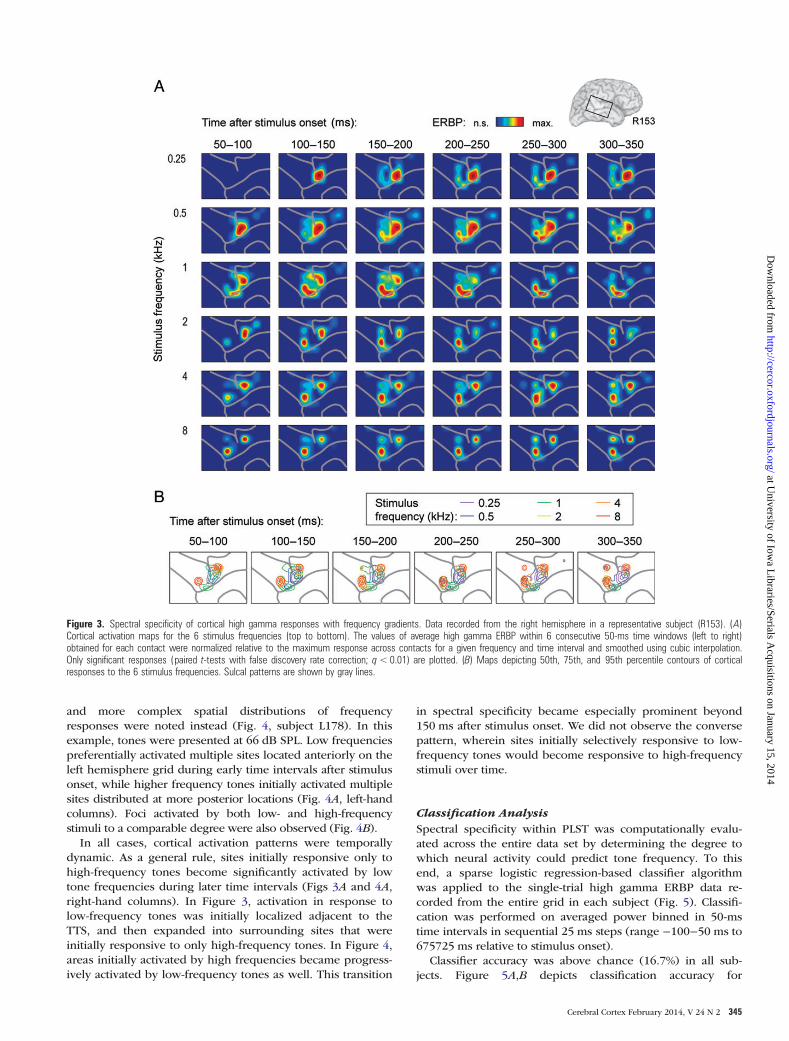
and more complex spatial distributions of frequencyresponses were noted instead (Fig. 4, subject L178). In thisexample, tones were presented at 66 dB SPL. Low frequenciespreferentially activated multiple sites located anteriorly on theleft hemisphere grid during early time intervals after stimulusonset, while higher frequency tones initially activated multiplesites distributed at more posterior locations (Fig. 4A, left-handcolumns). Foci activated by both low- and high-frequencystimuli to a comparable degree were also observed (Fig. 4B).
In all cases, cortical activation patterns were temporallydynamic. As a general rule, sites initially responsive only tohigh-frequency tones become significantly activated by lowtone frequencies during later time intervals (Figs 3A and 4A,right-hand columns). In Figure 3, activation in response tolow-frequency tones was initially localized adjacent to theTTS, and then expanded into surrounding sites that wereinitially responsive to only high-frequency tones. In Figure 4,areas initially activated by high frequencies became progress-ively activated by low-frequency tones as well. This transition
in spectral specificity became especially prominent beyond150 ms after stimulus onset. We did not observe the conversepattern, wherein sites initially selectively responsive to low-frequency tones would become responsive to high-frequencystimuli over time.
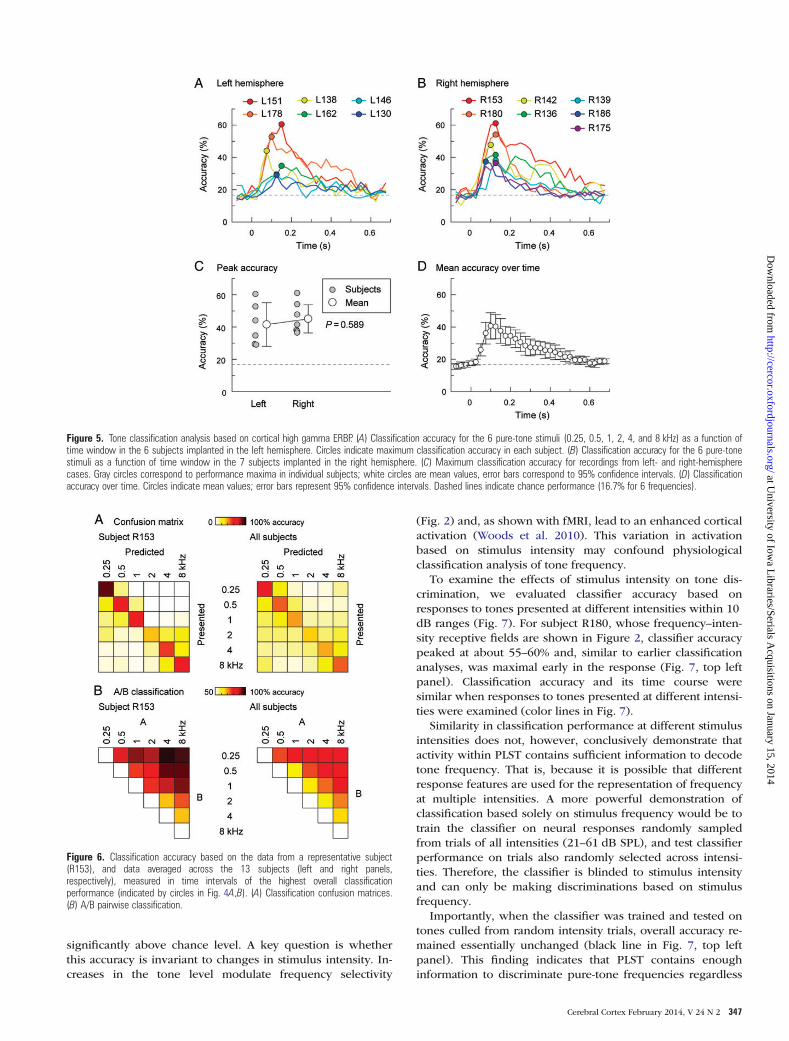
Classification AnalysisSpectral specificity within PLST was computationally evalu-ated across the entire data set by determining the degree towhich neural activity could predict tone frequency. To thisend, a sparse logistic regression-based classifier algorithmwas applied to the single-trial high gamma ERBP data re-corded from the entire grid in each subject (Fig. 5). Classifi-cation was performed on averaged power binned in 50-mstime intervals in sequential 25 ms steps (range −100−50 ms to675725 ms relative to stimulus onset).
Classifier accuracy was above chance (16.7%) in all sub-jects. Figure 5A,B depicts classification accuracy for
Figure 3. Spectral specificity of cortical high gamma responses with frequency gradients. Data recorded from the right hemisphere in a representative subject (R153). (A)Cortical activation maps for the 6 stimulus frequencies (top to bottom). The values of average high gamma ERBP within 6 consecutive 50-ms time windows (left to right)obtained for each contact were normalized relative to the maximum response across contacts for a given frequency and time interval and smoothed using cubic interpolation.Only significant responses (paired t-tests with false discovery rate correction; q<0.01) are plotted. (B) Maps depicting 50th, 75th, and 95th percentile contours of corticalresponses to the 6 stimulus frequencies. Sulcal patterns are shown by gray lines.
Cerebral Cortex February 2014, V 24 N 2 345
at University of Iow
a Libraries/Serials A
cquisitions on January 15, 2014http://cercor.oxfordjournals.org/
Dow
nloaded from

discrimination between the 6 tone stimuli as a function oftime interval for the left-hemispheric and right-hemisphericsubjects, respectively. Maximum accuracy (indicated by circlesin Fig. 5A,B) could reach over 60% and occurred early in theresponses in all subjects. It was most commonly observed inthe 100–150-ms time interval, with a subsequent decay in per-formance. Both mirror-image and clustered organizationalpatterns (see examples for subjects R153 and L178 in Figs 3and 4, respectively) could exhibit comparable accuracy intone discrimination by classification analysis.
As left and right hemispheres have been proposed to differ-entially process temporal and spectral information (e.g.Zatorre et al. 2002; Zatorre and Gandour 2008), we comparedpeak accuracies between the 2 hemispheres. No significantdifference was observed across hemispheres (t(11) = −0.556,P = 0.589 2-tailed; Fig. 4C). Mean peak discrimination accu-racy across all 13 subjects was 43.5% (95% confidence interval37.0–50.1%) and was significantly greater than chance (1sample t(12) = 8.926, P < 0.000005 1-tailed). To ensure thatoverall trends were not driven by several subjects with thehighest classification performance, the mean accuracy and
95% confidence intervals were calculated across subjects(Fig. 5D). Averaged across subjects, performance was abovechance beginning at the 25–75-ms interval, peaked at 75–125ms, and then slowly decayed to the chance levels at 575–625ms after stimulus onset.
Classification errors were not randomly distributed and ty-pically occurred between tones of adjacent frequencies. Thisis demonstrated by confusion and pairwise classificationmatrices for an exemplary subject (R153; Fig. 6, left column)and for the entire data set (Fig. 6, right column). Whenstimuli were misclassified, predicted stimuli were typicallythe next nearest neighbors in frequency to the presentedtone (Fig. 6A). Likewise, pairwise classification results demon-strate greatest accuracy between those stimuli that were pro-gressively more dissimilar in frequency (Fig. 6B). Thus, thesefindings are consistent with spectrally specific activationpatterns.
Classification Accuracy Across Stimulus IntensitiesResults indicate that ERBP recorded from PLST contains suffi-cient information to discriminate tone frequencies
Figure 4. Spectral specificity of cortical high gamma responses without frequency gradients. Data recorded from the left hemisphere in a representative subject (L178). Seelegend of Figure 2 for details.
346 Spectral Organization of Human Auditory Cortex • Nourski et al.
at University of Iow
a Libraries/Serials A
cquisitions on January 15, 2014http://cercor.oxfordjournals.org/
Dow
nloaded from
significantly above chance level. A key question is whetherthis accuracy is invariant to changes in stimulus intensity. In-creases in the tone level modulate frequency selectivity
(Fig. 2) and, as shown with fMRI, lead to an enhanced corticalactivation (Woods et al. 2010). This variation in activationbased on stimulus intensity may confound physiologicalclassification analysis of tone frequency.
To examine the effects of stimulus intensity on tone dis-crimination, we evaluated classifier accuracy based onresponses to tones presented at different intensities within 10dB ranges (Fig. 7). For subject R180, whose frequency–inten-sity receptive fields are shown in Figure 2, classifier accuracypeaked at about 55–60% and, similar to earlier classificationanalyses, was maximal early in the response (Fig. 7, top leftpanel). Classification accuracy and its time course weresimilar when responses to tones presented at different intensi-ties were examined (color lines in Fig. 7).
Similarity in classification performance at different stimulusintensities does not, however, conclusively demonstrate thatactivity within PLST contains sufficient information to decodetone frequency. That is, because it is possible that differentresponse features are used for the representation of frequencyat multiple intensities. A more powerful demonstration ofclassification based solely on stimulus frequency would be totrain the classifier on neural responses randomly sampledfrom trials of all intensities (21–61 dB SPL), and test classifierperformance on trials also randomly selected across intensi-ties. Therefore, the classifier is blinded to stimulus intensityand can only be making discriminations based on stimulusfrequency.
Importantly, when the classifier was trained and tested ontones culled from random intensity trials, overall accuracy re-mained essentially unchanged (black line in Fig. 7, top leftpanel). This finding indicates that PLST contains enoughinformation to discriminate pure-tone frequencies regardless
Figure 5. Tone classification analysis based on cortical high gamma ERBP. (A) Classification accuracy for the 6 pure-tone stimuli (0.25, 0.5, 1, 2, 4, and 8 kHz) as a function oftime window in the 6 subjects implanted in the left hemisphere. Circles indicate maximum classification accuracy in each subject. (B) Classification accuracy for the 6 pure-tonestimuli as a function of time window in the 7 subjects implanted in the right hemisphere. (C) Maximum classification accuracy for recordings from left- and right-hemispherecases. Gray circles correspond to performance maxima in individual subjects; white circles are mean values, error bars correspond to 95% confidence intervals. (D) Classificationaccuracy over time. Circles indicate mean values; error bars represent 95% confidence intervals. Dashed lines indicate chance performance (16.7% for 6 frequencies).
Figure 6. Classification accuracy based on the data from a representative subject(R153), and data averaged across the 13 subjects (left and right panels,respectively), measured in time intervals of the highest overall classificationperformance (indicated by circles in Fig. 4A,B). (A) Classification confusion matrices.(B) A/B pairwise classification.
Cerebral Cortex February 2014, V 24 N 2 347
at University of Iow
a Libraries/Serials A
cquisitions on January 15, 2014http://cercor.oxfordjournals.org/
Dow
nloaded from

of intensity. Further, detailed examination showed that re-cording sites that contributed most to the performance of theclassifier in this test (as determined by classifier weights)were typically those that demonstrated maximal excitationby a specific frequency across stimulus intensities (data notshown).
Both confusion and pairwise classification matrices contin-ued to show that errors were not random and were mostlikely to occur to the next nearest neighbor in frequency(Fig. 7, inset). While performance was not as optimal as thatshown for subject R180 in other subjects examined using thisparadigm (Fig. 7, bottom row), they all showed above-chanceperformance when tone frequencies were collapsed across in-tensities (P < 0.05, 1-sided Wilcoxon signed-rank test). Meanpeak discrimination accuracy was 37.1%, with a 95% confi-dence interval of 24.3–50.0% (chance = 16.7%). Responses ex-hibited the greatest specificity in the early time intervalsfollowing tone onset. Averaged across the 5 subjects over time,classifier performance peaked at 100–150 ms interval. Thus,although the spectral sensitivity of responses recorded fromindividual brain sites varied as a function of stimulus intensity,there is sufficient information in the responses distributedacross PLST to enable the classifier to identify spectral infor-mation in a manner that is largely insensitive to differences instimulus intensity.
Discussion
Summary of FindingsThis study demonstrates that auditory cortex overlying thePLST is strongly activated by pure-tone stimuli and that acti-vation patterns vary as a function of stimulus frequency. Thisactivation occurs along a restricted portion of PLST, adjacentto the TTS. While responses at individual sites exhibit fre-quency selectivity, they are typically broadly tuned at supra-threshold levels. In several subjects, spatial organization of
frequency selectivity demonstrated a tonotopic pattern withmirror-image gradients centered on a low-frequency respon-sive region. As a rule, however, spectral organization is rep-resented by clustered response patterns, wherein low- andhigh-frequency tones maximally activate different siteswithout clear spatially patterned frequency gradients. Regard-less of the specific spatial pattern, classification analysis con-sistently yields above-chance performance, indicating thatactivity along PLST contains information that is sufficient todifferentiate the pure tones that were presented in theseexperiments. Errors in classifier performance are most com-monly biased toward a next nearest neighbor to the presentedtone. Maximum accuracy is typically achieved at around 100–150 ms after stimulus onset and gradually declines. Thebroadening of spectral specificity over time occurs as regionsinitially responsive to a narrow range of frequencies becomeactivated by a broader range of tones. This feature is particu-larly prominent for sites initially selectively activated by high-frequency tones. Classifier performance is largely unaffectedby changes in stimulus intensity over a 40 dB range, and weobserved no significant difference between classificationresults in left-sided and right-sided PLST recordings.
Tuning Characteristics of PLSTA major advantage of examining high gamma activity in theECoG is its positive correlations with both spiking activity andhemodynamic responses (Nir et al. 2007; Steinschneider et al.2008; Whittingstall and Logothetis 2009). This enables highgamma activity measurements to serve as a bridge betweendifferent research techniques and facilitates comparisonsacross studies performed using different methodological ap-proaches. Although it is difficult to extrapolate tuning charac-teristics as measured by high gamma ECoG activity to thoseobtained from single units, the broad tuning on PLST is incontrast to sharper tuning observed in the primary auditorycortex of humans estimated from single-unit recordings(Howard et al. 1996; Bitterman et al. 2008). Our results also
Figure 7. Frequency discrimination accuracy across stimulus intensities. Classification accuracy for the 6 pure-tone stimuli (0.25, 0.5, 1, 2, 5.04, and 8 kHz) is plotted as afunction of time window for trials presented at different intensities. Circles indicate maximum classification accuracy for each intensity condition. Data from 5 subjects areshown. Inset: Classification confusion matrix (left) and pairwise classification accuracy (right) for stimulus intensities between 21 and 61 dB SPL in subject R180 for the timeinterval of peak classification performance (75–125 ms after stimulus onset).
348 Spectral Organization of Human Auditory Cortex • Nourski et al.
at University of Iow
a Libraries/Serials A
cquisitions on January 15, 2014http://cercor.oxfordjournals.org/
Dow
nloaded from

differ from the sharp tuning identified using similar ECoGmeasures in the monkey primary auditory cortex (Broschet al. 2002; Steinschneider et al. 2008). On the other hand,the current finding is in concordance with more complex andbroadly tuned responses observed in lateral nonprimary areasusing similar ECoG measures in humans (Pasley et al. 2012)and single-unit responses in nonhuman primates (Recanzoneet al. 2000; Rauschecker and Tian 2004).
Common to PLST were tuning curves characterized byresponses restricted to higher frequencies at low intensitiesand a broadening of excitation at higher intensities (e.g.Fig. 2, site X). This property is typical of many tuning curvesseen in the primary auditory cortex of nonhuman primatesand cats (e.g. Recanzone et al. 2000; Sutter 2000). Futurework with frequencies beyond 8 kHz will be required to moreaccurately characterize the shape of frequency–intensityreceptive fields and to determine whether the broadeningof excitation is symmetric or asymmetric around the bestfrequency.
An additional common shape observed at sites on PLSTwas characterized by a shift in tuning specificity toward lowerfrequencies at higher intensities (e.g. Fig. 2, site Y). Thisshape resembles the “slant-lower” tuning curve profile de-scribed in single-unit recordings in A1 in the anesthetized cat(Sutter 2000). Similar patterns have been reported from corefields A1 and R, and caudomedial belt field CM in the awakemacaque (cf. Figs 4 and 7 in Recanzone et al. 2000). Anotherfrequency–intensity receptive field shape commonly observedwas characterized by multiple peaks of spectral sensitivity atboth lower and higher intensities. This mixed multipeakedpattern is uncommon in A1 (Sutter 2000). Our protocol wasnot designed to test whether multiple peaks observed inthese cases were harmonically related based upon limitednumber of tone frequencies tested. Finally, the circumscribedpattern, commonly observed in the primate primary auditorycortex (Sadagopan and Wang 2010), was not seen in our dataset.
Relationship to Functional Neuroimaging StudiesPrevious attempts to characterize the spectral response prop-erties of PLST using fMRI have led to contradictory results.Our findings are incompatible with the conclusion that PLSTdoes not respond differentially to pure tones of different fre-quencies (Formisano et al. 2003; Lewis et al. 2009). In otherstudies, the spectral organization of PLST was examined as acomponent of a larger analysis focusing on frequency selectiv-ity within the superior temporal plane (Talavage et al. 2004;Humphries et al. 2010). Both studies observed a smallanterior-to-posterior gradient of frequency sensitivity fromhigh to low frequencies, respectively. These observations mayreflect a portion of the mirror-image gradients occasionallyobserved in the present study. Another study (Woods et al.2010) has identified frequency selectivity on PLST that mightrepresent a functional imaging analog of the more generalorganizational principles identified in the current electro-physiological study; individual sites were frequency selectivebut there was no obvious spatial pattern correlating frequencyselectivity with location along PLST. Our findings did notconfirm the dorsal-to-ventral spatial orientation of tonotopicpatterns on the lateral STG reported by Striem-Amit et al.(2011) using fMRI mapping techniques.
The present study using direct intracranial recordingmethods identified several organizational features that shouldbe considered when interpreting the findings from fMRIstudies.
First, the manner in which spectral information is rep-resented in the brain responses recorded from different PLSTsites changes rapidly over time following stimulus onset. Ex-isting fMRI techniques cannot resolve the changing activationpatterns with this degree of temporal resolution, and thelikely result is a spectral “blurring” of blood oxygen level-dependent (BOLD) signal responses. The BOLD signal there-fore may not capture the spectral sensitivity of the earliestportion of the neural response. Secondly, we did not identifya single spatially organized, spectrally specific, responsepattern that could characterize all subjects. This would con-found the interpretation of fMRI studies trying to identify aunified organizational scheme. Thirdly, variations in tone se-lectivity based on the stimulus level (particularly at the loudlevels typically utilized in fMRI paradigms), stimulation para-digm (e.g. pure-tone vs. frequency sweep stimuli, continuousvs. sparse acquisition), and background environment canpotentially obscure underlying organization. All these factorsmay have contributed to the differences between the currentdata and those obtained using fMRI.
Relationship to Multifield Models of Auditory CortexOrganizationOne purpose of the current experiments was to provideadditional insights into what role the PLST cortex may play inmultifield models of human auditory cortex functional organ-ization. These models reflect concepts derived from extensiveexperimental work carried out in nonhuman primates that de-monstrate the existence of multiple hierarchically organizedauditory fields distributed within core, belt, and parabelt cor-tical regions (Kaas and Hackett 1998). Cytoarchitectonicstudies of the human auditory cortex offer different interpret-ations for the place of PLST within the hierarchy of auditorycortical fields. Some studies interpret it as a belt area (Gala-burda and Sanides 1980; Fullerton and Pandya 2007), others(e.g. Rivier and Clarke 1997) refer to it as a “downstream”
association cortex (i.e. parabelt), while Sweet et al. (2005) donot include it in the core–belt–parabelt model altogether. Ananalysis of the anatomical studies of human auditory cortexconcluded that no clear designation of PLST could be madebased on current evidence (Hackett 2007).
In the setting of experimental animal research, individualfields are defined by the combinations of field-specific fea-tures, including gross anatomical location, cytoarchitectonics,spatial orientation relative to other fields, connectivity pat-terns, and functional properties of the populations of neuronsdistributed throughout a field. Limitations inherent to humansubject research preclude using the exact same powerfulexperimental methods to precisely define and compare audi-tory field homologies across primate species. It is possible,however, to make certain inferences based on experimentalevidence that can be safely collected in humans. In referenceto PLST, we know from earlier work that the functional prop-erties of this cortical region differ markedly from the proper-ties of core auditory cortex located on posterior-medial HG(Howard et al. 2000; Brugge et al. 2008). These studies leadto the conclusion that area PLST is comprised of noncore
Cerebral Cortex February 2014, V 24 N 2 349
at University of Iow
a Libraries/Serials A
cquisitions on January 15, 2014http://cercor.oxfordjournals.org/
Dow
nloaded from
auditory cortex positioned lateral to the known core cortex.Because grid recording arrays are not placed on the superiortemporal plane within the Sylvian fissure, it is not technicallyfeasible to create fine spatial grain maps of the expanse ofplanum temporale cortex located between known core cortex(posteromedial HG) and PLST. This precludes directlymapping any boundaries that may exist within the planumtemporale demarcating transitions between core, belt, andpossibly parabelt fields.
Another criterion—functional connectivity between audi-tory fields—cannot be directly extrapolated from experimentalanimal studies that were performed using histological tracttracing methods. In human subjects, electrical stimulationtract tracing methods have been used to show that shortlatency functional connections exist between posterior-medialHG (core cortex) and sites within PLST (Brugge et al. 2003).However, this method is not capable of resolving whether theobserved functional connection represents the activation ofmono- or polysynaptic pathways.
The current finding in some subjects of a mirror-image to-notopic pattern of frequency representation within PLST inresponse to pure-tone stimuli is similar to the patterns ob-served in the nonhuman primate lateral belt cortex(Rauschecker and Tian 2004). For the reasons describedabove, there is insufficient experimental information to defini-tively assign field homology. However, the current obser-vations of robust, spectrally selective responses to pure-tonestimuli within a circumscribed region of the lateral cortex,combined with earlier findings of short latency functionalconnections with core cortex are consistent with PLST occu-pying a relatively early stage in hierarchical models of themultifield processing of auditory information.
Ongoing studies address these issues by combining preo-perative fMRI mapping with direct intracranial recordings inthe same subjects. By determining relationships betweenBOLD signal changes and direct electrophysiological record-ings, and making use of the unrestricted spatial samplingcapacity of MRI techniques, a combined approach has thepotential to enhance our ability to define human auditorycortex fields and their boundaries (Chevillet et al. 2011). Thepresence and topographic patterns of pure-tone responses re-corded from PLST will be a key physiological feature, facilitat-ing the reliable identification of specific auditory fields inindividual subjects.
Spatiotemporal Representation of FrequencyThe cortical spatial patterns of frequency representationwithin PLST change as a function of the time period examinedfollowing stimulus onset. Recordings from individual brainsites show that the greatest degree of spectral selectivity is dis-played during the initial portions of the response. Later in theresponse, stimuli with a broader range of frequencies evokeincreases in gamma-band power. This pattern of changingspectral specificity within cortical sites over time may reflectintegrative cortical processes that are also engaged whenhumans hear more spectrally complex acoustic stimuli, suchas vowels containing multiple formants. Additional exper-imental studies designed specifically to investigate this inte-grative process, and its relevance to speech sound processing,are underway.
Psychophysical studies demonstrate that, as tone intensitydecreases, difference limens increase (Wier et al. 1977). Fromthese perceptual studies, one might expect concordant phys-iological changes in brain activation patterns. We found thatclassification performance was stable over a 40-dB range ofstimulus intensities. However, difference limens are muchsmaller than the spectral separations of the tones used in thisstudy. Therefore, we would be unable to identify the under-lying physiological correlates of intensity-related changes indifference limens with the paradigm used in this study.
Left- Versus Right-Hemispheric ProcessingThere was no significant difference in classifier performancebetween left- and right-sided PLST subjects. This suggests thathigh gamma activity evoked within PLST in the 2 hemi-spheres contains the comparable levels of information aboutthe frequency of the pure-tone stimuli that were delivered.This finding is compatible with current models of auditorycortical processing positing that PLST on both hemispheres isinvolved in acoustic-to-phonetic transformations (Poeppelet al. 2008; Hickok 2009). This model stipulates that bothhemispheres support accurate representation of the spectro-temporal attributes of the acoustic signal (Pasley et al. 2012).The bilateral representation of tone frequency informationwithin PLST is consistent with this model. It has also beenhypothesized that nonprimary auditory cortex on the lefthemisphere plays a specialized role in the processing ofacoustic stimulus features contained within shorter timeepochs (e.g. speech formant transitions), whereas the sameregions on the right hemisphere are preferentially involved inthe processing of slower spectral features (e.g. those charac-terizing vowels and speech prosody; Poeppel 2001; Zatorreand Belin 2001; Zatorre et al. 2002; Boemio et al. 2005;Zatorre and Gandour 2008). The acoustic stimuli used in thecurrent experiments were not designed to examine the typeof hemispheric asymmetry in temporal sampling posited bythis theory. Future work using electrophysiological measureswill be required to assess whether differences in hemisphericprocessing at the level of PLST can be identified.
Intersubject VariabilityData obtained from individual subjects exhibited variability inspatial patterns of tone-elicited responses and in results ob-tained from classification analysis. There are many potentialexplanations for this variability, including differences in corti-cal anatomy across subjects and the locations of electrodes inindividual subjects. For example, anatomically defined PLSTis in direct continuity with the cortex of the superior temporalplane, a brain region from which recordings were not ob-tained. It is possible that a specific nonprimary auditory corti-cal field that is present on PLST in some subjects is confinedto the immediately adjacent superior temporal cortex in othersubjects. In this case, if an auditory field is tonotopically orga-nized, surface recording arrays would only detect the tonoto-pic pattern in subjects with the field located on PLST.
Classification accuracy of pure-tone stimuli varied widelyacross subjects, with maximum performance ranging fromabout 30% to 60%. Another potential source of variability wasthe type of classification analysis employed in the study.Here, we made use of high gamma ERBP values measuredwithin discrete time bins. Future studies using alternative
350 Spectral Organization of Human Auditory Cortex • Nourski et al.
at University of Iow
a Libraries/Serials A
cquisitions on January 15, 2014http://cercor.oxfordjournals.org/
Dow
nloaded from

approaches, such as methods incorporating temporally dis-tributed high gamma activity (e.g. Pasley et al. 2012) or lowerfrequency evoked components of the ECoG (e.g. Chang et al.2010), may enhance accurate decoding of stimulus frequencyand provide additional insights into the functional organiz-ation of PLST.
Another important consideration is subject attention, whichis known to influence cortical processing within nonprimaryauditory cortex (Mesgarani and Chang 2012). This variable isnot optimally controlled during passive listening, and exper-iments specifically designed to address this issue are ongoing.Also, the current experiments were performed in neurosurgi-cal patients with medically intractable epilepsy. Auditorycortex may be dysfunctional to varying degrees in thesepatients (Boatman and Miglioretti 2005), and antiepilepticmedications may also affect the brain functions being studied.Although there are many possible etiologies for the observedintersubject variability, these would not explain the stronglypositive findings that we consistently observed across sub-jects. Finally, although no significant correlation was foundbetween classification accuracy and verbal comprehensionindex scores, the variability of spatial response patterns andclassification accuracy may also be related to differences inauditory processing skills that we did not test.
Funding
This work was supported by the NIH (grant numbers R01-DC04290, R01-DC00657, UL1RR024979), Hearing Health Foun-dation (Collette Ramsey Baker Award), and the Hoover Fund.
NotesWe thank John Brugge, Richard Reale, Olaf Kaufman, ChristopherKovach, Haiming Chen, and Rachel Gold for help with experimentdesign, data collection, and analysis. Conflict of Interest : Nonedeclared.
ReferencesAitkin LM, Webster WR. 1971. Tonotopic organization in the medial
geniculate body of the cat. Brain Res. 26:402–405.Allwein E, Schapire R, Singer Y. 2001. Reducing multiclass to binary:
a unifying approach for margin classifiers. J Mach Learn Res.1:113–141.
Benjamini Y, Drai D, Elmer G, Kafkari N, Golani I. 2001. Controllingthe false discovery rate in behavior genetics research. Behav BrainRes. 125:279–284.
Benjamini Y, Hochberg Y. 1995. Controlling the false discovery rate: apractical and powerful approach to multiple testing. J R Stat Soc B.57:289–300.
Besle J, Schevon CA, Mehta AD, Lakatos P, Goodman RR, McKhannGM, Emerson RG, Schroeder CE. 2011. Tuning of the human neo-cortex to the temporal dynamics of attended events. J Neurosci.31:3176–3185.
Bitterman Y, Mukamel R, Malach R, Fried I, Nelken I. 2008. Ultra-finefrequency tuning revealed in single neurons of human auditorycortex. Nature. 451:197–201.
Boatman DF, Miglioretti DL. 2005. Cortical sites critical for speech dis-crimination in normal and impaired listeners. J Neurosci.25:5475–5480.
Boemio A, Fromm S, Braun A, Poeppel D. 2005. Hierarchical andasymmetric temporal sensitivity in human auditory cortices. NatNeurosci. 8:389–395.
Brosch M, Budinger E, Scheich H. 2002. Stimulus-related gamma oscil-lations in primate auditory cortex. J Neurophysiol. 87:2715–2725.
Brugge JF, Nourski KV, Oya H, Reale RA, Kawasaki H, SteinschneiderM, Howard MA III. 2009. Coding of repetitive transients by audi-tory cortex on Heschl’s gyrus. J Neurophysiol. 102:2358–2374.
Brugge JF, Volkov IO, Garell PC, Reale RA, Howard MA III. 2003.Functional connections between auditory cortex on Heschl’s gyrusand on the lateral superior temporal gyrus in humans. J Neurophy-siol. 90:3750–3763.
Brugge JF, Volkov IO, Oya H, Kawasaki H, Reale RA, Fenoy A,Steinschneider M, Howard MA III. 2008. Functional localization ofauditory cortical fields of human: click-train stimulation. Hear Res.238:12–24.
Cawley GC, Talbot NLC. 2005. The evidence framework applied tosparse kernel logistic regression. Neurocomputing. 64:119–135.
Cawley GC, Talbot NL. 2006. Gene selection in cancer classificationusing sparse logistic regression with Bayesian regularization.Bioinformatics. 22:2348–2355.
Chang EF, Rieger JW, Johnson K, Berger MS, Barbaro NM, Knight RT.2010. Categorical speech representation in human superiortemporal gyrus. Nat Neurosci. 13:1428–1432.
Chevillet M, Riesenhuber M, Rauschecker JP. 2011. Functional corre-lates of the anterolateral processing hierarchy in human auditorycortex. J Neurosci. 31:9345–9352.
Crone NE, Boatman D, Gordon B, Hao L. 2001. Induced electrocorti-cographic gamma activity during auditory perception. Clin Neuro-physiol. 112:565–582.
Da Costa S, van der Zwaag W, Marques JP, Frackowiak RS, Clarke S,Saenz M. 2011. Human primary auditory cortex follows the shapeof Heschl’s gyrus. J Neurosci. 31:14067–14075.
Dietterich TJ, Bakiri G. 1995. Solving multiclass learning problems viaerror-correcting output codes. J Artif Intell Res. 2:263–286.
Edwards E, Soltani M, Deouell LY, Berger MS, Knight RT. 2005. Highgamma activity in response to deviant auditory stimuli recordeddirectly from human cortex. J Neurophysiol. 94:4269–4280.
Edwards E, Soltani M, Kim W, Dalal SS, Nagarajan SS, Berger MS,Knight RT. 2009. Comparison of time–frequency responses andthe event-related potential to auditory speech stimuli in humancortex. J Neurophysiol. 102:377–386.
Formisano E, Kim DS, Di Salle F, van de Moortele PF, Ugurbil K,Goebel R. 2003. Mirror-symmetric tonotopic maps in humanprimary auditory cortex. Neuron. 40:859–869.
Fullerton BC, Pandya DN. 2007. Architectonic analysis of theauditory-related areas of the superior temporal region in humanbrain. J Comp Neurol. 504:470–498.
Galaburda A, Sanides F. 1980. Cytoarchitectonic organization of thehuman auditory cortex. J Comp Neurol. 190:597–610.
Gelfand SA. 1998. Hearing: an introduction to psychological andphysiological acoustics. 3rd ed. New York (NY): Marcel Dekker.
Goll JC, Crutch SJ, Warren JD. 2010. Central auditory disorders:toward a neuropsychology of auditory objects. Curr Opin Neurol.23:617–627.
Gomez-Ramirez M, Kelly SP, Molholm S, Sehatpour P, Schwartz TH,Foxe JJ. 2011. Oscillatory sensory selection mechanisms during in-tersensory attention to rhythmic auditory and visual inputs: a humanelectrocorticographic investigation. J Neurosci. 31:18556–18567.
Hackett TA. 2007. Organization and correspondence of the auditorycortex of humans and nonhuman primates. In: Kaas JH, editor.Evolution of the nervous system. Oxford, UK: Elsevier. p. 109–119.
Hackett TA, Preuss TM, Kaas JH. 2001. Architectonic identification ofthe core region in auditory cortex of macaques, chimpanzees, andhumans. J Comp Neurol. 441:197–222.
Hickok G. 2009. The functional neuroanatomy of language. Phys LifeRev. 6:121–143.
Hickok G, Poeppel D. 2004. Dorsal and ventral streams: a frameworkfor understanding aspects of the functional anatomy of language.Cognition. 92:67–99.
Howard MA, Nourski KV, Brugge JF. 2012. Invasive researchmethods. In: Fay RR, Popper AN, editors. Springer handbook ofauditory research—human auditory cortex. New York (NY):Springer Science. p. 39–67.
Howard MA III, Volkov IO, Abbas PJ, Damasio H, Ollendieck MC,Granner MA. 1996. A chronic microelectrode investigation of the
Cerebral Cortex February 2014, V 24 N 2 351
at University of Iow
a Libraries/Serials A
cquisitions on January 15, 2014http://cercor.oxfordjournals.org/
Dow
nloaded from

tonotopic organization of human auditory cortex. Brain Res.724:260–264.
Howard MA, Volkov IO, Mirsky R, Garell PC, Noh MD, Granner M,Damasio H, Steinschneider M, Reale RA, Hind JE et al. 2000.Auditory cortex on the human posterior superior temporal gyrus.J Comp Neurol. 416:79–92.
Humphries C, Liebenthal E, Binder JR. 2010. Tonotopic organizationof human auditory cortex. Neuroimage. 50:1202–1211.
Kaas JH, Hackett TA. 1998. Subdivisions of auditory cortex and levelsof processing in primates. Audiol Neurootol. 3:73–85.
Kaas JH, Hackett TA, Tramo MJ. 1999. Auditory processing in primatecerebral cortex. Curr Opin Neurobiol. 9:164–170.
Kashino M, Kondo HM. 2012. Functional brain networks underlyingperceptual switching: auditory streaming and verbal transform-ations. Philos Trans R Soc Lond B Biol Sci. 367:977–987.
Krishnapuram B, Carin L, Figueiredo MA, Hartemink AJ. 2005. Sparsemultinomial logistic regression: fast algorithms and generalizationbounds. IEEE Trans Pattern Anal Mach Intell. 27:957–968.
Langers DR, van Dijk P. 2012. Mapping the tonotopic organization inhuman auditory cortex with minimally salient acoustic stimulation.Cereb Cortex. 22:2024–2038.
Leaver AM, Rauschecker JP. 2010. Cortical representation of naturalcomplex sounds: effects of acoustic features and auditory objectcategory. J Neurosci. 30:7604–7612.
Lewis JW, Talkington WJ, Walker NA, Spirou GA, Jajosky A, Frum C,Brefczynski-Lewis JA. 2009. Human cortical organization forprocessing vocalizations indicates representation of harmonicstructure as a signal attribute. J Neurosci. 29:2283–2296.
Merzenich MM, Brugge JF. 1973. Representation of the cochlear par-tition of the superior temporal plane of the macaque monkey.Brain Res. 50:275–296.
Mesgarani N, Chang EF. 2012. Selective cortical representation ofattended speaker in multi-talker speech perception. Nature.485:233–236.
Morel A, Garraghty PE, Kaas JH. 1993. Tonotopic organization, archi-tectonic fields, and connections of auditory cortex in macaquemonkeys. J Comp Neurol. 335:437–459.
Nir Y, Fisch L, Mukamel R, Gelbard-Sagiv H, Arieli A, Fried I, MalachR. 2007. Coupling between neuronal firing rate, gamma LFP, andBOLD fMRI is related to interneuronal correlations. Curr Biol.17:1275–1285.
Obleser J, Zimmermann J, Van Meter J, Rauschecker JP. 2007.Multiple stages of auditory speech perception reflected inevent-related fMRI. Cereb Cortex. 17:2251–2257.
Oya H, Kawasaki H, Howard MA III, Adolphs R. 2002. Electro-physiological responses in the human amygdala discriminateemotion categories of complex visual stimuli. J Neurosci.22:9502–9512.
Pasley BN, David SV, Mesgarani N, Flinker A, Shamma SA, Crone NE,Knight RT, Chang EF. 2012. Reconstructing speech from humanauditory cortex. PLoS Biol. 10:e1001251.
Poeppel D. 2001. Pure word deafness and the bilateral processing ofthe speech code. Cogn Sci. 25:679–693.
Poeppel D, Idsardi WJ, van Wassenhove V. 2008. Speech perceptionat the interface of neurobiology and linguistics. Philos Trans R SocLond B Biol Sci. 363:1071–1086.
Rauschecker JP, Tian B. 2004. Processing of band-passed noise in thelateral auditory belt cortex of the rhesus monkey. J Neurophysiol.91:2578–2589.
Reale RA, Calvert GA, Thesen T, Jenison RL, Kawasaki H, Oya H,Howard MA, Brugge JF. 2007. Auditory-visual processing rep-resented in the human superior temporal gyrus. Neuroscience.145:162–184.
Recanzone GH, Guard DC, Phan ML. 2000. Frequency and intensityresponse properties of single neurons in the auditory cortex of thebehaving macaque monkey. J Neurophysiol. 83:2315–2331.
Rivier F, Clarke S. 1997. Cytochrome oxidase, acetylcholinesterase,and NADPH-diaphorase staining in human supratemporal andinsular cortex: evidence for multiple auditory areas. Neuroimage.6:288–304.
Romanski LM, Averbeck BB. 2009. The primate cortical auditorysystem and neural representation of conspecific vocalizations.Annu Rev Neurosci. 32:315–346.
Rose JE, Greenwood DD, Goldberg JM, Hind JE. 1963. Some dis-charge characteristics of single neurons in the inferior colliculus ofthe cat I: tonotopic organization, relation of spike-counts to toneintensity and firing patterns of single elements. J Neurophysiol.26:294–320.
Ryali S, Supekar K, Abrams DA, Menon V. 2010. Sparse logisticregression for whole-brain classification of fMRI data. Neuro-image. 51:752–764.
Sadagopan S, Wang X. 2010. Contribution of inhibition to stimulusselectivity in primary auditory cortex of awake primates. J Neuro-sci. 30:7314–7325.
Schadwinkel S, Gutschalk A. 2010. Activity associated with streamsegregation in human auditory cortex is similar for spatial andpitch cues. Cereb Cortex. 20:2863–2873.
Schadwinkel S, Gutschalk A. 2011. Transient BOLD activity locked toperceptual reversals of auditory streaming in human auditorycortex and inferior colliculus. J Neurophysiol. 105:1977–1983.
Shamma SA, Micheyl C. 2010. Behind the scenes of auditory percep-tion. Curr Opin Neurobiol. 20:361–366.
Shevade SK, Keerthi SS. 2003. A simple and efficient algorithm forgene selection using sparse logistic regression. Bioinformatics.19:2246–2253.
Steinschneider M, Fishman YI, Arezzo JC. 2008. Spectrotemporal analy-sis of evoked and induced electroencephalographic responses inprimary auditory cortex (A1) of the awake monkey. Cereb Cortex.18:610–625.
Steinschneider M, Nourski KV, Kawasaki H, Oya H, Brugge JF,Howard MA III. 2011. Intracranial study of speech-elicited activityon the human posterolateral superior temporal gyrus. CerebCortex. 21:2332–2347.
Striem-Amit E, Hertz U, Amedi A. 2011. Extensive cochleotopicmapping of human auditory cortical fields obtained withphase-encoding fMRI. PLoS One. 6:e17832.
Sutter ML. 2000. Shapes and level tolerances of frequency tuningcurves in primary auditory cortex: quantitative measures andpopulation codes. J Neurophysiol. 84:1012–25.
Sweet RA, Dorph-Petersen KA, Lewis DA. 2005. Mapping auditorycore, lateral belt, and parabelt cortices in the human superior tem-poral gyrus. J Comp Neurol. 491:270–289.
Talavage TM, Sereno MI, Melcher JR, Ledden PJ, Rosen BR, Dale AM.2004. Tonotopic organization in human auditory cortex revealed byprogressions of frequency sensitivity. J Neurophysiol. 91:1282–1296.
Tian B, Rauschecker JP. 2004. Processing of frequency-modulatedsounds in the lateral auditory belt cortex of the rhesus monkey.J Neurophysiol. 92:2993–3013.
Tian B, Reser D, Durham A, Kustov A, Rauschecker JP. 2001. Func-tional specialization in rhesus monkey auditory cortex. Science.292:290–293.
Whittingstall K, Logothetis NK. 2009. Frequency-band coupling insurface EEG reflects spiking activity in monkey visual cortex.Neuron. 64:281–289.
Wier CC, Jesteadt W, Green DM. 1977. Frequency discrimination as afunction of frequency and sensation level. J Acoust Soc Am.61:178–184.
Woods DL, Herron TJ, Cate AD, Yund EW, Stecker GC, Rinne T, KangX. 2010. Functional properties of human auditory cortical fields.Front Syst Neurosci. 3:155.
Woods DL, Stecker GC, Rinne T, Herron TJ, Cate AD, Yund EW, LiaoI, Kang X. 2009. Functional maps of human auditory cortex:effects of acoustic features and attention. PLoS One. 4:e5183.
Zatorre RJ, Belin P. 2001. Spectral and temporal processing in humanauditory cortex. Cereb Cortex. 11:946–953.
Zatorre RJ, Belin P, Penhune VB. 2002. Structure and function of audi-tory cortex: music and speech. Trends Cogn Sci. 6:37–46.
Zatorre RJ, Gandour JT. 2008. Neural specializations for speech andpitch: moving beyond the dichotomies. Philos Trans R Soc Lond BBiol Sci. 363:1087–1104.
352 Spectral Organization of Human Auditory Cortex • Nourski et al.
at University of Iow
a Libraries/Serials A
cquisitions on January 15, 2014http://cercor.oxfordjournals.org/
Dow
nloaded from