Embed Size (px)
Citation preview

University of Central Florida
2012
eHVAC: Wireless Modular Multi-Zone HVAC
Controller Group B Javier Arias Ryan Kastovich Genaro Moore
Michael Trampler

i
Table of Contents Section 1: Executive Summary ............................................................................. 1
Section 2: Project Description ............................................................................... 3
2.1 Project Motivation and Goals ...................................................................... 3 2.2 Objectives ................................................................................................... 4 2.3 Project Requirements and Specifications .................................................... 4
2.4 Division of Labor.......................................................................................... 5
Section 3: Research ............................................................................................. 8
3.1 Research Methods ...................................................................................... 8 3.2 Main Control Unit (MCU) ............................................................................. 9
3.2.1 System Control Module ......................................................................... 9
3.2.1.1 Safety Controls ............................................................................. 10 3.2.1.2 Real Time Clock (RTC) ................................................................. 12 3.2.1.3 Heat Pump Control ....................................................................... 13 3.2.1.4 Fan Control ................................................................................... 15
3.2.1.5 Vent Control .................................................................................. 16
3.2.2 System UI & Intelligence Module ........................................................ 19
3.2.2.1 Operating System ......................................................................... 20 3.2.2.2 HTTP Server ................................................................................. 21
3.2.2.3 Common Gateway Interface (CGI) ............................................... 22 3.2.2.4 Database (DB) .............................................................................. 23 3.2.2.5 Beyond Hardware: The Cloud & The Google App Engine Platform .................................................................................................................. 25
3.2.2.6 Python Vs. Java Vs. C .................................................................. 26 3.2.2.7 MVC Framework: How it all comes together ................................. 28
3.2.2.7.1 Comparison of MVC Frameworks ........................................... 29
3.2.3 Comparison of System Modules ......................................................... 31
3.2.3.1 Comparison of System Control Modules ...................................... 31
3.2.3.2 Comparison of System UI & Intelligence Solutions ....................... 33
3.2.4 System Control and System UI & Intelligence Interface ...................... 35 3.2.5 Interfacing the MCU with the RSM(s) .................................................. 38 3.2.6 Interfacing with the outside world (LAN + Internet) ............................. 41
3.3 Power ........................................................................................................ 43
3.3.1 System Control ................................................................................... 43 3.3.2 Remote Sensing Module ..................................................................... 43
3.4 Thermostat (Remote Sensor Module - RSM) ............................................ 46
3.4.1 Functions ............................................................................................ 47
3.4.1.1 Temperature measurement .......................................................... 47 3.4.1.2 CO2 Monitoring ............................................................................. 49 3.4.1.3 VOC Monitoring ............................................................................ 51

ii
3.4.1.4 Humidity Monitoring ...................................................................... 52
3.4.1.5 Zone Control ................................................................................. 55
3.4.2 Hardware ............................................................................................ 56
3.4.2.1 Microcontroller Hardware .............................................................. 56 3.4.2.2 Input/ Output Hardware................................................................. 57
Section 4: Design Specifications ........................................................................ 59
4.1 System UI & Intelligence ........................................................................... 59
4.1.1 Software .............................................................................................. 59
4.1.1.1 Platform ........................................................................................ 59 4.1.1.2 Programming Language ............................................................... 60 4.1.1.3 MVC Framework ........................................................................... 61
4.1.1.4 Database Structure ....................................................................... 61
4.1.2 Web Application Layout ...................................................................... 65 4.1.3 Web Application Variable Definitions .................................................. 74
4.2 Main Control Unit/ System Control ............................................................ 79
4.2.1 Hardware ............................................................................................ 79
4.2.1.1 System Control Module Microcontroller & Communications ......... 79
4.2.1.2 Damper Control ............................................................................ 81 4.2.1.3 Fan Control ................................................................................... 82 4.2.1.4 Compressor Control ...................................................................... 83
4.2.1.5 Power............................................................................................ 84
4.2.2 Software .............................................................................................. 84
4.2.2.1 Damper Control ............................................................................ 84
4.2.2.2 Heat Pump Control ....................................................................... 86 4.2.2.3 Fan Control ................................................................................... 87 4.2.2.4 Safety Sensors ............................................................................. 88
4.2.3 RSM Interface ..................................................................................... 88
4.2.4 Web Application Interface ................................................................... 89 4.3.1 Hardware ............................................................................................ 89
4.3.1.1 Input/ Output ................................................................................. 89 4.3.1.2 Physical Dimensions ..................................................................... 91 4.3.1.3 Power Supply ................................................................................ 93 4.3.1.4 Sensor Schematic ......................................................................... 93
4.3.1.5 Micro Controller Schematic ........................................................... 94 4.3.1.6 Wireless Hardware ....................................................................... 95
4.3.2 Software .............................................................................................. 97
4.3.2.1 Sensor Subroutine ........................................................................ 98
4.3.2.2 Wireless TX Subroutine .............................................................. 100 4.3.2.3 Wireless RX Subroutine .............................................................. 103 4.3.2.4 Input Subroutine ......................................................................... 105
4.3.2.5 Display Subroutine ...................................................................... 106
iii
Section 5: Prototyping ...................................................................................... 110
5.1 Thermostat Prototyping ........................................................................... 110 5.2 System UI & Intelligence Prototyping ...................................................... 111 5.3 System Control Prototyping ..................................................................... 112
Section 6: Testing ............................................................................................. 114
6.1 Testing Criteria ........................................................................................ 114 6.2 Remote Sensor Module Testing .............................................................. 115
6.2.1 Human-Machine Interface Testing .................................................... 115 6.2.2 Sensor Testing .................................................................................. 116 6.2.3 Wireless Connectivity ........................................................................ 117
6.3 System UI & Intelligence Module Testing ................................................ 118
6.3.1 Web Application Access .................................................................... 118 6.3.2 Page Links and Settings ................................................................... 119 6.3.3 Temperature and Humidity Readout ................................................. 121
6.3.4 Simultaneous Load ........................................................................... 122 6.3.5 Control Mechanisms ......................................................................... 123
6.3.6 Data Logging ..................................................................................... 125
6.4 System Control Module ........................................................................... 126 6.4.1 Wireless Connectivity ........................................................................... 126 6.4.2 Test Damper Control ............................................................................ 127
Section 7: Administrative Content ..................................................................... 133
7.1 Milestone Discussion ............................................................................... 133
7.2 Finance Discussion ................................................................................. 134
Section 8: Appendices ...................................................................................... 136
Appendix A: Copyright Permissions .............................................................. 136
Appendix B: Datasheets ................................................................................ 141 Appendix C: Extraneous Figures ................................................................... 142
Appendix D: Acronyms .................................................................................. 143 Appendix E: Bibliography .............................................................................. 145

iv
Table of Figures Figure 3.2.1.3-1 Heat Pump Wiring Diagram [42] ............................................... 14
Figure 3.2.2.3-1 CGI block diagram .................................................................... 23 Figure 3.2.2.7-1 MVC Framework ...................................................................... 29 Figure 3.2.4-1 Typical I2C bus implementation .................................................. 37 Figure 3.2.4-2 Typical SPI bus implementation .................................................. 37 Figure 3.2.4-3 Typical UART implementation ..................................................... 38
Figure 3.2.6-1 MCU Network Setup .................................................................... 42 Figure 3.3.2-1 ..................................................................................................... 45 Figure 3.3.2-2 ..................................................................................................... 46 Figure 4.1.1.1-1 Google App Engine Diagram .................................................... 60 Figure 4.1.1.6-1 Database Diagram ................................................................... 65
Figure 4.1.2-1 Use Case Web Application Diagram ........................................... 67
Figure 4.1.2-2 Welcome Screen Layout ............................................................. 68
Figure 4.1.2-3 Password Prompt ........................................................................ 68 Figure 4.1.2-4 Homepage Layout ....................................................................... 69
Figure 4.1.2-5 Zone Page Layout ....................................................................... 70 Figure 4.1.2-6 Schedule Page Layout ................................................................ 71 Figure 4.1.2-7 Graph Page Layout ..................................................................... 72
Figure 4.1.2-8 History Page Layout .................................................................... 73 Figure 4.1.2-9 Settings Page Layout .................................................................. 73
Figure 4.1.3-1 Web Application Variable Definition Diagram .............................. 78 Figure 4.2.1.1-1 LM3S8962 schematic with ethernet. ........................................ 80 Figure 4.2.1.1-2 CC2500 Module for MCU microcontroller ................................. 81
Figure 4.2.1.2-1 Damper Control Schematic ...................................................... 82
Figure 4.2.1.4-1 Heat Pump Control Schematic ................................................. 83 Figure 4.2.1.5-1 Power Supply ........................................................................... 84 Figure 4.2.2.2-1 Heat Pump Programming Flowchart ........................................ 87
Figure 4.3.1.1-1 .................................................................................................. 91 Figure 4.3.1.2-1 .................................................................................................. 92
Figure 4.3.1.3-1 .................................................................................................. 93
Figure 4.3.4.1-1 .................................................................................................. 94 Figure 4.3.1.5-1 .................................................................................................. 95
Figure 4.3.1.6-1 .................................................................................................. 96 Figure 4.3.1.6-2 .................................................................................................. 97 Figure 4.3.2.1-1 ................................................................................................ 100
Figure 4.3.2.2-1 ................................................................................................ 102 Figure 4.3.2.3-1 ................................................................................................ 104
Figure 4.3.2.4-1 ................................................................................................ 105 Figure 4.3.2.4-2 ................................................................................................ 105 Figure 4.3.2.4-3 ................................................................................................ 105 Figure 4.3.2.4-4 ................................................................................................ 106 Figure 4.3.2.5 ................................................................................................... 109
Figure 5.3-1 LM3S8962 Block Diagram ............................................................ 113
v
Table of Tables Table 3.2.2.6-1 Comparing Languages .............................................................. 28
Table 3.2.5-1 General characteristics of TI CC2520 Zigbee® Transceiver [67]. 39 Table 3.2.5-2 General Characteristics of TI CC2500 Transceiver [67]. .............. 40 Table 3.2.5-3 General Characteristics of TI CC1101 Transceiver [67]. .............. 40 Table 7.2-1 MCU Parts ..................................................................................... 134 Table 7.2-2 RSM Parts ..................................................................................... 135

1
Section 1: Executive Summary Today, there are an increasing number of households running HVAC (heating, ventilation, and air-conditioning) control systems 24/7. While many of these systems might be designed to be as efficient as possible, it does not mean that they are smart enough to accommodate the needs of the user(s) in every possible usage scenario combination. For example, not every room in a house needs to be set at the same temperature at all times, especially once everyone has gone to bed. So at night, there are usually no occupants in the kitchen, living room, or dining room which are still being cooled or heated. Then, a multi-zone system was introduced to help fulfill the extra needs of consumers. With this new innovative system, users were given the ability to dictate individual temperatures to different “zones,” whether they be bedrooms and living rooms, or different floors of an office building. The user could control the HVAC to cool and/or heat only the room’s occupied, turning off the zones vacant through installed dampeners to control air flow. To give an example let’s say there are two zones for an HVAC system, if one zone is vacant, then the user could turn one zone off directing all the air flow to the occupied zone which will then be cooled or heated faster. So with this system installed, power consumption will decrease which results in a cut in energy costs. HVAC systems are designed to maintain a desired temperature set point. Unfortunately this system creates a large temperature gradient between the inside of the domicile and the natural weather. As per thermodynamics the larger the temperature gradient between two areas the quicker thermal energy transfers through the substrate which separates them. For example in the summer, the outside temperature can hit +90 degrees Fahrenheit while the set point for most HVAC systems will usually be between 65 and 80 degrees. This causes a large temperature gradient and reduces the effectiveness of the insulation provided by walls and purpose built insulation material. If the temperature gradient were to be reduced to a negligible value then thermal energy would stop flowing into the domicile. Our system’s main goal is to reduce the temperature gradient between the interior of the domicile and the exterior during the hottest part of the day. This will greatly reduce the amount of time the heat pump’s compressor will run which in turn will greatly reduce the energy it consumes. It is generally accepted that the heat pump is one of the largest energy draws in a domicile; therefore reducing its energy draw should be one of the easiest ways to reduce energy waste. To reinforce this projects energy saving applications, here’s another example of how this system will help. On a regular day in typical households worldwide, people have air conditioning units that run throughout the day while no one is home. If consideration is taken on how much energy is being wasted on a vacant house, the reality is that on a yearly basis this amount is astronomical. The advantage of the HVAC system would be the ability to shutdown the main system when no one is home. It would accomplish this task with a host of sensors tied
2
together which would recognize if someone was home, and if by chance they were not, a self-shutdown sequence would initiate. This in itself would save tons of energy and would lower the cost of running a system in a consumer’s home/zone. This system will be designed such that a consumer will be able to utilize the multi-zone controllers all while keeping the power consumption low, as well as being eco-friendly and leaving a small footprint. Although the power consumption will be low, there won’t be any drop off in precision levels, customizability, or aesthetics. Multiple remote sensor modules (RSM) will be implemented so the user will be able to control temperature and humidity in certain zones through an aesthetically pleasing interface. Each RSM will also come with preset modes with which a user can employ to run throughout the day to further decrease power consumption. But if those preset modes do not adequately meet the requirements of the user, he/she will be able to program the RSM to meet his/her own needs. This system will also feature internet connectivity for the convenience of control anywhere there's internet access. The web interface will give the user the control features of an RSM, while the user is away.

3
Section 2: Project Description
2.1 Project Motivation and Goals The reality of the average Americans lifestyle in the 21st century is such that there are large units of time where there is nobody home. With a traditional bimetallic spring thermostat, the air conditioning unit runs throughout the day cooling the house with no inhabitants thus wasting energy. One way people try to save energy is by raising the set point on the thermostat when they are not home; however this is a manual adjustment which must be repeated everyday and due to the fact that this is manual, the thermostat will remain set at the high temperature at which it was set while the person was not home. Due to this, the house is very warm and requires in excess of an hour after the person returns home for it to be cooled to a comfortable level. The motivation of this project stems behind the inefficient and labor intensive qualities of a bimetallic spring thermostat. When researching a standard digital thermostat we found them to be woefully lacking in useful features and capabilities for their users. Thus, the idea came about to create an HVAC Control system that will utilize a sophisticated system that is much more than a simple thermostat. Another large scale issue that drove us to select this project was the lackluster power saving features of a standard digital thermostat. Finally, the cost of a web-enabled intelligent thermostat is so excessive that is becomes prohibitive to the technology. Based on the perceived problems with a standard thermostat system, our group determined that a more efficient, user friendly, and feature rich HVAC Control system needs to be designed. This HVAC control system needs to be a low cost, drop-in replacement for a currently installed system. The controller will be programmable and modular such that it lowers electrical costs through intelligent control of the AC unit and is adaptable to any household environment. As well, the controller will be accessible through the internet. The user will also be able to control the HVAC system through any standard web browser. One of the major goals of our proposed system is to be able to schedule temperature set points in advance so whereas the user would not have to manually set the temperature everyday. Another specialized feature of the system is that the thermostats will monitor more than just temperature. It will be able to monitor humidity, CO2 readings, and the concentration of other various gases. A feature of our proposed system is wireless connectivity between each Remote Sensing Module (Thermostat) and the Main Control Unit for the purpose of allowing the user to interface directly to the main control unit without the need of a separate computer. Finally, the control system will take all data from the Remote Sensing Modules and store them into a web server. The user will be able to view this data in a useful, graphical format.
4
2.2 Objectives The objective of the project at hand is to create a fully functioning HVAC control system that can satisfy the following requirements:
● The capability of the system to connect to the internet. ● This system must have functioning and accurate CO2, temperature, and
Humidity sensors. ● The ability to allow multiple users to connect to the online web server
simultaneously and control multiple zones without issues. ● Zone configurations that will allow for adjusting temperature settings,
regulating monthly/ weekly schedules all while connected to the online GUI.
● The capability of viewing detailed historical reports of the system, power savings charts, current indoor and outdoor temperatures, set point readings, and humidity readings.
● The ability to adjust preset modes to change the power settings to potentially lower power consumption.
● The capability of having wireless connectivity from each Remote Sensing Module to the Main Control unit without the need of a computer.
● The system must be backwards compatible with any standard HVAC system already in place.
● The system should be able to detect any safety hazards internal to the HVAC system and respond accordingly to reduce damage to the system and/ or the user.
● The Thermostats will be able to function as an HMI (Human Machine Interface).
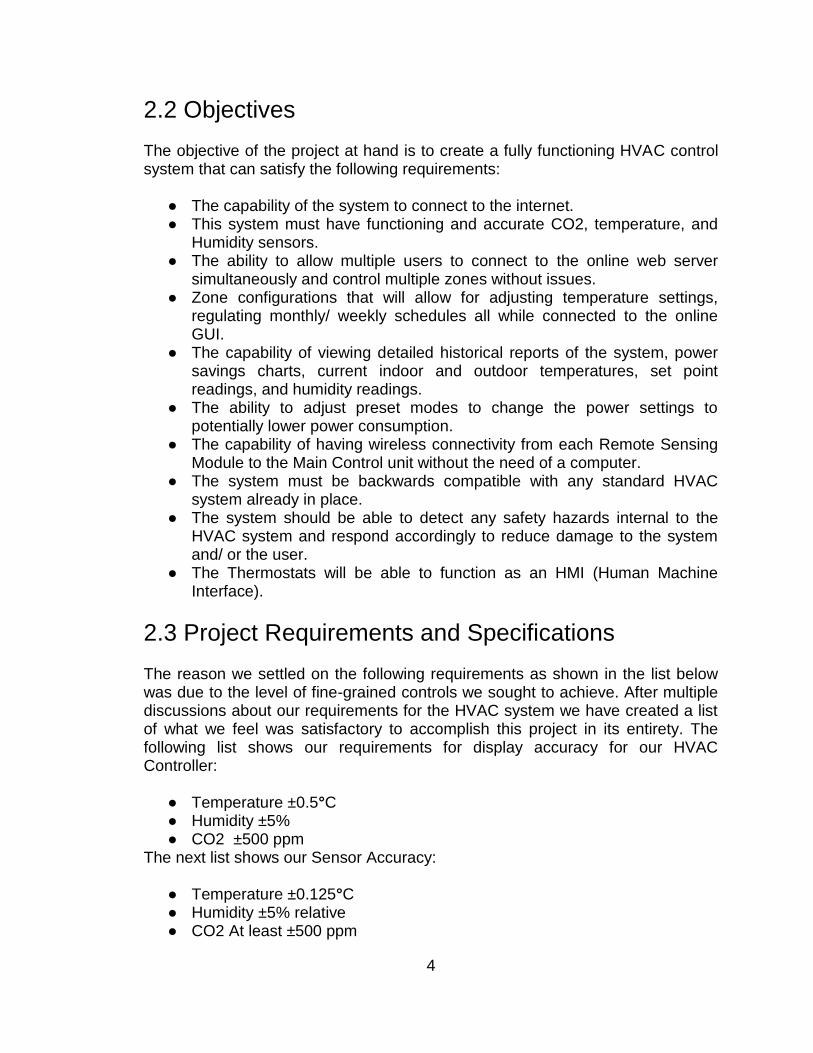
2.3 Project Requirements and Specifications The reason we settled on the following requirements as shown in the list below was due to the level of fine-grained controls we sought to achieve. After multiple discussions about our requirements for the HVAC system we have created a list of what we feel was satisfactory to accomplish this project in its entirety. The following list shows our requirements for display accuracy for our HVAC Controller:
● Temperature ±0.5°C ● Humidity ±5% ● CO2 ±500 ppm
The next list shows our Sensor Accuracy:
● Temperature ±0.125°C ● Humidity ±5% relative ● CO2 At least ±500 ppm

5
● Sampling Rate 0.5Hz
Finally, our requirements for the System accuracy for the HVAC Controller are as follows:
● Temperature ±0.25°C ● Humidity ±5%
As per the above requirements, we have created a list of specifications to satisfy these set requirements. For the Thermostat (RSM) we feel the specifications as follows are appropriate:
● 1 CO2 Sensor with accuracy ±500 ppm ● 1 Humidity Sensor with accuracy ±5% relative ● 1 Temperature Sensor with accuracy ±0.125°C ● Sampling Rate of 0.5Hz ● 1 8/16 Bit Microcontroller ● 1 LCD for displaying temperature and humidity readings ● Operating Temperature Range of 20-50°C ● 1 Rotary Encoder ● 3 Momentary on push button switches ● 2.4 GHz Radio ● I2C, SPI support
For the Main Control Unit the group feels the following specifications are appropriate:
● 2.4Ghz Radio ● Ethernet enabled ● I2C, SPI, UART support ● External Flash Storage Support (i.e. microSD) ● SQL (Structured Query Language) support ● Web Server w/CGI (Common Gateway Interface) ● 1 8/16 Bit Microcontroller ● 1 ARM microprocessor ● Triac components for switching ● Digital-to-Analog Converter (DAC)
2.4 Division of Labor After numerous discussions with the group, we devised a way to distribute the work such that we played to each other’s strengths. For example, all of our group members are Electrical Engineering majors so figuring out who would write the coding aspect of the project became the difficult part. However, through these

6
discussions we feel we managed to find the right people for each integral part of the project. Michael Trampler
● Remote Sensing Module Hardware Design and Software ● RSM User Interface ● Wireless Communications (Shared) ● PCB Design
Michael is an electrical engineer. He has practical experience with HVAC systems and was the main proponent for choosing an HVAC control system for this project. Michael has experience with designing, building and assembling printed circuit boards. He will be in charge of designing the remote sensing module, designing the power boards for both the remote sensing module and the main control unit, and will work in conjunction with Javier to build the wireless communications system. Javier Arias
● Web Server Programming (Shared) ● Database Programming (Shared) ● System Control Interface ● Data Logging (Shared) ● Wireless Communications (Shared) ● System UI & Intelligence Interface
Javier started out as a mechanical engineer, though later switched majors to electrical engineering. He has experience with thick applications and database programming with multiple programming languages. This combined with his acquired knowledge in electrical engineering allows him to switch back and forth between hardware and software in a near effortless manner. Javier will be in charge of designing portions of the Main Control Unit hardware and software. Ryan Kastovich
● Web application Layout Programming ● Database Programming (Shared) ● Data Logging (Shared)
Ryan is also an electrical engineer. Although he initially started out as a computer engineer, he realized that he could not keep up tempo with the high end programming that was required and switched over. However, even though he switched over, it wasn’t before he managed to get some experience in C and Java. Also, he took a class in HTML and CSS coding which was just what we needed when we realized we needed a web application programmer. Ryan will be in charge of creating a graphical user interface and creating a database with Javier for the web application.

7
Genaro Moore ● Damper Control ● Heat Pump Control ● Fan Control ● Safety Sensors
Genaro is an electrical engineer but started as an undeclared student when he first got here. He was always interested in electronics and signal communications due to his passion for music. He has some experience in designing circuits and hardware from classes so his part of the project played to his strengths. Genaro will be in charge of controlling the dampers, the fan in the air handler, the heat pump, and ensuring the system has a checks and balances system to keep it working correctly.

8
Section 3: Research
3.1 Research Methods Throughout the spring semester, the group met once week to discuss and plan for the modular HVAC system. We discussed we wanted to accomplish with this project and how we were going to reach the goals. First we laid out exactly what parts and features the project needed to have, then decided on what extra components we wanted to add. Once we had decided on all of that, we divided up the workload amongst the four of us. After that the group started their individual research efforts to better understand the project as a whole and the individual components. The bulk of the research was done via the Internet searching Google for websites on HVAC design and control. The internet was also used to find resources on the software aspects of the project such as the web page design, the communication of the web application to microcontrollers, and how to host a web server. We also looked at previous senior design project that are HVAC related to better understand exactly what is being asked of us as far as the senior design project guidelines. The older projects helped us gauge what will be and will not be feasible in the two semester time period and gave the group some insight on where to begin and what they can improve. Besides using the Internet and Google for resources, the UCF Library also proved its worth by having very helpful books on HVAC fundamentals and design. These books helped with the understanding of the many different components in an HVAC system which will be needed in order to control these components. Some classes and workshops were available on campus to aid the group in many different aspects in the scope of the project. The group attended a professional workshop hosted by Texas Instruments to learn how to use their microcontrollers. The group gained valuable information from this workshop as well as free microcontrollers for themselves to develop and prototype on and into the future. Cadsoft hosted another workshop on campus where the group learned about their PCB design software Eagle. Cadsoft also informed them how the group could populate their board using this software. This will be helpful, obviously for design the PCB for the system later down the road. A few of the group mates attended a series of coding classes to learn the Python coding language. In addition to these extra classes, some classes in the groups required coursework served quite useful when brainstorming about the design. Electronics II, Digital Signal Processing, and Embedded Systems were the most useful of the coursework. Some of the group members already had some experience with microcontrollers and PCB design. They gained this experience from personal interests in programming microcontrollers, system controls, website design and from Do-It-Yourself projects similar to this project that they have done in the past.

9
3.2 Main Control Unit (MCU) Overview -- The Main Control Unit (MCU) is the place in the system where the bulk of the control will be done. The Main Control Unit will serve a web application for user interfacing, send the commands for adjusting the various components of the HVAC system in accordance to established parameters, communicate with the thermostats in each zone via wireless link, run safety checks, and log data relevant to the user or system maintainer. In the groups efforts to meet their objective in keeping the system as modular and as self-contained as possible, it was decided that some portions of the MCU be split among two modules: A) System Control and B) System UI and Intelligence. This would compartmentalize and reduce the complexity of an otherwise monolithic control unit. The System Control module will be implemented in an embedded controller with sufficient speed, memory, I/O and communication protocol support (I2C, UART, SPI, etc.). The reasons behind such needs are because it has to be flexible enough to be able to interface with the individual thermostats over a wireless link, and also control the heat pump, fan, and vents. It should also contain the necessary programming to maintain the temperature of each individual zone within the parameters specified by the user(s) via a web application or the individual thermostats. Also, it needs to forward all readings and messages from the RSM(s) and the HVAC subsystems to the System UI and Intelligence component in order to provide the web application with the most up to date information on the other system elements and components. On the other hand, the System UI and Intelligence module will take care of hosting the UI, relay user commands and parameters to System Control, and log all (if not most) data received by the System Control. System UI and Intelligence will need more processing and memory resources than System Control to handle both the UI and data logging. These requirements pushed the group to consider platforms and technologies that would allow for the UI and data logging to be implemented either in a local unit, or on the web. In the following subsections every aspect of the MCU will be discussed as well as going over potential technologies that could make up its subsystems.
3.2.1 System Control Module Overview-- The System Control module is the element in the Main Control Unit (MCU) where all of the other elements that make up the HVAC control system converge. This module will operate side-by-side with the System UI & Intelligence module and provide safety controls, operational controls, system operation scheduling functionality, data interpretation, and communication with

10
the RSM(s). It will also relay information to the System UI and Intelligence module for data logging and use in the web application. Safety and operational controls require that the System Control module is able to operate the heat pump, the fan, and the vents. These would be operated by 24V relays connected to the System Control module. Any problem that might arise during startup or operation should be caught by the module and completely halt the system. The module must also be able to operate the HVAC system using parameters such as a fixed temperature setting (for one or multiple zones), or a programmed operation schedule (for one or multiple zones) provided by the System UI & Intelligence and set by the user(s). This module is also required to gather information from the RSM(s) such as temperature, humidity and CO2. This communication should occur over a wireless connection between the System Control Module and the RSM(s), meaning that it must also create a wireless network using a star or peer-to-peer topology. Most (if not all) of the readings it gathers from the RSM(s) must be computed and relayed to the System UI & Intelligence module for the purposes of data logging and web application update. All of these functions require that the System Control module has plenty of I/O, protocol support, and computational resources to be able to carry out those operations, thus making the System Control Module the heart of the HVAC control system. In the following subsections will contain discussions focused on the different elements that the System Control module will oversee and a couple of elements that will allow it to get the job done as accurately as possible with performance and energy efficiency to match.
3.2.1.1 Safety Controls Safety controls for any type of HVAC system, whether it is a window unit, ductless, split-system etc, are essential for proper and efficient function of the unit. Most safety features are installed in the factory by the manufacturer and very little by anyone else. For residential systems, the installer adds very little to the system when it comes to safety controls. They add some controls to protect the system from water and flooding damage. While the indoor coils are cooling air, water can accumulate underneath the coils due to condensation. Some systems come with an automatic shut off switch if the condenser drain gets clogged. According to the High-Performance-HVAC website, there are usually multiple cut-off switches in a system starting with one next to the drain pipe. A moisture sensor will detect in the primary drain pipe underneath the evaporator coil pan gets clogged or backed up. If it detects this happening, the switch will shut off the system. A second switch can be placed “in

11
line with the PVC condensation drain pipe” that will cut off the system if the drain becomes clogged. Another moisture sensor can be placed the PVC condensation trap so if water began to drip out of the pan below the evaporator coil the sensor will detect it and shut off the system. The condensation build can lead to damage to the system and damage to the house, depending on where the air handler is installed. One indication that this could be happening is if there is not any cool air flowing from the ducts if cooling is requested. This can be an easy fix by informing the user if an excess amount of water is building up. Then the user can just get rid of the water or anything that might be clogging the pipes by sucking up the water and debris with a shop vacuum before any critical damage has been done. There are many connections in the heat pump controls so there are many things that could possibly fail to work. To start with, when the heat pump’s temperature rises above its’ efficient working range, then a system shutdown might be in need. It is possible that a short might occur with all the wiring, so that needs to be taken into consideration. A short in the circuit could cause fuses to blow or the breaker to be tripped, if there is a breaker. Blown fuses could occur when there is too much current trying to flow, like when the compressor is turning on. The compressor requires more current to start up then it does to run. This spike in the current could cause a fuse to blow if it cannot handle that amount of current. The current can be monitored to ensure the circuit is working correctly. For instance, when a zone is requesting cool air then the system starts and there is a spike in current going to compressor but there is a drop in current going to the outdoor fan that could indicate a short in the circuit. If that occurred, then a system shutdown might need to take place to prevent any damage to the system. Another temperature that needs to be monitored is the coils’ temperature by the heat pump thermostat. If the system is running but the coils are not cold, then this may be an indication of low refrigerant and since the heat pump is a sealed system, there may be a leak somewhere. The thermostat can catch the lack of decrease in the coils and trigger an alert to the user informing them of the situation. From there, the user will have to have a professional refill the refrigerant and locate the leak. With the addition of dampers to the system, static air pressure could build greatly in a few seconds. This problem can easily be solved by installing a bypass air duct along with a bypass air damper. The purpose of this feature is to relieve the static air pressure build up when only one or two zones are requesting air. This feature will be further explained in the Vent Control section of this paper. Let’s say the actuator on the damper fails to open the damper at a needed time, or if the actuator just is not working correctly? An extra safety measurement can be taken by installing a pressure sensor in the air supply duct or plenum. This way the static pressure can be monitored in the plenum and in case there is a malfunction with the bypass damper. The sensor will pick up a spike in the pressure and emergency action can be taken, whether it be shutting the air

12
handler off if the pressure becomes too great, or just opening another zone damper to help relieve the excess pressure. Along with a pressure sensor in the plenum, other sensors can be placed throughout the ductwork for a list of readings to ensure the system is working correctly. A pressure sensor can be placed near a zone damper to ensure the air is flowing normally and there is no pressure build up. If there is a pressure build up, then that could be a sign of a malfunction from the actuator controlling the specific damper. If something like this occurs, then emergency action can be taken in either shutting the system off or opening another damper to relieve the pressure build up. The amount of airflow through a duct can also be measured with an anemometer. This can be used to keep the air ducts balanced when all zones are requesting air. The anemometer can also be used to check the air supply filter. The air filter should be changed every couple of weeks or after a couple of months, depending on how efficient the filter is, but this is something many people tend to forget. If the rate at which air enters the supply starts to decrease dramatically, then filter will need to be changed and the user could be reminded via the web application. Another anemometer can be used to measure the amount of air coming into the indoor air handler from the outdoor heat pump. The reason this should be monitored is for the same reason the air flowing through the filter. If there is a decrease in airflow that could mean an obstruction in front of the condenser coils such as weeds. If this sensor is triggered, then the user needs to be informed and the obstruction needs to be taken care of to ensure the heat pump keeps working efficiently.
3.2.1.2 Real Time Clock (RTC) Throughout the day, there are multiple reasons why the temperature should be changed in a household. During the day, there might not be anyone home so energy should not be wasted on keeping a comfortable temperature or at night when certain rooms will not be occupied, such as the kitchen. The HVAC system will feature multiple programmable schedules such that the user will be able automatically change the setpoint as desired based on the active schedule. This will help minimize power consumption and maximize efficiency. That is where the RTC will be used to accurately change the setpoint or mode based on the active schedule. The HVAC system will also feature data logging which will have timestamps supplied by the RTC. The part for the RTC has yet to be acquired and will be selected from these three chips: NXP PCF2123, NXP PCF8593, and TI’s BQ32000. Out of the three, the BQ32000 is the cheapest at only seventy-five cents a chip with the PCF2123 at $1.15 and the PCF8593 at $1.50. The PCF2123 transfers data through a four line SPI (serial peripheral interface) bus on a 14-pin package while both the PCF8593 and the BQ32000 use a two line I2C bus on 8-pin packages. This is a big deciding factor since we want to conserve space on the PCB and limit I/O

13
pins. Each chip has a low operating voltage in the range of 1-5 volts which means that supply voltage is not an issue.
3.2.1.3 Heat Pump Control Heat pumps are a very prominent form of heating and cooling in moderate climates such as the southern United States. For example in Florida, the temperature often does not fall below freezing in the winter. This temperature range is within the optimal working range for a heat pump. Today, the most common type of heat pump is the Air-to-Air heat pump. One of the problems with Air-to-Air heat pumps is that once the temperature falls below freezing, it becomes more difficult for an Air-to-Air heat pump to warm a household because there is less heat in the outside air to bring inside to warm the house. Therefore, there needs to be some supplemental system used to heat the house such as a gas burning furnace. The supplemental heat only turns on once the temperatures drops below the optimum temperature range. That working temperature range is the reason heat pumps are more efficient than fuel burning units in moderate climate, and they also do not burn any fuel which is a plus for the environment. The main concept behind this heat pump is to “transfer heat” from “air” inside “to air” outside the domicile or vice versa. Applying this concept allows the pump to cool or heat a household by using a reversing valve. This part determines the cycle of air flow, using the pump as either an heater, taking heat from the outside air to heat the household, or a cooling unit, taking heat from the inside air to cool the household. For the system, the Heat Pump control will turn on the pump and control the different components such as the heating coils, compressor, reversing valve, accumulator, etc. When researching about heat pump controls, the group found this high performance HVAC website; http://heat-pumps.highperformancehvac.com. It has a section detailing the different components that need to be controlled in a heat pump such as defrosting controls, accumulator controls, the reverse valve controls and others listed above. A defrost component is needed to defrost the ice or frost on the coils just like a freezer in the kitchen and is usually runs on a timer. The accumulator component prevents the compressor from having to compress any liquids which is very important since it is made to compress gas, not liquid. Controlling the reverse valve will either put the unit in cooling mode or heating mode upon request. The High Performance HVAC website goes into further detail for each component. As mentioned earlier, the reverse valve will be a key component to making this whole system work smoothly. If a zone is calling for heat, then the reverse valve needs to set the heat pump to heating mode to send air to the requesting zone. If one zone needs to be cooled, then the reverse valve switches the heat pump back to air conditioning. If a zone calls for heat while another requests to be cooled, it is up to the heat pump control to decide what to do first. It can go by the “first come, first serve” guidelines or it could go by the outside temperature

14
and whichever zone’s temperature is closer will be second on the list. This is a very important detail which will be further discussed in the Design section of this paper. The actual wiring and setup for a single stage heat pump is simple and straightforward. The chart below lists the wiring and connections for a “two heat/one cool” system, which are the majority of residential HVAC systems. “Two heat” describes how there are two stages in the heating process: first using the reverse valve to reverse the flow of refrigerant in system taking heat from outside air to bring inside the house, and the supplementary electric heating coils if the temperature falls too low for the heat handle on its own. The heat pump is powered by a 24V AC transformer and how this setup works is say a zone is calling for cold air, the yellow wire connected to the compressor is shorted to the red 24V AC return wire, and meanwhile the green fan wire will be shorted automatically to turn the fan on in most systems. In some systems the orange changeover wire will be shorted also if cooling is required. The HVAC systems vary greatly and as such the HVAC controller must be able to adapt to any common setups. It depends on the specific system because some systems require the orange wire to be shorted if heat is required. The orange changeover wire is in charge of the heat pump running in heat or air conditioning mode. If heat is needed, then the yellow compressor wire and the orange changeover wire are shorted to the red return wire, and the fan turns on automatically. If the user wants the fan on continuously for air circulation, then the green fan wire is shorted to the red return wire. The user will still be able to request for cooling or heating normally, but the fan will simply not turn off after the cooling/heating is done. The white wire is connected to the supplementary heating source and can be shorted in addition to yellow and orange if the temperature keeps falling. Some system will allow the white emergency heat to be on if the normal heating process in currently in progress, but it is not a common setup in residential systems.[42]
Figure 3.2.1.3-1 Heat Pump Wiring Diagram [42] Another item that needs to be controlled in a heat pump is the defrost cycle. The defrost cycle occurs when an excess amount of frost builds up on the outdoor
15
coils. To melt off the frost, the heat pump is switched to cooling mode but the outdoor fan is turned off. While the heat pump is in cooling mode, the supplementary heat is turned on to continue heating the household if needed. This is a very simple process, but according to zenhvac.com, a very helpful website when researching for defrost control information, the problem is knowing when the outdoor coils have accumulated frost on them because this process uses an excess amount of energy and money. The typical way this cycle is controlled is through a timer. Once the temperature drops below a certain temperature, usually around 28 degrees Fahrenheit, the timer starts and the heat pump will continue to run for a set time before it goes into the defrost cycle. This amount of time however can be adjusted on the control board; either 60, 90, or 120 minutes. The amount of time spent in the defrost cycle is typically ten minutes but the cycle can also be stopped if the outdoor coil reaches a set temperature, usually around 80 degrees Fahrenheit. It depends on whichever occurs first. The wiring for the defrost control board is very similar to the heat pump wiring. It runs on the same 24V AC transformer powering the heat pump with the wires connecting to the reversing valve, heat pump thermostat, fan, indoor coil, and other components.
3.2.1.4 Fan Control In a HVAC system, the purpose of the fan is to circulate the cold or heated air through the ducts into the household. Normally the fan will either be on or off depending on the status of the system. When a zone needs to be cooled, the system will turn on and start cooling air that the fan will blow through the ducts into the desired zones. After the zone has been cooled to the desired temperature, the system will then turn off along with the fan. The fan can also be run continuously independent of the heat pump upon request of the user. There are two types of fans used in HVAC systems, axial and centrifugal. Axial fans have the air flowing “in-line” with the propeller blades while air flows into one side of a centrifugal fan and takes a 90˚ turn outwards after being pushed from the blades. The fan is controlled by a switch or relay that receives a signal from the MCU when to turn on and off. Honeywell produces some nice relays such as the Honeywell Fan Relay R4222B1082 and the R4222D1013. They each are heavy duty multi-purpose relays with a 24V AC supply required. The only difference between the two is that the B1082 is a single pole, double throw relay and the D1013 is a double pole, double throw relay. The single pole, double throw uses each throw as either the fan on continuously setting or the fan on automatically setting with the single pole switching between the two depending on the request of the user. The double pole, double throw relay is essentially two single pole, double throw switches put together so there is an “on-on” feature. This means that two throws and one pole will control turning the fan either on or off, while the other pole throws and control the settings, either automatic or continuously.

16
A variable air volume system (VAV) is a potential configuration that might be run into when installing a HVAC system. A VAV system cools or heats air to only one specific temperature, then it is up to the blower to distribute the amount of cooled/heated air to the household depending on how much is needed to compensate for the changes in temperature. For example, if the user is requesting to be cooled and changes the setpoint ten degrees below the sample point, the blower will kick on to its’ highest speed to get as much cool air into the household as quickly as possible. If user changes the set point only 2 degrees below the sample point, the blower will turn on to a low speed to supply air to the household. To integrate the multi-zone system into a VAV system a variable-speed fan drive would be required. To determine the speed of the fan, it is common for pressure sensors to be installed in the ductwork since the static pressure of the system should be constant. Therefore, when a the sensor picks up a fluctuation in pressure, a signal will be sent to the MCU then to the fan to change speed depending upon an increase of pressure or decrease.
3.2.1.5 Vent Control Vent control in a HVAC system is essential to implement the multi-zoned feature. Air flowing through the ducts are controlled by dampers which are “doors” to guide the heated/cooled air to the requesting zones. The dampers, in addition to the thermostats, are primarily what make this system modular. Dampers usually come in a normally-open package or normally-closed package and are run off a 24V AC power supply. One of the first things to be considered in making the plant modular is the number of zones needed. Next the way in which the domicile will be separated into zones must be considered. Honeywell, one of the leading brands in the HVAC industry, suggests that a household be divided by living spaces and sleeping areas for a 2 zone system. A third zone can be added for extra spaces such as home offices, basements, game rooms, or other areas. One precaution though is to, “make no zone smaller than one-fourth of the total system capacity, measured in cubic feet/minute.” Dampers either come in a circular shape or a rectangular shape. There is no clear advantage over the different shapes. Picking the location of the dampers is also an important factor. They need to be someplace where they could easily be reached in case of a motor failure or any other malfunctions. According to a Honeywell design guide, an air supply damper cannot be placed closer than six feet from a diffuser and three feet from the plenum. The plenum is a part of the air cycle in a HVAC system; there is one for air supply and one for air return. As stated earlier, dampers come either normally-open or normally-closed. Normally-open dampers are usually used in residential applications. Normally-open means that when the damper is not receiving any voltage, then it is in its “off” position and the opposite is true for normally-closed dampers. The position of the damper is controlled by an actuator, or motor, that receives signals from

17
the Main Control Unit (MCU). Dampers can be bought with or without an actuator. Even when if a damper with an actuator is to be purchased, there are still options to be considered such as the type of control required from the actuator to control the damper and the type of power it receives. An actuator can be electrically powered, pneumatic (air pressure powered), or manual. For residential use, it’s usually electric. According Greenheck, another supplier in the HVAC industry, there are two types of controls that actuators have on dampers: two-position control or proportional control. Two position control means the actuator can either open or close the damper. Proportional control requires the position of the damper to be dependent upon a factor such as the temperature, pressure, or amount of airflow through the duct. In case of emergencies - a fire or power failure for example - an electric actuator would need a spring return type actuator while a pneumatic one is considered “fail-safe” if the damper is required to return to its’ normal position.[51] To implement the multi-zone feature, the actuators will open and close the dampers at the request of the user. If only zone one is requesting heat, then the other zone dampers would close and only zone one’s damper would stay open, the MCU will turn the heat pump on and supply the zone heated air. Once the zone reaches the requested temperature, the system will turn off the heat pump and the actuator will return the damper to its’ “off” position. If zone 1 and 2 were requesting heat, then those dampers would stay open and the remaining zones will be closed. If all zones were requesting heat, but zone 1 wants to increase the temperature by six degrees and the remaining zones only want an increase of two degrees, then only zone 1’s actuator will completely open its’ damper until zone 1 reaches its request temperature while the remaining dampers will not be completely open to compensate for the smaller temperature change until their requested temperatures are met. To control the actuators, a relay and an op amp could be implemented. The relay will receive a signal from the MCU to turn on but it requires a 24V AC voltage to turn on while the MCU will probably be supplied with only about 4-6 volts. That is where the op amp will come into play, it will amplify the signal coming from the relay to the actuator to the 24V AC it requires to turn the damper blades. In the example above where only one zone is requesting air, there is an issue with the airflow passageway. What if the zone calling for air is the smallest one? Static pressure, pressure pushing outwards against the duct walls, will start to build up in the supply plenum which is not good for the system. To counter this problem a bypass duct with a bypass damper needs to be installed. The bypass duct usually runs between the supply plenum and the return plenum. If there is not enough space to install an extra duct between the supply and air return, the bypass duct can run from the supply plenum and be dumped outside or to an unimportant area such as a hallway or basement. When researching bypass dampers this website was found to be useful: http://www.zoningnews.net. In the article, two types of bypass dampers are described: barometric and modulating. The modulating bypass damper is controlled by the static pressure. “As pressure

18
increases in the supply plenum, the static pressure sensor will register this increase and power the motorized damper to open slowly so as to relieve the excess pressure.”[52] The same type of thing happens if there is a decrease in pressure. The sensor registers the change and closes the damper accordingly. A barometric bypass damper uses the pressure of airflow through the bypass duct that moves an adjustable weight connected to a shaft collar that connects to the damper blade, to determine the position of the damper. To determine the size of the bypass duct, Honeywell has a simple equation:
(CFM System) - (CFM Smallest Zone) = CFM of Bypass where CFM is cubic feet per minute. So the bypass duct needs to be able to handle the difference between the system and the smallest zone. Honeywell has an excellent selection of motorized dampers to install in a household. They even have dampers specifically designed to be bypass dampers. The SPRD series (Static Pressure Regulating Damper) are barometric relief dampers used to prevent air velocity to increase. As described earlier, there is a counter weight connected to a shaft collar that moves the damper blade making this a purely mechanical damper with no electrical connections. If the ducts in the household are rectangular shape, then the ZD damper series would be compatible and if the ducts are circular, then a selection from the ARD series will be made. Both series are power close-spring open dampers with motor times of thirty seconds to open and ten seconds to close. As mentioned earlier, the damper actuators are most commonly controlled by electronic relays. A previous senior design project uses deltrol-controls.com to help choose relays since it is a leader in designing electronic components. Of the Deltrol-Controls selection the 263/268 collection best fits this type of project. This series of relays come with a single pole, double throw configuration up to triple pole, double throw configuration with voltage rating from 24V AC to 240V AC. Since most of the HVAC control system will be powered by a 24V supply, only those relays are under consideration. There are some drawbacks to using relays, such as lifespan, addition of extra components in the circuit when interfacing with a microcontroller, and if the relay fails it commonly fails closed which is not a good thing for the circuit. Over time the contacts of the relay can erode and even weld close. Also to protect the relay, a diode has to be used in the circuit along with a darlington transistor to regulate the current flow when interfacing with a microcontroller. An alternative to using a relay is using a triac. A triac acts like a switch once it is triggered with the minimum current at the gate. Once triggered, it passes both positive and negative cycles of the AC supply, similar to a full-wave rectifier, and continues to conduct until the current drops below the “holding current.” The advantages of using a triac is that there is no corrosion to deal with, if it fails it usually fails on to open which is safer, and interfacing it with the microcontroller would be much simpler. Since the triac is purely electronic, the switching is not subject to wear and corrosion. To interface a triac with the MCU, all that is needed is a digital-to-analog converter to send an analog signal to the

19
triac to turn on the motor. The biggest deciding factor in choosing a triac will be the amount of current it can handle and that all depends how much current the damper actuator will need. This amount varies from product to product so the specific part chosen will be discussed more in the design section of this paper. The DAC to power the triac does not need to the best of the best DAC as long as it outputs enough current to turn on the triac. Texas Instruments develops many quality DACs that could be sampled. The supply voltage of the DAC needs to be around 3V just like the MCU supply voltage and one of the goals of using the DACs is to keep the I/O requirements to a minimum so I2C compatibility is always a plus. TI’s DAC101C081, DAC121C081, and DAC081C081 fit all of this criteria. The only difference between the three is the bit-size: the DAC101C081 is a 10-bit DAC, the DAC121C081 is a 12-bit DAC, and the DAC081C081 is an 8-bit DAC. The choice of a specific DAC is highly dependent on how precise the required DAC needs to be, and how expensive that precision is. Another way to gain could control over the triac switches is by using a shift register with the same amount of bits as dampers. This control method was inspired by an open-source sprinkler design online for a sprinkler valve controller. The valves are similar to the dampers we want to control. The design utilized an 8-bit shift register to control a sprinkler system with eight valves. We could utilize this simple design to control the multi-zoned system dampers with triacs controlling the current flow to each actuator. Each bit would control a zone with the MCU sending the 8-bit string instructing which zones are calling for air and which ones are not. The design uses the 74HC595N, an 8-bit serial-in parallel-out shift register, to control 8 triacs. The 74HC595N uses a supply voltage between 0.5 - 7 volts which is exactly what we want in terms of low power.
3.2.2 System UI & Intelligence Module Overview-- The System UI & Intelligence Module’s functions are to provide a user-friendly web application that can be accessed over the local network or Internet and keep logs of the sensor information provided by System Control. The combinations of these two functions are the highlight of the eHVAC system because they provide additional convenience and functionality that are rarely bundled together. Through the web application the user(s) will be able to change temperature setpoints for their assigned zone(s) and also should be able to query historical data on system performance, duty cycle, energy consumption, and energy savings. This will provide the user with greater flexibility for operating the system and help keep track of one of the biggest energy hogs in a home. In order to reach the desired level of quality in terms of user experience, the group will have to combine different technologies that serve as backbones for web applications such as the host platform, HTTP (Hypertext Transfer Protocol)

20
server, CGI (Common Gateway Interface), Database, and the Programming Language. The following subsections will discuss these main aspects which need to be taken into consideration when designing the System UI & Intelligence Module for the project.
3.2.2.1 Operating System The group looked into the Sitara ARM® Cortex™-A8 and the Stellaris® ARM® Cortex™-M microcontroller as potential hardware platforms for the System UI & Intelligence module. These two platforms will be further discussed in section 3.2.3.2, but the purpose of this section is to discuss the available Operating Systems for the Sitara SoC. Texas Instruments provides Software Development Kits (SDK) for their Sitara SoCs, these kits allow for the development of Linux solutions on Sitara platforms. For this reason the group found available ARM Linux builds for the platform readily available on the internet and further enquired on developing the web application and database on Linux because a member of the group already had experience with Linux. The use of Linux would allow the group to concentrate on making the web application and database as powerful and useful as possible because there would be no need to setup low-level code for basic I/O and resource management as Linux would handle that and it is the most widely used operating systems. Of the many available distributions, the group focused on Ångström Linux (the most mature distribution) and Ubuntu Linux (the most familiar distribution). Ångström Linux is based on the OpenEmbedded Linux build framework for embedded devices. This allows for a very lean and stable Linux environment with the necessary tools--like the ipkg package manager--to quickly setup a web server and database. Unfortunately even though Ångström Linux is under constant development, the available packages through ipkg are somewhat limited and do not always offer the latest stable version of a tool or application. On the upside it appears to be the distribution of choice as it is included with the BeagleBone development board and is used in most example projects available online. Ubuntu Linux is also available for the Sitara SoC but brings a different offer to the platform. Although it is based on the popular Ubuntu Linux Desktop code, it has been in development for less time than Ångström Linux, so it is possible that it might not be as lean or stable. Now Ubuntu Linux makes up for this in terms of available software because it provides the popular apt package manager which offers thousands of tools and applications, many of which are up-to-date versions. Given Linux’s open source approach, plethora of tools and applications, and that it is the most widely used Operating System for web server deployments, the

21
group could very well design a powerful web application and database that meets the project objectives and specifications.
3.2.2.2 HTTP Server The basis for any web application is a HTTP (Hypertext Transfer Protocol) server. Since the main way of interacting with the system is through a web application, careful consideration must be taken into account when choosing a HTTP server. During the research phase the group came across a potential solution for use with an embedded controller or microprocessor and multiple potential solutions for use in Linux environments. During research they found that there are no free pure web server implementations for use in microcontrollers, though it is possible to code a simple server using available code samples online for available embedded TCP/IP stack suites. The most suitable TCP/IP stack for the purposes of the project is lwIP (Lightweight IP), developed at first by Adam Dunkels at the Swedish Institute of Computer Science and it provides enough protocol support to allow the group to code a simple HTTP server using available sample code. Some of the features lwIP include:
IPv4/IPv6 (Internet Protocol) support.
UDP (User Datagram Protocol) support.
TCP (Transmission Control Protocol) support.
DHCP (Dynamic Host Configuration Protocol) support.
ARP (Address Resolution Protocol) support.
IPv4 Link-local address (AUTOIP) support.
Code size around 40kB.
RAM requirements is usually around a few tens of kB.
Provided under the Modified BSD license On the other hand, in a Linux environment there is almost no shortage of available web server offerings. The group then looked into three different Linux-compatible web server options and realized they offer more than enough features and compatibility to run the web application with almost no restraints. Out of all of the available web servers, the group found precompiled versions for Apache, Cherokee, and lighttpd on both Angstrom and Ubuntu. Now even though they all share many features it does not mean that they are alike. As shown in table 3.2.2.2-1, all three are distributed under different software licenses, and in the case of lighttpd it does not provide a graphical administration interface. Also unlike Cherokee and lighttpd, Apache was not designed to be a lightweight HTTP server.

22
Feature Apache Cherokee lighttpd
License ASL GPL BSD
Admin Interface Yes Yes No
CGI (PHP, Python, etc.)
Yes Yes Yes
URL Rewriting Yes Yes Yes
Authentication Yes Yes Yes
IPv6 Yes Yes Yes
Table 3.2.2.2-1 Feature matrix for Apache, Cherokee and lighttpd.
If the group decided to implement the web application in an embedded controller or microprocessor, they would have to use lwIP and code their own server to handle requests. Unfortunately no one in the group has experience with developing web server software or RTOS, so the implementation is a simple one because this would consume more resources than they would like to in order to get the RTOS and web server up and running (this would also extend to the CGI handles). If the group decided to use a Linux-based platform, they would only have to allocate a minimum amount of resources to getting the HTTP server software up and running as all three can be easily installed using package managers included in each distribution. Also, they would have a lot more degrees of freedom for coding their web application because they can use a variety of programming languages and other web technologies that require a full-fledged HTTP server.
3.2.2.3 Common Gateway Interface (CGI) The Common Gateway Interface is a standard that allows for the execution of software and the processing of information in response to an HTTP request. Though in today’s world, the Common Gateway Interface is an integral part of almost any HTTP server. This allows for smarter web applications because it acts as the link between an HTTP server’s fundamental function of catering to HTTP requests and the processing of the requested content. CGI is a required element for the web application because it will need to process forms and query a database. All of this will be done on-demand, meaning that the web site will have to generate a lot of the information that will be displayed and the parameters that will be sent to the System Control Module, so the use of CGI will allow for this to be accomplished.

23
Figure 3.2.2.3-1 shows a basic block diagram showing how a dynamic web page is generated. First, the web browser requests a form or web page from the web server, this is known as an HTTP request. While trying to serve the request the web server notices that the requested page or form has to be pre-processed or generated by an external executable before being delivered to the user, so it passes the request along to the CGI program. The program takes the input and queries the necessary information from the database that will allow it to generate the requested content. Once it receives the result from the database, it generates either snippets of HTML that will be embedded into other HTML code or a complete HTML page that will be then delivered to the user by the web server.
Figure 3.2.2.3-1 CGI block diagram
3.2.2.4 Database (DB) During initial discussions the group had determined that they needed the system to store information on system activity and performance. Given that they are going to create a web application it is going to need some form of data storage where it can process said information for data logging and reporting purposes. For this the use of Comma-separated Values (CSV) files versus a database system based on the Structured Query Language (SQL) standard was looked into. The reason the focus was on these two solutions is because one of the members on the team has previous experience with both CSV files and SQL-based databases, and also because they are supported by a wide variety of applications and programming languages. A CSV file consists of a plain-text file which contains a dataset where all of the records in share a common feature. This common feature allows for the logical grouping of the records for data storage or exchange. Each record is further divided into fields, which are separated by a delimiter (normally a colon,

24
semicolon or TAB character). Most programming environments provide functions for simple, yet powerful I/O operations on CSV files. This would provide the system with a data storage and exchange capability that is simple to implement in the programming language and platform of the groups choosing. On the downside, although simple to implement it would also require the group to rebuild the file every time a modification is made. This could potentially become detrimental to the performance per watt of the system because said rebuild equates to more clock cycles for maintaining the data as it grows over time. On the other hand, a SQL-based database could provide the tools needed to efficiently handle the data. Being a widely known standard, SQL-based databases come in multiple flavors both free and proprietary. For the purposes of the project we believe that SQLite or MySQL could provide the tools needed to create and maintain the required data. These two databases can run on a variety of Operating Systems (though for the purposes of the project let’s concentrate on Linux). Here are some features provided by SQLite and MySQL:
Programming libraries available for a multitude of applications and programming languages.
Both support basic SQL commands needed for Create, Read, Update, Delete (CRUD) operations.
MySQL is one of the most widely-used database systems in the world (powering thousands of websites on the internet and many other database applications).
SQLite is popular among self-contained database systems and is found on thousands upon thousands of different applications: from aircraft control systems to local databases in today’s smartphones.
MySQL is distributed under the GPLv2.
SQLite is distributed under Public Domain. Although there is more to a SQL-based database than the features above, for the purposes of the project not everything needs to apply. Now, one very important factor is resource consumption and it’s also where these two databases mainly differ. MySQL is typically implemented as a server process which handles all of the operations done on the database files. This is good for concurrency performance in medium to high-volume applications. For the project this would translate to having take into account the persistence of another process in memory just for the database. On the other end of the spectrum, SQLite is fully implemented as a library therefore has no dedicated server process. This allows for more tightly coupled interfacing as all operations are done directly on the database file(s) through function calls provided by the library (which can be linked statically or dynamically to the application).

25
3.2.2.5 Beyond Hardware: The Cloud & The Google App Engine Platform Today solutions to many needs are being met by products on the Internet. These products appear in the form of Infrastructures (e.g. Amazon Web Services), Platforms (e.g. Google App Engine) and Products (e.g. Office 365). The idea of hosting the web application and database on the web was initially brought to consideration during the initial project discussions but was quickly discarded as the group believed that the complete integration of all functions of the core system seemed to present a greater and more rewarding challenge. On April 2012 the group had a meeting with Dr. Richie where they discussed the feasibility of having the web server and database hosted by the MCU. Here he asked why the idea of using the cloud was not considered and just connecting the System Control Module to the Internet. He argued that the Internet is not the same as 5-10 years ago, because many web technologies have matured and reached a point where you don’t have to reinvent the wheel every time you need to get something done. He also said that hosting the web application and database would probably make no sense out in the real world if the idea of developing a product was to be commercialized. This is because now there are a magnitude of tools and technologies that facilitate the development of a service or platform that can handle multiple instances of the same software for multiple users. This pushed the group to reconsider the leveraging of the cloud for the web application and database implementation. With this they set out and looked into the Google App Engine (GAE), a Platform as a Service cloud computing solution from Google. The Google App Engine provides tools and resources to develop and host web applications using Google’s Infrastructure. It supports apps developed in Java, Python and Go runtimes environments. Some of the common features and additional services provided by GAE are dynamic web serving, persistent storage, automatic scaling and load balancing, local SDK for developing on the computer, and different data storage solutions. For storing an application’s data GAE provides three different solutions, and all three provide a different approach to storing and managing data. The App Engine Datastore is a horizontally distributed database built on top of Google’s Bigtable distributed storage system and allows for the creation of “schemaless” databases with atomic transaction support (ensuring data integrity). It is not a relational database like SQL-based database systems (hence the “schemaless” attribute) and relies on setting properties on the objects or “entities” in it and whatever policy is enforced by the application code. It is a departure from the traditional Relational Database Management Systems (RDMS), but Google claims it makes up for it in reliability, speed and scalability versus widely deployed SQL RDMS. It supports an SQL-like syntax called GQL. The main

26
difference between GQL and SQL is the exclusion of the JOIN statement because it does not scale well in horizontally distributed databases. The second storage option is the recently unveiled Google Cloud SQL which runs on a modified version of MySQL 5.1. It is fully managed and requires near-zero maintenance. With this it provides a familiar SQL Relational Database Management System for people who want to quickly migrate existing applications to the cloud or are looking into quickly developing and deploying applications using existing and extensively tested application design and coding principles. The third storage option is Google Cloud Storage. It is designed for storing objects up to terabytes in size and provides the developer with powerful tools for handling and sharing the data across different applications. In order to use GAE the developer is required to have a Google account. This is provided free by Google and offers access to almost all of Google products and services for free (some restrictions apply on a per product/service basis). In the case of GAE, Google provides a set of free API access quotas (reset every 24 hours) and a limit of 10 free applications. Some of the free quotas are as follows:
Instance-hours: 28 hours.
Datastore: 1GB of data and 50k operations.
Bandwidth: 1GB in and 1GB out.
URLFetch API calls: 657,000. Google App Engine presents a strong proposition for implementing the web application and database because of its near-zero configuration platform approach, acceptable free quota limits, runtime environments, and data storage options. Though in order to make it work in conjunction with the System Control Module a communication session will need to be established over the internet. This means that System Control would need to be internet-enabled and have the capability to interact with the web application over the internet.
3.2.2.6 Python Vs. Java Vs. C There are a large number of programming languages out there in cyberspace. However, there are only a select amount that can fit the job for what the group requires for their HVAC Controller. Having experience in Python, Java and C helped the group narrow which programming languages to research. All three of these languages have suitable qualities and features that fit most (if not all) of the needs of the project. The first language the group looked at was Python. A few of the group members attended a few tutorial sessions on Python programming on the UCF campus hosted by the Astroclub. These sessions helped teach them about how Python worked and what it had to offer for the project. From these sessions they learned that Python is an interpreted programming language which means that it and

27
interpreter reads the code and executes it on the fly. There are many advantages to using Python because of its ease of use. More specifically, it is a free and open source language which has a plethora of resources for programmers which comes in handy when needing help writing programs. Along with the multitude of resources available to the programmer, another asset that Python has is a built-in documentation for which it gives examples and code snippets that a programmer could use to help learn the language on their own. Another advantage of Python is that its syntax is very easy to understand. To give an example, if someone were trying to print Hello World to the screen, they would only need to write one line of code: print(“Hello World”). Unlike many other programming languages, Python’s easy syntax makes coding much simpler. Another reason why the syntax is quite simple to understand is because in Python the programmer does not have to initialize any data types because it’s not needed. Python is also a very popular programming language for web application programming, allowing for the creation of web pages that are dynamic in content based on what is requested. Finally, Python has a wide range of tools and libraries that can imported into it, such as scientific tools for data crunching and graphing or special interpreters that helps debug and fix problems as the application is being programmed. Another programming language the group researched for the project was Java. Unlike interpreted Python code or compiled C code, Java generates what is called intermediate bytecode. This bytecode is then executed on a multi-platform runtime environment allowing for faster execution than Python and greater application portability than C. It is also a free and open source language and it has many resources online and in books which would help a programmer develop almost any proposed solution without having to reinvent the wheel. Also, it has many libraries that can be imported which make it a widely versatile language just like Python. Although these advantages make Java a worthy language to use in the project, there are a few drawbacks which can’t be overlooked. For example, unlike Python, Java has data types that must be initialized. As described with Python, using data types can cause issues when creating large sized programs and can cause issues with values that need to be equated when running a program if they were not initialized correctly from the beginning. Another disadvantage that would be a big issue when choosing Java is the creation of just a simple program to print Hello World. Unlike Python where the program only requires one line of code; Java requires not only that line that prints to the screen but also a declaration of a class and also a main for where this line of code can be written in. Although this is not all the capabilities/ issues with Java, it is a good background for reference when deciding whether or not to use this programming language for the project. The final programming language the group looked into for using with their HVAC Controller was C. The group as a whole has some experience in C programming so it decided to assess the possibility of programming in it. Unlike Java and

28
Python, C programs are fully compiled and the compiled code is not portable to different platforms. Like Java and Python, it is also a free and open source language with much documentation to look into when needing help. Also, it has a wide range of libraries to utilize like Java and Python. However, where C exceeds in all this, it lacks in simple syntax like Java. Unlike Python, C also requires variables to be initialized with a data type and needs a main for which the code is to be written in. C requires that the programmer create the code first, compile it and then run the compiled application. The compiled nature of C application also involves a much tedious debugging process because the program would need to be recompiled when fixing errors, making debugging C programs a time-consuming and inefficient process Although C has many things to offer it also has many disadvantages like Java which may be more troublesome than not when trying to code in these languages. A table of all three languages being compared can be seen in Table 3.2.2.6-1.
Python Java C
Is it Free? Free and Open
Source Free and Open
Source Free and Open
Source
Learning Curve Simple Syntax Lacks Simple
Syntax Lacks Simple
Syntax
Does it need to compile?
No Yes Yes
Other tools? Wide range of tools
and libraries Large range of
libraries Large range of
libraries
Built In Docs? Yes No No
Script? Yes No No
DataTypes? No Yes Yes
Table 3.2.2.6-1 Comparing Languages
3.2.2.7 MVC Framework: How it all comes together One of the many struggles a programmer has when dealing with creating a functioning web application is the organizational structure. Although there are several ways to combat this issue head on, there is another way that makes this task easier to implement, maintain and understand. This architecture is known as MVC (Model-View-Controller).

29
The simple structure of an MVC Framework is shown by three main aspects: A model, a controller and a view. “The model contains the data, views present the data, and the controller processes events affecting the model or views” [2]. In other words, the model itself is how the data is defined in the application, The view is how the information will be presented to the user. Finally, the Controller will utilize both the view and the model. The controller will decide what model it will implement and then also chooses the view it wishes to display to the user. A simple representation of an MVC Framework and how it communicates within itself is shown below in Figure 3.2.2.7-1.
Figure 3.2.2.7-1 MVC Framework
The MVC Framework is one of the most important aspects of the group’s HVAC control system. This framework will control the web site and database in a loosely coupled fashion. This will make for an implementation that is easier to maintain when more than one markup or programming language is involved. While researching the group came across a few MVC Frameworks that would satisfy their needs for this project. The three frameworks they investigated are Django, Web2py and Struts. The following section will discuss these frameworks which are implemented in Python (Django, Web2py) and Java (Struts).
3.2.2.7.1 Comparison of MVC Frameworks As discussed in the previous section, the group will be using an MVC Framework to house all of their needed programs for the web application. With this they realized they needed to find a Framework that would fit with the programming languages they researched (Python, Java and C). Through research however the group they discovered that there are no explicit MVC Frameworks for C so they had to discard C as a potential programming language. However, there are many different MVC Frameworks to choose from by which the group decided to

30
base their decision on three specific ones. The three frameworks they looked into were Django, Web2py and Struts. Django and Web2py are both Python based frameworks and Struts is a Java based framework. Each of these they feel might be suited for implementation in the HVAC control system. The first MVC Framework to look at is Django. This Python based framework is widely used for implementation on many web applications for various reasons. Firstly, according to the Django website the idea/purpose behind the Django framework was to be able to make web-development jobs quick and easy. Django also allows for database mapping using an ORM (Object-Relational Mapping) approach. With this Django can basically translate Python classes into table definitions in a database as use said classes as interface for the database. As well, Django creates an automated Python API (Application Programming Interface) by which the programmer can add, delete and adjust objects. Another ability of the Django framework is that it works as a dynamic administrative interface. Basically, this allows for the programmer to add, delete and adjust content with ease whether it be just one person or a multitude of people on the same web application. A large advantage of using Django is the “template inheritance” ability it offers. By this, a user can create a standard main page (base.html) for instance, and with this they “can dramatically cut down on redundancy in templates: each template has to define only what's unique to that template” [1]. Finally, another capability of Django is its ease of making an RSS feed. Unlike most other frameworks, Django can easily implement an RSS feed by having the programmer creating a mini Python class. The next framework the group looked into for the web application is Web2py. Web2py like Django is also a Python based framework. Like Django as well, Web2py can create database structures, however the advantage of Web2py is the way it does this. Unlike the ORM of Django, Web2py uses DAL (Database Abstraction Layer) which takes Python objects and maps them into a database and creates objects for that database. The advantage of DAL over ORM is that it creates these objects faster and makes almost all SQL structures easily mappable into DAL. Another advantage of Web2py is its user interface. It is a simple Model-View-Controller setup which requires no installation and is mostly browser based. The organization of this framework is highly regarded because it separates all the Models, Views and Controllers into their own sections and makes them easily accessible when need be. Also, Web2py does not import Python programs but rather executes them which accounts for the lack of need of restarting the server when updating or deleting the files. The final MVC Framework the group looked at was the Struts framework. Struts unlike Django and Web2py is a Java based framework. However, it is also an open source Framework like Django and Web2py so it’s free to use and implement for the use of this project and there is plenty of online documentation to use when working with it. One main difference that Struts accounts for that the other two (Django and Web2py) do not is the fact that it will create the view and
31
Controller layers itself but it will make the programmer do the Model layer themselves. However, because it doesn’t have a built-in function for the Models this allows for Struts to support any type of model. Another difference of Struts is that it will place all of its model-view and controller components into one file known as the struts-config.xml. Struts also allows for a built-in tag library that is able to read and write from the models directly rather than needing embedded code.
3.2.3 Comparison of System Modules
3.2.3.1 Comparison of System Control Modules The group looked into three microcontroller solutions from Texas Instruments for the System Control Module. The first microcontroller is the Stellaris® LM3S8962 and the other two are the MSP430F2274 and the CC430F6137 both based on the MSP430 microcontroller. The main reason why the group looked into these three microcontrollers is because it acquired and experimented with development boards powered by Stellaris and MSP430 microcontrollers during attendance to a Texas Instruments workshop that took place at UCF on February 2012. The Stellaris® LM3S8962 microcontroller offers plenty of power for the money. It is a microcontroller based on the ARM® Cortex™-M3 design. Cortex-M3 cores offer separate buses for instructions and data due to a modified Harvard architecture design, 16/32-bit Thumb-2 instruction set for improved code density and performance, 1.25 DMIPS/Mhz, Serial Wire JTAG Debug port, and three different sleep modes for flexible low-power operation. These base features allow for a highly configurable and powerful platform. In addition to the base Cortex-M3 features, the LM3S8962 adds multiple features that augment its capabilities and flexibility such as:
● 50 Mhz operation, 64 KB SRAM/256 KB flash which the group considers to be a generous amount of processing and memory resources for operating the system and handling two different communication interfaces.
● IEEE 1149.1-1990 compatible JTAG interface which facilitates on-site programming and debugging.
● 4 independently configurable General Purpose Timer Modules with Real-Time Clock capability which allows for flexible timer solutions and alleviates the need to implement a separate RTC.
● Total of 36 interrupts with eight different priority levels, and nested vectored interrupt controller (with tail chaining, pre-emption, non-pre-emption, and late arrival support). This allows for a more intelligently programmed MCU as the group can define different priorities to interrupts based on how critical an interrupt is versus the executing process.

32
● Programmable interrupts for RTC match, external wake, and low-battery events. This provides a powerful tool for coding HVAC operation based on a time schedule.
● 5-42 GPIOs with 5-V-tolerant inputs and programmable control for interrupts. This is a rather large number of GPIOs allowing for a flexible interfacing and control.
● I2C, UART and SSI support (programmable for SPI, MICROWIRE, and Texas Instruments synchronous serial interfaces. This provides the group with the ability to interface directly with wireless transceivers, external RTC, relays, and other subsystems.
● Fully Integrated IEEE 802.3-2002 10/100 Ethernet Controller with configurable MAC address, CRC error-rejection, user configurable interrupts, IEEE 1588 support and requiring only a 1:1 isolation transformer interface for a complete ethernet interface.
Along with the features mentioned above, Texas Instruments provided schematics and software for the development board. These can be used as reference for developing the System Control Module subsystems for communication interfaces and HVAC controls, so the group would not have to start design from scratch and quickly accelerate into the prototyping stage. The MSP430F2274 microcontroller uses a 16-bit RISC architecture and is geared for applications that require ultra-low power consumption. This microcontroller is used by Texas Instruments in its EZ430-RF2500 wireless development kit and could prove to be a cost-effective solution for the MCU as Texas Instruments provides schematics and code samples for said kit. This would allow the group to accelerate past design and into prototyping an MCU based on this microcontroller with wireless communications using the CC2500 2.4 Ghz transceiver. Some of the features in the MSP430F2274 microcontroller are:
● Up to 16 Mhz operation and 32KB Flash/1KB RAM in a von-Neumann architecture for adequate processing and memory resources for operating the system and handling communication interfaces.
● Low Supply Voltage ranging from 1.8 V to 3.6 V, and less than 1 μs wake-up from standby allowing for ultra-low power consumption and on-demand operation.
● One Low-frequency auxiliary clock for ultra-low power standby mode and one High-speed master clock for high performance processing. This augments the MSP430F2274’s flexibility in low-power environments.
● Universal Serial Communication Interface with UART, SPI, I2C support. This provides the microcontroller with plenty of communication interfaces for wireless transceivers, external RTCs, and other possible subsystems.
● Serial Onboard Programming for easier on-site programming and debugging.

33
● 32 GPIOs and vectored-interrupt capability for flexible hardware/software interrupt handling, allowing the group to quickly integrate interrupt handlers for external subsystems.
These features prove the MSP430F2274 a capable microcontroller for both a Remote Sensor Module and System Control Module. Now, trying to go one step further and integrate system components to reduce the complexity of the required hardware, the group also evaluated the CC430F6137. This is a System-On-Chip (SoC) solution with an integrated CC1101 Sub-1-Ghz ISM-band transceiver. Aside from conveniently integrating a wireless transceiver, the CC430F6137 offers the following relevant improvements over the MSP430F2274:
● Up to 20 Mhz operation and 32KB Flash/4KB RAM. ● Real-Time Clock which would alleviate the need for an external RTC. ● Two Universal Serial Communication Interfaces. ● LCD driver for display information to an external LCD. ● Included CC1101 RF transceiver compatible with frequency bands 300
MHz to 348 MHz, 389 MHz to 464 MHz, and 779 MHz to 928 MHz. Texas Instruments also provides sample code for configuring the wireless transceiver in the CC430F6137, which combined with RTC capability, additional processing power, memory resources, and communication interfaces, allow it to be a strong and reasonably cost-effective contender against the Stellaris LM3S8962. Now, one feature the LM3S8962 holds over the MSP430 options is the fully integrated ethernet controller. The reason why this is important is because in the event that the System Control Module requires ethernet capability, it would greatly reduce the complexity of the required hardware versus the reduction offered by the CC430F6137’s integrated wireless transceiver.
3.2.3.2 Comparison of System UI & Intelligence Solutions This subsection will go into the relevant details for the different platforms for implementing the System UI & Intelligence Module. The group took into account three very different approaches each with its own unique features. Two of these are Texas-Instruments-based solutions: The Stellaris LM3S8962 microcontroller and the BeagleBone. The third solution is not a hardware solution but rather a cloud-based solution from Google called Google App Engine. The following paragraphs will discuss the relevant features and advantages of using each platform.

34
As discussed in the previous section the LM3S8962 offers a wide array of features that prove it to be a flexible yet powerful platform. It has an integrated ethernet controller which simplifies the implementation of ethernet connectivity in the MCU and is also able to interface with external mass storage (required for the database). Now regarding the software required to host a web application and database the LM3S8962 falls short in comparison to the other two options. In order to serve web applications a web server must be coded almost from scratch using the lwIP stack. This would force the group to set more resources aside for getting the web server up and running. In addition to a lack of a pure web server software, the group would also need to code all CGI handlers from scratch further using up resources that would otherwise be available to coding the actual web application. On the positive side, ethernet connectivity examples were included with the LM3S8962 development boards at the Texas Instruments Workshop, but overall shortcomings make the LM3S8962 unsuitable for implementing an MVC framework because of the additional time required to implement and optimize such software and the need to use a CSV file which requires a rebuild after editing. Also, having the LM3S8962 host a multi-user web application as well as all other System Control Module functions will probably be too much for it to be able to complete its assigned task within a reasonable amount of time. One possible solution to this would be to use one LM3S8962 for the web application and another microcontroller for the System Control Module functions (as defined in section 3.2). An even more flexible and powerful option is the BeagleBone. It is an open-source credit-card sized computer powered by the Texas Instruments Sitara AM3358 ARM Cortex-A8-based microprocessor. It offers plenty of horsepower and peripherals and is able to run the Linux Operating System. Texas Instruments provides all the necessary documentation and schematics that detail the BeagleBone, this would allow the group to implement a solution based on the Sitara AM3358 using the BeagleBone schematics as reference. Some of the features offered by the BeagleBone hardware are:
● 720 Mhz operation (can be lowered for reduced power consumption) and 256 MB DDR2 RAM. This translates to effortless data processing and transmission thanks to its generous processing horsepower and memory resources.
● Integrated 10/100 Ethernet Controller + RJ45 Jack allowing for immediate internet connectivity.
● One USB 2.0 port for connecting Human Interface Devices, Mass Storage devices and almost any USB-compatible device. This USB port ensures potential expansions to the platform.
● MicroSD card slot for storing the Linux Operating System. ● JTAG interface for debugging and fail-safe system access. ● 66 GPIOs with interrupt capability. This is a welcome plus as it leaves the
doors open for the implementation of new features if needed.

35
● I2C, SPI, UART support all of which can be used for interfacing with the System Control Module.
On the software side the group looked into the Ångström Linux and Ubuntu Linux distributions. Both operating systems offer in their respective package managers all three HTTP servers (section 3.2.2.2), both SQL databases (section 3.2.2.4) and compilers or interpreters for all three programming languages (section 3.2.2.6), with Ångström offering slightly older versions on some of the packages. The availability of these programs, along with the BeagleBone’s open-source nature and raw power make for a compelling case where the group could build its own web server platform, deploy an MVC framework based web application and be able to control every single aspect in the hardware and the software. The last potential solution comes in the form of the Google App Engine. The Google App Engine is a platform as a service provided by Google for running web application on its infrastructure. For the group this meant that there would be no web server hardware to develop or maintain. With Google App Engine the group could develop the web application and database and upload it to Google’s servers and it would be available from anywhere in the world. Google App Engine provides runtimes for Java and Python and includes access to the Datastore cloud database through APIs provided for both programming environments. The deployment of the web application on the Google App Engine is certainly a very attractive and exciting solution because of the current trend of making web applications available on the cloud. Now the use of Google App Engine creates what could be considered an issue: this approach would most certainly change the way System UI & Intelligence communicates with System Control because the System UI & Intelligence hardware cannot be physically interfaced with the System Control hardware. In order to get around this limitation the System Control Module would have to be connected to the internet as well. As per the discussion in section 3.2.3.1 and information provided in this section, the most suitable microcontroller for this approach would be the LM3S8962, because of it’s integrated ethernet controller, sample code for ethernet connectivity and overall power.
3.2.4 System Control and System UI & Intelligence Interface The System Control module needs to forward whatever information it receives from the RSM(s) and the HVAC subsystems to the System UI and Intelligence module. This enables the user to have the most up-to-date information on the HVAC system. Therefore, when the group defined their specifications for the Main Control Unit it was determined that two-way communication between

36
System Control and System UI & Intelligence was required to achieve the best possible performance. During research they came across multiple potential solutions, one of which is I2C. I2C is a bus developed in the 80’s by NXP Semiconductors (formerly Philips Semiconductors) for the purposes of inter-IC communications. It is a flexible bus used in multiple applications from driving an LCD, querying sensors, and managing power circuitry in rechargeable batteries to being an integral part in many control architectures such as System Management Bus (SMBus) and Intelligent Platform Management (IPMI) (I2C specs pg 3). The flexibility of the I2C bus has allowed it to become a very commonplace solution when system designers find themselves in the need to get components in the systems to communicate with each other. Because of this, I2C became the first bus technology of interest. Some of the features of I2C bus are:
● Only two bus lines are required; a serial data line (SDA) and a serial clock line (SCL).
● Each device connected to the bus is software addressable by a unique address and simple master/slave relationships exist at all times; masters can operate as master-transmitters or as master-receivers.
● It is a true multi-master bus including collision detection and arbitration to prevent data corruption if two or more masters simultaneously initiate data transfer.
● The number of ICs that can be connected to the same bus is limited only by a maximum bus capacitance. More capacitance may be allowed under some conditions [54].
At first I2C seemed like a reasonable solution to getting the MCU modules to communicate, but after further research the group learned that I2C is for the most part designed to work in a Master-Slave(s) configuration where information would only be transmitted at the master device’s request (see figure 3.2.4-1). While I2C offers a multi-master option, it would have simply added another layer of complexity to what needed to be a simple point-to-point link. This is because in multi-master mode a user could run into a situation where one of the devices would not support said mode, which would prevent one of the devices from opening the link if needed, or worse, the presence of a single master in a multi-master setup could cause unexpected results. Mainly for these reasons, the idea of using I2C for communicating both subsystems was discarded, although the group still had plans for its use in other parts of the project.

37
Figure 3.2.4-1 Typical I2C bus implementation
Another data link solution the group came across during research was the SPI Bus, or Serial Peripheral Interface Bus. This bus was developed by Motorola® for its M68HC11 platform and is commonly implemented in a 4 or 3-wire setup. Like I2C, the SPI Bus is frequently used in Master/Slave bus topologies (see figure 3.2.4-2) but is also capable of multi-master configurations. Its applications are also somewhat similar to I2C, allowing the system designer to accomplish things from driving LCDs, sensors, transceivers and other slave-type devices to interprocessor communications. Although the SPI bus is mentioned in this section, it was not considered for interfacing System Control and System UI & Intelligence, because it turns out that UART would be easier to implement in all of the embedded controllers and microprocessors mentioned in section 3.2.3.
Figure 3.2.4-2 Typical SPI bus implementation
UART is a very simple controller that allows a system to open a serial communication channel with another system. Data is sent in a sequential fashion and is commonly included in microcontrollers and other embedded devices. It only requires 2-wires (TX/RX) and all of the embedded controllers and microcontrollers the group researched included UART support. Also, during the research the group came across enough sample code that would allow them to quickly setup UART on both ends of the link. The sample code, simple wiring (see figure 3.2.4-3), and widespread support became a big selling point, making
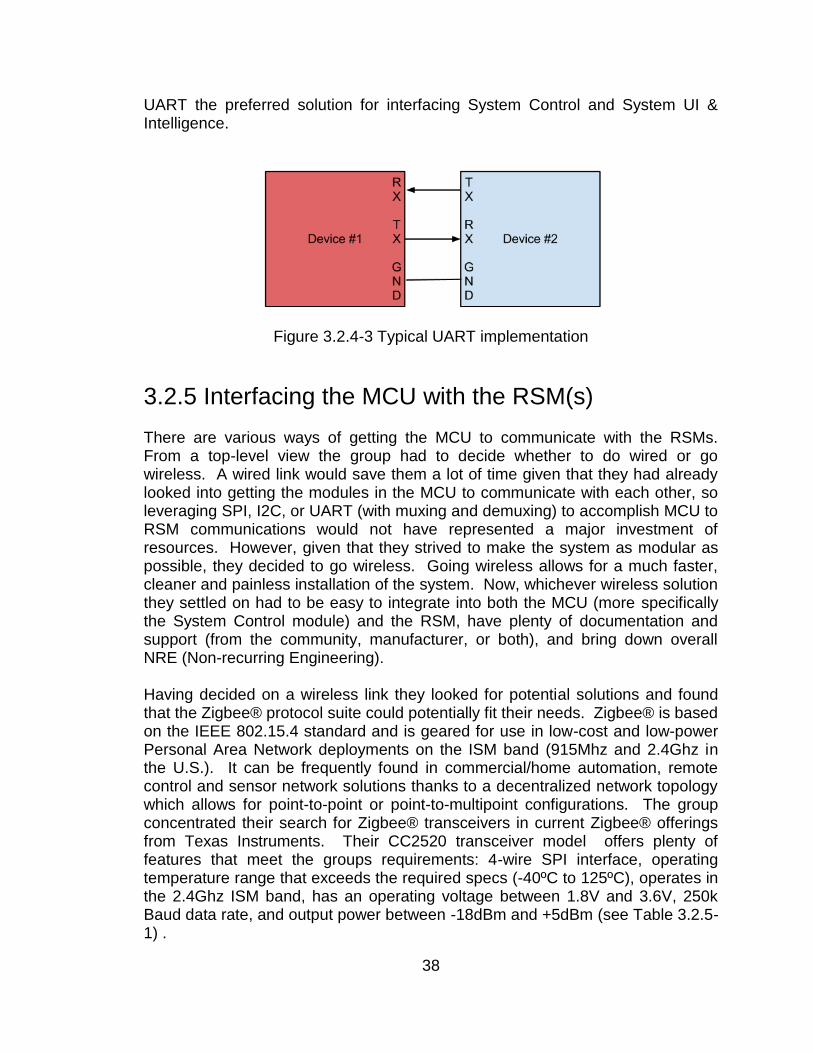
38
UART the preferred solution for interfacing System Control and System UI & Intelligence.
Figure 3.2.4-3 Typical UART implementation
3.2.5 Interfacing the MCU with the RSM(s) There are various ways of getting the MCU to communicate with the RSMs. From a top-level view the group had to decide whether to do wired or go wireless. A wired link would save them a lot of time given that they had already looked into getting the modules in the MCU to communicate with each other, so leveraging SPI, I2C, or UART (with muxing and demuxing) to accomplish MCU to RSM communications would not have represented a major investment of resources. However, given that they strived to make the system as modular as possible, they decided to go wireless. Going wireless allows for a much faster, cleaner and painless installation of the system. Now, whichever wireless solution they settled on had to be easy to integrate into both the MCU (more specifically the System Control module) and the RSM, have plenty of documentation and support (from the community, manufacturer, or both), and bring down overall NRE (Non-recurring Engineering). Having decided on a wireless link they looked for potential solutions and found that the Zigbee® protocol suite could potentially fit their needs. Zigbee® is based on the IEEE 802.15.4 standard and is geared for use in low-cost and low-power Personal Area Network deployments on the ISM band (915Mhz and 2.4Ghz in the U.S.). It can be frequently found in commercial/home automation, remote control and sensor network solutions thanks to a decentralized network topology which allows for point-to-point or point-to-multipoint configurations. The group concentrated their search for Zigbee® transceivers in current Zigbee® offerings from Texas Instruments. Their CC2520 transceiver model offers plenty of features that meet the groups requirements: 4-wire SPI interface, operating temperature range that exceeds the required specs (-40ºC to 125ºC), operates in the 2.4Ghz ISM band, has an operating voltage between 1.8V and 3.6V, 250k Baud data rate, and output power between -18dBm and +5dBm (see Table 3.2.5-1) .

39
Table 3.2.5-1 General characteristics of TI CC2520 Zigbee® Transceiver [67].
While browsing on the internet for other potential wireless connectivity solutions the group came across Texas Instruments’ own offering, SimpliciTI. SimpliciTI is a protocol developed by Texas Instruments for low-cost, low-power RF networks. It supports star and P2P (peer-to-peer) network topologies and works on any sub 1Ghz and 2.4Ghz TI radio. It is geared for use in home automation, automatic meter reading, sensor, and RFID applications. According to Texas Instruments it is very easy to implement as it only uses a five-command API and libraries are readily available for TI platforms such as the MSP430. There are two potential solutions based on this offering, the CC2500 transceiver and the CC430 family of SoC, both from Texas Instruments. The CC2500 is a IEEE 802.15.4 transceiver for 2.4Ghz ISM band applications. It has a programmable data rate of up to 500 kBaud, a 4-wire SPI interface, -40ºC to 85ºC operating temperature, 1.8V to 3.6V operating supply voltage, and output power between -30dBm and +1dBm (see Table 3.2.5-2). This transceiver has strong potential because the group also found a development board from TI called the EZ430-RF2500 for wireless development, which makes use of this transceiver and an MSP430 microcontroller. The use of this kit in development would allow them to reduce NRE because Texas Instruments provides schematics and code samples (using SimpliciTI) for this kit.

40
Table 3.2.5-2 General Characteristics of TI CC2500 Transceiver [67].
The CC430 SoC is also a very interesting solution because it combines an MSP430 microcontroller with a CC1101 Sub 1-Ghz RF transceiver in a single package. The combination of the MSP430 with and a RF transceiver makes the CC430 a very tempting solution for the project as it would allow the group to reduce the complexity of their schematics and further integrate components. While the CC430 is a family of SoCs, they all use the same CC1101 transceiver. The CC1101’s main characteristics are as follows: 315/433/868/915 MHz ISM/SRD band operation, 1.8V to 3.6V operating voltage, -40ºC to 85ºC operating temperature, up to 500 kBaud data rate, and programmable output power between -30dBm and +12dBm (Table 3.2.5-3). For more information on the MSP430 microcontroller family see section 3.2.3.1.
Table 3.2.5-3 General Characteristics of TI CC1101 Transceiver [67].

41
3.2.6 Interfacing with the outside world (LAN + Internet) Ethernet connectivity is a very important element if the group is to serve the web application to the Local Area Network (LAN) and the internet. In order to accomplish this they need to make use of various techniques and technology. First the MCU needs to connect to the existing computer network on the premises. Second, the system will need some sort of mechanism that will allow it to be accessible from the internet. To meet these needs the group must look into ethernet controllers for connecting the MCU to the network and a set of network technologies and services for accessing the system from both the Local Area Network (LAN) and the Internet. Ethernet Controllers-- Three readily available ethernet controllers are the CS8900A from Cirrus Logic, the LAN8710A from SMSC. These two controllers have been documented to work with TI MSP430 and Sitara SoC applications and can also be easily integrated into Stellaris products The Cirrus Logic CS8900A is a single-chip 10Base-T solution which operates at either 3V or 5V at temperatures between -40°C to 85°C (depending on the version) with a maximum current consumption of 55 mA at 5V. It has a broad feature set such as full-duplex capability, configurable automatic re-transmission on collision, automatic polarity detection and correction, and automatic rejection of erroneous packets. The CS8900A is accessed thru a ISA (Industry Standard Architecture) bus and TI provides an application report demonstrating the use of the CS8900A with their MSP430 family of microcontrollers, so this would allow the group the ability to implement ethernet capability into their System UI & Intelligence module in a quicker fashion. The LAN8710A ethernet controller from SMSC is also a single-chip ethernet controller, but unlike the 10Base-T CS8900A, it is a 10Base-T and 100Base-TX controller. It operates 3.3V with a maximum current consumption of 54 mA at operating temperatures between -40°C to 85°C (depending on version). It offers auto-negotiation, automatic polarity detection and correction, supports MII and RMII interfaces. This ethernet controller could be used if the group decided to run the web application on the TI Sitara SoC because there are schematics available showing how to wire the LAN8710A to the Sitara SoC. Access from LAN and Internet-- In order to facilitate access through the LAN and Internet the system needs to have the appropriate network configuration. Figure 3.2.6-1 shows an ideal network setup for the MCU. First, the MCU must be able to automatically acquire an IP address when connected to the network in the premises. By leveraging the Dynamic Host Configuration Protocol (DHCP) the System UI & Intelligence Module will be able to acquire an IP address from the DHCP server in the network (usually the main router). By making DHCP the

42
default network configuration the system will be more compatible with existing network installations. In the event that the home network does not have a DHCP server in place, the system should be able to setup a fallback IP configuration. This could be implemented in programming and allow the installer to access the system and set it up accordingly. In addition to DHCP the system should also include a NetBIOS name so the installer is able to access it without needing to know the IP address.
Figure 3.2.6-1 MCU Network Setup
Once the system has successfully connected to the local network it needs some mechanism that will allow it to be reached from the internet. The most simple solution would be to assign a hostname to the web server and publish it on the Internet. This is done in a Domain Name Server which responds to DNS requests when a system is trying to access a host with a specific hostname. The DNS server’s response is in the form of the public IP address of the requested hostname. While this might seem straightforward, in the case of targeted audience, most Internet Service Providers (ISPs) do not assign a fixed IP address to a customer. This means that the public IP address could change at any time and then a device on the Internet will not be able to reach the web server. This is where a Dynamic DNS service comes into play. This service allows for updating a Dynamic DNS server with the most up-to-date Public IP address used by the modem on the premises by using a program that will connect to the DNS server and provide it with the latest IP the moment the IP changes or after a predetermined time interval, whichever occurs first. Today, countless numbers of consumer grade modems and routers include a built-in Dynamic DNS updater, allowing for a rapid assignment of a hostname (e.g. myEHVAC.com). In the event that the modem or gateway does not include a Dynamic DNS updater, the system should include an updater client application

43
to make up for the potential lack of one (in linux, one client application is ddclient). This, combined with setting up port forwarding on the modem or router will allow for external access to the system in a way that is simple enough for the user because he/she will reach the server by its hostname instead of it will not require the user to remember a numeric address. Ideally, if the eHVAC system were to be commercialized, the deployment of our its Dynamic DNS service would prove itself to be very convenient for the purpose of simplicity and ease of use because it would include a Dynamic DNS update client and assign hostnames under the umbrella of a domain of the groups choosing. The deployment of their own Dynamic DNS service for the purposes of the project will likely prove itself costly in terms of time and possible money, therefore the group will most likely have to make use of an available free Dynamic DNS service to facilitate access from the Internet.
3.3 Power
3.3.1 System Control The main control unit has very complicated power requirements. It needs 24V AC to switch the dampers, the fan, the compressor etc. At the same time, the main control board uses low voltage DC ICs. Therefore the main control board requires a 24V AC rail, a 5V DC rail, and a 3.3V DC rail. There are many ways to obtain these voltages, such as a transformer to step down the main voltage, receivers and converters to produce the 5V and 3.3V rails. Out of the many methods of satisfying the power requirements of the main control board, the method that the group focused on the most was considered the simplest. Many HVAC control systems require an external transformer or ‘wall wart’ to step down the 120V AC mains voltage to produce 24V AC which the board then uses. The group decided that this method was most deserving of further research. It was shown that a DC/DC buck converter with a simple rectifier circuit could easily produce 5V DC from a 24V AC signal. Once 5V DC is procured, a simple low dropout voltage regulator is all that is required to produce the 3.3V DC required. Thus only two ICs are required to satisfy the power requirements of the main control board. This statement is made with the assumption that a 24V AC wall wart is used to suply the main control board originally.
3.3.2 Remote Sensing Module The remote sensing module is a wireless device which means that power considerations are of high priority when considering its design. The power requirements for the remote sensing module stem from the components that it will consist of. The remote sensing module will use a temperature sensor that

44
will require between two and four volts to drive. The current draw will be anywhere from one tenth of a microamp to approximately four hundred microamps depending on the sensor used and the activity of the sensor. The power requirements are more complicated for the humidity sensor. If the humidity sensor used is a passive capacitive sensor then the power requirements will be low for the sensor, but the support circuitry that goes along with the sensor will require special power considerations. The passive capacitive sensor requires at a minimum a single opamp, and depending on the measurement method chosen it might require frequency counters or highly accurate analog to digital converters. Using an opamp in this system would require at least a five volt power rail, and the analog to digital converter would require +3.3V or +5V depending on converter used. If the humidity sensor used has a voltage output such as Honeywell's HIH-1xxx and 5xxx series then the power considerations are easier to determine. The HIH-1xxx and 5xxx sensors operate down to +2.7V and draw between two hundred and five hundred microamps. The low voltage and current requirements make this a very easy sensor to power, but it outputs an analog voltage. The analog output means that the support circuitry for this sensor includes an accurate analog to digital converter, which increases the power requirements. When considering the support circuitry the power requirements for these sensors are lower than the requirements for the passive capacitive sensors. If the humidity sensor used has a digital output such as Honeywell’s HIH-6xxx series then the power considerations become very simple. The HIH-6xxx series sensors will operate with voltage supplies between +2.3 and +5.5V and they require either six hundred nanoamps or six hundred fifty microamps depending on activity. The HIH-6xxx series sensors have built in analog to digital converters which reduces the component count and the power consumption of the humidity measurement circuit. The source of the remote sensing module’s largest power consumption will be the carbon dioxide sensor. The technology of carbon dioxide sensing being considered uses a chemical reaction to generate a voltage output, but the chemical reaction requires a heater. This heater is driven by +6V and requires two hundred milliamps. This is by far the largest power draw the remote sensing module has. The power consumption will be kept to a minimum by reducing the sample rate of the sensor, but the remote sensing module must be able to supply +6V at two hundred milliamps which is a challenging requirement for battery operated power system. Due to the large current draw of the carbon dioxide sensor the group will most likely be using double-A batteries. The question is then how to get +6V and +3V for the remainder of the circuits. There are several ways to achieve this, but there are three methods that are appropriate for this application. Figure 3.3.2-1 shows one of the simplest methods of supplying power to the module. The
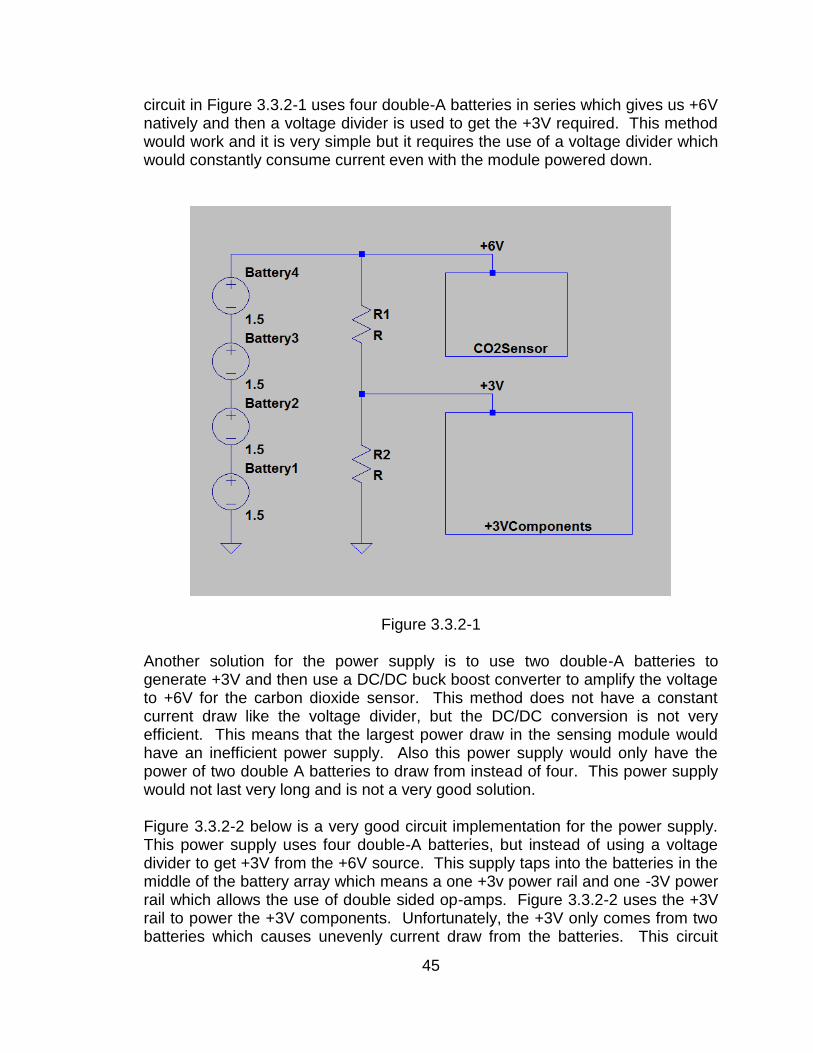
45
circuit in Figure 3.3.2-1 uses four double-A batteries in series which gives us +6V natively and then a voltage divider is used to get the +3V required. This method would work and it is very simple but it requires the use of a voltage divider which would constantly consume current even with the module powered down.
Figure 3.3.2-1 Another solution for the power supply is to use two double-A batteries to generate +3V and then use a DC/DC buck boost converter to amplify the voltage to +6V for the carbon dioxide sensor. This method does not have a constant current draw like the voltage divider, but the DC/DC conversion is not very efficient. This means that the largest power draw in the sensing module would have an inefficient power supply. Also this power supply would only have the power of two double A batteries to draw from instead of four. This power supply would not last very long and is not a very good solution. Figure 3.3.2-2 below is a very good circuit implementation for the power supply. This power supply uses four double-A batteries, but instead of using a voltage divider to get +3V from the +6V source. This supply taps into the batteries in the middle of the battery array which means a one +3v power rail and one -3V power rail which allows the use of double sided op-amps. Figure 3.3.2-2 uses the +3V rail to power the +3V components. Unfortunately, the +3V only comes from two batteries which causes unevenly current draw from the batteries. This circuit
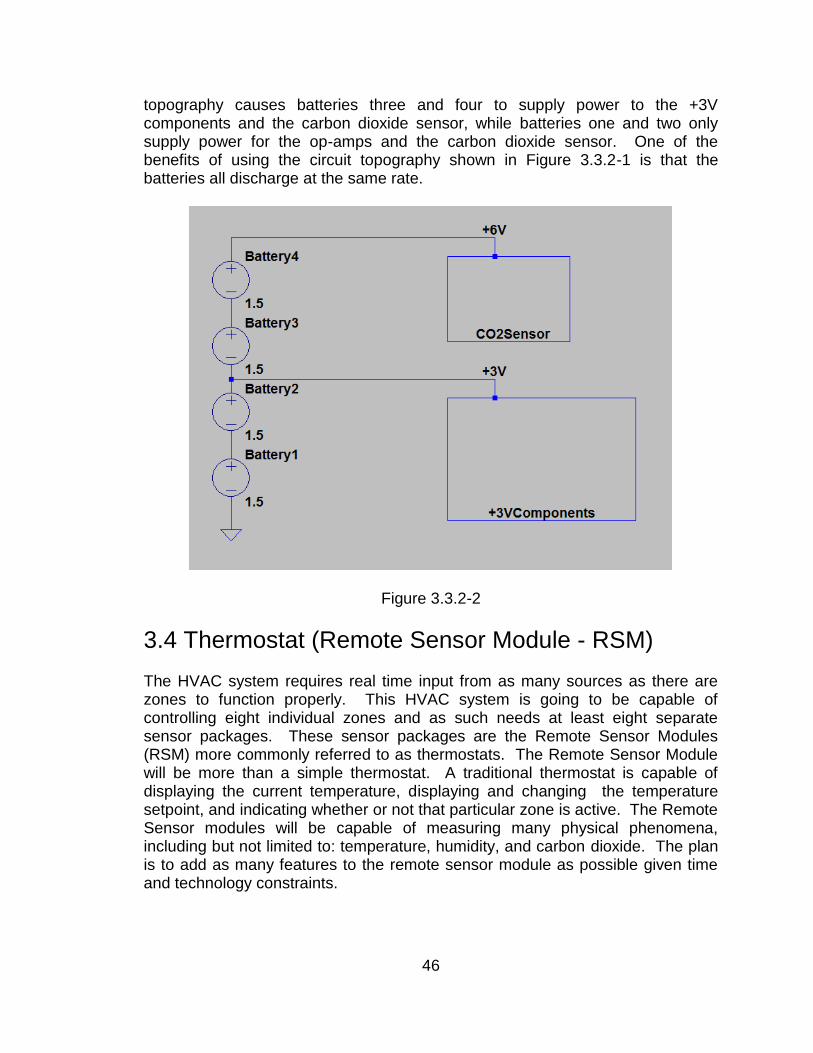
46
topography causes batteries three and four to supply power to the +3V components and the carbon dioxide sensor, while batteries one and two only supply power for the op-amps and the carbon dioxide sensor. One of the benefits of using the circuit topography shown in Figure 3.3.2-1 is that the batteries all discharge at the same rate.
Figure 3.3.2-2
3.4 Thermostat (Remote Sensor Module - RSM) The HVAC system requires real time input from as many sources as there are zones to function properly. This HVAC system is going to be capable of controlling eight individual zones and as such needs at least eight separate sensor packages. These sensor packages are the Remote Sensor Modules (RSM) more commonly referred to as thermostats. The Remote Sensor Module will be more than a simple thermostat. A traditional thermostat is capable of displaying the current temperature, displaying and changing the temperature setpoint, and indicating whether or not that particular zone is active. The Remote Sensor modules will be capable of measuring many physical phenomena, including but not limited to: temperature, humidity, and carbon dioxide. The plan is to add as many features to the remote sensor module as possible given time and technology constraints.
47
3.4.1 Functions The remote sensor module needs to be capable of certain functions in order to work as intended. The following sections will detail the research that has been directed towards the development of the remote sensor modules including, temperature measurement, carbon dioxide measurement, volatile organic compound measurement, relative humidity measurement, human machine interface (HMI) and wireless transmission. Many technologies are described and laid out in this section, with the ultimate goal of improving the design process.
3.4.1.1 Temperature measurement The Remote Sensing Module must be able to collect many types of data at regular intervals. At a bare minimum the Remote Sensing Module must measure ambient temperature, relative humidity of the ambient air, and the carbon dioxide content of ambient air. In this section we will discuss the temperature measurement methods and options. The thermostats for this HVAC must be able to read in the ambient temperature of the room in which they are placed. This temperature information must be relatively accurate, at least when compared to the accuracy of traditional HVAC systems. Traditional HVAC systems are accurate to about one degree fahrenheit, and as such it has been decided that the HVAC system should be capable of at least one half degree celsius accuracy. The group plans on logging all the sensor data the Remote Sensing Module collects and as such it would be preferable to measure all values as accurately as possible. Not only does the group have to consider accuracy when choosing temperature measurement technologies but the group will also have to consider power consumption. The Remote Sensing Module is going to be a battery operated device, and as such power consumption is a big issue. Hand in hand with power consumption is cost. The Remote Sensing Module is by its very definition, modular. This system is going to be capable of hosting multiple zones and multiple zones requires multiple sensing modules, which means small costs can escalate very quickly due to multiple modules. As such, it is very important to keep cost down if possible. There are three main methods of measuring temperature. Temperature can be calculated by measuring the change in resistance due to temperature of a known substance. Temperature can also be calculated by measure the voltage output of several types of custom made ICs. The third common method of measuring ambient temperature is digitally. Some ICs have internal temperature sensing devices coupled with built in analog to digital converters.

48
Temperature sensing devices which use a change in resistance due to temperature to measure ambient temperature are commonly called thermistors. Thermistors are very simple, passive components. They tend to be very cheap, but they require additional hardware to function. For example Murata Electronics North America’s NTSD1XH103FPB40 is a thermistor which has a base resistance of 10k ohms at 25 degrees celsius. 10k ohms at a +5V supply voltage draws 500 microamps which results in a 2.5 mW power consumption which is very high for a passive device which is usually always powered. The only way to de-energize the thermistor is to use additional circuitry which would increase the part count and the overall cost. However this part is very inexpensive and can be purchased for well under $1.00. Unfortunately the thermistor requires an analog-to-digital converter to be of any use. The analog-to-digital converter is the source of most of the error in temperature calculations. This means that the accuracy of the temperature measurement taken from a thermistor circuit is highly dependent on an external component. The fact that an analog-to-digital converter is required for a thermistor to function negates the benefits of its low cost. In summary the thermistor is a reasonably low cost solution, but it consumes a large amount of power, and it requires an expensive analog-to-digital converter to make it accurate. Temperature sensing ICs which output analog voltages such as Fairchild Semiconductor’s FM20S3X are step up in sophistication and cost from thermistors. The FM20S3X requires anywhere from +2.4V to +6V, and has a typical supply current of 9 microamps which draws 37.8 microwatts given median supply voltage of +4.2V. That is a large drop from the 2.5mW power consumption of the theoretical thermistor setup. This makes part a very low power solution to our temperature measurement issue. Unfortunatly like the NTSD1XH103FPB40, the FM20S3X outputs an analog signal which means it requires an accurate and expensive analog-to-digital converter to be accurate enough for the group’s purposes. As with a thermistor this means added circuit board space and added cost. In summary the FM20S3X and parts like it are low power temperature measurement devices but they require additional circuitry to make them accurate, which means they are either low cost or low accuracy. Some temperature sensing ICs output a digital signal. This makes interfacing with these ICs more complicated, but it also reduces the infrastructure needed to operate these ICs. The TMP275 and its variations output digital signals. This means that an analog-to-digital converter is not necessary which is very useful, not only does this cut down on cost, but it also simplifies the supporting circuitry required to use these chips. The TMP275 communicates in many different formats, for example the TMP275AIDGKR communicates via a SMBus™, but the TMP432ADGST communicates via 2-Wire Serial bus, or a I2C™/SMBUS™. ICs with digital outputs have internal analog-to-digital converters and internal power management. This solves two of the issues that plague temperature sensors that have an analog output, these chips require no active external circuitry to operate. The TMP275 does not require any power management circuitry, nor

49
does it require an expensive analog-to-digital converter. Not only that but the TMP275 offers many extra features, such as an adjustable analog-to-digital converter to tune the sensor based on accuracy, time, and power considerations, and alert circuitry which can be set up to give an interrupt based on any temperature based criteria the user needs. Also, the power consumption of the TMP275 is highly controllable, depending on the number of samples taken per second, and the accuracy of the samples, the power consumption can be greatly minimized. The TMP275 requires a power supply of +2.7V to +5.5V, and sources 50 micro amps when taking a temperature measurement, 100 micro amps when communicating on the serial bus. When the TMP275 is inactive and is not taking a temperature measurement, it only sources 0.1 micro amps. This means that the TMP275 consumes at most, 410 microwatts when active, and only 410 nanowatts when inactive. If temperature measurements do not need to be taken very frequently, this chip can be in inactive mode for most of the time which makes for a very low power consumption, which is great for battery operated applications. Unfortunately the TMP275 and chips like it are more expensive than thermistors and ICs that output an analog signal. However once the analog-to-digital converter and power management circuitry is considered, the TMP275 and chips like it are usually cheaper than any other choices. In summary, the TMP275 and similar sensors can be very low power consumption, highly accurate, and affordable solutions for any temperature measurement applications.
3.4.1.2 CO2 Monitoring One of the possible features of the remote sensing module is the ability to monitor carbon dioxide. Carbon dioxide monitoring is a very desirable feature, because carbon dioxide levels can indicate a few things about the quality of air. Carbon dioxide levels in a room can give a rough estimate of indoor air quality. The main producers of carbon dioxide in domiciles are humans and animals. High concentration of carbon dioxide can be hazardous to human health. Carbon dioxide levels can also indicate whether or not the outdoor ventilation of a domicile/room is adequate. High levels of carbon dioxide can be hazardous to human health. The Occupational Safety and Health Administration (OSHA) has set limits to carbon dioxide exposure in the The United States. They are as follows, up to five thousand parts per million (ppm) constant exposure for an eight hour work day, and up to thirty thousand ppm for a maximum of ten minutes exposure. According to OSHA prolonged excessive exposure to carbon dioxide can have several effects such as “headaches, dizziness, restlessness, …, malaise; increased heart rate, elevated blood pressure, ...; convulsions.”[58] The American Society of Heating, Refrigerating and Air Conditioning Engineers (ASHRAE) recommends that the carbon dioxide concentration in rooms not exceed one thousand ppm for personal comfort reasons.

50
Carbon dioxide monitoring can be used to toggle the fan in an attempt to circulate air and reduce the concentration of carbon dioxide in a zone. It can also be used to sound an alarm if necessary depending on the levels of carbon dioxide that are picked up by the remote sensing module. Given the health considerations, it is important that the carbon dioxide monitor be able to reliably measure with a resolution of at least five hundred ppm. A five hundred ppm resolution would be accurate enough to use as an alarm because the sampling resolution is ten percent of the alarm threshold (five thousand ppm for eight hours). Unfortunately a five hundred ppm resolution would not be accurate enough to use as a sensor to control fan activity. To use the carbon dioxide sensor to trigger fan activity it requires a resolution of at least one hundred ppm. Reasonably priced carbon dioxide sensors are usually capable of fifty ppm resolution, any greater and the cost of the sensors increases very rapidly. There are three different carbon dioxide measuring technologies of note; nondispersive infrared sensor (NDIR), Solid State mixed potential electrochemical sensors, and solid electrolyte cell sensors. The nondispersive infrared sensor uses an infrared lamp and an infrared sensor. The lamp emits infrared light, and that light travels through the sample air to be detected by the sensor. The gas sample absorbs light at different wavelengths depending on the concentration of gases that make up the air sample. NDIR sensors use this principle to measure specific gas concentrations with great accuracy and selectivity. One of the very good things about NDIR sensors is that they can be made very selective to a specific gas. Unfortunately NDIR sensors are high power sensors, requiring currents greater than twenty milliamps at +5V. Most NDIR sensors have an analog output, meaning a high precision analog to digital converter would be necessary to take advantage of the high accuracy of the sensors themselves. NDIR sensors are very expensive as well, and considering the multiple instances of the remote sensor module it is very important that the cost of each individual module be kept as low as possible. To summarize, NDIR sensors are high performance, high cost, and high energy cost sensors that are more appropriate for fixed applications and applications in which cost is much less of a concern that accuracy. Solid-state mixed potential electrochemical sensors measure concentrations of desired gases by using differential electrocatalysis on electrodes made of electrically different materials. These sensors are characterised by a relatively (compared to NDIR and solid electrolyte cell sensors) low power consumption, average monetary price, and low accuracy when dealing with small concentrations of the measured gases. These sensors are very appropriate for industrial and alarm applications but, when considering the low concentration accuracy that these remote sensing modules require, these sensors are simply too inaccurate at the anticipated operating range. In summary, solid state mixed potential electrochemical sensors are low energy cost, median monetary cost, and low accuracy sensors which are more appropriate for alarms, and industrial

51
applications in which the concentrations of the measured gases are high and accuracy is not the most important parameter. Solid electrolyte cell sensors use inorganic ionic conductors and the change in electrical properties due to interaction with gases to measure the concentration of targeted gases. For example, the MG811 is a carbon dioxide sensor that uses the solid electrolyte cell principle to function. It has been designed such that the cathode and anode of the cell undergoes a chemical reaction when exposed to carbon dioxide. When in the presence of carbon dioxide, this electrolyte cell generates a potential between the anode and the cathode. As with the SDIR sensors, solid electrolyte cell sensors have an analog output which requires a analog-to-digital converter. In particular, the MG811 requires a high impedance (one hundred to one thousand megaohm impedance) amplifier to make the signal readable even with a high precision analog-to-digital converter. So long as the amplifier does not introduce any error, the MC811 is capable of an accuracy of plus or minus 40 ppm. Unfortunately the electrical characteristics of the cells in these sensors are highly dependent on their temperature. To get around this issue these sensors are built with heating coils which raises the cell to an appropriate and stable temperature such that an accurate reading can be made without thermal drift affecting the output. These heaters require a good deal of power. The MG811 requires two hundred milliamps at +6V just for its heating coil. This is an order of magnitude higher than the current draw of most NDIR sensors, but solid electrolyte cell sensors are low cost solutions to gas measurement applications. The MG811 can be purchased for as little at twenty dollars. In summary, solid electrolyte cell sensors are very high energy cost, low monetary cost, and reasonably accurate sensors. These sensors are very suitable for low cost applications.
3.4.1.3 VOC Monitoring In the most general of terms volatile organic compounds are organic chemical compounds that have a high vapor pressure. This causes a large number of these molecules to sublimate into the atmosphere or in the case of domiciles, into the air that occupants breath. This is a very broad definition, and definitions of volatile organic compounds vary between countries. In the United States of America, it is defined as a subset of volatile organic compounds, but this subset is only for volatile organic compounds that are monitored and regulated by governing bodies[49]. Most definitions for volatile organic compounds are mainly applicable to industrial bodies such as manufacturers. In the US volatile organic compounds in non industrial air are not regulated by law. Volatile organic compound monitoring is important in HVAC systems because the products that are placed in domiciles usually contain volatile organic compounds which sublimate over time. The concentration of volatile organic compounds in residential buildings is usually much less than the concentrations in manufacturing facilities, but they are still five times higher than outdoor

52
concentrations and volatile organic compounds are a known health risk. The health risks associated with volatile organic compounds has been the subject of much research and it is accepted as fact that man-made volatile organic compounds can cause “Eye, nose, and throat irritation; headaches, …, nausea; damage to liver, kidney, and central nervous system. Some organics ... known to cause cancer in humans.”[49] These health risks are usually associated with high concentrations, but considering the duration of exposure to any volatile organic compounds found in a residence due to the nature of the occupancy, HVAC systems warrant volatile organic measurement. Health concerns aside, volatile organic compounds can be used as indicators of air quality in HVAC systems, much as carbon dioxide is. Using carbon dioxide sensing as a main method to control the quality of air has been the standard for a long time, but carbon dioxide itself is not a very good indicator of air quality. Volatile organic compounds such as acetone, heptane, formaldehyde, cooking odors, etc. cannot be monitored using a carbon dioxide sensor. Monitoring all of these gases requires a very robust volatile organic compound sensor, and having the capability of measuring these gases and those like them would make controlling the air quality with a HVAC system much easier. Unfortunately, volatile organic compound sensors are very specialized. To add volatile organic compound sensing to the HVAC system would require that the group focuses on a small subset of all compounds that are prevalent and especially important to monitor. Even when considering the high selectivity of these sensors the biggest issue concerning volatile organic compound sensors is the cost of the sensors themselves. Profesional sensors are sold as data loggers for industrial applications for several thousand dollars, and the benefit of volatile organic compound monitoring does not justify such an expense. Even if we used a very simple and low cost sensor it would still be prohibitively expensive.
3.4.1.4 Humidity Monitoring One of the many planned features of the remote sensing module is humidity monitoring and possibly humidity control. This is a very desirable feature for several reasons, mainly that the air’s relative humidity in a domicile can greatly affect the comfort levels of its occupants. Also, high levels of relative humidity can cause condensation which can cause damage to electronics and excessive wear on the domicile itself. Condensation can damage furniture, paint, and even the HVAC infrastructure (such as dampers and air registers). As the temperature of air increases, its ability to hold moisture increases and as such an absolute humidity measurement is not very useful. Thus humidity sensors measure relative humidity. Zero percent relative humidity indicates that the air is completely devoid of moisture, and one hundred percent relative humidity indicates that the air is saturated, and the air’s temperature/humidity combination has reached the dew point.

53
The humidity sensors for this project do not need to be very accurate, plus or minus five percent relative humidity is an acceptable accuracy level. This is because desired humidity ranges are very wide. The American Society of Heating, Refrigerating and Air Conditioning Engineers (ASHRAE) recommends that humidity be kept between thirty and sixty percent relative humidity to maintain comfort[41]. With a thirty percent relative humidity leeway, a humidity sensor accurate to five percent relative humidity is acceptable. Ideally the group would use a sensor with a two percent relative humidity accuracy, what is chosen depends heavily on monetary expense and power consumption. When considering humidity sensor technologies, there are two main technologies to consider. The simplest technology is a passive capacitive humidity sensor such as the HCH-1000 series from Honeywell. The other technology is much more complicated such as Honeywell’s HIH-6100 series dual humidity/temperature sensors. The passive capacitive sensors operate based on the principle that the presence of water on a capacitor’s dielectric sheet will increase that capacitor’s capacitance. Most of these sensors are constructed by creating a capacitor out of two dielectric sheets where only one sheet is exposed to the air sample to be measured for humidity. These sensors can be very accurate, are very low power consumption, and they are usually very low cost solutions. Yet the change in capacitance due to humidity is very small and reading these capacitive sensors requires a method to measure capacitance which is not easily achieved. There are three widely accepted methods of measuring capacitance. Capacitance can be measured using an oscillator and timing circuit, a charge measurement based approach, and a bridge approach. The oscillator approach requires that the humidity sensor be used in a oscillator as part of the time constant. Then a frequency counter is used to measure the frequency of the oscillator and thereby calculate the capacitance of the sensor which is then used to calculate the relative humidity of the sample air. This approach requires a large amount of support circuitry and can be difficult to calibrate, especially considering the small change in capacitance that the sensor undergoes across the measurement range. A charge based approach uses a capacitor with a known capacitance and a known voltage source to measure the capacitance of the sensor. At first the known capacitor is charged by the known voltage source. Then the voltage source is opened and the known capacitor is connected to the humidity sensor. Once the output voltage settles, the capacitance of the sensor can be measured using the output voltage. Unfortunately this method has many error sources, such as capacitor tolerance which is usually ten percent of the rated value, and capacitor leakage which would quickly skew the result. The output of this measurement method is an analog voltage which would require a high precision analog-to-digital converter to give an accurate measurement.

54
The third method of measuring capacitance is an AC bridge approach. This method requires an AC signal to drive two branches of a difference bridge. One leg of the bridge has a purely resistive load, the other has a complex load due to a resistor and the sensor. A difference amplifier is then used to measure the difference in the two legs which is then used to measure the capacitance of the sensor, and therefore the humidity. This approach can be made very accurately using a crystal oscillator to excite the bridge. While accurate, this approach requires a high precision instrumentation amplifier and an analog-to-digital converter, but it has a very low power consumption. The IC packaged humidity sensors that output digital information, such as Honeywell’s HIH-6100 series dual humidity/temperature sensors, use much of the same principle behind the passive capacitive sensors. However, these packages are much more sophisticated. The list of features varies between the different sensors but, it is possible to get a humidity sensor that communicates on an I2C bus, has a built in fourteen bit analog-to-digital converter, has a built in temperature sensor, and automatically calibrates the output based on thermal drift. In particular, the HIH-6100 dual humidity/temperature sensor has a built in temperature sensor which is used to compensate the output for thermal error automatically. It also has two built in fourteen bit analog-to-digital converters used to provide a digital output for both the humidity sensor and the temperature sensor. For these digital outputs, the sensor is capable of operating on an I2C bus, and because the sensor is an active component, it is easy to adjust operating times and thus reduce power consumption. The HIH-6100 consumes six hundred microamps at +3V when taking a measurement but it only consumes one microamp at +3V when in sleep mode. Another feature of the HIH-6100 is that it is capable of operating with a supply voltage as low as +2.7V. The HIH-6100 also has two built-in adjustable alarms for humidity levels which can be used as interrupts for the main controller to save battery life. Some IC packaged humidity sensors have analog outputs, such as the HIH-5030. These sensors are easier to use than traditional capacitive sensors. These sensors are designed such that they output a millivolt voltage which can be amplified and inputted to an analog-to-digital converter to use the sensor reading in a digital controller. These analog output humidity sensors are less expensive than the digital output sensors and are easier to interface with than the purely passive capacitive sensors, but the all-in-one digital output humidity sensors are more cost efficient once all costs accrued are considered by the support circuitry required for the analog output sensors. This is because the digital output humidity sensors do not require any output signal conditioning. Most of the cost of a humidity sensing circuit that uses a passive capacitive sensor is related to the support circuitry, the sensor is usually one of the cheapest parts.

55
In summary, there are many ways to measure relative humidity in an embedded application. If accuracy is not an issue there are several low cost solutions to humidity monitoring, but if high accuracy is required then all of the solutions become much more expensive. All three sensor types explored in this section are capable of the accuracy required for these modules, but the complexity of the circuitry and the difficulty of achieving the required accuracy is very high when using the passive components. System on chip solutions with digital outputs such as the HIH-6100 have higher component costs, but when considering that they require no support circuitry the total cost is actually less. System on chip solutions are very easy to interface with because of the purely digital output, and they are usually very low power because the sampling rate can be adjusted to suit the specific needs of each application. System on chip solutions can very easily be highly accurate as well mainly due to the fact that they are internally corrected for temperature error.
3.4.1.5 Zone Control Except for very small or very old installations, all HVAC systems have multiple zones. One of the main reasons for this HVAC control project is to enable the owner/user to control a HVAC system that uses multiple zones in a sophisticated and intelligent manner. Thus it is important that the system is able to control these zones appropriately. HVAC systems use zones to improve inhabitants’ comfort as well as reducing the energy costs of the system. Utilizing zones improves HVAC control systems in two major ways; first adding a zone adds a thermostat which increases the amount of information that the main controller can use to regulate temperature and air quality. Also zones enable the HVAC system to cool separate sections of the house independently which helps balance the system and reduce hot/cold spots. Buildings are sectioned and zoned according to two major considerations; how many zones are going to be installed; and how many floors does the building have. A typical house installation will have one zone per floor because temperatures vary a great deal between floors. In more advanced systems each floor may have two or even three zones, and these zones are usually created based on the path of the sun. The sun contributes much of the heating in houses, and thus the position and path of the sun is important when designing zones. Ideally each floor will have a zone for the west quarter of the house, the east quarter of the house, and the middle half of the house. This setup allows the HVAC controller to direct more cold air to each zone as the day progresses which keeps all zones at a comfortable level and reduces the runtime of the system and compressor which reduces energy costs while maintaining comfort. Consider a floor of a house that is set up with three zones. The west quarter of the floor is one zone, the east quarter of the floor is another, and the middle half

56
of the floor is setup as one zone. As the day progresses the sun moves from the east to the west, which causes each zone to heat differently as the day progresses. If the house had only one zone, the thermostat would be placed in the middle of the floor which would mean that the side of the house exposed to the sun would be hot, the side of the house in shadow would be cold, and the HVAC system as a whole would be consuming more power than necessary. The actual control is handled by the main controller. The main controller will be electrically connected to the motors that drive the dampers which control air flow. Each remote sensing module is responsible for sampling the temperature in its respective zone and reporting that value to the main controller which will then, based on the setpoint, make the necessary changes the the HVAC system to control the temperature in the zone as desired.
3.4.2 Hardware In the following sections the research that has been applied to specific hardware solutions will be presented. The goal of the following section is to detail potential hardware solutions to fulfill the requirements of the remote sensing module.
3.4.2.1 Microcontroller Hardware The choice of the remote sensing module’s microcontroller is very important. There will be only one microcontroller used in the remote sensing module, and it will be responsible for every feature that is planned for it. This means that the choice of microcontroller is highly dependent on all other hardware used in the module. This microcontroller must be able to communicate with an I2C bus and a SPI bus, it must have at least 3 analog-to-digital converters (this is subject to change depending on sensor hardware), and it must be able to be powered by less than +6V, ideally it will be able to accept +3V power. Another major consideration for the microcontroller is power consumption. The remote sensing module is a battery powered system, and as such power consumption is a big consideration. There are three major (well known) semiconductor companies to look at when considering microcontrollers. Atmel is known for its AVR ATmega family which is very popular because of the arduino hobbyist board. Texas Instruments is very well known in the semiconductor business and their MSP430 family of microcontrollers is well known for the low cost of individual microcontrollers and their extremely low power consumption. Texas Instruments’ (TI) MSP430 family of microcontrollers is very well suited to this project. The MSP430s are very low cost chips which makes them a good choice for the remote sensing module. Depending on the specific chip, they can be extremely low power chips with some only requiring +1.8V and drawing less

57
than one microamp when in sleep mode. The MSP430 family is very diverse and full featured. The microcontrollers on the low end draw less than one microamp and the upper end F5xx series are very powerful chips with many input/output pins and up to 25 MIPS which is much more than the remote sensing module is going to require. Atmel’s 8/16-bit AVR XMEGA family is very similar to TI’s MSP430. The 8/16 VR XMEGA family operates up to 32 MHZ and up to 32 MIPS which again, is much more than this module will need. Atmel’s XMEGA family is an AVR based microcontroller. They will operate down to +1.6V and require only five hundred microamps when in sleep mode. Atmel’s XMEGA family is very comparable to TI’s MSP430 family but in general is the more expensive of the two. Both TI’s MSP430 and Atmel’s Atmega microcontrollers have JTAG programmers that also debug. TI’s MSP430 uses the MSP-FET430UIF which can be connected with a JTAG or with the two wire SPI JTAG protocol. The MSP-FET430UIF retails for one hundred dollars which is approximately one third the cost of Atmel’s JTAG programmer/debugger. Atmel’s middle level AVR programmer/debugger uses the AVR JTAGICE mkII which retails for approximately three hundred dollars, which means that getting started programming with Atmel is very costly. In general, due to the close relationship established with Texas Instruments, and the price of the JTAG programmer, it is likely that a microcontroller from TI’s MSP430 family will be chosen.
3.4.2.2 Input/ Output Hardware The remote sensing module must have a way to output data to the user and the user must have a way to input data to the module. There are several ways to accomplish this. The method chosen depends in part on the programming style used for the microcontroller. The remote sensing module is powered by batteries which means that it needs the input and outputs to be as low energy as possible. The group also needs the code that is running on the microcontroller to be as efficient and low energy as possible. This means that the group will be using an interrupt driven programming style for the main microcontroller in the remote sensing module. Interrupt driven programming means that the microcontroller is going to be in sleep mode for the majority of its life as a sensing module. The only time the microcontroller is going to come out of sleep mode is when it gets an interrupt, at which point it will carry out a predetermined action based on what the interrupt was. There are a few input technologies which lend themselves nicely to this programming style. Pushbuttons are a mainstay for microcontroller inputs and another useful input are rotary encoders. Pushbuttons either open or close an electrical connection, which the microcontroller sees as an interrupt. Rotary encoders are similar to pushbuttons in that they open or close an electrical connection, but they do so when the user rotates the encoder. This style of input

58
lends itself well to scrolling through lists or adjusting continuous values (such as the setpoint) up or down. Another input technology that is becoming more popular lately is the capacitive touch sensor. Capacitive touch sensors are very interesting and they tend to give any project a bit of sophistication and in general are more impressive than pushbuttons. The capacitance of the sensor changes when a finger or stylus is present. This capacitance is used to control the frequency of an oscillator, at which the frequency is then measured using a counter. The change in frequency is read as a change in capacitance which in turn indicates an input. The major issue with capacitive touch inputs is that they require constant power and a large amount of support circuitry. On the other hand, push button and rotary encoder inputs do not look as nice as capacitive touch sensors, but they only require a voltage to be applied to an open circuit to function as inputs. There are a few ways to go about adding outputs to the remote sensing module. The easiest and cheapest method is to add a few LEDs, but LEDs do not provide enough information for the user. The remote sensing module needs a graphical display, but there are many ways to do this. One graphical display technology that is very simple and provides a good amount of information for the user is LCD display technology. LCD displays come in many forms and one of the most prevalent forms is the seven segment display. This display is very easy to interface with and is very simple. Unfortunately it is difficult to read alphabetic characters from the seven segment display. LCD displays also come as dot matrix displays. Standard dot matrix displays are not very high resolution but they display alphabetic characters much better than seven segment displays. One of the drawbacks to using a dot matrix display is that they require a large number of inputs to drive them. A common practice for controlling dot matrix LCD displays is to use a LCD driver which is addressable over a digital interface. Many dot matrix LCD displays come complete with drivers built into them which makes interfacing with them very easy. One of the major considerations that must be taken into account when using dot matrix displays is the character and line count. These displays typically have anywhere from one to four lines and anywhere from four to thirty character spaces. Dot matrix displays are excellent outputs for low cost, low power applications.

59
Section 4: Design Specifications The following sections are meant to specify the design choices that will be made for this project. In the previous section, many alternative design methods were introduced to find the best way to design this project. Each decision was based upon the specifications laid out earlier in this paper.
4.1 System UI & Intelligence These sections are for the design choices that will provide a user-friendly web application that is accessible from anywhere a user has internet connectivity. The decisions made were the most appropriate and efficient in terms of design and application.
4.1.1 Software The software design for the System UI and Intelligence portion of this system will be discussed in the following sections. The coding language, platform, and framework for the web application layout will be chosen and discussed why this method was used.
4.1.1.1 Platform After careful consideration the group decided to fully implement the web application in Google App Engine. This decision was made based on how the use of Google App Engine would in turn reduce the complexity of the hardware in the MCU by completely removing the System UI & Intelligence module from the MCU and moving it to the cloud making it a completely independent entity. As shown in figure 4.1.1.1-1 Google App Engine will provide the HTTP server, CGI, database (Datastore), and load balancing for the eHVAC web application, only requiring minimum fine tuning on the group’s part. This will provide the group with savings in the allocated resources for developing the necessary backend to run the web application. The main drawback of Google App Engine is the read-only filesystem access. Even though in section 3 it was determined that a filesystem was needed for a database, the APIs provided by Google for the Datastore should suffice for accessing and manipulating it. For accessing the web applications anywhere on the internet Google App Engine assigns a hostname to all uploaded applications, so the group reserved in advance the hostname ehvac2012.appspot.com for use (subject to change) in testing and possibly final deployment. A relatable and familiar hostname will help users remember how to reach the application from outside their homes (especially those who are not technologically savvy). For maintaining

60
communications with the MCU, the web application will record the public IP address used by the MCU when communicating with it. The group will also implement a timer on the MCU that will check for a change in the public IP address and force an update in the event that it has changed. This ensures that the web application always knows which IP address to communicate with. The communication with the MCU will be done by implementing CGI handlers on both ends (web application and MCU). These CGI handlers should trigger changes or functions on the receiving end instead of generating web pages. The leveraging of CGI for communications should help simplify development as it is also a common interface for exchanging data between internet-connected devices.
Figure 4.1.1.1-1 Google App Engine Diagram
4.1.1.2 Programming Language After digging through all the research to find a suitable programming language the group would need to write their project with, they sat down and decided that Python would be the best fit. To begin with, they first looked into its ease of use. Through research they found out that it is one of the easier languages to use not only in the web application but in general. More specifically, as the example explained in 3.2.2.6 shows, a typical coding language like Java requires not only a specific line of code that can execute a simple structure like Printing Hello World to the screen, it also requires a declaration of variables and a declaration of the “main” where code will be executed. Python does not require a declaration like “int” or “double” but instead inherently can determine what type of variable a

61
user is creating. Also, Python does not require a compiler by which it needs to produce viable code; instead it is interpreted code executed by an interpreter. Python’s extensive community support which provides many resources that will be needed when implementing the code. Another accessory that Python has to offer is its wide library which includes importing tools the group can use when they are trying to communicate with the System Control microcontroller and also its sophisticated library of scientific tools like its graphing and interpretive tools. These tools will come in great handy when they implement the code for graphing stats and readings on the web application. Another reason why the group chose Python is the fact that it can be used by the Google App Engine. The Google App Engine allows for the deployment of Python applications on Google infrastructure, requiring minimal server setup on the group’s part.
4.1.1.3 MVC Framework The MVC Framework the group chose was the web2py Framework. Initially they decided that they would use the Python programming language because of its many assets and features. From there they needed to decide which MVC Framework they would use and why. Through their research they found that Web2py seemed to be the best choice for implementation in the system. Firstly, the group chose web2py because of its obvious implementation of Python. Next, they looked into its structure and layout and found that its organization template was very simplistic in nature and easy to use. The way it sets up its framework is clean because unlike most MVC Frameworks it fully separates the Model, the View, and the Controller. This allows for ease of access to specific files. Another advantage of the Web2py framework is the Database Abstraction Layer (DAL) by which is sets up databases. This structure takes Python objects and maps them into a database and then creates objects for that database. Finally, a large requirement of the project after much researching is the use of the Google App Engine as was discussed in 3.2.2.5. The group would need to make sure that the specific framework they chose would be able to run smoothly on Google App Engine which web2py can do with minimal setup.
4.1.1.4 Database Structure One of the most important pieces to the HVAC Control system is the database. As discussed in the research section of the paper, the database will house all of the data. After many discussions, it was decided that they would use Google App Engine’s Datastore for the database. Their database will be comprised of roughly 10 kinds of entities based on 10 Python data object class models; each kind will be described and shown how they relate to one another.

62
Initially when the eHVAC web application is initialized there will be entities of two kinds initially created. These two kinds are Modes and WeekDays. The Modes entities will have a unique ID that it will be given by the system and will be used in other parts of the system as well as a corresponding mode by which the system will be operated with. More specifically, these IDs will be referenced by a corresponding mode like cool, heat, emergency heat or off. The WeekDays entities will store its unique ID value like the Modes entities and the corresponding day of the week as a string. These entities will be referenced later in the other entities in the database. The next kind to be discussed is the System_Settings data object. There will be one entity of this kind and will contain many different properties with some being set at time of installation. Some of these properties include the Default Temperature Setpoint value, the Default Temperature and Humidity Sampling Frequency, the Default CO2 Sampling Frequency and the Temperature Overshoot. This entity will also have a Units Celsius property of boolean type which will default to True and cause the system to display temperature in celsius. If this setting was set to False, then the system would display temperature in Fahrenheit instead. The final properties that will accompany the entity System_Settings are the Infrastructure properties. The main purpose of these properties are for indicating what HVAC system setup is on the premises. The available property settings for system infrastructure are vents, fans, heating and compressor type. The vents property will be implemented as an integer that the user will be shown as a series of checkboxes they will get to choose from. These however in the background of the GUI will be really implemented as a 2-bit value and will be saved as an integer in the system after an option has been chosen. To give an example, the vents property will have 2 options (open and close) which will be set up as a vertical list on the web application with open being on top and close being on the bottom. Initially, the system will set this as “00” which means none of the options will be checked. Once one of the options has been checked the system will register that value as a binary number, for example, if Open is selected then the value would be “10” and Close would be “01.” Once the option has been checked by the user the system will then convert that binary string into an integer to store into the entity Vents_Type which will be saved into the System_Settings entity. The next property that System_Settings will address is Fans_Type. This property has only one option which is One Speed which will be chosen by the user. The database will store this property as a boolean value where when the system is first initialized the user will have to click the option for the One speed fan during setup. The system will have the default value as False until the user chooses the option for a One speed fan. Like the Vents_Type property worked, the final two properties--Heat_Type and Comp_Type--will work the same exact way but with a 3-bit addressable word that will be saved as an integer into the database after the user has chosen the options pertaining to the HVAC installation. Heat_Type will have 3 options for the user to choose from which will be a Heat Pump component, Coil component, and oil furnace component all of which can be set individually. The Comp_Type
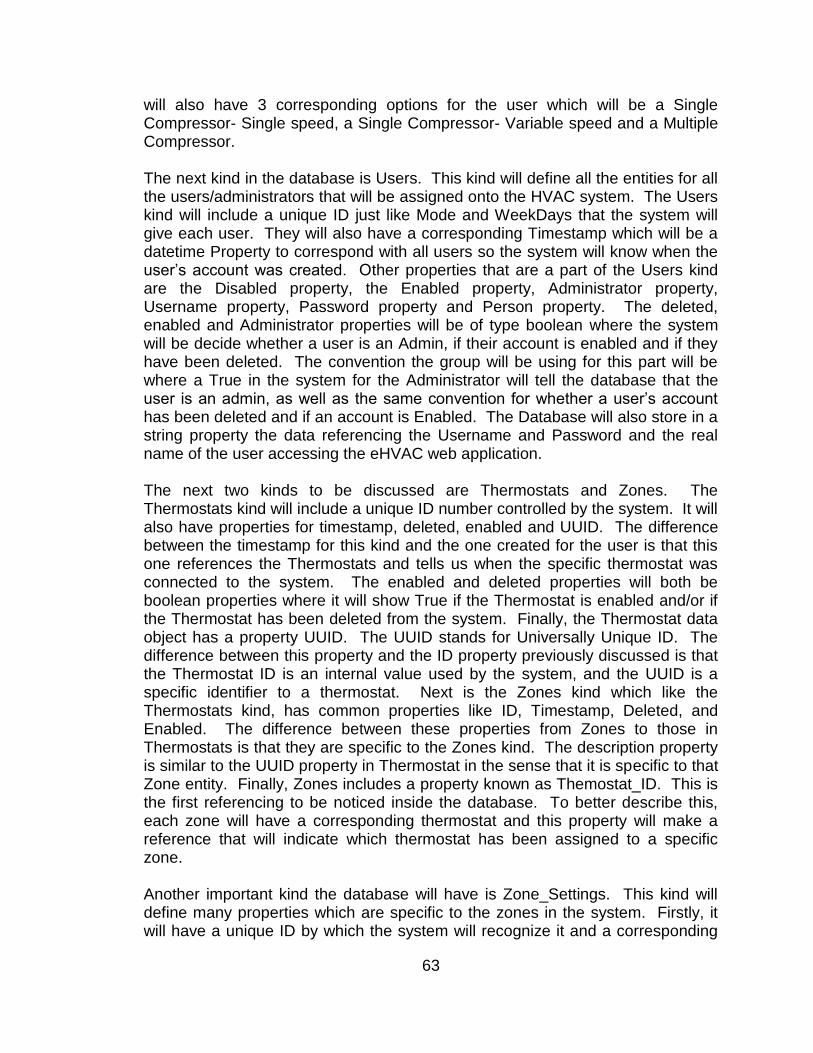
63
will also have 3 corresponding options for the user which will be a Single Compressor- Single speed, a Single Compressor- Variable speed and a Multiple Compressor. The next kind in the database is Users. This kind will define all the entities for all the users/administrators that will be assigned onto the HVAC system. The Users kind will include a unique ID just like Mode and WeekDays that the system will give each user. They will also have a corresponding Timestamp which will be a datetime Property to correspond with all users so the system will know when the user’s account was created. Other properties that are a part of the Users kind are the Disabled property, the Enabled property, Administrator property, Username property, Password property and Person property. The deleted, enabled and Administrator properties will be of type boolean where the system will be decide whether a user is an Admin, if their account is enabled and if they have been deleted. The convention the group will be using for this part will be where a True in the system for the Administrator will tell the database that the user is an admin, as well as the same convention for whether a user’s account has been deleted and if an account is Enabled. The Database will also store in a string property the data referencing the Username and Password and the real name of the user accessing the eHVAC web application. The next two kinds to be discussed are Thermostats and Zones. The Thermostats kind will include a unique ID number controlled by the system. It will also have properties for timestamp, deleted, enabled and UUID. The difference between the timestamp for this kind and the one created for the user is that this one references the Thermostats and tells us when the specific thermostat was connected to the system. The enabled and deleted properties will both be boolean properties where it will show True if the Thermostat is enabled and/or if the Thermostat has been deleted from the system. Finally, the Thermostat data object has a property UUID. The UUID stands for Universally Unique ID. The difference between this property and the ID property previously discussed is that the Thermostat ID is an internal value used by the system, and the UUID is a specific identifier to a thermostat. Next is the Zones kind which like the Thermostats kind, has common properties like ID, Timestamp, Deleted, and Enabled. The difference between these properties from Zones to those in Thermostats is that they are specific to the Zones kind. The description property is similar to the UUID property in Thermostat in the sense that it is specific to that Zone entity. Finally, Zones includes a property known as Themostat_ID. This is the first referencing to be noticed inside the database. To better describe this, each zone will have a corresponding thermostat and this property will make a reference that will indicate which thermostat has been assigned to a specific zone. Another important kind the database will have is Zone_Settings. This kind will define many properties which are specific to the zones in the system. Firstly, it will have a unique ID by which the system will recognize it and a corresponding

64
Zone_ID by which it can reference a specific Zone in the system. As well, it will include a Mode_ID which references the Mode entity that indicates what mode the system is whether it be cool, heat, emergency heat or off. Other properties in Zone_Settings are: Timestamp, Deleted, Temp_Setpoint, TempHumid_Sampling_Freq, and CO2_Sampling_Freq. Timestamp will indicate when a zone has been created/added to the system. Like the other parts of the database, the deleted property will be of boolean type and will indicate whether or not a zone has been deleted from the system with value of True indicating deleted and False indicating otherwise. Some properties of this kind will be automatically set during entity creation based on property values in the System_Settings entity and they are the Temp_SetPoint, TempHumid_Sampling_Freq and CO2_Sampling_Freq. One of the most important kinds in the database is the User_Zone. This is important because it defines all the user-zone assignments. To explain, there will be a unique ID controlled by the system. When a user is given access to a specific zone the system will create an entity defining the user-zone assignment. It will reference the User_ID from the Users entity for that user and the Zone_ID from the Zones entity for the assigned zone to indicate that a specific user has access to a specific zone. Other properties that User_Zone will have are Deleted, and Enabled. These will tell the system whether or not the assignment is active, inactive or deleted. The Zone_Readings kind is a huge portion of the database because it is used not only in the history records for when the user needs to see the history of their system, but it also comes into play when the user is accessing the web application and would like to see the values of the Temperature, Humidity and CO2 in the zones. The properties that are a part of this kind are as follows: ID, Timestamp, Deleted, Zone_ID, Thermostat_ID, Temperature, Humidity, CO2, and CO2_Timestamp. Like most of the other kinds in the database, Zone_Readings will have a corresponding ID that the system will set when creating the entry and a Timestamp indicating when it was received from the Main Control Unit. The Deleted and Enabled properties will indicate whether the entity has been deleted or enabled/disabled in the system. Zone_Readings also references the Zones and Thermostats entities for the zone and corresponding thermostat the reading originated from using their respective ID properties. The actual readings for Temperature, Humidity and CO2 will be stored as integers. Along with these values, the database will also record the timestamp of when the reading was made by the thermostat it originated from. The final kind in the database is Schedules. This is is what sets this HVAC control system apart from most other ones. The advantage of having this feature is so the user can set a time, date and zone to a specific temperature whenever they feel like from wherever they are. This kind is constructed by the following properties: ID, Timestamp, Deleted, Enabled, Zone_ID, Day_ID, StartTime, EndTime, Temp_Setpoint and Mode_ID. ID, Timestamp, Deleted and Enabled

65
properties behave like those mentioned in the previous kinds. When a schedule entry is created StartTime and EndTime properties will specify the start time and end time for that scheduled system operation. Zone_ID, WeekDays_ID and Mode_ID are also referenced from their respective entities specify which zone is being scheduled, which day the scheduler is accounting for and the mode by which the scheduler will be set as. A diagram for the database with the associated data objects and entities can be seen in Figure 4.1.1.6-1.
Figure 4.1.1.6-1 Database Diagram
4.1.2 Web Application Layout One of the largest and most integral aspects of this project is the web application and its user interface. The goal of this section is to show the user what kind of abilities they will have with adjusting settings with the HVAC system from changing the temperature to adjusting personal preferences for power savings as well as a multitude of other things. In this section we will take a look at a high level schematic of user-system associations as well as possible design layouts for the web application.

66
The web application is comprised of many parts that the user will be able to interact with. The web application will be coded at the high level with Python. This along with HTML and CSS will ensure ease of understanding for the user. Looking at the web application in a high level sense one can see that there are two types of people who are able to access it. These two types are the user and the administrator. Typically a “user” is a person who has limited access and will only have access to select zones and will be able to do the following things to these zones: view and change schedules, adjust temperature settings, adjust power settings, access to low level settings like changing their password and viewing the history, temperature and humidity of these zones. This means they can only adjust settings and read history in those zones they have access to. The administrator on the other hand will have all the access a “user” has as mentioned before but will also be able to access all the zones and settings including changing the system infrastructure settings which include settings for older systems that can be implemented into our system. Also, the administrator will be able to adjust the user management settings by being allowed to change, delete, and add usernames. The administrator will also have access to giving other users administrative access. A detailed schematic of this is shown in the Use case Diagram in Figure 4.1.2-1.

67
Figure 4.1.2-1 Use Case Web Application Diagram
The layout of the web application will be comprised of 7 different main pages. These pages consist of the Home Page, Zones, Schedule, Graphs, History, Settings and About. All of these will be shown with prototyped figures and will be explained later in this section with much detail. Like the High Level Schematic design from Figure 4.1.2-1 the user will be able to see the functionality of the web application and the features that will be available to them. To start, the user will connect to the web application via a URL that will be chosen sometime in the future for the HVAC Controller. From here, the user will be taken to a Welcome Screen as shown in Figure 4.1.2-2. Here they will be able to enter the control panel (web application). However, one of the more prominent features the web application will include is our security. The user will be prompted to type in a username and corresponding password upon entering

68
the site, shown in Figure 4.1.2-3. Depending on what username the user has will define whether or not that have access to specific zones.
Figure 4.1.2-2 Welcome Screen Layout
Figure 4.1.2-3 Password Prompt
Once the user has correctly inputted the password needed to access the web application they will be transferred to the Home Page as in Figure 4.1.2-4. From here the user will be given many options to choose from as well as many readings/ data to enquire. The Home Page will have many features including but not limited to links to the following pages: Home, Zones, Schedule, Graphs, History, Settings and About. These pages will be further discussed later on in this section. However, to start with, from the main Home Page the user will be able to see Temperature readings from throughout the system and in particular: Current inside Average Temperature, Current Average Set Point Temperature, Current Average Humidity and Outside Temperature. The user will be given an option to choose which city they are in so as to display the outside temperature. This will be created by using an RSS Feed. Other features on the Home Page will include displaying the Zones and the connection statuses as well as the temperatures in each one. The user will also
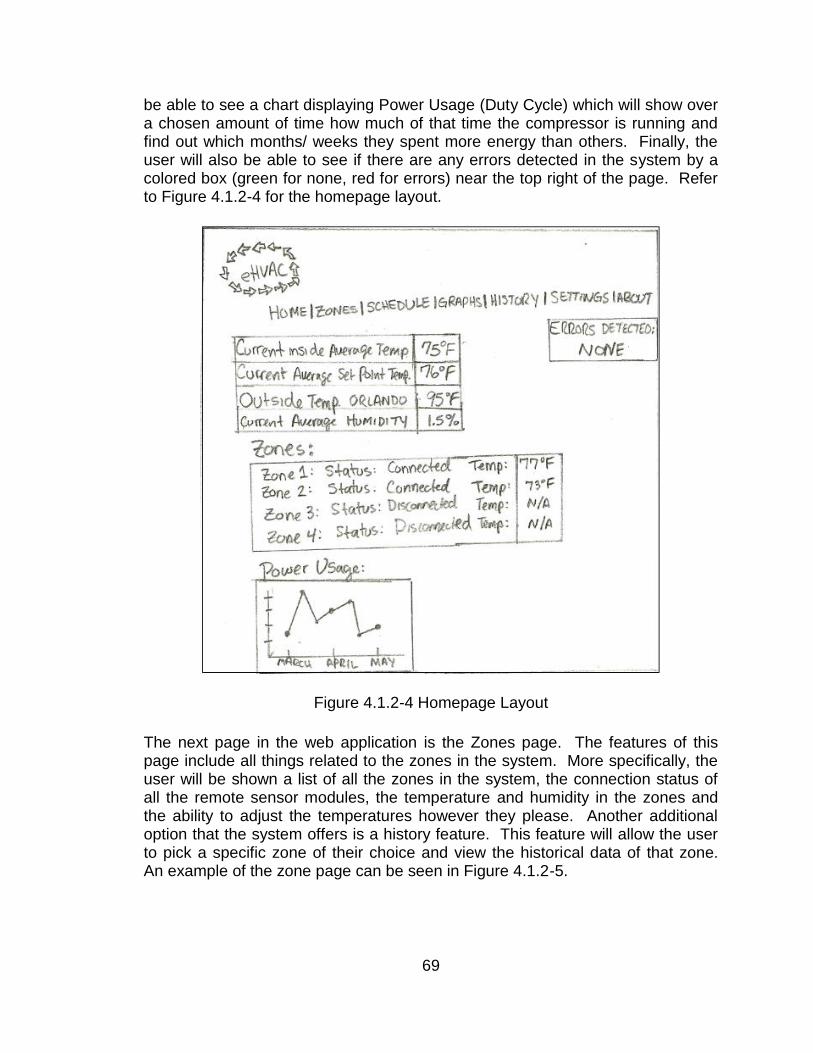
69
be able to see a chart displaying Power Usage (Duty Cycle) which will show over a chosen amount of time how much of that time the compressor is running and find out which months/ weeks they spent more energy than others. Finally, the user will also be able to see if there are any errors detected in the system by a colored box (green for none, red for errors) near the top right of the page. Refer to Figure 4.1.2-4 for the homepage layout.
Figure 4.1.2-4 Homepage Layout
The next page in the web application is the Zones page. The features of this page include all things related to the zones in the system. More specifically, the user will be shown a list of all the zones in the system, the connection status of all the remote sensor modules, the temperature and humidity in the zones and the ability to adjust the temperatures however they please. Another additional option that the system offers is a history feature. This feature will allow the user to pick a specific zone of their choice and view the historical data of that zone. An example of the zone page can be seen in Figure 4.1.2-5.

70
Figure 4.1.2-5 Zone Page Layout
Another asset to the HVAC system is the scheduler. This is a prominent component because it gives the user the capability to set specific time and dates for when they would like to have their system turned on to certain temperatures. This is very useful when a user is not home and would like to set the temperature for their system to whatever they would like and have it set before they get home so they are comfortable when they walk in their house. An illustration of the Schedule Page is shown in Figure 4.1.2-6.

71
Figure 4.1.2-6 Schedule Page Layout
The next main tab that the web application will have is the Graphs page. This Page will display a multitude of graphs for the user of which are included but not limited to: Power Usage, Average Set Point and Average Humidity. Not only will the user be be able to see these graphs along with others, they will also be able to choose specific settings as they wish which will range from different line representations, line colors, adjusting the size of the graphs, plot point symbols and colors, the time period of each graph and possibly an option of overlapping more than one graph on the same chart to see comparisons. An illustration of of this page can be seen in Figure 4.1.2-7.
72
Figure 4.1.2-7 Graph Page Layout
One of the more prominent features this HVAC system will have is Datalogging. This means that the user will be able to choose a Zone (assuming they have access) and see a history of everything that has happened in that zone from a time period of their choice. More specifically, the user will choose the “See History” option on the History page and will be given a magnitude of data through which to see what has been happening in the system. The data will show not only readings of temperature but also humidity, CO2 readings, Set point readings and the activity of the compressor and fans more specifically to see if the fan has been overrunning. Another choice for the user would be to see a graph of the zone which will display a full look at from the data the system was installed until that day, a graph of the specified zone with relevance to all the readings listed above. An example of the History page can be seen in Figure 4.1.2-8.

73
Figure 4.1.2-8 History Page Layout
The final major component to the web application will be the Settings Page. This page will have many options for the user/ administrator to choose from. More specifically, the user will be able to do the following: change password, set the sample rate for their system, choose the temperature settings (Either Fahrenheit or Celsius), change the language, change the compatibility options (i.e. old system to new system), and changing zone options (adjusting number of zones and renaming zones). The administrator will have all these abilities and will also be able to control all zones and give out zone assignments to users and change usernames, add and delete them as well. An example of this page can be seen in Figure 4.1.2-9.
Figure 4.1.2-9 Settings Page Layout
The last page of the web application will be the About Page. This will have basic information regarding the HVAC system as well as knowledge about our group.
74
Also, this will have the licenses and/or copyrights for some of the technologies utilized for the creation of the HVAC system.
4.1.3 Web Application Variable Definitions The system will be creating separate variables on the GUI end of the web application that the user will interface with and these variables will obtain their corresponding values by accessing the database and compiling data to display to the screen for the user to interact with. The process of how this will work for the pages on the web applications will be explained in the following paragraphs. As shown in section 4.1.2 with the Web Application Layout we can see how the web application view will be structured. With this let’s take a look more into depth on how each pages variables will be defined and how they will extract their data from the database. When the web application is accessed for the first time, the user must be an administrator and thus will use the master login credentials. After this the user will create his/her own administrator account. The next time this user logs in they will be prompted with a username and password to input. When they type in their respective username and password the web application will send a request to the database to validate the submitted credentials. If valid, the web application will respond by allowing the user to connect the Home Page, if not however the user will be provided with a message of “Invalid Username or Password, Please try again.” The variables that will be implemented on the password Prompt page is Username_input and Password_Input. Both variables will be used as parameters for credential validation against the users in the database. If a user match is found and the supplied password is valid, the application with verify that the account has not been deleted or disabled by checking the values in the Deleted and Enabled properties for that user entity. Once the user has accessed the Home Page they will be able to see a few different readings, zones displays and power graph. Firstly, the user will be able to see the Current Average temperature in the premises. The system will accomplish this task by using the currentav_temp_disp variable. The application will make a request to the database and will enquire about the recent zone readings in all the zones connected to the system. It will then take an average from all the zone temperatures currently connected to the system and then display that value to the screen for the user to see. The currentav_humid_disp variable will work the same way as currentav_temp_disp, however, it will enquire the Humidity values in the Zone_Readings entities and take the average value to display to the screen. The currentav_setpt_disp variable works in a similar fashion except it will enquire from the Zone_Settings entity. It will take an average of the Temp_setpoint entities associated with all the currently connected zones and will display the average value to the screen. The next variable to look at is outside_Temp_disp. The function of this variable is quite different from all

75
the others ones because it will obtain its value through an RSS Feed which will access the internet and retrieve the value to display to the user. The next aspect of the Home Page the user will be able to see is the display of the zones in the system. The user will be able to see the connection status of the zones and also the temperatures in each zone respectively. For this to be shown to the screen the variable zones_disp will be used. This variable is really a sum of all the zones together which means that on a system with 4 zones there would really be 4 zones_disp each referencing a different zone (i.e. zone1_disp, zone2_disp, etc.). The zones_disp will request data from the Zone_Readings entities in the database and be able to tell the connection status by checking the Enabled property and zone temperature by checking the Temperature property for each respective zone connected in the system. The final variable on the Home Page is Power_graph_disp. This variable is a potential upgrade in the system where the user would be able to see a display for a power graph and see how their system is performing in terms of power consumption. As of now however the implementation of this has not been created but might be in the future. The next page to look at is the Zones page. Like the zones_disp variable on the Home Page, the zones_disp on the Zones page will do the exact same thing by collecting the values from the connected zones from the database and displaying them to the screen. The next variable on this page is zones_temp_inc. This variable in an obvious sense is used to increase the temperature setpoint in the zone. However, to understand this better basically this variable will be changed by the user on the application and once the set button has been pressed the database will take that value and set the Temp_Setpoint property in the Zone_Settings entity for that zone to it. Like the previous variable, zones_temp_dec will do the same thing by accessing the database however it will instead decrease the temperature setpoint rather than increasing. Finally, the last variable that the Zones page will include is zones_hist_disp. This is a cumulative variable that will separately be used for all the zones connected into the system (i.e. zone1_hist_disp, zone2_hist_disp, etc.). The way this variable will work is by querying data from the Zone_Readings entities and displaying it onto another page. More specifically, this page will display the Temperature Readings, Humidity Readings, CO2 Readings, and Timestamp of every reading made (by the sample rate) of the specified zone. The next page to be discussed is the Schedule Page. This page is special in itself because it is used to create a schedule to set the temperature in any of the connected zones at any time and for any temp. It will also display the month, year and day for the user to see. It will accomplish displaying the month and year by using the month_disp and year_disp and it will pull this data from the extensive built-in Python date and time libraries. When the page is first accessed it will display the current month and year. The user will also have the ability to increase and decrease the year and month. The variables to store this are year_inc, year_dec, month_inc and month_dec. The user will be able click a button which will increase and decrease the month and year. These buttons will
76
be able to do this by having the variables store the current month that is being displayed and add 1 and subtract 1 from it so when the user clicks it the month should change according to whether it’s increasing (the next month/year) and decreasing (previous month/year). The next variable to discuss is the schedule_Date. This will display the current day with a highlighted color so the user can tell which day it is. This will also be utilizing the Python date library to know the current day. Another feature that must be discussed is when a user chooses a specific day to schedule for a temperature set. The options that the user will encounter will be the scheduled start time and end time, the day scheduled, the mode and the set point. The variables to define these actions are as follows: sch_startTime, sch_endTime, sch_day, sch_mode, and sch_setpt. The sch_startTime, sch_endTime, sch_setpt and sch_mode variables will be user inputted values which will be used to create a Schedule entity with the specified programming. For example, the user will input the start time (9:00am), end time (10:00pm), mode (cooling), temperature (24 degrees celsius) and the Python code will take those values and store them into the properties StartTime, EndTime, Mode and Temp_Setpoint in the newly created Schedules entity in the database. The final variable sch_day will be pulled from the database once the query for the scheduled day has been made by the user. The Graphs page will be a set of user specific graphic displays. The user will have the ability to change between a set of graphs that detail the performance or operation of the HVAC system. Some of the variables that may be implemented with this page are power_graph_disp, setptgraph_disp and humgraph_disp. Like the page before the power_graph_disp is a possible addition to the application where the user would be able to see energy-consumption related information about the HVAC system. The setpt_graph_disp variable will display data about the average of the zones set points for a period of time. It will pull its data from the Zones entities in the database. It will take an average per day of all the zone set points and will display it graphically for the user to see. The final variable that will be utilized is humgraph_disp. This will take an average of the humidity values recorded by the systems zones which are extracted from the Zone_Readings entities’ Humidity property. The History Page is the next page to be discussed on the web application. This page will display all the zones connected and disconnected in the system and will also have a link to see a graphical look of the history. Two variables to look at on this page is zones_hist_disp and zones_hist_graph. These variables will really be specific to each zone (for example: zone1_hist_disp etc.). The zones_hist_disp variable will pull data from the database and display it to the screen. The values it will retrieve are the Humidity, Temperature, CO2 Readings and Timestamp from every reading from the respective zone Zone_Readings entity in the database. The zones_hist_graph will also retrieve the same data but it will represent the information in a graphical interface for the user to see over an extended period of time the performance of the system.

77
The final page to be discussed is the Settings Page. This page has many variables it will implement which include and are not limited to: view_users, Add_User, Change_User, Delete_User, Admin_Rights, password_Change, samp_rate_set_CO2, samp_rate_set_Temp, units_Celsius, zone_name, zone_num, Compatability_Options, Vent_Type, Fan_type, Heating_type and Compress_type. Some of these options will explicit to an Administrator only. These options include viewing all users, adding users, changing users, deleting users, giving admin rights, giving zones name, adjusting the amount of zones in the system, giving access to specific zones, and changing all the compatibility options which are the vent, fan, heating and compressor types. An Administrator will be able to choose the view_users variable which will pull all the Users in the system from the Users entities in the database and will display it to the screen. Add_User will give the Administrator the ability to add a user to the system. Once the administrator has created the username the system will use the Python code to add a Users entity into the database. Change_User will give the Administrator to adjust an already existent user’s username. Unlike Add_User this variable will not add a new entry into the Users data object but instead will change the values already stored in the specific users Username properties. The next variable is Delete_User which will allow the Administrator to delete a users username from the system. When the Administrator chooses to delete the user it will modify that user’s User entity and set the Deleted property to True. Admin_Rights is a special variable that will allow the Administrator to give any other user on the system an Administrator status. It works just like Delete_User and modify the boolean Administrator property in the user’s User entity in the database. The Administrator will also be able to change the names of the Zones to whatever they feel. They will be able to click this option and rename it and the Python code will access the Zone entity for the modified zone and change the Description property to the new value. Another ability of the Administrator will be to give other users access to zones as they please. When choosing this option the application will link the user and zone together by creating a User_Zone entity detailing the assignment. Another option of the Administrator is to change the number of zones in the system. They will be able to adjust this value depending on how many thermostats they have connected which will account for the amount of zones they will have in their house or premises. This will access the database and check the Thermostats entities to see how many thermostats are connected into the system and will allow for the amount of zones the Administrator is requesting up to the number of thermostats. If the amount of thermostats is smaller than the value the Administrator has requested a message will appear telling the Administrator that there are not enough Thermostats to fit the zone amount they want. Finally, the Administrator will be able to change the Compatibility Options which include changing the Vent, fan, heating and compressor types. Depending on what system is installed in the premises, the administrator will be able to adjust the options as they wish. Once the administrator has specified the compatibility

78
options for the HVAC system the application will modify the System_Settings entity and set the values for the following properties: Vents_Type, Fans_Type, Heat_Type, and Comp_Type. The other variables the user and Administrator will be simultaneously able to change are password_Change, samp_rate_set_CO2, samp_rate_set_Temp, and units_Celsius variables. The password_Change will allow the user to change their password. Once they have changed their password a the application will access the corresponding Users entity for the user and set the Password property to the submitted password. Samp_rate_set_CO2 and samp_rate_set_Temp will allow the user to adjust the default value for the sampling rate for the CO2 and Temperature values for their assigned zones. Once the user has clicked the set button the system will modify the corresponding Zone_Settings entity properties for the zone(s). Finally, the last variable the user will be able to interact with is the Units_Celsius variable. This variable is quite different than the others because it only accounts for when the user has the Celsius option on the Settings page clicked. If however this was to change to Fahrenheit, the system would send this request to the database and would tell the UnitsCelsius entity to change its boolean property to False which would tell the system that it will display the degrees in Fahrenheit and not Celsius. A structure of the Web Application Variable Definitions can be seen in Figure 4.1.3-1.
Figure 4.1.3-1 Web Application Variable Definition Diagram

79
4.2 Main Control Unit/ System Control The following sections will discuss the choices made in the design for system control modules and the MCU. In each decision several factors were considered in order to make this system according to the specifications laid out earlier in this paper.
4.2.1 Hardware The hardware chosen for this project will be specified in the following. The microcontroller will be chosen according to several factors and the hardware needed to control the different components of an HVAC systems will be described as well.
4.2.1.1 System Control Module Microcontroller & Communications After deciding to use Google App Engine for the System UI & Intelligence, the group now had to integrate ethernet connectivity into the System Control Module to achieve communication between them. This new requirement meant that the microcontroller has to be able to handle internet connectivity. After careful review it was determined that the LM3S8962 met and exceeded all requirements because of the following reasons:
● It is a relatively cheap yet powerful microcontroller. ● It is able to handle ethernet, wireless communications and the HVAC
system controls with no shortage of I/O pins. ● Integrated ethernet controller, requiring only magnetics and RJ45 jack. ● The ability to assign different priority levels to interrupts and the nested
vectored interrupt controller should prove beneficial to making the microcontroller respond to interrupts, requests and other tasks in the most dexterous way possible.
● The group attended a TI workshop on the LM3S8962 where it acquired EKS-LM3S8962 development boards and gained some programming experience on the microcontroller.
● The group had access to sample code for ethernet, CGI, and I/O. This will help in accelerating prototyping and implementation.
● The group also had access to the schematics for the EKS-LM3S8962 kit. This helped accelerate design (shown on figure 4.2.1.1-1).
Figure 4.2.1.1-1 shows the proposed schematic for the microcontroller. This design was heavily based on the EKS-LM3S8962 development kit provided by TI. It incorporates a J0011D21B through hole RJ45 jack with integrated

80
magnetics from Pulse Electronics which is known to be compatible with the integrated ethernet controller. As shown in Figure 4.2.1.1-2 for wireless communications with the Remote Sensor Modules the LM3S8962 will have a CC2500 2.4 Ghz wireless transceiver connected to it through a SPI connection with two additional wires for waking up the device from sleep if necessary. It is possible that the CC2500 will be implemented in a daughter board which will then be connected to the LM3S8962 via a ribbon cable. The reasoning behind this possibility is to reduce noise from all of the signal that might be moving around in the main printed circuit board.
Figure 4.2.1.1-1 LM3S8962 schematic with ethernet.

81
Figure 4.2.1.1-2 CC2500 Module for MCU microcontroller
4.2.1.2 Damper Control After all the research covered in Section 3 of this paper has been considered and weighing the pros and cons, the decision has been made to go with the 8-bit shift register control design. This design will be much simpler to implement and simple for future prototyping. The design will implement the 74HC595C shift register from NXP Semiconductors to control eight MAC97 Series Sensitive Gate Triacs which gives the controller the ability to add up to eight zones if there is a need or request. Below is a schematic of the solenoid driver, Figure 4.2.1.3-1. Each triac will be triggered by one of the eight bits of the shift register. The second main terminal of the triacs are connected to ground so that the holding current in them will drain once the gate is unbiased. The first main terminal of the triacs are connected to each of the eight dampers for each zone. According to the datasheet for the shift register, each output can supply a high voltage output up to 6 volts to trigger the triacs with a 2 volt max trigger voltage and a typical triggering voltage at 0.66 volts. The shift register has a active low reset pin so to prevent that from happening the reset pin, pin 10 SCL, is connected to VCC which is always high. The clock will be tied to another shift register’s clock. Since the data is read in serially, it is transferred from each storage register whenever pin 12, RCK, is high. So RCK is connected with a load to ground. The G pin, pin 13, is connected to ground since this chip has the active low output enable condition.
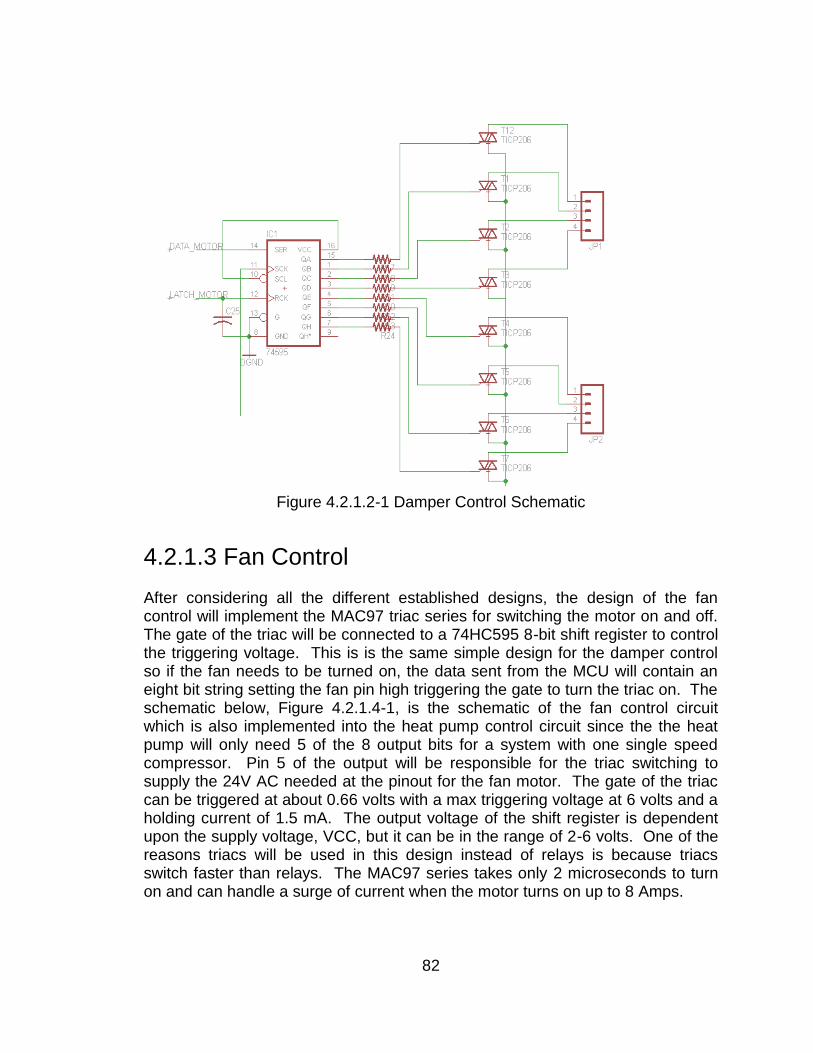
82
Figure 4.2.1.2-1 Damper Control Schematic
4.2.1.3 Fan Control After considering all the different established designs, the design of the fan control will implement the MAC97 triac series for switching the motor on and off. The gate of the triac will be connected to a 74HC595 8-bit shift register to control the triggering voltage. This is is the same simple design for the damper control so if the fan needs to be turned on, the data sent from the MCU will contain an eight bit string setting the fan pin high triggering the gate to turn the triac on. The schematic below, Figure 4.2.1.4-1, is the schematic of the fan control circuit which is also implemented into the heat pump control circuit since the the heat pump will only need 5 of the 8 output bits for a system with one single speed compressor. Pin 5 of the output will be responsible for the triac switching to supply the 24V AC needed at the pinout for the fan motor. The gate of the triac can be triggered at about 0.66 volts with a max triggering voltage at 6 volts and a holding current of 1.5 mA. The output voltage of the shift register is dependent upon the supply voltage, VCC, but it can be in the range of 2-6 volts. One of the reasons triacs will be used in this design instead of relays is because triacs switch faster than relays. The MAC97 series takes only 2 microseconds to turn on and can handle a surge of current when the motor turns on up to 8 Amps.

83
4.2.1.4 Compressor Control To control the compressor, an 8-bit shift register, 74HC595, will be implemented with one bit of the output designated for the compressor. Whenever the output goes high, the gate of the triac connected will be triggered to close the circuit and supply the 24V AC to the pinout. Figure 4.2.1.4-1 below the schematic of the design. Pin 15 will be connected to the reverse valve and the next two pins, pin 1 and pin 2, will be for the compressors. If the system has one single speed compressor, then only pin 1 will be used but if the system has 2 compressors or has a multi-speed compressor, another pin can be utilized. The triacs used will be from the MAC97 series with a max gate trigger voltage of 2 volts and a typical triggering voltage at 0.66 volts. The setup of the shift register will be the same as the damper control setup described earlier. The clocks will be tied together with the reset pin, SCL, tied to VCC to keep it high and the clock for data transfer between storage registers, RCK, tied to ground because it is active low. The 74HC595 is a serial-in, parallel-out shift register, meaning it will active the required components at the same time. As stated earlier, the shift register’s output voltage can be in the range of 2-6 volts depending on the supply voltage, VCC, to trigger the gate of the triac.
Figure 4.2.1.4-1 Heat Pump Control Schematic

84
4.2.1.5 Power This simple power supply design, Figure 4.2.1.5-1, is the same as the open-sourced sprinkler design. The 24VAC enters the buck converter, LM2574N, through a half-wave rectifier and has a 5 volt output. So the input voltage to the regulator, MCP1700-33, is 5 volts stepped down to 3.3 volts for the supply of the MCU. The LED is connected to the input line and lights up when the power supply is on.
Figure 4.2.1.5-1 Power Supply
4.2.2 Software The following sections will go into detail about how the code will be written in order to control the different components of an HVAC system. This system is supposed to be efficient so the software will be designed in the same way in order for effective use of the hardware components.
4.2.2.1 Damper Control The coding for the Damper Controls will be very simple. The HVAC system will be design for two-position dampers, either open or closed. Therefore the coding for the register designated for the zone will be “zero” for open, because the dampers are usually open, and “one” for close. This standard is configurable such that if the user purchases normally-closed dampers, this setting will be changed in the “Configure” tab of the web application to accurately reflect the hardware. The flowchart below, Figure 4.2.2.1-1, illustrates the process the code will follow. After the initialization and polling of zone thermostats, there is a comparison between the “set” temperature point and the “sampled” reading. If they are not equal then the command is given to turn the system on, which will

85
be discussed in the next section, and the zone damper register will be kept at zero such that the damper will stay open to allow the air to flow in. There is the other condition where the “sample” point and “set” point are equal in zone one but they are not equal in zone two. In this case, the system will still turn on to feed air to zone two so zone two’s register will stay zero but zone one’s register will need to be changed to “on” or from zero to one to close zone one’s damper. Since the thermostats are measuring temperature every 2 seconds, they could pick up an inequality between the “set” and “sample” points so zone one’s damper register will be able to change from off to on to cool or heat the zone. We then go back to check the set-point and sample-point registers until the both of the zone’s set-points equal the sample-points and then we reset both damper register back to zero.
Figure 4.2.2.1-1 Damper Program Flowchart
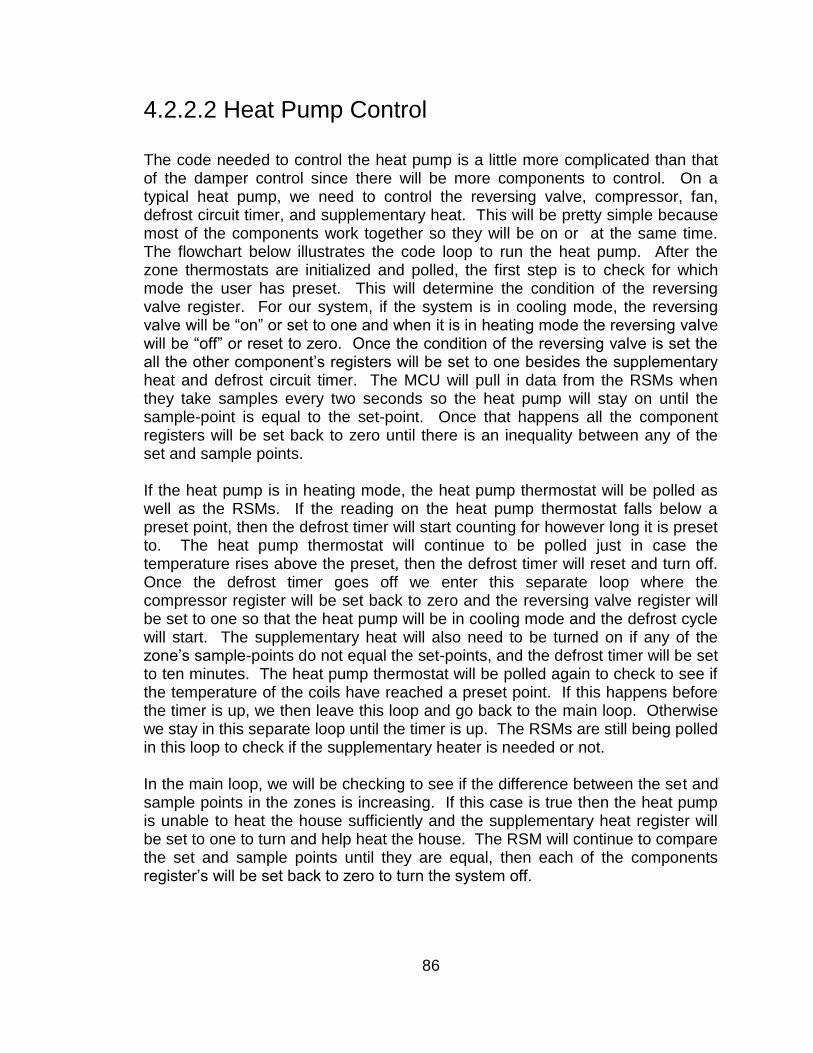
86
4.2.2.2 Heat Pump Control The code needed to control the heat pump is a little more complicated than that of the damper control since there will be more components to control. On a typical heat pump, we need to control the reversing valve, compressor, fan, defrost circuit timer, and supplementary heat. This will be pretty simple because most of the components work together so they will be on or at the same time. The flowchart below illustrates the code loop to run the heat pump. After the zone thermostats are initialized and polled, the first step is to check for which mode the user has preset. This will determine the condition of the reversing valve register. For our system, if the system is in cooling mode, the reversing valve will be “on” or set to one and when it is in heating mode the reversing valve will be “off” or reset to zero. Once the condition of the reversing valve is set the all the other component’s registers will be set to one besides the supplementary heat and defrost circuit timer. The MCU will pull in data from the RSMs when they take samples every two seconds so the heat pump will stay on until the sample-point is equal to the set-point. Once that happens all the component registers will be set back to zero until there is an inequality between any of the set and sample points. If the heat pump is in heating mode, the heat pump thermostat will be polled as well as the RSMs. If the reading on the heat pump thermostat falls below a preset point, then the defrost timer will start counting for however long it is preset to. The heat pump thermostat will continue to be polled just in case the temperature rises above the preset, then the defrost timer will reset and turn off. Once the defrost timer goes off we enter this separate loop where the compressor register will be set back to zero and the reversing valve register will be set to one so that the heat pump will be in cooling mode and the defrost cycle will start. The supplementary heat will also need to be turned on if any of the zone’s sample-points do not equal the set-points, and the defrost timer will be set to ten minutes. The heat pump thermostat will be polled again to check to see if the temperature of the coils have reached a preset point. If this happens before the timer is up, we then leave this loop and go back to the main loop. Otherwise we stay in this separate loop until the timer is up. The RSMs are still being polled in this loop to check if the supplementary heater is needed or not. In the main loop, we will be checking to see if the difference between the set and sample points in the zones is increasing. If this case is true then the heat pump is unable to heat the house sufficiently and the supplementary heat register will be set to one to turn and help heat the house. The RSM will continue to compare the set and sample points until they are equal, then each of the components register’s will be set back to zero to turn the system off.

87
Figure 4.2.2.2-1 Heat Pump Programming Flowchart
4.2.2.3 Fan Control The fan or blower in the air handler will have two settings, automatic or on. The “automatic” setting means that the fan will only run when there is a request for heating or cooling from any zone and the system turns on. The “on” setting will have the fan running continuously independent of system’s status. This setting is controlled by a button on the RSM’s at the discrepancy of the user. The setting will be set to “automatic” by default so the register for the fan will start at zero. If the user wants the fan to be “on” then the register will be loaded with with a “one”. Since there are only two settings, the code will be very simple. Once the initialization is complete, the preset configuration will be loaded into the registers so the fan register will be “0” by default. The system will continue on its’ normal routines until the thermostat sends a request back to the MCU that the fan register wants to be changed. Once that happens, the main control unit will jump to a subroutine to load the fan register with a 1 and then jump back to the main loop until another request is received. The fan subroutine will also account for which zone is requesting the fan to be on continuously. That way the dampers

88
for the non-requesting zones will be closed whenever the system is off so that it does not receive the extra air circulation. Once a request is received from a RSM to switch the fan back to the automatic setting, the main control unit jumps back to the subroutine to reset the fan register back to zero. If there are two zones currently calling for the fan on continuously and one of those zones wants to switch back to automatic, then instead of resetting the fan register back to zero, the damper register corresponding to that zone will be changed in order to close that zone whenever it does not need heat or cool air.
4.2.2.4 Safety Sensors The safety sensors for an HVAC system are essential for the proper and efficient usage of the system. However for the purpose of this project and considering the time and testing restraints it was determined that safety sensor monitoring and control is not within the scope of this project. Safety sensors are different for every system. They depend upon many different factors which cannot all be taken into account for. Factors such as the manufacturer of the particular system and which contracting company installed the system play a role in the design of the safety sensors. Most safety features will be installed by the factory that makes the system and whatever else needs to be installed will be done on site. There are just too many things that need to be accounted for which puts it outside the scope of this project.
4.2.3 RSM Interface The Main controller interfaces with the remote sensor module using the CC2500. The CC2500 is used by the main controller in much the same way as the remote sensor module controls the CC2500. The CC2500 is connected to the main controller using a six wires, four wires for a SPI bus and two wires for triggering interrupts. The main controller is the master of the pair, and because of this the main controller’s microcontroller must always initiate communications between the two. This means that the CC2500 cannot use the SPI bus to let the microcontroller know that there is an incoming message, which is where the two extra wires come in. Out of the six wires used by the CC2500 to connect to the main controller, two wires are used to set interrupts on the main controller, thus letting the main controller know that there is an incoming message from the CC2500. Then one of the two interrupt wires causes an interrupt, the main controller then commands the CC2500 to send its data to the main controller via the SPI bus. The six wires are required solely because of the limitations of the SPI bus protocol. However these limitations are acceptable because of the simplicity and speed of the SPI bus. There are two subroutines that will control the CC2500, one will be used to transmit data from the main controller to the remote sensing modules. The second subroutine will be used to receive data from the modules.

89
In this way, the main control unit will be in communication with the remote sensing modules and visa versa.
4.2.4 Web Application Interface The group initially thought that it would have to make use of some interconnect using UART or similar bus to bring together the System UI & Intelligence and System Control modules. The decision to use Google App Engine forced the group to reevaluate this idea because now both subsystems would have to communicate over the internet. To overcome this new barrier the group decided to use the Common Gateway Interface to get both modules to communicate. The Common Gateway Interface allows for exchange of content such as plain text over its interface, so data of almost any type can be transferred. The web application already makes use of CGI for serving its web pages, so all that is needed to setup the communication means is to add CGI handlers in code so that the web application can respond to requests made by the System Control Module. This can be done in the same programming language used to program the web application. In the case of the System Control microcontroller the team will implement a simple web server with CGI handlers using the lwIP stack that will respond requests made by web application using sample code from the TI workshop as reference.
4.3.1 Hardware In the following sections, the hardware components chosen for the RSMs will be described. Each decision was made after many considerations, specifically the specifications of this system. The following include the input/output design, physical dimensions of the casing for the RSMs, power supply, the appropriate schematics.
4.3.1.1 Input/ Output The remote sensing module will act as one of the human machine interfaces for the HVAC controller. It follows that the remote sensing module will have a method for inputting data, and a method for outputting data. The rest of this section will go into great detail concerning the choice and implementation of input and output hardware. The choice of input hardware reflects the low cost approach that the group has taken throughout the entire design of the remote sensing module. To keep costs low the group decided to make the input interface very simple, using only three individual inputs. At the same time, it was desired to make the process of inputting data easy and straightforward. It was decided to use two simple momentary push buttons along with one rotary encoder for the input. The rotary

90
encoder has a built in momentary push button. This means that the remote sensing module effectively has a total of three momentary push buttons and one rotary encoder. The remote sensing module’s program is driven by interrupts. The push buttons are placed between VCC and three separate general purpose inputs. When a pushbutton is actuated, VCC is applied to an input which creates an interrupt in the micro controller. This interrupt causes an interrupt subroutine to run, which serves as the input to the remote sensing module. The operation of the rotary encoder is slightly more complicated. The rotary encoder is supplied by VCC and GND, and has two outputs. The two outputs of the rotary encoder are square waves which are offset from one another by ninety degrees. This offset changes depending on the direction of rotation. If the encoder is turned clockwise output A leads output B by ninety degrees. If the encoder is turned counter clockwise output A lags output B by ninety degrees. This relationship is used to determine the direction of rotation which allows the remote sensing module to use the rotary encoder as a bidirectional input. The rotary encoder’s functionality could be replaced by three push buttons which would be cheaper, but it was decided that the improvement that the rotary encoder would give the interface was worth the extra cost and the extra programming required to use it. Another benefit of the rotary encoder, is that it takes the place of three push buttons but it’s footprint is only slightly bigger than a single pushbutton. It was decided that the remote sensing module would use a two-line by twenty-character dot matrix LCD panel for output. It was determined that a seven segment display though cheap and easy to interface with, would not display enough information for the remote sensing module. Also, it was determined that the high cost of a high resolution LCD screen was not justified by the added functionality it would give to the module. Another reason the high resolution LCD screen was rejected was the added complexity of interfacing with it. A two line by twenty character dot matrix LCD display provides the space to present the information required for an appropriate output for the remote sensing module. These displays are cheap, low power devices that are easy to interface with. The group decided to use NewHaven’s NHD-C0216CIZ-FN-FBW dot matrix display. This display is compatible with the I2C communication protocol which makes using it very easy. The remote sensing module is already using the I2C protocol with one of the sensors, which made using this display a very good choice. The complete interface schematic can be seen in Figure 4.3.1.1-1 below. The rotary encoder and its included push button are on the left of the figure. The outputs of the rotary encoder are connected to the general purpose inputs P2.1 and P2.2. As seen in the schematic, these inputs correspond to pins nine and
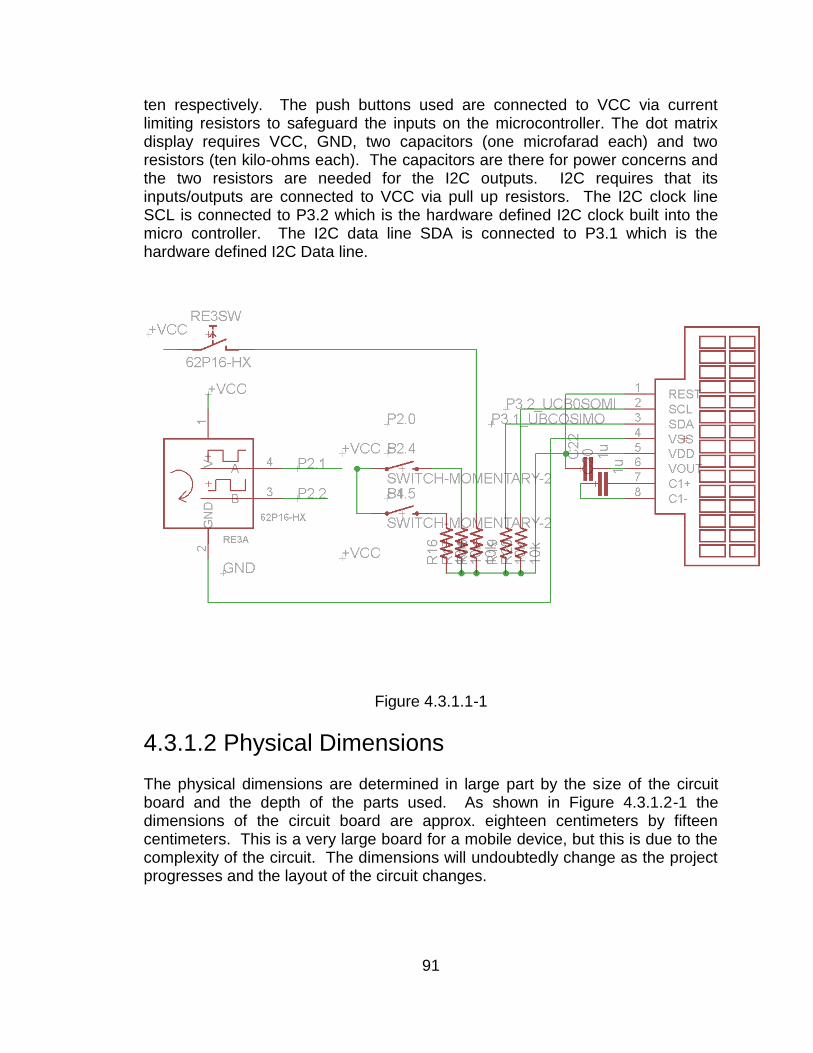
91
ten respectively. The push buttons used are connected to VCC via current limiting resistors to safeguard the inputs on the microcontroller. The dot matrix display requires VCC, GND, two capacitors (one microfarad each) and two resistors (ten kilo-ohms each). The capacitors are there for power concerns and the two resistors are needed for the I2C outputs. I2C requires that its inputs/outputs are connected to VCC via pull up resistors. The I2C clock line SCL is connected to P3.2 which is the hardware defined I2C clock built into the micro controller. The I2C data line SDA is connected to P3.1 which is the hardware defined I2C Data line.
Figure 4.3.1.1-1
4.3.1.2 Physical Dimensions The physical dimensions are determined in large part by the size of the circuit board and the depth of the parts used. As shown in Figure 4.3.1.2-1 the dimensions of the circuit board are approx. eighteen centimeters by fifteen centimeters. This is a very large board for a mobile device, but this is due to the complexity of the circuit. The dimensions will undoubtedly change as the project progresses and the layout of the circuit changes.
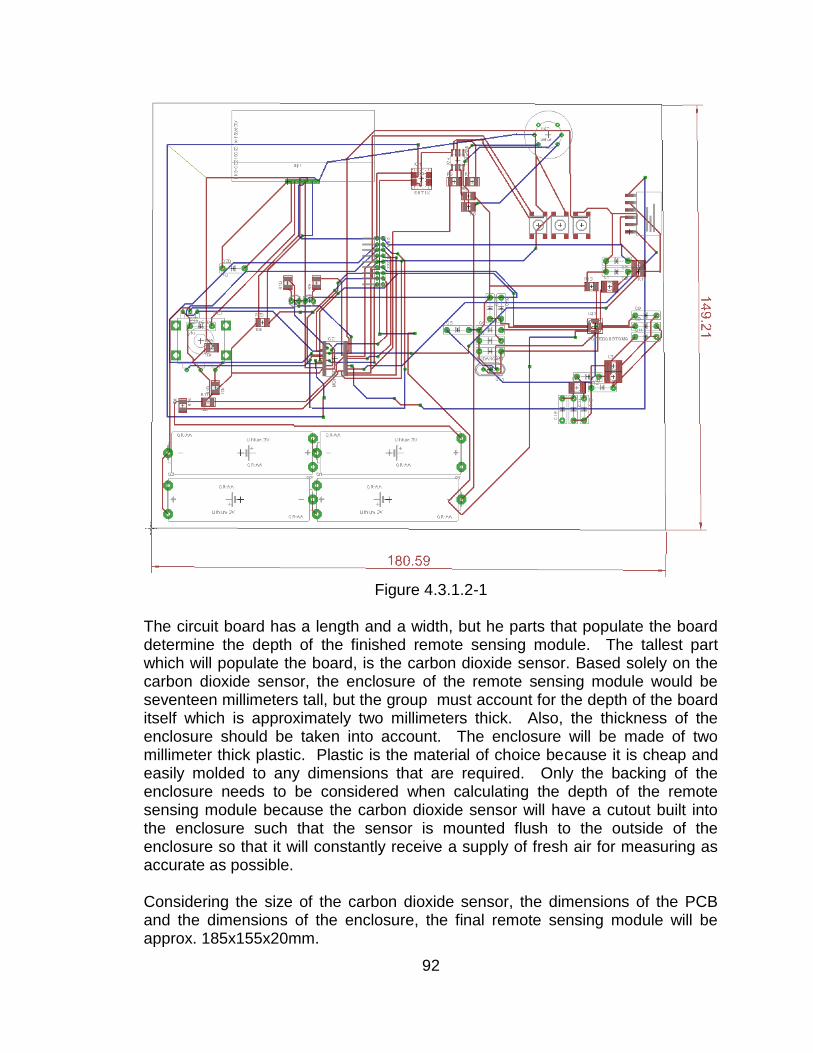
92
Figure 4.3.1.2-1
The circuit board has a length and a width, but he parts that populate the board determine the depth of the finished remote sensing module. The tallest part which will populate the board, is the carbon dioxide sensor. Based solely on the carbon dioxide sensor, the enclosure of the remote sensing module would be seventeen millimeters tall, but the group must account for the depth of the board itself which is approximately two millimeters thick. Also, the thickness of the enclosure should be taken into account. The enclosure will be made of two millimeter thick plastic. Plastic is the material of choice because it is cheap and easily molded to any dimensions that are required. Only the backing of the enclosure needs to be considered when calculating the depth of the remote sensing module because the carbon dioxide sensor will have a cutout built into the enclosure such that the sensor is mounted flush to the outside of the enclosure so that it will constantly receive a supply of fresh air for measuring as accurate as possible. Considering the size of the carbon dioxide sensor, the dimensions of the PCB and the dimensions of the enclosure, the final remote sensing module will be approx. 185x155x20mm.

93
4.3.1.3 Power Supply The modular nature of the remote sensing module makes its power consumption very important. The goal is for the module’s batteries to last as long as possible, but they need to last for at least one week. The remote sensing module only has one source of power which consists of four double A batteries. All four batteries power the carbon dioxide sensor, while only two batteries power the remainder of the sensing module. Figure 4.3.1.3-1 shows the power supply for the remote sensing module. The use of the ground tab in the middle of the four batteries supplies the module with +3V and -3V so that a dual power rail opamp can be used. From Figure 4.3.1.3-1 it can be seen that +VCC is equal to +3V and -VCC is equal to -3V. +VCC is used throughout the sensing module, while -VCC is used only in the carbon dioxide sensing circuit, both for the sensor and for the differential op-amp used to amplify the signal.
Figure 4.3.1.3-1
Only batteries G3 and G4 are used to supply +VCC, while all four batteries are used to supply the six volt source. This means that the batteries will drain at different rates, but considering the high current draw of the carbon dioxide sensor, it was determined that the difference in discharge rates is negligible.
4.3.1.4 Sensor Schematic The schematic for the sensor package is given below in Figure 4.3.1.4.-1. It was decided that the remote sensing module would be best served by using the MG811 carbon dioxide sensor coupled with a LM1458 operational amplifier set up in a difference amplifier configuration. Another method of measuring the voltage difference across A2 and B2 is to use a unity buffer on B2 and connect A2 to ground, but it was determined that a differential amplifier would be more accurate. The MG811 uses a chemical reaction to create a voltage difference between pin A2 and B2. The differential amplifier measures this difference and places the difference on the input pin P4.4. P4.4 is a hardware specific analog to

94
digital converter for the MSP430. The converter has an accuracy of ten bits which is enough for the purposes of this sensor. The temperature sensor chosen is also the humidity sensor. It was determined that because of pricing and footprint issues, a temperature/humidity sensor was the optimal choice. The SHT11 digital combination temperature/humidity sensor is ideal for this application. The SHT11 is accurate to four percent relative humidity, and one tenth of a degree fahrenheit which satisfies the specifications laid out earlier in this paper. The SHT11 uses a digital output and communicates via an I2C bus which is very good because the MSP430 has built in I2C functionality.
Figure 4.3.4.1-1
As shown in Figure 4.3.4.1-1 the SHT11 is connected with four pins, +VCC, GND, and two I2C pins. The I2C pins used are the same two pins used by the dot matrix LCD screen, P3.2 for the clock and P3.1 for the data. The MG811 carbon dioxide sensor has two power pins, +VCC and -VCC. This is because the MG811 requires +6V to drive the internal heating element.
4.3.1.5 Micro Controller Schematic The microcontroller of choice for the remote sensing module is the MSP430F2274. Figure 4.3.1.5-1 below shows the schematic of the MSP430 and the circuitry required to run it. Figure 4.3.1.5-1 also shows the nets used to connect the MSP430 to the rest of the remote sensing module’s circuitry. This

95
microcontroller was chosen for the ease with which it is interfaced with the CC2500 Wireless radio. Aside from being easy to interface with the CC2500, the MSP430F2274 has a plethora of in/out pins, as well and hardware built SPI, I2C, and analog to digital converters.
Figure 4.3.1.5-1
The MSP430 is mounted to a general purpose momentary switch, and two status LEDs which will be used to display the status and/or mode of the microcontroller. The MSP430 is set up with RS232 headers built in so that a debugger can interface with it. Many of the design choices evident in this circuit come from a wireless module available from Texas Instruments.
4.3.1.6 Wireless Hardware The remote sensing module communicates with the main controller via a 2.4 GHz radio. The wireless radio of choice is the CC2500. The CC2500 is a relatively new part, and is an integrated radio which communicates via a SPI bus. The CC2500 requires very little to set up just power, an impedance matched trace to an antenna, and a SPI bus to communicate to the microcontroller with. Figure 4.3.1.6-1 shows the setup and the wiring for the CC2500 sans the antenna.

96
Figure 4.3.1.6-1
The CC2500 uses a crystal oscillator, and a complex capacitor/inductor network to connect to the antenna. The CC2500 interfaces with the MSP430 using six wires. Four wires are used for the SPI data interface which is used to send data to and receive data from the MSP430. The SPI protocol requires four connections, clock (P3.3SCLK), slave select (P3.0 SCN), master-in slave-out (P3.2 SO(GDO1)), and master-out slave-in (P3.1 SI). With the SPI protocol a slave cannot initiate communications, the master must select the chip using SCN and then send a request for data, or send data to be sent using SO(GDO1). The slave then echos the commands back to the master using SI. Because of these limitations the CC2500 requires additional connectivity to the MSP430 in order to let the MSP430 know it needs to initiate communications. The remaining two wires meet this requirement by acting as interrupts to the MSP430. The Antenna used is made by Wurth Elektronik. It is part number 7488910245 and is a simple 2.4 GHz monopole antenna. The antenna is very versatile in that it has a S11 return loss of -13.33 db at 2.445 GHz without a matching circuit and a S11 return loss of -31.9db at 2.445 GHz with a proper matching circuit. With a matching circuit the graph of the return loss is very steep, with a return loss of approx. -10db at 2.19 and 2.78GHz, which compared to -31.9db at 2.445GHz means that this antenna is very selective. Figure 4.3.1.6-2 is below and it depicts a directional scan of the electrical field produced by the antenna in the far field. As figure 4.3.1.6-2 shows, the antenna has a very low directivity which is to be
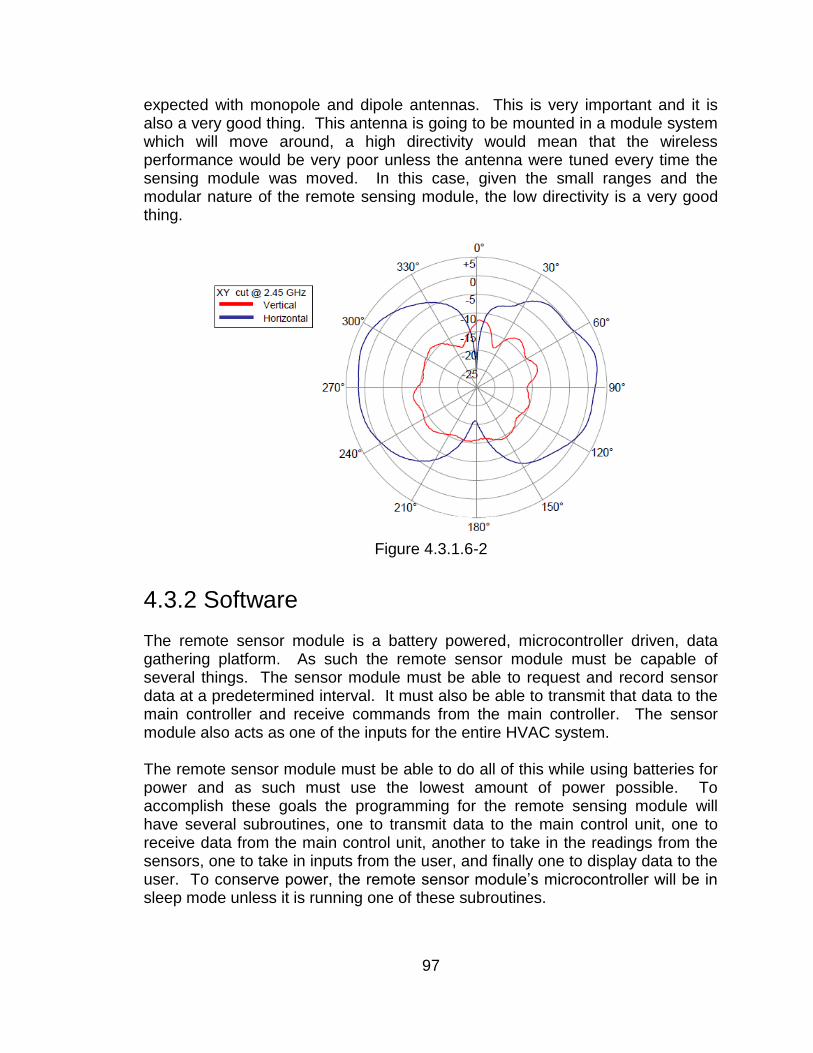
97
expected with monopole and dipole antennas. This is very important and it is also a very good thing. This antenna is going to be mounted in a module system which will move around, a high directivity would mean that the wireless performance would be very poor unless the antenna were tuned every time the sensing module was moved. In this case, given the small ranges and the modular nature of the remote sensing module, the low directivity is a very good thing.
Figure 4.3.1.6-2
4.3.2 Software The remote sensor module is a battery powered, microcontroller driven, data gathering platform. As such the remote sensor module must be capable of several things. The sensor module must be able to request and record sensor data at a predetermined interval. It must also be able to transmit that data to the main controller and receive commands from the main controller. The sensor module also acts as one of the inputs for the entire HVAC system. The remote sensor module must be able to do all of this while using batteries for power and as such must use the lowest amount of power possible. To accomplish these goals the programming for the remote sensing module will have several subroutines, one to transmit data to the main control unit, one to receive data from the main control unit, another to take in the readings from the sensors, one to take in inputs from the user, and finally one to display data to the user. To conserve power, the remote sensor module’s microcontroller will be in sleep mode unless it is running one of these subroutines.

98
The sensor module’s microcontroller will initialize itself when it is powered on, and then start timers which will drive the subroutines. All of the subroutines used in the microcontrollers programming will be interrupt subroutines, which allows the microcontroller to stay in the low power sleep mode for as long as possible. This is prefered because it reduces the power consumption of the microcontroller considerably. The inputs will be seen as interrupts, and the timers will be used as interrupts as well. Most of the programing that goes into the remote sensing module is designed to minimize the power consumption in order to preserve the battery.
4.3.2.1 Sensor Subroutine The sensor read Subroutine is possibly the most important piece of code that the remote sensor module uses. The sensor read subroutine is broken into two parts. One which reads the temperature and the humidity measurements from the SHT11 dual humidity/temperature sensor. The second part has two functions, one function is to power the heating elements for the carbon dioxide sensor and the second function is to read the carbon dioxide measurement from the sensor after the heating elements are powered up. Figure 4.3.2.1-1 below shows the pseudo code used to implement the sensor read subroutine. The sensor interrupt subroutine is activated by a timer that runs in the background while the microcontroller sleeps. The counter will be running faster than one half hert, therefore a counter is required to measure the time between readings. The first thing done when the program enters the sensor_read_sub is to check the main_counter to determine if two seconds has elapsed since the last temperature/humidity reading. If two seconds has yet to elapse, the subroutine adds one to the main_counter and proceeds to check the carbon dioxide counter. If two seconds has elapsed the subroutine communicates with the sensor (SHT11) via the I2C bus and requests that a temperature measurement to be taken. Once the temperature measurement is completed, the subroutine stores that data in a temporary register where it will stay until the wireless TX subroutine sends it to the main controller. The same process is then repeated for a humidity reading. The humidity data is stored in a different register than the temperature data. Once both temperature and humidity data is gathered, the subroutine resets the main_counter to zero, and sets an interrupt for the wireless TX subroutine so that the data will be sent as soon as the program returns from the sensor read subroutine. After this the subroutine continues to check the carbon dioxide counter. The subroutine checks the secondary_counter after the main_counter is resolved. The secondary_counter counts to five minutes because the carbon dioxide reading will only be taken once every five minutes. If five minutes has not passed the subroutine adds one to the secondary_counter and the program proceeds to check the heater_counter. If the secondary_counter indicates that five minutes has passed since the last carbon dioxide reading, then the

99
secondary_counter is reset to zero, the carbon dioxide sensor’s heater is turned on, the heater active bit is set high, and the heater_counter is incremented. The heater active bit is required for the heater_counter if-else statement below the heater activator section. The heater_counter is necessary to measure the time the heater has been on for. The carbon dioxide sensor used in the remote sensing module requires that the built-in heater be powered for thirty seconds before an accurate reading can be taken. The subroutine checks the heater_counter after the secondary_counter is resolved. The heater_counter measures the time that the carbon dioxide sensor has been on, for the heater must be on for at least thirty seconds before an accurate measurement can be made. If the heater_counter shows that less than thirty seconds has passed since the heater has been powered and the heater active bit is high (meaning that the heater is currently energized) the subroutine adds one to the heater_counter. If the heater_counter indicates that thirty seconds has passed since the heater has been powered and the heater active bit is high, the subroutine starts the ten bit analog to digital conversion for the input pin for the carbon dioxide sensor. Once the conversion is complete the converted number is then stored in a temporary register and the interrupt for wireless transfer is set high. The heater is then turned off, and the heater active bit is set low, after which the subroutine returns to the main program. sensor_read_sub() check main_counter to see if two seconds has elapsed If less than two seconds has elapsed( increment main_counter ) elseif two seconds or more has elapsed( reset main_counter read temperature and humidity sensor( send temperature read request to SHT11 via I2C bus wait for data from SHT11 store temperature data in temporary register send humidity read request to SHT11 via I2C bus wait for data from SHT11 store humidity data in temporary register set interrupt for wireless transfer set interrupt for display interrupt ) ) check secondary_counter to see if five minutes has elapsed if less than two seconds has elapsed( increment secondary_counter ) elseif five minutes has elapsed
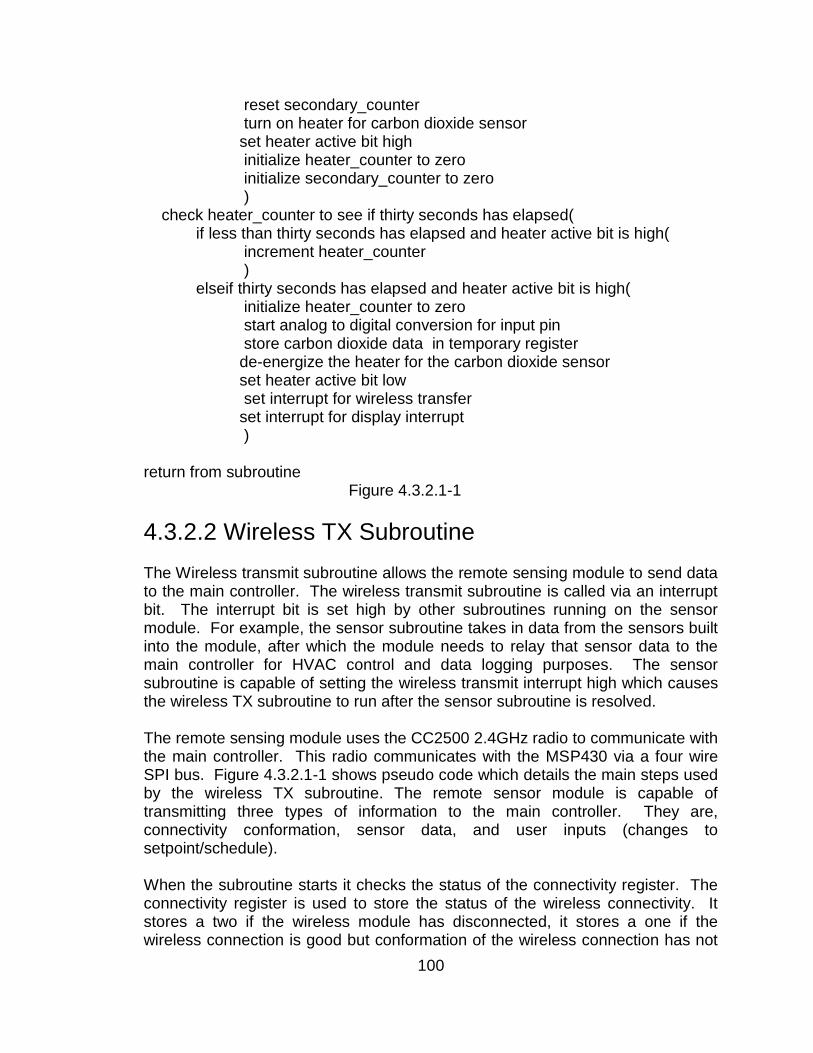
100
reset secondary_counter turn on heater for carbon dioxide sensor set heater active bit high initialize heater_counter to zero initialize secondary_counter to zero ) check heater_counter to see if thirty seconds has elapsed( if less than thirty seconds has elapsed and heater active bit is high( increment heater_counter ) elseif thirty seconds has elapsed and heater active bit is high( initialize heater_counter to zero start analog to digital conversion for input pin store carbon dioxide data in temporary register de-energize the heater for the carbon dioxide sensor set heater active bit low set interrupt for wireless transfer set interrupt for display interrupt ) return from subroutine
Figure 4.3.2.1-1
4.3.2.2 Wireless TX Subroutine The Wireless transmit subroutine allows the remote sensing module to send data to the main controller. The wireless transmit subroutine is called via an interrupt bit. The interrupt bit is set high by other subroutines running on the sensor module. For example, the sensor subroutine takes in data from the sensors built into the module, after which the module needs to relay that sensor data to the main controller for HVAC control and data logging purposes. The sensor subroutine is capable of setting the wireless transmit interrupt high which causes the wireless TX subroutine to run after the sensor subroutine is resolved. The remote sensing module uses the CC2500 2.4GHz radio to communicate with the main controller. This radio communicates with the MSP430 via a four wire SPI bus. Figure 4.3.2.1-1 shows pseudo code which details the main steps used by the wireless TX subroutine. The remote sensor module is capable of transmitting three types of information to the main controller. They are, connectivity conformation, sensor data, and user inputs (changes to setpoint/schedule). When the subroutine starts it checks the status of the connectivity register. The connectivity register is used to store the status of the wireless connectivity. It stores a two if the wireless module has disconnected, it stores a one if the wireless connection is good but conformation of the wireless connection has not

101
been sent to the main controller. A zero is stored in this register if the connection is good, and if conformation of the connection has already been sent to the main controller, in which case the subroutine skips to the next check. Next the subroutine checks the temporary temperature register. If it is zero the subroutine continues on to the humidity check. If the value is not zero then the subroutine sends the new temperature data to the CC2500 so that it will be sent to the main controller, and then the temporary temperature register is set to zero so that the temperature value is sent only when the value is updated. After the temperature register is taken care of, the subroutine checks the temporary humidity register and operates similar to the temporary temperature register check. Next the temporary carbon dioxide register is checked in the same manner. Next the subroutine checks to see if the schedule has been updated. The value of the temp schedule change register is checked and if it is zero the subroutine moves on to check if the setpoint has been changed. If the value is not one then the subroutine sends the new schedule value to the CC2500 and sets the temp schedule change register to zero before moving on to check the temp setpoint change register. The temp. setpoint change register contains a zero if the setpoint hasn’t changed, but contains the new setpoint if it has. If the setpoint has been changed the new value is sent to the main controller via the CC2500 after which the temp setpoint change register is set to zero. Wireless_TX_sub() check connectivity register for data if register is two( reinitialize wireless module set wireless status register to zero set display interrupt ) elseif register is one( set chip select high send connectivity conformation to CC2500 via SPI set connectivity register to zero set chip select low set wireless status register to one set display interrupt ) elseif register is (zero)( ) check temp temperature data register if register is zero( ) elseif register is not zero(

102
set chip select high send temperature data to CC2500 via SPI set temp temperature data register to zero set chip select low ) check temp humidity data register if register is zero( ) elseif register is not zero( set chip select high send humidity data to CC2500 via SPI set temp humidity data register to zero set chip select low ) check temp carbon dioxide data register if register is zero( ) elseif register is not zero( set chip select high send carbon dioxide data to CC2500 via SPI set temp carbon dioxide data register to zero set chip select low ) check temp schedule change register if register is zero( ) elseif register is not zero( set chip select high send new schedule to CC2500 via SPI set temp schedule change register to zero set chip select low ) check temp setpoint change register if register is zero( ) elseif register is not zero( set chip select high send new setpoint to CC2500 via SPI set temp setpoint register to zero set chip select low ) return from subroutine
Figure 4.3.2.2-1

103
4.3.2.3 Wireless RX Subroutine The setpoint/schedule for any zone can be set using two different methods; the user can input data using the remote sensing module, or the user can input data using the web interface. The remote sensing module must display the current setpoint and schedule regardless of how it was set. This means that the remote sensing module must be capable of receiving information from the main control unit, and this is accomplished through the 2.4GHz radio CC2500. The MSP430 and the CC2500 are connected via a SPI bus where the MSP430 is the master. This means that the CC2500 is not capable of initiating communications with the MSP430 through the SPI bus, but the CC2500 must have a way to initiate communications. This is accomplished using a pin that is completely separate from the SPI bus. The CC2500 is capable of using net DGO0 or DGO1 (these nets are shown in Figure 4.3.1.6-1 and Figure 4.3.1.5-1) to cause an interrupt in the MSP430, thereby initiating communications between the two. Figure 4.3.2.3-1 shows the subroutine that will run after DGO0 is raised high. First the subroutine will send a data request to the CC2500 which has the data that needs to be input to the MSP430. Next the subroutine must determine what type of data has been transmitted. Depending on the type of data, the subroutine will act differently. If the data is a new setpoint, the new value is stored in the register that the display subroutine uses to store the setpoint value. After that the interrupt for the display subroutine is set high, which means as soon as the wireless_RX_sub finishes, the display will be updated. The remote sensing module displays a number of things, one of which is an indication of zone activity. If the zone is calling for air, the module displays this, if it is calling for heat the module will display this as well. The indication symbol register is used by the display subroutine so that it will display the air handler information accurately. If the transmitted data is air handler activity information, the subroutine stores the data in the indication symbol register and sets the interrupt for the display subroutine, after which the subroutine will exit. Each zone has a number of pre-programmed schedules that can be chosen by the user via the remote sensing module or the web interface. If the schedule is changed through the web interface the main controller will send the updated data to the sensor module so that it can display up to date information. If the data that the wireless_RX_sub pulls from the CC2500 is schedule-update data, then it will store that data in the schedule register that the display subroutine uses. Then the subroutine will set the interrupt for the display subroutine, after which the subroutine will exit. If the data that Wireless_RX_sub gathers is not setpoint, air handler activity or schedule data, then there has been an issue somewhere. If this occurs the

104
subroutine will check the wireless_error_counter which counts the number of times this message has been an error. If the message has erred less than four times or less, then the wireless receive subroutine will set the connectivity register to a value that will let the main controller know that an error has occured with the previous message, and then the interrupt for the wireless_TX_sub will be set. If the message has erred more than four times, the subroutine sets the connectivity register to the value two, which is used to reinitialize the wireless connection. Then the wireless_TX_sub interrupt is called and the wireless_RX_sub exits. Wireless_RX_sub() access the CC2500 via the SPI bus determine what type of data it is(setpoint, activity, schedule) if data is setpoint type( change the setpoint register to reflect new value set wireless_error_counter to zero set interrupt pin for display_sub ) elseif data is air handler activity information( change indication symbol register set wireless_error_counter to zero set interrupt pin for display_sub ) elseif data is schedule type( change schedule register to indicate new schedule set interrupt pin for dispaly_sub
set wireless_error_counter to zero ) else( if wireless_error_counter is less than four( set connectivity register to error message vaule increment wireless_error_counter set interrupt for wireless transfer ) else if wireless_error_counter is greater than four( set connectivity register to two set wireless_error_counter to zero set interrupt for wireless transfer ) ) return from sub
Figure 4.3.2.3-1

105
4.3.2.4 Input Subroutine The remote sensor module is one of the inputs for the HVAC system and as such has physical inputs. The module has two types of inputs, pushbuttons and a rotary encoder. The two types of inputs must be handled differently, and thus the input subroutine is divided into five subroutines. The first three subroutines will take care of the pushbutton inputs. The final two subroutines will take care of the rotary encoder. Figure 4.3.2.4-1 shows input_sub_left which is the subroutine used to handle the left pushbutton. None of these subroutines are responsible for changing the display, but for progressing through the menus or for changing variables. The display_sub subroutine will take care of these responsibilities. The input_sub_left runs when the left pushbutton is pressed, it sets the left_pushbutton register to one and triggers the display subroutine. It is a very simple subroutine because it is not responsible for menu management or data management. input_sub_left() set left_pushbutton register to one set display interrupt return subroutine
Figure 4.3.2.4-1 The input_sub_select and input_sub_home are shown in figures 4.3.2.4-2 and 4.3.2.4-3 respectively. These subroutines act just like input_sub_left but they set different registers high such that the display interrupt will enact the proper display. input_sub_select() set select_pushbutton register to one set display interrupt return subroutine
Figure 4.3.2.4-2 input_sub_home() set home_pushbutton register to one set display interrupt return subroutine
Figure 4.3.2.4-3

106
The segment to control the rotary encoder is slightly different from the push button protocol. The biggest difference is that the rotary encoder acts as two separate inputs depending on whether the encoder is turned clockwise or counterclockwise. Figure 4.3.2.4-4 gives the pseudo code used for the rotary encoder. The rotary encoder uses two outputs; a and b. The input_sub_rotary is triggered by the ‘a’ input from the encoder. Once triggered, the subroutine looks at the value of the ‘b’ input. If the ‘b’ input is low that means that the rotary encoder is being turned clockwise and as such the clockwise register is set to one. If the ‘b’ input is high it indicates that the encoder is being turned counterclockwise and as such the counterclockwise register is set to one. After the direction has been taken care of, the subroutine calls the display subroutine which runs after the completion of this subroutine. input_sub_rotary() sample b input if b input is low( set clockwise register to one ) if b input is high( set counterclockwise register to one ) set display interrupt return subroutine
Figure 4.3.2.4-4
4.3.2.5 Display Subroutine The display subroutine is called whenever data that is displayed is changed or when the remote sensor module receives an input from the user. The display subroutine, displayed below in Figure 4.3.2.5-1 as pseudo code, is very large because one subroutine handles displaying every input and sensor reading. This subroutine must display any changes made by the three pushbuttons, the rotary encoder, all three sensors, and the wireless communication. The subroutine first checks to see if the left_pushbutton has been depressed. If it has, the subroutine looks into the menu hierarchy and moves up one level in the menu. The menu hierarchy is a file system which houses the menu structure, the true setpoint and schedule variables, and all text used to communicate with the user. Once the text for the new menu level is pulled from the menu hierarchy, the subroutine sends that text to the LCD screen via the I2C bus. After the LCD is updated the flag that indicates if the button is pressed is cleared. If the value stored in the left_pushbutton register was zero, then the program continues on to check the next input.

107
Next the subroutine checks to see if the select_pushbutton has been depressed. If it has, the subroutine looks into the menu hierarchy and moves down one level through the currently selected folder. Once the text for the new menu level is pulled from the menu hierarchy, the subroutine sends that text to the LCD screen via the I2C bus. After the LCD is updated the flag that indicates if the button is pressed is cleared. If the value stored in the select_pushbutton register was zero, then the program continues on to check the next input. Next the subroutine checks to see if the home_pushbutton has been depressed. If it has, the subroutine looks into the menu hierarchy and moves to the top level which is considered the ‘home’ folder. Once the text for the home level is pulled from the menu hierarchy, the subroutine sends that text to the LCD screen via the I2C bus. After the LCD is updated the flag that indicates if the button is pressed is cleared. If the value stored in the home_pushbutton register was zero, then the program continues on to check the next input. Next the subroutine checks to see if the clockwise register is one or zero. If it is one, the subroutine looks into the menu hierarchy and moves down one item while staying in the same folder. This is how the user will cycle through the menu. Once the subroutine knows which item needs to be selected, it sends that data to the LCD screen via the I2C bus. After the LCD is updated the the clockwise register is cleared. If the value stored in the clockwise register was zero, then the program continues on to check the next input. Next the subroutine checks to see if the counterclockwise register is one or zero. If it is one, the subroutine looks into the menu hierarchy and moves up one item while staying in the same folder. This is how the user will cycle through the menu. Once the subroutine knows which item needs to be selected, it sends that data to the LCD screen via the I2C bus. After the LCD is updated the the counterclockwise register is cleared If the value stored in the counterclockwise register was zero, then the program continues on to check the three temporary registers which store the sensor data, if the displayed sensor data needs to be updated. Finally the subroutine checks the temporary humidity register, the temporary temperature register, the temporary carbon dioxide register, and the temporary wireless status register. In each case if the register has a value of zero stored into it, the subroutine moves on to the next check. If the register has a value other than zero, then the subroutine transmits that data to the LCD display and sets that temporary register to zero. Once the subroutine has run through all these checks and updated the LCD accordingly, the program will leave the subroutine. display_sub() check left_pushbutton register(

108
if left_pushbutton register is zero( ) if left_pushbutton register is one( access menu hierarchy and move up one menu level send new menu level data to display using I2C bus set left_pushbutton register to zero ) ) check select_pushbutton register( if select_pushbutton register is zero( ) if select_pushbutton register is one( access menu hierarchy and move into selected folder level send new menu level data to display using I2C bus set select_pushbutton register to zero ) ) check home_pushbutton register( if home_pushbutton register is zero( ) if home_pushbutton register is one( access menu hierarchy and move to the top folder level send new menu level data to display using I2C bus set home_pushbutton register to zero ) ) check clockwise register if clockwise register is zero( ) if clockwise register is one( access menu hierarchy and move down one menu item send new menu level data to display using I2C bus set clockwise register to zero ) ) check counterclockwise register if counterclockwise register is zero( )
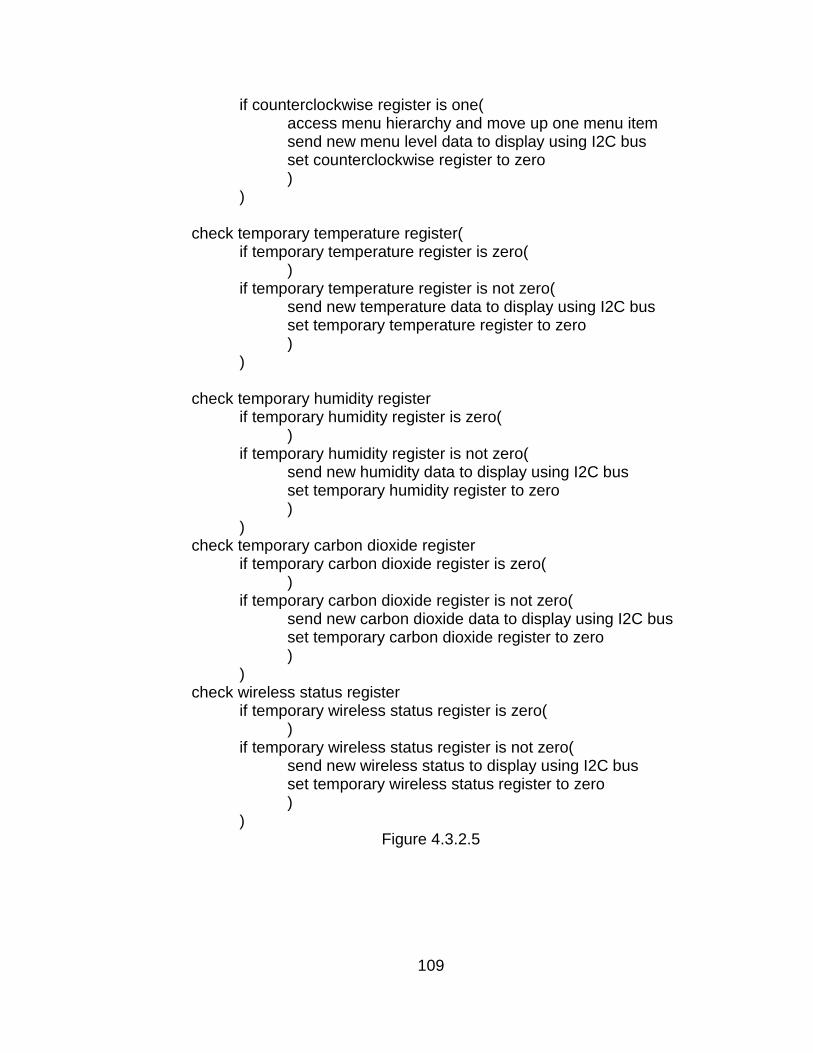
109
if counterclockwise register is one( access menu hierarchy and move up one menu item send new menu level data to display using I2C bus set counterclockwise register to zero ) ) check temporary temperature register( if temporary temperature register is zero( ) if temporary temperature register is not zero( send new temperature data to display using I2C bus set temporary temperature register to zero ) ) check temporary humidity register if temporary humidity register is zero( ) if temporary humidity register is not zero( send new humidity data to display using I2C bus set temporary humidity register to zero ) ) check temporary carbon dioxide register if temporary carbon dioxide register is zero( ) if temporary carbon dioxide register is not zero( send new carbon dioxide data to display using I2C bus set temporary carbon dioxide register to zero ) ) check wireless status register if temporary wireless status register is zero( ) if temporary wireless status register is not zero( send new wireless status to display using I2C bus set temporary wireless status register to zero ) )
Figure 4.3.2.5

110
Section 5: Prototyping The group was able to prototype something for each major section. The group prototyped the I2C interface which is a key technology used in the remote sensor module. The group also prototyped using the Google App Engine which is a major part of making the control system internet capable. Finally the group became familiar with the Texas Instruments’ Stellaris LM3S8962 Ethernet+CAN Evaluation kit at a Texas Instruments’ workshop. The Stellaris kit will be used extensively with the main control unit.
5.1 Thermostat Prototyping The thermostat will make great use of the I2C protocol and as such it was determined that energy should be devoted to prototyping with a device that used the I2C interface. To this end a TMP275 temperature sensor was acquired from Texas Instruments (TI). TI supplied the sensors free of charge as samples. The TMP275 is a digital temperature sensor that requires extensive initialization, and communicates via an I2C bus. The TMP275 was a great choice for prototyping, but it can in a sot-8 package. The sot-8 package has eight SMD pads and the leads are too small to solder to in the ‘dead bug’ style. This means that a custom PCB was required simply to get access to the leads of the TMP275. Figure 5.1-1 is a picture of the breakout board that was used. The group decided that it would be wasteful and irresponsible to purchase one custom breakout board that would not be used again. The group decided to make the breakout board using copper-clad, toner, and an etching solution. The PCB was laid out in Eagle CAD and then transferred to the copper-clad. After etching the PCB, the IC and eight male headers were soldered onto it. Once the PCB was made and populated, it was placed on a breadboard and connected to two general purpose I/O pins on the MSP430 Launchpad. Once the physical system was prepared, the coding began. After much work, the group was able to get data from the TMP275. The I2C protocol was emulated using a brute force (bit bang) approach. The TMP275 requires several registers be set when powered on, the accuracy of the conversion must be set, and a few other status registers need to be adjusted. Once communication was established the MSP430 requested temperature data from the TMP275. Once the MSP430 received the temperature data, it decoded the binary value and compared it to a preset temperature set when it was programmed. The preset was sixty degrees fahrenheit, and if the temperature measurement taken by the TMP275 was higher than the preset, the red LED was turned on. After the red LED to turned on and it was confirmed that the I2C bus worked, the preset temperature was set to one hundred degrees fahrenheit, and the green LED was made to turn on if the measured temperature was less than the preset. When
111
the green LED turned on, it was shown that the I2C bus worked, and the program on the MSP430 was capable of accurately requesting, gathering, and processing data from the I2C bus.
5.2 System UI & Intelligence Prototyping The decision to leverage Google App Engine greatly simplified the hardware design of the MCU, but also brought a shift in how the System UI & Intelligence would be developed. For developing web applications Google provides Google App Engine SDKs (Software Development Kits) for various operating systems. The SDK includes a web server that provides a local sandboxed environment with elements found in the Google App Engine runtime environment like APIs, libraries and the datastore. Also, it provides the means for deploying the application directly on the Google App Engine. The group proceeded to setup a local development environment for further testing Google App Engine’s features and capabilities. The Google App Engine Python SDK requires at minimum a computer with Python version 2.5. For this, the group chose the Windows 7 operating system and installed the latest windows binary of Python 2.7. Once Python was installed the group tested the Python installation to make sure it was working correctly. For this, the group tested the included IDLE interactive shell and created a short Python script that would output “Hello World!” to the screen. For testing IDLE the group launched it from the Python 2.5 directory in the All Programs list. Once inside the IDLE shell they called the “help()” function to test if the interpreter was working correctly and quickly quit the help() function by typing “quit” to go back to the shell and then quit the shell by typing “quit()”. To test the execution of Python scripts, a simple Hello World! script was created on the Desktop with the following line of Python code:
print("Hello World!") To run the script the group opened a command line window and ran the following commands: > cd Desktop > python helloworld.py The Python interpreter should read the script and output “Hello World!” in the command line. After ensuring the correct installation of Python on the development computer the group proceeded to download and install Google App Engine SDK for Python from the Google App Engine website. Once installed, the SDK can be managed

112
by opening the Google App Engine Launcher application which can be found in the All Programs list. For testing the group created a sample application using web2py by clicking File->Create a New Application. The application was named web2py and was stored in its own folder located inside the Documents folder. It was also set to listen on port 8080. With the creation of the web2py folder, the application files automatically generated by Google App Engine Launcher needed to be replaced with the web2py source files. These files were downloaded from the web2py website and extracted to the web2py folder. In order for the application to work, the contents of the app.yaml file in the web2py folder needed to be replaced with the contents of the app.example.yaml file. Once the application was setup it was launched from the Google App Engine Launcher. To access the application the group used a web browser and accessed http://localhost:8080 where they were greeted to a welcome page generated by web2py.
5.3 System Control Prototyping Texas Instruments’ Stellaris LM3S8962 Ethernet+CAN Evaluation kit will be implemented for system control to prototype for this system since the LM3S8962 will be used as the MCU but the CAN device will not be used. At the TI workshop discussed in Section 3.1 Research Methods, a lot of useful information specific to this system as well as multiple development boards was acquired. The LM3S8962 is not a cheap microcontroller and since multiple evaluation kits were acquired at the workshop it made it that much easier to prototype amongst the group members. It comes will a fully integrated Ethernet controller which will be used for the web application-to-MCU interface portion of this system. The microcontroller also has four General-Purpose Timer Modules which can be configured to act as a Real Time Clock instead of trying to integrate another chip on the PCB in the final design. The LM3S8962 has I2C and SPI buses available to interface with which will be useful since the RSMs will communicate to the MCU via a transceiver with a SPI bus interface. The I2C buses can be used to interface with the 74HC595 shift registers that will be used to control different components of an HVAC system. The board has a MicroSD Card Slot so that data, such as web page content, can be stored on removable flash cards using the SD card’s SPI mode. Figure 5.3-1 below is block diagram of the LM3S8962 Evaluation board. As shown, the board has 42 General Purpose I/O pins (GPIO), depending upon the configuration of the user. It comes with an on chip low drop-out voltage regulator, OLED display, magnetic speaker, and several other features. The dual USB controller is a 2-way communication port for serial communication, debugging, and power. The diagram illustrates the flow of signals from the MicroSD card slot or from the USB control through the JTAG MUX then to the microcontroller.

113
Figure 5.3-1 LM3S8962 Block Diagram

114
Section 6: Testing
6.1 Testing Criteria The system will undergo different functionality tests for checking proper operation. These tests will be carried out in a controlled environment where unknowns can be minimized, human error reduced and mistakes should not lead to major system failure or be a hazard to others. They should be repeatable and simple enough to be carried out by a layman who is not familiar with the system. Testing will be split among the three main components in the system: Remote Sensor Module, System UI & Intelligence Module, and System Control Module. Remote Sensor module testing procedures involve checking the following functions:
● Human-machine interface: This test will verify that the buttons, rotary encoder and LCD behave and respond in accordance to their designated functions.
● Sensors: The temperature sensor, humidity sensor and CO2 sensor should carry out proper readings based on exposure of the Remote Sensor module to different elements that alter its immediate vicinity.
● Wireless connectivity: This test will attempt to open a communication channel with the Main Control Unit over the wireless link.
● TESTING CODE For testing the System UI & Intelligence the web application and database must be uploaded first to Google App Engine in order to maximize the expected user experience. The tests will be as follows:
● Web application access: Checks for web application accessibility from the web browser using a computer connected to the internet.
● Page Links and Settings: This test verifies the proper redirect when clicking a link or button on the web application as well as testing the settings differences between a user and Administrator.
● Temperature and Humidity readout: This test goes over correct display of temperature and Humidity readings on the web application.
● Simultaneous Load: This test checks for web application stability when more than one user is connected.
● Control mechanisms: This test ensures that the web application is properly enforcing user privileges.
● Data logging: This tests for proper data logging and preparation of logged data for display in the form of graphs and logs from the History Page.
System Control module testing will be as follows:

115
● Wireless Connectivity: This test will check for the module’s ability to create the wireless network required by the Remote Sensor Module.
● Safety Shutdown: This test verifies that the fail safe shutdown function operates and performs as it is designed.
● Damper control: This test checks the system’s ability to open and close the dampers that are wired to it.
● Fan control: This test checks the system’s ability to start and stop the fan in the air handler.
● Heat pump control: This test checks for control of the heat pump including the reverse valve and heat pump fan.
6.2 Remote Sensor Module Testing The remote sensor module is a complicated subsystem. It was determined that the functionality of the remote sensor module could be completely tested using three comprehensive tests. These tests are targeted at specific functions of the remote sensor module, but by testing them it can be shown that every function built into the module works. These tests are, Human-Machine Interface, Sensors, and Wireless Connectivity.
6.2.1 Human-Machine Interface Testing The purpose of this test to make sure that the inputs and the outputs of the remote sensor module function as they should. The following tests will test both the hardware and the software that the module’s interface uses. The test can be performed in multiple settings, but it is desirable for the remote sensor module to be tested in an area in which all necessary support equipment is available. That is, the main controller should be within range of the module’s wireless radio, the main controller should be connected to the domicile’s physical plant. The main controller should be fully tested and should function appropriately. The following steps should be taken in the aforementioned setting, in the order specified below.
1. Place four new double-A batteries into the remote sensor module and wait for it to finish initializing; approx. five minutes.
2. Once initialized, the LCD screen should display the current temperature and humidity on lines one and two respectively of the LCD screen. There should be a ‘W’ in the top right corner which indicates that the wireless system is connected. There should also be a number in the lower right corner which indicates the zone that this module is controlling.
3. Press the ‘select’ button. This will cause the menu to change to the top view of the file hierarchy. There should be multiple items to choose from, but only two will be displayed at one time.
4. Turn the rotary encoder clockwise to move down the list

116
5. Continue until ‘view carbon dioxide’ Is selected 6. Press the ‘select button. The display should show ‘Carbon dioxide
XXXppm’ where XXX is populated by the sampled value 7. Press the ‘left’ button. The display should now show the previous menu 8. Turn the rotary encoder counterclockwise until the entry ‘Change
schedule’ is selected 9. Press the ‘select’ button. The display should show a currently activated
schedule. 10. Turn the rotary encoder until a different schedule is selected. 11. Press the ‘select’ button. The display should now show that the newly
selected schedule is active. 12. Press the ‘Home’ button. The display should return to showing the
temperature, humidity, zone number, and wireless status. 13. Log onto the server interface through a web browser. 14. Check the schedule for the zone that the module is controlling. The
schedule should be updated to the same one as set through the module’s interface.
If all the functions act as expected, then the input/output hardware and software function correctly.
6.2.2 Sensor Testing The sensors operate automatically, and they operate using timers. To make sure that enough time has elapsed for all sensors to have taken at least one sample the module must be powered on for at least ten minutes before undertaking this series of tests. The test can be performed in multiple settings, but it is desirable for the remote sensor module to be tested in an area in which all necessary support equipment is available. That is, the main controller should be within range of the module’s wireless radio, the main controller should be connected to the domicile’s physical plant. The main controller should be fully tested and should function appropriately. The following steps should be taken in the aforementioned setting, in the order specified below.
1. Place four new double-A batteries into the remote sensor module and wait for it to finish initializing; approx. five minutes.
2. Wait at least ten minutes. 3. The home view on the display should have updated temperature and
humidity data. 4. Use an accurate digital thermometer to test the accuracy of the
temperature reading. 5. Use an accurate digital humidity meter to test the accuracy of the
humidity reading. 6. Navigate through the menu to ‘view carbon dioxide’ and select it

117
7. Compare the carbon dioxide value shown with the value from a calibrated sensor
8. Next apply compressed carbon dioxide to the carbon dioxide sensor for five minutes
9. Check the carbon dioxide reading to see if it has increased 10. Next press the ‘home’ button 11. Apply heat to the temperature sensor for twenty seconds 12. Check the temperature readout on the home screen to see if it has
increased 13. Next apply a drop of water to the sensing membrane of the humidity
sensor 14. Check the humidity readout on the home screen to see if it has increased 15. If the module fails any of these tests log on to the web server and view the
data through a web browser. Repeat steps two through fourteen.
6.2.3 Wireless Connectivity The wireless connection initializes automatically. The purpose of this test is to ensure that the remote sensor module has a well functioning wireless connection to the main control unit. This series of tests will show that the wireless hardware works, and that both the transmit and receive subroutines work properly. This test requires that the display and input subroutines work properly. The test can be performed in multiple settings, but it is desirable for the remote sensor module to be tested in an area in which all necessary support equipment is available. That is, the main controller should be within range of the module’s wireless radio, the main controller should be connected to the domicile’s physical plant. The main controller should be fully tested and should function appropriately. Wait at least five minutes after power is connected before carrying out the following steps. The following steps should be taken in the aforementioned setting, in the order specified below.
1. Place four new double-A batteries into the remote sensor module and wait for it to finish initializing; at least five minutes.
2. Once initialized, the LCD screen should display the current temperature and humidity on lines one and two respectively of the LCD screen. There should be a ‘W’ in the top right corner which indicates that the wireless system is connected. There should also be a number in the lower right corner which indicates the zone that this module is controlling.
3. Next navigate to the option ‘change setpoint’ 4. Press the ‘select’ pushbutton 5. Use the rotary encoder to change the setpoint to sixty degrees 6. Press the ‘select’ pushbutton 7. Press the ‘home’ pushbutton 8. Log on to the web application using a standard web browser

118
9. Check the current setpoint for the zone which the module is controlling. It should be sixty degrees
10. Use the web interface to change the setpoint for that zone to seventy degrees
11. Use the inputs on the remote sensor module to navigate to the ‘change setpoint’
12. Press the ‘select’ pushbutton the current setpoint is displayed. It should be seventy degrees.
If this test was followed in this order, under these circumstances and the results are as expected, then it can be assumed that the wireless connectivity of the remote sensor module functions properly.
6.3 System UI & Intelligence Module Testing The following tests will ensure the correct functioning of the eHVAC web application for the system. The tests will target the functions of the web application in a way to simulate anything a typical user could ask.
6.3.1 Web Application Access Web application accessibility is an essential part of this project for it is one of the key features. Any device with internet capabilities should be able to access the web application and make adjustments if a valid password is used. First a device with internet connectivity such as a smartphone or computer should try to connect to the URL: http://ehvac2012.appspot.com. Once connected to the web application, the user will be prompted to enter a password so only the owners of the system can access the web application and make adjustments. There will be 2 levels of access depending on whether a user is an Administrator or they are not.
1. Confirm internet connectivity then open a web browser and go to the eHVAC web application, http://ehvac2012.appspot.com. The welcome page should come up with an enter button halfway down the page. Click on that button and type in a valid Username and Password. If a valid username and password is used, the next to load should be the homepage of the eHVAC web application. Once the Home Page has loaded the user should be able to see readings from all the zones that are currently connected in the system and also links to different pages like Zones, Schedules, History, Graphs, and Settings. If all this appears for the user then the web application is working correctly.

119
6.3.2 Page Links and Settings This set of tests will check the web application’s links and tabs for the user to be able to adjust settings as they please. As mentioned earlier, there are two levels of access: unlimited access to all settings and configurations if an Administrator is logged in and a limited access to users with only specific zone access. Both user and Administrator access will be tried and tested for any malfunctions. First thing is to acquire a device with internet connectivity and capabilities along with some type of web browser to visit the eHVAC web application. The first password to be tested will be from an Administrator password.
1. With a web browser open and internet connection, type in the URL for the eHVAC web application in the address bar: http://ehvac2012.appspot.com. The welcome page should have an enter button that when it is clicked a screen comes up with a username and password prompt. The prompt is for access to the homepage so that only valid username and passwords will be granted access to the systems homepage and links.
2. In the prompt, enter the Administrator username and password and the web application should go directly to the homepage. Since the Administrator username and password was used, the user will have unlimited access to all settings and configurations so every link can be tested. Figure 4.1.2-4 in Section 4.1.2 Web Application Layout shows a similar view of the possible displayed values for the Administrator to see.
3. Click the link titled “ZONES.” The web application should go directly to the “ZONES” page which should resemble Figure 4.1.2-5 of Section 4.1.2. The Administrator should have access to adjusting values to all the zones. For testing purposes change a value in all the zones and see if the values change. If this is true, then move on to the next step.
4. The next link to test will be the “SCHEDULE” link. Click on the “SCHEDULE” link and the web application should directly go to the “SCHEDULE” page. This page should look similar to Figure 4.1.2-6 of Section 4.1.2. To test for access adjust a schedule for every zone and see if the web application allows for it. If so, then go on to the next link.
5. Next test the “GRAPHS” link by clicking on the “GRAPHS” link at the top of the page. Immediately the web application should open up a webpage that looks similar to Figure 4.1.2-7 of Section 4.1.2 of this paper. If the link takes the user to a webpage that looks similar, then the next link will be tested.
6. To test the next link, click on the “HISTORY” link at the top of the page and web application should automatically load the new page. The “HISTORY” page should appear like Figure 4.1.2-8 from Section 4.1.2 of this paper. If this is true then for testing purposes try and access the history for all of the zones. Only the Administrator will have access to all

120
the zones and will thus know they have total Administrator access to this page.
7. The last link to test is the “SETTINGS” link. Since the Administrator user is logged in, the user should have access to this page. Click the link and once the page is loaded it should look similar to Figure 4.1.2-9 of Section 4.1.2. To test for Administrator access the user should try and click the zones button and once clicked this should open a separate page with options to adjust the amount of zones and names of the zones. Once this has been completed then go on to the next step.
8. From here, click the “HOME” link to test if the web application will load the homepage correctly. If this is true then it is proven that all the links work if logged in as an Administrator.
These next steps will be for a username and password that does not have any administrative rights, therefore there will be some restrictions when it comes to what links are available.
1. With a web browser open and internet connection, type in the URL for the EHVAC web application in the address bar: http://ehvac2012.appspot.com. The welcome page should have an enter button that when it is clicked a screen comes up with a username and password prompt. The prompt is for access to the homepage so that only valid passwords will grant access to the systems homepage and links.
2. In the prompt, enter a non-administrative username and password and the web application should go directly to the homepage which should look similar to Figure 4.1.2-4 in Section 4.1.2. Figure 4.1.2-4 has links to all the other pages that will need to be tested.
3. Click the link titled “ZONES.” The web application should go directly to the “ZONES” page which should resemble Figure 4.1.2-5 of Section 4.1.2. To make sure a User is logged in and not an Administrator, try to access all the zones and if you are prompted with a “Not Allowed to Access” message then you are logged in as a User. If this is true, then move on to the next step.
4. The next link to test will be the “SCHEDULE” link. Click on the “SCHEDULE” link and the web application should directly go to the “SCHEDULE” page. This page should look similar to Figure 4.1.2-6 of Section 4.1.2. To test, please attempt to schedule for all the zones, if a message appears for “Not Allowed to Adjust this Zone” then this tells the user they are not an Administrator and are in fact as User on this Page.
5. Next test the “GRAPHS” link by clicking on the “GRAPHS” link at the top of the page. Immediately the web application should open up a webpage that looks similar to Figure 4.1.2-7 of Section 4.1.2 of this paper. If the link takes the user to a webpage that looks similar, then the next link will be tested.
6. To test the next link, click on the “HISTORY” link at the top of the page and web application should automatically load the new page. The

121
“HISTORY” page should appear like Figure 4.1.2-8 from Section 4.1.2 of this paper. To test this page, the user will try and click the history for all the zones and if they are prompted by saying “Not allowed access to this zone” then this tells the user they are not an Administrator and cannot access all the zones on the web application. If this is true then the next link can be tested.
7. The last link to test is the “SETTINGS” link. Since a username and password with no administrative rights is being used, the amount of settings they can change are limited unlike the Administrator. For instance, to test this, the user should click the User Management tab. If a prompt message appears and says “Not allowed to access” then this tells the user they are not an Administrator and are in fact a user. If that appears then the link works correctly in this situation.
8. From here, click the “HOME” link to test if the web application will load the homepage correctly. If this is true then it is proven that all the links work with this username and password.
These tests should give the user a better insight on the ways around the web application. After the tests, the user will have a better grasp on how to navigate through the eHVAC web application, will know that all the links are working properly, and the difference in privileges between a username with administrative rights and a username without. Each page is an important part of the system that helps define this project. If one page is not available or not working, then the whole purpose of having control of the system from a web application is defeated.
6.3.3 Temperature and Humidity Readout This testing section is to help the user know if the Temperature and Humidity Sensors are correctly displaying the readings in the system. This section does not require the user to be an Administrator to view all the readings.
1. With an internet enabled device open a web browser and type in the URL for the eHVAC web application, http://ehvac2012.appspot.com.
2. Once connected to the web application input a valid Username and corresponding password to log in.
3. Once the page has loaded it should load to the Home Page. Take a look at the Current Inside Average Temperature, Current Average Set Point Temperature and Current Average Humidity displays. If all the values corresponding with those displays look accurate then scroll to the Zones display on the Home Page.
4. In each Zone the user should see a connection status of either “Connected or Disconnected” depending on the state of the Zone and also a corresponding Temperature for those zones. If all values seem correct then go to the next step.

122
5. Click the “Zones” Page Link. The user will notice this display is similar to the display on the Home Page for the Zones. If the values on this page seem to reflect the ones on the Homepage then your system is correctly working.
6.3.4 Simultaneous Load The point of this test is to see how many users can access the eHVAC web application and be able to use all of the features of the web application at one time. The specification for this project is to be able to handle five users at once. First there will need to be at least five devices that have internet access to visit the web application such as a smartphone or computer and a web browser. Connection to the internet will need to be established first. Once that is established the testing can begin. One device will be used to begin with.
1. With the web browser open, the URL for the eHVAC web application, http://ehvac2012.appspot.com, needs to be entered into the address bar. The page that is loaded should resemble Figure 4.1.2-2 of Section 4.1.2 of this paper.
2. Click the enter button for a screen to pop up and enter a valid username and password to gain access to the homepage. The homepage should resemble Figure 4.1.2-4 of Section 4.1.2 if it is loaded correctly
3. Some requests or adjustments will need to be made to test the communication between the web application and the system. If the adjustment or requests for heat/cool is received by the system then the web application and MCU are connected. This proves that the web application can handle a load of 1 user.
4. Use a second device with internet capabilities and enter the eHVAC URL, http://ehvac2012.appspot.com, in a web browser. At the welcome page, click the enter button to enter another valid username and password (not the same as the first user) to gain access to the eHVAC homepage.
5. Once access is granted to the homepage, some type of request or adjustment needs to be made from both the first and second devices. If the web application can take in these requests and have the system process and adjust to these requests, then the web application is able to handle a load of 2 users simultaneously.
6. Use a third device with internet capabilities and enter the eHVAC URL, http://ehvac2012.appspot.com, in a web browser. At the welcome page, click the enter button to enter another valid username and password to gain access to the eHVAC homepage.
7. Once access is granted to the homepage, make some type of request or adjustment from the third, first, and second devices simultaneously. If the web application can take in these requests and have the system process and adjust to them, then the web application is able to handle a load of 3 users simultaneously.

123
8. Use a fourth device with internet capabilities and enter the eHVAC URL, http://ehvac2012.appspot.com, in a web browser. At the welcome page, click the enter button to enter another valid username and password to gain access to the eHVAC homepage.
9. Once access is granted to the homepage, some type of request or adjustment needs to be made from the first, second, third, and fourth devices. If the web application can take in these requests and have the system process and adjust to these requests, then the web application is able to handle a load of 4 users simultaneously.
10. Use a fifth device with internet capabilities and enter the eHVAC URL, http://ehvac2012.appspot.com, in a web browser. At the welcome page, click the enter button to enter another valid username and password to gain access to the eHVAC homepage.
11. Once access is granted to the homepage, some type of request or adjustment needs to be made from the first, second, third, fourth, and fifth devices. If the web application can take in these requests, have the system process/adjust to these requests, and there are not any issues or malfunctions with the web application working properly, then the web application is able to handle a load of 5 users simultaneously.
As stated in the steps above, if there are no malfunctions on the web application and all the commands, requests, and adjustments made were processed then the web application can be deemed as being able to handle 5 users simultaneously. These steps can be repeated to find the max amount of users the web application can handle.
6.3.5 Control Mechanisms The control mechanisms for the system UI & intelligence module consist of user privileges and restrictions. The control mechanisms are set such that the HVAC system’s preferences and configurations are not available to every user. Only the admin has access to the configuration files, and only the administrator is able to set zoning privileges. The user accounts have been set up such that one user type (the Administrator) has access to all zones and all configuration files. This gives the Administrator the ability to control how the main controller responds to the physical plant, and the ability to set up zone restrictions. The Administrator must create user accounts and give other user accounts permissions and ownership of zones. Only when a user has ownership of a zone can the user change the setpoint, schedule, or adjust the settings for that zone. This series of tests will show that the control mechanisms work and that they correctly limit users access and control of the HVAC system. This test should be conducted once it is ascertained that the main control unit functions properly and is connected to the network appropriately. The following steps should be taken in the aforementioned setting, in the order specified below.

124
This section is meant for Users with No Administrative rights.
1. With an internet enabled device please open a web browser and type in the URL for the eHVAC web application, http://ehvac2012.appspot.com.
2. Once connected to the web application please input a valid Username and corresponding password to log in.
3. Once the page has loaded, click the “History” Page Link and wait for it to load.
4. Once the page has loaded, try and access a zone history that admittance would not normally be allowed. If a prompt appears with the following message “Not Allowed to Access,” then this shows that the user account does not have Administrative access to this content.
5. Click the “Settings Page” and wait for it to load. 6. Once the page has loaded, click the user management button and wait for
it to load. If a prompt appears with the following message “Not Allowed to Access,” then this shows that the user account does not have Administrative access to this content.
7. Next, click the Zone options tab. If a prompt appears with the following message “Not Allowed to Access,” then this shows that the user account does not have Administrative access to this content.
8. Finally, click the Compatibility Options tab. If a prompt appears with the following message “Not Allowed to Access,” then this shows that the user account does not have Administrative access to this content.
9. If all steps have been completed and no access is allowed then this shows the account that is logged in is a User Account.
This section is meant for Administrators.
1. With an internet enabled device please open a web browser and type in the URL for the eHVAC web application, http://ehvac2012.appspot.com.
2. Once connected to the web application please input a valid Username and corresponding password with Administrative status to log in.
3. Once the page has loaded, click the “History” Page Link and wait for it to load.
4. Once the page has loaded, try and access a zone history that admittance would not normally be allowed. If the zone history displays correctly then this account has Administrative access to all zones.
5. Click the “Settings Page” and wait for it to load. 6. Once the page has loaded, click the user management button and wait for
it to load. If user management options display correctly then this account has Administrative access to all user accounts.
7. Next, click the Zone options tab. If the zone options display correctly this this account has Administrative access to all the zones and options.
8. Finally, click the Compatibility Options tab. If the Compatibility Options load correctly then this account has Administrative access to all system settings.

125
9. If all steps have been completed and all access is granted then this shows the account that is logged in is an Administrative Account.
6.3.6 Data Logging The point of this test is to check and see if the system is correctly calculating and storing the right values of the readings into the database and making sure the history for each zone is reflecting these values. To confidently test this aspect of the system it is advised that the user wait 15 minutes after logging in for data to be stored. This section is meant for Users with No Administrative rights.
1. With an internet enabled device open a web browser and type in the URL for the eHVAC web application, http://ehvac2012.appspot.com.
2. Once connected to the web application input a valid Username and corresponding password to log in.
3. Once the page has loaded, click the “History” Page Link and wait for it to load.
4. Next, click a Zone History button (more specifically the zone the user has access to) and wait until the data is compiled.
5. Once the page has loaded, check to see if the data is being properly displayed with corresponding Temperature, Humidity and CO2 Readings and also Timestamps for these readings.
6. Finally, the user should check the ability to adjust the time frame for viewing from Day, to Month.
7. If all these steps work correctly then the system is properly working. This section is meant for Administrators.
1. With an internet enabled device open a web browser and type in the URL for the eHVAC web application, http://ehvac2012.appspot.com.
2. Once connected to the web application input a valid Username and corresponding password with Administrative status to log in.
3. Once the page has loaded, click the “History” Page Link and wait for it to load.
4. Next, click any Zone History button and wait until the data is compiled. 5. Once the page has loaded, check to see if the data is being properly
displayed with corresponding Temperature, Humidity and CO2 Readings and also Timestamps for these readings.
6. Finally, the user should check the ability to adjust the time frame for viewing from Day, to Month.
7. Repeat steps 4-6 with the other Zones to make sure they are all working properly.
8. If all these steps work correctly then the system is properly working.

126
6.4 System Control Module The following tests ensure the proper function of the system control. These tests validate the designs made and will test if the chosen methods are effective and efficient. Each design will be tested to determine if the controls will actually control dampers, a heat pump, a fan as well as the wireless connectivity between the RSMs and the MCU.
6.4.1 Wireless Connectivity The wireless connection initializes automatically. The purpose of this test is to ensure that the main controller has a well functioning wireless connection to the remote sensor modules. This series of tests will show that the wireless hardware works, and that both they transmit and receive subroutines work properly. This test requires that both the remote sensor module’s interface and its wireless subsystem work properly. The test can be performed in multiple settings, but it is desirable for the main controller to be tested in an area in which all necessary support equipment is available. That is, the remote sensor module(s) should be within range of the main controller’s wireless radio, and the main controller should be connected to the domicile’s physical plant. The remote sensor module(s) should be fully tested and should function appropriately. Wait at least five minutes after power is connected to both the main controller and the remote sensor module before carrying out the following steps. The following steps should be taken in the aforementioned setting, in the order specified below.
1. Place four new double-A batteries into the remote sensor module and wait for it to finish initializing; at least five minutes.
2. Once initialized, the LCD screen should display the current temperature and humidity on lines one and two respectively of the LCD screen. There should be a ‘W’ in the top right corner which indicates that the wireless system is connected. There should also be a number in the lower right corner which indicates the zone that this module is controlling.
3. Next navigate to the option ‘change setpoint’ 4. Press the ‘select’ push button. 5. Use the rotary encoder to change the setpoint to sixty degrees. 6. Press the ‘select’ push button. 7. Press the ‘home’ push button. 8. Log on to the web application using a standard web browser. 9. Check the current setpoint for the zone which the module is controlling. It
should be sixty degrees. 10. Use the web interface to change the setpoint for that zone to seventy
degrees.

127
11. Use the inputs on the remote sensor module to navigate to the ‘change setpoint.’
12. Press the ‘select’ push button for which the current setpoint is displayed. It should be seventy degrees.
This is the same test that is used to test the remote sensor module’s wireless connection but it serves to test the wireless connection of the main controller as well. If this test passes then it means that both wireless hardware and the wireless software function correctly in both the remote sensor module and the main controller.
6.4.2 Test Damper Control In order to test the system without actually buying dampers and installing them in a house, a testbed is going to be made. The testbed is going to consist of LEDs to simulate the dampers opening or closing. All possible simulation contestants will be considered and tested for such that the testing accurately represents the full scale results. In order to test the damper control, several commands will be sent from the MCU to simulate the usually requests of a user. Then a series of commands that will outside the normal request will be sent. This will find the breaking point of the software or hardware. All the testing will be for a two-zoned system will normally-open dampers so the LEDs will only turn on if the damper is closed.
1. To turn on the LEDs manually, change the damper registers in the database from 0’s to 1’s. This will prove that the MCU is sending data to shift register and the data is correctly being sent through the triacs to the LEDs. Once it is proven that the circuit is working correctly, use the RSMs to simulate typical situations by changing the set-points in each zone.
2. Use both RSMs in zone 1 and zone 2 to change each set-point so the system will turn on. Since the dampers are normally-open, they should not change the positions so neither LED1 nor LED2 should turn on.
3. Change zone 1’s set point such that the system will turn on but keep zone 2’s set point such that the sample point is equal to the set point. The system should turn on to supply air to zone 1 so LED1 should not turn on but zone 2 does not need air so LED2 should turn on indicating the zone 2’s damper closing. Once zone 1’s set-point is reached, the system should turn off and LED2 should turn off to simulate zone 2’s damper opening back up.
4. Change zone 2’s set point such that the system will turn on but keep zone 1’s set point such that the sample point is equal to the set point. The system should turn on to supply air to zone 2 so LED2 should not turn on but zone 1 does not need air so LED1 should turn on indicating the zone 1’s damper closing. Once zone 2’s set-point is reached, the system should turn off and LED1 should turn off to simulate zone 1’s damper opening back up.

128
5. Next call for air from zone 1 only. Before the set-point is reached call for air from zone 2 whose LED should be currently on. Once the MCU receives this request, LED2 should then turn off to indicate zone 2’s damper opening. The sample-point in zone 1 should reach the set-point first of the two zones. Therefore, LED1 should illuminate indicating that the desired temperature has been reached and there is no longer any need for air so the damper closes. LED1 should stay on until the desired temperature is reached in zone 2 and then the system shuts off turning LED1 off indicating zone 1’s damper returning to its’ normally-open position.
6. Next call for air from zone 2 only. Before the set-point is reached call for air from zone 1 whose LED should be currently on. Once the MCU receives this request, LED1 should then turn off to indicate zone 1’s damper opening. The sample-point in zone 2 should reach the set-point first of the two zones. Therefore, LED2 should illuminate indicating that the desired temperature has been reached and there is no longer any need for air so the damper closes. LED2 should stay on until the desired temperature is reached in zone 1 and then the system shuts off turning LED2 off indicating zone 2’s damper returning to its’ normally-open position.
7. Next raise the set point in zone 1 such that system will be in heating mode and zone 2’s set point equal to the sample point; LED2 should turn on indicating zone 2’s damper closing. While the system is still heating zone 1, call for cool air in zone 2. LED2 should stay on until the set-point in zone 1 is reached. Once that happens, LED2 should turn off and LED1 should turn on indicating zone 2’s damper opening and zone 1’s damper closing. Once the set-point is reached in zone 2, LED1 should turn off simulating zone 1’s damper returning to its’ normally-open position. Then run this test again starting with a call from zone 2.
8. Next raise the set point in zone 2 such that system will be in heating mode and zone 1’s set point equal to the sample point; LED1 should turn on indicating zone 1’s damper closing. While the system is still heating zone 2, call for cool air in zone 1. LED1 should stay on until the set-point in zone 2 is reached. Once that happens, LED1 should turn off and LED2 should turn on indicating zone 1’s damper opening and zone 2’s damper closing. Once the set-point is reached in zone 1, LED2 should turn off simulating zone 2’s damper returning to its’ normally-open position. This will test if the damper controls can distinguish between heating and cooling mode.
After this set of tests the user should feel confident with the dampers working and being able to handle any requests. If the controls fail any of these tests, then major problems could develop throughout. The tests above are critical in determining if this system can be a viable product sold in stores.

129
6.4.3 Test Fan Control The following are tests for the proper function of the fan in the air handler. The beginning of the test will be done by manually changing values of registers in the database. This is to ensure the hardware portions of the controls are working. Then the RSMs will be used to send commands to the MCU to test the software side of the controls. Just like in the testing of the damper controls, these tests are going to be scaled down, and are going to use a LED to simulate turning the blower fan on and off. All tests will be for a 2-zone system.
1. To test the hardware, change the default “0” in the fan register to “1.” The fan LED should turn on. This indicates that the blower fan is running and setting the register back to “0” should turn the LED off.
2. Next use both RSMs to call for air; this should automatically turn on the fan LED. Once the temperature set-points have been reached the fan LED should turn off.
3. Use the RSMs to request for the fan to be on continuously regardless of the relationship between sample and set points. Once the request is processed, the fan LED should turn on and stay on independently of the temperature set-points.
4. Then change the desired temperature in each zone. The fan LED should stay on no matter what changes are made even after the system shuts off. Once the system shuts off change the setting of the fan via the RSMs back to automatic and the fan LED should then turn off.
5. Next repeat last three steps; request for the fan to be on continuously from both RSMs and change the desired temperatures in each zone to turn the system on. While the system is still running change the setting on the RSMs for the fan to be automatic. The fan LED should stay on until the desired temperatures are reached. Once those temperatures are achieved, the system will shut off along with the fan LED.
In the software for the fan control, there are some damper controls which the following steps will test.
1. First request for the fan to be on continuously from zone 1 only so the fan LED should light up along with LED2, which indicates zone 2’s damper closing.
2. Then change the set-points in each zone to turn the system on. LED2 should turn off to indicate the damper opening until the desired temperature in zone 2 is reached then LED2 should turn on, the fan LED should stay on, and LED1 should have never turned on.
3. Once the system is off request from zone 2 for the fan to be on continuously and LED2 should turn off and the fan LED should stay on.
4. Request for the fan to be on continuously from zone 1 only so the fan LED should light up along with LED2, which indicates zone 2’s damper closing.

130
5. Then change the set-points in each zone to turn the system on. LED2 should turn off to indicate the damper opening until the desired temperature in zone 2 is reached then LED2 should turn on, the fan LED should stay on, and LED1 should have never turned on.
6. Before the system turns off request from zone 2 for the fan to be on continuously and LED2 should turn off and the fan LED should stay on. Once system turns off only the fan LED should be on.
7. Request for the fan to be on continuously from zone 1 only so the fan LED should light up along with LED2, which indicates zone 2’s damper closing.
8. Then change the set-points in each zone to turn the system on. LED2 should turn off to indicate the damper opening until the desired temperature in zone 2 is reached then LED2 should turn on, the fan LED should stay on, and LED1 should have never turned on.
9. Before the system turns off change the setting in zone 1 for the fan to be automatic. The fan LED should turn off when the system turns off.
10. Request for the fan to be on continuously from zone 1 only so the fan LED should light up along with LED2, which indicates zone 2’s damper closing.
11. Then change the set-points in each zone to turn the system on. LED2 should turn off to indicate the damper opening until the desired temperature in zone 2 is reached then LED2 should turn on, the fan LED should stay on, and LED1 should have never turned on.
12. Before the system turns off change the setting in zone 1 for the fan to be automatic and the setting in zone 2 from automatic to ON. The fan LED should stay on when the system turns off.
13. Repeat steps 1 through 12 but start with zone 2 requesting the fan ON first so LED1 and the fan LED should turn on. Then LED1 should turn off once the system turns on and when the systems turn off LED1 should turn on,the fan LED should stay on, and LED2 should have never turned on. The next condition LED1 should turn off when the request for the fan to be ON from zone 1 is made. The next condition the fan LED and LED2 on the only ones that start illuminated, then the instructions above are taken and once the system shuts off only the fan LED should be on. The next condition the fan LED and LED2 start on then the above instructions take place and once the system shuts off no LEDs should be on. The last condition the fan LED and LED2 should start on and then the steps above are executed, the fan LED should stay on and LED2 should be on also.
6.4.4 Test Heat Pump Control Testing the controls of the heat pump must be done by manually changing values in the registers to test the hardware and then by using the RSMs to give commands to test the software of the system. Again, it is not going to be possible to do these test on a system already installed in a household so the test are going to be scaled down by the use of LEDs to simulate the turning on and off of the compressor, the outdoor fan, the supplementary heat, and the mode of
131
the reverse valve. All tests are for a 2-zone system with one single-speed compressor.
1. First go into the database and change the heat pump registers by manually setting them from 0 to 1 to turn on all the components. Every LED should illuminate indicating the hardware is correctly put together and the MCU’s has success sending commands. Set the registers back to 0 turning off the LEDs. The following steps will test the software control of the heat pump by sending commands from the RSMs.
2. First call for heat from either RSM and this should turn on the LEDs for the compressor and outdoor fan. When the set point temperature is reached both the compressor and outdoor fan LEDs should turn off.
3. Next test the emergency heat by changing the set point 5 degrees higher than the sample point. The system should turn on with the compressor, outdoor fan, and emergency heat LEDs turning on. Once the set point is reached, the system should shut off so all the LEDs should turn off.
4. Next lower the set point to test the cooling mode. When the system turns on, the outdoor fan, compressor, and the reverse valve LEDs should turn on. The reverse valve’s default position is for heating mode so to switch it needs to be energized. Once the set point is reached, all the LEDs should turn off.
5. Have zone 1 call for heat while zone 2 calls for cool air. Since the default mode is heating, zone 2 will have to wait until zone 1 is heated to its’ set point so only the outdoor fan, the indoor fan, and compressor LEDs should turn on along with LED2 to indicate zone 2’s damper closing. Then once the set point is reached, the reverse valve LED should turn on along with LED1 indicating zone 1’s damper closing and LED2 should turn off for zone 2’s damper opening. Once zone 2 reaches its’ set point, all the LEDs should turn off.
6. Repeat step 5 with zone 2 calling for heat and zone 1 calling for cool air. This condition should first turn on the LEDs for the outdoor fan, compressor, blower fan, and LED1 for zone 1’s damper closing. When the set point is reached in zone 2, the reverse valve LED should turn on along with LED2 and LED1 should turn off.
7. For the last test have zone 1 calling for heat and sometime while the system is running, zone 2 will call for cool air. While the system is heating zone 1, the compressor and outdoor fan LEDs should be on along with LED2 indicating that zone 2’s damper is closed. Then once zone 1’s set point is reached, the reverse valve LED should turn on along with LED1 and LED2 should turn off. Once the set point in zone 2 is reached, all LEDs should turn off.
8. Repeat step 7 with zone 1 calling for cool air first then somewhere along the line zone 2 will call for heat. With these conditions the outdoor fan, compressor, and reverse valve LEDs should turn on along with the blower fan LED and LED2. Once the set point in zone 1 is reached, the reverse valve LED should turn off along with LED2 and LED1 should turn on.

132
9. Repeat step 7 and 8 again but start with zone 2 calling for heat/cool then zone 1 for cool/heat at some intermediate point. The first condition zone 2 calls for heat, the outdoor fan and compressor LED turns on along with LED1 and the fan LED. Then once zone 2’s set point is reached, the reverse valve LED should turn on along with LED2 and LED1 should turn off. The second condition, the outdoor fan, compressor, and reverse valve LED will turn on along with LED1 and the fan LED. Then once the set point is reached in zone 2, the reverse valve LED should turn off along with LED1 and LED2 should turn on.
During these tests, the time it takes to heat or cool a zone to its’ desired temperature will be timed to measure how having a modular system can be more efficient by being able to cool or heat smaller zones faster. Voltage and current measurements will also be taken to calculate power consumption to prove this system to be efficient.
133
Section 7: Administrative Content
7.1 Milestone Discussion In a project of this magnitude there must be a discussion of goals and timelines. A set of milestones has been created to keep the project on track and have progress made in a timely manner. Timelines have been set for each individual in the group such that they reflect the skill set and abilities of each member. These timelines include a start date, a work period, a review period and a completion time. The timelines for each major section of the project has been laid out in such a way that all the above parameters have been defined. These major sections include the Remote Sensor Module (RSM), the Main Controller (MC) and the Web application. There are many subsections within these top level sections that will be discussed. Starting with the RSM there are a few subsections that go into it which include but are not limited to the User interface, the Sensors, the Connectivity to the Main Controller and the PCB Design. The average time for all of these subcomponents is roughly 6 months which will include research, design and completion. If all goes as planned the RSM should be finished by the end of November. The Main Controller includes many subcomponents within itself which require a large effort from the group to complete. These subsections will include the web server (Google App Engine), Connectivity (to the RSM), Vent Control, Safety Sensors, Fan controller, heat pump controller and the PCB Design. On average these subcomponents will take about 5-6 months to complete the research, design and completion phase. If all goes as planned these will be completed by the end of November. The final aspect of the project that will be discussed is the Web application. More importantly the components of the web application are the Main controller interfacing, the user interface and the data logging. Although this section is rather small, the completion of these tasks will not be quick due to the extensive level of coding and testing involved. The expected date of finishing is around the end of October if all goes as planned. A more detailed representation of the Milestone can be seen in Figure 8.1-1.

134
7.2 Finance Discussion After many discussions with the group it was perceived that this project would in fact be quite expensive. However, after researching for individual parts for the design of our MCU and RSM’s this price was slightly reduced. The budget the group felt made sense to be around $1500. The bulk of the project in reference to the budget will come with building all the parts associated with the Main controller and the radio frequency transceivers, the sensors as well as the processors. As seen in Tables 7.2-1 and 7.2-2 a rough draft of the parts the group will buy for the Main Control Unit and the Remote Sensing Modules.
Item Quantity Price (of each) Apprx. Total
Stellaris Cortex-M3 Processor 1 $10.00 $10.00
PulseJack J1026F21C RJ45 Jack w/magnetics 1 $8.19 $8.19
CC2500 2.4GHz RF Transceiver 1 $4.00 $4.00
Crystal(s) 3 $5.00 $15.00
Socket 5-pin 1 $2.00 $2.00
Silicon Triacs 14 $1.00 $14.00
Screw Terminals 3.5mm Pitch (4-Pin) 4 $1.00 $4.00
74HC595N Shift Register (TSOP-16) 2 $1.00 $2.00
LEDs 2 $1.00 $2.00
Passive Components (RCL) Alot Varies $100.00
2.4Ghz Monopole Antenna 1 $5.00 $5.00
Table 7.2-1 MCU Parts
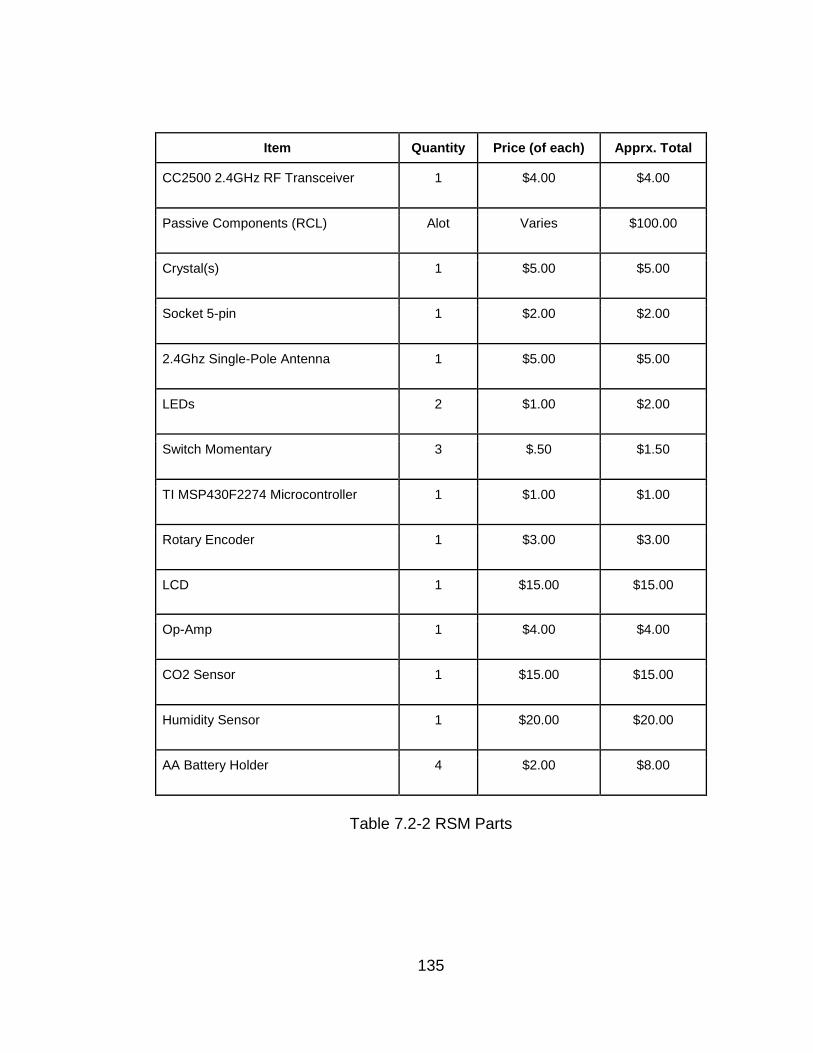
135
Item Quantity Price (of each) Apprx. Total
CC2500 2.4GHz RF Transceiver
1 $4.00 $4.00
Passive Components (RCL)
Alot Varies $100.00
Crystal(s)
1 $5.00 $5.00
Socket 5-pin
1 $2.00 $2.00
2.4Ghz Single-Pole Antenna
1 $5.00 $5.00
LEDs
2 $1.00 $2.00
Switch Momentary
3 $.50 $1.50
TI MSP430F2274 Microcontroller
1 $1.00 $1.00
Rotary Encoder
1 $3.00 $3.00
LCD 1 $15.00 $15.00
Op-Amp
1 $4.00 $4.00
CO2 Sensor
1 $15.00 $15.00
Humidity Sensor
1 $20.00 $20.00
AA Battery Holder
4 $2.00 $8.00
Table 7.2-2 RSM Parts

136
Section 8: Appendices
Appendix A: Copyright Permissions Dear Ms. Blair-DeLeon, My name is Ryan Kastovich, I am currently a student at the University of Central Florida and am currently working on my EE Degree. This email is regarding the usage of an IEE paper I came across the other day about MVC Frameworks. The title of the article is "Flexible Self-Management Using the Model-View-Controller Pattern." I am wondering if I would be given permission to cite some information from this article in my senior design research paper for my project. The Link to the article I am referring to is here: http://ieeexp|ore.ieee.org/stamp /stamp.jsp?tp=&arnumber=4497770 If you have any questions please let me know. Thank you, Ryan Kastovich Re: Permission to use Hi Ryan, You may absolutely use portions of IEEE articles for your paper. Just in sure that you cite in reference properly. If you need further assistance, please let me know. Kind regards, Nancy Sent from my iPhone Request to use Web2py Documentation] Resources Dear Mr. DiPierro, My name is Ryan Kastovich, I am currently a student at the University of Central Florida and am currently working on my EE Degree. This email is regarding the usage of your Web2py ebook. I am currently in Senior Design at UCF and am writing a paper about our project which is creating an HVAC system. My group and I will be implementing an MVC Framework to run our projects and am requesting permission to use your documentation (words and images) from the online version of "web2py Full Stack Web Framework, 4th Edition" (wvvw.web2py.com/book) for use in my report. If there's anything you need from me please let me know. Thank you, Ryan Kastovich

137
Re: Request to use Web2py Documentation] Resources Hello Ryan, The web2py book is not open source and is copyrighted. In fact I sell it both the PDF version and the printed version. Yet you can: — use any text and images from web2py.com[examp|es - use up to 10% of text from the book but not the entire book (but the source must be quoted) - use all the images and code examples from the book (but the source must be quoted) — if for internal use only, you can redistribute the book within the organization. (it must say for internal use only). Hope this is acceptable. massimo Python Material Usage for Senior Design Paper Dear AstroClub, My name is Ryan Kastovich, this email is regarding the usage of your tutorials you created for your Python lessons. I wasjust wondering if I could get permission to use your Python lessons plans in my essay I am writing for Senior Design . If there's anything you need from me please let me know. Thank you, Ryan Re: Python Material Usage for Senior Design Paper Hello, Permissions is granted with the condition that proper credit is given. Ryan My name is Ryan Kastovich and this email is regarding using the Django website information/ tutorials/ documentation for my personal use. I am writing a paper for my Senior Design class where I implement using a Web Framework like Django in my final project. Moreover, I was wondering if I would be able to get permission to use the documentation/ information on the Django website in my paper. If you have any questions please let me know. Thank You, Ryan Hi Ryan, Django's documentation is covered by the same license as Django itself (i.e., the BSD license) . This means that you are free to use the content for whatever purpose you wish, provided retain and distribute the original copyright notice (available in Django's source distribution) in whatever you publish, and don't use the name of Django or it's contributors to endorse or promote your own work. This is a slightly more strict version of the usual academic requirement to cite your sources. I would also note that depending on the details of your specific usage of Django's documentation, your request *may* fall under the copyright rules governing academic citation. This would mean you don't require permission from the Django project to use the text from Django's documentation or website —— you

138
just need to appropriately cite the content you are replicating, and stay within the limits placed on citation volume by copyright law. A good analog here would be a liberal arts paper on Joseph Heller's novel "Catch—22". You don't need Heller's permission to write a paper about his book, and in the context of your academic work, you're free to quote a few selected sentences or paragraphs. However, you can't copy entire pages or chapters, and you must make it clear in your paper that you're citing the work of another. For advice on academic citation requirements and limits, I suggest discussing your planned usage with your Professor. My name is Javier Arias and I'm a student at the University of Central Florida. I am writing to request permission to use portions of the I2C-bus Specification and User Manual from your website located on the following link: http://www.nxp.com/documents/user manual/UM10204.pdf. Portions of this document would be used for the purposes of documenting my Senior Design project in which my group will be leveraging the I2C-bus. If there is anything you might need from me, please do not hesitate to let me know. Thank you. J.A. Javier, You have our permission to do so. Rhonda Birch Marketing Manager, Interface Products My name is Genaro Moore and I am an electrical engineering currently enrolled at the University of Central Florida. The email is regarding the permission to use your information and figures from your website, httoiffyormr.hometech.comfkhfouestions.|:Il1o?ouestionid=53. I am writing a paper for my senior design project on controllers for multi-zone systems. Thank you for your time, Genaro Moore We would be happy to help! Please feel free to utilize any information from our site that suits your needs, and if you have any questions don't hesitate to ask. Zoning systems are ever evolving and I'm sure you could lend some valuable insight to us; If you would like to submit something about your research and views we would be glad to run it. Best of luck with your paper and your career! Patrick My name is Genaro Moore and I am an electrical engineering currently enrolled at the University of Central Florida. The email is regarding the permission to use

139
your information and figures from you website, http://www.hometech.com/kb/questions.php?questionid=53. I am writing a paper for my senior design project on HVAC controllers for multi-zone systems. Thank you for your time, Genaro Moore Thanks for asking. We give permission to use pictures and words from www.h0metech.oom for your senior design project only. These pictures and words are not to be published or indexed on the world wide web as this would lessen their value to us. If you want to publish your design project after it’s completed forward me a copy or link password and I'll look at it to decide if I can give permission for publication. I’m pretty lenient about those kinds of things, as long as large sections aren’t lifted verbatim. [Not a good plan for a design project anyway J] Good luck with the project. Jeff My name is Michael and I'm a senor engineering student at the University of Central Florida. I want to say thanks for posting information about your open-source sprinkler controller. It has been a great help in designing my own project. I'm currently in the middle of an embedded design project for class, in which I have used some of the ideas presented in your sprinkler project (such as shift register driven triacs). The main reason for this email is to ask for you permission to use some of your information in a paper regarding my project. Michael, Sure, as long as you provide a reference to my website, you can feel free to use the design and any content on my site. -Ray
Pending Dear Exadel, My name is Ryan Kastovich, I am currently a Senior at the University of Central Florida working on my bachelor's degree in Electrical Engineering. This email is regarding the usage of your documentation regarding the Struts framework. I was wondering if I could get permission to use this information provided I correctly cite your source in my Senior Design Report I am writing for my class. The information I am referring to is located on this webpage: http://exadel.com/tutorial/struts/5.2/guess/strutsintro.html

140
Thank for your time, Ryan Kastovich My name is Genaro Moore and I am an electrical engineering major enrolled at the University of Central Florida. This email is regarding the permission to use your words from this document, www.greenheck.com/media/articles/Product_guide/actuators.pdf. I am writing a paper for my senior design project on a HVAC controller for a multi-zoned system. Thank you for your time. My name is Genaro Moore and I am an electrical engineering currently enrolled at the University of Central Florida. The email is regarding the permission to use your information and figures from your website. I am writing a paper for my senior design project on HVAC controllers for multi-zone systems. Thank you for your time, Genaro Moore Mr. Karst, My name is Michael Trampler and I am a senior engineering student at the University Of Central Florida. I am currently in the middle of a project in which I would like to make use of Sensirion's SHT1X family of humidity/temperature sensors. To make use of these sensors our group needs to use the SHT1X's datasheet. The purpose of this email is to ask for the permission to use sections of Sensirion's datasheet in a paper which discuses the design aspect of our project. Thank you for your time, Michael Trampler Würth Elektronik, My name is Michael Trampler and I am a senior engineering student at the University Of Central Florida. I am currently in the middle of a project in which I would like to make use of Würth Elektronik's SMD antenna part number 7488910245. To make use of this antenna our group needs to use it's datasheet. The purpose of this email is to ask for the permission to use sections of Würth Elektronik's datasheet in a paper which discusses the design aspect of our project. Thank you for your time, Michael Trampler

141
Appendix B: Datasheets
● 263/268 Series General Purpose Relay datasheet by Deltrol Controls ● DAC081C081, DAC081C085 datasheet by TI ● DAC101C081, DAC101C085 datasheet by TI ● DAC121C081, DAC121C085 datasheet by TI ● MAC97 Series Sensitive gate Triacs by ON Semiconductor ● 74HC595 datasheet by NXP ● SIP-RC Series datasheet by XICON ● ZD Series Dampers datasheet by Honeywell ● ARD Series Dampers datasheet by Honeywell ● M847D1012 Damper Actuator installation guide by Honeywell ● MG811 datasheet by Hanwei Electronics ● SHT1x datasheet by Sensirion ● HCH-1000 series datasheet by Honeywell ● HIH-5030/5031 Series datasheet by Honeywell ● TMP275 datasheet by TI ● NHD‐ 0216K3Z‐ NSW‐ BBW datasheet by Newhaven Display ● NHD‐ C0216CiZ‐ FN‐ FBW‐ 3V datasheet by Newhaven Display ● Encoders/EVER/U/V/Y datasheet by Panasonic ● Encoders/EVEG/H/K/L datasheet by Panasonic ● MSP430F22X4 datasheet by TI ● Stellaris LM3S8962 datasheet by TI ● Stellaris LM3S8962 Evaluation Board user manual by TI ● CC430F613X datasheet by TI ● CC430F612X datasheet by TI ● CC430F513X datasheet by TI ● CC1101 RF Transceiver datasheet by TI ● CC2500 RF Transceiver datasheet by TI ● CC2520 RF Transceiver datasheet by TI ● BQ32000 Real Time Clock datasheet by TI ● PCF2123 Real Time Clock datasheet by NXP ● PCF8593 Real Time Clock datasheet by NXP ● LAN8710A/LAN8710Ai datasheet by SMSC ● CS8900A datasheet by Cirrus Logic

142
Appendix C: Extraneous Figures
Figure 8.1-1
143
Appendix D: Acronyms API - Application Programming Interface CO2 - Carbon Dioxide CSV - Comma-Separated Values DAL - Database Abstraction Layer DB - Database DHCP - Dynamic Host Configuration Protocol DNS - Domain Name Server DynDNS - Dynamic Domain Name Server eHVAC- Efficient Heating Ventilation and Air Conditioning GAE - Google App Engine GUI - Graphical User Interface HVAC - Heating Ventilation and Air Conditioning I2C - Inter-Integrated Circuit IC - Integrated Circuit IO - Input/ Output IP - Internet Protocol IPKG - Itsy Package Management System ISA - Industry Standard Architecture ISP - Internet Service Provider JTAG - Joint Test Action Group LAN - Local Area Network LWIP - Lightweight Internet Protocol MC - Main Controller MCU - Main Control Unit MHz - Megahertz MVC - Model, View and Controller NRE - Non-Recurring Engineering ORM - Object Relational Mapping OS - Operating System PCB - Printer Circuit Board PPM - Parts Per Million RAM - Random Access Memory RCL - Resistors, Capacitors and Inductors RDMS - Relational Database Management Systems RF - Radio Frequency RSM- Remote Sensing Module RTC - Real Time Clock SCL - Serial Clock Line SQL - Structured Query Language

144
SPI - Serial Peripheral Interface SSI - Server Side Includes TCPIP - Transfer Control Protocol over Internet Protocol UART - Universal Asynchronous Receiver/ Transmitter UCF - University of Central Florida UI - User Interface USB - Universal Serial Bus VOC - Volatile Organic Compound

145
Appendix E: Bibliography
1. "Django at a Glance." Django. N.p., n.d. Web. 21 Apr. 2012. <https://docs.djangoproject.com/en/1.4/intro/overview/>.
2. Curry, E, and P Grace. "Flexible Self-Management Using the Model-View-Controller Pattern." IEEXplore. N.p., June 2008. Web. 21 Apr. 2012.<http://ieeexplore.ieee.org/xpl/articleDetails.jsp?arnumber=4497770#>.
3. "web2py." Wikipedia, the free encyclopedia. N.p., 4 Apr. 2012. Web. 21 Apr. 2012. <http://en.wikipedia.org/wiki/Web2py>.
4. "Java (programming language)." Wikipedia, the free encyclopedia. N.p., 21 Apr. 2012. Web. 21 Apr.2012. <http://en.wikipedia.org/wiki/Java_%28programming_language%29>.
5. "Python (programming language)." Wikipedia, the free encyclopedia. N.p., 20 Apr. 2012. Web. 21 Apr.2012. <http://en.wikipedia.org/wiki/Python_%28programming_language%29>.
6. "C (programming language)." Wikipedia, the free encyclopedia. N.p., 17 Apr. 2012. Web. 21 Apr. 2012. <http://en.wikipedia.org/wiki/C_%28programming_language%29>.
7. "Struts Tutorial: Struts Framework Overview." Exadel. N.p., n.d. Web. 21 Apr. 2012.<http://exadel.com/tutorial/struts/5.2/guess/strutsintro.html>.
8. "The Python Tutorial--Pythonv 2.7.3." Python. N.p., 21 Apr. 2012. Web. 21 Apr. 2012.<http://docs.python.org/tutorial/index.html>.
9. "web2py Documentation and Resources." Web2py Web Framework. N.p., n.d. Web. 21 Apr. 2012.<http://web2py.com/>.
10. Pierro, Massimo Di. "Introduction." Introduction. Web2py Full Stack Web Framework. By Pierro. 4th ed. N. pag. N.p., n.d. Web. 21 Apr. 2012.
11. "PythonSeminar." Astronomy Society. N.p., n.d. Web. 21 Apr. 2012. <http://planets.ucf.edu/astroclub>.
12. "Comma-separated values." Wikipedia, the free encyclopedia. N.p., 21 Apr. 2012. Web. 21 Apr. 2012.<http://en.wikipedia.org/wiki/Comma-separated_values>.
13. "Common Format and MIME Type for Comma-Separated Values (CSV) Files." RFC 4180. N.p., n.d. Web. 21 Apr. 2012. <http://tools.ietf.org/html/rfc4180>.
14. "SQLite." Wikipedia, the free encyclopedia. N.p., 19 Apr. 2012. Web. 21 Apr. 2012. <http://en.wikipedia.org/wiki/SQLite>.
15. "SQLite Home Page." SQLite. N.p., n.d. Web. 21 Apr. 2012. <http://www.sqlite.org/docs.html>.
16. "MySQL." Wikipedia, the free encyclopedia. N.p., n.d. Web. 21 Apr. 2012. <http://en.wikipedia.org/wiki/MySQL>.
17. "MySQL Community Edition." MySQL Community Edition. N.p., n.d. Web. 21 Apr. 2012.<http://www.mysql.com/products/community/>.
18. "Apache HTTP Server Version 2.4 Documentation." Apache HTTP Server Version 2.4. N.p., n.d. Web. 21 Apr. 2012. <http://httpd.apache.org/docs/2.4/>.

146
19. "Cherokee Documentation." Cherokee Project . N.p., n.d. Web. 21 Apr. 2012. <http://www.cherokee-project.com/doc/basics.html>.
20. "Welcome to lighttpd." Wikistart. N.p., n.d. Web. 21 Apr. 2012. <http://redmine.lighttpd.net/projects/lighttpd/wiki>.
21. "lwIP - A Lightweight TCP/IP stack - Summary." Savannah. N.p., n.d. Web. 21 Apr. 2012.<http://savannah.nongnu.org/projects/lwip/>.
22. "lwIP - lightweight TCP/IP." lwIP Wiki. N.p., n.d. Web. 21 Apr. 2012. <http://lwip.wikia.com/wiki/LwIP_Wiki>.
23. "Cloud computing." Wikipedia, the free encyclopedia. N.p., 21 Apr. 2012. Web. 21 Apr. 2012.<http://en.wikipedia.org/wiki/Cloud_computing>.
24. "Platform as a service ." Wikipedia, the free encyclopedia. N.p., n.d. Web. 21 Apr. 2012.<http://en.wikipedia.org/wiki/Platform_as_a_service>.
25. "Google App Engine." Wikipedia, the free encyclopedia. N.p., n.d. Web. 21 Apr. 2012.<http://en.wikipedia.org/wiki/Google_App_Engine>.
26. "BigTable." Google Research Publication. N.p., n.d. Web. 21 Apr. 2012. <http://research.google.com/archive/bigtable.html>.
27. "Google Cloud SQL." Google Developers. N.p., n.d. Web. 21 Apr. 2012. <https://developers.google.com/cloud-sql/>.
28. "What is Google App Engine?" Google Developers. N.p., n.d. Web. 21 Apr. 2012. <https://developers.google.com/appengine/docs/whatisgoogleappengine>.
29. "Introduction - Google Cloud Storage ." Google Developers. N.p., n.d. Web. 21 Apr. 2012.<https://developers.google.com/storage/docs/getting-started>.
30. "The NIST Definition of Cloud Computing." NIST. N.p., n.d. Web. 21 Apr. 2012. <http://csrc.nist.gov/publications/nistpubs/800-145/SP800-145.pdf>.
31. "Crystal LAN® 10Base-T Embedded Ethernet Controller." Cirrus Logic. N.p., n.d. Web. 21 Apr. 2012.<http://www.cirrus.com/en/products/cs8900a.html>.
32. "Small Footprint, Low Power Consumption, Full-Featured 10/100 Ethernet Transceivers." SMSC. N.p.,n.d. Web. 21 Apr. 2012. <http://www.smsc.com/index.php?tid=149&pid=59>.
33. "Dynamic DNS." Wikipedia, the free encyclopedia. N.p., 20 Mar. 2012. Web. 21 Apr. 2012.<Wikipedia, the free encyclopedia>.
34. "Common Gateway Interface." Wikipedia, the free encyclopedia. N.p., n.d. Web. 21 Apr. 2012.<http://en.wikipedia.org/wiki/Common_Gateway_Interface>.
35. "The Common Gateway Interface (CGI) Version 1.1." RFC 3875. N.p., n.d. Web. 21 Apr. 2012.<http://tools.ietf.org/html/rfc3875>.
36. "Sitara ARM® Cortex™-A8 and ARM9® Microprocessors." Texas Instruments. N.p., n.d. Web. 21 Apr. 2012.<http://www.ti.com/lsds/ti/dsp/platform/sitara/ whats_new.page?DCMP=AM33x_Announcement&HQS=am335x>.

147
37. "Introduction - Google Cloud Storage." Google Developers. N.p., n.d. Web. 21 Apr. 2012.<https://developers.google.com/storage/docs/getting-started>.
38. "BeagleBone System Reference Manual." BeagleBone. N.p., n.d. Web. 21 Apr. 2012.<http://beagleboard.org/static/beaglebone/latest/Docs/Hardware/BONE_SRM.pdf>.
39. "Google App Engine SDK for Python." Google Developers. N.p., n.d. Web. 21 Apr.2012.<https://developers.google.com/appengine/downloads#Google_App_Engine_SDK_for_Python>.
40. "Google App Engine the Development Environment." Google Developers . N.p., n.d. Web. 21 Apr. 2012. <https://developers.google.com/appengine/docs/python/gettingstarted/dev environment>.
41. "Air Quality." EEOP. N.p., n.d. Web. 21 Apr. 2012. <http://www4.nau.edu/eeop/air_quality/>.
42. "HVAC Control Tutorial." HomeTech Solutions. N.p., n.d. Web. 21 Apr. 2012. <http://www.hometech.com/kb/questions.php?questionid=53>.
43. "Goodman 13 SEER Heat Pump Condensing Unit." High Performance HVAC. N.p., n.d. Web. 21 Apr. 2012.<http://heat-pumps.highperformancehvac.com/>.
44. "Heat pump controls demystified ." ZenHVAC. N.p., n.d. Web. 21 Apr. 2012. <http://zenhvac.com/its-technical/heating/21-heat-pump-controls-demystified>.
45. "Zoning Design and Application Guide." ZONEFIRST HVAC Zoning Systems. N.p., n.d. Web. 21 Apr. 2012.<http://www.zonefirst.com/products/DesignManual.pdf>.
46. Sugarman, Samuel. HVAC Fundamentals. Boca Raton: Fairmont Press, 2005. http://ucf.catalog.fcla.edu/cf.jsp?st=hvac+fundamentals&ix=kw&V=D&S=0991335034748578&I=0#top.Web. 21 Apr. 2012.
47. "An Introduction to Indoor Air Quality (IAQ)." EPA. N.p., n.d. Web. 21 Apr. 2012.<http://www.epa.gov/iaq/voc.html>.
48. "Volatile Organic Compounds in Your Home." MDH. N.p., n.d. Web. 21 Apr. 2012.<http://www.health.state.mn.us/divs/eh/indoorair/voc/>.
49. "Volatile Organic Compound." Wikipedia, the free encyclopedia. N.p., n.d. Web. 3 Apr.2012.<http://en.wikipedia.org/wiki/Volatile_organic_compound>.
50. "Zoning System Design Manual." Blue Phx. N.p., n.d. Web. 21 Apr. 2012. <http://blue-phx.com/pdf/Honeywell%20Zoning%20Design.pdf>.
51. "Actuators for Commercial HVACDampers." GreenHeck. N.p., n.d. Web. 21 Apr.2012. <http://www.greenheck.com/media/articles/Product_guide/actuators.pdf>.
148
52. "HVAC Zoning Bypass Damper – More than you ever wanted to know." ZoningNews. N.p., n.d. Web. 21 Apr.2012. <http://www.zoningnews.net/?p=41>.
53. Ray. "An Open-Source Web-Enabled Sprinkler Timer / Controller." OpenSprinkler. N.p., n.d. Web. 21 Apr. 2012. <http://rayshobby.net/blog/?page_id=160>.
54. "I2C-bus specification and user manual." NXP. N.p., n.d. Web. 21 Apr. 2012. <http://www.nxp.com/documents/user_manual/UM10204.pdf>.
55. "Multi Master." I2C Bus. N.p., n.d. Web. 21 Apr. 2012. <http://www.i2c-bus.org/MultiMaster/>.
56. "M68HC11 Reference Manual." Freescale Semiconductor. N.p., n.d. Web. 21 Apr. 2012. <http://www.freescale.com/files/microcontrollers/doc/ref_manual/M68HC11RM.pdf>.
57. "MICROCONTROLLER UART TUTORIAL." Society of Robots. N.p., n.d. Web. 21 Apr. 2012. <http://www.societyofrobots.com/microcontroller_uart.shtml>.
58. "Carbon Dioxide." United States Department of Labor. N.p., n.d. Web. 21 Apr. 2012. <http://www.osha.gov/dts/chemicalsampling/data/CH_225400.html>.
59. "Amstrong Manual." Institut Montefiore. N.p., n.d. Web. 21 Apr. 2012. <http://www.student.montefiore.ulg.ac.be/~merciadri/angstrom/files/angstrom-manual.pdf>.
60. "Welcome to OpenEmbedded." Opemebedded. N.p., n.d. Web. 21 Apr. 2012.<http://www.openembedded.org/wiki/Main_Page>.
61. "The Ångström Distribution." Introduction . N.p., n.d. Web. 21 Apr. 2012.<http://www.angstrom-distribution.org/>.
62. "Getting started with your new BeagleBone." BeagleBone. N.p., n.d. Web. 21 Apr. 2012. <http://beagleboard.org/static/beaglebone/latest/README.htm>.
63. "BeagleBoardUbuntu." elinux.org. N.p., n.d. Web. 21 Apr. 2012. <http://elinux.org/BeagleBoardUbuntu>.
64. "ARM ." Ubuntu Wiki. N.p., n.d. Web. 21 Apr. 2012. <https://wiki.ubuntu.com/ARM>.
65. "The research group." Wireless Sensor Networks Research Group. N.p., n.d. Web. 21 Apr. 2012.
66. <http://sensor-networks.org/index.php?language=english&page=the_group>.
67. "Wireless Connectivity." Texas Instruments. N.p., n.d. Web. 21 Apr. 2012. <http://www.ti.com/lit/sg/slab056/slab056.pdf>.
68. "CC2520 Datasheet." Texas Instruments. N.p., n.d. Web. 21 Apr. 2012. <http://www.ti.com/lit/ds/symlink/cc2520.pdf>.