Embed Size (px)
Citation preview
UNIVERSITI PUTRA MALAYSIA
CHANGES IN SKIN COLOUR AND OTHER RELATED QUALITY CHARACTERISTICS OF 'B10' CARAMBOLA
(AVERRHOA CARAMBOLA L.) AT DIFFERENT STAGES OF MATURITY
MUKHLIS IRSAN
FP 1998 8

CHANGES IN SKIN COLOUR AND OTHER RELATED QUALITY CHARACTERISTICS OF 'B10' CARAMBOLA
(Averrhoa carambola L.) AT DIFFERENT STAGES OF
MATURITY
MUKHLIS IRSAN
MASTER OF AGRICULTURAL SCIENCE
UNIVERSITI PUTRA MALAYSIA
1998

CHANGES IN SKIN COLOUR AND OTHER RELATED QUALITY CHARACTERISTICS OF 'BlO' CARAMBOLA (Averrhoa carambola L.) AT
DIFFERENT STAGES OF MATURITY
By MUKHLIS IRSAN
Thesis Submitted in Fulfilment of the Requirements for the Degree of Master of Agricultural Science in the Faculty of Agriculture
Universiti Putra Malaysia June 1 998

ACKNOWLEDGEMENTS
I wish to express my sincere gratitude and thanks to the Dean and entire staff
of the Faculty of Agriculture, Universiti Putra Malaysia, for providing facilities and
assistance during my graduate study. I would like to record my gratitude to the
National Council for Scientific Research and Development, Ministry of Science and
Technology, Malaysia for funding this research through the IRP A programme.
I extend my sincere gratitude to my chief supervisor, Dr. Siti Hajar Ahmad,
for her understanding, patience, guidance and supervision throughout the preparation
of this thesis. My deep appreciation and gratitude also go to Assoc. Prof Dr. Jinap
Selamat and Assoc. Prof Dr. Mawardi Rahmani, my co-supervisors, for their
guidance and suggestions.
My sincere gratitude is also expressed to all the Laboratory Assistants of the
Faculty of Agriculture and Faculty of Food Science and Biotechnology, especially
Puan Mahani Yahya for her assistance and friendship and to all my friends who have
helped me in many ways in conducting my research.
Last but not least, my sincere appreciation also goes to my dearest wife, sons,
brothers, sisters and parents for their understanding, patience and moral support
throughout my study.
II
T ABLE OF CONTENTS
Page
ACKNOWLEDGEMENTS . . . . . . . . . . . . . . . . . . . . . . . . . . . . . . . . . . . . . . . . . . . .. . . . . . . . . . . . . . . . II
LIST OF TABLES . . .... . . .. . ..... .. . . . . . . ... . . .. . . ... . . . . . . . .. . . . . . . . . . . . . . . . . .. . . . . . . . . . . v
LIST OF FIGURES . . . . . . . . . . . . . . . . . . . . . . .. . . . . . . . . . . . . . . . . . . . . . . . . . . . . . . . . . . . . . . . . . . . . . . . . VI
ABSTRACT . . . . . . . . . . . . . . . . . . . . . . . . . . .. . . . . . . . . . . . . . . . . . . . . . . .. . . . . . . . . . . .. . .. . . . . . . . . . . . . . . . . VB
ABSTRAK . . . . . . . . . . . . . . . . . . . . . . . . . . . . . . . . . . . . . . . . . . . . . . . . . . . . . . . . . . . . . . . . . . . . . . . . . . . . . . . . . . . . . x
CHAPTER
I
II
III
INTRODUCTION 1
LITERATURE REVIEW . . . . . .. . . . . . . . .. . . . . . . . .. . . . . . . . .. . . . . . .. . . . . . . . . . . 6
Carambola . . . .. . . . . . . . . . . . . . . . . . . . . . . . . . . . . . . . . . . . . . . . . . . . . . . . . . . . . . . . . . . . . . . . .. . . . . 6 Fruit Colour . . . . . . . . . . . . .. . . . . . . . . . . . . . . . . . . . . . .. . . . . . . . . . . . . . . . . . . . . . . . . . . . . . . . . . . . 8
Visual Evaluation of Colour . . . . . . . . . . . . . . . . . . . . .. . . . . . . . . . . . . . . . . . . . ... 11 Colour-measuring Instrument . . . . . . . . . . . . . . ... . . . . . . . . .. . . . . . . . . . . . . . . . 12 Pigment Determination . . . . . . . .. .... ..... ..... .. . .. . . .... ... . . ..... .. . . ... . 1 7
Fruit Maturity . . ........ ....... ........ ...... ........................ ....... ....... 20-Texture . .. . . . . . . . . . . . . . . . . . . . . . . . . . . . . . . . . . . . . . . . . . . . . . . . . . . . . . . . . . . . . . . . . . . . .. . . . 21 Organic Acids . ........ . .. . .... . .. ... . .... . ... ... . . . .. . . ............. . . . .... . . . 23 Sugar . . . . . . .. . . . . . . . . . . . . . . . .. . . . . . . . . . . . . . . . ... . . . . . . . . . . . . . . . .. . . . . . . . . . . . . . . . . . . 25
Fruit Quality . . . . . . . . . . . . . . . . . . . . . . . . . . . . . . . . . . . . . . . . . . . . . . . . ................ ........ 26 Visual Appearance: Size, Colour and Defects . . . . . . . . . . . . . . . . . . 28 Flavour . . . . . . . . . . . . . . . . . .. . . . . . . . . . . . . . . . . . . . . . . . . .. . . . . .. . . . . . . . . . . . .. . . . . . . . . . . . 29
Respiration Rate and Ethylene Production . . . . . . . . . . . . . . . . . . . . . . . . . . 30
MATERIALS AND METHODS . .. . . . . . . .. ... ... .. . . . . . . . . . . .. . .. . . . . . . .
Experiment I . Determination of Skin Colour, Chlorophyll and Carotenoid Contents of 'B 1 0' Carambola at Different Stages
33
of Maturity . . . . . . . . . . . . . . . . . . . . . . . . . . . . . . . . . . . . . . . . . . . . . . . . . . . . . . . . . . . . . . . . . . . . . . . . . . 33 Experimental Design . . . . . . . . . . . . . . . . . . . . . . . . . . . , . ... . ............ .. . ... . ... 33 Skin Colour Determination . . . . . . . . . . . . . . . . . . . . . . . . . . . . . . . . . . . . . . . . . . . . . . 34 Chlorophyll Determination . . . . . . . . . . . . .. . . . . . . . . . . . . . . . . . . . . . . . . . . . . . . . . 35 Carotenoid Determination . . . . . . . . . . . . . . . . . . . . . . . . . . . . . .. . . . . . . . . . . . . . . . . 36
III

IV
V
Page
Experiment II. Determination of Quality Characteristics of 'B I O' Carambola at Nine Colour Indices (Maturity Stages) 36
Experimental Design . . . . . . . . . ... . .... . . . . . . . .... .. . .... .. . . . .. . . . . . .. . . ... . 37 Firmness Determination . . . . . . . . .. . . . . . . . . . . . . . . . . . . . . . . . . . . . . . .. . . . . . . . . . . . . 38 SSC Determination . . . . . . . . . . . . . . . . . . . . . . . . . . . . . . . . . . . . . . . . . . . . . . . . . . . . . . . . . . . 38 Ascorbic Acid (Vitamin C) Determination . . . . . . . . . . . . .. . . . .. . . . . 39 Sugar Determination . . . . . .. . . . . . . . . . . . . . . . . . . . . . . . . . . . . . . . . . . . . . . . . . . . . . . . . 39 Organic Acid Determination . . . . . . . . . . . . . . . . . . . . . . . . . . . . . . . . . . . . . . . . . . . . 40 Respiration Rate and Ethlyene Determination . . . . . . . . . . . . . . .. . . 41
RESULTS AND DISCUSSION . . .... . . . . .. . . . . . . . . . . . . . . . ... . . . . . . . . . . .
Experiment I . Changes in Skin Colour of 'B I O' Carambola at
43
Different Stages of Maturity . . . . . . . . . . . . . . . . . . . . . . . . . . . . . . . . . . . . . . . . .. . . . . . . 43 Skin Colour . . . . . . . . . . . . . . . . . . . . . . . .. . . . . . .. .. . . . . . . . . . . . . . . . . . . . . . . . . . . . . . . . . . . . 43 Pigments . . . . . . . . . . . . . . . . . . . . . . . . . . . . . . . . . . . .. . . . . . . . . . . . . . . . . . . . . . . . . . . . . . . . . . . . . 57
Chlorophyll . . . . . . . . . . . . . . . . . . . . . . . . . . . . . . . . . . . . . . . . . . . . . . . . . .. . . . . . . . . . . . . . . . 57 Carotenoid . . . . . .............. ........................... ..................... 60
Experiment II . Changes in Quality Characteristics of ' B 10' Carambola at Nine Colour Indices (Maturity Stages) . . . . . . . . . . . 62
Flesh Firmness . . . . . . . . . . . . . . . . . . . . . . . . . . . . . . . . . . . . . . . . . .. . . . . . . .. . . ........... 62 Soluble Solids Concentration . . . . . . . . . . . .. . . . . . . . . .. . . . . . . . . . . . . . . . . . . . . 65 Sugar . . . . . . . . . . . . . . . . . . . . . .. . . . . . . . . . . . . . . . . . . . . . . . . . . . . . . . . . . . . . . . . . .. . . . . . . . . . . .. 66 Organic Acids . . . . . . . , ............ , ............ , .. . ... . .... .. . . . . ........ . ... .. 7 1 Ascorbic Acid . . . . . . . . . . .. . . . . . . . . . . . . . . . . . . . . . . . . . . . . . . . . . . . . . . . . . . . . . . . .. . . . . 76 Respiration Rate and Ethylene Production . . . . . . . . . . . . . . . . . . . . . . . 78
CONCLUSION .. . . . . . . . . . . . . . . . . . . . . , . . . . . . . . . . .. . . . . . . . . , . . . . . . . . . . . . . . . . . . . ' " 85
REFERENCES . . . . . . . . . . . . . . . . . . .. .. . . . . . . . . . .. . . . . . . . . . . . . . . . . . . . . . . . . . . . . . . . . . . . . . . . . . . . . . 88
VITA . . . . . . . . . . . . . . . . . . . . . . . . . . . . . . . . . . . . . . . . . . . . . . . . . . . . . . . . . . . . . . . . . . . . . . . . . . . . . . . . . . . . . . . . . . . . . 99
tv

LIST OF TABLES
Table Page
1 Changes in Skin Colour as Indicated by L*, a*, b*, C*, a*lb* and hO Values of'BIO' Carambola at Different Maturity Stages 44
2 Correlation Coefficients (r) among L*, a*, b*, a*Ib*, C* and hO and Pigment Content of 'B I 0' Carambola 47
3 Changes in Pigment Content of'BlO' Carambola at Different Stages of Maturity 58
4 Changes in Flesh Firmness, Soluble Solids Concentration (SSC) and Sugar Content of 'B] 0' Carambola at Nine Colour Indices 63
5 Correlation Coefficients (r) among Quality Characteristics of 'BIO' Carambola 70
6 Changes in Organic Acid and Ascorbic Acid Contents of 'B 1 0' Carambola at Nine Colour Indices 72
v

LIST OF FIGURES
Figure Page
1 Three-dimensional Colour Space Representing Colour Graphically 14
2 Relationship between L*, a*, b*, a*lb* Values and Maturity Stage (days after fruit-set) of'BlO' Carambola 45
3 Relationship between C* and hO Values and Maturity Stage (days after fiuit-set) of'BlO' Carambola 54
4 Relationship between Chlorophyll, Carotenoid Pigments and Maturity Stage of 'B 10' Carambola (days after fruit -set) 59
5 Relationship between Flesh Firmness and Colour Index of 'B1O' Carambola 64
6 Relationship between Soluble Solids Concentration (SSC), Total Sugar, Fructose, Glucose, Sucrose and Colour Index of 'B1O' Carambola 67
7 Relationship between Organic Acids (Oxalic, Citric and Malic), Ascorbic Acid and Colour Index of 'B 10' Carambola 74
8 Changes in Respiration Rate (C02 production) of 'B 1 0' Carambola at Various Stages of Maturity (Colour Index 2,5 and 8) when Stored at 25°C 79
9 Changes in Ethylene (C2H4) Production of'B1O' Carambola at Various Stages of Maturity (Colour Index 2,5 and 8) when Stored at 25°C 81
VI

Abstract of the Thesis Submitted to the Senat of the Universiti Putra Malaysia in Fulfilment of the Requirements of the Degree of Master of Agricultural Science
CHANGES IN SKIN COLOUR AND OTHER RELATED QUALITY CHARACTERISTICS OF 'BI0' CARAMBOLA (Averrhoa carambola L.) AT
DIFFERENT STAGES OF MATURITY
By MUKHLIS IRSAN
June ]998
Chairman: Siti Hajar Ahmad, Ph.D
Faculty : Agriculture
A study was conducted on changes in skin colour and other related quality
characteristics of 'BI0' carambola (Averrhoa carambola L.) at different stages of
maturity. In Experiment I the carambola were harvested at different stages of
maturity beginning from 57 to 93 days after fruit-set with three day intervals between
each harvest. Skin colour (L*, a*, b*, C* and hO values), chlorophyll and carotenoid
contents of the fruit were determined at each stage of maturity. In Experiment II
other related quality characteristics such as flesh firmness, soluble solids
concentration, sugar (sucrose, fructose, and glucose), ascorbic acid and organic acid
(malic, citric and oxalic) contents at nine colour indices (as had been categorised in
Experiment I) were also determined. Respiration rate and ethylene production of
carambola were determined to study the climacteric nature of the fruit. Each of the
experiment was conducted using a completely randomised design and the data
obtained were analysed using analysis of variance and Duncan Multiple Range Test.
Vll

Simple regression model was used to determine relationship between maturity stages
and skin colour (Experiment I) and relationship between colour indices and other
related quality characteristics (Experiment IT). Correlations among parameters in each
experiment were obtained by means of Pearson's correlation matrix.
In Experiment I, a linear increase in a* and b* values indicated that skin colour
of carambola had significantly lost its greenness and was turning yellow as fruit
maturity increased. The linear decrease in hO and linear increase in a*/b* values
indicated that carambola skin colour had changed from green to yellow and yellowish
orange. L * value increased linearly with increasing maturity, indicating that fruit skin
colour became lighter as maturity increased. C* showed a linear increase as fruit
matured, indicating that skin colour of the fruit had become intense yellow and
yellowish orange. The hO was the most accurate colour measurement predicted by
maturity stages giving the highest coefficient of determination (r= -0.95) compared
to other parameters. As such, the maturity stages of carambola were categorised into
nine colour indices based on hO value. The results showed that carotenoid pigment
was present even before chlorophyll was degraded and it continued to increase with
increasing fruit maturity. However, total chlorophyll pigment decreased with
increasing fruit maturity. Chlorophyll and carotenoid pigment contents were
significantly correlated with each of the parameters used to measure skin colour,
indicating that chlorophyll and carotenoid pigments contributed to the skin colour
changes of the carambola.
V11l
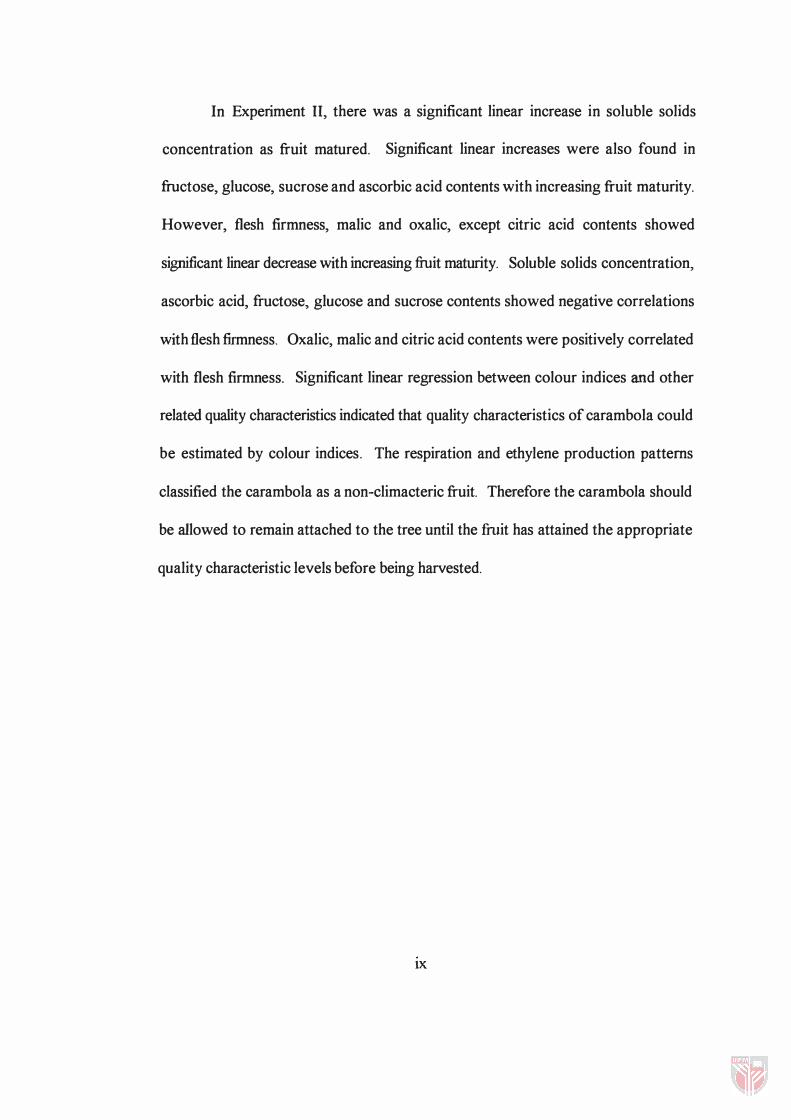
In Experiment II, there was a significant linear increase in soluble solids
concentration as fruit matured. Significant linear increases were also found in
fructose, glucose, sucrose and ascorbic acid contents with increasing fruit maturity.
However, flesh firmness, malic and oxalic, except citric acid contents showed
significant linear decrease with increasing fiuit maturity. Soluble solids concentration,
ascorbic acid, fructose, glucose and sucrose contents showed negative correlations
with flesh firmness. Oxalic, malic and citric acid contents were positively correlated
with flesh firmness. Significant linear regression between colour indices and other
related quality characteristics indicated that quality characteristics of carambola could
be estimated by colour indices. The respiration and ethylene production patterns
classified the carambola as a non-climacteric fruit. Therefore the carambola should
be allowed to remain attached to the tree until the fruit has attained the appropriate
quality characteristic levels before being harvested.
lX

Abstrak Tesis Yang Dikemukakan Kepada Senat Universiti Putra Malaysia Sebagai Memenuhi Syarat Untuk Ijazah Master Sains Pertanian.
PERUBAHAN W ARNA BUAH BELIMBING 'B 10' (Averrhoa carambola L.) DAN CIRI-CIRI KUALITI YANG BERKAITAN PADA PELBAGAI
PERINGKAT KEMAT ANGAN
Oleh MUKHLIS IRSAN
June 1998
Pengerusi: Siti Hajar Ahmad, Ph.D
Fakulti : Pertanian
Kajian telah dijalankan ke atas perubahan warna buah belimbing 'BIO'
(Averrhoa carambola L.) dan ciri-ciri kualiti yang berkaitan pada pelbagai peringkat
kematangan. Pada kajian I, buah belimbing dituai dengan selang masa 3 hari pada
pelbagai peringkat kematangan mulai daripada 5 7 sehingga 93 hari setelah berputik.
Perubahan warna (nilai L *,a*,b*,C* dan hO), kandungan pigmen karotin dan klorofiI
buah belimbing ditentukan pada setiap selang masa tersebut. Pada kajian II, ciri-ciri
kualiti seperti kekerasan buah, jumIah pepejaI terlarut, kandungan gula (fruktosa,
gJukosa dan fiuctosa), asid askOIbik, asid-asid organik (oskalik, sitrik dan malik) pada
kesembilan indek warna yang telah diperolehi daripada kajian I telah ditentukan.
Kadar respirasi dan pengeluaran etilena juga ditentukan untuk mengkaji jenis respirasi
buah belimbing. Setiap kajian dijalankan menggunakan rekabentuk rawak Iengkap
dan data yang diperolehi dianalisis menggunakan kaedah analisis varian dan Duncan
x
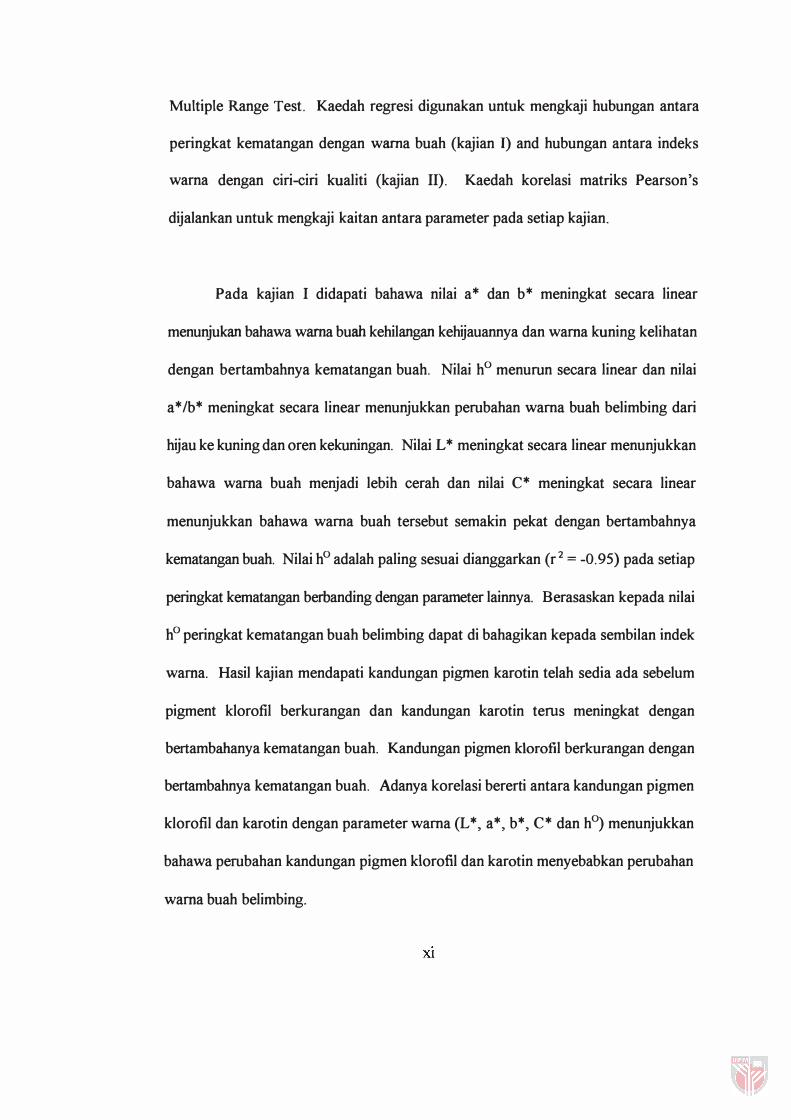
Multiple Range Test. Kaedah regresi digunakan untuk mengkaji hubungan antara
peringkat kematangan dengan warna buah (kajian J) and hubungan antara indeks
warna dengan ciri-ciri kualiti (kajian II). Kaedah korelasi matriks Pearson's
dijalankan untuk mengkaji kaitan antara parameter pada setiap kajian.
Pada kajian I didapati bahawa nilai a* dan b* meningkat secara linear
menunjukan bahawa wama buah kehilangan kehijauannya dan wama kuning kelihatan
dengan bertambahnya kematangan buah. Nilai hO menurun secara linear dan nilai
a * /b* meningkat secara linear menunjukkan perubahan warna buah belimbing dari
hijau ke kuning dan oren kekuningan. Nilai L * meningkat secara linear menunjukkan
bahawa wama buah menjadi lebih cerah dan nilai C* meningkat secara linear
menunjukkan bahawa warna buah tersebut semakin pekat dengan bertambahnya
kematangan buah. Nilai hO adalah paling sesuai dianggarkan (r2 = -0.95) pada setiap
peringkat kematangan berbanding dengan parameter lainnya. Berasaskan kepada nilai
hO peringkat kematangan buah belimbing dapat di bahagikan kepada sembilan indek
wama. Hasil kajian mendapati kandungan pigmen karotin telah sedia ada sebelum
pigment klorofil berkurangan dan kandungan karotin terus meningkat dengan
bertambahanya kematangan buah. Kandungan pigmen klorofil berkurangan dengan
bertambahnya kematangan buah. Adanya korelasi bererti antara kandungan pigmen
klorofil dan karotin dengan parameter warna (L*, a*, b*, C* dan hO) menunjukkan
bahawa perubahan kandungan pigmen klorofil dan karotin menyebabkan perubahan
wama buah belimbing.
Xl

Pada kajian II, kandungan jumlah pepejal terlarut meningkat secara linear
dengan bertambahnya kematangan buah. Peningkatan secara linear juga didapati pada
kandungan fruktosa, gluckosa, sukrosa dan asid askorbik dengan bertambahnya
kematangan buah. Tetapi kekerasan buah, kandungan asid malik dan oksalik
menunjukkan penurunan secara linear dengan bertambahnya kematangan buah. Asid
sitrik tidak menunjukkan peningkatan secara linear dengan bertambahnya kematangan
buah. Kandungan jumlah pepejal terlarut, fruktosa, glukosa, fructosa dan asid
askorbik berkorelasi negatif dengan kekerasan buah. Manakala asid oksalik dan malik
berkorelasi positif dengan kekerasan buah. Kandungan pepejal terlarut berkorelasi
positif dengan kandungan fruktosa, glukosa, fruktosa dan asid askorbik dan
berkorelasi negatif dengan asid oksalik, sitrik dan malik. Persamaan regresi linear yang
bererti antara indeks warna dengan ciri-ciri kualiti kecuali asid sitrik menunjukkan
bahawa ciri-ciri kualiti buah belimbing 'BlO' dapat dianggarkan menggunakan indeks
wama. Kadar respirasi dan pengeluaran etilena menunjukan bahawa buah belimbing
'B 1 0' adalah buah bukan klimakterik. Oleh yang demikian buah belimbing harus
dibiarkan di pokok sehingga mencapai kualiti yang sesuai sebelum dituai.
xu

CHAPTER I
INTRODUCTION
Carambola (Averrhoa carambola L.) is also called the starfruit or star apple
because it has five longitudinal ribs (Watson et al., 1988). The fruit is oblong in shape
with thin, smooth and glossy skin and a sweet-watery pulp, tasting like a cross
between an apricot and a passion fruit (Macomboy, 1982). The fruit matures after
60-70 days of development, producing fruit that weigh between 80 and more than
200g (Campbell et ai., 1989) and varying in size between 80-250 mm in length, and
50-100 mm in width (Watson et ai., 1988). Fruit colour varies from green to
yellowish orange depending on the cultivar and stage of maturity.
Carambola is one of the most important fruits for export. The total export of
carambola has not increased since 1990. Total export was 11 metric tons in 1990
compared to 8.9 metric tons in 1995. Although total export has not increased, the
value of carambola exports has increased from RM22.5 million in 1990 to RM23.60
million in 1995. The percentage of carambola exported (12%) was even lower
compared to overall total of fruits exported (Jabatan Perangkaan Malaysia, 1995).
Improving and optimizing the quality of carambola would increase demand by
overseas markets.
1

2
Grade standards offiuit tend to be based on attributes that can be detennined
visually such as colour, shape, form, sizes and absence of defects. Visual grading
operations use these attributes to determine acceptance or rejection of fruit for
shipment to export markets (Shewfelt, 1993). The quality specifications of carambola
for export are determined according to condition, cleanliness, shape and form,
presence of blemishes, discoloration, damage and size offruit (SIRIM, 1993). Skin
colour, which indicates the stage of maturity of carambola, is also an important
grading criterion in determining its export destination. Presently, skin colour is
assessed visually by matching the fruit with a colour chart produced by the Federal
Agricultural Marketing Authority (F AMA). The chart contains six colour indices
representing six maturity stages (index 1= deep green, 2= light green, 3= green
yellow, 4= yellow green, 5= yellow and 6= orange). Fruit of index 2 and 3 are usually
exported to the European countries while �it of index 4 and 5 are exported to Hong
Kong and Singapore.
The main problem associated with the F AMA colour chart is inaccuracy in the
grading system. The six colour indices of the chart do not cover the spectrum of
colours that occur at the different maturity stages. Thus, determining the skin colour
of a particular fiuit that falls in between the indices by personal judgement becomes
a difficult task during grading, resulting in a high frequency of misgrading. F AMA's
six colour indices were developed by visual observation and without reference to the
international colour standards such as that of the Royal Horticultural Society (RHS)
3
Munsell colour chart. Grading of fiuit by personal judgement and without the use of
any other colour measuring instruments is often flawed. Personal judgement
perceived through visual images is relative from one individual to another (Judd and
Wyszecky, 1975) . A person's visual accuracy varies according to age, sex and light
intensity (Bollen et aI., 1993) .
Colour-measuring instruments make it possible to determine skin colour
accurately. Instruments such as the colorimeter and spectrophotometer have
objective notations of colour coordinates which represent lightness, chromaticity and
hue. These coordinates are used by botanists, biologists and horticulturists in the
United States of America and European countries to develop colour charts based on
the international colour standards, and are also widely used in evaluating or describing
colour (McGuire, 1992; Voss, 1992) . The coordinates obtained can be used to
differentiate the skin colour changes that occur in carambola at different stages of
maturity. The use of such colour measurement can avoid the effects of differences in
colour perception among human observers, thus reducing human error in colour
evaluation and ensuring uniformity and accuracy in colour grading.
The changes in fiuit colour during ripening are the result of the loss of green
colour due to the destruction of chlorophyll pigments and the presence of yellow or
orange colour due to carotenoid pigments. According to Gross (1987) there are
three general patterns of carotenoid development during ripening. In the first pattern

4
the presence of yellow or orange colour is due to the degradation of chlorophyll and
unmasking of the previous carotenoid pigments. Secondly, the loss of chlorophyll is
followed by the synthesis of one or more carotenoid pigments and thirdly is the
chlorophyll degradation followed by a decrease in carotenoid pigments. In carambola
only two ripening stages have been studied, i.e., less ripe and ripe fruit whereby an
increase of total carotenoids was observed (Gross et al., 1983). However, the pattern
was still vague.
In addition to skin colour, changes in flesh firmness, ascorbic acid, sugar and
organic acid contents, respiration rate and ethylene production at different stages of
fruit maturity are important in determining quality attributes. Grade standards in the
United State of America and European countries use colour and other attributes in
determining their grade specifications for fresh fruits and vegetables (Kader et aI.,
1992). The related attributes help the consumers and producers to determine quality
efficiently and quickly. However, the Malaysian Standard Specifications for Fresh
Carambola (SIRIM, 1993) lacks information on such attributes. Fruits that are
harvested at the early green stage usually have a firm texture but are poor in taste
when ripe, whereas fruit harvested at a late stage with yellowish orange colour
normally have better taste, but a shorter storage life (Rahman et aI. , 1992). To
improve and optimise produce quality of Malaysian carambola, changes in the quality
characteristics at different stages of maturity and their relationship with colour
changes need to be studied. This information, once made available, could be used for
5
better specifications for carambola and would make the Malaysian carambola more
competitive in the export markets.
Therefore, the objectives of this experiment were to determine (a) the skin
colour changes at different stages of maturity objectively, using a colour-measuring
instrument, (b) the pigments that contribute to the skin colour and (c) changes in the
quality characteristics at different stages of maturity and establish their relationships
to skin colour.

CHAPTER II
LITERA TURE REVIEW
Carambola
Averrhoa carambola L., which is native to Southeast Asia, belongs to the
Oxalidaceae family under the order of Geraniles and the class of Dicotyledoneae in
the subdivision Angiospermae of the division Spermatophyta (Hsuan, 1978). It can
now be found in many parts of the globe in both large and small plantations. It is
grown in Taiwan (Green, 1987), Australia (Watson et al., 1988), Florida, USA
(Campbell et al. , 1989; Campbell and Koch, 1987), Brazil (Donadio, 1989), Guyana
(Ramsammy, 1989), Trinidad and Canary Islands (Galan-Sauco et al., 1989;
Hernandez-Dolgado and Galan-Sauco, 1996), Tobago (Andrew, 1989) and Surinam
(Lewis and Groeizam, 1989).
Several cultivars are grown; Arkin and Golden Star are the predominant
cultivars in Florida, USA and Australia (Campbell et aL, 1989; Campbell and Koch,
1987; Watson et al. , 1988), Fwang Tung cultivar is commercially planted in Taiwan
(Green, 1987) and Newcomb cultivar is grown in Trinidad and Canary islands (Galan
Sauco et al. , 1989; Hemandez-Dolgado and Galan-Sauco, 1996). In Malaysia,
6

7
seventeen cultivars of carambola have been registered (Jabatan Pertanian Malaysia,
1989). Three of these cultivars, 'B2', 'BIO' and 'BIT, are widely planted because
of their commercial value (Rahman et al., 1992). The fruit of 'B2' is elliptical in
shape and does not have a sour taste even in the immature stage. Fruit colour changes
from whitish green to whitish yellow when the fruit is ripe. The fruit is about 8 - 15
cm in length, and about 200 - 250 g in weight. The flesh is juicy and has a very fine
texture with soluble solids concentration (SSe) of 7 - 8%. This cultivar is normally
used as a pollinator to the B 1 0 cultivar. The B 1 0 cultivar is about 15 - 21 cm in
length and 150 - 300 g in weight. The immature fruit is green in colour and has an
astringent taste. Ripe fruit is golden orange in colour and has a sweet and juicy taste
(SSe of 8 - 10%). 'BIT is sweeter than 'BIO' (SSe of 12 - 18%). 'BIT is
distinguished from other cultivars by its elongated shape and broad winged bottom.
The skin surface is freckled when the fruit is ripe (Rahman et al., 1992).
Among the tropical fruits, carambola is one of the richest in vitamins A, B 1,
B3 and C which are essential in the human diet (Giri et al., 1980). It is also claimed
to have medicinal values for people with heart problems or high blood pressure
(padmawinata, 1980). The star-shape of carambola makes it popular in the European
countries where it is mixed in fruit salad. It can be eaten fresh as a dessert or
processed into juice, jam or preserves (Rahman et al., 1992).

8
Fruit Colour
Fruit colours are due to the chlorophylls, carotenoids and anthocyanin
pigments that are present in the pulp and/or skin offiuits. The chlorophylls are green
pigments that strongly absorb the red and blue regions of the visible spectrum. The
small differences in the structures of chlorophyll a and chlorophyll b cause differences
in the absorbtion spectra, thus producing the different green hues of the two pigments,
blue-green for chlorophyll a (430 and 662 nm) and yellow-green for chlorophyll b
(455 and 664 nm) ( Gross, 1 987). The carotenoids absorb mainly the blue region
(430 - 470 nm), but they also absorb the blue-green (470 - 500 nm) and green (500 -
530) region of the spectrum and their colour is determined by the light they reflect.
The hue colours they reflect increase from yellow (neurosprene) to orange and red
(lycopene) (Goodwin, 1 982). The anthocyanins, which appear strongly in the acid
medium, have two absorption maxima, a visible region between 465 - 550 nm and an
ultraviolet region of270 - 280 nm (Gross, 1 987).
For most fruits, the first visible sign of ripening is the loss of greenness.
Unripe fruits contain large amounts of chlorophyll at the beginning of their
development. As the fruits ripen, the chlorophylls are degraded, resulting in the loss
of the green colour of the fruits. Simpson et al. ( 1976) reported that degradation of
chlorophylls proceeds via the pheophytins or via the chlorophyllins, pheophorbides
leading to tetrapyrrolic chlorins, which are eventually oxidised in light to colourless
9
compounds. A more recently proposed model for chlorophyll degradation involves
chlorophyll a-I as an intermediate in addition to the cyclic tetrapyrrolic derivatives,
namely chlorophyllins, pheophytins and pheophorbides. These derivatives are
transformed successively into linear tetrapyrroles and dipyrroles, then into
corresponding monopyrroles and linear, nitrogen-containing components and
eventually into colourless simple molecules such as CO2 and NH 3 (Hendry and
Stobart, 1 986). Degradation of chlorophylls during ripening has been related to the
increasing activity of chlorophyllase and magnesium dechelatase enzymes (Schoch and
Brown, 1987). In most fruits, the loss of chlorophylls is accompanied by the
unmasking or the biosynthesis of carotenoid pigments.
Carotenoids, which are normally constituents of the photosynthetic tissue, are
present in green fruit tissue prior to maturation. The first pattern of carotenoid
biosynthesis takes place in the chloroplast and is an integral part of their development.
It is closely linked to the biosynthesis of chloroplast components but masked by the
presence of chlorophylls. During ripening the green colour turns to yellow as
chlorophylls gradually degrade, unmasking the colour of previously available
carotenoid pigments. The second pattern of carotenoid formations is indicated by the
accumulation oflarge amounts of carotenoids. During ripening carotenogenic fruits
gradually tum to yellow, orange or red as chlorophylls degrade and carotenogenesis
takes over. This process is known as chloroplast-chromoplast transformation and is
correlated with the conversion of chloroplast carotenoids in green fruits into

10
chromoplast carotenoids by the presence of plant growth substances such as ethylene,
gibberellins, abscisic acid and cytokinins. Ethylene accelerates the degradation of
chlrophyll, as well as the biosynthesis of carotenoid. Gibberellins and abscisic acid
reduce production of ethylene while cytokinins enhance the ability of auxin to induce
ethylene production. The chromoplasts are characterised by their rapid and
biosynthetic ability as reflected in the appearance of multiple carotenoids in different
types (Goldschmidt, 1986). The first pattern occurs in degreening of lemon (Gross,
1987) and banana (Medlicott et al., 1992) and the second pattern occurs in tomato,
Golden Delicious apples (Gross, 1992) and mangoes (Medlicott et al., 1992). In
fruits such as the sweet cherry (Gross, 1982a), red currant and strawberry (Gross,
1982b) in which the final colour is imparted by anthocyanins, the total carotenoid
contents decrease continuously, paralleling the decrease in chlorophylls.
In the carambola fruit (Gross et aI., 1983) only two ripening stages were
studied and an increase in total carotenoid level was observed. The total carotenoid
content was 22 J-lg/g (fresh wt.). The carotenoid pattern of carambola mainly consists
of phytofluene (17%), (-carotene (25%), P-cryptoflavin (34%) and muthatoxanthin
(14%). p-carotene, p-apo-8-carotenal, criptoxanthin, cryptochrome and lutein are
present in small amounts.

1 1
Visual Evaluation of Colour
Visual colour evaluation is done by matching the fruits with standardized
colour charts such as the Royal Horticultural Society (RHS) or Munsell Colour charts
(Voss, 1 992) and more commonly by using numerical scales based on visual
observation of the colour changes of the fruit. It is a widely used and accepted
technique of determining quality and maturity stages of fruits, but it has many
setbacks. Visual colour evaluation is sUbjected to variability by personal judgement.
Personal judgement of visual images varies according to age, sex and light intensity.
Visual acuity decreases with age, whereby a 60-year-old worker requires about twice
brightness level than a 20-year-old worker (Luckiesh, 1 964). Normal colour vision
differs among sexes, whereby the degree of deviation is about 8% among males and
0.4% among females (Judd and Wyszecky, 1 975). Changes in intensity oflight alter
the image received by the eye (Bollen et aI. , 1993).
Many colour indices have been developed to determine the maturity stages of
the carambola. Oslund and Davenport ( 1983) divided the maturity stages of Golden
Star cultivar into six colour indices according to the Munsell Colour chart (index 1
= 2.5GY 711 0; strong yellow-green, 2 = IOY 8/1 1 ; strong green-yellow, 3 = 7.5Y
8/12; vivid green-yellow, 4 = 5Y 8/12; vivid yellow, 5 = IOYR 7/1 0; strong orange
yellow to 7.5YR 7/1 1 ; strong orange-yellow). Mitcham and McDonald ( 1991 )
divided ' Arkin' into four indices according to the stages of maturity ( 1 = Dark green,