Embed Size (px)
Citation preview
12:00 P.M.
United States Department of Agriculture
National Agricultural Statistics Service
Prospective Plantings
Grain Stocks
Rice Stocks
Executive Summary
Lance Honig, Chief
Crops Branch
March 29, 2018
USDA-NASS
3-29-18
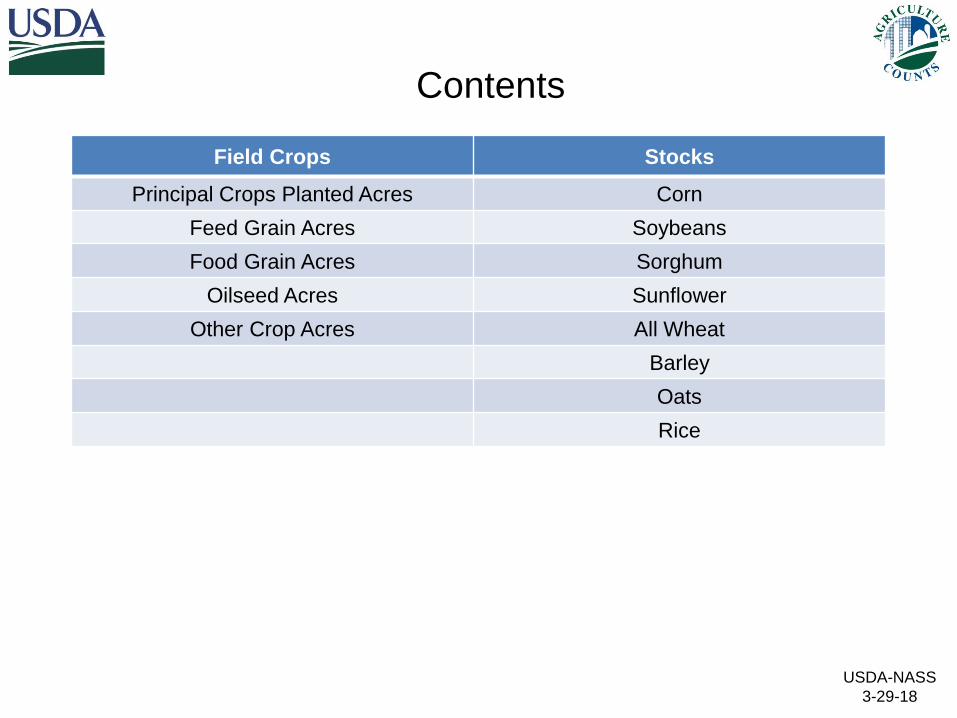
Field Crops Stocks
Principal Crops Planted Acres Corn
Feed Grain Acres Soybeans
Food Grain Acres Sorghum
Oilseed Acres Sunflower
Other Crop Acres All Wheat
Barley
Oats
Rice
Contents
USDA-NASS
3-29-18
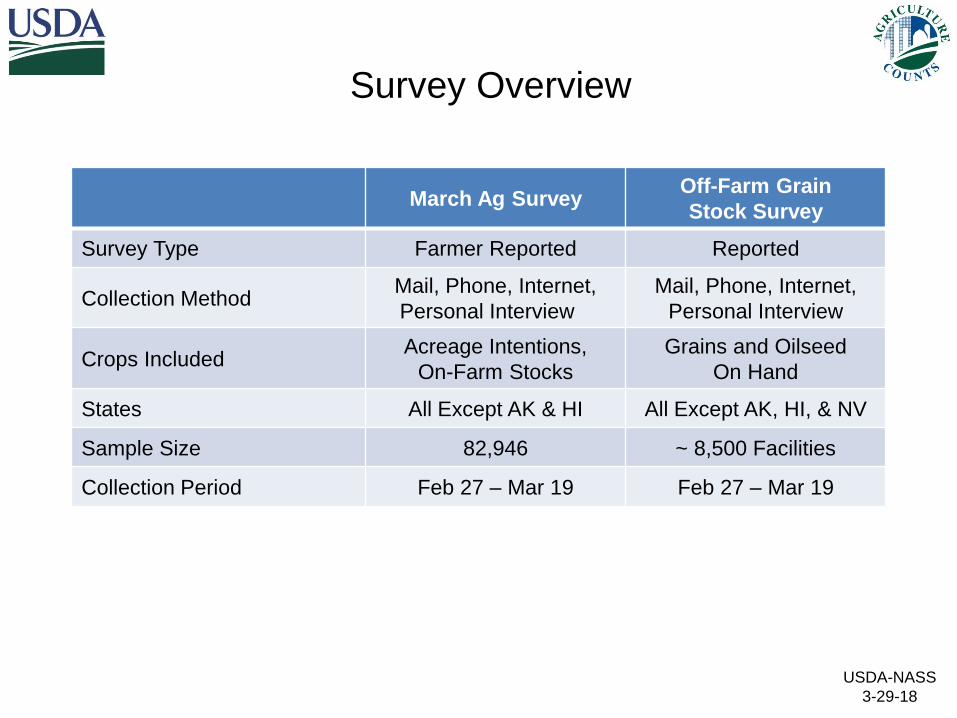
March Ag SurveyOff-Farm Grain
Stock Survey
Survey Type Farmer Reported Reported
Collection MethodMail, Phone, Internet,
Personal Interview
Mail, Phone, Internet,
Personal Interview
Crops IncludedAcreage Intentions,
On-Farm Stocks
Grains and Oilseed
On Hand
States All Except AK & HI All Except AK, HI, & NV
Sample Size 82,946 ~ 8,500 Facilities
Collection Period Feb 27 – Mar 19 Feb 27 – Mar 19
Survey Overview
0
10
20
30
40
50
60
70
80
90
100
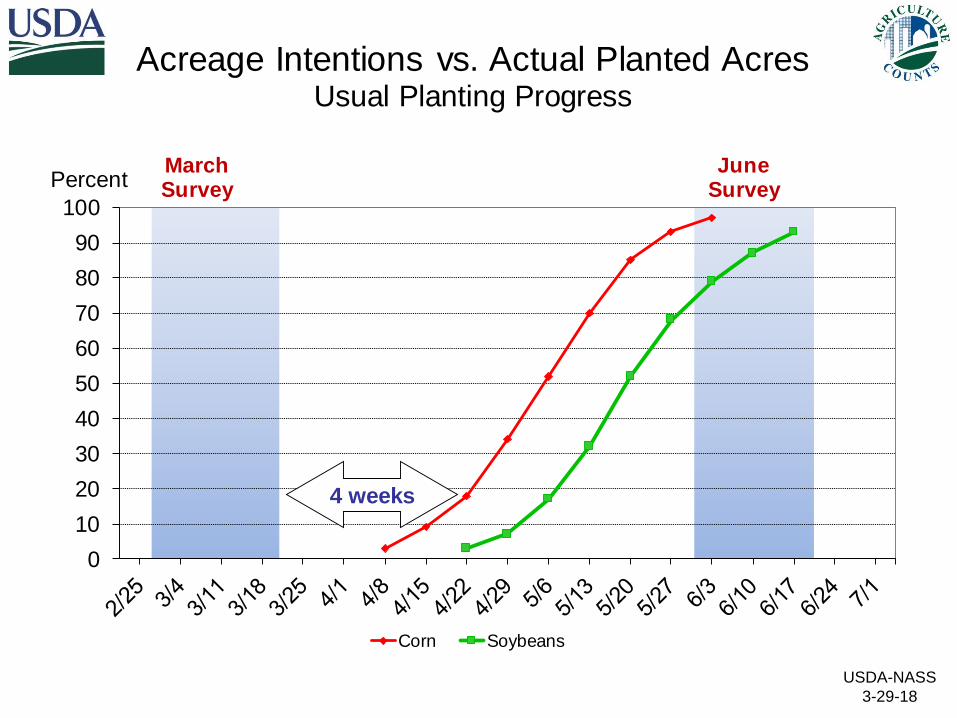
Percent
Acreage Intentions vs. Actual Planted AcresUsual Planting Progress
Corn Soybeans
March Survey
June Survey
4 weeks
USDA-NASS
3-29-18
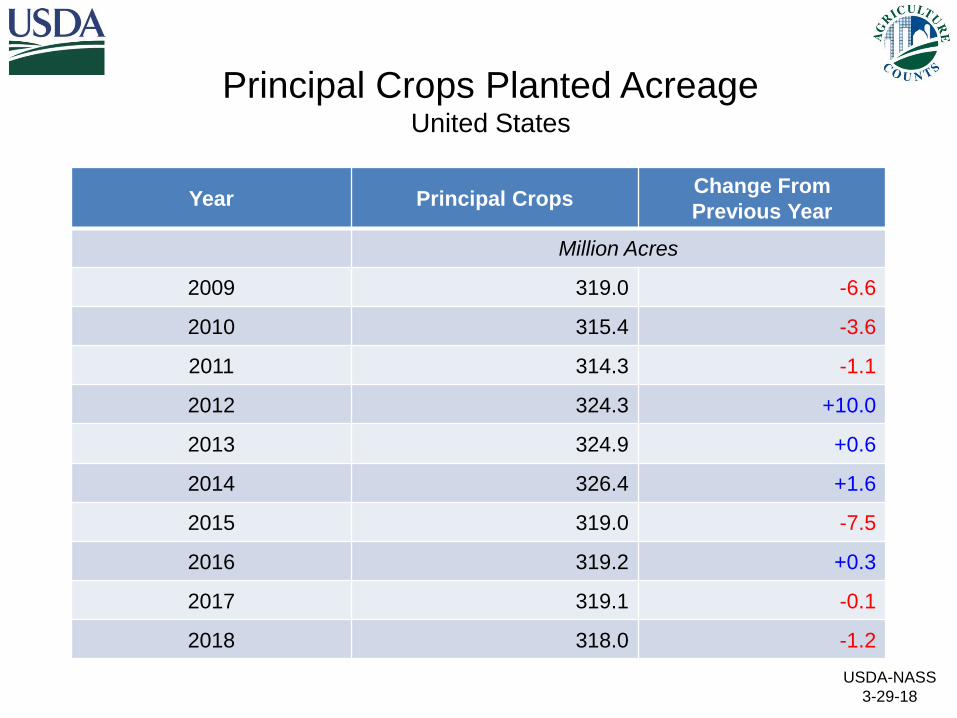
Year Principal CropsChange From
Previous Year
Million Acres
2009 319.0 -6.6
2010 315.4 -3.6
2011 314.3 -1.1
2012 324.3 +10.0
2013 324.9 +0.6
2014 326.4 +1.6
2015 319.0 -7.5
2016 319.2 +0.3
2017 319.1 -0.1
2018 318.0 -1.2
Principal Crops Planted AcreageUnited States
USDA-NASS
3-29-18
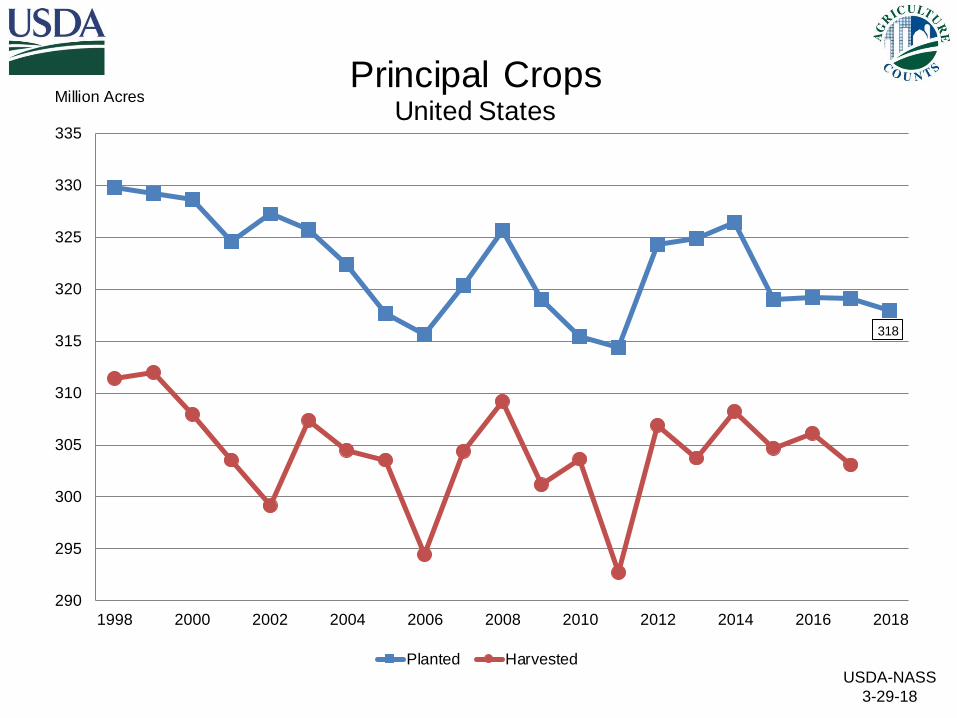
318
290
295
300
305
310
315
320
325
330
335
1998 2000 2002 2004 2006 2008 2010 2012 2014 2016 2018
Million AcresPrincipal Crops
United States
Planted HarvestedUSDA-NASS
3-29-18
USDA-NASS
3-29-18
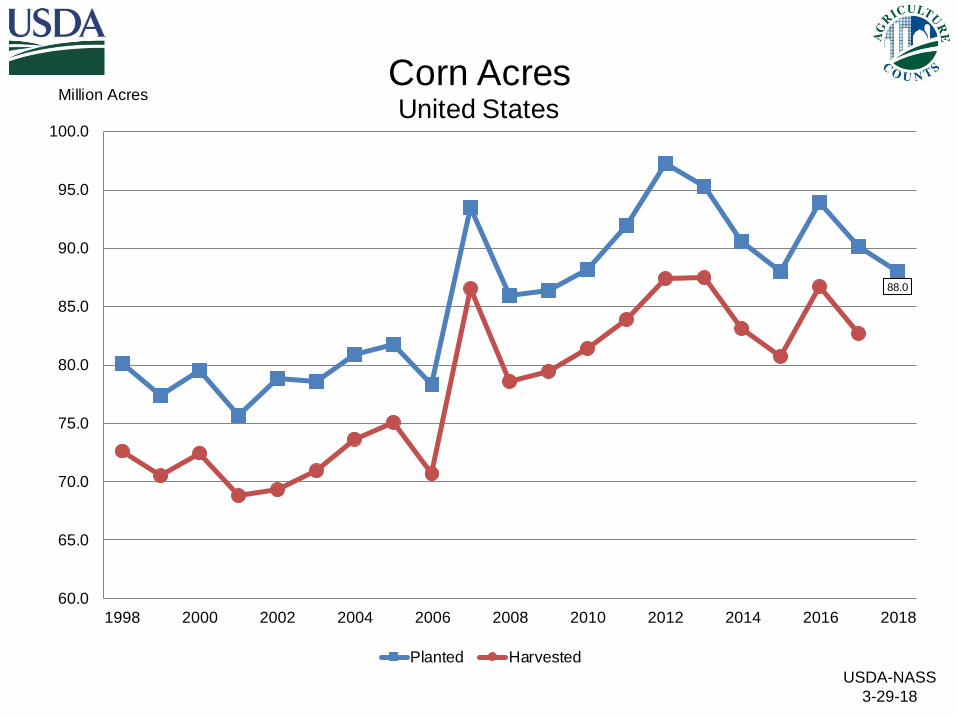
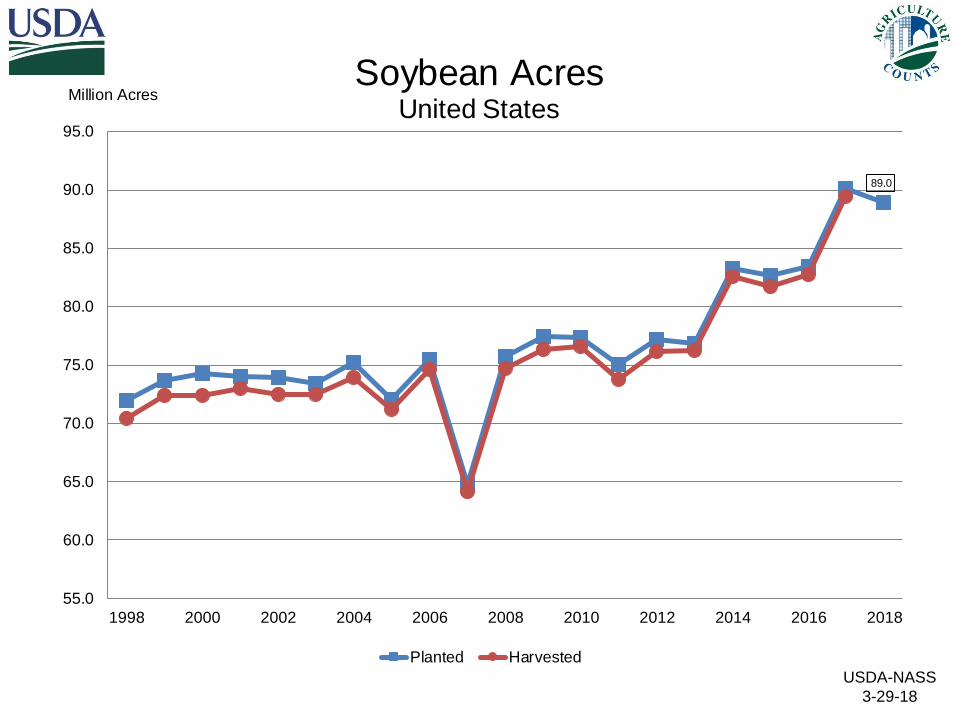
88.0
60.0
65.0
70.0
75.0
80.0
85.0
90.0
95.0
100.0
1998 2000 2002 2004 2006 2008 2010 2012 2014 2016 2018
Million AcresCorn AcresUnited States
Planted Harvested
USDA-NASS
3-29-18
USDA-NASS
3-29-18

USDA-NASS
3-29-18
NASSEstimate
LowOf Expectations
AverageOf Expectations
HighOf Expectations
87.0
87.5
88.0
88.5
89.0
89.5
90.0
90.5
91.0
91.5
March June Final
Million Acres
2018 United States Corn AcresIndustry Expectations vs NASS
NASS Estimate Individual Industry Expectation
89.0
55.0
60.0
65.0
70.0
75.0
80.0
85.0
90.0
95.0
1998 2000 2002 2004 2006 2008 2010 2012 2014 2016 2018
Million AcresSoybean Acres
United States
Planted Harvested
USDA-NASS
3-29-18
USDA-NASS
3-29-18
USDA-NASS
3-29-18
NASSEstimate
LowOf Expectations
AverageOf Expectations
HighOf Expectations
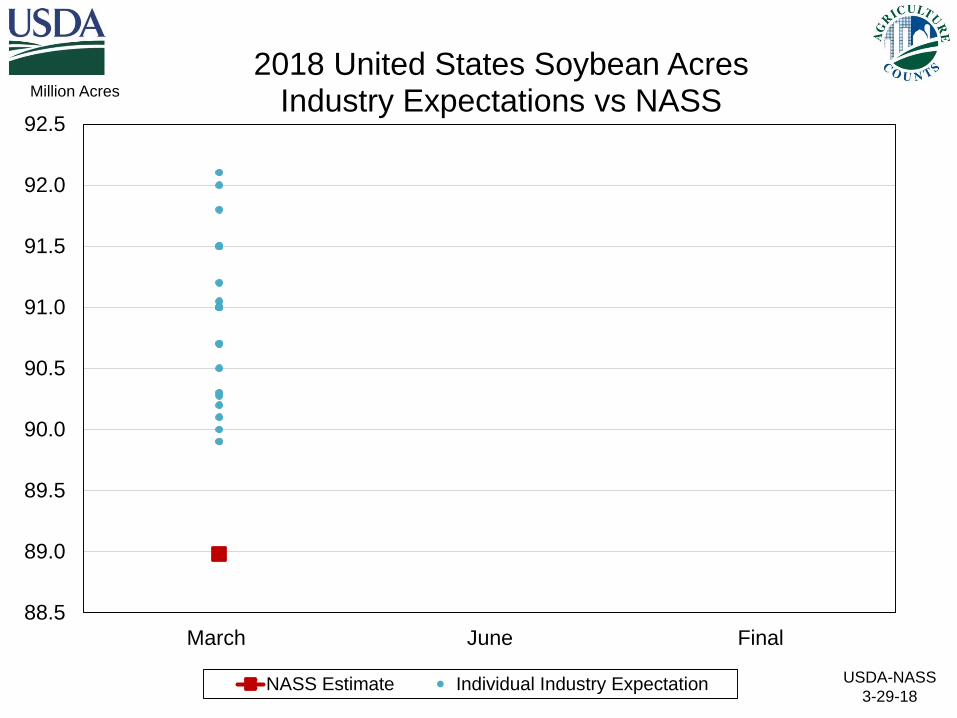
88.5
89.0
89.5
90.0
90.5
91.0
91.5
92.0
92.5
March June Final
Million Acres
2018 United States Soybean AcresIndustry Expectations vs NASS
NASS Estimate Individual Industry Expectation
USDA-NASS
3-29-18
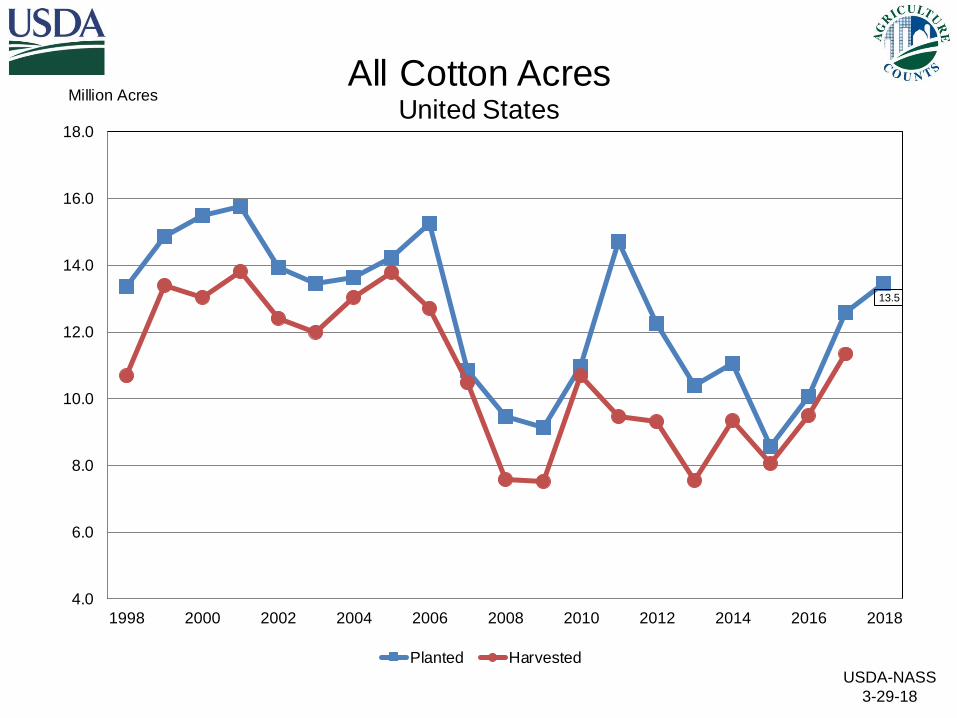
13.5
4.0
6.0
8.0
10.0
12.0
14.0
16.0
18.0
1998 2000 2002 2004 2006 2008 2010 2012 2014 2016 2018
Million AcresAll Cotton Acres
United States
Planted Harvested
USDA-NASS
3-29-18
USDA-NASS
3-29-18
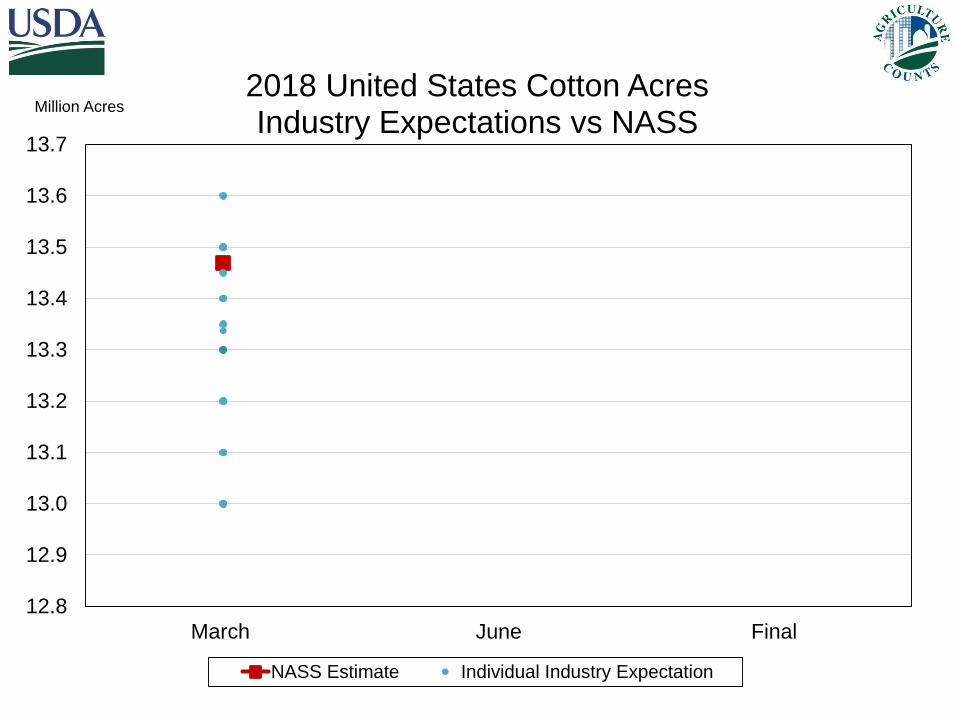
12.8
12.9
13.0
13.1
13.2
13.3
13.4
13.5
13.6
13.7
March June Final
Million Acres2018 United States Cotton AcresIndustry Expectations vs NASS
NASS Estimate Individual Industry Expectation
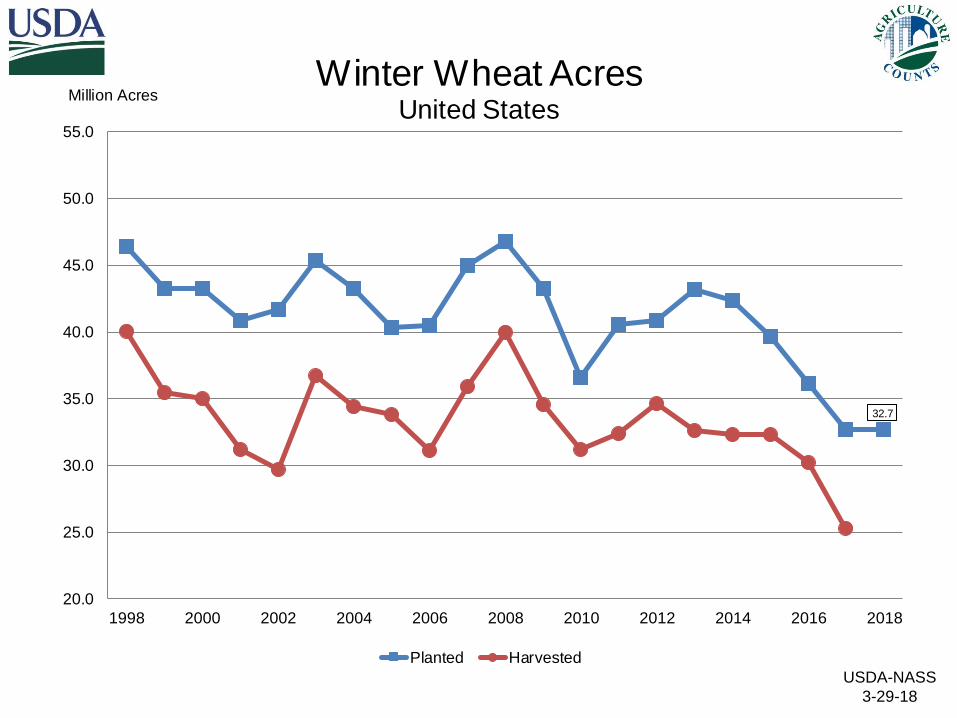
32.7
20.0
25.0
30.0
35.0
40.0
45.0
50.0
55.0
1998 2000 2002 2004 2006 2008 2010 2012 2014 2016 2018
Million AcresWinter Wheat Acres
United States
Planted Harvested
USDA-NASS
3-29-18
USDA-NASS
3-29-18
USDA-NASS
3-29-18
NASSEstimate
LowOf Expectations
AverageOf Expectations
HighOf Expectations
30.0
30.5
31.0
31.5
32.0
32.5
33.0
December March June Final
Million Acres
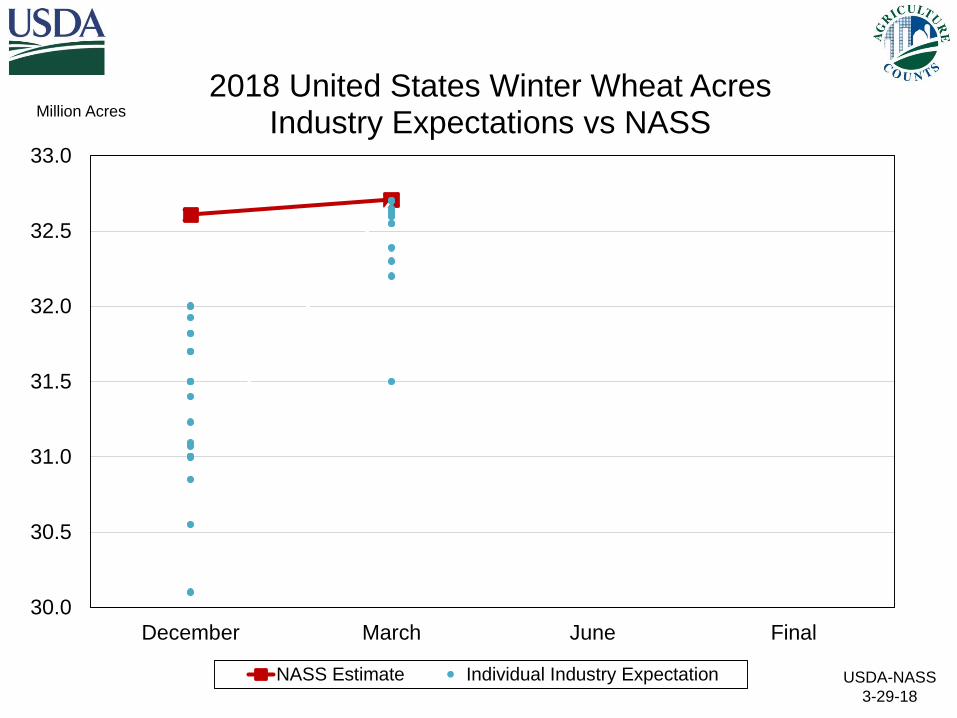
2018 United States Winter Wheat AcresIndustry Expectations vs NASS
NASS Estimate Individual Industry Expectation
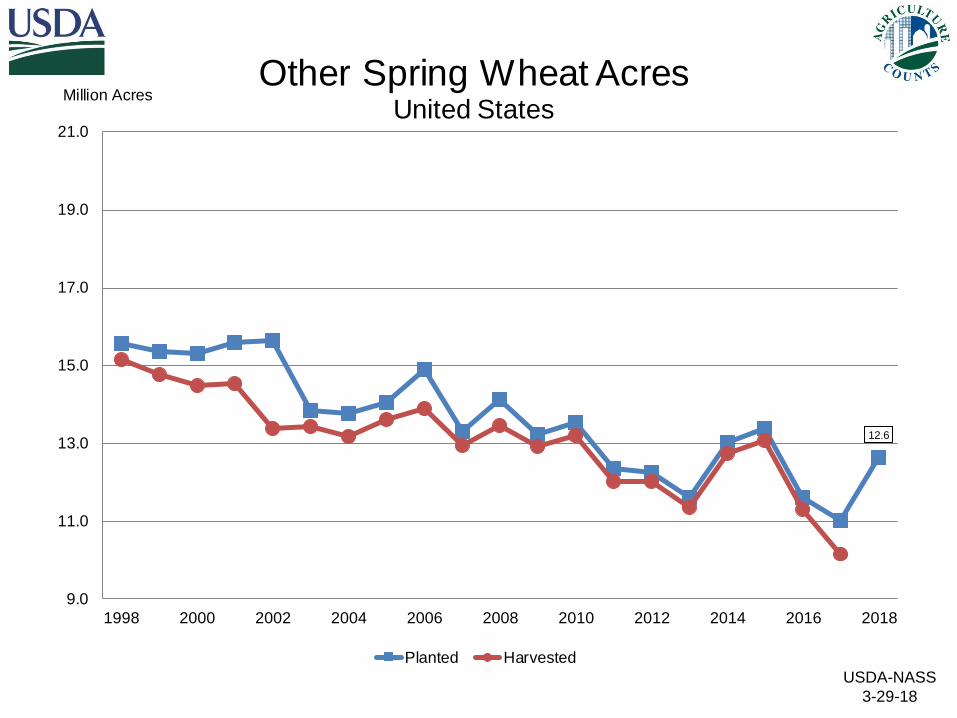
12.6
9.0
11.0
13.0
15.0
17.0
19.0
21.0
1998 2000 2002 2004 2006 2008 2010 2012 2014 2016 2018
Million AcresOther Spring Wheat Acres
United States
Planted Harvested
USDA-NASS
3-29-18
USDA-NASS
3-29-18
USDA-NASS
3-29-18
NASSEstimate
LowOf Expectations
AverageOf Expectations
HighOf Expectations
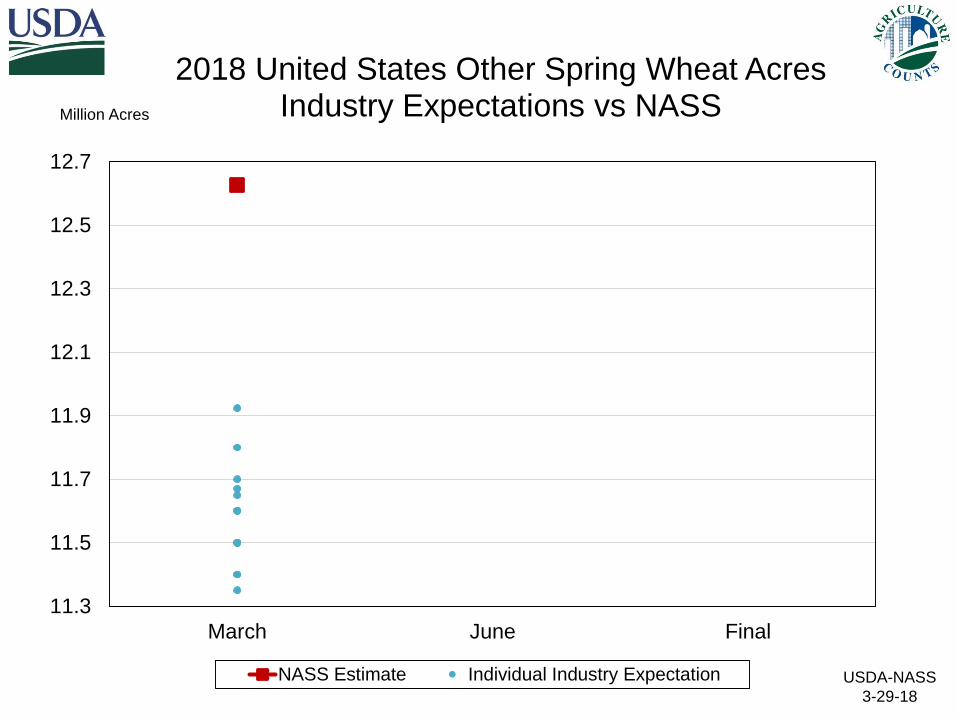
11.3
11.5
11.7
11.9
12.1
12.3
12.5
12.7
March June Final
Million Acres
2018 United States Other Spring Wheat AcresIndustry Expectations vs NASS
NASS Estimate Individual Industry Expectation
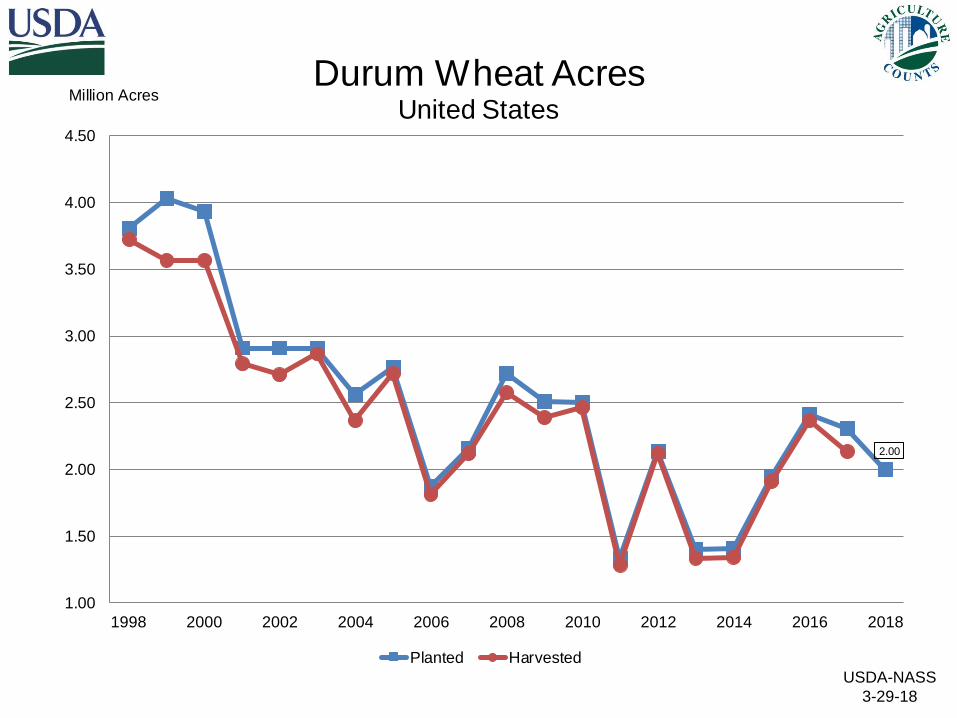
2.00
1.00
1.50
2.00
2.50
3.00
3.50
4.00
4.50
1998 2000 2002 2004 2006 2008 2010 2012 2014 2016 2018
Million AcresDurum Wheat Acres
United States
Planted Harvested
USDA-NASS
3-29-18
USDA-NASS
3-29-18
USDA-NASS
3-29-18
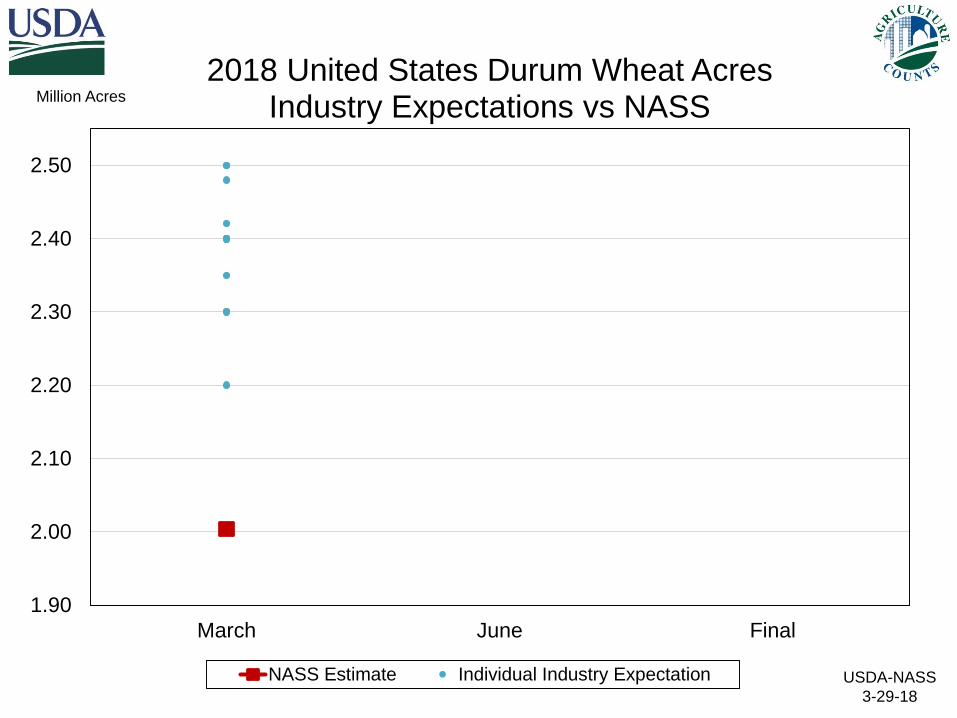
NASSEstimate
LowOf Expectations
AverageOf Expectations
HighOf Expectations
1.90
2.00
2.10
2.20
2.30
2.40
2.50
March June Final
Million Acres
2018 United States Durum Wheat AcresIndustry Expectations vs NASS
NASS Estimate Individual Industry Expectation
USDA-NASS
3-29-18
% Change % Change
From From
Crop Unit March Previous Previous
2018 Estimate Season
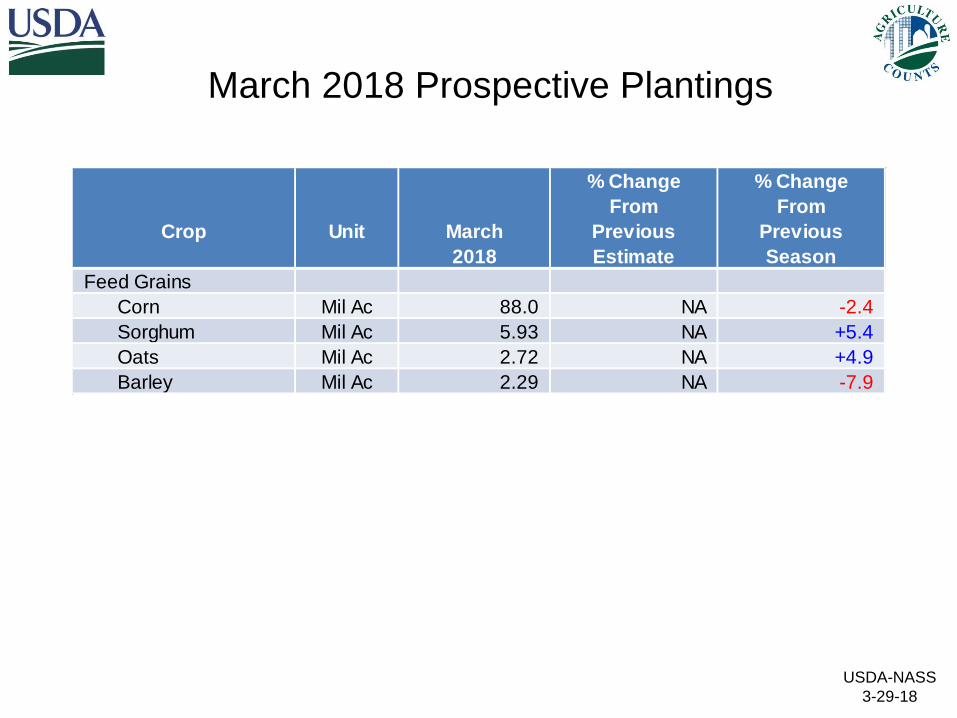
Feed Grains
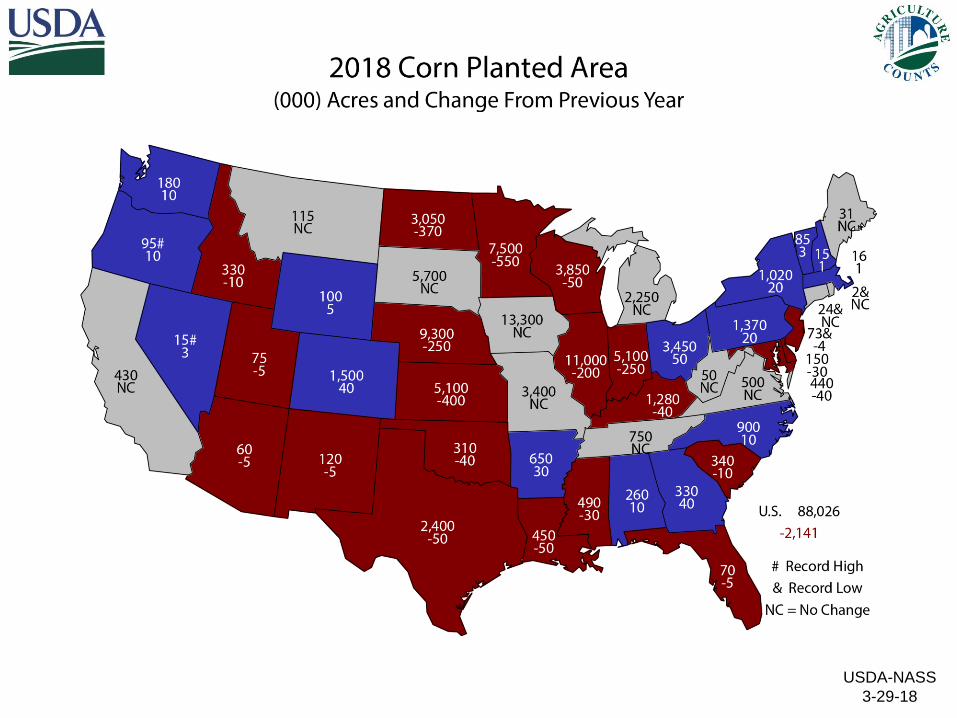
Corn Mil Ac 88.0 NA -2.4
Sorghum Mil Ac 5.93 NA +5.4
Oats Mil Ac 2.72 NA +4.9
Barley Mil Ac 2.29 NA -7.9
March 2018 Prospective Plantings
USDA-NASS
3-29-18
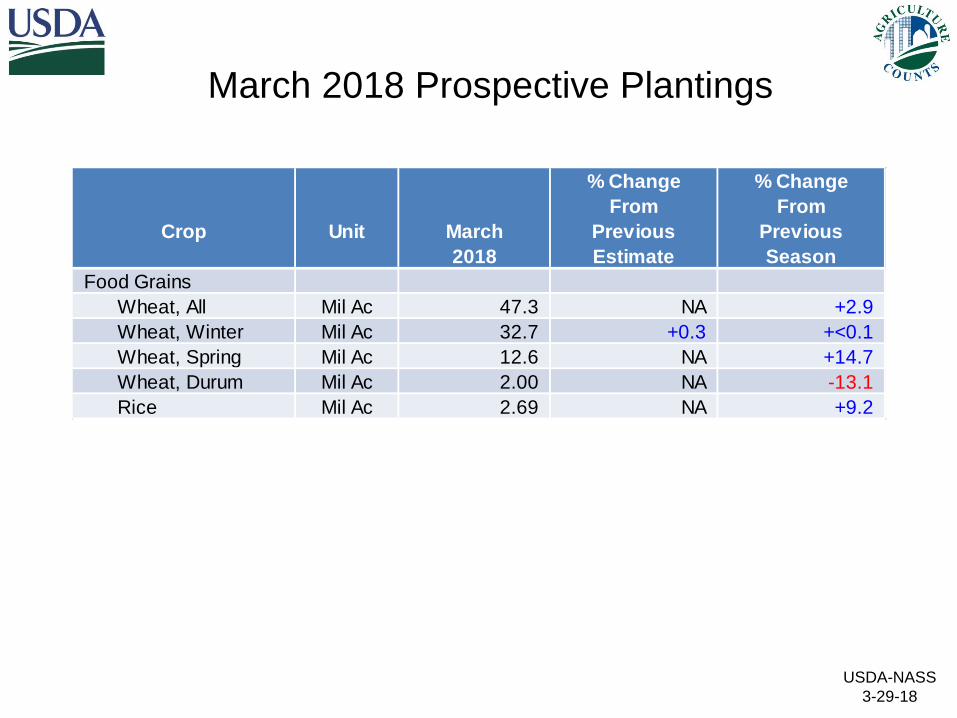
March 2018 Prospective Plantings
% Change % Change
From From
Crop Unit March Previous Previous
2018 Estimate Season
Food Grains
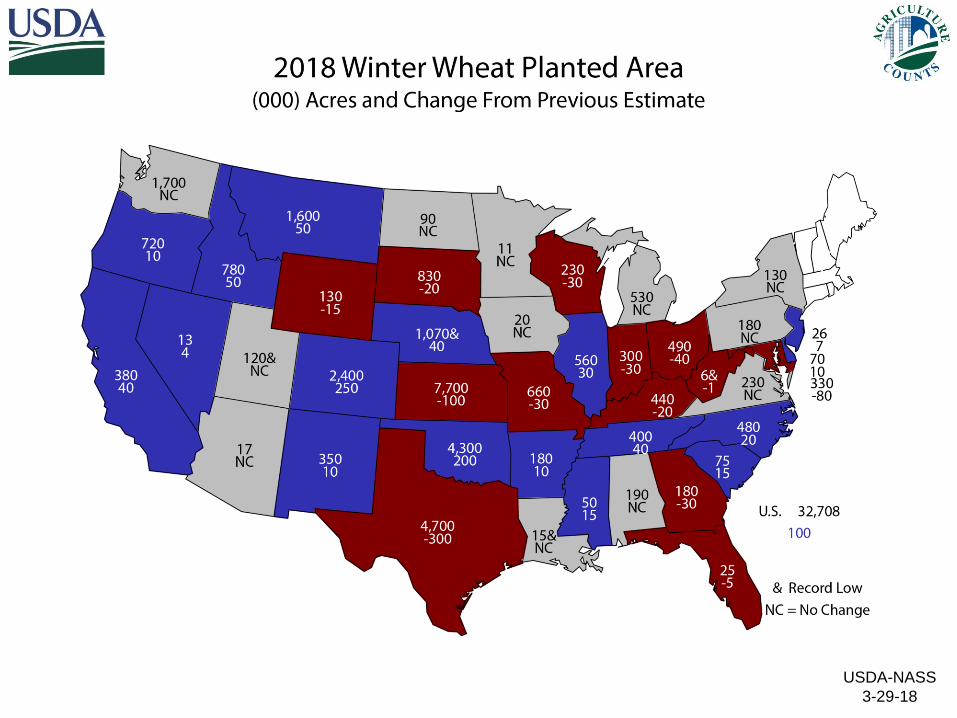
Wheat, All Mil Ac 47.3 NA +2.9
Wheat, Winter Mil Ac 32.7 +0.3 +<0.1
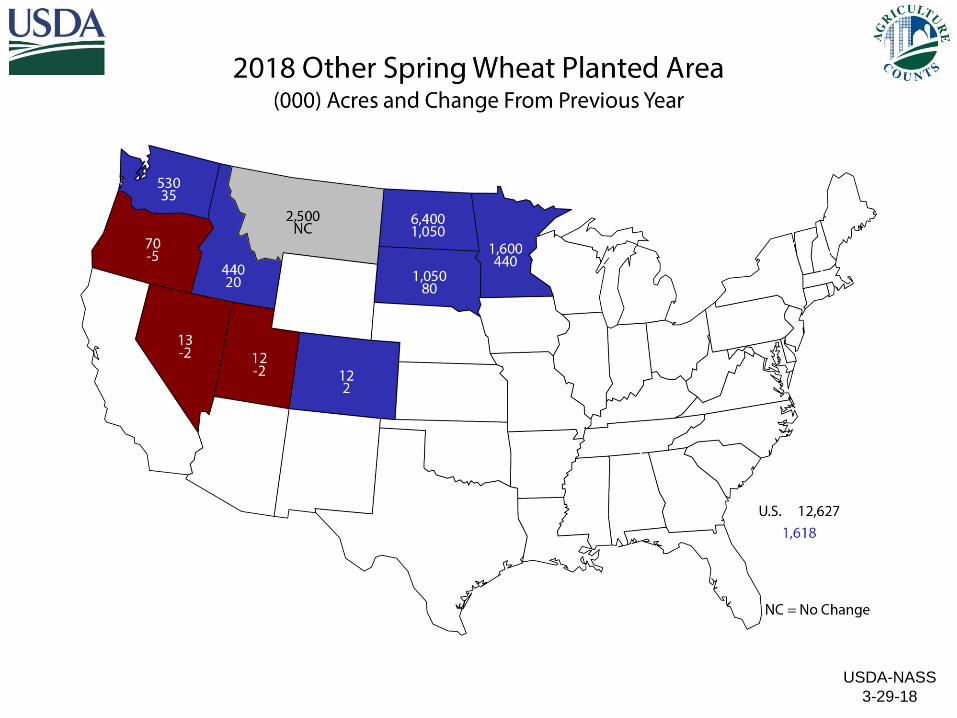
Wheat, Spring Mil Ac 12.6 NA +14.7
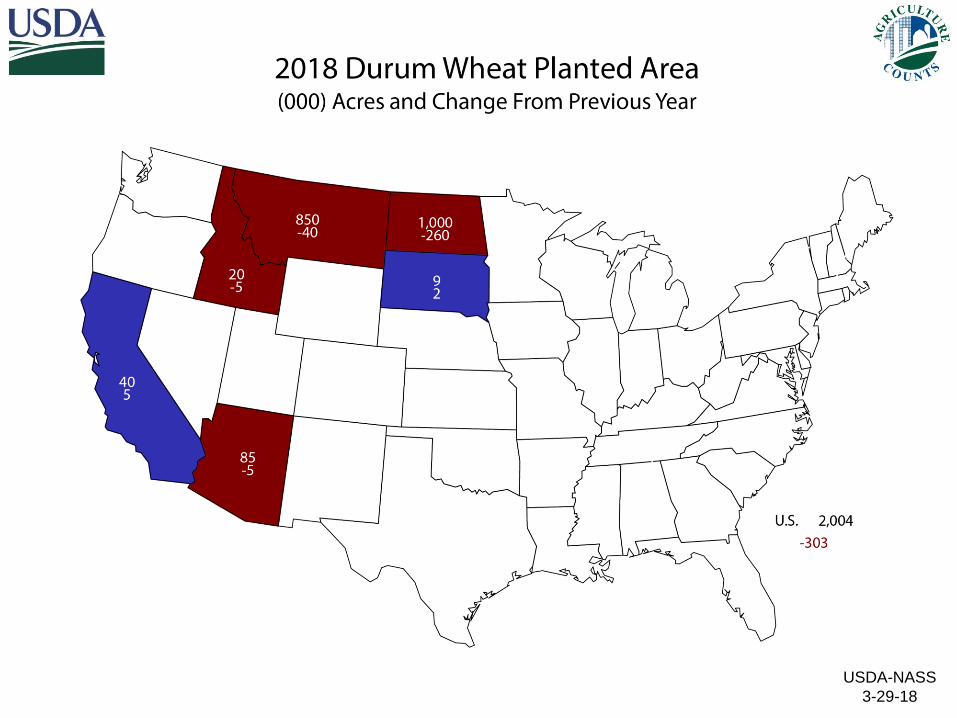
Wheat, Durum Mil Ac 2.00 NA -13.1
Rice Mil Ac 2.69 NA +9.2
USDA-NASS
3-29-18
% Change % Change
From From
Crop Unit March Previous Previous
2018 Estimate Season
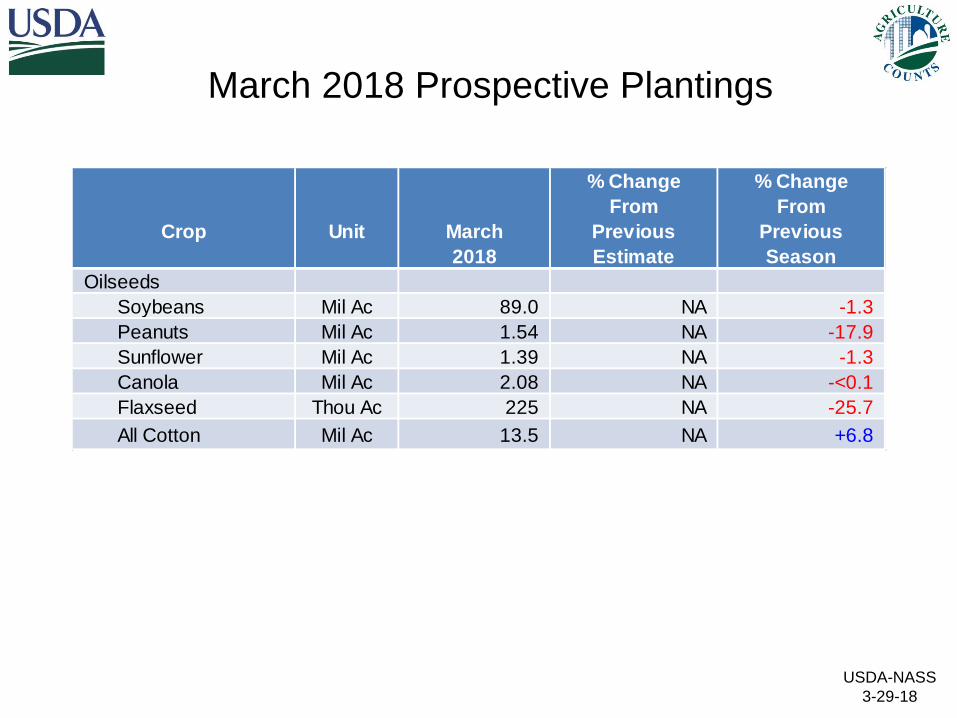
Oilseeds
Soybeans Mil Ac 89.0 NA -1.3
Peanuts Mil Ac 1.54 NA -17.9
Sunflower Mil Ac 1.39 NA -1.3
Canola Mil Ac 2.08 NA -<0.1
Flaxseed Thou Ac 225 NA -25.7
All Cotton Mil Ac 13.5 NA +6.8
March 2018 Prospective Plantings
USDA-NASS
3-29-18
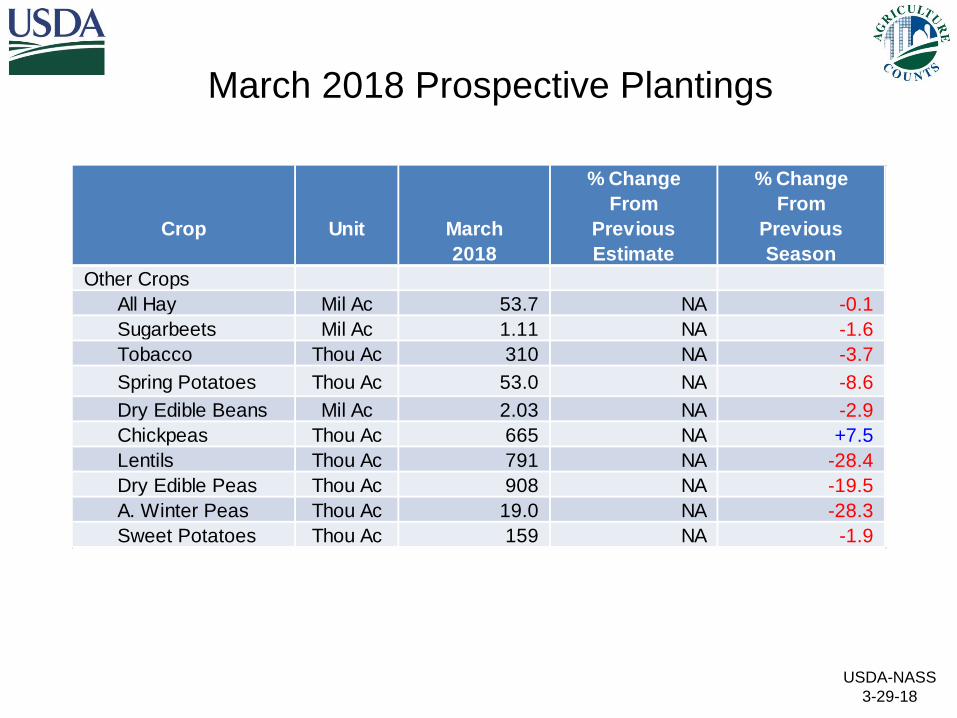
March 2018 Prospective Plantings
% Change % Change
From From
Crop Unit March Previous Previous
2018 Estimate Season
Other Crops
All Hay Mil Ac 53.7 NA -0.1
Sugarbeets Mil Ac 1.11 NA -1.6
Tobacco Thou Ac 310 NA -3.7
Spring Potatoes Thou Ac 53.0 NA -8.6
Dry Edible Beans Mil Ac 2.03 NA -2.9
Chickpeas Thou Ac 665 NA +7.5
Lentils Thou Ac 791 NA -28.4
Dry Edible Peas Thou Ac 908 NA -19.5
A. Winter Peas Thou Ac 19.0 NA -28.3
Sweet Potatoes Thou Ac 159 NA -1.9
USDA-NASS
3-29-18
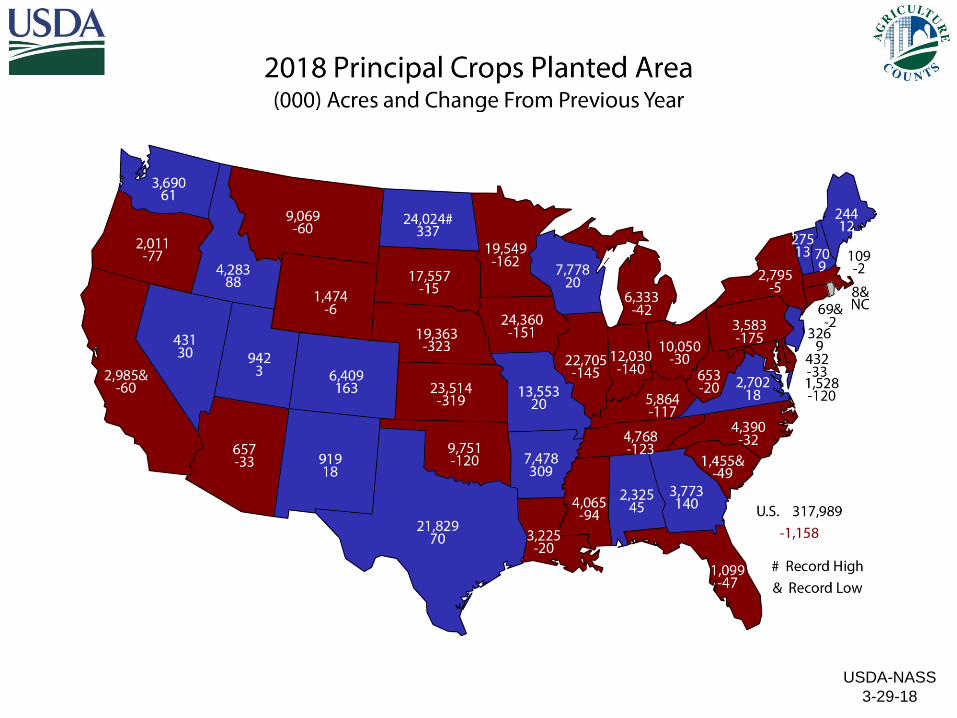
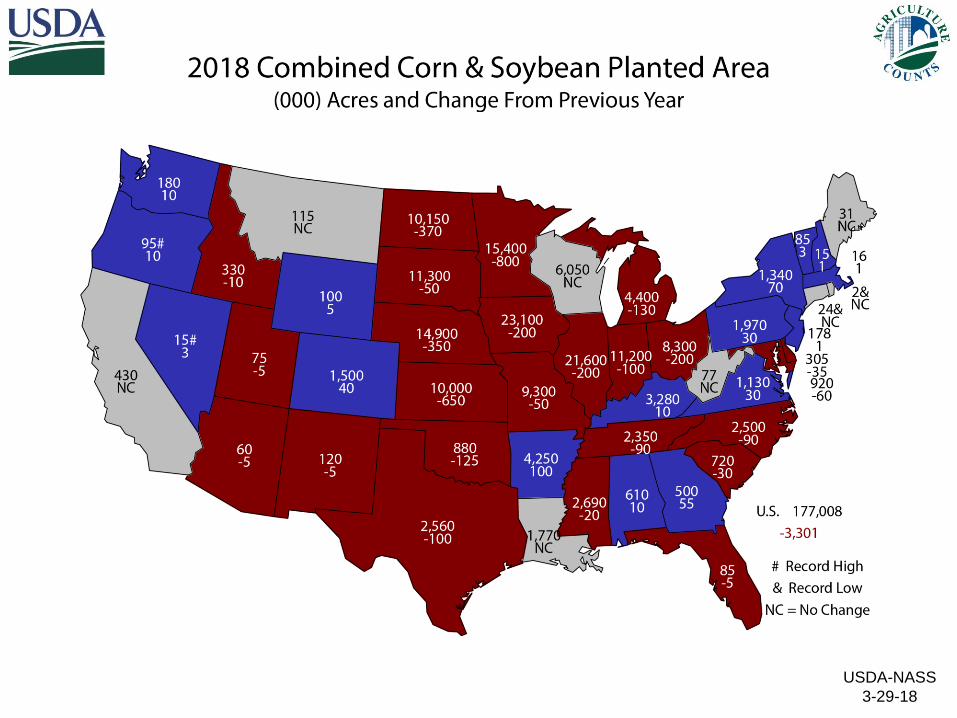
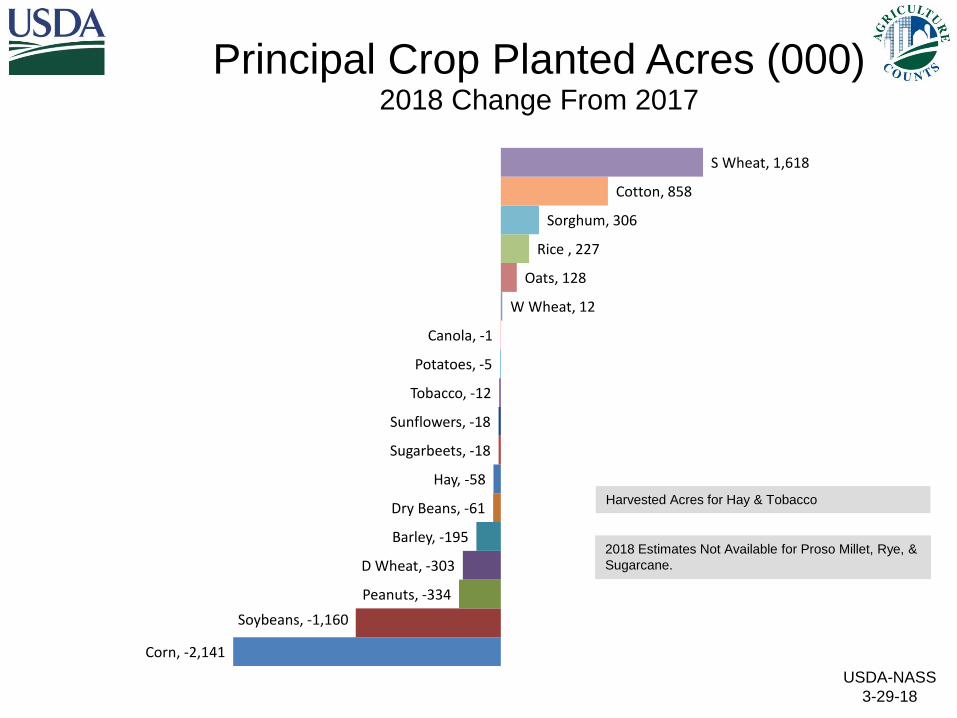
Corn, -2,141
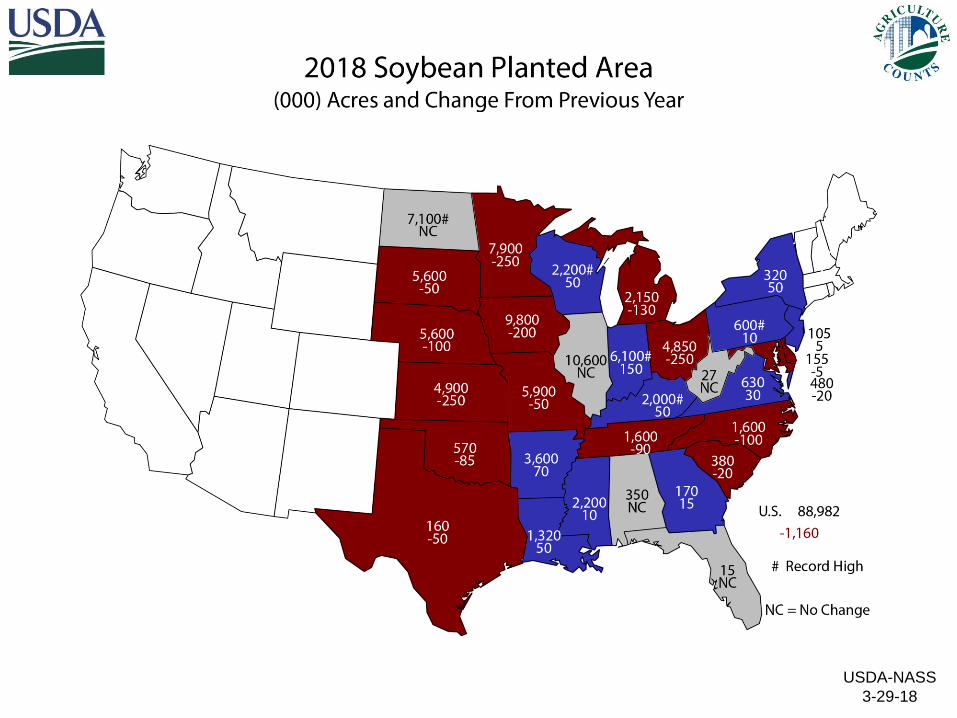
Soybeans, -1,160
Peanuts, -334
D Wheat, -303
Barley, -195
Dry Beans, -61
Hay, -58
Sugarbeets, -18
Sunflowers, -18
Tobacco, -12
Potatoes, -5
Canola, -1
W Wheat, 12
Oats, 128
Rice , 227
Sorghum, 306
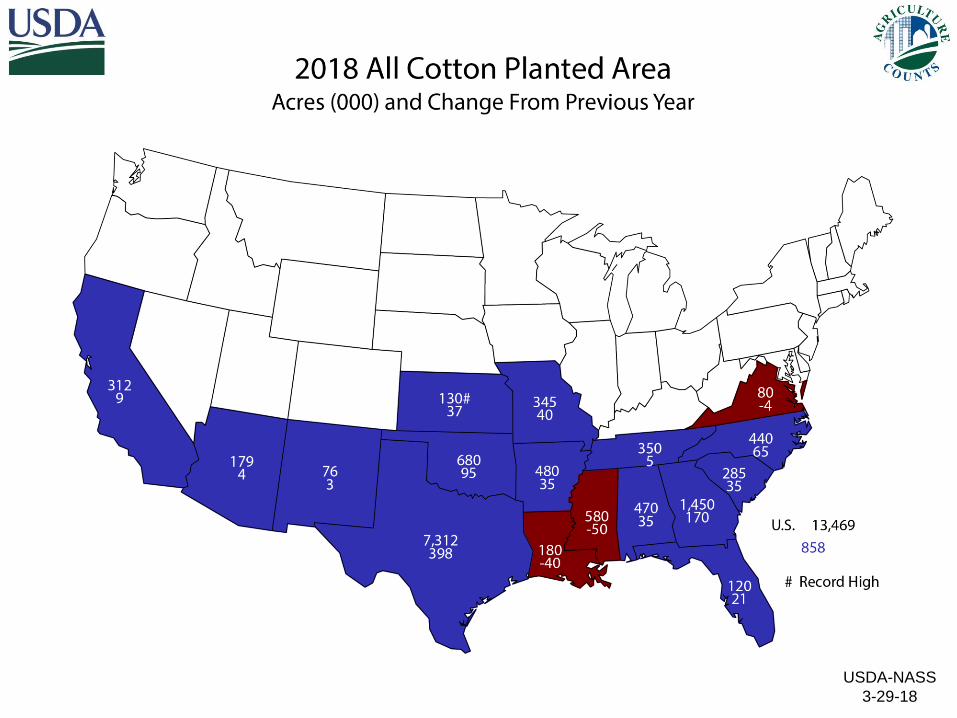
Cotton, 858
S Wheat, 1,618
Principal Crop Planted Acres (000)2018 Change From 2017
Harvested Acres for Hay & Tobacco
2018 Estimates Not Available for Proso Millet, Rye, &
Sugarcane.

USDA-NASS
3-29-18
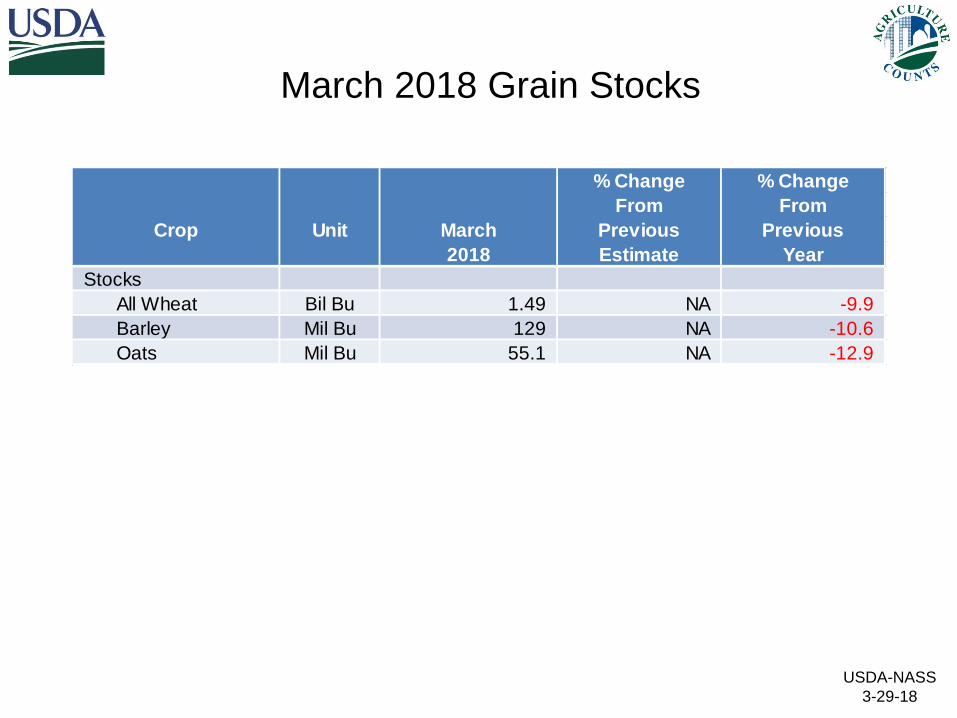
March 2018 Grain Stocks
% Change % Change
From From
Crop Unit March Previous Previous
2018 Estimate Year
Stocks
Corn Bil Bu 8.89 NA +3.1
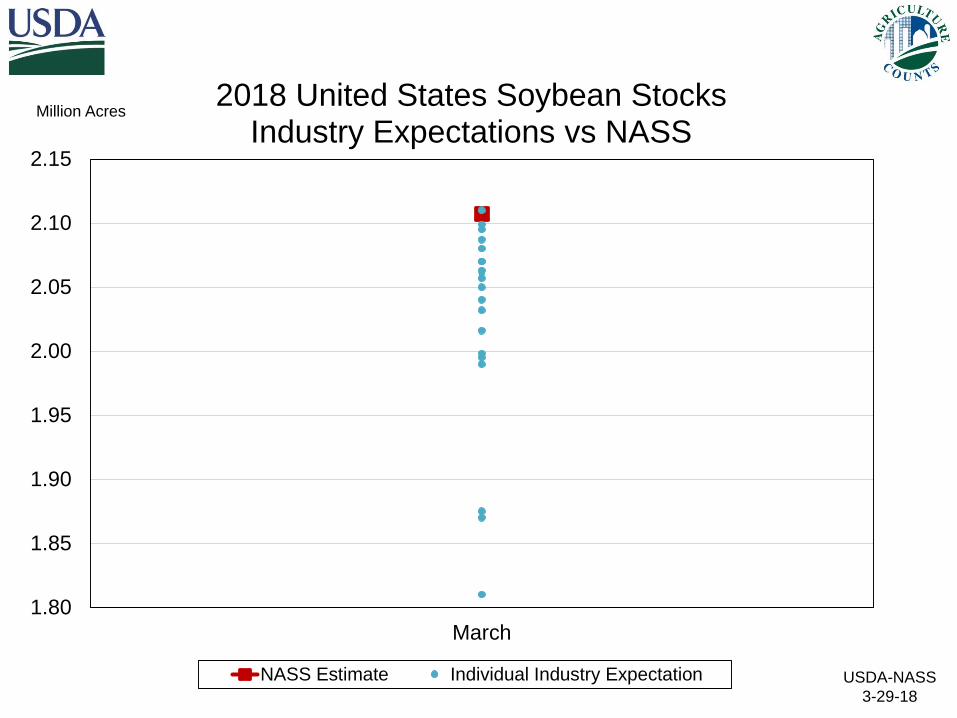
Soybeans Bil Bu 2.11 NA +21.2
Sorghum Mil Bu 138 NA -23.5
Sunflower Bil Lbs 1.24 NA -8.4
Rice Mil Cwt 83.4 NA -22.5
USDA-NASS
3-29-18
% Change % Change
From From
Crop Unit March Previous Previous
2018 Estimate Year
Stocks
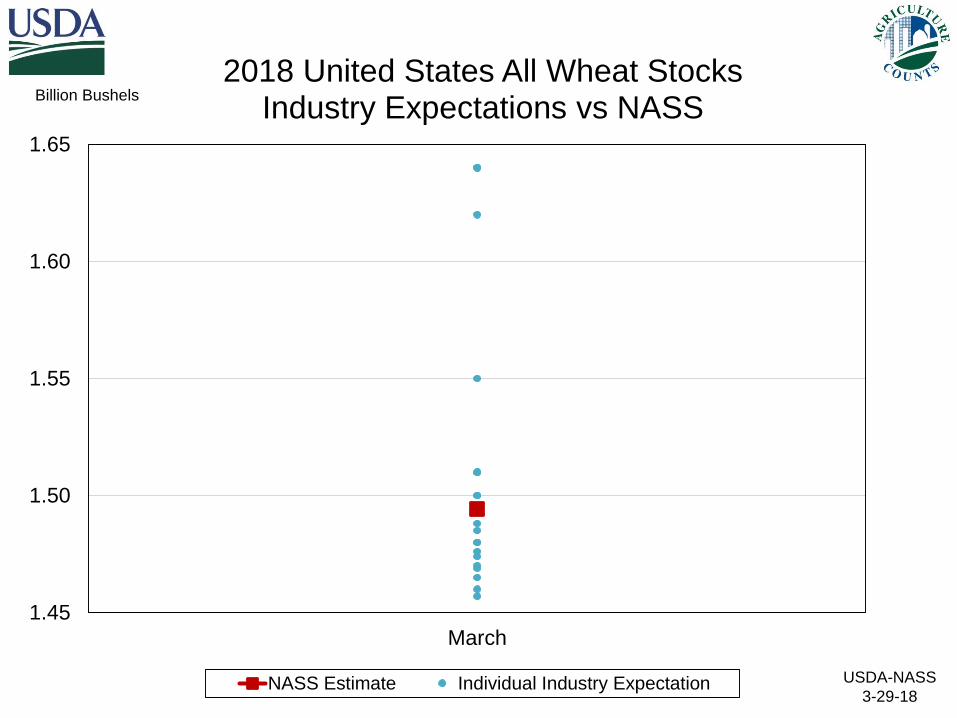
All Wheat Bil Bu 1.49 NA -9.9
Barley Mil Bu 129 NA -10.6
Oats Mil Bu 55.1 NA -12.9
March 2018 Grain Stocks
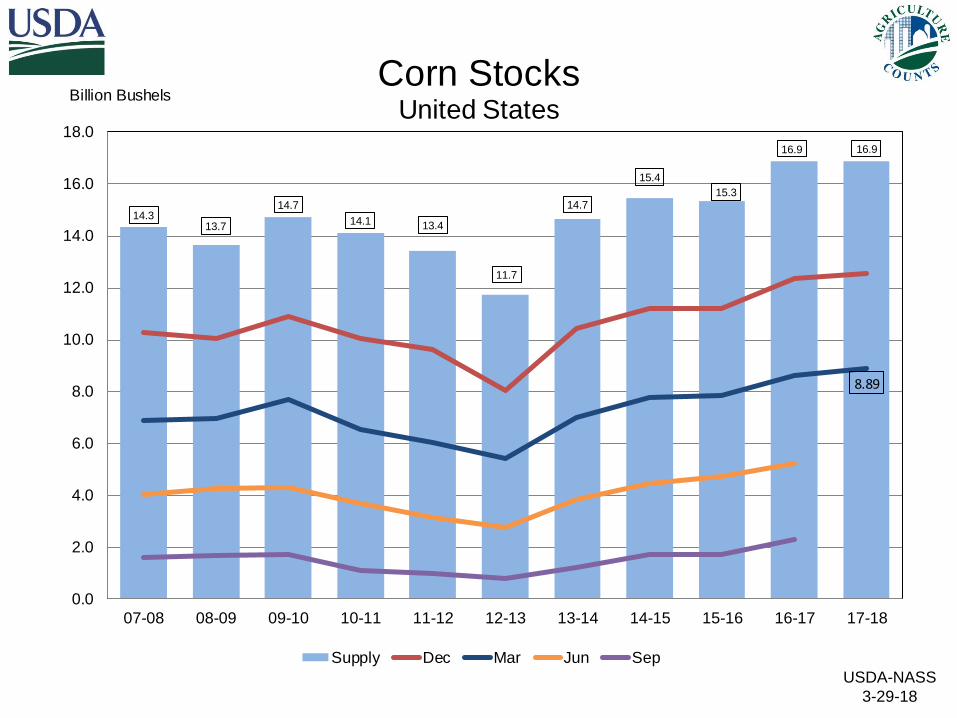
14.313.7
14.7
14.1 13.4
11.7
14.7
15.4
15.3
16.9 16.9
8.89
0.0
2.0
4.0
6.0
8.0
10.0
12.0
14.0
16.0
18.0
07-08 08-09 09-10 10-11 11-12 12-13 13-14 14-15 15-16 16-17 17-18
Billion BushelsCorn Stocks
United States
Supply Dec Mar Jun Sep
USDA-NASS
3-29-18
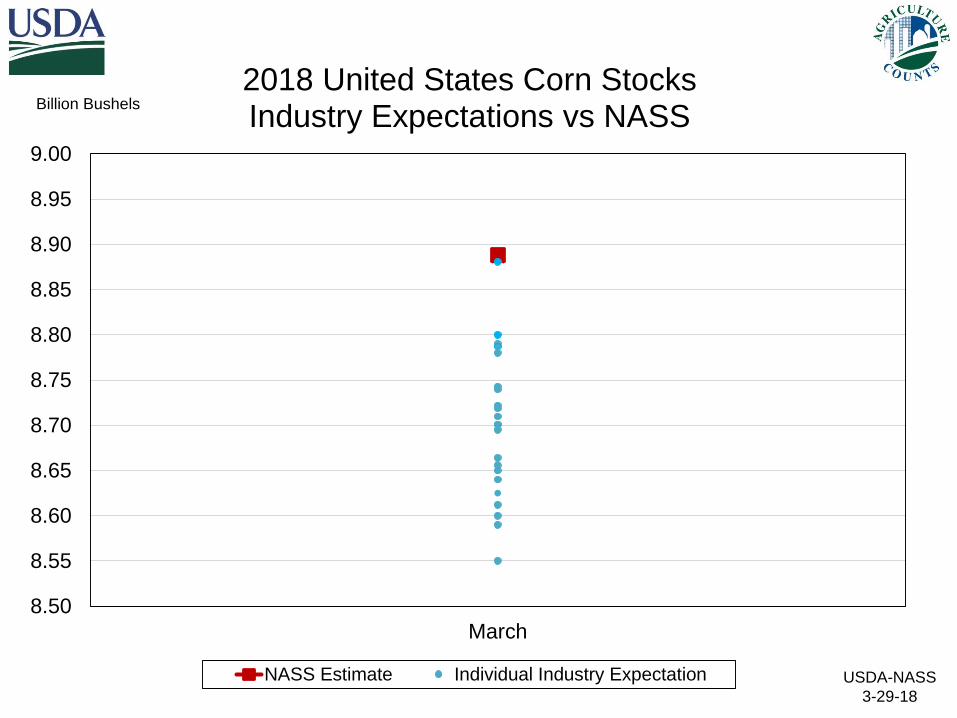
USDA-NASS
3-29-18
NASSEstimate
LowOf Expectations
AverageOf Expectations
HighOf Expectations
8.50
8.55
8.60
8.65
8.70
8.75
8.80
8.85
8.90
8.95
9.00
March
Billion Bushels
2018 United States Corn StocksIndustry Expectations vs NASS
NASS Estimate Individual Industry Expectation
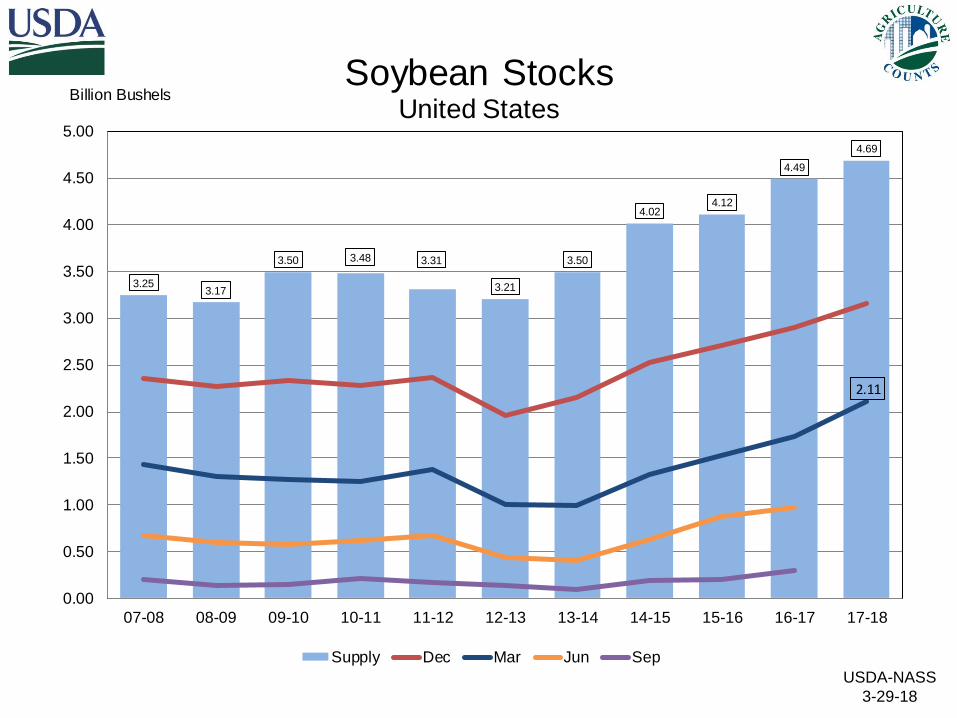
3.253.17
3.50 3.48 3.31
3.21
3.50
4.024.12
4.49
4.69
2.11
0.00
0.50
1.00
1.50
2.00
2.50
3.00
3.50
4.00
4.50
5.00
07-08 08-09 09-10 10-11 11-12 12-13 13-14 14-15 15-16 16-17 17-18
Billion BushelsSoybean Stocks
United States
Supply Dec Mar Jun Sep
USDA-NASS
3-29-18
USDA-NASS
3-29-18
NASSEstimate
LowOf Expectations
AverageOf Expectations
HighOf Expectations
1.80
1.85
1.90
1.95
2.00
2.05
2.10
2.15
March
Million Acres2018 United States Soybean Stocks
Industry Expectations vs NASS
NASS Estimate Individual Industry Expectation
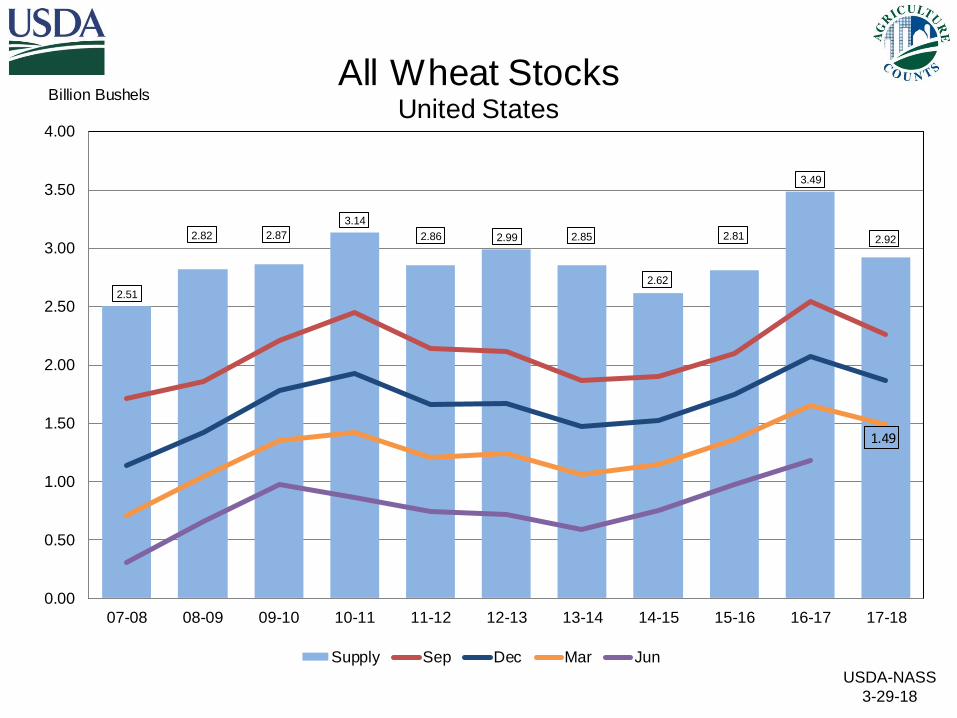
2.51
2.82 2.87
3.14
2.86 2.99 2.85
2.62
2.81
3.49
2.92
1.49
0.00
0.50
1.00
1.50
2.00
2.50
3.00
3.50
4.00
07-08 08-09 09-10 10-11 11-12 12-13 13-14 14-15 15-16 16-17 17-18
Billion BushelsAll Wheat Stocks
United States
Supply Sep Dec Mar Jun
USDA-NASS
3-29-18
USDA-NASS
3-29-18
NASSEstimate
LowOf Expectations
AverageOf Expectations
HighOf Expectations
1.45
1.50
1.55
1.60
1.65
March
Billion Bushels
2018 United States All Wheat StocksIndustry Expectations vs NASS
NASS Estimate Individual Industry Expectation
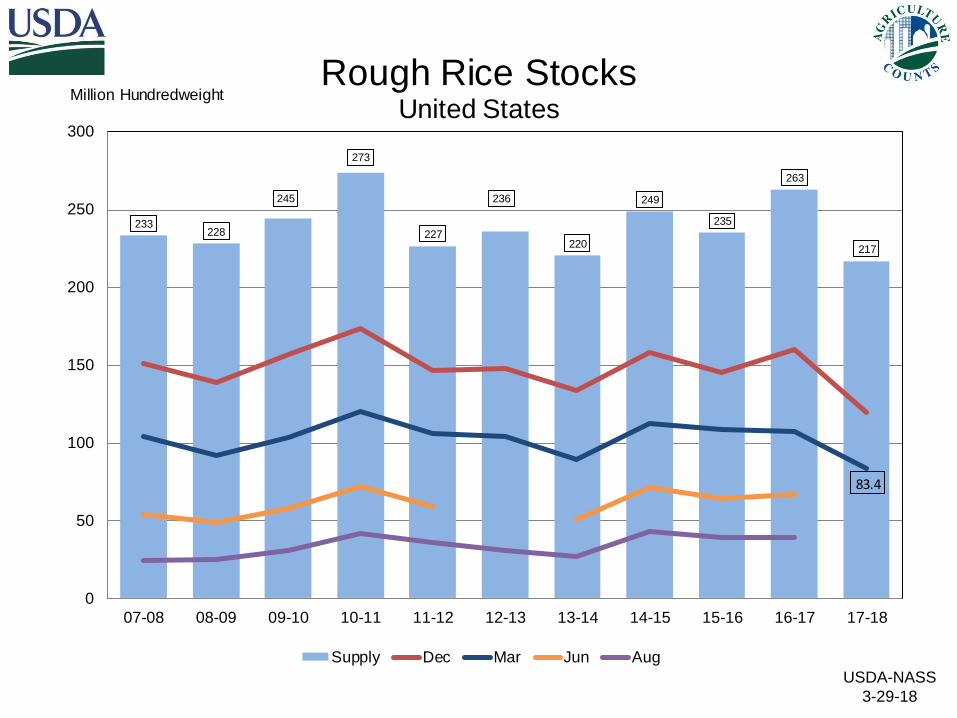
233228
245
273
227
236
220
249
235
263
217
83.4
0
50
100
150
200
250
300
07-08 08-09 09-10 10-11 11-12 12-13 13-14 14-15 15-16 16-17 17-18
Million HundredweightRough Rice Stocks
United States
Supply Dec Mar Jun Aug
USDA-NASS
3-29-18
USDA-NASS
3-29-18
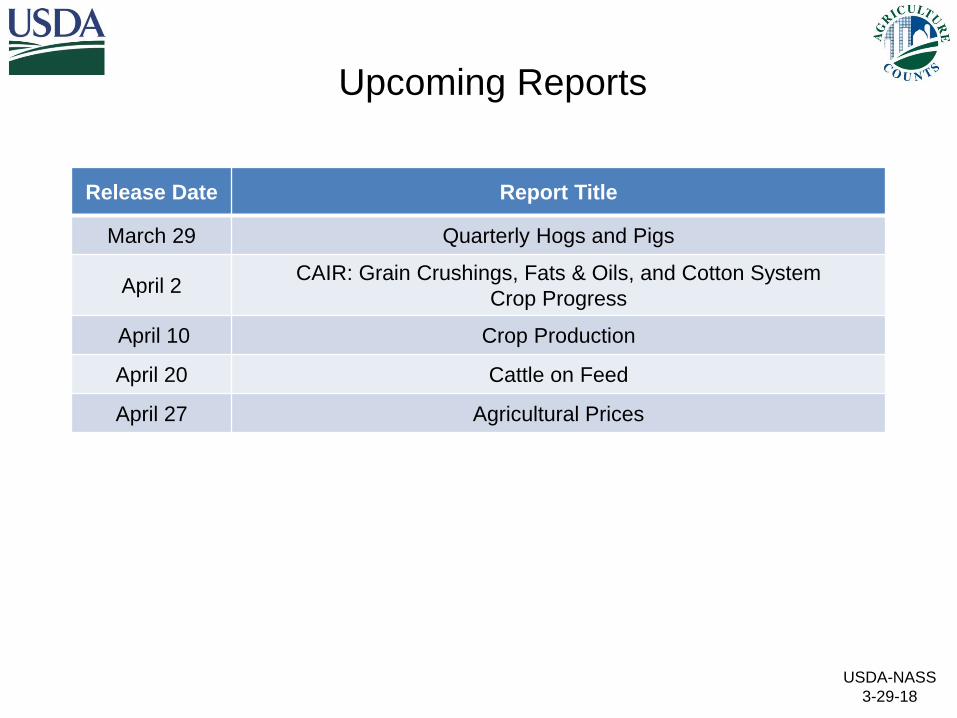
Release Date Report Title
March 29 Quarterly Hogs and Pigs
April 2CAIR: Grain Crushings, Fats & Oils, and Cotton System
Crop Progress
April 10 Crop Production
April 20 Cattle on Feed
April 27 Agricultural Prices
Upcoming Reports

USDA-NASS
3-29-18
USDA-NASS
3-29-18
USDA-NASS
3-29-18
United States Department of Agriculture
National Agricultural Statistics Service
All Reports Available Atwww.nass.usda.gov
For Questions202-720-2127
800-727-9540