Embed Size (px)
Citation preview

Unit 5 Research Project
Worthing College Sports ScienceJordan Core
2015
Assessment Criteria Pages 3-17 & 27-38
• P2: carry out sport science or exercise science-based research
• P3: collect and record data from the research project conducted
• M2: correctly analyse collected data, describing techniques used
• D1: correctly analyse data, explaining techniques used
• P4: produce a full research report using a standard scientific structure

Does the average height of a Barclays Premier League (2013/2014) teams defence, including players who appeared
on ten or more occasions, affect the amount of goals they concede per season?
By Jordan Core
P2: Carry out / P4: Produce

AbstractI have researched and I am writing about a correlation between the average height of a premier league defence, featuring only players who have played 10 or more games and whether that affects the amount of goals their team concedes. This is a pressing issue in football and teams and managers are always looking to upgrade their players and their defensive coaches, so if they were to look through my project they may see that ability doesn’t matter and it may well be physiological factors that affect the goals a defence concedes. My project is trying to take a look at defences and why they concede goals, whether its due to the amount of defenders they are playing or the ability, I decided to look at the height, a physiological factor. I am focusing purely on Premier League defenders in the 2013/2014 season and they must have played more then 10 games. I sat down recording average heights of players, secondary research, from a single website, then using calculations to work out average heights and recording the goals conceded. Then going to use Excel to help put these into a graph. The Spearman rank correlation order, however proves that there is no correlation between the height and goals conceded, my most important source, my only real source was www.Squawka.co.uk and gave me all of my statistics. My hypotheses wasn’t proved right, due to the that there 2was no correlation and the general finding was that the height didn’t play a factor at all, in terms of goals conceded. My results are now very general and wont impact many managers or teams at all, as it shows there is no correlation so they will continue to employ and buy players based on ability.
P2: Carry out / P4: Produce

Contents: GeneralPage 1-Title Page 2- Assessment CriteriaPage 3- Main Aim Title PagePage 4-AbstractPage 5-ContentsPage 6-Appendices ContentsPage 7-Figures and Tables Contents.Page 8- Acknowledgements.Page 9- Introduction.Page 10- Literature Review.Page 11- Project HypothesesPage 12-MethodPage 13- Data CollectionPage 14- Data AnalysisPage 15-ResultsPage 16- DiscussionPage 17-ConclusionPage 18- Assessment Criteria.Page 19- Review 1/3Page 20- Review 2/3Page 21- Review 3/3Page 22- Future Recommendations 1/5Page 23- Future Recommendations 2/5Page24- Future Recommendations 3/5Page 25- Future Recommendations 4/5Page 26- Future Recommendations 5/5
P2: Carry out / P4: Produce

Contents: Appendices
Page 27- Appendices Title PagePage 28- Appendices 1- Screenshot of Squawka.Page 29- Appendices 2- Screenshot of Data Collection sheet.
P2: Carry out / P4: Produce

Contents: Figures and Tables
Page 30- Figures and Tables Title Page. Page 31- Figures and Tables 1- Screenshot of Spearman rank and graph, excel spread sheet. Page 32- Figures and Tables 2- Screenshot of final scatter graph, with a line of best fit. Page 33- Figures and Tables 3- Screenshot of Spearman rank correlation order calculations, taken from excel.
P2: Carry out / P4: Produce

Acknowledgements
I would like to acknowledge Paul Cox, who’s consistent perseverance with me and effort towards lesson plans, made my project possible. Matthew Smith, who I have worked with on a number of occasions on our projects, aiding each other when needs be.
P2: Carry out / P4: Produce

IntroductionThe aim of my project is to see if there is a correlation, whether it be positive or negative, between the average height of a Barclays Premier League teams defence, including players who featured in ten or more games, affect the amount of goals that they conceded that season.
I chose this aim as I saw it had a lot of potential to explore different avenues with the research, I also couldn’t find any research that mirrored mine exactly, so as far as I was aware it was a completely new research project. Football is also a great interest of mine, so I could be passionate about my research, which helped me to carry it out. The type of data collection I would’ve had to carry out was all desk research, which is again the type of collection I am most fond to. So there were just positives in my eyes, to carrying out the research.
The timescale of the research was over the course of a Premier League season, so I had a balanced set of statistics to look at, with a balanced number of players, per team to look at. I chose a past season, due to the fact that the current one is on going and wouldn’t of been finished. The timescale was February the 16th to the 27th of March, this is the time that I had to gather my data and come to my conclusion.
P2: Carry out / P4: Produce

Literature Review and References
https://worthingsportscience.wordpress.com/2015/02/26/unit-5-literature-review-jordan-core/
P2: Carry out / P4: Produce

Project Hypothesis
I believe that after I have gathered all of my data and I have analysed it in detail, that I will find a correlation between the average height of a Barclays Premier League defence, counting players who featured in over ten games or more and the amount of goals that their team concedes. Due to the fact that taller defenders, are usually stronger and better in aerial battles, meaning their team will concede less goals due to this.
P2: Carry out / P4: Produce

Method1.The only person carrying out this data is me and nobody else, I single handily compiled it and put together the research project. 2.I began by setting up a data collection sheet, this enabled me to take down all of my research per team, giving me sufficient room for calculations to take place, players names to be written, heights to be written and appearances to be written down. So all of it can be written down, in order to analyse. 3.I then made it a priority to gather the necessary equipment that I needed, gathering a pencil, rubber, pen and a calculator, so I was prepared to take all the information down. 4.After I had collected all the equipment, I started to take down the information after I found a credited and a reliable website. I settled for Squawka.com, these are trusted and reliable football statistician throughout football. I then took down all of the results. 5.Starting off with Arsenal and working down in alphabetical order, finding all of the players who featured in ten or more games over the course of the season. I then took these players and found out their height in cm. 6.Still on Squawka.com, I looked at the teams themselves, taking down the amount of goals they conceded, home, away and in total. 7.After this had been completed, I totalled up the averages, by adding all the heights of those who featured in ten or more games and then divided the sum by how many of them there were. 8.After completing these simple steps I then had the data, however I needed a visual representation of what I had collected. So I put my findings into excel; with a average height, team and goals conceded column, using graph wizard to create my graph.
P3: Collect and record / M2: Correctly analyse & describe techniques / D1: Correctly analyse & explain techniques

Data CollectionAll of the data that I collected was secondary, as I was using data previously published on a statistics website and I used it to form rationales, for my research to support or counter my findings. The website I used was of course, www.Squawka.co.uk, (See Appendix 1).I was taking statistics from the website in my own way, using it as research and then decided whether it was going to support my research or counter act my research. My data is Ordinal, due to the fact that the ranked data gives no indication of difference between levels, until I further analyse it. It shows who is best and who is second best etc., in a ranked order, however until further analysis is conducted I wont have any indication as to why. Its also continuous as it is data that has numerical data, as its goals conceded in total, at home or away. The collection method I used was all desk based research. Sitting at a computer, with my data collection sheet (See appendix 2) , pen and a calculator. Collecting my statistics and then working out what they confirm. It was mainly mathematic equations and spending long periods of time taking down all the statistics and working out formations. Desk research is the research method I tend to find most interesting as it allows me to apply IT skills with research skills. My data was all quantitative, as it was purely numerical, in the shape of goals being conceded, total, home and away, average heights and heights of individuals. This meant when I was sorting my data it was much easier, as I was able to use ranking and then display it using Spearman rank order correlation.
P3: Collect and record / M2: Correctly analyse & describe techniques / D1: Correctly analyse & explain techniques

Data AnalysisTo organise my data I used a rank order distribution which is placing my data into an ordered list, from lowest to highest in a single column, I did so in excel in preparation for the creation of my graphs. I collected this data via desk research, looking at two variables, one being the average height of each Premier League teams defence in the 2013/2014 season and the other being the amount of goals each team conceded in that time. Then to display my data, after all was put into graphs I used a Spearman rank-order correlation, which is a non-parametric test. I chose to do this as it gives a clear indication as to whether there is a correlation or not, which is key for my research project as I was looking at two variables. Its similar to the Pearson product moment correlation coefficient in its purpose. However, it’s a non-parametric method of display and is used when data is like mine, ordinal (ranked), as the average heights and goals conceded are. Its commonly used when trying to find a relationship between two sets of ordinal data. The first step is two rank the data from highest to lowest, with 1 being the highest. Then determining the difference between the data and the place in the tournament. (See Figures and Tables 1). This then enabled me, on excel to create my Spearmans rank order correlation, giving me a figure which would point in the direction of whether my data did have a link or not. Which would then help mew to discuss my results, so without doing this I wouldn’t of had a figure and would have had to look through all my data and come to a conclusion using my brain and pen and paper, which wouldn’t have been reliable, nor would it have been valid. Using equations on excel, in the form of Spearmans rank-order correlation was the most reliable and valid way to do so, when looking at quantitative data of the ordinal kind, especially when there is two sets of it. As I quoted in my acknowledgements earlier, Paul Cox helped me a great deal when it came to data analysis. As I was fairly uneducated in the field of excel, he helped me to understand how to use it and why it was best for my research project to do so. Describing what I had mentioned above, about the clear correlation figure it gives you at the end of the equations.
P3: Collect and record / M2: Correctly analyse & describe techniques / D1: Correctly analyse & explain techniques

ResultsAfter collection and analysis, I was able to look at my results and see, if indeed the average height of a team, including players who featured in ten or more games, affects the amount of goals a team concedes. After using excel and the Spearman rank order correlation, the results showed that my correlation was negative (See Figures and Tables 3). My Spearmans rank-order correlation was -0.181, meaning there is no correlation what so ever in my experiment. Even if there is a positive it needs to be quite high, as if it shows a weak correlation then there is likely not to be one at all. But a negative correlation, like my research project has shown means there is no correlation what so ever between the average height of a Premier League defence and the amount of goals they concede. Neither does the formation, as I thought the formation would play a part, as teams such as Hull who play five at the back should concede less due to a greater amount of defenders defending but it appeared to play no part as they conceded 53 goals, placing them 12th on the goals rank. The only factors that affected it were the ability of the players, as the teams that finished in the top 6, conceded less goals, due to the ability of the teams and the financial situation of the clubs themselves, as they can afford better defenders. This looks at clubs such as Chelsea who conceded 27 goals, the least in the league which saw them 1st on the goals rank on the excel spreadsheet, averaging less than one goal a game and Manchester City who conceded 37, slightly more than one a game, seeing them at 2nd on the goals rank on the spreadsheet. These teams, may have conceded less as they had the highest transfer spend in the Premier League that season, meaning they could afford defenders of a higher quality than say teams like Crystal Palace. The quality of the coaching staff at the club is also a great deal better, due to the fact that they have the money to employ better staff, so will concede a great deal less amount of goals. So there is no relationship between the average height of a premier league defence, featuring players who appeared in ten or more games and the amount of goals a team concedes. Teams such as Fulham also disprove my hypotheses as they had the 2nd tallest Premier League defence that year but conceded the most amount of goals, 85, seeing them in 20th on the goals rank, Sunderland were also joint 2nd with Fulham in terms of defensive height, conceding 60 goals. This however ties in with the theory that the better the financial situation of the club, the better the coaching staff, the better the quality of player, this should then lead to the team conceding less goals. Crystal Palace, however disprove that, as they are a team who aren’t financially well off but have a manager who focus’s on defending a great deal. As they are 15th on the height rank with an average height of 182cm, conceding 48 goals, less than top six clubs Tottenham and Liverpool, being 8th on the goals rank.
P3: Collect and record / M2: Correctly analyse & describe techniques / D1: Correctly analyse & explain techniques

DiscussionAfter I collected my data, for each team in the 2013/2014 season, I had a formation that they fielded all season long, the amount of goals they’d conceded at home and away, then totalling them, I also had the height of ever defender who featured in ten or more matches and the average between them. So I was able to come to a conclusion, that the average height of a premier league defence, of players who played ten games or more, does not affect the amount of goals they conceded over the course of the 2013/2014 season. I came to this conclusion by analysing all of my results and seeing no noticeable pattern. There were lots of teams like Aston Villa with an 184cm average height who conceded 61 goals across the course of the season. Another team like this was Fulham, who had a very high average of 186cm but conceded 85 goals. Other teams that followed this pattern were Stoke, with an average of 186cm, conceding 52 goals and Sunderland with an average of 186cm conceding 60 goals and West Bromwich Albion who had an average height of 187cm, conceding 59 goals. Then there were teams with lower average heights conceding far fewer amount of goals, Arsenal with a average height of 183cm, conceding only 41 goals, Everton with an average height of 182cm, conceding just 39 goals over the course of the season, however their formation could have something to do with this as they play five at the back, so allowing more defenders in their half defending and defending set pieces could aid them. But there were a few tall defences in the cases of the Manchester clubs, that conceded few goals, Manchester City, conceding just 37 with an average height of 184cm and Manchester United with an average height of 185cm, conceding 43 goals. Its evident that there was no pattern established and its just down to the ability of the players and the coaching staff, as some tall defences were conceding 50+ goals, some short defences were conceding between 35 and 45 but some tall defences were also conceding between 35 and 45. It was also evident that the height of the fullbacks of the team dragged the teams average down, as fullbacks play a very attacking role in modern football so are required to be short, fast and have attacking ability. The height of the centre back’s was commonly over 185cm with fullbacks being around 178cm.
P2: Carry out / P4: Produce

ConclusionMy aim was to see if there was a correlation, whether it be positive or negative, between the average height of a premier league defence, looking at players who featured in ten or more games and the amount of goals a team conceded in the 2013/2014 season. The key trends I saw from my literacy review focused around the research that took place into seeing how physiological factors affected development of players or how players felt and performed in their sport. There was no trends that looked at linking variables, looking for a correlation, solely with quantitative research. Also none looked at my specific league, being the Barclays Premier League in the season that I targeted, 2013/2014. However I was quite lucky to have found a few that look at premier league football, such as (Michael Bailey 2012) and (Miller 2009). The ones that aren’t looking at football are looking at physiological factors, I am also looking at a physiological factor, being height like (Maria Gil 2007) looked at the selection of young players based on physiological factors. However there are evident differences in the factors that I have chosen for example some look at different sports to football, such as basket ball. The physiological factors some of the studies look at, are also different to height, as (Miller) is looking at body composition and the impacts this has.My results however do not support my hypotheses, as I believed there would be a correlation between my two variables, however there wasn’t one which was disappointing. After doing the spearman rank correlation and seeing that there was a negative link and using my eyes on my data collection sheet (See Appendix 2) to see if I could see evident links. However there were too many teams, that had high average heights and high amounts of goals conceded, these were often teams that were low ranked in the league standings at the end of the season. The teams that finished in the top six, often conceded below 40 goals and had medium average heights. I believe that my results didn’t support my hypotheses as there were lots more factors that weren’t taken into account, as physiological factors don’t necessarily make a defence work well, I didn’t take into account the coaching staff, goalkeeper height.
P2: Carry out / P4: Produce

Assessment Criteria Pages 19-26
• P5: carry out a review of the research project conducted, describing strengths, areas for improvement and future recommendations.
• M3: carry out a review of the research project, explaining strengths, areas for improvement and future recommendations.
• D2: carry out a review of the research project, justifying future recommendations for further research.

Review (1/3)I feel as though my data collection and analysis, in the research project went very well, better than expected if anything. As before I had no clue how to use excel but after a brief one to one with Paul Cox, he taught me how to use Excel. So I was able to put my data into a Spearman rank correlation order (See Figures and Tables 1). This then gave me a correlation (See Figures and Tables 3) although it was negative, meaning that there was no correlation, the way in which my data was organised and displayed was very good. I also used my own data collection sheet (See Appendices 1) this was good to create and helped me organise all my quantitative data in one place, so I could carry out equations and then transfer it all into excel to create a Spearman rank correlation order. I thought this went particularly well, as I carried it out efficiently and whilst I was focused on task. It was all carried out to a high standard and the results reflect that.
P5: Describe / M3: Explain / D2: Justify

Review (2/3)I believe that the original aim I chose was a strength to my research project. As my knowledge of Premier League football is very vast as it happens, so when researching and collecting data it was only increasing. The research project aim, was relatively vague also which gave me lots of avenues to explore, such as formations, league positions, style of play etc. It also leaves me plenty of room to investigate next time I conduct it, as I can investigate for longer periods of time and expand the leagues I am looking at. The study was also looking at two variables, so I was able to draw comparisons which gave me more to discuss and more of my knowledge to build on. This helped when it came to analysing data and transferring it into graphs (See Figures and Tables 2). I believe if I would have chosen another question, I could have struggled a great deal. My prior knowledge made the research project a great deal easier than if I were to chose another sport all together, as I would have had to educate myself on the sport prior to carrying out research and collecting data.
P5: Describe / M3: Explain / D2: Justify

Review (3/3)
I believe that my scope was relatively quite limited, as I constricted it to a specific season, being 2013/2014 and one league, being the BPL. I could have broadened my scope, including the main 4 leagues in England, opening it up to the UK, including some SPL teams. Then going abroad, looking at the top five leagues around Europe. I could've lengthened the time period of my data collection to longer than a season, so its likely to develop more of a trend and show more of a correlation, than if I were to do it for the length of a season as I did. So if all variables and elements were to get larger and longer, the data pool gets larger which makes my research project better over all.
P5: Describe / M3: Explain / D2: Justify

Future Recommendations (1/5)If I were to carry out my research project again I would change the way that I collected my data, not changing the desk research but changing the way that I recorded my data. As I created my own data collection sheet for this research project, writing down the data that I collected in free hand, which was time consuming, recording results from www.Squawka.co.uk and writing them down and then transferring the written onto a spreadsheet. Where as if I were to create a spreadsheet prior to my research, that would calculate the average height of the defence per team. Then I would be able to move this data into another spreadsheet on the Spearmans rank-order correlation. So I could get an immediate result. Doing this would save an awful lot of time and increase the reliability of the research, as when I am writing my own data down, the margin for error is higher than it would be if I was carrying it from a website to a spreadsheet, as with paper it has to be transported one less place, reducing the margin for error and increasing the validity of the research, as well as the reliability of the research as a whole. This would also give me more time to analyse my data and look at my results in more detail, so I would be able to come to a better conclusion.
P4: Produce / P5: Describe / M3: Explain / D2: Justify

Future Recommendations (2/5)If I were to do the research again I would look at the rest of 3 major leagues in England, the nPower Championship, League 1 and League 2. Seeing if the average height of defences in these leagues, as well as the Premier League affect the amount of goals conceded. As the BPL is the highest footballing standard out of the 4, the other leagues rely a lot on physicality of defenders, as they tend to lack ability. So if I look at the four leagues then I am able to see more of a trend. Seeing if height affects the amount of goals conceded to a higher degree in the lower 3 leagues, as they rely an awful lot on physiological factors to be an efficient defence. This would increase the reliability and validity of my research, as I would have taken into account the major 4 leagues in England, as opposed to just looking at one league, to draw conclusions from my research. As this is still reliable research but if I am looking at the question as a whole, seeing if average heights of defences effect the amount of goals they concede this helps to increase my data pool. If my data pool is bigger then I have more data to draw my conclusions from and this again, increases reliability and validity. This helps also when it comes to drawing results, as I will have more data to talk about, however most of this data is quantitative. So I will use quantitative data analysis to analyse the vast majority of it.
P4: Produce / P5: Describe / M3: Explain / D2: Justify

Future Recommendations (3/5)If I were to carry this research out again I would increase the period of time that I collected the data from. As I only looked at a season, this could have effects on my results. As some teams aren’t consistent throughout seasons and can go through constant changes in a season, such as injuries, managers coming and going and players being signed and bought. All these factors can unsettle a team and could affect the performance of the team as a whole and the defensive unit. For example if a team is buying a new defender from abroad, its going to take a while for him to integrate, learn the language and adapt to the game. If I am monitoring my research over 5 seasons, then all these factors will even out. As most teams go through at least one of the three described factors a season, so they will all average out and increase the reliability and validity of my results as a whole. As a team may have their main two defenders injured for the majority of a season, they are going to concede more goals than they would say the season after. So increasing the time period helps to get a more reliable set of data, as all injuries, managerial changes and signings are averaged out.
P4: Produce / P5: Describe / M3: Explain / D2: Justify

Future Recommendations (4/5)If I were to carry my research my research out again, I would look at European leagues. This gives me an element of geographical diversity in my testing, which yet again increases my data pool. Again giving me a great source for comparison, it also allows me to look further into my research, seeing if different countries and their footballing leagues defences, goals conceded are affected by the average height of their leagues defences. As different countries tend to have different styles of play, some require a team that is very physiologically advanced, whereas some require technically gifted players in leagues such as Liga BBVA. It gives me a great source for comparison and justification, when it comes to finding out my results. It gives the research a greater sense of creditability as I am looking at other leagues in other countries, not just focusing on the English game, which makes my study more ethical also. Giving it a wider reach. Increasing the reliability of my research, as I am taking into account other regions, the over all acceptance of my research, amongst the footballing world, as they are more inclined to look at research covering more than one country, rather than just on in particular.
P4: Produce / P5: Describe / M3: Explain / D2: Justify

Future Recommendations (5/5)I would also change the environment I conducted the research in. I would seclude myself and work intensively, in a quiet environment for the full data collection of my research project. To ensure that all of my data is correct, as I feel like this research project, I often worked in the company of people in a close environment, which I feel that may have compromised the validity and reliability of my results. If I were to have conducted them with no distractions what so ever, then they would be perfect. Especially if I was looking at other leagues, other countries for longer periods of time than a season, it will benefit my study, research and data if I am doing so not distracted. This would increase the validity and reliability of the study a great deal. Making the study more creditable. If I am able to work alone, in an environment where I work best its only going to increase the reliability and validity of the research as the quality of the work, as it’ll be at my optimum due to the environment its conducted in. My concentration is going to need to be at a much higher level due to the fact that the time period is increasing and the geographical reach is expanding.
P4: Produce / P5: Describe / M3: Explain / D2: Justify

Research Project Appendices

Appendix 1

Appendix 2

Research Project Figures and Tables

Figures and Tables 1
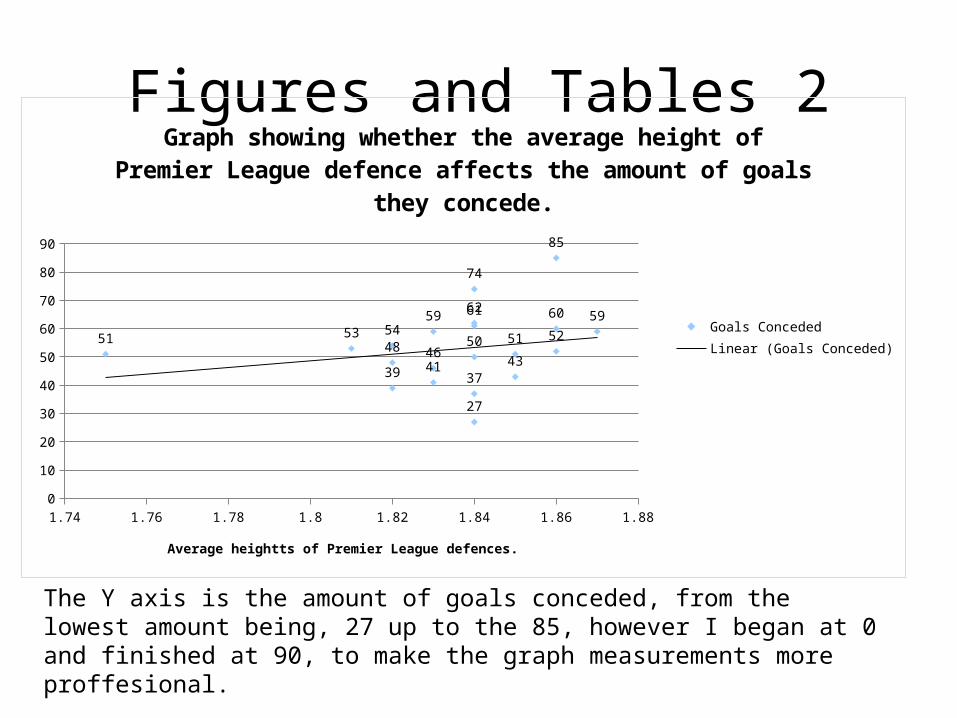
Figures and Tables 2
The Y axis is the amount of goals conceded, from the lowest amount being, 27 up to the 85, however I began at 0 and finished at 90, to make the graph measurements more proffesional.
1.74 1.76 1.78 1.8 1.82 1.84 1.86 1.880
10
20
30
40
50
60
70
80
90
27
3739 41 434648 5051 51 5253 5459 59606162
74
85
Graph showing whether the average height of Premier League defence affects the amount of goals they concede.
Goals ConcededLinear (Goals Conceded)
Average heightts of Premier League defences.

Figures and Tables 3