Embed Size (px)
Citation preview

UniCredit Italian Financials Debt Conference Mirko Bianchi, UniCredit Group CFO
Milan 4th October, 2017

Disclaimer
This Presentation may contain written and oral “forward-looking statements”, which includes all statements that do not relate solely to historical or current facts and which are therefore inherently uncertain. All forward-looking statements rely on a number of assumptions, expectations, projections and provisional data concerning future events and are subject to a number of uncertainties and other factors, many of which are outside the control of UniCredit S.p.A. (the “Company”). There are a variety of factors that may cause actual results and performance to be materially different from the explicit or implicit contents of any forward-looking statements and thus, such forward-looking statements are not a reliable indicator of future performance. The Company undertakes no obligation to publicly update or revise any forward-looking statements, whether as a result of new information, future events or otherwise, except as may be required by applicable law. The information and opinions contained in this Presentation are provided as at the date hereof and are subject to change without notice. Neither this Presentation nor any part of it nor the fact of its distribution may form the basis of, or be relied on or in connection with, any contract or investment decision. The information, statements and opinions contained in this Presentation are for information purposes only and do not constitute a public offer under any applicable legislation or an offer to sell or solicitation of an offer to purchase or subscribe for securities or financial instruments or any advice or recommendation with respect to such securities or other financial instruments. None of the securities referred to herein have been, or will be, registered under the U.S. Securities Act of 1933, as amended, or the securities laws of any state or other jurisdiction of the United States or in Australia, Canada or Japan or any other jurisdiction where such an offer or solicitation would be unlawful (the “Other Countries”), and there will be no public offer of any such securities in the United States. This Presentation does not constitute or form a part of any offer or solicitation to purchase or subscribe for securities in the United States or the Other Countries. Pursuant the consolidated law on financial intermediation of 24 February 1998 (article 154-bis, paragraph 2) Francesco Giordano, in his capacity as manager responsible for the preparation of the Company’s financial reports declares that the accounting information contained in this Presentation reflects the UniCredit Group’s documented results, financial accounts and accounting records. Neither the Company nor any member of the UniCredit Group nor any of its or their respective representatives, directors or employees accept any liability whatsoever in connection with this Presentation or any of its contents or in relation to any loss arising from its use or from any reliance placed upon it.
2

Transform 2019 update
Asset quality
Capital position
Funding & Liquidity
4
5
6
2Q17 P&L results 3
2
1 UniCredit at a glance
7
Concluding remarks
Agenda
3
8
NPE evolution in the Italian banking sector
UniCredit at a glance
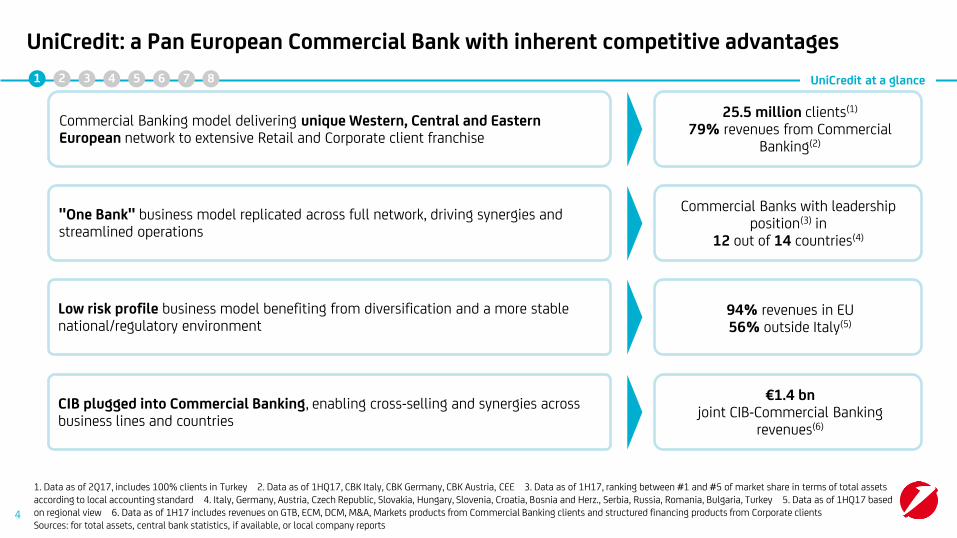
UniCredit: a Pan European Commercial Bank with inherent competitive advantages
Commercial Banking model delivering unique Western, Central and Eastern European network to extensive Retail and Corporate client franchise
25.5 million clients(1) 79% revenues from Commercial
Banking(2)
"One Bank" business model replicated across full network, driving synergies and streamlined operations
Commercial Banks with leadership position(3) in
12 out of 14 countries(4)
CIB plugged into Commercial Banking, enabling cross-selling and synergies across business lines and countries
€1.4 bn joint CIB-Commercial Banking
revenues(6)
Low risk profile business model benefiting from diversification and a more stable national/regulatory environment
94% revenues in EU 56% outside Italy(5)
1 2 3 4 5 6 7
1. Data as of 2Q17, includes 100% clients in Turkey 2. Data as of 1HQ17, CBK Italy, CBK Germany, CBK Austria, CEE 3. Data as of 1H17, ranking between #1 and #5 of market share in terms of total assets according to local accounting standard 4. Italy, Germany, Austria, Czech Republic, Slovakia, Hungary, Slovenia, Croatia, Bosnia and Herz., Serbia, Russia, Romania, Bulgaria, Turkey 5. Data as of 1HQ17 based on regional view 6. Data as of 1H17 includes revenues on GTB, ECM, DCM, M&A, Markets products from Commercial Banking clients and structured financing products from Corporate clients Sources: for total assets, central bank statistics, if available, or local company reports
4
8

Strong competitive advantage across countries and products
Strong local Commercial Bank
Best-in-class CIB product provider
Rank by assets in Europe(2)
2
3
1
Germany
Austria
CEE 1
Italy
# clients, m(1)
1.6
1.7
8.8
13.4
Revenues by geography(4)
EMEA rankings(5)
EMEA Bonds in Euro by # of transactions(5) 1
1 Syndicated Loans in Austria (5)
1 Syndicated Loans in Italy (5)
1 Syndicated Loans in Germany (5)
Five-Star Cash Manager in Western Europe and CEE in 2017(7)
Best Trade Finance Provider in Western Europe and CEE in 2017(6)
1. Data as of 2Q17, includes 100% clients on Turkey 2. Data as of FY16, for Austria domestic assets as of end of 2015 on local GAAP (source OeNB), for Germany only private banks; for CEE compared to Erste, KBC, Intesa Sanpaolo, OTP, RBI, Société Générale (data as of FY16) 3. Data as of 1H17; peers includes: BNP Paribas, Deutsche Bank, Intesa Sanpaolo, Santander, Société Générale 4. Data as of 1H17 based on Regional view 5. Dealogic, as of 30 June 6. Source: EuroMoney Trade Finance Survey 2017 7. Source: EuroMoney Cash Management Survey
"Go to" bank for European "Mittelstand" Corporates
Loans to corporates in EU zone, €bn(3)
Awards
1 2 3 4 5 6 7 UniCredit at a glance
21%
26%
9% 44% Italy
CEE
Austria
Germany
5
Peer 3
Peer 2
UniCredit
Peer 1
Peer 5
Peer 4
8

Agenda
6
UniCredit at a glance
Asset quality
Capital position
Funding & Liquidity
4
5
6
2Q17 P&L results 3
1
2 Transform 2019 update
7
Concluding remarks 8
NPE evolution in the Italian banking sector

UniCredit key targets
2015 2017 2Q17
Revenues(1) €20.4bn
CET1 FL ratio 10.4% >12.0% >12.5% 12.80%
Group Bad Loan Coverage 60.6% >65% >63% 66.5%
Cost of Risk 89bps 65bps 49bps 50bps
Cost €12.2bn €11.7bn €10.6bn
RWA(2) €361bn €389bn €404bn €351bn
Group UTP Coverage 34.2% >38% >38% 43.6%
Group NPE Coverage 50.8% >54% >54% 56.3%
Non Core Net NPE €24.8bn €11.4bn €8.1bn €12.8bn
Non Core NPE Coverage 52.4% >56% >57% 57.0%
Net income €4.7bn €1.5bn
Cost/income <52% 61.6%
1. Revenues 2015-2019 CAGR at 0.6% 2. CMD perimeter Note: All 2015 figures restated assuming new Group perimeter; Plan assumes a cash dividend with 20% payout
Group Gross NPE Stock €44.3bn €77.8bn €53.0bn
Group Net NPE Stock €20.2bn €38.3bn €23.2bn
1 2 3 4 5 6 7
RoTE(2) 4% >9% 8.2%
Transform 2019 update
58.9%
€2.9bn
€945m
€4.9bn €19.9bn
1H17
12.80%
55bps
8.7%
59.3%
€5.7bn
€1.9bn
€9.7bn
7
2019
8

STRENGTHEN
AND OPTIMIZE CAPITAL
IMPROVE ASSET
QUALITY
• Bold actions taken: disposals of Pioneer, Pekao and 30% of Fineco
• €13bn rights issue successfully executed
• Decisive actions to address Italian legacy issues
• Strengthened coverage ratio
• Further tightened risk discipline
Significantly strengthened capital position with a solid fully loaded CET1 ratio at 12.80% in 2Q17 after successful Pekao disposal (72bp)
Additional benefit in 3Q17 from Pioneer disposal (84bp)(1)
Gross NPE reduced to €53.0 bn, with coverage ratio increased to 56.3% in 2Q17
Improved expected loss on performing stock(2), from 0.43% in 4Q16 to 0.39% in 2Q17, 0.35% on new production
Disposals of 1.5bn gross NPE portfolios in 2Q17 at Group level(3)
Disposal of majority stake of FINO to be closed in 3Q17
CET1 ratio >12.5%
NPE Coverage >54%
Net NPE ratio 4%
Cost of Risk 49bps
1 2 3 4 5 6 7 Transform 2019 update
Transform 2019 execution on track, delivering tangible results (1/2)
8
1. Expected to be largely offset by higher RWA in 2H17 (due to business growth, model changes and procyclicality) and IFRS9 from Jan-18 2. Impact of procyclicality and model changes in 2H17 envisaged at c.4bp for the Group and c.12bp for CBK Italy (preliminary estimates based on 30 June figures) 3. €0.9bn in the Non Core and 0.6bn in the Group excluding Non Core (o/w €0.4bn already classified under held for sale in 1Q17)
5 Strategic Pillars 2019 Target Achieved
8

Achieved 5 Strategic Pillars
TRANSFORM OPERATING
MODEL
• Transformation of operating model to a sustainable lower cost structure
• Improve customer focus, services & products
• €1.6 bn IT investments(1) to support business transformation
c.6,000 FTEs reduction since Dec-15, 42% of c.14,000 target. FTEs down by 1,135 Q/Q
464 branch closures since Dec-15 in Western Europe, 49% of 944 closures target
New organization in place from January 2017 with key IT external hires
€1.7 bn net cost savings by 2019
C/I ratio <52%
MAXIMIZE COMMERCIAL BANK VALUE
• Leverage on CIB leadership
• Increase CEE client penetration
• Enhance cross-selling across business lines and countries
€856 bn TFA
Additional €363 m joint CIB-Commercial Banking
revenues(3)
Ranking #1 in “Syndicated Loans” in Italy, Germany and Austria”, #2 in “Syndicate Loans in CEE” and #1 in “EMEA All Bonds in Euro” by number of deals(2)
New partnership with Apple Pay
Strong focus on multichannel approach
ADOPT LEAN
BUT STEERING CENTER
• Effective steering Group Corporate Center
• KPIs to drive performance and accountability
• Leaner support functions and transparent cost allocation
Weight of Group Corporate Center on total costs from 5.1% to 2.9%
by 2019
Tangible results in 2Q17, with FTEs down by 7.6% and costs down by 8.8% in 1H17 vs. 1H16
1. Excluding €0.7 bn investments to fulfill regulatory demand in 2017-19 2. Dealogic, as of 30 June 3. Includes revenues on GTB, ECM, DCM, M&A, Markets products from Commercial Banking clients and structured financing products from Corporate clients
944 branch reduction in Western Europe
1 2 3 4 5 6 7 Transform 2019 update
9
Transform 2019 execution on track, delivering tangible results (2/2)
2019 Target
8

Agenda
UniCredit at a glance 1
Transform 2019 update 2
3 2Q17 P&L results
10
Asset quality
Capital position
Funding & Liquidity
4
5
6
7
Concluding remarks 8
NPE evolution in the Italian banking sector

2Q17 P&L results 1 2 3 4 5 6 7
1. One-offs in CBK Germany: release of a tax provision on net interest (+90m) and net effect of release of provisions on income tax (+80m) 2. Normalized trading at 1.4bn to 1.5bn on a yearly basis. 1Q17 benefitting from some large client driven transactions; 2Q16 one-offs: security disposal gain (+132m), Visa Europe disposal gain (+246m)
NB: net profit at 1.3bn in 2Q17 exc. Pekao disposal (+38.4% Q/Q and +94.1% Y/Y)
Group – Net profit in 2Q17 supported by strong fee generation, cost containment and risk discipline
11
Key drivers
• Net interest in 2Q17 positively impacted by the release of a tax provision on net interest in CBK Germany (+90m(1)); commercial trend impacted by lower customer rates, in line with expectations
• Strong fee generation with all categories improving
• Trading income above normalized level(2)
• Costs continued to decrease supported by lower FTEs and branch reductions
• LLPs decreased resulting in CoR of 50bp, with positive asset quality trends. Revised guidance CoR at low 60s bp for 2017
• Full impairment of remaining stake in Veneto banks through Atlante 1 for 135m
• Net profit from discontinued operations including contribution from Pioneer (+74m) and embedding negative currency effect related to Pekao disposal (-310m)
Data in m
Total revenues 5,262 4,833 4,855 +0.4% -7.8% 9,937 9,688 -2.5%
o/w Net interest 2,670 2,564 2,652 +3.4% -0.7% 5,301 5,216 -1.6%
o/w Fees 1,401 1,481 1,507 +1.8% +7.6% 2,818 2,988 +6.0%
o/w Trading 860 590 462 -21.7% -46.2% 1,197 1,053 -12.0%
Operating costs -2,982 -2,886 -2,858 -1.0% -4.2% -5,958 -5,744 -3.6%
Gross operating profit 2,280 1,947 1,997 +2.6% -12.4% 3,979 3,944 -0.9%
Loan loss provisions -884 -670 -564 -15.8% -36.1% -1,644 -1,235 -24.9%
Net operating profit 1,397 1,277 1,433 +12.2% +2.6% 2,335 2,709 +16.0%
Other charges & provisions -477 -463 -135 -70.9% -71.7% -858 -598 -30.3%
o/w Systemic charges -259 -434 -19 -95.6% -92.6% -615 -453 -26.3%
Profits on investments 0 24 -174 n.m. n.m. -18 -149 n.m.
Profit before taxes 837 833 1,117 +34.1% +33.4% 1,125 1,950 +73.3%
Income taxes -153 -212 -134 -36.8% -12.5% -339 -346 +2.0%
Net profit from discontinued
operations379 376 79 -79.0% -79.1% 778 456 -41.4%
Net profit 916 907 945 +4.2% +3.3% 1,321 1,853 +40.2%
1H16 1H17∆ % vs.
1H162Q16 2Q17
∆ % vs.
2Q16
∆ % vs.
1Q171Q17
8

Group – Resilient recurring revenues underpinned by solid NII and strong fee generation
2Q17 P&L results
Fees & commissions proforma(4), m Net Interest(1), m
1,003 1,097
634 715 729
1,284 1,444
550547507
459 443 448
892944
+7.9%
1.3%
+6.3%
1H17 proforma
3,433
1H16 proforma
3,231
2Q17 proforma
1,727
1Q17 proforma
1,705
2Q16 proforma
1,600
1. Contribution from macro hedging strategy on non naturally hedged sight deposits in 2Q17 at 378m, -2m Q/Q and -15m Y/Y 2. Net interest margin calculated as interest income divided by earning assets minus interest expenses divided by earning liabilities 3. Considering one-off of net interest on tax refund in CBK Germany 4. Managerial figures. Proforma data excluding the temporary effect of Pioneer & Pekao classified under IFRS5. Baseline proforma data excluding the temporary effect of Pioneer & Pekao classified under IFRS5 and non commercial items fees
• Commercial trend of net interest impacted by loan dynamics in a competitive environment
• Guidance of underlying net interest for 2017 confirmed at around 10.2bn
• Strong fee generation in 2Q17, with all categories improving
Investment fees
Financing fees
Transactional fees
Net interest margin(2)
1.33% 1.36% 1.42%
-0.33%
(-2bp Q/Q)
Average Euribor 3M
1,507 1,401 1,481 Fees stated
1 2 3 4 5 6 7
(3)
5,2165,301
2,670 2,6522,564
-0.7%
+3.4%
-1.6%
1H17 1H16 2Q17 1Q17 2Q16
2,988 2,818
12
8

1. One-offs related to security disposal gain (+132m) and Visa Europe disposal gain (+246m) 2. Figures include dividends and equity investments. Turkey contribution at equity based on divisional view. Balance of other operating income/expenses at +50m in 2Q17 (+28m in 1Q17, +37m in 2Q16) 3. Collateral valuation adjustment (OIS), Credit Value Adjustment (CVA) and Funding Valuation Adjustment (FVA)
1 2 3 4 5 6 7
Group – Trading income in 2Q17 above normalized level benefitting from customer driven
activities. Turkey resilient and other dividends up Q/Q
2Q17 P&L results
13
Dividends(2), m Trading income, m
401
497 353
641
849
204556459
-46.2%
-21.7%
-12.0%
1H17
1,053
1H16
1,197
2Q17
462
110
1Q17
590
94
2Q16
860
148
79 97
288
176
218 1778691147
-37.9%
+7.7%
-30.3%
1H17
353
1H16
507
2Q17
183
1Q17
170
2Q16
295
Turkey (at equity) Other dividends and equity investments
Client driven
Other trading
• Trading income in 2Q17 above normalized level, benefitting from customer driven activities
• Client driven trading includes value adjustments(3) equal to +23m in 2Q17 (-58m in 1Q17 and +47m in 2Q16)
• Turkey's contribution resilient Q/Q, down Y/Y mostly on currency effect
• Other dividends up Q/Q thanks to shareholdings in Austria and insurance JVs in Italy, Y/Y trend impacted by lower dividends by minority participations
481m adjusted(1)
120m exc. Visa Europe
8

Group – 4,543 FTE reduction and 398 branch closures Y/Y supporting lower costs
C/I adj (1)
1. C/I adjusted for the temporary effects of reclassification of Pekao and Pioneer under IFRS5 and for 405m non recurring revenues in 2Q16. C/I stated at 58.9% in 2Q17, 59.7% in 1Q17, 56.7% in 2Q16, 59.3% in 1H17 and 60% in 1H16 2. Branch figures consistent with CMD perimeter
Costs, m FTEs Branches(2)
• Costs down Y/Y and Q/Q, confirming 2017 guidance of 11.7bn
1 2 3 4 5 6 7
• FTEs reduced by 1,135 Q/Q, c.6,000 since Dec-15 (42% of 14,000 target)
• Branches down by 154 Q/Q, 464 since Dec-15 (49% of 944 target closures in Western Europe)
Q/Q Q/Q
2Q17 P&L results
14
+0.2%
-1.6%
CEE
W.E.
-4,543
-1,135
2Q17
95,288
71,064
24,224
1Q17
96,423
75,595
24,236
72,246
24,177
2Q16
99,831
-154
-398
W.E.
CEE
2Q17
5,109
3,345
1,764
1Q17
5,263
3,470
1,793
2Q16
5,507
3,632
1,875
-3.6%
-1.6%
-4.2%
-1.0%
-3.6%
1H17
5,744
1H16
5,958
2Q17
2,858
1Q17
2,886
2Q16
2,982
58.9% 57.0% 56.2% 59.8% 56.6%
8
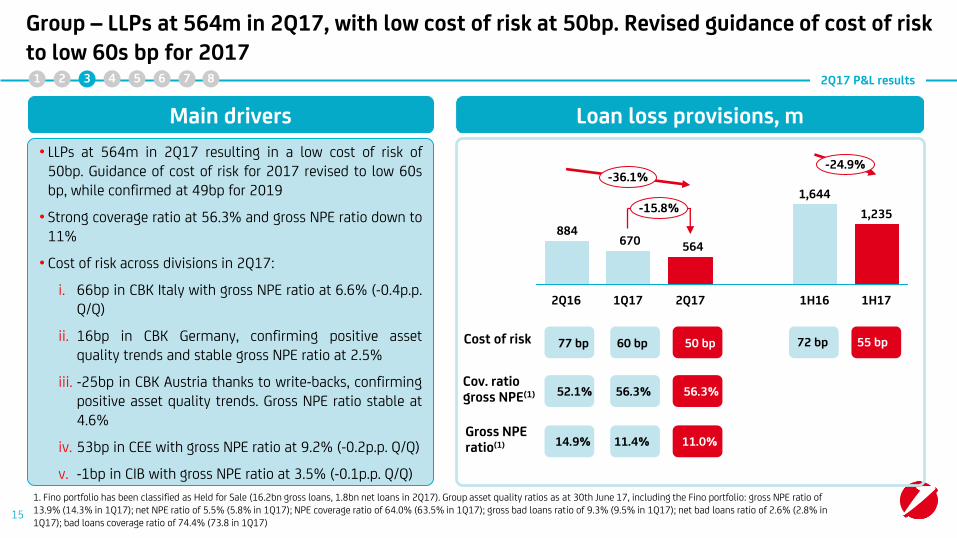
Group – LLPs at 564m in 2Q17, with low cost of risk at 50bp. Revised guidance of cost of risk to low 60s bp for 2017
1. Fino portfolio has been classified as Held for Sale (16.2bn gross loans, 1.8bn net loans in 2Q17). Group asset quality ratios as at 30th June 17, including the Fino portfolio: gross NPE ratio of 13.9% (14.3% in 1Q17); net NPE ratio of 5.5% (5.8% in 1Q17); NPE coverage ratio of 64.0% (63.5% in 1Q17); gross bad loans ratio of 9.3% (9.5% in 1Q17); net bad loans ratio of 2.6% (2.8% in 1Q17); bad loans coverage ratio of 74.4% (73.8 in 1Q17)
2Q17 P&L results 1 2 3 4 5 6 7
15
Loan loss provisions, m
Cost of risk
Cov. ratio gross NPE(1)
Main drivers
Gross NPE ratio(1)
• LLPs at 564m in 2Q17 resulting in a low cost of risk of 50bp. Guidance of cost of risk for 2017 revised to low 60s bp, while confirmed at 49bp for 2019
• Strong coverage ratio at 56.3% and gross NPE ratio down to 11%
• Cost of risk across divisions in 2Q17:
i. 66bp in CBK Italy with gross NPE ratio at 6.6% (-0.4p.p. Q/Q)
ii. 16bp in CBK Germany, confirming positive asset quality trends and stable gross NPE ratio at 2.5%
iii. -25bp in CBK Austria thanks to write-backs, confirming positive asset quality trends. Gross NPE ratio stable at 4.6%
iv. 53bp in CEE with gross NPE ratio at 9.2% (-0.2p.p. Q/Q)
v. -1bp in CIB with gross NPE ratio at 3.5% (-0.1p.p. Q/Q)
564670884
-24.9% -36.1%
-15.8%
1H17
1,235
1H16
1,644
2Q17 1Q17 2Q16
77 bp 60 bp 50 bp
52.1% 56.3% 56.3%
14.9% 11.4% 11.0%
72 bp 55 bp
8
Agenda
Transform 2019 update
2Q17 P&L results 3
2
UniCredit at a glance 1
4 Asset quality
16
Capital position
Funding & Liquidity
5
6
7
Concluding remarks 8
NPE evolution in the Italian banking sector

Asset quality
Non Core - Gross NPE breakdown by origination date
1 2 3 4 5 6 7 1 2 3 4 5 6 7
17
Non Core – Gross NPEs stock by origination date as of 1Q2017, bn
0.6
2013
0.7
2012
1.0
2011 Older 2005
2010
2.0
2009
2.0
2008
5.0
2007
5.0
2006
4.8
2005
2.4
4.0
31.1
1Q17 Total NPE
0.3
1.6
2016
1.0
2015
0.6
2014
16% 66% 18%
8

Asset quality
Clear plan of actions for the Non Core run-down: Our proactive disposal process is on track.
In particular FINO majority stake sold in July and starting of phase 2 in 2H17
Actions of Non Core run down, bn
Gross loans, €bn
-€2.5
-€1.6
-€4.8
-€5.5
-€37.2
1bn performing loans transferred to CBK Italy
Active portfolio management and cost optimization
Mainly driven by Corporate, Small business, Real estate and Mortgages
"Back" to Core
Write-offs
Repayments
Recoveries
Disposals
-€5.0 Cash recoveries on workout and on UTP (to 5% recovery in 2019)
0.9bn in 2Q17, 1bn in 1H17
-€17.7 Disposal of majority stake completed in July. Further reduction below 20% in 2H17 FINO
1 2 3 4 5 6 7 1 2 3 4 5 6 7
-€1.0(3)
-€0.1(4)
-€0.5(7)
-€0.6(6)
1H17 by 2019
-€1.0(5)
18
1. The FINO portfolio, as communicated during the Capital Markets Day, originally amounted to 17.7bn gross loans, which decreased to 17bn as at 31.12.16 thanks to work out activity 2. 15.0bn Bad Loans (32% Corporate, 10% Small business, 1% Old Vintage, 1% Individuals, 29% Mortgages, 27% Leasing), €4.0bn UTP (72% Corporate, <1% Small business, 0% Old Vintage, <1% Individuals, 7% Mortgages, 20% Leasing), and €0.2bn Past Due 3. In 2Q17 4. In 1Q17 5. o/w €0.1bn in 1Q17 and €0.9bn in 2Q17. In 4Q16 additional €1.0bn 6. o/w €0.3bn in 1Q17 and €0.3bn in 2Q17 7. o/w €0.2bn in 1Q17 and €0.3bn in 2Q17
executed
56.4 19.2(2) Gross loans
Net loans
68.2% >57% NPE coverage ratio
Bad loans cov ratio 77.1% >63%
UTP coverage ratio 42.8% >38%
o/w gross NPE
49.7 19.2
-€37.2(1)
Non Core evolution, bn
33.8
57.0%
64.4%
45.2%
29.7
8.1
16.6
22.3
2019 Jun-17 9M2016 Adj
(incl. one-off LLP)
8

Group – Asset quality further improved in the quarter with lower NPE, improved NPE ratios and strengthened coverage ratios Asset quality
15.1% 8.4%
Non performing exposures, bn
24.2 20.2
Coverage ratio
Gross NPE ratio
52.2% >54%
o.w. Gross bad loans, bn
o.w. Gross unlikely to pay, bn
Coverage ratio
Net bad loans
7.9% 4.0% Net NPE ratio
11.0%
56.3%
5.1%
61.4% >63% 66.5%
Net NPE
1 2 3 4 5 6 7 1 2 3 4 5 6 7
-40.80%
-29.2%
2019
44.3
20.2
Jun-17
53.0
23.2
Sep-16
74.8
35.8
-43.1%
-40.2%
2019
28.5
<10.5
Jun-17
29.9
10.0
Sep-16
50.1
19.3
Coverage ratio 34.0% >38% 43.6%
19
-37.8%
-4.1%
2019
14.1
<8.7
Jun-17
21.8
12.3
Sep-16
22.7
15.0
8
Net UTP

Agenda
UniCredit at a glance 1
Transform 2019 update 2
20
NPE evolution in the Italian banking sector 5
2Q17 P&L results 3
Capital position
Funding & Liquidity
4
6
7
Concluding remarks 8
Asset quality

5.7% 9.1% 9.9% 11.2% 13.4% 16.0% 17.7% 18.1% 17.3%
3.4% 4.7% 5.4% 6.3% 7.3% 8.7% 10.0% 10.6% 10.7%
NPE stock showing first signals of decrease after 2015 peak
Note: Source: Banca d'Italia "Financial Stability report" April 2017
39 70 76 83
99 125 139 136 126
86 107
124
141
175 197 210
215
0
5
10
15
20
0
50
100
150
200
250
300
350
400
2016
349
8
2015
360
14
2014
350
13
2013
319
20
2012
261
21
2011
220
13
2010
195
12
2009
167
10
2008
117
9
69
Past Due (€Bn)
Unlikely to pay (€Bn)
Bad Loans (€Bn)
Gross Bad Loans/ Loans to Customer (%)
Gross NPE/ Loans to Customer (%)
21
NPE evolution in the Italian banking Sector
% bn
1 2 3 4 5 6 7 1 2 3 4 5 6 7 8

2016
-7,867
2015
-10,084
2014
-13,024
26,478
55,392
37,482
NPE dynamics show net improvement over the last three years in terms of average default rate and recovery rate
5.2 3.7 2.6 Default Rate1 (%)
Note: 1. Default rate calculated on outstanding stock and inflows to NPE: ratio of inflows to NPE in year t vs outstanding performing stock at the end of year t-1; 2. Cure rate calculated as ratio of outflows to performing vs NPE stock at t-1; 3. calculated as ratio of outflows to performing vs inflows to NPE; Source: Bain, banks included in the sample: UCI, ISP, UBI, MPS, Banco Popolare, BPM, BPER, Gruppo Cariparma, BNL, Credem, Pop Vicenza, Veneto Banca, Carige, Creval, Sondrio
Outflows to performing (m)
Inflows to NPE (m)
Cure Rate (%)2 5.8 4.0 2.9
Outflows/inflows (%)3 23.5 26.6 29.7
Recovery rate (%) 2.9 3.1 3.4
22
1 2 3 4 5 6 7 1 2 3 4 5 6 7 8 NPE evolution in the Italian banking Sector

Recovery rate hit bottom in 2014 and is expected to further improve in coming three years
6.3%
2010 2011
4.8%
2012 2009
3.8%
2013
5.5%
3.2% 2.9% 3.1%
2014 2015 2016
3.4%
2018E
4.1%
2017E 2019E
4.5%
3.8%
Source: Bain, average of top 15 Italian banks, i.e., ISP, UCG, UBI, MPS, Banco Popolare, BNL, BPER, Popolare Vicenza, Veneto Banca, Carige, BPM, Cariparma CA, Creval, Popolare Sondrio, Credem 23
1 2 3 4 5 6 7 1 2 3 4 5 6 7 8 NPE evolution in the Italian banking Sector

Agenda
Transform 2019 update
Asset quality 4
2Q17 P&L results 3
2
UniCredit at a glance 1
24
Funding & Liquidity
5
7
Concluding remarks 8
NPE evolution in the Italian banking sector
Capital position 6

Capital position
CET1 transitional Tier 1 transitional Total capital transitional
€59 bn €61 bn €49 bn €50 bn €45 bn €46 bn
Group – Transitional ratios well above MDA levels
Capital buffer vs MDA requirements is above 400bp
25
MDA as of Jun-17 @10.27% MDA as of Jun-17 @8.77% MDA as of Jun-17 @12.27%
CET1 11.71%
AT1 0.94%
Note: Phase-in of net liability related to Defined Benefit Obligation at 60% in 2017
+1.2pp
Jun-17
12.93%
Mar-17
11.71%
CET1 11.71%
AT1 0.94%
+1.7pp
Jun-17
14.31%
Mar-17
12.65%
+2.0pp
Jun-17
17.25%
Mar-17
15.20%
CET1 12.93%
AT1 1.37%
CET1 12.93%
AT1 1.37%
T2 2.95%
1 2 3 4 5 6 7 1 2 3 4 5 6 7 8

Solid CET1 ratio FL at 12.8% up by 135bp q/q mainly thanks to Pekao disposal, earning generation and RWA dynamics. Target leverage ratio at 5.6% in 2019
1. CET1 FL calculated as FL CET1 Ratio * RWA 2. Total capital FL where available 3. Leverage ratio FL where available
Note: Peers: BBVA, BNP, Commerzbank, CASA, DB, HSBC, ISP, ING Bank, Nordea, SAN, SG
Capital position
26
4.23
Peer3 UCG 2019 Peer8 UCG
5.09 5.60
Peer9
5.70
Peer6
4.70 5.00
Peer7 Peer11
4.60 4.60
Peer5 Peer2
4.20
Peer10 Peer1
3.80
6.80 6.10
Peer4
4.70 Peers Avg.
4.95%
Basel 3 Leverage ratio fully loaded(3) as of Jun-17, %
CET1 capital fully loaded(1) as of Jun-17, €bn
41.1 45.2 50.1
Peer5 Peer6 UCG Peer7
41.4 39.2 24.9
39.7
Peer3
36.6
Peer1 Peer4 Peer2
23.2
67.5 74.6
Peer11
112.7
Peer8 Peer10 Peer9
Total assets
€/bn
Total capital(2) 29.1 31.9 54.4 51.6 56.1 62.1 56.7 60.8 66.6 89.3 93.8 160.4
487 643 1,541 788 862 1,350 702 827 1,569 1,314 2,143 2,181
1 2 3 4 5 6 7 1 2 3 4 5 6 7 8

Agenda
Transform 2019 update 2Q17 P&L results 3
2
UniCredit at a glance 1
Asset quality 4
7 Funding & Liquidity
27
Capital position
5
6
Concluding remarks 8
NPE evolution in the Italian banking sector

Well diversified and centrally coordinated funding and liquidity profile
1. Bosnia and Herzegovina, Bulgaria, Croatia, Czech Republic, Hungary, Romania, Russia, Slovakia, Slovenia, Serbia and Turkey
Local funding and self-sufficiency principle is part of overall Group funding plan while leveraging on local knowledge (well established issuance platform in Germany e.g. Covered Bond/Pfandbriefe)
CEE Banks (11 CEE countries(1))
Western Europe
• UniCredit SpA is operating as the Group Holding as well as the Italian operating bank:
TLAC issuer assuming Single-Point-of-Entry (SPE)
Coordinated Group-wide funding and liquidity management
to optimize market access and funding costs
Diversified by geography and funding sources
Funding & Liquidity
28
1 2 3 4 5 6 7 1 2 3 4 5 6 7 8

68
5
111
Ample Group liquidity buffer
2Q17 strong liquidity buffer Already compliant with key
liquidity ratios
• €180bn liquid assets immediately available, well above 100% of wholesale funding maturing in 1 year
• UniCredit S.p.A. LCR and NSFR >100%
Additional eligible assets available within 12 months(1)
Cash and Deposits with Central Banks
Unencumbered assets (immediately available)
184
180
€bn
LCR NSFR(2)
>100% >100%
1. Unencumbered assets are represented by all the assets immediately available to be used with Central Banks. Additional eligible assets (available within 12 months) consist of all the other assets eligible within 1 year time 2. As of 31 Dec'16
Funding & Liquidity
29
1 2 3 4 5 6 7 1 2 3 4 5 6 7 8

2017-2019 Group Funding Plan
22.9
3.5(2)
14.1
20.0
8.2
10.1
78.7
TLAC funding plan (ex. AT1)
Supranational
Total funding plan
€bn, to be issued over plan period
Covered
Other wholesale M/L term
AT1
Other senior bonds
2017-19 Group Funding Plan
Italy
CEE(1)
Germany
Austria
33.6%
4.0%
19.6%
42.8%
78.7bn
2017-19 Strategy
• Very conservative funding plan given the current regulatory uncertainty to mitigate any execution risk
• Group ML Term funding plan envisages cumulated bond issuances of c. €79 bn with a carefully selected array of debt and capital instruments
• The funding plan has been put in place to ensure that TLAC and MREL requirements are respected over the next three years
• The recent set-up of a $30 bn 144a / RegS Global MTN combined Program will allow the bank to further diversify its funding sources and tap investors globally
• 50% of planned AT1 issuances already executed
by Product by Country
1. Including Turkey at 100% 2. €3.5 bn AT1 planned of which €500 m AT1 already executed in December 2016
Funding & Liquidity
26.4
30
1 2 3 4 5 6 7 1 2 3 4 5 6 7 8

Funding & Liquidity
TLAC (Pillar 1 MREL) issuance plan Over 17% TCR with almost €70 bn of bank capital instruments for 2019
Funding plan based on conservative case - TLAC compliant
2019 assumed TLAC requirements(1) (Pillar 1 MREL) TLAC building blocks Total 26.4bn issuance over
the Plan
4.5% CET1
1.5% AT1
2.0% Tier 2
8% TLAC eligible
instruments
2.5% Capital conservation
buffer
1.0% G-SIBs
19.50%(2)
Subordination requirements
17.0%
2.5% Senior Bond exemption
16.0%
CET1
AT1
Tier 1 ratio
Capital ratio
Tier 2
TLAC ratio + buffers
Old Senior outst. TLAC eligible (€5.6 bn)
Senior bond Funding Plan
Senior non preferred Funding Plan
>12.5%
1.5%
>14.0%
>17.1%
1.4%
3.1%
1.1%
3.3%
>23.0%
Not part of the issuance plan 2.5% of
RWA met with senior bonds
€3.5 bn(3)
€5.0 bn
€4.5 bn
€13.35 bn
1. UniCredit view on current regulations which may be subject to change. Assuming UniCredit as Single Point of Entry (SPE) and all the TLAC instruments have to be issued by UniCredit S.p.A. 2. 21.50% by Jan-2022. Assuming Counter-Cyclical Buffer set at 0%. Plan RWAs 2019 €404 bn vs. €362 bn as of 9M16 presented during CMD 3. €3.5 bn AT1 planned of which €500m AT1 already executed in Dec 2016 31
1 2 3 4 5 6 7 1 2 3 4 5 6 7 8

2017 Medium-Long Term Funding Plan
2017 M/L term funding plan by region
18.5%
3.5%
28.2%
49.8% Italy
Germany
Austria
26.9bn
2017 (Planned)
CEE(1)
1. Including Turkey at 100% 2. As of 15th of September 2017
Italy
Germany
Austria
2017 (Realized)(2)
CEE(1)
TLTROII split by region
CEE
1.9%
Austria
7.8% Germany
24.6%
Italy
65.7%
• Taking also advantage of the last additional TLTROII take-up of c. €24.4 bn during the recent auction in Mar-17, the Group is leveraging on €51.2 bn of TLTROII As of 15th of September, c. 59% or c. €15.9bn of the 2017 Group Funding Plan
is executed
Funding & Liquidity
15.9bn
0.8%
24.4%
35.7%
39.1%
32
Funding & Liquidity 1 2 3 4 5 6 7 1 2 3 4 5 6 7 8

Funding & Liquidity
Ratings Overview
SpA BBB-/Stable/A3(1)
(bbb-)(2)
Baa1/Stable/P2(1)
(ba1)(2)
BBB/Stable/F2(1)
(bbb)(2)
“….on the right track to improve its capital position and asset quality. Evidence of execution on cost savings and the disposal of Non Performing Assets could result in an improvement in its Stand-Alone Credit Profile over the next 12 months”
“...very large capital raising coupled with a reduction in problem loans and increased provisioning coverage places the bank in a better position to meet the challenges of an adverse operating environment in Italy...”
“…the planned recapitalisation, sale of non-performing loans and cost-cutting measures, if achieved, are all positive for creditors”
Issuance Ratings Issuance Ratings Issuance Ratings
UC SpA T2
AT1
OBGI (Ital CB)(5)
OBGII (Ital CB)(6)
BB
nr
A
nr
UC SpA T2
AT1
OBGI (Ital CB)(5)
OBGII (Ital CB)(6)
Ba1
nr
Aa2
Aa2
UC SpA T2
AT1
OBGI (Ital CB)(5)
OBGII (Ital CB)(6)
BBB-
B+
AA
nr
Italy BBB-/Stable/A3(1) Baa2/Negative/P2(1) BBB/Stable/F2(1)
BBB/Develop(3)/A2(1)
(bbb+)(2)
A2(4)/Stable/P1(1) (baa2)(2)
BBB+/Negative/F2(1)
(bbb+)(2)
BBB/Negative/A2(1)
(bbb)(2)
Baa1/Stable/P2(1) (baa3)(2)
BBB+/Negative/F2(1) (bbb+)(2)
1. Order: Long-Term Senior Unsecured Debt Rating / Outlook or Watch-Review / Short-Term Rating / Stable = Stable Outlook; 2. Stand-Alone Rating; 3. Outlook "developing" due to (i) uncertainties around resolution process and (ii) related questions about sustainability of ALAC (Additional Loss-Absorbing Capacity) buffer; 4. Deposit rating shown, while Senior Debt at 'Baa2/Stable/P1'; 5. Soft Bullet; 6. Conditional Pass Through
33
1 2 3 4 5 6 7 1 2 3 4 5 6 7 8

Agenda
Transform 2019 update
Capital position
5
2Q17 P&L results 3
2
UniCredit at a glance 1
Asset quality 4
Funding & Liquidity
6
8 Concluding remarks
34
7
NPE evolution in the Italian banking sector

Concluding remarks
Concluding remarks
35
Transform 2019 execution on track, delivering tangible results
Revenues benefitted from strong business focus, with resilient net interest, strong fee generation and trading above normalized level
Operating costs reduction confirmed thanks to Transform 2019 actions
LLPs at 564m and guidance of CoR for 2017 revised to low 60s bp, while confirmed at 49bp in 2019
Fully loaded CET1 ratio at 12.80%. Additional 84bp in 3Q17 from Pioneer disposal, expected to be largely offset by higher RWA from business growth, model changes & procyclicality in 2H17 and IFRS9
1 2 3 4 5 6 7 1 2 3 4 5 6 7 8