Embed Size (px)
Citation preview

UNCLASSI FIED----.
AD 284 777R4"d~4
ARM ED SERVICES TECHNICAL INFORMAION MUMNCARUINGIN HALL SATIONARLIN(1MY 12, VIRGINIA
UNCLASSIFIED
- I
NOTICE: When government or other drawings, speci-ficationpt or other data are used for ^_nY puzproL-other than in connection with a definitely relstedgovernment procuremnt operation, the U. S.Government thereby incurs no responsibility, nor anyobligation whatsoever; and the fact that the Govern-ment may have fozuilated, furnished, ur in any waysupplied the said drawings, specifications, or otherdata is not to be regarded by implication or other-wise as in any wner licensing the holder or anyother person or corporation, or conveying any rightsor permission to manufacture, use or sell anypatented invention that may in any way be relatedthereto.

~~Pill
Ii ia
~~72-
AMERICAN METEOROLOGICAL SOCIETY'*5--BEACON STREET
BOSTON-8. MASSACHUSETTS
TRANSLATION-OF
THE MECHANICAL PROPERTIES OF ICE
(Mekhanicheskie svoistva l'da)
TF byL
K. F. Voitkovskii L_
Translated
V by
The American Meteorological- SocietyAF Contract 19(604)w6113 and
The Arctic Inistitute of North AmericaAF Contract 19(604)-8343
for Terrestrial- Sciences Laboratories,Air Force Cambridge Research Laboratories.
£Iedford- Massachusetts.
Voitkovskii, K. F_ nekhanicheskie svoistva I'da,Moscow. Izd. Aka' 1emii Nauk SRI, l9uU 1 -pp,
Alit FORCE CAM B11R!DGE RESEARCH LABORATORIES
GEOPHYSICS RESEARCH DIRECTORATE
L G# H-ANSCOM FIFELD
BEDFORD. MASSACHUSETTS

b AMS-T-R-391+
THE MECHANICAL PROPERTIES OF ICE
(Mekhanicheskie svoistva l'da)
by
K. F. Voitkovskii
f Translated
by
The American Meteorological- SocietyAF-Contract 19(604)-6113 and
- The Arctic Institute-of -North AmcricaAF-Contract 19(604)-8343-.
for Terrestrial Sciences Laboratories,Air Force Cambridge Research Laboratories,
Bedford, Massachusetts.
Source: Voitkovskii, KC. F. Makhanichaskie svcsistvaI'da, Moscow, Izd. ekkadlemii Nauk SSSR. 1960. 100 pp.
Research carried out at the Severo-Vostochno Otclcniclnstituta Merziotovedeniia imeni V. A. Obrucheva (North-ca~qtert' Division of the V A. Obruchev Permafrost In-
stiEtt).

PREFACE -
Ice is one of the m..jst widely distributed solids on the earth's
surface eincountered-by-man in ~eveirday, life. We'know that ice some-
iesinflict getlosses on the national economy; it obstructs. naviga-
tion, exerts an atdverse influence on port installations, bridge supports,
hydrotechnical- equipment,, et -al. However. -ice-isalso widely-employed
as a construction material for ice storehouses, ice-causeways and the
lieand for ice crossings and ice roads.Frteiisudtoc ba
aridity.A
All this indicates the-need for sound knowledge o! the physical
and mechanical properties-of-ice. Studies of these-properties have been
A made-and extenisive data have appeared in the s pec ial -literature, but it
is-very- difficult to make practical use of this information- because the
ofaitie fundrby ters -o the mnechanical properties of ice show-very
Wi lrgedisrepncie. -or xamle, he ltiatecompressive strcngthof-cefoud y tstng cesamle vaie frm 0-.o-100-kg/cm and more,
i~e. -t-ay arybyfactor-o teo oe h dataonteplsi
properties of ice reveal even greater disc repancie s. In View of this, the
need-has arisen to analyze and-generalize all these-data, to attempt to3Ii exolain-the reasons for the-large discrepancies in the -various parameters, _iito esita!blish- the laws of their: change- and to find the-m most- reliable charac-teristics of the-mechanicaiproperties of -ice in order-to make- recommen-
dation s for engineering practice. The present work-is devoted to the solu-tioni-of these problems. it is-based on a generalization 6f the data in the
literature on the propertiesofice and on the experimental work of ihc
If author on studies of the plastic properties of ice carried out at the V. A;
~' I Obruchev Permafrost Institute of the Academy of Sciences of the USSR
I~ 1 during the period 1954 through 1958. The author wishes to express hist I deep gratitde to Corresponding Member of the Academy, N. A. Tsytovich,to Professor S. S. Vialov and to Professor B3. A. Savellcv for a number of
valuable suggestions which have been considered in the present work.

CHAPTER I
THE STRUCTURE AND THE PHYSICAL PROPERTIES OF ICE
Ice has crystalline structure. Ice crystals are optically uni-
-axial and belong to the hexagonal system. The external form of the
crystal varies andodepends on-the conditions of the formation and
growth oi the crystal. However, one may distinguish three basic typesof-ice crtstals: tabular, columnar and-needle (acicular). The crystal
size varies greatly (from a fraction of a millimeter to one meter and
more) and changes continually because of recrystallization processes,
by which some crystals grow at the expense of others.
Ice crystals have a sharply defined mechanical anisotropy, as afunction of the direction in which forces-act with respect to the basal
plane (the plane perpendicular to the optic axis-of the crystals). The.
atoms in the space lattice oi the ice crystal are-arrangpe. such tha a
disturbance in the basal plane breaks only two atomic bonds per unitI _cell, while a disturbance in any plane perpendicular to the basal plane
requires the breaking of at least four bonds per cell (Owston and Lons-
dale, 1948). Therefore, the structure of an-ice crystal may be rep-
-resented as a collection of numeroux, very thin, durable but-flexible
plates (McConnel, 1891). The intervals between:the-elementary plates
(the planes ofclosest packing of atoms) ara planes-of-weakness, along
Which relative slipping of the -plates may occur.
Due to the anisotropy of the ice properties, one must consider the
structure of ice and the-direction of the optic axes of its crystals.
In nature one encounters various types of ice, distinguished by
structure, type of distribution and other properties. Actually, largesingle crystals of-ice are rarely found. For the most part, one finds
polycrystalline ice, which consists either of randomly oriented fused
crystals (granular ice) or intergrown individual crystals, whose axes
are approximately parallel.
Ice structure is a function of its mode of-formation. The following
basic types may be distinguished (Tsytovich and Surngin, 1937):
I2
__ -i-l i i w l i i w l--7 -

a) Continuous-crystalline, which forms during the calm freezing
of water;
b) Needle, often-with air bubbles, which forms at the point ofcontact of water and icet
c) Lamellar, which forms during the periodic freezing of individual
-layers of water or during-the densification of individual layers of wet show;_
d) Firn or granular, -which iorms during the freezing-of -now;
e) Fine-aggregate irregular, whichforms-during alternate freezing
and mixing (observed in the upper ice layer of large reservoirs);
f) Loose-flaky, observed in a newly fallen-snow cover and also
during the freezing of water- which condenses from vapor.
We now have a more complete and better genetic classification of
ice developed by P. A; Shumskii (Shumskii, 1955), in which all types of
fresh ice are taken into account and a detailed description is g;,eu of tne
conditions of their formation and mode of occurrence, their structure,-
crystal orientation and-the nature of their air inclusions. The broad-scopc
of the Shumskii classification makes it somewbatcumbersome, however,
and since we are not concerned with th- genesis of ice, we-feelwe can
limit ourselves to the above simplified classification and refer our readers
to Shumskii's work for a-more complete classificationm
When water freezes calmly, crystals with-optic axes parallel to
the surface of freezing predominate in the upper layer of the ice cover, while
crystals with vertical axes predominate in the lower layers. In lake ice,
according to B. A. Savel'ev (1953), crystals with optic axes parallel~to the
surface of freezing are encountered approximately to a depth of 18 cm,.
while below that all crystals have optic axes perpendicular to the plane of
freezing. With increasing depth from the upper surface, some of the cry-
stals wedge out and the lateral dimension of the remaining crystals in =
creases.
In the case of turbulent freezing of water, the axes of the ice cry-
stals have rand(om orientation.
The inciting of ice and sublimation (transition to the vapor state)
are functions of temperature and pressure. Under specific temperatures
-3-

IIand pressures, ice and water or ice and Vapor may enter into equilibrium
with each other. The curves of the equilibrium of these phases (fig. I)
show the limits of the stable state of the ice. The point of intersection
of the indicated curves, the so-called triple point, in which the systemice-water-vapor is in equilibrium corresponds to a temperature of.
+ 0. 00990-C and a pressure of 0. 006 atmosphere. The melting point of
pure ice at normal atmospheric pressure is 0°C. The melting point is
reduced as hydrostatic pressure is increased. It has been established
that i pressure increase of I kg/cm 2 corresponds toa-0.-00750 C reduction
of the melting pointi Oriented unilateral pressure can also cause some
change in the melting point, but it will be quite negligible, less than 0. 010C
(Shumskii, 1955).
Water may freeze at the same temperatures (as a function of pres-
sure) at which ice melts only at the boundary of an extant crysta-lphase.Therefore, when there are no crentpra .r.,t3.h-_.n, of t1--i iay-
"supercooled" considerably below the temperature at which thermodynur-licF conditions are created for converting water into ice. Cases are known
where water dropletsahave been supercooled to -72°C. Under natural
conditions, there are always foreign particles in water which becomecenters of crystallization, therefore, ordinarily water cannot be. super-
cooled more than a few degrees.
In addition to ordinary ice, various polymorphour modifications
of ice are known. However, they exist only under great pressures (from
2,000-50, 000 atm) and are not encountered under normal conditions,-
therefore, we shall-not investigate these modifications of ice In the pre-
sent work.
Impurities inice. In ice one usually finds a certain number of
impurities, inclusions of air or of gases-and salts. Furthermore, under
specific conditions (heat influx, increased pressure) ice also contains
water. In natural icc. one may find various solid inclusions, c. g.-, in-
soluble mineral fraiments.
4'The gaseous inclusions in ice come either directly from the atmos-phere or from freezingwater. The chemical composition of these in-
clusions is usually close to that of atmospheric air. The air inclusions
-4-
-4-
:in~it 9 *'t :.u Ly, tiny .-ptji~i voids-or elongatedociosed-cells. Oe
pore s~d eracks-ari i!,o f&ald j b]:ehe, -tr-spajent ic ihr-n~n
-o acPoresat-all er very-few of-themn (porosity within the limit of3,1-cm 1kg)., Ifthere .is alargequantity of air inclusions in the ice, the
ice is less transpirent, i. e. , cloudy. Such ice is: usually _fouhd in -themiddle and thelower layer of the ice cover. In-this'case, the porosity
'' of the-ice generally aries from I to 50 m3/kg. Ice with-a verylarge4nu -xer-of air pores (from 50-400 cm 3 /kg) also-occurs. Such ice is
opeque and looks like ,iow (Savelev. 1953). Usually-it forms as a re-
s-ult- ofthe freezing:together-of moistened snow.
The presence of dissolved-salts in Water changes the conditions of
freezing of the water. Uponcooling and passing-into the solid state, thesolution becomes in-homogeneous and-breaks -up into its-components.
Wheni alow-concentration solution is cooied below the freezing ,point-of
-pure watei, pure ice begins to form-from it and the solution conc-ntra-'tion:increases When a high-concentrationiilution is coolcd,, iL-becomtE-
-supersaturated,and- salt c rystals begin. t form rori-it.
-ThUS. for. each solution-temperature below the-ffreezing point of
pure water, there are tWau maximum ,equilibrium concentrations of- sIts.
beyond which ice or salt crystals separate out (fig. -2). the temperaturecorrestpndingotothe point of-intersection ofthese limits is called-the
4=- eutectic temperature. At this temperature and the corresponding solution
concentration,, both components separate out simultaneously and-the solu-
? j tioh composition reimains unchanged during -this -freezing period,. i.e., the
0solution-freezes completely. -As-a result, a-eutectic mixture of ice and
salt crystals forms. If the initial concentration of the solution was less
than-the eutectic, after cooling below the eutectic temperature a mixturcB of eutectic and'ice formsi called the hypoeutectic, but- ifthe initial con-
centration of-the solution is greater thanthcecutectic, a mixture-,of eutec-
tic and salt forms, called the hypereutectic. Thus, salts in-the ice above-
the eutectic temperature are in the form of a liquid brine, and its concen-
tration increases and the quantity decreases with intensification of-frcez-
ing. When'the salt content is small, almost all the brine in the ice is
concentrated in the form of films or isolated inclusions at the crystal
boundaries. An increase in-the salt content leads to the formation of inter-
F-I-5-
layers of brine within the crystals in the basal planes, separating the
crystals into a number of plates (Savel'ev, 1953; Shumskii, 1955).
The presence of films, isolatedinclusions and especially inter-
layers of liquid brine exerts a considerable influence on the mechanical
properties of ice, reducing the ice strength. However, it should be noted
that the amount of liquid brine in fresh-water ice is usually negligible
and can exert some influence on the mechanical properties of ice only
at a temperature close-to the melting point.
Regelation and recrystallization. Ice can regel or freeze together.
This property consists in the following: external forces may cause some
melting of particles at-the points of contact of ice particles or pieces
of ice. The water which forms in this case is extruded to places where
pressure is-lower and freezes there, as a result ice particles freeze to-
gether. The freezing together of ice surfaces occurs mort slowiv and e-o,
take place without anypressure andwithout the participation of a liquid
phase, as a result of the sublimation;* of ice and rccrystallization. Con-
sequently, hairline cracks in ice cannot exist for-a lontg period of time.
Recrystallization takes place continuously in ice and is manifested
in the spatial displacement of the boundary between crystals. -in the change
of size, shape and total number of crystals and in the change of crystal
orientation. The rounding of sharp edges and corners is observed in indiv-
idual crystals. Crystals strive toward the equilibrium form (a sphere),
which is characterized by a minimum free energy. In polycrystalline ice,
the principle of minimun free energy is manifested in the tendency toward
the fusion of crystals and reduction of the number of crystals. The larger
crystals grow because-of the reduction of volume (and even the complete dis-
appearance) of the smaller crystals, i.e. , a "selective" recrystallization
occurs (Shtwanskii, 1955). Rounding is rapid only when angular crystals are
present, while selective, recrystallization takes placc only when very small
crystals-are present. These processes -diminish as-the crystals become
rounded and the tiny crystals disappear.
* By sublimation we mearx the process of the distillation of ice fromone place to another through the vapor state, i. e, volatilization, the mig-ration of vapor and iia crvstallization.
-6-
'C- - - -

The6 crjystaizatio rocesses arte moreiteneu-ve i ice in a state
6f stress under the6 influente-of various mtechanical-forces. In-this case,
dvii.to the smeichical anicotropy of the-.crystals, a non-equilibrium
*tire sied stia is-creaited and recrystaillitiondi begins; with the growth of
the less. stressed crystale or- their parts at the expense of -the more, heavily
-strissed crystals. The orientation of, the. crystals may, chanige in this
case.- -Crystals with basal Planes close -to the- directions-of shear, experience,
a smaller stiresis during, the deformation process than crystals oriented
diifferentl~y-and-unider heavier sjtress and they grow -at-the expense of the
more, heavily- stressed- crystials.
Recrystallizatio-n consists in th-e-transfer of molecules fIo th
space -lattice of one crystal-to the space latticeofathrryaldact
to it. RecrystilUization may also take place by the redistribution of material
through the vapor orliquddphas~e. These latte tpso-recrystallization'
play a considerable role, at teniperatures- close. to zero.
Densiity-and spe-cific volumhe. The deiisity-oftpure iceat 0 C and a3Pressure. of I.UM aosphere, is. 0. 9168 -g/cmn . while-the spccikic~volumq is
1. 0908C cn/g. The density. of w*ater -under these -conditions is Oi3999863
gfcm'. Waterf expinds 9% upon freezing. We-h~ecnau~oe
and-im-purities, its density differs -slig-htly froni-the abvei -The' densityof pore-free ice changes but- slightlyunpde r -the ir~uuence of press-ure.
According tothe data of B. P. Veinberg'(1940), the compreiisibility factor
is approximately 1.1-5) x 10' pe r atm. -Pressure may exert a--substantil
influeiice on the dehsity ofPorous ice only, redticingthe porosity -andcor--
respondingly, increasing the-Acusity.
Thermal expansion. The- coefficient of~expsion of-ice is a- itnc-
tion of teprature, -increasing as-AeMperatures increase, Ira theterperjk-
ture range -200 C to- OeC, the coefficieia. -Hne4; c.pansion-_is, on an.5't'
average, '5. 5 x 10 , whUthe- cofficiii-f--volmntic x r-nJ
responinglysl6.-5;xIQ~ per 0 C. fr..the -tq#rperature ritnoc-0Ct kthe, coefficient of linca r expansionj acco rd-Ang-to,-the exnr~mntts of'--Ardfiws
(see'Veinbeig, 19040) is about 3. 6 x: 10~ r 0C.
The-specific heat of ice- varies as the (empei ature, dccrcax~iiug ;P
the termpekature decreases. This relationship may be expressed-by 0.1
following empirical furnnula. (Veinberg, 1940).'
-7
Cit 0.45057 -0. 001863 0 cal/S degree.
where I, is the absolute value of the negative-Aemp'trature of ice in 0 C.
The -latent heat of fusion- of pure ice is 79. 6 cal/g. The latent neat
of sublimation (vaporization) ofICe at O"C is 677 cal/g.
The the mal conddietivity of ice is a function of the ice temperature.
The coefficient of thermal conductivity, of dense ice is a function of tempera-
ture and may be expreused by the empirical formula (Veinberg, 1940):
X. u0. 0053 (1 + 0. 0015 0) cal/cm sec degree,ice
where 0 is the value of the ice temperature in 0 C.
The presence of air inclusions in ice reducea the coefficicnt of
the jasaii cunductivity oi the ice. Lta are now available ah1.uWilig tha., th'i
thermal conductivity of ice crystals -n the direction of the main crystal-lographic axis-is scinawuhat greater than in the direction perpendicular
to the axis (Shurnskii, 1955). However, this difference is insignificant.
-8-

CHAPTER U
THE BASIC LAWS OF' ICE DEFORMATION
When a force is applied to ice, the icc begins to deform andbehaves is' an elastic, plastic or brittle body depending on variousfactors, 1. e., it deforma elastically or plastically or it experiencesbrittle fracture.
Some of the main characteristic properties of ice compared withII other crystalline bodies are its distinctly expressed plastic properties.Under a load, ice may change form without breaking and without changingvolume, like a fluid. We know, for example, that glaciers "flow" at adefinite speed and, to a certain extent, such flow is reminiscent of thej J flow of a river. Therefore, the plastic deformation of ice is sometimes
compared withi the flow of a highly viscous fluid.The area of manifestation of purely elastic properties is so smallfi that in practice one cannot distinguish it. Usually, plastic deformations-
can be observed along with elastic deformations, under any stress.Elastic deformation occurs at the moment load is applied, and the plasticdeformation begins immediately after the elastic. The total deformationgenerally consists of two components: the elastic, i. e., the reversibledeformation and the plastic, i. e., the residual. In passing, it should be
mentioned that plastic deformations occur only in presence of shearstresses, therefore, only elastic deformations and densification will occurunder equal, hydrostatic compression of monolithic ice.
Brittle fracture of ice is observed when the stresses on the ice areincreased to a certain limit, the ultimate strength of the ice, * and also,in a number of c. ses, under the influence of dynamic loads.
The mechanical properties ol. ice, i.e., the capa .,-ity of ice to re-sist the influences of external forces change considerably depeniding ontemperature. The closer the teisiperature of the ice is tO the meltingpoint of ice, the greater arc the manifestations of the plstic properties of
j This critical stress is also called Me bre-aing PaG Lo t jF l "of plasticity.
F -9-

the ice and the lower its strength. This phenomenon is explained by
Ithe weakening of the cohesion of the ice molecules in the space lattice
of the crystals and the possibility of rearrangement of the atoms. On
the other hand, the lower the temperature is, the more difficult it is
for the atoms to become rearranged in the space lattice of ice and the
more apparent are the elastic and brittle properties of ice.
The structure of ice *lso exerts a considerable influence on the
character of the ice deformation. In this connection, first let us
treat the deformation of individual ice crystals.
THE DEFORMATION OF ICE MONOCRYSTALS
IThe character of the deformation of the monocrystal is firet afunction of the direction of shearing forces with respect.to the basal
plane of the crystal. As has already been noted in Chapter 1, an icecrystal may be represented as an accumulation of numerous, Very thin
strong but flexible plates perpendicular to the optic axis of the crystal.
These elementary plates, about 0. 06 mm thick (Nakaya, 1958), cor-
responding to layers of closest picking of atoms. may move relatively
Ieasily with respect to each ,-ther. During the deformation of ice, gliding
is observed exclusively along the basal planes. In cases where the direc-
tion of the forces causing shear does not coincide with the basal plane,
the bending and relative shearing of the elementary plates occur simul-
taneously. Only at a temperature close to the melting point can plastic
shearing occur in any direction (Glen and Perutz, 1954), because in this
case many internal bonds are broken in the crystal. Gliding may takeplace with approximately equal ease in any direction in the basal plane
(Steinemann, 1954). This type of plastic deformation may reach any
magnitude up to complete extraction of the parts of the ice crystals bounded
by the basal planes.
Figure 3 shows three main possible directions of forces which cause
shearing relative to the basal plane. In case 1, where the shear plane
coincides with the basal plaris, only translation of the elementary plates
takes place and the deformation is plastic. If the shearing force acts in
the direction of the main axis, i.e., if the direction of force and the
-10-

shear plane are perpendicular to the basal plane (case 2), the elementary
platesof the crystal bend and-small relative shearing motions of'the
plates occur with respect to the basal planes. After the stresses in the
elementary plates reach a certain limit, the plates break. Deformation
is elastoplaStic and when the stresses are increased, ruptutre occurs. In
came 3, where the directionof the shearing force coincides with~the basalplanei but the ,shear plane is-perpendicular to it, the elementary plates
allow only a negligible elastic deformation. However, when the stresses
are increased and when there is a corresponding increase of the elastic
plane strain of the elementary plates, they may bend due to the loss of
stability and some relative shearing motions in directions which do not
coincide with the direction of the shearing force. A further increase ofstress causes the crystal to break.
From what has been said, it is evident that two different types of
deformation occur simultaneously in a monocrystal under the iiluence ofan external force, namely: elastic deformations of the elementary plates
and their relative plastic shear. These two types of deformation are
closely related and exert a mutual influence on each other. We know that
the elastic deformation takes place instantaneously (more exactly, at the
rate of propagation of acoustic waves), while plastic deformation takes
place relatively slowly. Therefore, at the moment force is applied onlyelastic deformation of the crita =,at place. The elementary plates in
this case are still rigidly connected, as it were, while bending of the plates
is difficult and the total deformation is slight. The internal shearing
stresses which occur cause a corresponding relative gliding of the elemen-
tary plates and their flexure. Plastic deformation begins. The gliding of
the plates and their flexure cause a redistribution of the internal stresses,
which leads to a change of the rate of plastic deformation, depending on the
direction of the force and the magnitude of the deformatioi of the crystal,
the rate of plastic deformation may decrease, remain consitant or increase,
If the shearing stresses on the planes of weakness between the plates
decreases as a result of bending and s.ipping of the plates, the rate of
plastic deformation of a monocrystal will also decrease. However, if the
flexures and the rotations of the plates takes place in a direction such that
the shearing stresses between them increase, the rate of plastic deformation
~- 11 -

will increase. In cases where there is no substantial change of the
inteznal stresses, the deformation rate may be constant.
Figure 4 shows curves of the shearing of monocrystals of ice vs.time. with different shearing stresses, at a temperature of -2. 3°C,
-according to the experimental data of S. Steinemann (1954). The tests
were conducted such that the direction of the shearing forces coincided
with the basal plane and pure shear occurred. Steinemann established
that-two stages of creep may be distinguished in the pure shear of a
crystal. The first stage occurs during gliding when the total relativeangular strain compared with the undeformed state of the crystal does
A not exceed 0.1-0. 2; the second stage applies to large shears. In the
tundeformed crystal, gliding takes place relatively slowly, then the creep
rate increases and a new linear segment appears. A special softening of
I the crystal takes place. The transition from one stage to the other is14t I irreversible. The crystal, once deformed beyond the indiaj4!d !imit
for the first stage, remains soft even after several hundreds of hours.
4 1 After the transitional period, the deformed state remains stable, The
relationship between the strain rate . and the shear stress r for both
stages is expressed by the equation - k n, where n is 2.3-4.0 for the
first stage and 1. 3-1. 8 for the second stage.
Figure 5 shows the deformation curve for the tension c! an ice
cylinder cut from a monocrystal of glacier ice. according to the experi-
mental data of Jellinek and Brill (1956). The rate of deformation increases
with time. Apparently this increase is explained by the above-described
"softening" of the crystal and by the fact that under tension the shear
stresses in the sample increase between the elementary platec., due to
a reduction of the cross section of the sample and the rotation of the
plates. An ice crystal permits considerable plastic tensile strain. For
example, cases are known where the sample was stretched almost double
its initial length and became a thin tape, but remained a tnonocrystal
(Glen, 1952). In this case the optic axis changed direction and became almost
perpendicular to the direction of strain. In those cases when the optic
axis of the crystal coincided with the direction of strain and primarily
elastic deformation occurred, the plastic deformation was negligible and
the accelerating creep stage did not occur (Glen and Perutz, 1954).
-12
In a crystal s8bjacied to piastic deformation under some sort ofexternal force, after the iorce has ceased to act, partial reduction of thedeformation occurs-with a tendency toward re-establishment of the initialform. This recovery does not take place immediately, but over a certainperiod of time. The recovery process is similar to that of crystal defor-mation in the initial period of influence of the force. At the moment theforce ceases, instantaneous elastic recovery occurs due to the removal ofthe overall stress state; then one observes a special "reverse creep" con-sisting in the gradual reduction of the total deformation of the crystal (at a
decreasing rate).
The work expended during the mechaitical action on the crystal isconverted in part into thermal energy, while the remainder is transformed
___ into the free energy of the crystal. During plastic deformation, work isw~c onverted principally into thermal energy, due to which the tempezature ia-
creases or partial melting, begins. The free energy of the ciyi al increa%;USduring elastic deformation and also when the crystal breaks, in which casework is expended on creating an additional surface. There may also be anegligible free energy increment during plastic deformation when there id somei lattice disturbance and when stresses are created which leadto hardening.The excess free energy of the crystal may be expended on processes connectedwith relaxation or again may be converted into mechanical work. The free
F energy increment may also cause recrystallization.
THE DEFORMATION OF POLYCRYSTALLINE ICE
j The deformation of polycrystalline ice consists in the deformationand the relative displacement of ito crystals. This second factor causes somedifference between the laws of the deformation of polycrystalline and mono-crystalline ice.
Polycrystalline ice in which the direction of the optic axes of mostcrystals coincides (a characteristic feature of the ice cover during the calmfreezing of water), is characterized by mechanical anisotropy. The magnitudeof the deformation of such ice as well as the deformation of individual monocrystals depends, to a considerable extent, on the direction of application
-13-

of the forces relative to the axial direction of most of the crystals. However,
anisotropy is not as pronounced in polycrystals as in monocrystals, since
the ice crystals may slip with respect to each other and the stressed state
in the deformed ice mass is almost always irregular; thus, the shear stresses
act in diff3rentdirections relative to the crystal axes. Howeve., if the ice
consists of randomly Oriented crystals (ice which forms during the freezing of
water with mixing, during layer-by-layer freezing, during the freezing to-
gether of snow, et al. ), most of it may be regarded as an isotropic body.
Let us use inmdividual examples to illustrate the laws of deformation.
When polycrystalline ice is compressed, plastic deformation or creep begins
after elastic deformation. If the pressure is relatively slight (a few kg/cm
and the ice sample is subjected to unilateral uniform compression, a steady
rate of deformation will be established (fig. 6) some time after the application
of load and then the magnitude of this creep rate will be a f',:,ction of prossure
and temperature. In this case, the creep rate may be kept constant ic-x ;a long
period of time if the temperature as well as the stresses in the samplc are
kept constant. If a high pressure operates after the stage of steady creep is
established, a stage of accelerating creep or progressive flow will begi, in
which case the creep rate will increase continuously. The higher the pressure,
the more rapidly will the stage of accelerating creep be established and cor-
respondingly the stage of steady state creep will decrease. With a pressure
of the order cf 10 kg/cm and more, the stage of steady creep practically dis-
appears and, after some decrease of the creep rate of the sample, the stage of
accelerating creep begins (fig. 7). The deformation (creep rate) of an ice
sample increases with increasing pressure (Kartashkin, 1947).
It should be mentioned 'iA passing that the stage of accelerating
creep is characteristic of cases in which the examined ice sample is subjected
to a constant comprcssivc stress. Since the lateral dimension of a sample
increases during longitudinal compression because of lateral -rcpansion. in
cases where the compression is produced by a static load, there will be a
certain reduction of the compressive stresses in the sample, which, in turn,
will reduce the compression rate.
When the pressure -1s increased above the ultimate strength, brittleI fracture of the ice will occur.
-14-
.£
_ _ - --
Ice experiencing compression perpendicular to the direction of the
optic axes has a somewhat greater rate of deformation and a somewhat lower
critical strength than ice compressed in the direction of the crystal axes.
Tensile strains of polycrystalline ice (fig. 8) occur basically in
the same! manner as the described compressive strains (Kartashkin, 1947).
The difference is as follows: in the case of compression, compres-
sive stresses act in the shear plane increasing the cohesion between the mobile
particles of ice, while in the case of tension, tensile stresses act in the shear
planes, reducing cohesion. As a result, conditions may arise which promote
the relative shearing of the crystals and the- shearing cf the elementary plates
in crystals, which as a whole will reduce the strength of the ice. The area
cross-section of an ice sample under tension decreases: it therefor.- ronida,--
ably increases the influence of the ice structure, the inhomogeneitics, and tile
internal-weaknesses. The presence of air pockets, cracks or structural faults
in an extesided ice sample results in an inhomogeneous stressed state at such
points and increased tensile stresses, which accelerate the deformation and
increase the chances that the ice will break. Considerable plastic deformation
can occur in monolithic polycrystalline ice when the tension is smooth and
uniform. However, the test sample of ice may rupture even when the dynamic
effect is slight or in the case of vibrations. Usually the tensile strength of ice
is considerably less than the compressive strength.
Figure 9 shows several curves which characterize the laws of ice
flexure. Prismatic beams, 10 x 10 x 120 cm, of ice with random structure
were used for the experiments (Voitkovskii, 1956). The beams were mounted
on two supports with a span of 100 cm; they sagged under their own weight and
an additional load of two weights was placed symmetrically atdistances of15 cm
from the center of the beam span. When the beam was loaded, at first an in-
tensive increase of deformation was observed; then the rate of deformation
gradually decreased and tended toward a constant value for the given load and
temperature. The deformation may continue at this rate over a very long
period of ti.ie. For example, fig. 9 shows a case where the ice beam sagged
at an approximately constant rate over a period of 3000 hours, i. e , more than
- 15 -
SA
four months. However, immediately-after the load had been changed, the sag
rate changed sharply and proved to be a function of the size of the acting load
and of the load before it was changed. Thus, when the weight is removed,besides the tinstantaueous" elastic decrease of- sag, there is a gradual slow
decrease of sag which is most pronounced during the first hour, but a new
increase of sagging begins after 1-2 days, due to the weight of the sample it-
self.
If the stresses in the bending sample of ice exceed a certain limit,
after the stage of steady creep, a stage of accelerating creep begins which
results in the rupture of the sample.
Polycrystalline ice experiences considerable plastic deformation
during steady bending; however, it breaks easily under a dynamic load and
near the neutral axis, followed by rupture of the ice in the extended zone and
by extrusion of the ice in the compression zone (Kartashkin, 1947).
Figure 10 shows experimental curves of the deformation of poly-
crystalline ice of random structure in pure shear with a subsequent stepwise
increase of the tangentiil stresses.
As can be seen from the graph, immediately after the application of
a ahear force or after the increase of this force, there is an intensive increase
of the shear strain, then the strain rate gradually decreases and approaches
a value which is constant for the given conditions. The plastic deformation has
no critical li:nit under small stresses and may take place over a very long
period of time. For example, in my experiment (see fig. 15), one of the ice
tubes deformed over a period of 5, 000 hours under the influence of a torqueA2 o
which caused tangential stresses of I kg/cm at I C. Li thlhi case, the strain
L rate was nearly constant.
If the tangential stresses exceed a certain limit, after deceleration
of the strain rate during the initial period of stress and after a c6rtain inter-
val with an approximately constant rate of strain, the shear velocity begins to
increase gradually and may finally lead to destruction of the deformable volume
o1 ice.
!I - 16-

In the case of a complex stressed state, the magnitude and rate of
shear strain is a function not only of the tangential stresses, but also of the
magnitude of the normal stresses in the shear plane. With one and the same
tangential stress, the additional influence of normal stresses may change (in-
crease) the *train rate substantially (fig. 11). In other respects, the nature of
the deformation remains the same as in the cae of pure shear.
[Shear strains form the basis of any deformation during which the
j form of the body changes. In particular, any plastic deformation of ice charac-
terized by a change in the form of the body without destruction and change of
the volume results from internal relative movements of the ice particles. There-
fore, the nature of the plastic deformation is approximately the same during the
various modes of deformation, viz., compression, tension, bending, torsion
and the complex forms. The differences lie chiefly in the nature of the destruc-
tion and the magnitude of the critical strength.
Pulyuryaisiline ice deiorms under the iniiuence oi three t 'tors:
1) elastic and plastic deformations of the individual crystals;
2) displacements of the crystals with respect to each other;
3) destruction of the crystals.
All these-factors are closely related and influence each other. In
ice, recrystallization occurs simultaneously withthese factors and also in-
fluences the nature of the deformation. Crystals oriented with their basal
plane, close to the direction of shear and which, therefore, experience less
stress during the deformation process grow at the expense of the less favorably
t oriented, more heavily stressed crystals. The individual over-stressed crystals
disintegrate and become crystal fragments which are wistressed at the beginning
cf their formation, grow at the cxpense of the older stressed crystals and then
become st:cssed and deformed themselves. Thus, during the deformation of
ice due to partial destruction of the old crystals and recrystalization, there
is a partial re-establishment of the undeformed state, a special "recovery" of
the ice structure. This is also explained by the fact that in a number of cases
ice has practically no limits of deformation. At the moment load is applied,
elastic deformation begins, caused by the exceptionally elastic deformations
of the ice crystals. The elastic deformations of the crystals cause stresses
* within the crystals and at the contacts between crystals, resulting in plastic
~- 17 -

deformations of the crystals, relative shearings of the crystals and, in in-
dividual cases, in destruction (disintegration). Thus, plastic deformation
begins immediately after the "instantalieous" elastic deformations. At the
inital moment there may be concentrations of stresses at individual points
of the crystals, then internal shearing, gliding along the-crystal boundaries
and disintegration of individual crystals occur, which leads to some internal
redistribution of stresses and to a partial balancing of the stresses. A re-
arrangement of particles takes place, during which the, ice offers more re-
sistance to load because it becomes more rigid, as it were, and this decreases
the rate of strain.
This strain hardening is accompanied by the breaking of bonds be-
tween the elementary plates of the crystal and between the individual crystals,A'2d by the ,d;.;,.Ilch leadr. to an iiiii-z to an
increased rate of strain; Thus, a load induces two opposite and siniultaseous
processes in polycrystalline ice; the breaking of bonds and weakening, on the
one hand, and the re-establishment of bonds and strengthening, on the other.
The nature of the deformation is determined by the prevalence of one or the
other of these processes.
In the case of slight shear stresses following instantaneous defurr-in-
tion and a reduction of the strain rate during the first period after the applica-
tion of load, a dynamic equilibrium is gradually established between the ex-
ternal forces and the total internal resistance. The increased hardness of
the ice due to the increased internal deformations is compensated by the de-
crease of hardness due to the formation of particles of undeformed material
by disintegration of the individual crystals, recrystallization and weakening.
A stage of permanent plastic deformation begins, i.e., steady-state creep,
which may continue for an unlimited time as long as the conditions uf deforma-
tion, i. e.. the temperature, the stresses and the ice strncture, remain un-
changed. However, usually these conditions cannot remain unchanged over
a long period of time and, therefore, in practice the stage of steady state
creep is limited although it may persist over a long time period. Even :w'hen
the temperature and stresses are constant, the orientation of the ice crystals
may change during the deformation process. Recrystallization results in the
iI- 18 -

fiI
graduil formation of a structure with main axes oriented along a line pcrpen-
dicular to the shear plane tShumskii, 1958) and this increases the strain rate.
Ifthe shear stresses exceed a certain limit, which we shall call
arbitrarily "limit of prolongcd.creep" (for more details, see-Chapter iV),
either there will be no internal equilibrium between the weakening and harden-
ing-processes or it will be short-lived. Weakening prevails over hardening
and there can be no prolonged stage of steady creep. In this case, deformations
develop relatively rapidly and, as a result, the bonds between the elementary
plates that move with respect to each other in the ice crystals and between the
individual crystals break, the internal resistance of the ice decreases. Inindividual cases, glide planes with weakened cohesion form in the ice, and theshear along these planes is more intensei All this gradually increases the
deformation rate, which may eventually lead to the disintegration of the ice.
|A-range in the 's ̂ * -,t; -Cc:; lea
j change of the deformation rate. If the stress increases discontinuously (with
j increasing load) during the deformation process, the change of the deformaiooi
rate will be similar to the change in the deformation rate described above
for the initiation of strcss. Following an instantaneous discontinuity of de-
formation, i. e. . an elastic deformation corresponding to a discontinuity of
stresses, deformation continues at a decreasing rate. Then, gradually a new
constant rate of deformation is established corresponding to the equilibrium of
the new external forces and internal resistance, or the rate of deformation
increases, i. e. , accelerating creep begins. A reduction of the shear
stress causes a reduction of the elastic deformations of the crystalr, which
in turn causes plastic shearing in the crystals and their relative displacementin a direction opposite that of the initial deformation. This process combineswith an increase of plastic deformations due to th- acting (after reduction)
stresses. The result is a quite complex type of deformation; at the moment
of the reduction of stress there is a somewhat discontinuous decrease of de-
formation which fades in time; then a short-term stabilization of deformation
begins and it increases again at a rate which increases to a value correspond-
ing to the stress acting after the change.
t
1" -19 -

As a graphic presentatio-x, in- fig. 12-we give the curve of the
chahge'in, sag of an ice beam under Successive loadings at various time in-
tervals (Voitkovskii, 1957). The mechanism ef the elastic aftereffect(delayed Appearanc* of elasticity) is clearly:manifeited'here. it consists
in the following: in addition to the instantarfeous-elastic and irreversible-
plastic deformation after application of load, over-a certain time interval
there is a structurally reversible deformation which disappears with timeafter unloading. One-might say this delayed, structurally reversible de-
formation is intermediate -between elastic and plastic deformation. Itconsists of the following: after the load has been applied and instintaneous
elastic deformation occurs, there is a gradual further increase of elastic
deformation of the elementary plates of the crystals proportional to the re-
lative plastic shearings of these plates and the individual crystals. Cor-
restpnondingoy.. thp 4pIaoti,- otroto c in the ,.,.!,. eets - A^~!
after the removal of the load, but, rather, gradually, causing plastic si'cv.ring
in a direction opposite that of the initial deformation.
(4 One manifestation of the elastic aftereffect is the relaxation ofstresses in ice during its steady deformation. In this case, the elastic de-
i, formations of the crystals gradually decrease due to increasing plastic de-formation and, correspondingly, the internal stresses decrease and the rc-
sistance of the ice decreases. As a result, the orce needed to keep the ice
sample in a given state of deformation will decrease with time. Figure 13shbows relaxation curves based on the experimental data-of B. D. Kartashkin
(1947). The curves show the change in force required to maintain the initial
U sag value of ice beams 8 x iZ cm in cross section with a span of 100 cm, as
a function of time and initial load. These curves correspond to the change in
stressed state of the beams and reflect the general nature of the relaxation
. of stresses.
The greatest reduction of stresses, relaxation, is observed im-
mediately after the ice deformation stops increasing. Then the relaxation
rate gradually decreases. The higher the initial stress, the faster the re-
]laxation in the initial period. Since the elastic limit of polycrystalline iceis p7acticaliy zero, during prolonged relaxation the stresses will also de-
- crease to approximately zero.
-20.

The plastic deformation of polycrystalline -ice is connected with
the partial breaking of the internal -bonds of the crystals and the bonds between
crystals. Therefore, it do.es not-always occur smoothly. K. E. Ivanov and
-V V. Lavrov (1950) noted that during the bending of, samples of polycrystal-
line ice-the deformation increased discontinuously, accompanied periodically14 by a peculiar scraping sound. Howeveri we did not observe- discontinuitiesin our experiments (V'oitkovskii, 1957) where considerably larger sampleswere used. Evidently, discontinuities of deformation can appear only during
the deformation of small ice samples. The partial -breaking of bonds-in one
crystal may have a perceptible influence on the deformation of the entire 3ampie.
Ini large samples of polycrystilline ice. the individual discontinuities will
t not beapparent in the overall deformation of the sample and the deformation
will actually be very smooth due to the total effect of a large number of minute
-~ discontinuities. Thu author also assumes that the discontinuous =.iure of thsz
deformation May be perceptible in cases where irregular shear dtresses,
exceeding the limit of prolonged creep at individual points, occur in the, deor-
inable ice mass. Then, at points of increased stresses, conditionssxnay favor
a progressive flow which will bring abaut an abrupt redistribution of the inter-.
nal stresses and, possibly, a discontinuous change of the deformation rate.
All these questionls require further cxperimental v:erification.
Rtecently, P. A. Shuxnskii (1058) developed a new theory of the
mechanism of ice straining and recrystallization based on the data of crystal-
Pgrphi investigations of ice, firn and snow samples which had been strained.
According to his theory, six different mechanins of ice straining can be
distinguished on the basis of strw'ture, the mallnitude of the- tangential and
normal stresses and temperature. The first --e strain mechanii coneists
in slow shearing parallel to the basal planes vfu thle crystals. In this case no
structural changes of the ice are observed, )'ho second nucch r im is one
whereby the mass of polycrystalline ice flowu slowly under the influence of
a tangential stress less than I kg/cm 2and the intragranular slip along the
basal planes accompanied by a slight distor-ion and other lattice disturbances
caused by a slow migratory recrystallizatiWn of the ice and by an ordering of the
structural orientation (a structure forms with an oricntat-.on of the main
axes perpendicular to the shear plane). In the third mechanism, with ahigh rate of low, the intragranular slip is accompanied by curvature (dis-tortinn) and crystal lattice disturbances, by disarrangement of the structure
of heavily stressed crystals and by recrystallization. The fourth mechanismis one in which a further increase of load and the strain rate with breakingand partial destruction of the crystal bonds is accompanied by intragranularslip, reduction of crystal size and the formation of random structure in theshear zone. The fifth mechanism comprises the ice straining which takes21
place at low pressures due to large tangential stresses (10 kg/cm 2 and more);shearing causes crack formation, slipping along the planes of fracture anddisintegration of the ice. The sixth mechanism is one in which the strainingoccurs under great pressure and at high temperatures; there is partialinternal meltinz of the ice (ue to tie hmat of frictinn, fQLI_.ed by .¢rz--together and the formation of the so-caJled blue bands.
This classification of the ice strain mechanisms allows one todraw a clearer picture of the physical essence of the laws of ice deformationand the specific nature of the mechanical properties of ice.
Z2i-2-
I I
CHAPTER IU
THE-ELASTIC PROPERTIES OF ICE
An has already been noted, the-elastic limit of ice is coe to
zero and ordinarily the elastic properties appear together with the plastic.
Consequently, it is difficult to determine the exact value of the various
factors which characterize the elastic properties of ice (the elastic modulus
E, the shear modulus G and Poisson's-ratio li).
When the load acting upon the ice is changed, three different types
of deformation appear: I) elastically reversible instantaneous deformation,
2) irreversible deformation, i.e., creep and 3) the slowly reversible de-
formation of the aftereffect. Actually, this division is arbitrary, sinco all
three types of deformation are interrelated and there-are no sh.,,P boundarikF
between them. This is especiaIly true of the aftereffect. The initial stage
of the aftereffect deformation begins immediately after the instantaneous
elastic deformation and is usually recorded as elastic defornation. The
next stage, however, is part of the total or overall creep value. Since the
rate of increase of the aftereffect is greatest immediately after the load is
changed, the "initial" elastic deformation of the ice which we have observed
will be a function of the rate of application of-load, to a considerable extent,
atid the time interval between the application of load and the measurement of
strain. Here, time periods of even tenths of a second may exert an influence
(Donchenko and Shul'man, 1949). Correspondingly, when the elastic and sizear
moduli are determined experimentally, their values may also dcpcnd on the
rate of application of load and the duration of loading. This is also one of the
reasons for the considerable discrepancies in the quantitative valuet of
the parameters that characterize the elastic properties of ice.
THE ELASTIC MODULUS
The modulus of elasticity characterizes the resistance of ice to
elastic deformation in tension or compression. If a cube of ice is sub,)ected
to uni lateral compression, its relative elastic compression c may be expres-
sed by the formula:
S-23-

(I
where fr is-the normal stress; E'is the elastic modulus, which is the pro-
portionality factor connecting the normal stress and the relative compres-
sion.
In tension, the elastic modulus is also the coefficient whikh con-
nects the normal t.nsile stress with the relative elongation. Two methods,
the static and dynamic, are used to determine the elastic modulus of ice,
Essentially, the static method is the measurement of strain after the applica-
tion of load, when testing ice samles in compression, tension or flexure.
The dynamic method is based on the calculation of the elastic modulus or the
ba i off u!asritm.a. ihi rate oi propagation of elastic .',-rations in ice.
As Veinberg.(1940) pointed out, -the first experiments for dntr-
mining the elastic modulus of ice were made at the beginning of the 19th cen-
tury by Young (1820) and Bevan (1824). La4ter,. experiments of this type w.,
conducted by nunerous other investigators. Tables I and 2 summarize the
results of the principal experiments. Asithe-data show, 'the values of the
elastic modulus of ice may vary Within-quite broad limits. The greatestvariations are observed when-the static method is used. The variations are
smaller when the dynamic method is used, but the average value of the elas-
tic modulus is higher. This may be explained a% follows: whetn the static
method of investigation of ice strain is used, the deformation is not measured
at the momer.nt the load is applied but after a certain time interval. Ordinarily,
this interval is small, a matter of seconds, but this is sufficienit.to permit a
perceptible creep deformation of the ice (chiefly due to the aftereffect) to-
gether with an elastic deformation which begins immediaotcly after the applica-
tion of load. As a result, the elastic modulus determined by the moasurement
of total deformation does not characterize the resistance of ice to instantaneous
elastic deformation, but characterizes the resistance of ice to reversible de-
formation after a specific time interval.
-24-
p/

The greater the tension caused by the load, the more substantialwill be the role played by the creep component of the deformation. The in-
stantaneous elastic deformation may be regarded as directly proportional to
the magnitude cf the stress, but the creep rate increases considerably more.
intensively with an increase of stresses, approximately proportional to the
square of the stress (see Chapter IV). Therefore, the magnitude of ice de-
orination measurable after a specific time interval following the application
of load, say after 5-10 seconds, will not increase linearly with increasing
stresses, but will increase more intensively. The elastic modulus calculated
on the basis of strain measurements should decrease correspondingly as the
stresses increase. This has been confirmed by experiments. For example,
the data of V. N. Pinegin (1927) show that the elastic modulus of river ice in
compression (at -30C) decreases with increasing stresses as follows:
F 2I Stress, kg/cm 1.07 - 3.75 3. 75-6. 44 11. 80-14. 48 17.16-19. 84
Elastic modUlus,x 103 kg/cm' 37.5 13.7 6.0 3.4
I' Our experiments showed a similar picture. We determined the
elastic modulus on the basis of measur rments of the flexural strain of pris-
matic ice beams 10 x 10 x 120 cm. Figure 9 gives a schematic view of the
i apparas and the loading of the beams. The experiments were designed to
study the plastic properties of ice and we investigated chiefly the long-term
plastic deformations. However, in passing we measured the deformations
which occurred after the application of load. The first reading was made
5-10 seconds after the application of load, then after 1, 5, 10 and 30 minutes,
and further after longer time intervals. Similar measurements of the de..
formation were made after the magnitude of the load had been changed. fhe
elastic modulus was calculated on the basis of the first meas'rement of sag
after the application of load or the change of load, according to formula:
aP 3 a 2 -a) 22A 4(2)
*4 - Z5 -

= -1where AP is the change in magnitude of loading-of the beam in kg, a 6 is the
discontinuity of the sag value caused by the change in load in cm, 1, a and Jare, correspondingly, the span of -the beam, the distance between weights and
the moment of inertia of the cross secion of the beam.
Table 3 shows the results of one series of experiments. Thr,-e
beams were tested simultaneously. Beams I and 2 were cut from ice of reg-ular structure, which had formed during the calm freezing of water in an open
reservoir, and beam I was tested such that the axes of the crystals were hor-
izontal, perpendicular to the plane of flexure (01 f and 0. 1), while beam 2 was
tested such that the axes of the crystals were vertical (011 f). Beam 3 was cut
from ice of random structure frozen from a mixture of pieces of ice, snow and
water. Predetermined weights were placed on the beams, the beams deformed
plastically for a long period of time and then the 'weights were removed. Afterseveral days the last stage of loading was applied to the beams. It should heiacietdiL ih decrease of deformation upon removal of the wo';.ehts corrrj-ponded
approximately to the increase of deformation upon application of the loads, i. e.,
the values of the elastic modulus during loading and unloading were nearly
identical, despite the considerable plastic deformations which occurred during
the period between loading and unluading. From the data given one can see that
the magnitude of the elastic modultis is determined basically by the size of theload (the stress) and decreases as the load is increased. However, a diffMr-30C.
in ice structure and the direction of the crystal axes with respect to the action
of the forces did not cause any substantial difference in the obtained values of
the elastic modulus.
According to the data of V. P. Berdennikov (1948), the elznticmodulus of ice is a function of the ice temperature and decreases as the tempera-
0 3 2 3 2ture increases (at -40 C, E = 95 x l03 kg/cm ; at -2°C, E = 90 x I0 kg/cm 1.The salinity of ice increases the temperature dependence of the elastic modulus,
in this case the decrease of the elastic modulus of salty ice compared with pure
ice is a function of the liquid content in the form of brine cells.
With frequent repeated loading and unloading, the elastic modulusof ice increases with the number of ioadings (Pinegin, 1927; Kartashkin, 1947),and the rate of increase of the modulus decreases as the number of loadingn is
increased (table 4).
26

im
The elastic modulus of ice depends essentially on the density of
the ice and decreases with decreasing density, e. g., Nakaya's (1958) data
show the elastic modulus of ice of density 0. 910-0. 914 to be 90 x 10 kg/cm2n
while ice of density 0. 900 has an elastic modulus of only (70-80) x 103 kg/cm 3
and ice of density 0. 700 a modulus of 40 x 103 kg/cm.L
Generalizing the results of the investigations, Veinberg (1940)
considered the elastic modulus of ice to be (70-80) x 103 kg/cm 2 . Later,Kartashkin (1947), on t , basis of numrer ur, 'xperiments, established that the
elastic modulus in compression, tension and flexure at temperatures from -5003 2
to -16°C is, on an average, 40 x 10 kg/cm . At the same time, Berdennikov
(1948), having determined the modulus by the acoustic method considered it to
be 90 x 103 kg/cm 2 for monolithic ice.
Analyzing these recommended values for the elastic modulus of ice
and also keeping in mind the results of experimental determinatiots reportcA
above (in tables 1 and 2), we came to the following conclusions:
1. The elastic modulus of ice is, to a certain extent, indetermin-
able, because it is very difficult to distinguish the purely elastic deformation
of ice.
Elastic deformations are those deformations of a body which
disappear after the forces which caused the deformation have been removed,
i. e. . they are reversible deformations. The theory of elasticity contends that
the deformation occurs at the moment the load is applied and disappears com-
pletely when the load is removed. However, the elastic aftereffect is strongly
manifested in ice and the reversible part of the deformation does r-'t occur
immediately after the application of load, but increases over a certain period
of time. Correspondingly, when the load is removed that part of the deforma-
tion does not disappear immediately. Thercforc, the magnitude of the elastic
(reversible) deformation of ice is a function (in contrast to the deformation of
elastic bodies) of the duration of loading. Correspondingly. the elastic modulusof ice, which characterizes the relationship between the magnitude of the defor-
I mation and the load, will also be a function of time
2. If by elastic deformation of ice we mean only that part of the
reversible deformation which occura instantaneously (at the speed of sound) at
the moment the load is applied, the elastic modulus should be determined only
-27
by dynamic methods of investigation. in such a case, the most reliable value
of the elastic modulus of ice will be E = 90, 000 kg/cm. It is recommended
that this value be used in calculating the elastic deformation of ice underdynamic loading.
3. When the loading effect is quite prolonged, som.times it is ex-
pedient to take the value of the reversible deformation, which occurs duzing
the first seconds after the load is applied and which is a more realistically per-
ceptible value, as the initial elastic deformation. For calculations of the value
of such deformation in compression, tension or flexure, the value E : 40, 000
kg/cm may be taken as the elastic modulus of ice and in this case one should
7 : consider the above-mentioned relationship of this value to the stresses and
other factors._ _ _ _ _ _
~ I THE SHEAR MODULUS
The shear modulus characterizes the resistance of ice to sho.iring
strain.If an elementary cube is removed from a mass of deformable ice,
its angular strain y , in agreement with the theory of elasticity, may be ex-
*pressed by the formula:
G (3)
where T is the tangential stress and G the shear modulus.
As in the case of the elastic modulus, static and dynamic methods
are used to determine the shear modulus. The most frequently used static
method consists in testing cylindrical or prismatic ice samples in torsion,
since in this case conditions are created for pure shear.
Table 5 shows some results of experiments for determining the-
shear modulus of ice. The reasons for the considerable discrepancies in the
values obtained are basically the same as those which arise in determining the
elastic modulus.
By analogy with the recommended values of the elastic modulus,
we propose the following values be accepted for the shear modulus of ice:
-28-

a) for calculating the elastic deformation during dynamic loading,
G (30-34) x 103 kg/cm2 ;
b) for calculating the initial deformation during prolonged loading
(deformation occurring during the first few seconds of application of load),
Gs" 15x 03 kg/cm'.
POISSON'S RATIO
The coefficient of transverse deformation, or Poisson's ratio, is
the ratio of the transverse deformation to the longitudinal deformation of a
sample when compressive (or tensile) forces are applied to the sample and
when the dimensions of the sample may change freely in transverse directions.
t. ' In the case of elastic deformation, Poisson's ratio i. ._cnnectvdU1
17 with the elastic modulus and the shear modulus by the following relation.
ILZ_ 1. (4)
V.N. Pinegin (1927) has made the only direct measurements of
Poisson's ratio for ice. Veinberg (1940), on the basis of an analysis of the re-
suits of these measurements and oa the basis of a comparison of the propaga-
FV tion velocities of longitudinal and transverse vibrations in ica and also by a
comparison of the elastic and shear moduli values drawn from the data of varlta
investigations, established that the value of the Poisson ratio closest to reality
is 1. o. 36 - 0. 13.
The considerable variations of the possible values of Poisson's ratio
may be explained in part by the fact that the ela3tic deformation of ice takes
place in conjunction with plastic deformation and that it is difficult to distinguish
purely elastic deformation. The plastic deformation is characterized by a
change in the form of the ice sample without a change of its volume, thus Pois-
son's ratio for pure plastic deformation is 0. 5. Consequently, when the load
is increased, when the plastic deformations appear more rapidly, Poisson's
ratio will increase to a certain extent. Further, the anisotropy of ice also
affects the value of Poisson's ratio.
- 29 -

B. D. Ka,:tashkin (1947) considers that Poisson's ratio, on anaverage, is 0. 34 for ice in the temperature range -5 0 C to -16 0 C. He bases
hi value on his experimental determinations of the value of the elastic andshear moduli.
B. A. Savel'ev (1953) recommends that the value 0. 36 be takenI for Poisson's ratio in calculations.
30I

CHAPTER IV
THE CREEPOF ICE.
Creep is the term used to define slow and steadily increasing de-
formation of a material under the influence of constant forces or stresses.
Creep deformation in ice is irreversible (plastic) and is often regarded as
slow flow.IThe creep process is associated with continuous changes of form
without change of volume and occurs only in presence of shear stresses, be-
cause only densification occurs under uniform hydrostatic compression.
Therefore, the basic laws of creep are given first for the case of pure shear.
CREEP IN PURE SHEAR
Figure 14 shows characteristic creep curves of pn!-.-,rVitallinv.
ice. In all cases, elastic deformation y elastic takes place at the moment tho.
shearing force is applied and creep deformation y creep begins; in the initial
period the creep rate gradually decreases to a value which is a function of
the value of the shear 'stresses.
In the case of small stresses a constant rate of creep is subsequently
established, i. c., the stage of steady-state creep which may continue for an
indefinite period of time (providing, of course, that the stresses, temperature
and conditions of deformation are constant and lie within certain limits where
the change in structure and orientation of the ice crystals may be neglected).
When the stresses increase, the rate of steady creep increases and, correspon-
dingly, possibLlities arise for a more rapid change of the ice structure, which,
in turn, may change the rate of deformation. Therefore, when the stresses
increase, the stage of steady creep becomes limited in time and passes into the
stage of accelerating creep. The greater the stress, the shorter the time inter-val of steady creep and the sooner accelerating creep begins. Finally, when the
stresses ,txc#.ed a certain limit, the distinct segment of steady-state creep dis-
appears.
In this case, after a smooth decrease of the creep rate during the in-
itial period to a minimum velocity. the creep rate begins to increase gradually,
-31-
becoming progressive 2ow, and this scts in the more rapidly the greater the
stress.
One may judge the validity of the general laws of ice creep given
above by the experimental creep curves shown in figure 15, obtained fromI long-term experiments on the torsion of cylindrical ice samples (Voitkovskii,
1957). Hollow ice cylinders 800 mm long, with an outer diameter of 120 mmand an inner- diameter of 78 mm, consisting of artificially frozen poiycrystalline
ii ice were used in the experiments. In torsion the stresses were quite uniformin all the cross sections of the tubes, which permitted us to calculate thermag-
nitude of the relative shear deformation and to establish the quantitative re-
lationship between the magnitude and rate of shear and the value of the tangen-
tial stresses on the basis of the angular strain of the tubes. The experiments
were conducted at a constant temperature and over a sufficiently/ long p-er.id2of time. As is evident, with stresses less than 2 kg/cm in tii cases Ma ap-
r - proximately constant creep rate was established after 50-100 hours following
the application of load. Individual experiments lasted up to 5, 000 hours and
even after such a long time interval there was no tendency toward an increasc,
t of the creep rate.cm2 ,
With a stress of 2 kg/cm a constant creep rate was establishedafter 70 hours, but after 200 hours (at a temperature of -1. 80 C) the creep
rate began to increase gradually. iith a stress of 3 kg/cm 2 there was noclearly defined straight-line segmcr.t. During the initial 30 hours, the creep
rate gradually decreased and then began to increase.
For convenience in some of the conclusions which follow, the author
has used the term 'the limit of prolonged creep" or T to indicate the stress
above which prolonged creep at a constant raic is no longer possible. In pas-
sing, it should be mentioned that this limit is somewhat arbitrary, since there
is no clear stress limit to define the conditions which would permit prolonged
steady-stite creep, on the one hand, and transiion to the stage of acceleratingcreep without the stage of steady-state creep, on the other. A quite prolonged
stage of steady-state creep, which then became accelerating creep, watt obser-
ved in a certain range of stresses. Furthermore, even in absence of the steady
Il3
- 32 -
*1

creep stage, with a transition from the initial stage of decelerating creep to the
stage of progressive flow (characterized in figure 14 by a. bend in the curve T4),
there was a segment where the creep rate changed comparatively little and
during short-term experiments this is sometimes erroneously ass,.med to be
steady creep.
In this connection, it has been proposed that the limit of prolonged
creep should be the stress at which there is a clearly defined stage of steady
creep lasting at least as long as the initial stage, namely, the stage of decelera-
ting creep (of the order of 100 hours), i.e., when the tendency toward an in-
crease of the creep rate may not appear sooner than 200 hours after the begin-
ning of the deformation (with constant stresses and temperature).
According to my experimental data, the limit of prc!.:ied creep
T of ice is as follows: approximately 1. 6 kg/cm at -I. 2°C (Voikovskii, 195
approx. 2 kg/cm at -1. 8 C (see the creep curve for T - 2 kg/cm2 in fig. 15;and 3 kg/cm 2 at -4°C (see fig. 16).
FFigure 16 shows the character of the change in the rate of steady
creep as a function of the stress value. The shear-rate values taken here as the
basis for the experimental works of the author on the torsion of ice cylinders
with a stepwise increase of stresses are as follows: for curve 1, values taken
from an earlier published work (VoitkovsKii, 1957); for curve 2, the values from
table 6 (ice cylinder No. 5). In figure 16a, where the experimental data are
plotted against the corresponding values of tangential stresses, it ie evident
that the rate of shear is small when the stresses are small. When the stresses
increase, the rate of shear also incieaseti, at firut smoothly and then quile
abruptly. When these values are plotted on a double logarithmic scale (fig. 16b),
the points lie fairly well along straight lines. This means that the relationship
between the steady rate of creep .. and the value of the tangential stress
with constant t.emperature may be defined by the equation
j00 ke T n (5)
- 33 -
N

IIwhere k and n are constant factors (in the given case, n: Z-2. 2; in other
experiments by Voitkovskii the n-value for ice of random structure varied~from 1. 6 to 2. 2).
Grrard, Peruts and Roch (1952) first proposed an equation of
this type for ice on the basis of measurements of the vertic- distribution of
flow velocities in a glacier. They used the following values for the constants:
n 1 1. 5 and k " 10 8, where the stress is measured in bars and the rate of
shear y in seconds.
Glen (1952, 1955)used a similar equation. He established that in
the case of unilateral compression of cylindrical samples of fine-grained poly-
crystalline ice, the ratio of the minimum strain rate i obscrved during the
experiment and the stress value a (within the limits 1-10 kg/cm Z) is expressedby the formula
= ko(6)
where n = 3. 2-4.
Glen's values of n are frequently cited these days in glaciological
literature, but one must remember that they are too high to bc representative
of the prolonged steady creep of ice. In most of Glen's experiments the stres-
ses exceeded the limit of prolonged creep and there was no stage of steady
creep, while Glen compared minimum rates of deformation without considera-tion of the character of the creep curves.
For small stresses, the minimum rate corresponds to the rate ofsteady creep, but for stresses exceeding the limit of prolonged creep "t Ierely
characterizes the transition from the decelerating creep in the initial period
of stress to progressive flow. Thcr-_-fore, it is doubtful whether the laws of
change of the minimum creep rate would remain idcr.tical "n both cases. One
can see this bj examining the logarithmic relationship (fig. 16) betwecn fherate of shear and the stresses, where one may see that the straight lines tend
to bend upward at stresses near the limit or pro!ongcd creep, which indicatesan increase of the n-value at these stresses. This also follows from a
-34-j
III
comparison of the expcrim.aental creep curves given ia figure 15. For example,
a comparison of the rate of steady creep when T = 1. 0 kg/cm 2 (i 1. 5 x 10- 5
I/hr) with a minimum creep rate when T Z 3 kg/cm 2 Q = 50 x 10- 5 I/hr) will
show that the minimum shear rate-increased more than 30-fold with a 3-foldincrease of stress, i. e. , approximately proportional to the cube of the stress,
which corresponds to the n-value determined by Glen.
When temperature is taken into consideration, tae relationship be-
tween the steady rate of creep of polycrystalline ice in pure shear and the
value of the tangential stresses is defined by the equation (Voitkovskii, 1957)
K nY 00-1 + 0 (7)
where e is the temperature of the ice In °G without the minus sign); K and n
I ate factors dependent upon the ice structure (for icr of random a:ructuie.
n - 1. 6-2. Z and K (1. 6-4) x 105 degree/kg n hr.
This latter equation is obtained from the relationship between thestrain rate and the temperature, ".f the ., value from formula (5) is substi-
tuted for - and if K : (I + Oo)k o .
The increase of the deformation- value during the creep process,
with consideration of the initial stage may be expressed by the empirical for-
mula (Voitkovskii, 1957)
Y t Yelastic + t+ [jo t 0 a (8)
where y t is the total deformation after any tine interval t (in hours) following
the application of forces (the beginning of the effect of shear stresses); y elastic
is the elastic deformation; t is the time from the moment of application of load
in hours; to ,a, m arc empirical coefficients (in the dc-a.ribcd expertiments they
have the following values: to : 30-100 hours; a a 0. 5; n 0 0. 5-1. 0).
In this formula the total deformation is expressed as the sum of
the elaistic and creep deformations and the creep deformatton is arbitrartly
3
II

1I WI divided into two components: steady creep (the second term) and trancient
creep (the third term). Figure 17 depicts the division of the total deformation
into the indicated components. The creep rate An the initial period after
loading may be expressed as the time derivative of equation (8)
. a m to 9
: (I 1 + lat )m + I
For the case where the shear stresses exceed the limit of pro-
longed creep, thus far we have not been able to establish the quantitative re-
lationship between the creep rate, the stress value and time because under
such circumstances the creep rate is variable and may change within verybroad limits depending on the conditions of deformation, the structure of thi
ice and other factors.
In a number of cases it is desirable to know the time dependence
of the shear strength of the Ice (resistance of the ice to sh',or with a goith .
jjj rate of deformation. Thus far, no direct measuromrints have been nade 'f
the resistance with small strain rates which do not cause destruction of thtu ice
However, one may get some idea of the nature of the change of resistante y
analyzing the creep curves. The laws of the rate of chiange of creep of fi-o
with time and various conitant stresses, based on the experimental curvees
of creep (see fig. 15), are of the form represented in figure 18a. If a horizon-
tel line corresponding to a specific creep rate (e. g. 4)is dratn across this
scheme, the r-vaUes at the points of Internection of this curve with the curves
cst-" f(t) may, under certain assumptions, be regarded Uis the values
of the reaitance at a constant rate of shear 4 If thuio rasistatnco values
are plotted against the corresponding times (fig. 18b), one will got the curves
of the change in magnitude of the resistance of ice with tihni and a constant rate
of deformation,
As is evident from this scheme, the change of the shear strength
(resistance) value is a function of the given rate of deformation, With a small
rate of shear, the resistance will increase smoothly to a certain value which
may be determined from equation (7), after which it will remain constant. If
the shear rate corresponds to the ieady-statw creep rate with a stress close
to the limit of prolonged croep after an interval of constant resistance
-36-

V --
it may decrease slightly in connection with the gradual change of 'Ace structure.
When the shear rates tuxceed the possible rate of prolonged steady creep, the
value of the resistance after attainment of the maximum value will gradually
decrease to a value close to the limit of prolonged creep.
THE INFLUjENCE OF TEMPERATURE
The creep rate inc~reases with increasing temperature. This rela-
tionship is especially strong at a temperature close to 0&C. On the basis of
experimental da~ta, Royen (1922) described the relationship between the value of
the plastic deformation of ice (in compression) and temperature by thes empirical
formulaf
B (~+0 (0
where 0 is the temperature of the ice w~th#,ut the minus sign and B is 4 cor.Rtant
which differs in each individual case.T
Experiiments on the flexure of ice beams a-d the torsion of ice
cylinders (Vaitkovskii, 1956, 1957) have shown that the change in the value
of the rate of steady creep with given conditions of deformation (stressen) as0function of temperatures within the range -1Cto -40 C is expressed by an
empirical formula analogous to Royen's (10)
where j. is the experimentally determnined rate of ateady creep at any tef-.I
perature 00; j is tho rate of steady creep at any temperature 0.
This formula is acceptable for casos of pure shear ars well as for
other types of dczormation (compression, tenition, flexure, deformation wit~h
a complex state of stress), provided there is a stage of steady-state creep
and that the stress v.alues remain the same at all points with a change of tem-
perature, i.e. , provided a change of ttemperature does not cause a re-distribu-
tion of the internal stresses.
Figure 19 shows the results of one of the experimeznts on the in-
fluence of tempe rature. The expe rim nt consisted in the following: Weights
- 7-

were placed on a 10 x 10 x 120 cm beam of ice of random structure (the dia-
gram of the apparatus and the loading of Lhe beams is shown in fig. 9), after
which the sag values were measured systematically, which made it possible to
determine the rate of sag of the beam. The temperature in the room where the
experiment was conducted was kept approximately constant during the time
required to establish a constant sag rate, after which it was changed and the
steady rate of sag was aain determined. The temperature was varied from
-10°C to -40°. In figure 19, the experimentally determined rates of sag of
the beam at the cozresponding temperatures are indicated by the circles. As
can be seen, within this temperature range these circles correspond satisfac-
torily to the curve which depicts graphically the relationship between the creep
rate and the temperature, in agreement with formula (11), if we assume that:4 x 10- 3 cm/hr at -3.5GC (9 - 3.5).
The examined relationship between the rate of steady creep a..tl
the temperature may be employed to determine the influence of tenperature on
plastic deformation after a specified time interval during the initial period
after application of load, as follows from an analysis of formula (8). In Liuis
case it should be kept in mind that this can be accepted fully only when the
stresses do not exceed the limit of prolonged creep. If fthe stresses are largo,
however, the temperature relationship may be more complex, since the very
limit of prolonged creep is a function of temperature; furthermore, the creed
rate, as indicated above, is very variable under these conditions and depends
on many factors.
Some investigators have proposed other equations for the relation-
ship between the creep rate of ice and temperature, but these equations have
not been properly verified by experimental data. For example, Glen (i955)accepted the equation
0-Ae" " (12)
as ax expression of the relationship between the compressive strain rLtC
and the absolute ice temperature T. Here A is a constant, a the gas constant
and Q the activation energy (a heat of activation).
-38

I'Earlier, A. R. Shul'man (1948) declared it possible to use such
an equation to express the relationship between the viscosity of ice and tem-
perature. Later, Jellinek and Brill (1956) used a similar equation. However,
Voitkovskii's experimental data indicate that the above equation (12) does not
ceflect the acttual abrupt increase of creep velocity with temperature above
-5 C to -3°C; therefore, we do not recommend its use.
CREEP UNDER THE SIMULTANEOUS INFLUENCE OFNORMAL, ANiD TANGE NTIAL STRESSES (IN A-COMPLEX
STRESSED STATE
Uniform hydrostatic pressure does not exert a substantial influence
on the character and the rate of creep. Rigsby (1958), in conducting experiments
on the shearing of ice crystals at pressures up to 306 ain, established that the
rate of shear deformation is practically independent of pressure if the difference
between the ice temperature and the melting point (which varius -7 a fuictior: of
pressure) rtatiains constant. If the temperature of the defor.e;ag ice reniat:,6
ronstant, the shear strain rate will increase somewhat with ipcrcasing preo'sure,
but this increase becomes substantial only at quite considerable pressures. For
example, at a pressure of 306 atm, the shear rate approximately doubled. Thu'-,for the most part hydrostatic pressure is expressed merely as follows: it re-
duces the melting point of ice and its influence on the creep rate is equal to the
effect of an actual increase of ice tbmpcrature during the deformation of the ice
Irregular or unilateral pressure, as distinct trom hydrostatic, has
a substantial influence on the creep rate. To arrive at a quantitative estimate
of its influence, I conducted long -term experiments on the simultaneous torsion
and longitudinal compression of hollow ice cylinders consisting of ice having
randomly oriented crystale. During the experiment, normal and tangential
stresses, distributed quite uniformly and identical in magnitude, were createdin all cross sections of the ice cylinder. This made it easy to determine the re-
lative angular and longitudinal strains. The values of the torque and longitudinal
force were chosen such that the influence of normal stresses oi creep could be
traced fo. given constant values of the shear stresses.
In all, six ice cyliders were tested. Various cosa8inations of the
simultaneous effect of normal and tangential stresses were created for each
- 39 -

22cylinder (normal from 0-5 kg/cm 2 , tangential from 0. 75-2. 5 kg/cm2). Each
state of loading was continued for at least 200 hours, so that the rate of steady
creep could be determined.
11 Figure 20 shows the order of magnitude of the change in the valueof the stresses and the character of the creep curve for one of the experiments.The results of the remaining experiments are given in table 6. As can be seen
from figure 20, a constant rate of creep was established for all combinationsof stresses except the case where the limit of prolonged creep was exceeded.
In this latter case, the rate of shear did nut depend solely on the value of thetangential stresses but also on the value of the normal stresses acting in theshear plane and increased as the normal stresses increased. Similarly, therate of longitudinal compression at a constant compressive stress increased asIthe tangential stresses increased in the planes perpendicular to the directionof compression. Thus, the steady rate of creep in the complex stressed state
Pre--------- -- ---- - -
j Analysis of the experimental data shows that the steady-state creepof polycrystalline ice in the complex stressed state may be expressed with theaid of equations of the theory of plastic flow (Sokolovskii, 1950), assuming that
I: the value of the shear strain rate of ice L is a specific function of the valuc ofLthe tangential stresses S:
i L = f(S) (13)S2 2 2 2 +
,- where L:' (2 [(ix )}+ (iy. z} + (iz. )2 + Yx +yi +ix
[ xy yz 4T zx
Here it is assumed that the stressed state at any point of the body is charac-terized by the stress components a' r ., r xy r yz and a while therate of deformation is determined by the six components of the strain rates inthese same axes ( , C *y , (z xy y' #izx
For the case of pure shear, when L " and S T, this relation-ship, in agreement with eq. (7), should appear as follows
-40-
LII

TT (14)
Proceeding from the generally accepted hypothesis of proportion-j ality of the principal shear rates and the principal tangential stresses, theratio of the deviator of the strain rates D. to the deviator of the streacs Dcshould be proportional to the ratio of the value of the shear strain rates to thevalue of the tangential stresses:
wherefl D. ! xy (
I. I zy Z
D. r ax -:av xy
T YX y av yzT T a" -zx zy Z avi
5; Substituting the L-value from (14) in this equation, we get thegeneralized relationship between the rate of steady creep of ice in the comn-plex stress state and the temperature and stresses in the form:
D KS"' D(6
n-i a' -KS~z - ~y z)Th
Yyz Z) - jr -+(y, x
IL-
-41-
Table 6 gives the actual values of the relative increase of thc shear
rate due to normal stresses and also shows the values calculated onl the basisof formulas (16). A comparison of these figures shows the agreement of the
given experimental proposals concerning the generalized relationship between
the creep rate and the stresses and temperature.
Figure 21 shows graphically the results of determining thie steady
rate of shear j.for cylinder 6, plotted on a double logarithmic grid against
corresponding values of thc rate of change of tangential stresses. Thle dashed
line here characterizes the relationship between the rate of shear and the value
of the tangential stresses in pure shear, while thle tangent of tile slope angle of
this line characterizes the magnitude of the coefficient nt in formula (7). Thle
points corresponding to :;hcar rates with identical values of tangential stress
but with different values of normal stress are connected by solid linies. Tile
points lie along straight lines, the tangents of the slope angle 0" these i;'sare
approximately a unit smaller than thle tangent of the slope angic of the da.:-
line. This means that the rate of shear and thle rate of change of stress-s wvith
constant tangential stresses in the shear plane are related by a power funcwtion
n-
of the type j 0 &S-, corresponding to formula (16).
Employing relationship (16), one may calculate the rate of steady
creep of ice with different types of deformation: tension, flexure, compre~So')i~,and the more complex types of deformation. Then, uy comparing Elhe .iatually
observed rates of creep with the corresponding calculation formulas, Otte may
datermitte K and n, which characterize ice creep. Thus, onl the basib of an-
alytical calculations of the sag rate of ice beamis, proceeding fromt the relation-
ship (16) and the experimental data on the bending of beamns, I found thle following
values for ice of random structure: n Z1. 8 and K z2. 3-2. 5 cm .n degree/kg . hr
(Voitkovskii, 1957), which fully corresponds to the values of these coefficients
in pure shear. This is another indication of the applicability of ecis. (16).
As experiments have shown, the basic feature, of the laws of the
creep of polycrystalline ice in a complex stressed state are thle same as those
described above for pure shear (see fig. 14), except that the limit of prolongedcreep in this case corresponds to a value of tangential trreases which, with
soe approxiation, may be regarded as the aximum shear stress. One may
-42-

assumne that the calculated coefficients K and n, characterizing the creep rate
and the limit of prolonged creep, are the same as in the case of pure shear*.
Here we should emphasize, as we did in describing creep in pure
shear, that the proposed generalized relationship (6) is completely valid only
for cases where the stage of steady-state creep is observed. Quantitative laws
have not yet been established for the change of the rate of deformation during
the stage of accelerating creep.
The change in the magnitude of ice deformation during the initial
period of creep after the application of load may be calculated by an empirical
formula similar to formula (8), substituting in it the steady-state creep in a
given stress state calculated on the basis of (16) in place of j.0" For exaxrple,
1_r the case of unlateral a ajn-iu (ur iension), a change i- mu. value -.i tme
relative compressive (or tensile) strain is expressed by the formula
K no o 1 + 0 " - -n+i
(17)
2 at¢rK 0" * o
(taking n -"2 and m "-1).
Sometimes Royen's y922)empirical formula
is still used to calculate the value of ice deformation in compression and the
thermal stresses in ice. In Royen's formula ( is the relative compressive
* I assume that the normal stresses and especally hydrstaii, pressureS may raise the limit of prolonged creep of ice somewhat. however, this has not
yet been confirmed experimentally.
-1
strain and c (6-9) x Io 4 . However, Royen's formula has a number of sub-stantial defects. First, it assumes a linear relationship between strain and
t stresses, while the strain actually increases approximately in proportion toF1 the square of the stress. Secondly, according to the formula the strain rate
should decrease continuously, while actually it decreases only during theinitial period and then a constant creep rate is established or acceleratingcreep begins. Therefore, we do not recommend its use in calculations.
[1 VISCOSITY
Most researchers have examined the creep of ice as viscous flow,with a velocity that can be characterized by the viscosity coefficient. There-fore, the study of the creep of ice usually amounts to a determination of the
viscosity coefficient.
The coefficient of viscosity characterizes the internal frictioni..... appears durlLijg the ric.Llvc movement oi the adjacent i.-,e.-- ot a Lodv
Li and which depends on the forces of adhesion between the molecules. It rmay beexamined as the resistance of the body at a given moment of its deformationper unit surface of the shear layer and per unit angular velocity of the shear(Veinberg, 1940). The coefficient of viscosity is measured in poises:
1 poie "- 1dyne. sec . .0102 g. WE. se
I poisecm cm
Results of determinations of the viscosity coefficient can be foundin the works of B. P. Veinberg (1906), Deeley (1908), Lagally (1930), P. P.Kobeko (1946), V. V. Lavrov (1948), A. R. Shul'man (1948), S. K. Khanina(1949) and others. The data obtained are so contradictory (individual values
10 15of the coefficient of viscosity for ice vary frorn 10 to 10 poise, i.e., theymay differ by a factor of 100, 000), that they are not conducive to establishinga definite law of change of the coefficient of viscosity. The discrepancieshave been ascribed chiefly to the influence of the ice structure and the direc-tion of the deformation with respect to the optic axes of the ice crystals.
Actually. however, the main reason for the large discrepanrionbetween the dctcrmined values of he viscosity coefficient is that this cofficint,
-44-
LII

when applied to ice, is not a specific physical constant but is arbitrary,
since it may vary within wide limits depending on the magnitude and dura-
tion of the stresses, in addition to their dependence upon the structure and
orientation of the crystals and the temperatur'z. Furthermore, crude methodo.-
logical errors are connonly made since the above factors are usually
ignored in determining the coefficient of viscosity.
I The coefficient of viscosity of ice is usually calculated on the
basis of measurements of the rate of deformation (strain), proceeding irom
the assumption that ice satisfies Newton's law of viscosity, i.e., that the re-
ilationship between the stress values and the rate of strain is linear. The worksof Glen (1952, 1955) were the first to show that ice does not satisfy Newton's
law of viscosity.
The works of a number of investigators, namely, Glen (1952, 1955),
Gerrard, Perutz and Roch (1952), Haefeli (1952). Steinemann JiQ541: Voitktv-
skii (1956, 1957) and others have proved decisively that the relationship b'ween
the stress values and the strain rate is not linear and that the coefficient oi
viscosity of ice is not a specific physical constant but a variable depend-int
upon many factors.
The relationship between the strain rates and the stresses in ideally
viscous flow (n I) can be expressed in general form by the equation
D). DT (19)
where i. is the coefficient of viscosity.
Uf the stage of steady creep is examined arbitrarily as viscous
flow, the coefficient of viscosity of ice for this case, using formulas (16) and
(19), should he
+KS n (20)
i.e., it depends on three factors: ice structure, chara,'terized by the coefflrc4nt.
K and n, temperature, and the intensity (rate of changC) of the tangential
stresses.
- 45 -
In cases where there is no prolonged stage of steady creep, the
coefficient of viscosity becomes a completely indeterminable value. There-
fore, the coefficient of viscosity of ice may be examined only as an arbitrary
value characterizing the relationship between the stress values and the creep
rate with given strain conditions at a given moment of time.
CREEP WITH VARIABLE LOADING
When the load is changed, the rate of deformation changes abruptly
and within a certain time after the load is changed (up to 100 hours) the charac-ter of the change of the deformation and the rate of change are functions of
both the magnitude of the acting stresses and the magnitude of the stresses
before the load was changed, due to the appearance of an elastic aftereffect
(see Chapter II).
If the load on the ice at a specific moment of time L is changcJ
and the stresses consequently change from T I to T, the further behavior of
the deformation may be described by the formula (Voitkovskii, 1956)
Y t - (Ti t) + Y (T t-t) Y (TI t-tl) , (21)
where y t is the magnitude of the deformation (strain) at any time, y , t
is the deformation which would have occurred at time t if the stresses had
not changed (with T y (T, t-tl) is the deformation calculated on tile basis
of formula (8) for t-t I with stress T 2 ; y (Tl, t-tl) is the same as above with
stress T
Figure 22 shows a scheme for calculating the magnitude of the defor-
mation on the basis of this formula. Here it is assumed that the total defor-
mation at any moment ir time after the change of stress may be expressed
as the sum of two arbitrary values. The first of these is thr, strain which
would occur at the tine of interest to us if the stresses did not change. The
second it the dirfernce between the calculated strain values for the new and the
old stresses. In die diagram, which shows a case of the reduction of stresses,
this difference is negative and is shown by the shaded portions.
-46-
The subsequent changes of stress may be calculated analogously.
In the case of unilate:ral compression of the ice, with a change of stress from
a' to r 2 (stress r acted during time interval tl), the further change of the
relative compressive strain, in agreement with (17) and (21), is expressed as:
a. a2 + K . t 1 1 (t-t 1I f+at _; + (a a.
at0 2z+ +a (t-t
It should be noted that the values o the empirical coefficient
to may vary within quite broad limits. In cases of initial loading and an
increase of stresses t 0 30-100 hours, as shown by my experiments, buto
when stresses are reduced t - 5-10 hours, and with repeated increase- of0
t ...... to - 5 3 . (.V..........vb ki.. lj 6). Thcrefre. ;= f rrnuia ..
two values of the coefficient to - t0 1 and t 0 2 are introduced, which should be
assigned according to the specific conditions of deformation.
If the sign of the stresses changes when the direction of the loading
is reversed, the creep rate usually increases. For example, in my experi-
ments (Voitkovskii, 1957), the sag rate of the ice beams approximately doubled
with the same loading values when the direction of sag was changed. This
can be explained as follows. Usually, the creep of ice is associated with some
breaking of bonds and in a number of cases with the partial destruct ion of the
crystals in the shear surfaces, therefore the shear strength of the ice de-
creases in the direction opposite the initial direction.
RELAXATION
Thc term relaxation is used to define the decrease of the rests-
tance of a body during its steady deformation. The lawn of relaxation of
stresses in ice have not yet been studied sufficiently. B. P. Veinberg (1907)held that the relaxation of stresses in ice obeys Shvcdov's law, which states
that the stresses decrease exponentally when the strain is constant
i.4

tW-r (r- 0 x) e - , (23)
where tr o is the stress at the initial moment; o- X is the elastic limit and
a is the relaxation time.
However, this law is not very applicable to ice, because the
assumptions accepted initially in deriving the formula are not applicable
for the deformation of ice. The reason for this is tlzit the elastic limit of
ice is close to 0, while the relaxation time, which is related to the cocf-
LJ ficient of viscosity, is variable.
I Kartashkin (1947), in analyzing the results of his experimcn.z,
came to the conclusion that the relaxation of stresses can be expressed roughly
by a formula similar to formula (23). but with the final value of the stress
after a specified period of relaxation substituted for the elastic limit. How-
ever, this modification of the formula leaves quite a bit to be desired since
usually the final stress value is not known. Furthermorc, the relaxation
time a remains an indefinite value.
I We have used the above-described laws of ice creep and the
general postulations about relaxation to derive a more acceptable relaxa-
tion formula. The postulations about relaxation can be summarized as
follows: the total deformation value at any moment may be examined as the
stun of thc and p! c deformations. fur'her, during the process of
relaxation the reduction of stresses is due to the gradual reduction of the
elastic dcformation and the addition of the plastic deformatio Lei this same
value, according to the system:
-48
" initial Y ¥ elastic (t) + "' plastic (t) - const (24)
or
+ :0,Sclastic + plastic
where -y elastic and y plastic are, correspondingly, the elastic and plastic
deformations at any moment in time t and ela and ': are theestic plastic
rates of elastic and plastic deformation.
The rate of plastic deformation of ice (creep) is determined by
the intensity of the tangential stresses, thus the condition of relaxation, in
agreement with the above scheme, may be expressed as a sum of the rates
L ~~of chang. nf Piaptic anti piaa'.k sh-- inutgo(
Lelastic Lplastic:0(5
The rate of change of elastic shear strain, according to the theory
of elasticity, is
Li- 1 dS (26)'" Lelastic" dt (6
where G is the shear modulus.
Let us assume that the rate of plastic deformation diring the relax-
ation process is equal to the creep rate according to (9). Substituting the
value of the shear strain rate L for the value of the rate of angular strain
y in formula (9). we get [with consideration of (14) and m z 1] the following
values for the rates of change of plastic deformation:
' K ateplastic 1+0 plastic + a 7)
Substituting the values of Lelastle and l t in eq. (25), dividing the
elastic plasticvariables and integrating, we get
- 49 -
7plastic Ia)z
dS G 11 dt.%O; (28)
plastict= i
iniia , (nL Siiil + l a
hours.~ ~ 1 rIfW th(eaai n -1 iSimeatlafrte initial elastic defor-)
ationThe at eauato wis eof the reuto of ehrxaiowenr of sthesicesIagemnwihteexpericsntre and drati on bheforee raati of begn, w th ri
lue waill, dhecrasue of 5-10 houirs.lcefcen hudbefo o3
niatinFo thvle ashe of nixie oresofn hr. ic eassumif Gh ice00kg/ricms stese nn cr;e de3xforma0.5;ton 10;fthe relaxation euain willtaue thldeae form0 ous
00
tinitial (29)1 +0 26 5iiil I
YTW- 0 iitilt 111+0. 5t
Figure 23 shows the curves of relaxation of SLresses calculated by this for-inula for the initial stresses of 10, 5 and 3 kg/cm 2at -1. 60C. As one can
see from the graph, thle character of the relaxation curves t-orresponds to theexperimental relaxation curves obtained by Kartashkin (see fig. 13). However,the relaxation formula which we have proposed requires further experimentalverification and refinement.
so

THE DEFORMATION OF ICE IN AN INHOMO(,'-NOUSSTRESSED STATE
A homogeneous stressed state in ice is created only tn experimentswith unilateral compression or elongation of samples of regular form or intexperiments with torsion of samples made of thin-wailed tubes. Experimentsof this type are required to establish the laws of ice creep and to evaluatethese laws quantitatively. In all other cases, after a load has been applied toa mass of ice or to an ice sample, an inbomogeneous stress is created inwhich the magnitude and direction of the main stresses differ at different points.
The appearance of an inhomogeneous stressed state during the defor-ination of ice causc6 a redistribution of internal stresses, since the laws ofthe distribution of stresses differ for initial elastic deformation and for creep.In the stage of elastic deformation there is a linear relationship be%.ween themagnitude of the deformation and the stress, while in thc ra-4# of creen, Usemagnitude (rate) oi dciormation increases considerably Lakpidly ti.a,, thestress. Rapid plastic deformation can occur in places where higher shearstresses develop during initial elastic deformation, but since the deformationsare continuous this will be prevented to a certain extent by the more slowlydeformng (less stressed) adjacent sectors. To summarize, the stresses inthe more stressed portions will decrease in part (relax) due to the increase ofstresses in the nearest less stressed portions.
An example of the redistribution of stresses for the case of the bend-ing of aix ice beam (Voitkovskij, 1957) ;.- illustrated in figure 24. The dashedline here shows the distribution of stresses in the cross sectionk of a bicaml atthe initial moment after application of load (during elastic deformation). Thesolid line bhows the diAribution of these same stresses during steady-statecreep. Trhe maximum stresses at the upper Anzd lower surface of the beamdecreased, while the stresses in the middle part increased.
The rate of redistribution of internal stresses dlepends on the M.Lg-nitucic anti the inhomogeneity of the initial shear stresses in the deformtngmass of ice. The more intense the shear stresses are, the more rapid willbe the plastic deformation and the more rapid can be the relaxation of stresses.An especially intensive redistribution of stresses occurs in cases where shear
-51
Im

stresses %=-*64ing thia Ifn'it of longed creep appear at the& initial m~oment
Sfter appLicztict af loa4 simcc condiio n-- are crxeated far progre s ive f row-
at points of ased, atrwsx. Sear stmssa& exwceeding the limit of ptolonged,
creep say be preserved only 6tring a Limited timre period. Under such~
stresses, the defizrmaue va mar disintegrate as a result of accelerating
creep or the large stresses decrease due to their reditribuio.
IThe redistributon of int-rnal. stresses causes w roduction. of the-
rate of pLanic d er--a of the toadied sarmpke or of the mass of ice a: a
Whole.. Therefore. in. the cage of am inh o-eneoxs streissed s=a'&. the inital,
gradihaa1y-de'creasiag transient stage of creep may be- very prlonged. This-
may be seet- 1n the case of:hw insertiom of ruid dies int ice.. For example,
accardling to the experiments carried out by- Votiakov im L956 in. the Laboratory
of Soil Mechanics of the lortheaster Section f the- InstitUte of Permalcost.-4--M- of ofth- =f --- -- - = e- ..
gra6xaty dctesew orr ap~rximtetr LOQGhotrs, and onl~y thex. was a. con-
stant rate of insertion. established Efig.. 251 Here, the period of time oefo.re
Vthe estabishrment of a constant rate of defornaziozx was EO-ZOa tizn-I-s, loager
than im- the case of pstre shear-.
In examining the problem of the redistribution, of intern~al otresse3
in. a deformable mass of ice. one -. st alw-aTs strictiy- distinguish be.teem the
shear stresses and the stresses of hydrostatic compression. The redistribu-
tiom. of -nterzat stresses is due to, processes c-f creep amd relaxation, whic&
may exist only in presence of sheaz stresses and in. practice is independent
of the stresses of hydrostatic compression- Therefore, the presence of Large
and irregularLy distributed normal stresses db not in themselves indicate the
F pssiitity of a redistri . tion of st esses. For example, there can be mo re-
distr ibuion of inte.lal stresses under the middle part of a la-rge heavily loaded
die, despite the great stresses, since such zce wtll he compressed hydrostati-
caty- The main. region of redistriLbutiom of stresstet will be L.,e areas around
the edges of the- die where greatiar shear stresses appear-.
0 Laboratorina rekhaan'tk gr~utov Severo-Vostarzhmogo ceanz
rnsiuezioedeiza Akadenn-z 7 -Z SSSFL

THE INFLUENCE OF ICE STRUCTURE ON ICE CREEP
Ice crystals have sharply defined mechanical anisotropy. There-
fore. all the above-indicated quantitative relationships and creep character-
istics are fully applicable only to the deformation of polycrystalline ice with
randomly oriented crystals in volumes larger than the dimensions of the
individual crystals, when ice may bc regarded as a solid isotropic body. For
ice with a clearly defined crystal orientation, the basic creep laws remain
unchanged, however, the creep rate may vary as a function of the direction of
the acting shear stresses with respect to the direction of the crystal axes. As
a result, the coefficients n and K, which characterize steady-state creep[formulas (7) and (16)], may differ from those previously indicated, mostly
they will be larger. This may be explained as follows: for oriented structure,
in individual cases there is an increased possibility of the dffon.maton ,! ie
r without disintegration of its individual crystals, for example, when thu ch .TArplanes coincide with the basal planes of the crystals or with the contact- between
crystals. In such cases, the internal resistance to deformation may be urnal-
ler than in the case of the deformation of ice of random structure and corri,-
pondingly the creep rate may be greater. In our experiments on the torsion of
ice cylinders and the bending of ice beams with specific orientation cf the
crystals (Voitkovskii, 1957), the n-value in individual cases reached 2. 4 and-5the K-value 9 x 10
The influence of ice structure is expressed particularly strongly
in the case of shear stresses which exceed the limit of prolonged creep, when
there is accelerating creep.
-53-

CHAPTER V
THE ULTIMATE STRENGTH OF ICE
fThe ultimate strength or the breaking point of any material is the
stress at which the material ruptures. For ice this magnitude is conditionalto a certain degree, since the rupture of ice is due not only to the attainmentof a certain critical stress, but, in view of the considerable role played by
creep phevomena, the beginning of ice rupture and the magnitude of internal
stresses corresponding to this moment depend substantially on the rate of
application of load, the conditions of deformation and other factors. This isalso one of the reasons for the large fluctuations of the ultimate strength valuesof ice determined by various investigators.
The uL-imate strength oi ice usually is defined as gr 'eatest
stress (resistance) in the test sample of ice before its rupture due to "rapid"
loading. The ultimate strength of ice depends on the type of deformation, thus,
there are ultimate strengths ii. compression, tension, flexure and shear. Dueto the specific nature of the mechanical properties of icc, the determinable
values of its ultimate strength are somewhat different in nature and design
than the ordinarily applied ultimate strengths of various materials. The ulti-
mate strength characterizes the ultimate resistance of the material to external
forces and ordinarily is used to determine the possible loads which can be
supported by some structure or structural unit made of the given material.
However, when ice is used as a construction material or as a bearing foundIa-
tion, the permnisible load is determined from the permissible nagnitude and
rate of plastic deformation of ice under the specific conditions and not by the
magnitude of the permisiible stresses, which should be less than the ultimate
strength (Voitkovskii, 1954).
Data on the magnitude of the ultimate strength of ice are required
basically in cases where the problem of combating ice is examined. For
example, such data are required for cRiculating structures that are subject toice action and for determining the possible forces of interaction between the
54

'Iiice and the structure. The magnitude of ultimate strength characterizes the
force required for the mechanical destruction (disintegration) of the ice.
The crushing strength of ice. Table 7 gives the basic results of
experiments to determine the ultimate strength of ice under unilateral compression
conducted by various investigators. From these data it is evident that the r.e-
sistance of the ice varies within broad limits depending on the structure of theice, the orientation of the crystals with respect to the direction of comnpression,
the temperature and other factors. One also observes a considerable scatter
of ultimate strength values, even in tests of samples of analogous structure
under identical conditions.
It should be noted that the magnitude of the ultimate strength of ice
depends to a considerable extent on the conditions of deformation, namely, the
dimensions of the test samples and the rate of application of load (or the rate
of deformation), which have received little attention from most investigator".
Accurding Lo ihe daia of N. A. TsyLovich (see Tsytovich and t. n, i937 j h,
ultimate strength in compression of identical ice samples varied within thefollowing limits as a function of the rate of increase of load:
Rate of increase of load,kg/cm 2 m min 20 36 50
Ultimate strength in com-pression, kg/cm " 60 37 24
K. N. Korzhavin (table 8) noted similar phenomena. He established
that an increase of the rate of deformation reads to a reduction of the ultimate
strength, in which case the influence of the rate of dcformation is particularly
strong at Ivw temperaturts, and the influence d..reases as the temperature
approaches 00 C. Korzhavin (1951) represents the relationship between the ulti-
mate strength and the rate of relative deormation S (within the limits 0. 0007-
0. 0417 sec 1 ) by te empirical formula
a a ~ 0)
where a is an empirical coefficient (at -30 C, a 3. 1; at 0°C, a Z. 5).
-55-

Let us note, that this type of relationship may exist only with rela-
tively- large rates of deformation. since the reverse picture is observed in the
case of small deformation rates: an increase in the deformation rate leads
to an increase in the resistance (see fig. 18). In compression, an ice sample
often begins to disintegrate before the stresses in it reach the breaking point.
For example, in compression tests of samples of underground ice (L. S.
Khomichevskaia, 1940) it was noted that cracks began to appear in the samples
at stresses 2-3 times less than the breaking point (ultiniate strength). An ice
sample in which cracks have formed may disintegrate in time without an increase
of stresses, 1. e. , under the more or less prolonged effect of the same stress
under which the cracks formed, with the following result. The ultimate strength
of ice may decrease substantially under the prolonged effect of loading or a very
low rate of increase of load.
To date not enough study has been devoted to the influence of the
size of the test samples on the magnitude of the ultinmato it.,ngnmt,. Cump"-r-n.
2 the results of tests of 10 cm and 20 cm cubes of ice, K. N. Korzhavin (1940)
noted an increase in the ultimate strength of the large ice samples. However,
this increase is not always observed. For example, Butiagin (1955) asserts
il that in experiments carried out under natural conditions of destruction ef an
ice cover, the ultimate strength of various types of deformation of large ice
samples was less than that of the small samples tested.
The ultimate strength of ice is a function of temperature and in-
creases as the temperature decreases. This relationship may be expressed by
the empirical formula (Korzhavin, 1940):
A A+ BO. (31)
where 0 is the negative temperature of ice in 0 C (without the minus sign);
A and B are empirical coefficients (for the case of the crushing of 10 cm cubes
of ice at a rate of v = 2 cm/min in the temperature interval 00 to -10 0 C.
A r 15 and B - 3. 4.
The ulLimate strength of ice in compression in the direction of the
crystal axes it, is usually greater than it is in the direct~on perpendicular
to the crystal axes or,. For example, according to Korzhavn's data (1951)
- 56 -
the ratio W11 /a for the ice cover without conspicuous indications of the
weakening of the bonds between the crystals at a temperature of ( 0 C to -3°C
is, on an average, 1. 3-1. 5. During the spring thaw, when there is a per-
ceptible weakening of the bonds between the crystals, this ratio increases
and may reach 3.6.
The strength of a natural ice cover is not uniform vertically. The
ice is strongest in the central part of the cover and weakest in the lower part.
The tensile strength of ice. This depends basically on the same
factors a. the crushing strength, except that the ultimate tensile strength is
considerably smaller than the crushing strength and varies within smaller
limits (table 9). Furthermore, various inclusions and structural irregulari-
ties, which may become centers of destruction, have a great influence on the
tensile strength value, In compression an ice sample may permit a further
increase of load after cracks have arpcared, but in tension the ice sample
usualiy breaks without preliminary crack formation.
The fracture strength of ice is determined by bending ice sar. l-s
or a portion of the ice cover, for example, by bending strips of ice rut frent
the ice cover, the so-called "ice keys" (literally, "pilano keys of ice, " tr. ).
The most probable centers of rupture are the breaks in the tension zone oj
the shearing (cleaving) at points of greatest tangential stresses and, corre-
spondingly, the beginning of rupture should be determined by the attainment
of critical tensile stresses or critical shear stresses.fl The ultimate flexura! strength of ice is usually defined as the maxi-
mum tensile stress in the bending sample of ice before its destruction, cal-
culated on the basis of formulas for a linearly elastic body. In such an approach,
the determinable magnitude of the maximum stress is greater than the actual
stress in the test sample, since during flexural testing of ice plastic deforma-
tions appear along with elastic deformations and in the case of these plastic
deformations, the distribution of stresses in the flexure sample changes coml-
pared with the distribution of stresses in linear elastic deformation. This
change tends toward a reduction of the maximum stresses (see fig 24).
Thuis. the deterusinable ultimate strength is ai, arbitrary value to
' a certain extent, somewhat greater t.aan the actual maximrnum stress in fractture
In our opinion, this can be explained by the following. Ac(.ordng to the data
- 57-

II
of most investigators, the ultimate flexural strength of ice (table 10) is
greater than the ultimate tensile strength, since it is not very likely that the
actual tensile stresses In a flexure sample would increase beyond the ultimate
tensile strength
The concepts outlined above do not prevert the practical use of the
given ultimate strength values for computing the conditions of ice fracture,
considering that the over-valuation of the str - ies allowed in determining the
ultimate strength will be compensated by a corresponding under-valuation of
the actual stresses compared with the calculated stresses in the cases of in-
terest to us. One need but observe the following. In the calculations one must
proceed not from the value of the actual stresses, but from the calculated
stresses, and regard ice arbitrarily as a linearly elastic body.
The magnitude of the flexural strength of ice depends verv subst.v.-.
tially on the size of the bending samples and the rate of application of load.
For example, according to the data of I. P. Butiagin (1955), the ultimate
strength of small samples (7 x 7 cm and 10 x 1Oc,:: in croza section and 50 cin
long) on an average is three times greater than the ultimate strength of larg.
strip samples cut from the ice cover. V. V. Lavrov (1958) attempted to give
a theoretical explanation of the influence of the size of the ice test samples on
the magnitude of the ultimate strength and to present corresponding calculation
formulas. Lavrov's theoretical premises arc somewhat debatable, so we have
not given his formulas here.
For example, according to Lavrov's formulas, the ultimate flexural
strength of a sample 4. 5 cm thick and 35 cm long would be 23 kg/cm 2 , while
it would decrease to 9 kg/cm 2 for a sample 34 cm thick and 250 cm long.
Similarly, while the ultimate fracture strength oi an ice cover 0. 35 cm thick2. 2would be 21 kg/cm , it would be only about 7 kg/cm for an ice cover 1-2 m
thick.
K. N. Korzhavin treated the relationship between the fracture strength
and the rate of loading. According to his data (see table 10), an increase of the
bending rate from 2 to 20 cLIn/min decreased the ultimate strength from 9. 22
to 3. 6 kg/cm
-58-
I1
Orlov (1940) noted that the fracture strength of an ice sample in
water is somewhat less than the fracture strength of "dry" ice. The bending
of ice "keys" has shown that the strength of an ice cover usualj.y is greaterwith bending from above than with bending from below (Neronov, 1946;
Butiagin, 1955).
The higher the temperature of the ice, the smaller its fracture
strength. According to the experimental data of F. F. Orlov (1940), the
ultimate strength of ice decreases approximately 46% with an increase of
temperature from -100 C to -0. 50C.
The shearing strength of ice. Table 11 presents the basic data on
the magnitude of the shearing strength of ice, based on the information of
various investigators. Obviously, the shearing strength may vary within
broad limits. For the most part, the shearing strength is less than the
tensile strength (Veinhrg, IQI, n a.cra -c about hall ;;,' ku sisiie -':ze:igtth
(r tensile 2 11. kg/cmz , 0r shear r 5. 8 kg/cm 2). However, at low tempera-
tures in individual cases the shearing strength may be considerably greater
than the tensile strength. The magnitude of the shearing strength. as in the
case of other types of destruction, increases with decreasing temperature and
may change as a function of the ice structure and the direction of shear with
respect to the direct-:on of the crystal axes. Furthermore, as the experIn, 'tts
of Vialov (1958) have shown, the shear strength of ice is a function of the mag-
nitude of the normal pressure irn the shear plane, increasing as the pressure
increascs There is also some basis for assuming that the shearing conditions
exert a considerable influence on the magnitude of the shearing ctrength, vi/.
the manner of conducting the experiment, the size of the sample, the rate of
application of the load or the rate of shear, et al. However, not enough study
has been devoted to these problems.
The adfreezing (freez:ng together) strength of ice and various sub-stances is a function of the material, the character of its surface and the tem-
perature. Tdble 12 shows some -alues of the inaximuni adfrecz.ing forces of
ice. From the data it is evident that the adilreezing or-es intrease substain-
tially with dec.easing temperature and with roughness ,,f the surface The
adfreezing forces also change as a function of the conditions whereby :ce freezes
together with another body and these are respxnsibie lor the structure of the
IIice and the direction of the crystal axes at the point of contact. The ad-
freesing forces depend on the rate of increase of lo.d. When the load in-
creases rapidly, brittle fracture results and rupture may pass in part along
VE the ice and not strictly along the contacts, depending on the material and the
condition of its surface. For example, in experiments on the extraction of
Lwooden rods (stakes) frozen into ice, Vialov (1956) observed cases where the
destruction was accompanied by a sharp cracking sound and rupture of the ice,
individual pieces of which remained on the extracted rod. The greatest values
of the adfreezing forces were noted in these cases. However, when there was
a prolonged interaction of loads or when the load3 were increased slowly, the
rod slipped along the ice. In such cases, the adfreezing forces were consider-ably smaller.
Figure 26 shows a curve of long-term adfreezing strength of ic.
with wooden rods (stakes) frozen into it (Vialov. 1956). which sh-ws h.;w tv:efl adfreezing strength varies as a function of the time of activ, luding up .c. t!-
moment the stakes were extracted. When the load was increased rapidly. the2adfreezing forces reached 5 kg/cm . With Icads that created adhesive forces
L of I kg/cm 2 , the rods were pulled out in 8-12 hours, while 1, 000-3, 000 hour:'
elaptied before extraction of the rods with adhesive forces of 0. 5 kg/cm
The resistance of ice to local crumpling may be considerably
greater than the resistance of ice to crushing. Korzhavin's (1955) data show
that the ultimate local crumpling strength of ice may be 2-2. 5 times greater
than the ultimate strength in general unilateral compression. He proposes
the following formula for cases of the crumpling of river ice
fr crumpling Z (r compression i7' (3Z)
This formula defines the ultimate crumpling strength of ice r crumpling a i
a function of the ultimate compressive strength 4r compressive' the width of
the floe B and the width of the crumple area b (wc have in mind the crumpling
at the edge of a floe, along its entire vertical face).
V When a solid body (a die) it inserted nto ice. the magnitude of the
resistance of the ice and the nature of its dcstruction arc functions of the size
~- 6" -
and shape of the die, the rate of insertion (or the rate of application of load
to the die) and also the size and shape of the volume of ice into which the die
is inserted. Finally, other factors which affect the compressive strength of
Uthe ice, namely, temperature, ice structure, et al., also play a role here.
For example, Korzhavin (1955) observed that the force required to insert the
die decreases 1. 5 to 2-fold if a triangular die with a peak angle of 600 is used
instead of a semi-circular die, other conditions being equal.
In the case of a slow increase of load and prolonged loading, causingstressca beiicath the die which are small compared with the ultimate strength,
the die penetrates into the ice smoothly due to the creep of the ice. A rapid
increase of load cauces brittle fracture of the ice with crack formation in azone near the die.
The strength of river ice decreases considerably. dtring the b- ,ak-up period (L. 5 to 3-fold). The sun's rays and heat cause tl i.s. to bea" tIo
melt throughout its volume by the time of the spring breakup. First, meting
t Ioccurs at the contacts betw - in the crystals, where iilms of mineralized
water formed during the freezing process, freezing and subsequently molting
at a low temperature. During the melting of these interlayers, voids having
a lower pressure formed and water could penetrate into them. As a result,
the ice became cloudy and friable and became rapidly weaker.
To determine the possible forces of interaction between bridgc
supports or various hydrotechnical structures and ice during the spring break-
up period, one may use the calculated values of ice strength as a function of
the rate of movement of the ice (table 13) proposed by Korzhavin (1955).
The resistance of ice to dynamic loads. Usually the term dynamic
loading is used to define loadings during which there is a substantial accelera-
tion of the particles of the loaded body or of another body in contact with it,
for example. in the case of impact or oscillations.
During forced oscillations, causing stresses which vary in sign,
cracks may appear in the ice, gradually grow and cause dcstruction. Con-sequently, ultimate strength decreases with an increasing number of cycles
of changing stresses.
t 1
m
B. D. Kartashkin (1947) noted that in most cases ice beami undera relatively small static load disintegrated during forced oscillations. Thegreatest additional dynamic stress which an ice beam was able to withstand fora fairly long time (10, 000, 000 cycles) without disintegrating, at a tempera-ture of -S°C t -9 0 C under a static load causing a maximum stress of 2. 5 kg/cm 2
with an ultimate strength of 16 kg/cm was approximately 1.5 kg/cm . Thesmallest additional dynamic stress above which the beams disintegrated almostin&,antaneously was approximately 2. 75 kg/cm2 . Thus, the ultimate strength
decreased 3 to 4-fold during dynamic loading.
The nature of the impact deformation is a function of the activerate of loading (the impact). A small impact velocity causes only elasticdeformations. When the rate of impact is increased, elasto-plastic deformationsappear and finally brittle fracture. As yet, too little study has been devoted toI problems of the resistance of ice to impact stresses.
-62
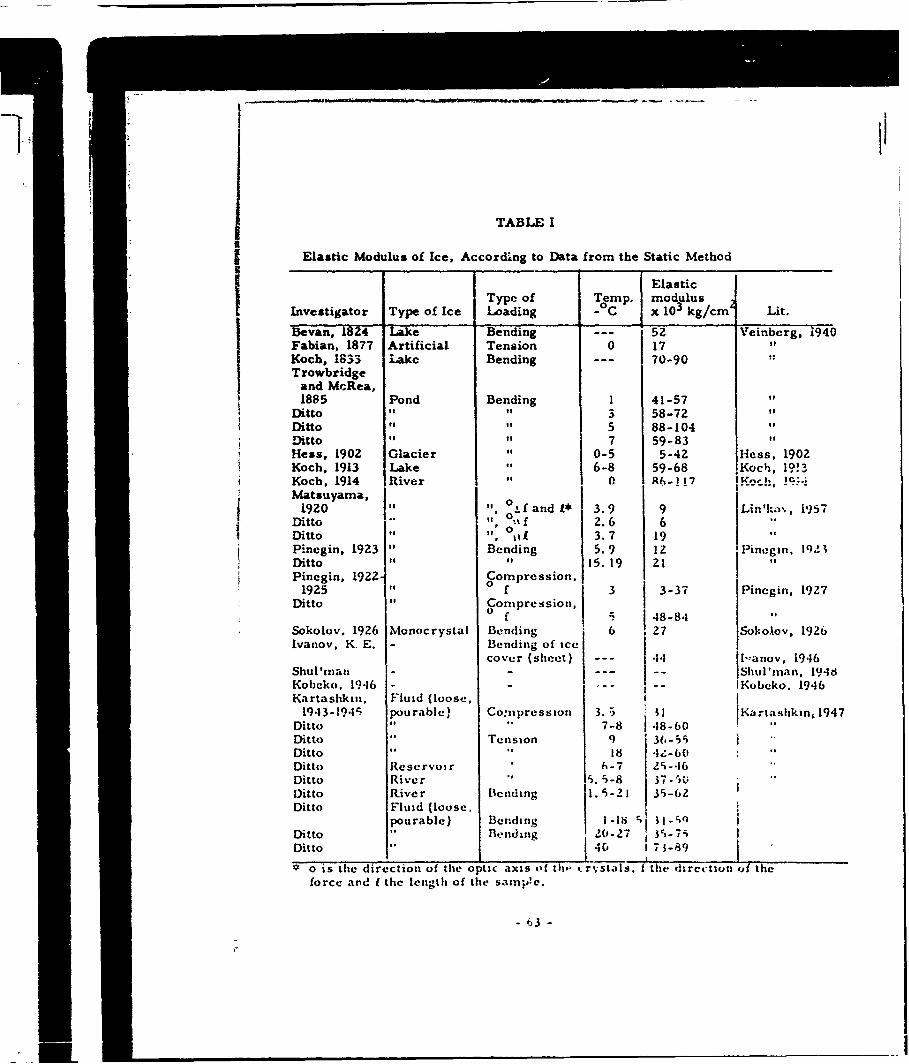
TABLE I
j Elastic Modulus of Ice, According to Data from the Static Method
ElasticType of Temp. modulus
Investigator Type of Ice Loading - C x 103 kg/cm Lit.
Bevan, 124 Bending - -- 52 Veinberg, 1940Fabian, 1877 Artificial Tension 0 17Koch, 1833 Lake Bending --- 70-90Trowbridge
and McRea,1885 Pond Bending 1 41-57
Ditto " " 3 58-72Ditto " 5 88-104Ditto " it 7 59-83Hess, 1902 Glacier 1 0-5 5-42 Hess, 1902Koch, 1913 Lake " 6-8 59-68 IKoch, 19!3Koch, 1914 River " 0 R6-!!7 IKe,..i 10.;Matsuyama,
1920 -I o, f and f* 3.9 9 Lin'ka,, 1957Ditto " ,' 2.6 6Ditto Of ", °3.7 19Pinegin, 1923 " Bending 5.9 12 Pinegin, 1q"ZDitto " I 15. 19 21Pinegin, 1922- Compression,
1925 o f 3 I 3-37 IPincgin, 1927Ditto Compression,j Io f 4 48-84 "
Sokolov. 1926 Monocrystal Bending 6 27 Soko'tov, 1926Ivanov, K. E. - Bending of ice I
cover (sheet) --- 4. f ,anov, 1946Shul'man - ---... iShul'nan, 19"1tKobcko, 1946 -"" - -- IKobeko. 1946Kartashkin, Fluid (loose.
1943-194", pourable} Compression 3.5 31 Kartashkin, 1947Ditto 7-8 .18-60Ditto Tension 36-5Ditto 18 .l,-60Ditto Reservoir 6-7 25-16Ditto River ". 5-8 37-1)(1.Ditto River Bending i. 5-21 35-62Ditto Fluid (loose.
pourable) Bending 1-18 'o, 51_;QDitto Bending 20-270 3 5-75
Ditto " 4 6 75-89
o is the direction of the optic axis of thc rvstals. f the direction o theforce and I the length of the samp!c.
-63 -
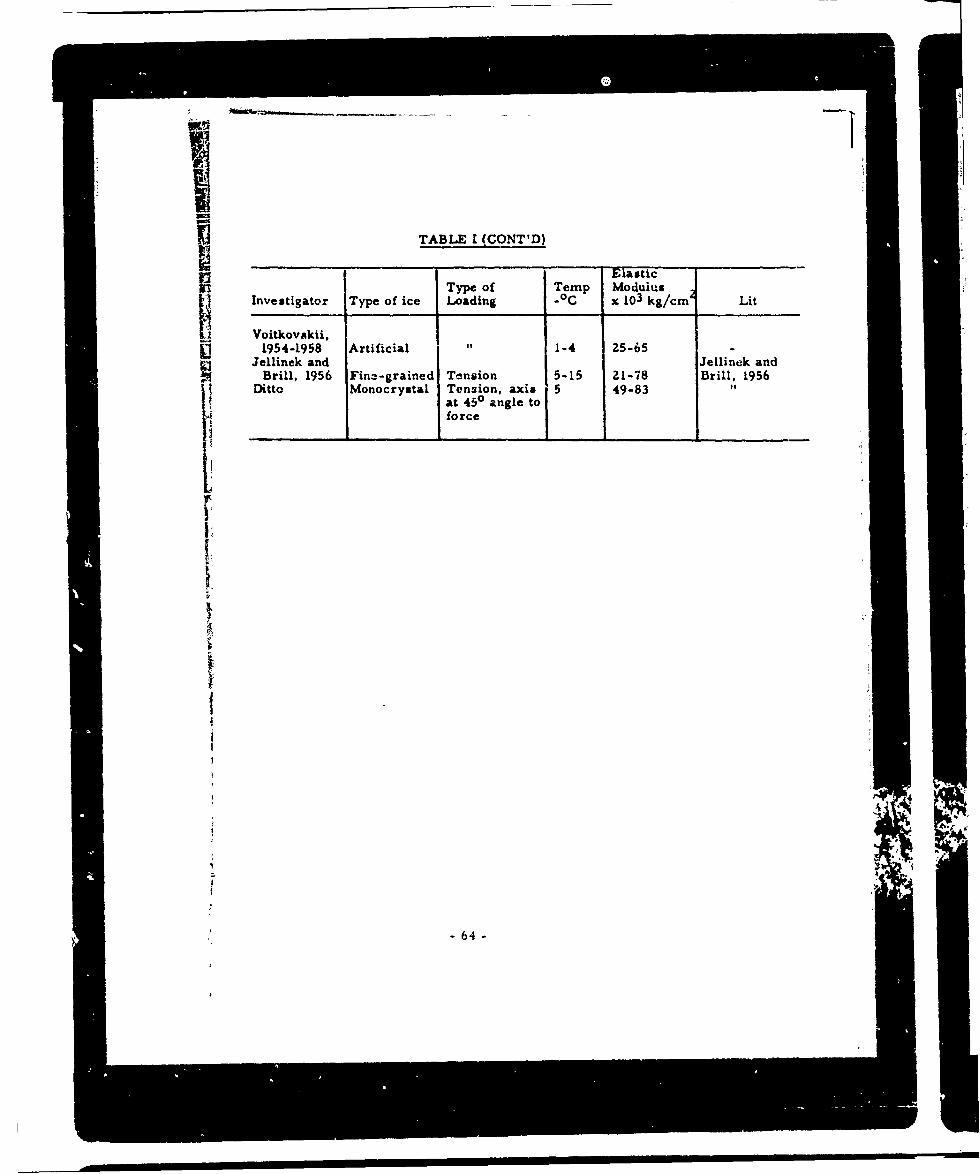
iTABLE I (CONT-D)
ElasticinType of Temp ModulusI~ Investigator Type of ice Loading x ~ gcm Lit
Voitkovskii,U1954-1958 Artificial 1-4 25-65S Jellinek and Jellinek and
Brill, 1956 Fine-grained Tension 5-15 21-78 Brill, 1956Ditto Monocrystal Tension, axis 5 49-83
at 450 angle to_ _ _ _ _ J ~forcej_ __
46
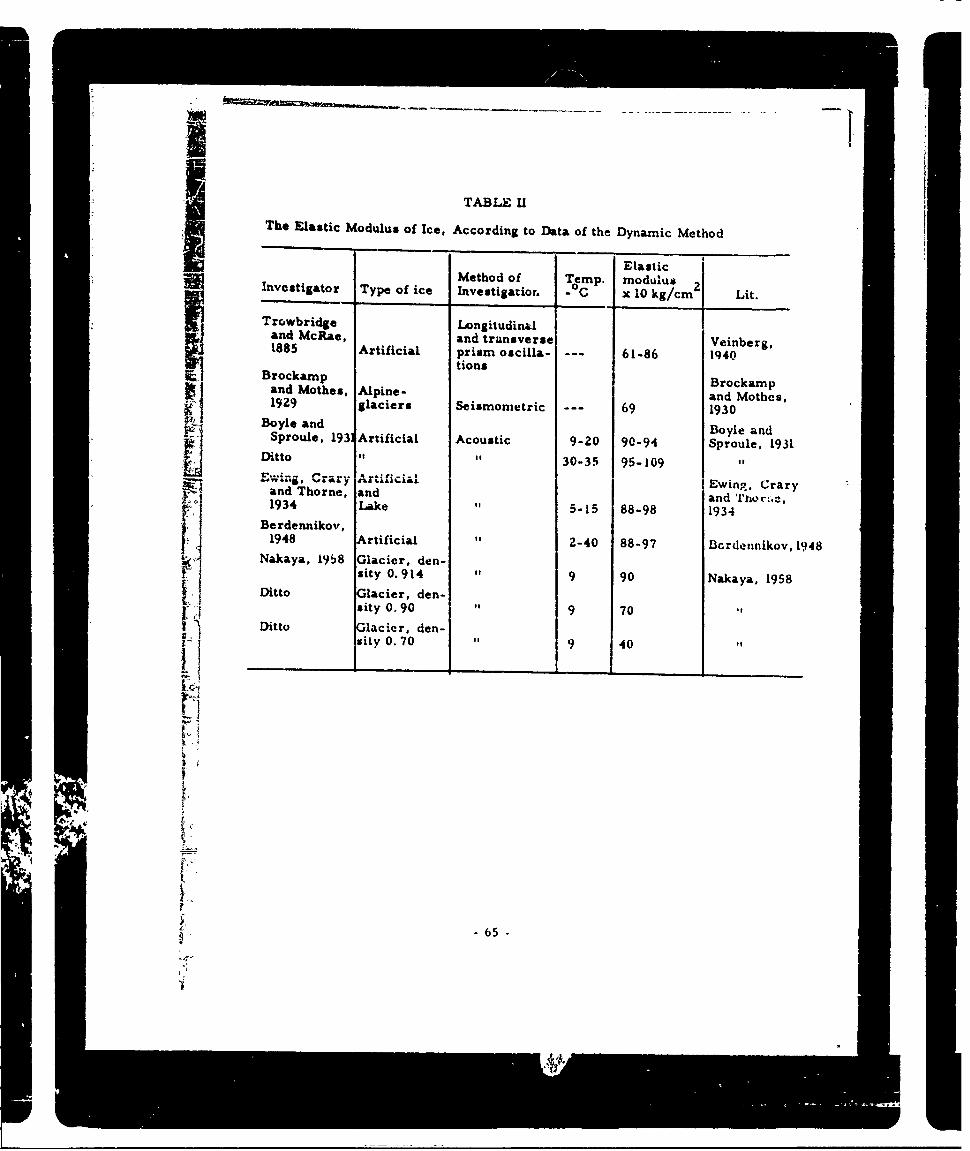
TABLE 11
The Elastic Modulus of Ice, According to Data of the Dynamic Method
ElasticMethod of Temp. modulusInvestigator Type of ice Investigatior. 0 C x 10 kg/cm Lit.
Trowbridge Longitudinaland McRae, and trunsverse Veinberg,1885 Artificial prism oscilla- -- 6 1-86 1940
tionsBrockarnp Brockampand Mothes, Alpine- and Mothes,
1929 glaciers Seismometric - -- 69 1930&LiBoyle and Boyle andSproule, 1931 Artificial Acoustic 9-20 90-94 Sproule, 1931Ditto Is 30-35 95-109
6, rary Artificial Ewing, Craryand Thorne, and and 't~:~1934 Lake It5-15 88-98 1934Nakaya, don-
1948 Artificial it 2-40 88-97 IBcrdennikov, 1948Nky,1958 Glacier, dniisity 0. 914 It 9 90 Nakaya, 1958
Ditto Glacier, den-sity 0. 90 "9 70
Ditto Glacier, den-sity 0. 70 "9 40
i65
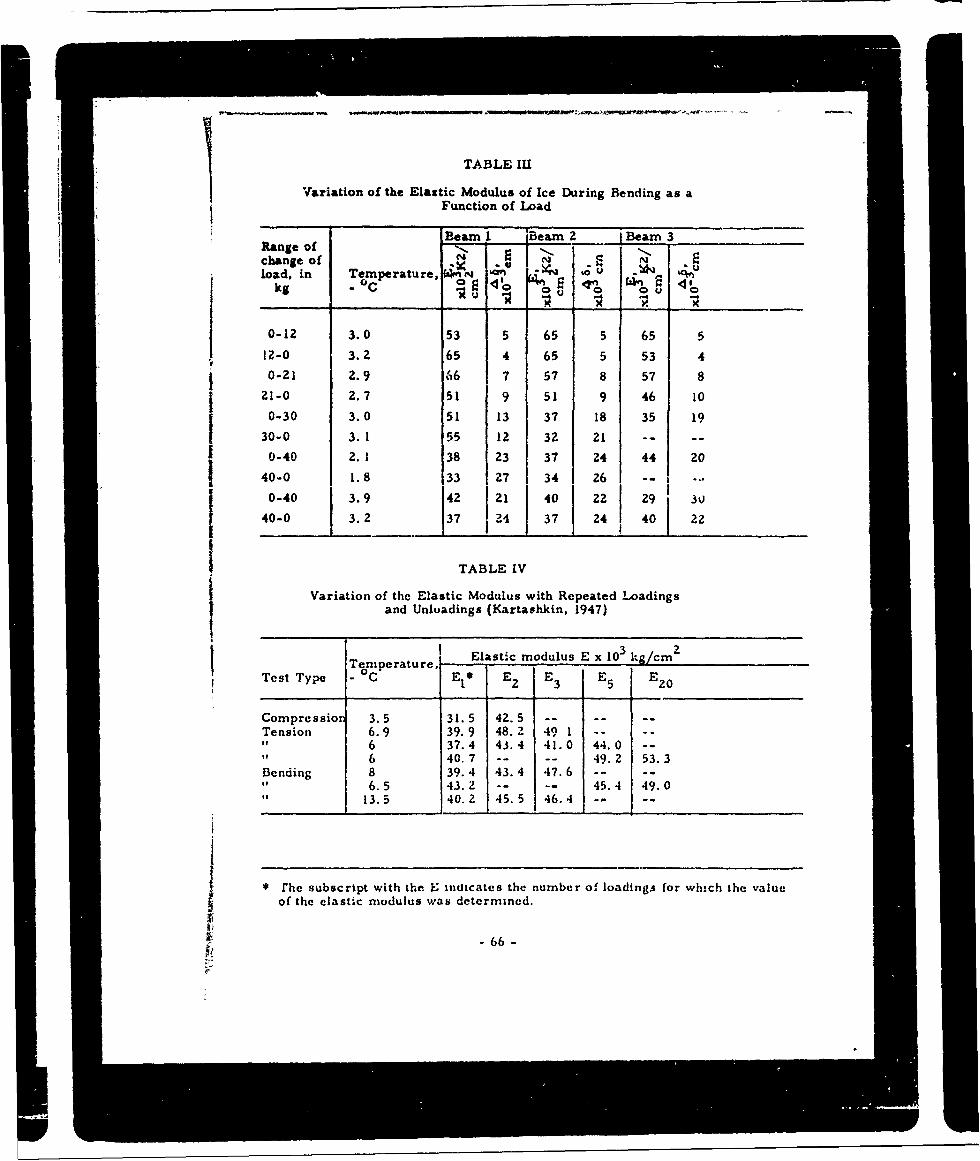
TABLE III
Variation of the Elastic Modulus of Ice During Bending as aFunction of Load
Beam I Beam. 2 1 Beam 3Range of 1 I-change of V. 164 E
load, in Temperature, 464 ' 4 J ' U .J 4
kg - c C 0I
0-12 3.0 53 5 65 5 65 5
U 1-0 3.2 65 4 65 5 53 4
0-z1 2. 9 6 6 7 57 8 57 8I 21-0 2.7 51 9 51 9 46 10
0-30 3.0 51 13 37 18 35 1930-0 3. 1 55 12 32 21 -- --
0-40 2. 1 38 23 37 24 44 20
40-0 1.8 33 27 34 26 --
0-40 3.9 42 211401 221 29 3
1 40-0 3.2 37 24 371 241 401 2Z
I TABLE IV
Variation of the Elastic Modulus with Repeated Loadings
and Unluadirigs (Kartavhkin, 1947)
Temperture, Elastic modulus E x 103 kg/cm 2
Test Type -0 C E* E E ET~ni2 6. 39. 48. H
Compression 3.5 31.5 42.5 -- - -
13540. 2 45 .5 46. 4 - -
I *rhe subscript with the k; indicates the number of loadingsi for which the valueof the elastic modulus was determined.
-66-
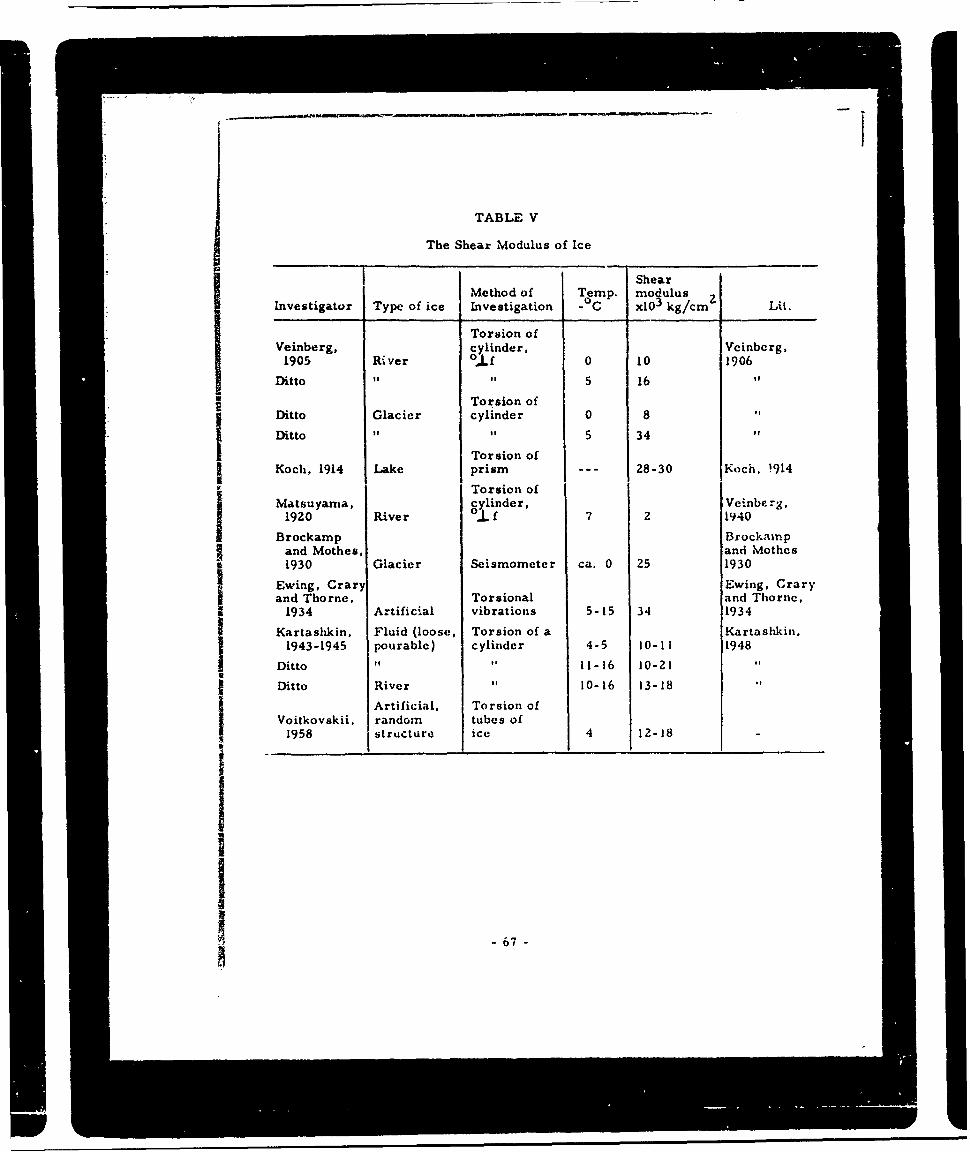
TABLE V
The Shear Modulus of Ice
I ShearMethod of Temp. modulusL.
Investigator Type of ice Investigation -0 C x10 3 kg/cmZLt
Torsion ofVeinberg, cylinder, Vcinberg,
1905 River 01.Lf 0 10 1906
Ditto '~5 16
Torsion of
Ditto Glacier cylinder 0 8
Ditto It5 34
j Koch, 1914 Lake prism - -- 28-30 Koch, !914
Torsion ofMatsuyamna, cylinder, Vei-nbe rg,I1920 Rive r 0 J. f 7 2 1940Brockamp Bro ckAmp
and Mothes, and Mothcs1930 Glacier Seismometer ca. 0 25 1930
Ewing, Crary Ewing, Craryand Thorne, Torsional and Thorne,
1934 Artificial vibrations 5-15 34 1934
I Kartashkin, Fluid (loose, Torsion of a Kartashkin.1943-1945 pourable) cylinder 4-5 10-11 1948
UI Ditto It 1 11-16 10-21j Ditto River It10-16 13-18
Artificial, Torsion ofVoitkovskii, random tubes of1958 structure ice 4 12-18
-67-
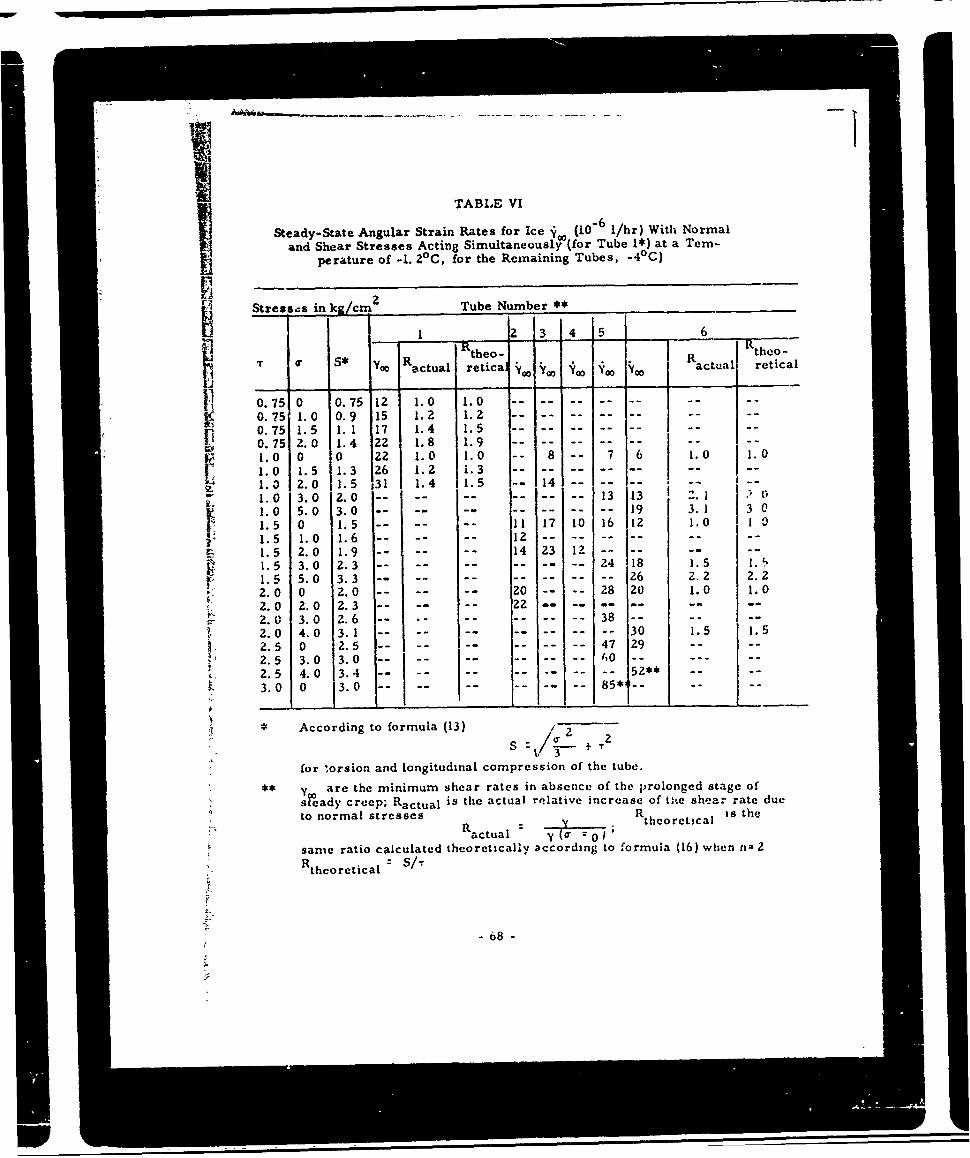
TABLE VI
6/
Steady-State Angular Strain Rates for Ice ',(10 -61/hr) With Normaland Shear Stresses Acting Simultaneously (for Tube 1*) at a Tem-
perature of -1. 20C, for the Remaining Tubes, -4(C)
Stressas in kg/cm 2 Tube Number *
1 2 3 4 5 6lthe°- I
T S* y R-R Rtheo-
Sctual retical 00 m j o j oo actual retical
0.75 0 . 12 1.0 1.0 -- -- ---- --
0.75 1.0 0.9 15 1.2 1.2 ---- ---- -.
0.75 1.5 1.1 17 1.4 1.5 ---- ---- -.
0.75 2.0 1.4 22 1.8 1.9- .. .. ......1.0 0 0 22 1.0 1.0 -- 8 -- 7 6 1.0 1.0
1.0 1.513 6 .. i -3 14 . .. .......- - IL-1.0 2.0 1.5 26 1.4 1.3 14 I -
1.0 3.0 2.0 -- .. .. 13 13 Z.1.0 5.0 3.0 .. .. .. .. .. .. . ..- 19 3.1 3 0
1.5 0 1.5 .. .. .. 11 17 10 16 12 1.0 101.5 1.0 1.6 .. .. .. 12 .... I
n1.5 2.0 1.9 -- - 14 23 1 j- -- --
1.5 3.0 2.3 .. . ... 24 18 1.5 5.1.5 5.0 3.3 .. .. .. 26 2.2 2.2
2.0 0 2.0 .. .. .. 20 28 20 1.0 1.02.0 2.0 2.3 .. .. .. 22 .. . .. ......2.0 3.0 2.6 . .. ..- 38 --....
2.0 4.0 3. 1 .. .. ..- 30 1.5 1.5
2.5 0 2.5 .. .. ..- 47 29 ..
2.5 3.0 3.0 --. .. .. 0 ... ..
2.5 4.0 3.4 .. .. ......3.0 0 3.0 .. .. .... ..- 85* -- .
According to formula (13) 2 2
S : +
for torsion and longitudinal compression of the tube.
** y are the minimum shear rates in absence of the prolonged stage of
steady creep; Ractual is the actual relative increase of t he shear rate dueto normal stresses R theoretica s the
Ractual Ysame ratio calculated theoretically according to formula (16) when n= 2
R theoretical
- 68 -
w?

TABLE VII
JThe Ultimate Strength of Ice for Unilateral Compression
Strength, in kg/cn 2
Type of Temp. o0Investigator Ice -°C r1 11 Lite rat- e
Vasenko, 1899 Artificial 10-18 .. .-- 12-50 Vasenio, 1899
LDtto River 12-17 20 37-46 -- .
Bell, 1911 River 0 37-55 25-54 KomarovskiiDitto River 8-10 .. .. 34-78Barnes and
McKay, 1914 " 0 17-40 16-39 "Bessonov, 1915 "-- 10-26 29-61 - Bessonov, 1923Sergeev,1921 " --- 10-75 Sergeev,1929Pinegin, 1923 River, upper
part 0-2 18 21 Pinegin, 1923Ditto " 12-15 25 29 "Ditto " 31-35 28 38 -
Ditto River, middhpart 0-2 28 36 go
Ditto 12-15 33 33 to
Ditto " 31-35 69 76 "Ditto River, lower
part 0- 2 12 18 "Ditto 12-15 18 20Ditto " 31-35 32 38 -:
Arnol'd-Alia- From Gulf 0 22 Arno'ld-Alia-blev, 1923-28 of Finland b'ev, 1929Ditto " I -.26 --
Ditto 2 35 -- "Ditto 5 47 -- "Ditto " 9 56 -- "Ditto " 13 52 -- "
E-Korzhavin, 1934 River 0 10 30 Korzhavin, 1951Ditto " 0.3 12 22 if
Ditto " 0.6 !0 37 "KOVM team, Khomichev-1936-1937 Underground 0. 1-9 -- 9-32 skaia, 1940
Ditto, con-taminated
Ditto with ground 3-7 .. .. 16-43Ice of ground
Ditto naled (icing) 0-86 .. ..- 1t-12"Mean valuefor upper
Veinberg part 3 29 33 Vcnberg, 1940Ditto, for
Ditto lower part 3 23 28
- 69 -

i TABLE V11 (CONT'D)
It Strength in lig/cni 2
SType of Temp. a, Tr cInvestigator Ice -o7 C __ Literature
Kartashkin Kartashkin,1943-1945 Reservoir 2 36-50 -- 1947
Fluid (loose
Ditto pourable) 3.5 . -- 48-51Ditto 8 48-83Korzhavin, Korzhavin,
1938 River 0 15 .. .. 1952Ditto 3.6 27 .. ..Korzhavin,1950 0 10
BuIagin, Butiagin,1953 0 5-1 . 1 955
Remarks: a"j_ is the ultimate compressive strength in a direction per-pendicular to the crystal axes;
, ,ditto, for compression in the direction of the crystalaxes;
or ditto, in cases where there is no clearly definedcrystal orientation in the test sample or where the orienta-tion is not known.
-70-

.......
TABLE VIII
The Ultimate Compressive Strength of Ice (kg/cm") as aFunction of the Strain Rate and the Temperature
__________Temperature, - 0C
Strain rate vK2:: 30 80 0
in cm/min* 0_4_6_8__
2 14.5 212 2. 50 41.2 48.9
20 9.7 1. 105 1.5 13,0 14.2
* The rate of compression of cubes 10 x 10 x 10 cm 3perpendicular to tilecrystal axes.

TABLE IX
WWUltimate Tensile Strength of IceF
Temp. Strcng~iInvestigator Type of ice -0 C kg/cm~l Lit.j
AYasenko, 1897 Artificial 4-12 11-09 Vaseatko, 1897
Hess, 1902 Glacier 7Pinegin, 1923 River niddle
prt, iOr 0-2 10 Pinegin, 1923
Ditto "12-15 12 "o
Dito "31-35 14
River. middleDitto part, N~ f 0-2
Ditto "o 31-35 18 0
River lower
Ditto Ditto, but~j 11 f 0-35 10-13
Average vakcVeinberg, 194( of 235 tests 11. 1 Vcinberg, 1940
Kartashkin Kartashkjn1943-1945 River 3-8 9-12 1947
Fluid (loose.UWDitto pourable) 3-18 10-18
-72-

TABLE X
Ultimate Bending Strength of Ice
02Investigator Type of ice Temp. -C Strength, kg/c teatr
Vasenko, 1897 River is Z5-45 Vasenko, 1897I:Ditto Artificial 15 30-42 IVeinberg, 1912 River,upperIpt. 6 8.3 Veinberg, 1913Ditto River, middle
Pt. 0 13.04Ditto Rive r, lower
Bessonov, P.01.1913-1915 River 3 11-31 lBessonov, 1923
Serec, 92 Rv. upe 0 11.4 Sergeev, 1929jDitto River, middle
fpt. 0 9.9Ditto River. lower
Pt. 0 14.4P;'; 1072 t'.... C 0 ~ui12Ditto "15-19 33Pedder, 1925-28 " .2-32 5. 7-22.1I Pedder, 19Z9
Basin, 1934 "0 11.8 Kiorzlivisi, 191Korzhavin, 1937 River, strain
rate vx2 cm/mini 0 9.2
DittoDitto, v:z2Dtocm/min 0 3.6 o
Ditto River, fracturin water, v f 0 25 t
Ditto River, fractuin water, 0 f 0 14 i
Veinberg, t940 River, av. Tvalue 193 16 Veinbcrg. 1940
Troshchinskii * Rivcer, flexure1942 of ice strips
in water 0 7. 1 Korzhiavin, 1951Shishov, 1938- 1.4-8.3
43 1 ( av. 4) Shishov, L947Ditto. 1942 River z 9-13Ditto River 5 10-16Ditto 110 13-20171tto ' 20 18-19Neronov, 194; River, flexur
0 f ice strips* 0 2. 8-5. 6 rNeronov, 1946;
SIce etyips, litera!ly pieces in th form of piano k~eys (tr. note)
-73-
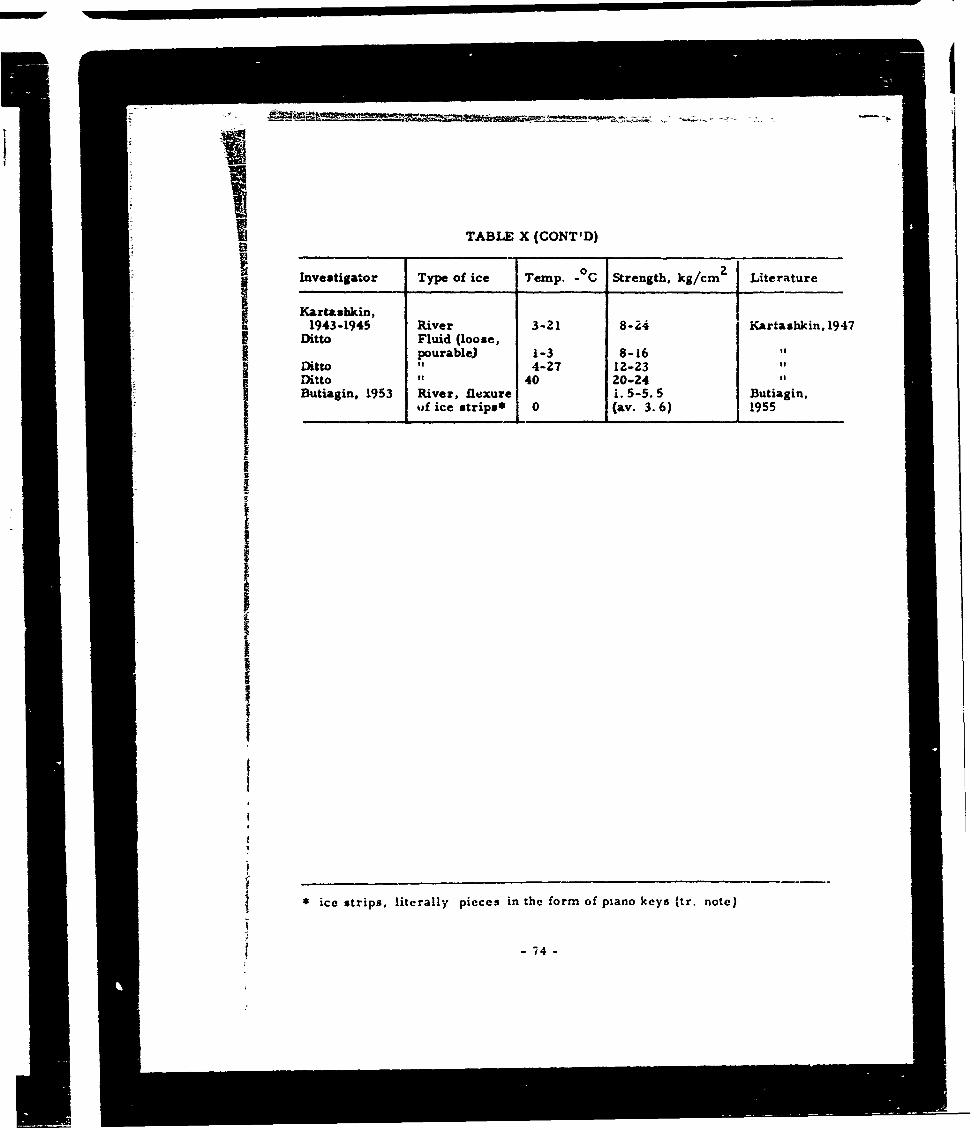
TABLE X (CONT'D)
Investigator Type of ice Temp. CO Strength, kg/cm Literature
a1943-1945 River 3-21 8-24 Kartashkin, 1947DittoFluid (loose,
pourable) 1-3 8-16Ditto it 4-27 12-23Ditto "40 20-24Butiagin, 1953 River, fle~xure i. 5-5. 5 Butiagin,
ofE ice strips* 0 (av. 3. 6) 1955
ic tis ieal icsi h omo in es(r oe
I4
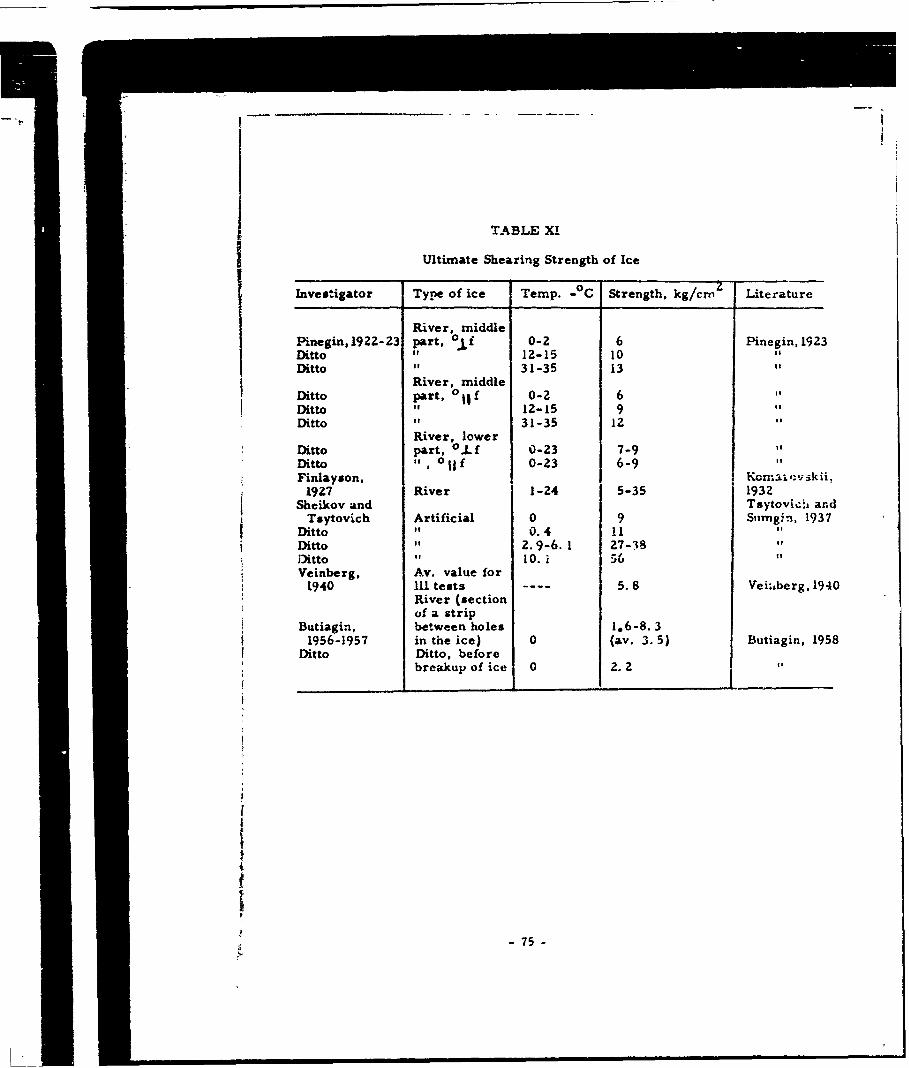
TABLE XI
Ultimate Shearing Strength of Ice
Investigator Type of ice Temp. -°C Strength, kg/crn Literature
River, middlePinegin,1922-23 part, 0Jf 0-2 6 Pinegin, 1923Ditto " 12-15 10 "Ditto 31-35 13
River, middleDitto part, 0 |f 0-2 6Ditto " 12-15 9 "Ditto 31-35 12
River, lowerDitto part, o.Lf 0-23 7-9Ditto 0, 11jf 0-23 6-9Finlayson, Kn'vki
1927 River 1-24 5-35 1932Sheikov and Tsytoviela and
Tsytovich Artificial 0 9 Siimg.n, 1937Ditto 0.4 11 "
Ditto " 2.9-6. 1 27-38 "
Ditto 10. i 56 tVeinberg, Av. value for
1940 ILL tests ---- 5.8 Vei.,berg, 1940River (sectionof a strip
Butiagin, between holes 1.6-8.31956-1957 in the ice) 0 (av. 3. 5) Butiagin, 1958
Ditto Ditto, beforebreakup of ice 0 2. 2
-75-

JiU TABLE XU
The Adhesion Between Ice and Other Substances
Material and tW;, 1 0c AdhesionInvestigator of Surface Temp. -Cforce, kg/cm Literature
Bell, 1911 Concrete with plast- 0 8-11 Komarovskii,LAered surface (Non- 193Z
ionized) 1. 1 13-16
Taytovich, Wood (pine) with a Tsytovich and1930 smooth surface 1 5. 2 Sumgin, 1937
Ditto 5 6.2z
Ditto 7 11.6
f, Ditto 20 22.0
Ditto 5-10 !1. 5
~ I Ditto Concrete with asmooth surface 5-10 9.8
AlItberg, 1948 Iron 0. 085 0. 14 A1'tberg, 194E
Dto0.32 0.52
k Ditto 0.50 0.81
Ij Ditto "1.09 2.95
F1 Ditto Asphalt (biiurnen) 0. 08 0. 025
Ditto 1.9 0.28
~ 1 -76-

II
TABLE XIII
Ultimate Strength of River Ice (kg/cm ) During the Period ofThe Spring Break-up as a Function of the Rate of Ice Movement
(m/sec)
Rivers of the North and Siberia Rivers of the European USSR
Ice mo- Ice mo-tion Full break-up tion .Ful-break-up
Type of force 0.5 1.0 1.5 0.5 1.0 1.5
Compression 6.5 5.0 4.5 3.5 2.5 2.0Local crumpling 16.0 13.0 11.5 8.0 6.5 5.5Bd 7.5 6o5.5 4.0 3.5 3.0Shear 3-6 .5-3.0 --
Tension 7-9 .... 3-4 --
iii
I
r?
r?
'? 77 -m -
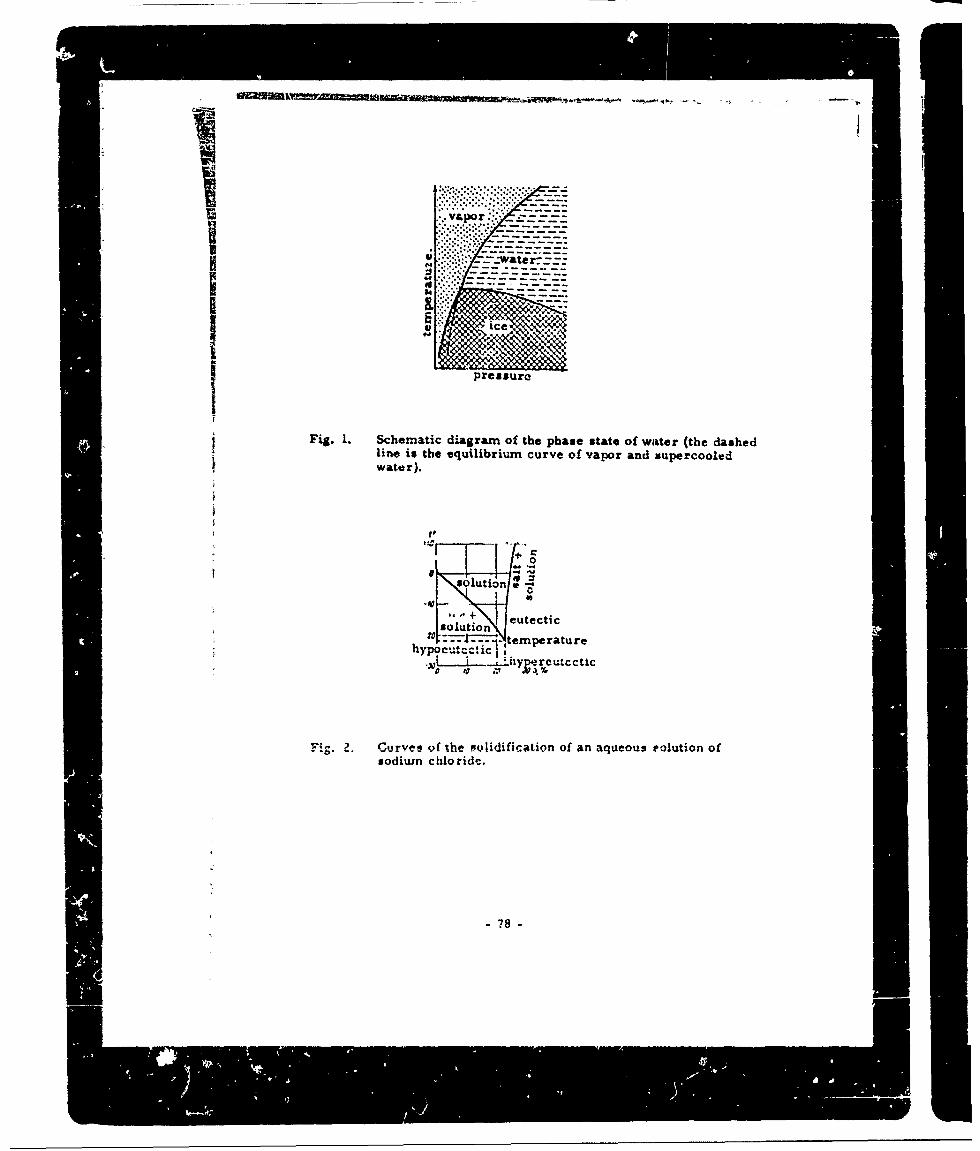
SO'C
Fig. 1. Scherratic diagram of the phase state of water (the dashedI line is the equilibrium curve of vapor and supercooled
water).
to
111,0
e utecticsolution
'temperaturehypoeutcct ic
.x *nygerclci
Fig. 2. Curves of the tgolidification of an aqueous rolution ofsodium chloride.
-78-
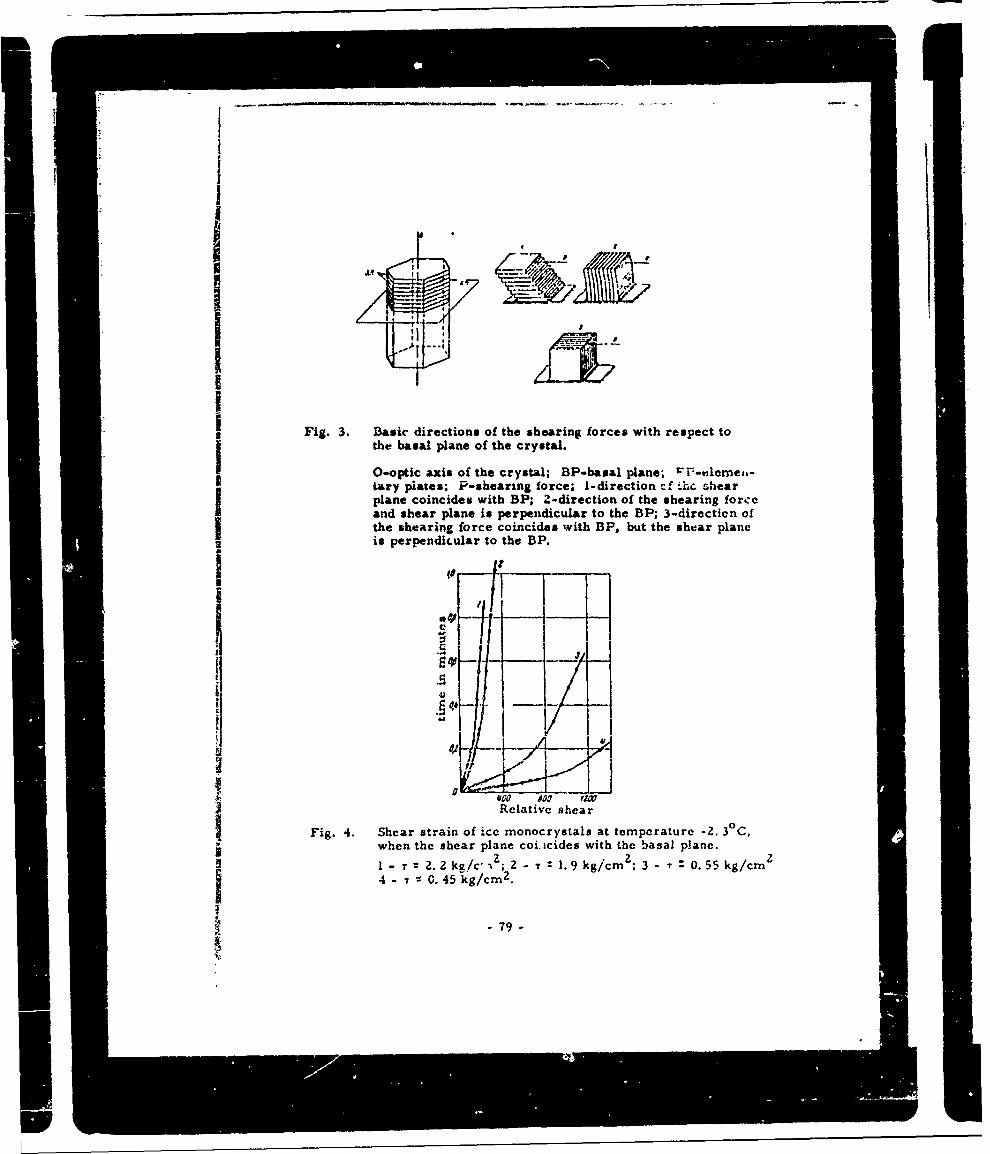
3. BscdrcinIfteseaigfre ihrsettthe baa ln -ftecytl
I Fig.l3. eBasincie whB;direction of the shearing forces ihrsett
arid shear plane is perpendicular to the BP; 3-directicri ofj the shearing force coincides with BP, but the shear plane
is perpendicular to the BP.
Fig 4. Sers a i fiemncytl ttmeaue-.30Cwhnth'herpln.ci cie wt 4ebaa paeI~ ~ I .2ktC .9k/m .5 gc4 0.45 L Lcm2
79 ~ ~a
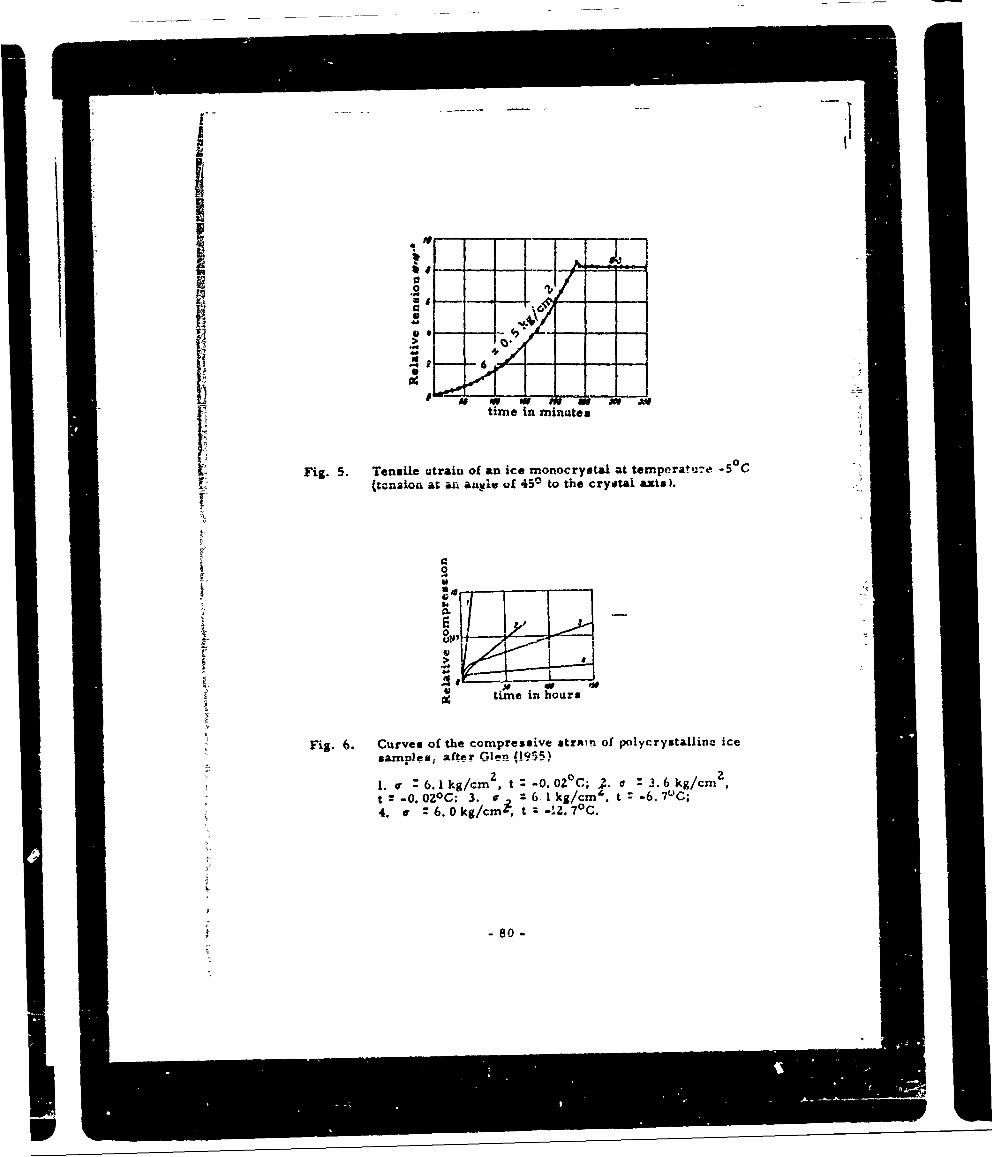
I0II
0
r.,
time in iuts
Fig. . Cuensil oftecmesvtrain of pnoceloycrystalli me~ne i5c
80

0
It.411
time iwn hours
rFig. 7. Curves of the compressive atrain of ice.tn- 2V - 1. T = 21 kg/cni2 ; t =-6. 70C; 2. or = 16 kg/cm
LPA t-50C;3. or 15 kg/C&M z -6. 40C
I0
C OwM
4w
time in hours
Fi g. 8. Curves of the tensile strain of ice.
2. -7C 4.7 o/r 21. a : 5. 3kg/cm, t--C .~:.5 cu
t 7'C.
eli

wo"V or
Fig. 9. Thbe sagging of ice beams at a temperature of about-2 0C and various loads Q in kg.
1. ice beam; Z. ioads (weights); 3. indicators fordetermining the dispIacemcnts of tC beam.
A
I 8

- - I
ii '
i V
(.t/ ,
IIi 1time in hours
Fia. 10. Pure shearing of ice at a tempW.eature of -4°C
(- is tangential stress in kg/cm')
- 83 -

w _ __ __ 4IiJ
tiei4or
Fi-1. ha sri wt imlaeostngnil n or a ~jcxUin th author's exeimns_ odeemiethorinn
fs It II
n 84

0
timne iii miutes
Fig. 13. Curves of relaxation
'I
.IY reep
Fig. 14. Curves of ice creep (-r1 iitfprlgeceap
lii of5 prlnedce

~~ W~41 &W 1J
Iwe1 0" .- ; J "
I C,,IL !
Fig. 15. Curves of the cxe-, of polycrystalline ice in pure shearat temperatures -1. 2°C and -1. 80 C (-r is the tangentialstress in kg/cmni)
I ii 2IA
-- tangential st --- f. i t l cmn
Fig. 16. Change in thn rteady state shiear as a function of tangentiailstrep: a-graph in ordinary cotI div-tev; b-the saxne, inlogarithmic coordinates; 1. at t = -1. 2C; Z. at t . -4 C; thnblack dots indicate points corresponding ttu the rnii ,muni shearvelocity with stresses exceeding the limit of prolonged i reep,when there is no prolonged stage oi stead- creep.
- 86 -
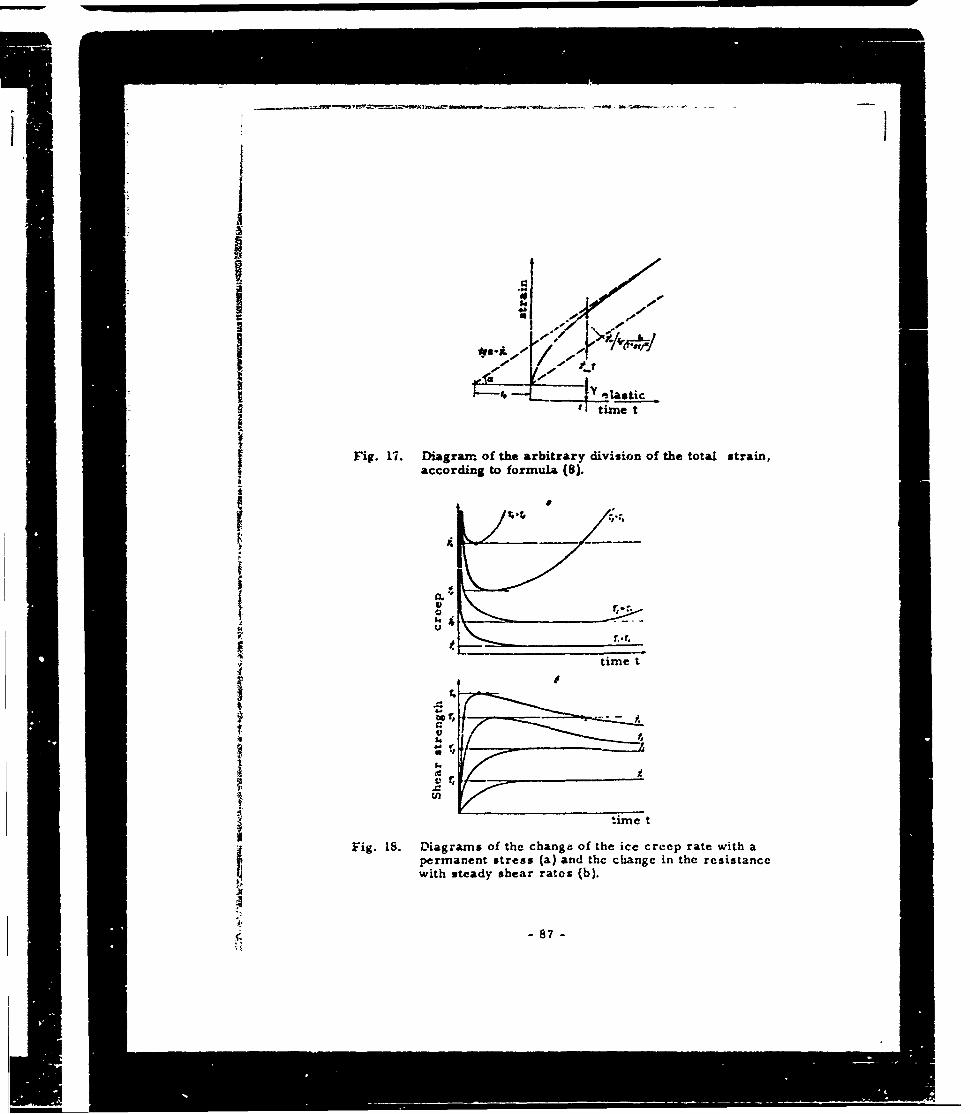
III....-.t..
lastictine t
I Fig. 17. Diagram- of the arbitrary division of the total strain,according to formula (8).
I,S0.
V
o a
time tFig. 18. Diagrams. of the cangear ivo of the eprteth stai
I U)
i ;ime t
Fig. 18. Diagrams of the chang of the ice creep rate with a
permanent stress (a) and thc change in the resistancewith steady shear rates (b).
-87-
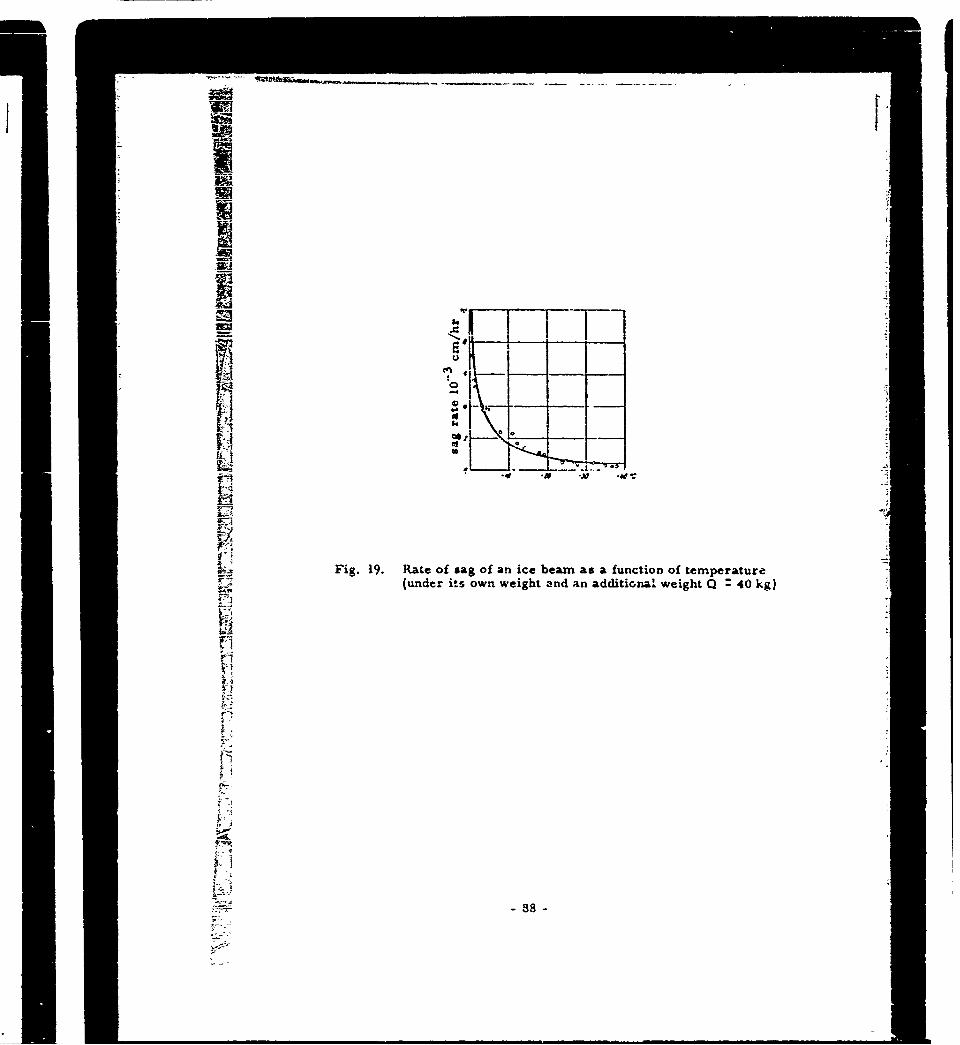
Fig. 19. Rate of sag of an ice beam as a function of temperaturer (under its own weight and an additional weight Q 40 kg)
~.- 8

-see
5V Ar A-4 4W
4A -A i
Fig 00.re fiewt omlad agnilsrs cigam
________a_ tmertue-3 8C
Soi lin - _ cagofrltv 0ha;dse ln- ~~of reaiecmrsso;rgrmlsrs i gcT tagental sressin ky41
41 189 -

0 I/hrIs
ste I (
if '90
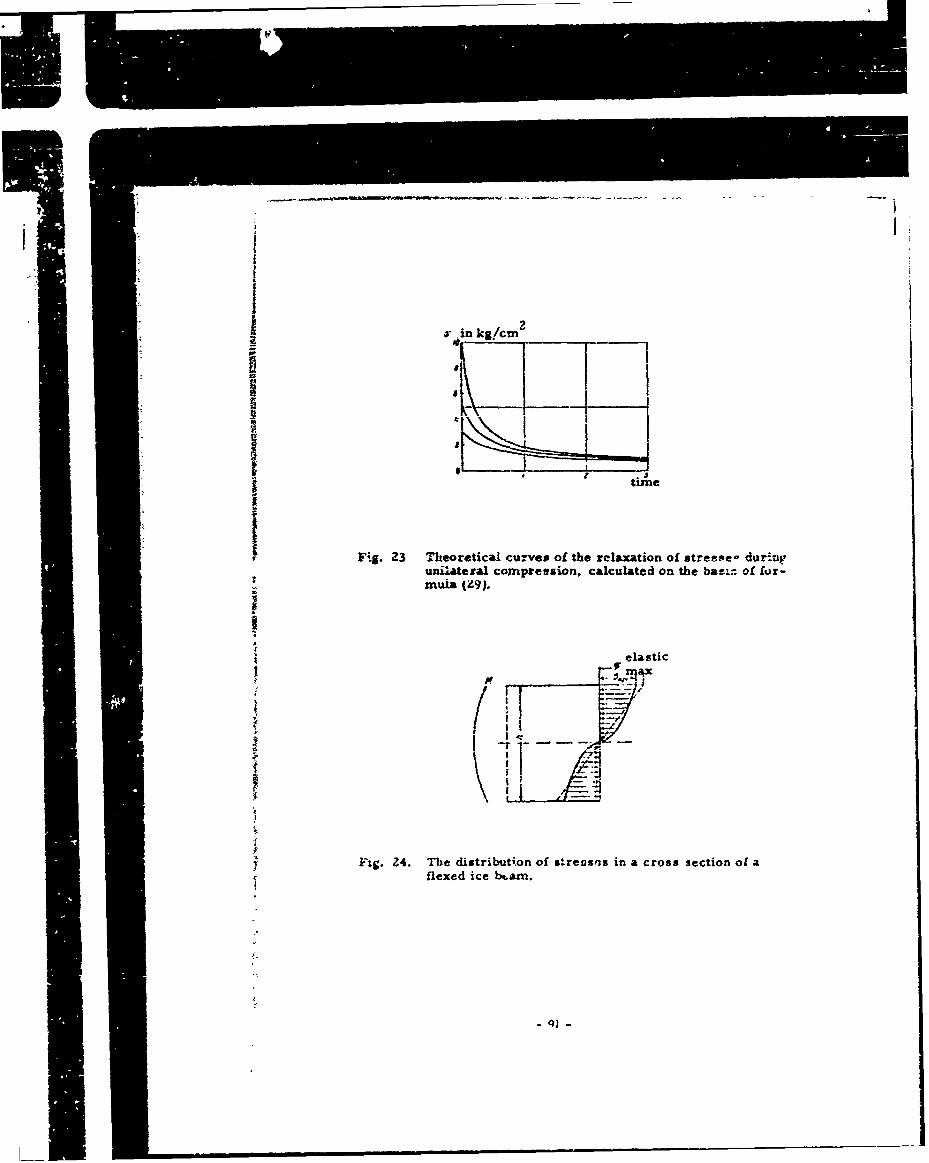
ain kg/cr&_______
* time
F;g. 23 Theoretical cu.-Vat of the relaxation of stress'e- durintunilateral compression, calculated on the bacxL: of for-muia (z9J.
elastic
ii
Fi'g. Z4. The distribution of streosna in a cross section of aflexed ice btam.
- 1

Fig. 25. Indentation of & fla, rouand die 30 cm 2 into ic'. att -:.3. SOC.LI with - g/m 2 ihe 'c
T in k/cmn
Ic time in hours
Fig. 26. Curve of long-term strength of freezing of ice to~ woodat t -0. 40C.
92

DISCLAIMER NOTICE
THIS DOCUMENT IS BEST QUALITYPRACTICABLE. THE COPY FURNISHEDTO DTIC CONTAINED A SIGNIFICANTNUMBER OF PAGES WHICH DO NOTREPRODUCE LEGIBLY.

UNCLASSIFIED
U
UNLSSE