Embed Size (px)
Citation preview

Ultra-low Energy Calibration of LUX Detector using 127Xe Electron Capture
Dongqing HuangBrown UniversityOn behalf of the LUX collaborationAPS April Meeting 2015
1

2
LUX Experiment
by Carlos Faham and Samuel Chan
S1
S2
Time
Drif
t ind
icat
es th
e de
pth

3
LUX Experiment
by Carlos Faham and Samuel Chan
Time
S1
S2
S2
Particle
S2

127Xe decay scheme
4
Electron capture: p + e- → n + νe
127Xe 127I
νe
cascade χ-rays or Auger
γ-ray52.7% 203keV17.2% 375keV
The binding energy and expected EC probability from that shell - K: 33.2 keV 83.4% - L: 5.2 keV 13.1% - M: 1.1 keV 2.9% - N: 190 eV 0.6%
- Cosmogenic activation- Half life: 36days- Based on the measurement of Apr222013 data, there are ~0.9million 127Xe atoms in LUX Xenon volume

127Xe EC Decay Event in LUX Data
5
LUXEventViewerGUI by James Verbus
S1S2
S2
x-ray(EC site)
γ-ray
e-
e-
S2
S2
S1
K-shell χ-ray 33.2keV
γ-ray 203keV
TOP PMTs
BOTTOM PMTs

127Xe EC Events in data
6
33.2 keV
5.2 keV
203k
eV
5.2
keV
1.1
keV
190e
V
Sin
gle
Ele
ctro
n
375keV
203keV
375k
eV
33.2
keV
LUXPreliminary Note:
Due to S2 threshold effect, N shell χ-ray events are not completed found for histogram; Detail analysis for N shell shown in later slides
µ = 74.5±0.9
µ = 183±1
µ = 856±2LUXPreliminary
190eV 1.1keV 5.2keV 33.2keV
(1electron = 10.6phe)

Ratio Analysis
7
LUX Preliminary
K 33.2keV L 5.2keV M 1.1keV N 190eV
#events used for fitting 2515 375 96 16
Amplitude from fit to decay time histogram (y intercept) 7517±150 1208±62 245±25 45±11
Expected percentage(%) 83.4 13.1 2.9 0.6
Observed percentage(%) 83.4±2.3(Result + 0σ)
13.4±0.7(Result + 0.4σ)
2.7±0.3(Result - 0.6σ )
0.5±0.1(Result - 1σ )

Searching for N-shell χ-rays
8
N-shell χ-ray(SE)
γ-ray
SE
SE
LUXPreliminary 203keV
2σ 2σ
BG
TOP PMTs
BOTTOM PMTs
Energy Reconstruction of Single-Vertex Events

N shell Fit
9
● Fiducial r → 22cm● S2 threshold: 250phe
● All SE-type pulses between S1 and S2 in drift are histogrammed
○ In this case, more background will be presented; but no real signal is missed
● Total number of observed M-shell χ-ray events with fiducial r 22cm and S2 threshold 250phe
○ 501±22● Total expected number of N-shell
events based on the known ratio between M and N shell (see slide7):
○ 115±11● The best-fit N is within 1 sigma of
what is expected
LUXPreliminary
(1electron = 10.6phe)
µ = 15.9(1.2+/-1.3)σ = 7.7(+1.0/-0.8)N = 106

NESTv98*[1][2] & Data
10* NEST with simulation of detector effects such as the binomial light collection and extraction efficiency
LUXPreliminary
Energy (keVee)
(EC x-ray)127I
NEST S2c(phe)
NEST QY(e/keVee)
NEST QY width(e/keVee)
127Xe Data Fit S2c
(mean phe)
127Xe Data QY(e/keVee at 180
V/cm)
127Xe Data QY width
(e/keVee)
33.2 (K shell) 8121 23.1 3.42 9093±21 25.8±0.9 4.06±0.15
5.2 (L shell) 1830 33.2 5.18 1943±13 35.2±1.2 7.2±0.3
1.1 (M shell) 633 54.5 12.26 802±10 68.6±2.5 12.5±0.7
0.19 (N shell) 131 65.4 32.49
169(+11/-13) 83.7(+6.2/-7.1) 40.6(+5.6/-4.7)
[1] Matthew Szydagis, Adalyn Fyhrie, Daniel Thorngren, and Mani Tripathi. Enhancement of NEST Capabilities for Simulating Low-Energy Recoils in Liquid Xenon. JINST, 8:C10003, 2013. doi:10.1088/1748-0221/8/10/C10003.
[2] Brian Lenardo, Kareem Kazkaz, Aaron Manalaysay, Matthew Szydagis, Mani Tripathi. A Global Analysis of Light and Charge Yields in Liquid Xenon. arXiv:1412.4417 [astro-ph.IM]
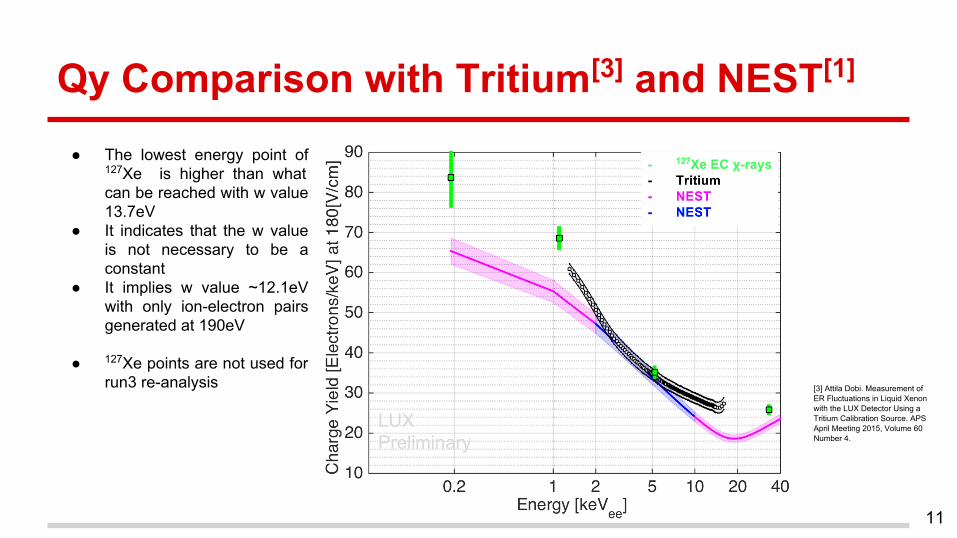
Qy Comparison with Tritium[3] and NEST[1]
11
LUXPreliminary
[3] Attila Dobi. Measurement of ER Fluctuations in Liquid Xenon with the LUX Detector Using a Tritium Calibration Source. APS April Meeting 2015, Volume 60 Number 4.
● The lowest energy point of 127Xe is higher than what can be reached with w value 13.7eV
● It indicates that the w value is not necessary to be a constant
● It implies w value ~12.1eV with only ion-electron pairs generated at 190eV
● 127Xe points are not used for run3 re-analysis

Acknowledgment Special thanks to My advisor Professor Richard GaitskellSpecial thanks to Alastair Currie(Imperial College London)
Thanks to James Verbus, David Malling, Jeremy Chapman, Simon Fiorucci
12

Appendix slides:
13

127Xe EC DecayThere are two components in Electron Capture decay: - γ-ray or I.C. Electron associated with 127I excited state - χ-ray cascade (in daughter atom) from atomic electron vacancy in the K,L,M or even N shell.
- Note that Auger Electron processes are subdominant in high-Z atoms.
If a γ-ray is emitted, the mean free path in Xe, will lead to a reasonable probability that a second vertex separated from the first created.
- 203 keVee → ~1.0cm
- 375 keVee → ~2.2cm
- Note that events where γ-ray escapes the active region completely become low
energy ER background events.
Binding energies of atomic electrons in 127I and percentages: - K: 33.2 keVee 83.4% - L: 5.2 keVee 13.1% - M: 1.1 keVee 2.9% - N: 0.19 keVee 0.6% - Note that percentages are calculated by including neutrino-phase space
14
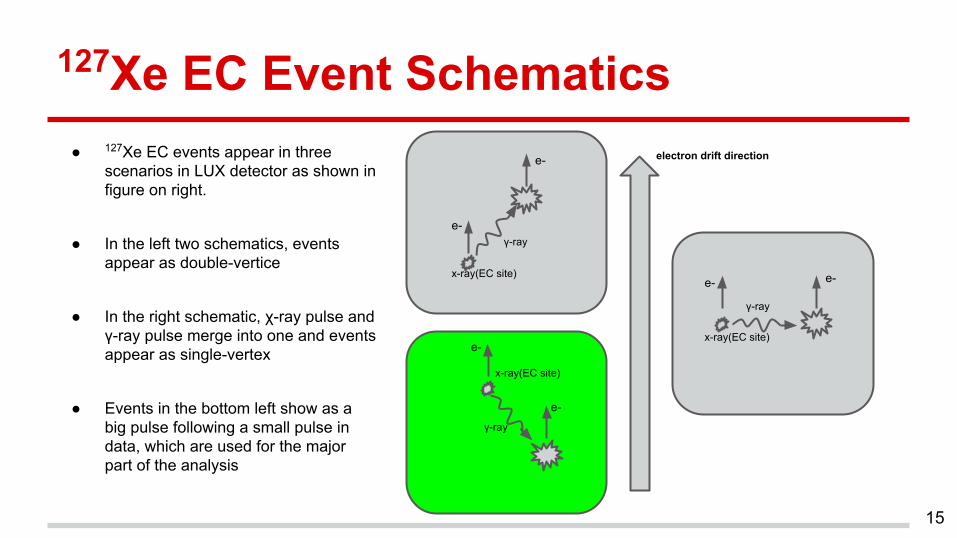
127Xe EC Event Schematics● 127Xe EC events appear in three
scenarios in LUX detector as shown in figure on right.
● In the left two schematics, events appear as double-vertice
● In the right schematic, χ-ray pulse and γ-ray pulse merge into one and events appear as single-vertex
● Events in the bottom left show as a big pulse following a small pulse in data, which are used for the major part of the analysis
x-ray(EC site)
x-ray(EC site)
x-ray(EC site)
γ-ray
γ-ray
γ-ray
e-
e-
e- e-
e-
e- electron drift direction
15
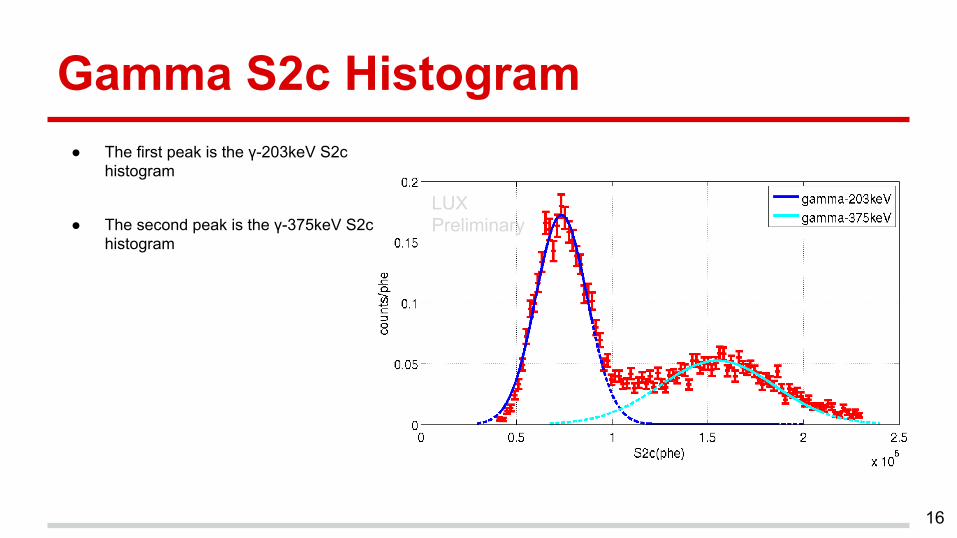
Gamma S2c Histogram● The first peak is the γ-203keV S2c
histogram
● The second peak is the γ-375keV S2c histogram
16
LUXPreliminary
Z-Separation 0.19keV 1.1keV 5.2keV 33.2keV
17
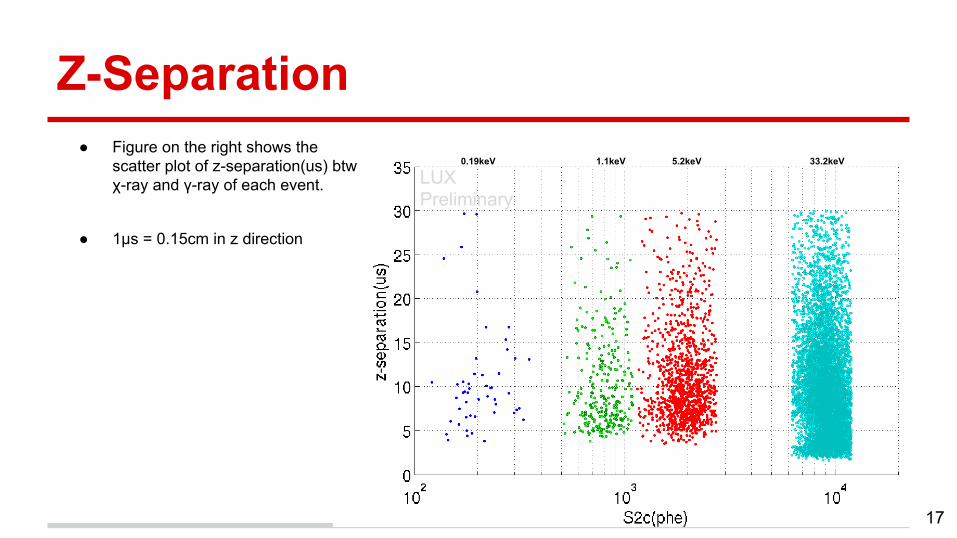
0.19keV 1.1keV 5.2keV 33.2keV● Figure on the right shows the
scatter plot of z-separation(us) btw χ-ray and γ-ray of each event.
● 1μs = 0.15cm in z direction
LUXPreliminary

Z-Separation Histogram● Events with γ-203keV S2 size less than the
mean value are used for histogram to mitigate γ-375keV impact on its mean free path(see slide16)
● The histograms show a semi-exponential trend due to photon attenuation of γ-203keV.
● Data are fitted from the bins which are fully efficient.
● The mean free path of the best fit:○ 1.08±0.06cm
● The theory predicted mfp:○ 0.928cm
● The discrepancy(16%) is due to uncertainty in electron drift velocity and liquid xenon density
18
LUXPreliminary

N-shell Event Schematics● When the size of N-shell χ-ray pulse is too small
(less than S2 threshold), it is then classified as SE-type pulse; and thus 127Xe EC event that happens with N-shell χ-ray appears as single vertex event.
● Bottom-left schematic shows an N-shell event with real SEs and χ-ray pulse; and χ-ray pulse is classified as SE-type pulse due to its small size
● Events shown on the right schematic become background events because the χ-ray pulse merges into γ-ray pulse; the combined pulse has size close to the size of γ itself since the size of γ pulse is significantly greater than that of χ-ray
● γ-ray signal helps determine what single-vertex events are needed to be looked into to find N-shell χ-ray signal
N-shell x-ray(EC site)
γ-ray
x-ray(EC site)
γ-ray
SE
SE
electron drift direction
19
N-shell χ-ray(SE)
γ-ray
SE
SE

Energy Histogram of Single-Vertex events● S2 threshold: 250 phe
● Energy reconstruction model:● g1 = 0.120±0.002 (phe/ph)● EE = 0.431±0.015● SE = 24.66±0.02 (phe)● g2 = EE*SE
● E = 0.0137 *(S1/g1 + S2/g2)● Esys = ~1.6% at the energy
range shown in the plot
20
LUXPreliminary

Energy Histogram of Single-Vertex events● The second peak is the 127Xe EC events with γ-203keV pulse merged with L-shell χ-ray pulse
○ data: mean = 215.4keV; sigma = 8.2keV○ expected: 203 + 5.2 = 208.2keV predicted by theory
● The third peak is the 127Xe EC events with γ-203keV pulse merged with K-shell χ-ray pulse○ data: mean = 244.2keV; sigma = 8.0keV○ expected: 203+33.2 = 236.2keV predicted by theory
● The peak means are systematically off from expected values by ~3% which is a factor of 2 greater than the systematics caused by uncertainty in g1 and g2; the extra systematics is due to the field variation in detector.
● Set up a new energy scale relative to the third peak (with most statistics) ○ γ-203keV peak:
■ mean = 212.2 keV; sigma = 8.2keV● N-shell χ-rays, which have been classified as SE-type pulse, expects to be found in γ-203keV single-vertex
events
● The energy cut for signal region (2 sigma):○ [195.8 228.6] keVee
● The energy cut for background region:○ [240 260] keVee
21


![Symbol - 0.tqn.com · Xe Xenon 131.29 55 Cs ... Electron Configuration 1s1 [Rn]5f146d37s2 ... [Xe]5d16s2 [Xe]4f15d16s2 [Xe]4f36s2 [Xe]4f46s2 [Xe]4f56s2 [Xe]4f66s2 [Xe]4f76s2 [Xe](https://img.dokumen.tips/doc/110x75/5b6b1a407f8b9a9f1b8d06f4/symbol-0tqncom-xe-xenon-13129-55-cs-electron-configuration-1s1-rn5f146d37s2.jpg)
![Periodic Table Electron Configuration - BBG - 2015 · Electron Configuration 1s1 [Rn ... [Xe]5d16s2 [Xe]4f15d16s2 [Xe]4f36s2 [Xe]4f46s2 [Xe]4f56s2 [Xe]4f66s2 [Xe]4f76s2 [Xe ... Color](https://img.dokumen.tips/doc/110x75/5b6b1a407f8b9a9f1b8d06f2/periodic-table-electron-configuration-bbg-2015-electron-configuration-1s1.jpg)


![IA 1A Periodic Table of the Elements H He · Electron Configuration Electron Shells 1 IA 1A 1 2 3 ... [Xe]5d16s2 [Xe]4f15d16s2 [Xe]4f36s2 [Xe]4f46s2 [Xe]4f56s2 [Xe]4f66s2 [Xe]4f76s2](https://img.dokumen.tips/doc/110x75/5b6b1a407f8b9a9f1b8d06f3/ia-1a-periodic-table-of-the-elements-h-he-electron-configuration-electron-shells.jpg)