Embed Size (px)
Citation preview

UK Poverty 2017A comprehensive analysis of poverty trends and figures
Report by the JRF Analysis Unit

JRF – UK Poverty 2017
1
Contents
Acknowledgements 2 Executive summary 3 Introduction 7 Poverty among children and working-age adults 13 Pensioner poverty 51 Housing, health and relationships 68 Drivers of future poverty 85 Conclusion 99 Notes 101 Appendix: UK poverty 2017: methodology 105 Appendix notes 110

2
JRF – UK Poverty 2017
2
Acknowledgements
AcknowledgementsThank you to the team at JRF who worked on the report: Helen Barnard, Ashwin Kumar, Andrew Wenham, Eddie Smith, Ben Drake, Aleks Collingwood and David Leese.
We would like to thank Wendy Sykes, Nick Coleman and Andrea Finney from Independent Social Research, and Dave Thomson from the Education Datalab/FFT Education, for their contributions to the analysis for this report. We would also like to thank Luke Staniland for his advice and support in developing the analysis for the report. All views and any errors contained in this report are the responsibility of the authors.

3
JRF – UK Poverty 2017
3
Executive summary
Executive summaryIntroductionNearly a quarter (24%) of the UK’s population lived in poverty 20 years ago. By 2004, this had fallen to one in five (20%) of the population. By 2015/16, the proportion had risen slightly to 22%. However, the overall trend masks large variations in the fortunes of different groups. Over the last 20 years the UK succeeded in reducing poverty significantly among those groups who had traditionally been at most risk – pensioners and some types of families with children. Very little progress was made in reducing poverty among working-age households without children. In more recent years, poverty rates have started to rise again among both pensioners and families with children.
Working-age povertyPoverty rates are consistently highest among children and their parents. Twenty years ago, a third of children lived in poverty. This fell by 15% between 1994/95 and 2004/05, to 28% of children. The child poverty rate fell to its lowest level (27%) in 2011/12, but has started to rise again in recent years, reaching 30% in 2015/16.
Over the last 20 years there have been very significant reductions in poverty among those working-age families particularly at risk: lone-parent families and families with three or more children. In 1994/95, 58% of lone parents lived in poverty, rising to 62% in 1996/97. Their poverty rate then fell to a low of 41% in 2010/11 before rising again to 46% in 2015/16. In 1994/95, 45% of children in families with three or more children lived in poverty; compared with 27% of children in families with one or two children. The risk of poverty for children in families with one or two children barely changed over 20 years. However, poverty among families with three or more children had fallen to 32% by 2012/13. Since 2012/13 their poverty rate has started to rise again – reaching 39% by 2015/16 (even before the two-child limit on benefits and tax credits was introduced in April 2017).
Poverty rates among couples without children have always been low and have changed very little, with around one in 10 in poverty throughout the last 20 years. Levels of poverty among single people without children have also been fairly steady – around 25% were in poverty in 1994/95, rising to 28% in 2009/10 and falling back to 25% by 2015/16.
Two factors drove the falls in poverty among families with children. First, successive governments chose to increase support for these families through the benefit and tax credit system. Benefits for out-of-work families not only kept up with prices, between 2000 and 2013 they rose in comparison with average incomes.1 The introduction of tax credits meant that those in work but with low earnings were also supported. These decisions meant that these families saw their living standards move closer to those among the rest of the population and were protected from the worst effects of the 2008–09 recession. Second, there were big reductions in worklessness and rises in employment. These were accompanied by rising skill levels and increased wages for the low-paid due to the introduction and raising of the minimum wage.

4
JRF – UK Poverty 2017
4
Executive summary
Since 2013, these reductions in poverty among families with children have gone into reverse. Their poverty rates are rising, largely due to reductions in the support offered by benefits and tax credits. Tax cuts and minimum wage rises are beneficial for some, but for many low-income families, the gains are far outweighed by reductions in the more targeted support given by the benefit and tax credit system.
The financial pressures faced by families on low incomes have been exacerbated by increases in the cost of essential goods and services. The proportion of working-age adults in the poorest fifth of the population who spend more than a third of their income (including Housing Benefit) on housing costs has risen from 39% in 1994/95 to 47% in 2015/16. This is partly due to far greater numbers now living in the private rented sector, but has also been affected by increases in the cost of social rented housing and reductions in the benefits intended to help low-income families afford it. The cost of childcare has also increased substantially. People on low incomes spend proportionally more of their income on food and fuel, and fuel prices have increased faster than overall inflation. This means that since 2003, people on low incomes have also experienced consistently higher inflation than those with higher incomes, despite having far less scope to reduce spending.
Pensioner povertyIn 1994/95, pensioners had the highest rates of poverty in the UK apart from children. 28% of pensioners lived in poverty; by 2011/12, this had fallen to only 13%, driven mainly by falls in poverty among single pensioners. More recently, however, pensioner poverty has started to increase again, reaching 16% in 2015/16.
The largest falls in the pensioner poverty rate happened in the period from 1998/99 to 2004/05. The increase in income was driven by two main factors. First, increased state benefit income, particularly the Pension Credit Guarantee (previously the Minimum Income Guarantee), which boosted the incomes of lowest income pensioners. Second, more pensioners retired owning their own home, meaning that their housing costs were much lower than those still renting.
However, in the past few years these drivers have become weaker. The Pension Credit Guarantee failed to keep up with prices for a number of years. Housing costs for those pensioners still renting have risen, and growth in occupational pensions has tended to benefit better-off pensioners more than those on lower incomes.
Housing, health and relationshipsLiving on a low income reduces the options available for housing, leaving some people more vulnerable to living in poor quality or insecure homes. The proportion of homes which do not meet minimum standards of covering safety, state of repair, facilities and heating has fallen over time but those on low incomes remain more likely to live in them than those who are better off. For instance, in England just over one in five of people in the poorest fifth of the population live in ‘non-decent’ homes.
Poverty is also closely linked to health. The stress of struggling to make ends meet affects both physical and mental health. Poor health also increases the risk of poverty by limiting people’s opportunities to work and increasing costs. The evidence shows that adults in the poorest fifth of the population experience worse physical health than those who are better off. Disability is strongly linked to poverty – 30% of people in families with disabled members live in poverty, compared with 19% of those who do not. Mental health is also associated with poverty. Nearly a quarter of adults in the poorest fifth of the population experience depression and anxiety – more than twice the number in the richest two-fifths of the population. The proportion of those in the poorest fifth in England experiencing these mental health difficulties has also increased over time.

5
JRF – UK Poverty 2017
5
Executive summary
There is an emerging body of evidence about the links between poverty and relationships – both within families and with wider support networks. Measurement of these issues and of the ways that they interact with poverty and other factors is at an early stage. Social isolation (defined as having no more than one close friend) is more common among those with lower incomes than those who are better off. More than one in 10 working-age adults in the poorest two-fifths of the population are socially isolated, compared with just over one in 20 of those in the richest fifth. This link is even stronger among pensioners: around one in six of the poorest fifth of pensioners are socially isolated, compared with only around one in 14 in the richest fifth.
Within families, poverty can also place a strain on relationships. Children in lower-income families are more likely to report that they quarrel with their parents and do not discuss important issues with them. The proportion of couples experiencing ‘relationship distress’ is higher in the poorest fifth of the population and decreases as incomes rise: just over one in 10 of those in the poorest fifth compared with around one in 20 of those in the richest fifth. Separation is well known to greatly increase the risk of poverty, but the evidence also shows that couples who are on low incomes are more likely to separate than those who are better off.
Drivers of future povertyThere are several factors that affect the chances of children experiencing poverty when they grow up, and of working-age adults experiencing poverty later in their lives. Many of these factors not only contribute to the risk of future poverty, they are also, at least to some extent, a consequence of current poverty. Living in poverty as a child increases the risk of having low attainment at school. Adults in poverty, and those in low-paid jobs, are less likely to receive training and to progress into better jobs than those who are better paid. Adults on low incomes are less likely to save money or pay into a pension.
The data suggests that children’s educational attainment overall has risen across the UK but that the gap in attainment between children from richer and poorer backgrounds remains stubbornly large. In England and Northern Ireland, at age 16, young people from poorer backgrounds are around a third less likely to achieve good qualifications; in Wales they are about half as likely and in Scotland a fifth less likely (although this is not directly comparable with other parts of the UK as attainment data in Scotland is available by area rather than family’s circumstances). These results are not directly comparable between the four parts of the UK as both measurement and educational systems vary considerably, but it is clear that young people from poorer backgrounds across the UK are much less likely to achieve good qualifications, putting them at much higher risk of continuing to live in poverty as adults.
Since 1996, there has been a large decrease in the proportion of working-age people with no qualifications and an increase in the proportion with higher education and degree-level qualifications. By 2016, less than one in 10 working-age adults in England, Scotland and Wales had no qualifications, a reduction of more than half. Wales had caught up with England and Scotland by this time, having begun with a higher proportion of adults with no qualifications. Northern Ireland stands out as having started the period with the highest proportion of adults with no qualification (30%), and still having a much higher proportion in 2016 (16%), despite a reduction of nearly half.
The proportion of working-age adults with higher education qualifications has nearly doubled in England, Wales and Scotland; 45% of working-age adults in Scotland, 38% in England and 35% in Wales have these qualifications. In Northern Ireland, the proportion with higher education qualifications was the lowest in 1996 (at 17%) and remained the lowest in 2016 (at 31%).

6
JRF – UK Poverty 2017
6
Executive summary
The level of financial resilience among those on low incomes can be seen in the data on the level of savings, debt and pension accumulation among this group. Having some savings can be an important buffer to cover unexpected fluctuations in income and avoid having to take on high-cost credit to meet day-to-day expenses. Likewise, getting into debt by falling behind with bills can make it much harder for someone to reach a reasonable living standard, even if their income increases. Building up a pension is an important factor affecting someone’s risk of poverty in later life.
In 2015/16, six in 10 of those in the poorest fifth of households had no savings at all, while a further one in nine had savings less than £1,500. This is in stark contrast to those in the better-off parts of the population: most households in the richest three-fifths of the population have savings of more than £1,500.
Just under one in 10 households report having ‘problem debt’, defined by the Family Resources Survey as being behind with any household bill or credit commitment. This is much higher among those in the poorest fifth compared with the rest of the population; 20% compared with 11% of the second poorest fifth, and 1% of the richest fifth.
The proportion of the in-work population contributing to a pension scheme increased from 45% to 55% following the introduction of a new pension scheme and auto-enrolment for employees in 2012. However, only 30% of people in work in the poorest fifth of the population are contributing to a pension scheme, compared with 67% of those in the richest fifth.
ConclusionThe prospects for solving UK poverty are worrying. The continuing rise in employment is no longer leading to lower poverty. Changes to benefits and tax credits for working-age families are reducing the incomes of many of those on low incomes. High housing costs continue to reduce the incomes available for those in poverty to meet other needs. Inflation is rising and is higher for those on lower incomes than for better-off groups. This squeeze on living standards is also storing up problems for the future. Most people on low incomes have no savings and are not building up a pension. The decreasing proportion of the working-age population buying their own home means that in the future more older people are likely to rent and have higher housing costs in retirement.
The UK’s success in increasing employment rates means that many of those who are now out of work are disabled or have health conditions, have young children or are caring for disabled adults. Those circumstances make it far harder for them to find and sustain work and more likely that when they do get work, it is low-paid and part-time.
The skills profile of the adult population has improved considerably over the last 20 years, enabling more people to get work and improve their earnings. But there is still a group with no or low qualifications who are at an increasing disadvantage in the labour market. Qualifications are also far less effective in improving pay prospects for people working part-time.
The impact of poverty on physical and mental health and on relationships within families adds to the disadvantages facing those living on low incomes. Enabling those in poverty to improve their incomes and reduce their costs, as well as addressing the negative impacts of low incomes, would help to prevent future poverty.
7
JRF – UK Poverty 2017
7
Introduction
IntroductionThis is the first report to assess the progress the UK is making in reducing poverty rates and tackling the underlying drivers of poverty since the publication of the Joseph Rowntree Foundation’s report We can solve poverty in the UK. The report takes a long view of these trends – examining how UK poverty has changed over the last 20 years, as well as more recent developments.
Poverty is when a person’s resources are well below their minimum needs, including the need to take part in society. Measuring poverty accurately is difficult, with most measures providing only a partial view. The main poverty indicator used throughout this report is when someone lives in a household whose income is less than 60% of median income, adjusted for their household size and type. This is the most commonly used measure both in the UK and internationally. The report also references other measures where these provide particularly important information that is not captured by the headline indicator.
Poverty varies greatly across the population. Overall, poverty fell by about a fifth between 1994/5 and 2004/5. In the following decade progress stalled and poverty started to rise again. In 1994/5, 24% of the population lived in poverty. This fell to 20% in 2004. By 2015/16 it had risen slightly to 22%. However, poverty among some groups has fallen markedly, while others have seen little improvement or a deterioration in their fortunes.
Relative poverty rates*
The report starts with an overview of changes to a range of headline indicators over the last five and the last 20 years.
* Measured using 60% of median income, after housing costs (AHC)
Source: Households Below Average Income (JRF analysis)
Children PensionersWorking-age adults with childrenAll people Working-age adults without children
Perc
enta
ge in
pov
erty
40%
25%
35%
30%
20%
10%
5%
0%
15%
1994/95
1995/96
1996/97
1997/98
1998/99
1999/00
2000/01
2001/02
2002/03
2003/04
2004/05
2005/06
2006/07
2007/08
2008/09
2009/10
2010/11
2011/12
2012/13
2013/14
2014/15
2015/16

8
JRF – UK Poverty 2017
8
Introduction
The second chapter focuses on the UK’s working-age population. It examines changes in poverty among different groups of working-age families – those with and without children, couples and single people and those in and out of work. It then examines some of the main drivers of those changes – employment, worklessness, pay, skills and disability. Poverty is caused not only by the resources that people have available to them, but also by the cost of living. The report focuses on two of the biggest costs facing many households – housing and childcare. It also sets out the overall inflation rates faced by richer and poorer people in the UK.
We then look at the changes in pensioner poverty across the UK. This starts with the overall trends in poverty among pensioners in different household types. It then moves to examine the drivers of these changes, in particular changes in state benefits, occupational pensions and home-ownership.
The fourth chapter examines issues that are closely linked to poverty – housing quality and security, physical and mental health and relationships within families and more widely. The evidence shows that living in poverty affects all these areas of life, making it harder for individuals and families to thrive and damaging their future prospects.
Finally, we look ahead, considering the outlook for poverty. Education and skills are the biggest factors predicting whether individuals are likely to experience poverty. The report therefore examines progress in improving qualifications and raising educational attainment, in the adult population and among children from low-income or disadvantaged backgrounds. Financial resilience is also crucial to enabling people to manage changes in their needs or resources and to avoid poverty in later life. The report therefore concludes by exploring trends in savings, problem debt and pension accumulation.

9
JRF – UK Poverty 2017
9
Introduction
Summary of trends over the last five and last 20 years
Indicator 20 years 5 years
Poverty rates Child poverty Better Worse
Working-age adults with children poverty No change No change
Working-age adults without children poverty Worse No change
Pensioner poverty Better Worse
Persistent poverty – No change
People in a family which includes a disabled adult or child Better No change
Work and worklessness(working-age)
Poverty risk for people in workless families Better No change
Poverty risk for people in working families Worse Worse
Employment rate Better Better
Workless households % Better Better
Costs % of poorest fifth spending more than one-third of income on housing Worse No change
Education and skills
Attainment gap at age 16*
England – Better
Scotland – Better
Wales – Better
Northern Ireland **
Working-age adults with no qualifications Better Better
Working-age adults with a higher education qualification Better Better
Health(for the poorest fifth of the population)
Adult physical health (UK, working-age adults) – Worse
Adult mental health (England) Worse† Worse†
Adult mental health (Scotland) – Better§
Young people’s mental health – No change
Financial resilience(for the poorest fifth of the population)
% with no savings Worse No change
Notes:
– Data is not available for comparison with 20 years ago.* Changes over time in England and Wales should be treated with caution due to changes in education systems.** Changes in the eligibility for free school meals in Northern Ireland means that comparative data is not available.† Analysis of this data covers a slightly different time period: from 1998 to 2008 and then from 2008 to 2014.§ Analysis of this data covers a slightly different time period: from 2008 to 2014.
Methodological note:
All indicators except the education attainment gaps at age 16 are based on survey data. The summaries of change shown for survey data are based on statistical tests that measure whether a change in a rate is significant with 95% confidence.

10
JRF – UK Poverty 2017
10
Introduction
Overview of the number of people in poverty and the poverty rate for different groups
Group Number in poverty Poverty rate
People in poverty 13,900,000 22%
People in persistent poverty 4,600,000 7%
Children in poverty 4,000,000 30%
Working-age adults in poverty 8,000,000 21%
Pensioners in poverty 1,900,000 16%
Disabled people in poverty (using the after disability benefits measure)
4,200,000 31%
People in families that include a disabled adult or child
6,400,000 30%
People in families that do not include a disabled adult or child
7,900,000 19%
Single pensioners in poverty 900,000 20%
Couple pensioners in poverty 1,000,000 13%
Single working-age adults in poverty with no children
2,900,000 25%
Working-age adults in poverty in a couple with no children
1,600,000 12%
Working-age lone parents in poverty 900,000 46%
Children in poverty in lone-parent families 1,500,000 47%
Working-age parents in poverty in couple families 2,600,000 22%
Children in poverty in couple families 2,500,000 24%
Working-age adults and children in poverty in workless households
4,100,000 63%
Working-age adults in poverty in workless households
2,800,000 60%
Children in poverty in workless households 1,300,000 72%
Working-age adults and children in poverty in working households
8,000,000 18%
Working-age adults in poverty in working households
5,200,000 16%
Children in poverty in working households 2,700,000 23%
11
JRF – UK Poverty 2017
11
Introduction
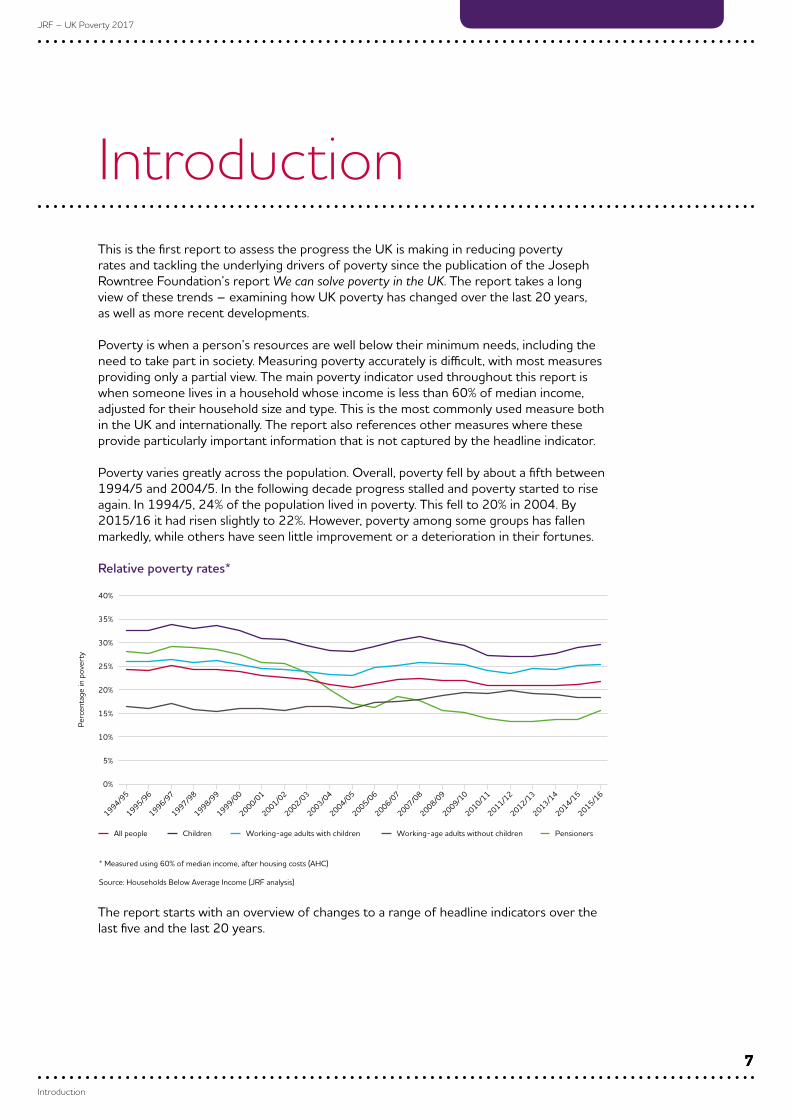
Group Number in poverty Poverty rate
Working-age adults in poverty in couple families where both adults work full-time
200,000 3%
Children in poverty in couple families where both adults work full-time
100,000 5%
Working-age adults in poverty in couple families with one full-time worker earner
1,200,000 27%
Children in poverty in couple families with one full-time worker earner
800,000 36%
Working-age adults in poverty in couple families with one full-time and one part-time worker
400,000 7%
Children in poverty in couple families with one full-time and one part-time worker
300,000 10%
Lone parents working full-time in poverty 200,000 28%
Children in poverty in full-time working lone-parent families
200,000 28%
Lone parents working part-time in poverty 200,000 35%
Children in poverty in part-time working lone-parent families
400,000 36%
Children in poverty in families with one child 1,000,000 27%
Children in poverty in families with two children 1,600,000 26%
Children in poverty in families with three children 900,000 36%
Children in poverty in families with four or more children
500,000 45%
Children in poverty in families where the youngest child is under 4
2,100,000 34%
Children in poverty in families where the youngest child is aged between 5 and 10
1,000,000 24%
Children in poverty in families where the youngest child is older than 10
900,000 28%
Workers in poverty 3,700,000 12%
Full-time workers in poverty 2,400,000 10%
Part-time workers in poverty 1,300,000 20%
Source: Households Below Average Income 2015/16 (JRF analysis) except figures for persistent poverty which are taken from Persistent poverty in the UK and EU: 2015 (2017) Office of National Statistics. Available at: www.ons.gov.uk/peoplepopulationandcommunity/personalandhouseholdfinances/incomeandwealth/articles/persistentpovertyintheukandeu/2015

12
JRF – UK Poverty 2017
12
Introduction
Poverty lines for different householdsThe poverty indicator used throughout this report is when a family has an income of less than 60% of median income for their family type, after housing costs (AHC). The most recent poverty lines for four illustrative family types are provided below.
It is important to note that these represent the total net income for each family type – earnings from employment, profit or loss from self-employment, state support (including benefits, tax credits and state pensions) and any other source of income. They are also after income tax, National Insurance and Council Tax payments, as well as contributions to occupational pension schemes, maintenance payments and student loan repayments. These income levels are measured after housing costs. They subtract costs such as rent and the contribution of Housing Benefit to their income.
Many families on low incomes receive all or part of their income from sources other than employment, meaning that their earnings may be considerably less than these income levels.
Family type £ per week, equivalised, 2015/16 prices
Couple with no children 248
Single with no children 144
Couple with two children aged 5 and 14 401
Single with two children aged 5 and 14 297
Source: Households Below Average Income 2015/16, table 2.2db (www.gov.uk/government/statistics/households-below-average-income-199495-to-201516)

JRF – UK Poverty 2017
This chapter examines changes in poverty among children and working-age adults over the last 20 years. It describes the ways in which poverty has changed among different groups and sets out the factors that have driven changes in poverty rates over time.
Poverty among children and working-age adults
Summary 14 Poverty levels and trends 15 Drivers of changes to poverty levels 17 Disability and ethnicity 25 Poverty across the UK 29 The challenge ahead 29

JRF – UK Poverty 2017
14
Poverty among children and working-age adults
SummaryOver the last 20 years there have been very significant reductions in poverty among working-age families who were particularly at risk. Lone-parent families and families with three or more children have always had high rates of poverty but these have fallen markedly.
Poverty rates among couples without children have always been the lowest and have changed very little – around one in 10 were in poverty between 1994/95 and 2004/05. Since then there has been a very slight increase to 12% in 2015/16. Levels of poverty among single people without children have also been very steady – 24% were in poverty in 1994/95, rising to 28% in 2009/10 and falling back to 25% by 2015/16.
There are two main factors driving the striking falls in poverty among families with children.
First, the choices of successive governments to increase support for these families through the benefit and tax credit system. Benefits for out-of-work families have not only kept up with prices, between 2000 and 2013 they rose compared with average incomes. The introduction of tax credits meant that those in work but with low earnings were also supported. These decisions meant that these families saw their living standards move closer to the rest of the population and were protected from the worst effects of the 2008–09 recession.
The second factor is the UK’s great success in reducing worklessness and increasing employment, accompanied by rising skill levels and the impact of the minimum wage on increasing wages for the lowest paid. Rising employment was a key reason for the reduction in poverty among lone-parent families in particular.
Since 2013, these reductions in poverty among families with children have begun to unravel. Their poverty rates are rising, largely due to reductions in the support offered by benefits and tax credits. Reductions in tax and increases in the minimum wage are beneficial for some but mostly benefit families who are already out of poverty. For most families on low incomes, the gains are far outweighed by reductions in the more targeted support given by the benefit and tax credit system.
The financial pressures faced by families on low incomes have been exacerbated by increases in the cost of several essential goods and services. The proportion of low-income households spending more than a third of their income on housing has increased markedly. This is partly due to far greater numbers now living in the private rented sector, but it has also been affected by increases to the cost of social rented housing and reductions in the benefits intended to help low-income families pay for it. The cost of childcare has also increased very substantially. People on low incomes spend proportionally more of their income on food and fuel, sectors where prices have increased faster than overall inflation. Since 2003, people on low incomes have also experienced consistently higher inflation than those with higher incomes, despite having far less scope to reduce spending.
Poverty among children and working-age adults

JRF – UK Poverty 2017
15
Poverty among children and working-age adults
Poverty levels and trendsThe group with the highest poverty throughout the last two decades is lone parents. They still have the highest poverty rates, but this is the group where the greatest progress has been made. In 1994/95, 58% lived in poverty, rising to 62% in 1996/97. Their poverty rate then fell significantly, to a low of 41% in 2010/11. However, since then this has started to rise again – reaching 46% in 2015/16.
Couples without children have always had the lowest poverty rates and these have hardly changed in 20 years. In 1994/95, 11% lived in poverty. That rose to a high of 13% in 2011/12 before falling back to 12% in 2015/16.
Couples with children have the next lowest poverty rates, which have also remained steady: 22% in 1994/95, falling to 19% in 2004/05, and rising again to 22% in 2015/16.
Similarly, among single people without children 24% were in poverty in 1994/95, rising to a high of 28% in 2009/10 and falling back to 25% by 2015/16.
Working-age poverty rate by family type
Among families with children there are very different patterns of poverty depending on the number and age of children. 45% of children in families with three or more children lived in poverty in 1994/5, compared with 27% of children in families with one child and 26% with two children.
The rate of poverty for children in families with one or two children barely changed over 20 years. However, poverty among families with three or more children had fallen to 32% by 2012/13. Since 2012/13 their poverty rate has started to rise again however, reaching 39% by 2015/16 (even before the two-child limit on benefits and tax credits was introduced in April 2017).
Source: Households Below Average Income (JRF analysis)
Single with children Single without childrenCouple with children Couple without children
Wor
king
-age
adu
lts
70%
40%
60%
50%
30%
0%
20%
10%
1994/95
1995/96
1996/97
1997/98
1998/99
1999/00
2000/01
2001/02
2002/03
2003/04
2004/05
2005/06
2006/07
2007/08
2008/09
2009/10
2010/11
2011/12
2012/13
2013/14
2014/15
2015/16

JRF – UK Poverty 2017
16
Poverty among children and working-age adults
Children’s poverty rate by number of children in family
Similarly, poverty has always been greatest among those with young children, but fell between 1994/95 and 2010/11. As is the case for other groups that saw sharp falls in poverty, rates have started to increase sharply again since 2013/14.
Destitution
People living in poverty experience different levels of low income. The usual definition of poverty is when people have incomes of less than 60% of median income (for their household type). However, some fall far beyond this level. The most extreme form of poverty is destitution. This is not yet measured regularly in the UK. Research published in 20162 provided the first estimate of the number of people who were destitute in the UK. In consultation with experts and the public, destitution is defined as being when someone lacks two or more basic essentials in one month. This means that, over that month, people have: slept rough, had one or no meals a day for two or more days, been unable to heat or to light their home for five or more days, gone without weather-appropriate clothes or gone without basic toiletries.
The research showed that 1,252,000 people, including 312,000 children, were destitute at some point in 2015. The vast majority were born in the UK. Young, single people, particularly men, were more likely to be destitute, but there were also considerable numbers of families living in destitution. The research found that there was no single cause, but most people had been living in poverty for a considerable length of time before tipping into destitution. The most common factors driving this were:
• the extra costs of ill health and disability
• the high costs of housing and other essential bills
• unemployment
• a financial shock like a benefit sanction or delay.
Source: Households Below Average Income (JRF analysis)
Three or more children in family All childrenOne child in family Two children in family
Chi
ldre
n
60%
40%
50%
30%
0%
20%
10%
1994/95
1995/96
1996/97
1997/98
1998/99
1999/00
2000/01
2001/02
2002/03
2003/04
2004/05
2005/06
2006/07
2007/08
2008/09
2009/10
2010/11
2011/12
2012/13
2013/14
2014/15
2015/16

JRF – UK Poverty 2017
17
Poverty among children and working-age adults
Persistent poverty
The Office for National Statistics defines persistent poverty as being when someone is currently in poverty and has been in poverty for at least two of the three preceding years.3
In 2015, 7% of the UK population were in persistent poverty – around 4.6 million people.4 This is a slight reduction from 9% in 2008.
People who are in persistent poverty are more likely to lack essential goods and services than those who are in more short-lived poverty. 27% of those in persistent poverty, compared with 16% of all those in poverty, were ‘severely materially deprived’ – lacking four or more essential items.5
Some groups are more likely to be in persistent poverty than others.4 In particular, lone parents are much more likely to experience poverty than all other groups, followed by single people without children. The proportion of those in persistent poverty in different household types is:
• 20% of lone-parent households
• 15% of single adults without children
• 5% of couples with children
• 5% of households with two or more adults and no children.
Drivers of changes to poverty levelsFour main factors explain the changes to levels of poverty over the last 20 years: employment; pay; skills; and benefits and tax credits.
Employment and worklessness
People who live in workless households have much higher rates of poverty than those who live in households where at least one person is in work: in 2015/16, 60% of working-age adults in workless households were in poverty, compared with 16% of those in working households.
One of the UK’s successes over the last 20 years has been a large drop in the proportion of people living in workless households and a big rise in employment rates, particularly since 2011.

JRF – UK Poverty 2017
18
Poverty among children and working-age adults
Workless household and working-age employment rates 1997–2017
The three groups where poverty has fallen most are lone parents, families with three or more children and families with young children. Employment rates have risen significantly for both lone parents and people in families with young children, contributing to their falls in poverty (alongside rises in benefits and tax credits6). However, the employment rates for people in families with three, four or more children are little different from 20 years ago, and are below the rates in 2000, suggesting that the fall in poverty among this group was not driven by rising employment.
Working-age employment rate (%) by selected family characteristic; annual four-quarter averages 1996/7 to 2016/7
Note: Y axis does not start at 0. The workless household rate only includes households where at least one person is aged 16 to 64. The working-ageemployment rate is the percentage of 16- to 64-year-olds in employment.
Source: Labour Force Survey (JRF analysis)
Workless household rate (LH axis) Seasonally adjusted working-age employment rate (RH axis)
Hou
seho
lds
20%
18%
16%
12%
14%
76%
74%
72%
68%
70%
1997 Q1
1998 Q1
1999 Q1
2000 Q1
2001 Q1
2002 Q1
2003 Q1
2004 Q1
2005 Q1
2006 Q1
2007 Q1
2008 Q1
2009 Q1
2010 Q1
2011 Q1
2012 Q1
2013 Q1
2014 Q1
2015 Q1
2016 Q1
2017 Q1
Percentage of 16- to 64-year-olds
Note: Y-axis does not start at 0. Employment rate is for working-age adults in families with these numbers of or age of children, not just parents,except lone-parent employment rate, which is from the ONS Working and Workless households statistical release (April to June quarter data only).Families with youngest dependent child aged 0–4, families with three dependent children and families with four or more dependent children maybe one-parent households or two-parent households.
Source: Labour Force Survey (JRF analysis) (data only available from 1997)
Total Families with youngestdependent childaged 0–4
Families with threedependent children
Lone parent withdependent children
Families with four ormore dependent children
Wor
king
-age
adu
lts
80%
65%
75%
70%
60%
50%
45%
40%
55%
1996/97
1997/98
1998/99
1999/00
2000/01
2001/02
2002/03
2003/04
2004/05
2005/06
2006/07
2007/08
2008/09
2009/10
2010/11
2011/12
2012/13
2013/14
2014/15
2015/16
2016/17

JRF – UK Poverty 2017
19
Poverty among children and working-age adults
Pay and skills
Low pay is one of the key drivers of poverty, although the relationship between low pay and poverty is not straightforward. Most workers in poverty are low-paid, however the majority of low-paid workers live in households where other earners mean that they do not have a low income overall. Two policies played a vital role in translating rising employment into falling poverty over the last two decades: rising wages for the low-paid and in-work tax credits (discussed below).
The minimum wage was introduced in April 1999 with the aim of eradicating extreme low pay. Since then it has been expanded to cover more and more people and jobs and, in April 2016, a higher minimum wage (called the National Living Wage) was introduced for workers aged 25 and over. Since its introduction, the minimum wage has resulted in earnings increasing fastest for those employees with lower-paid jobs, particularly in the most recent 10 years. During this period, the percentage hourly pay increase for full-time employees was greatest for the lowest paid while, in the earlier period, full-time pay growth had only been faster among the very highest paid. This pattern is evident for both full-time and part-time pay.
Percentage change in full-time hourly pay by decile
Skills and qualifications have a considerable influence on the risk of poverty, affecting both employment and pay. Those with no or low skills are far more likely to be in poverty than those with higher levels of skills.
Source: Annual Survey of Hours and Earnings
0%
Change in full-time hourly pay
10th percentile
20th percentile
30th percentile
40th percentile
Median
60th percentile
70th percentile
80th percentile
90th percentile
5% 10% 15% 20% 25% 30% 35% 40% 45% 50%
Inco
me
deci
le
1997 to 2006 2006 to 2016

JRF – UK Poverty 2017
20
Poverty among children and working-age adults
Poverty by highest qualification among working-age people
The proportion of working-age people with no qualifications decreased in the 20 years to 2016, from 20% to 8%, while the percentage with a highest qualification of degree or equivalent increased from 12% to 30%. There are now far fewer people in the population with no or very low qualifications. The percentages with highest qualifications of other higher education, A-level or equivalent, and GCSE A*–C or equivalent changed little between 1996 and 2016; an increase from 8% to 9%, unchanged at 23%, and a decrease from 22% to 21% respectively. These patterns vary across the UK.
In 2016 about 30% of the working-age people in England had a degree-level qualification compared with 29% in Scotland, 24% in Wales and 23% in Northern Ireland. All proportions had increased greatly since 1996, from 12%, 11%, 9% and 10%, respectively. The percentage of working-age people with no qualifications was much higher in Northern Ireland than elsewhere in 2016, almost 16%, compared with 9% in both Wales and Scotland, and 8% in England. Wales experienced the largest percentage point decrease since 1996.
Percentage of working-age population with degree-level qualifications in England, Wales, Scotland and Northern Ireland (annual four-quarter averages)
Wor
king
-age
adu
lts
45%
0%
20%
25%
40%
35%
30%
10%
15%
5%
No qualifications GCSE A*-C Higher education Others Degree levelOther* qualificationsbelow GCSE A*-C
A-level
*Other refers to other foreign/professional/vocational qualifications below degree level but not below GCSE level and others where the level is not known.
Source: Households Below Average Income (JRF analysis)
Source: Labour Force Survey (JRF analysis)
England ScotlandNorthern Ireland Wales
Wor
king
-age
adu
lts
35%
20%
30%
25%
15%
0%
10%
5%
19961997
19981999
20002001
20022003
20042005
20062007
20082009
20102011
20122013
20142015
2016

JRF – UK Poverty 2017
21
Poverty among children and working-age adults
Percentage of working-age population with no qualifications in England, Wales, Scotland and Northern Ireland (annual four-quarter averages)
Skills and qualifications affect poverty in two main ways; the likelihood of getting a job and how much someone is paid.
In 2016, around 86% of working-age people educated to degree level were in employment, compared with around 44% of those with no qualifications. Both percentages were the same as in 2008 (when qualifications data was first available for all aged 16 to 64) but the latter decreased by 4 percentage points during the years immediately after the 2008–09 recession while the former only decreased by 2 percentage points. The 2016 employment rate for people with the highest level of qualifications at GCSE grades A*–C or equivalent was 3 percentage points below the 2008 rate, and the rates for those educated to the level of non-degree higher education or A-levels had also not returned to their pre-2008–09 recession level.
Working-age employment rate by highest qualification (four-quarter averages)
Those people without qualifications are at a greater disadvantage in the labour market than used to be the case. In comparison, the proportion of people with the highest level of qualifications has increased greatly, but the benefit of having a high-level qualification in relation to getting a job has remained.
Source: Labour Force Survey (JRF analysis)
Northern Ireland ScotlandEngland Wales
Wor
king
-age
adu
lts
35%
20%
30%
25%
15%
0%
10%
5%
19961997
19981999
20002001
20022003
20042005
20062007
20082009
20102011
20122013
20142015
2016
Source: Labour Force Survey
Wor
king
-age
adu
lts
90%
60%
80%
70%
50%
30%
40%
19961997
19981999
20002001
20022003
20042005
20062007
20082009
20102011
20122013
20142015
2016
Aged 16 to 59(F)/64(M)up to and including 2007
Aged 16 to 64from 2008 onwards
Degree or equivalent Higher educationGCE, A-level or equivalent
GCSE grades A*-C or equivalent
Other qualifications
No qualifications

JRF – UK Poverty 2017
22
Poverty among children and working-age adults
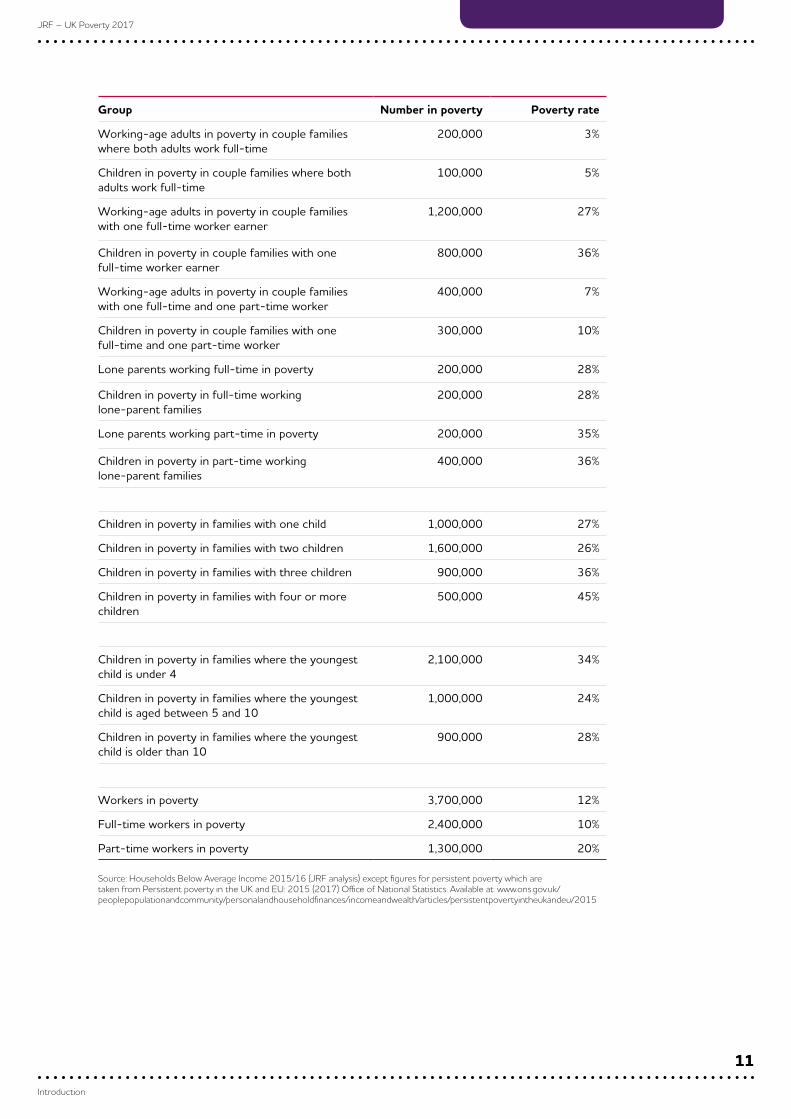
Qualifications also play a major part in affecting pay levels, although they are also affected by whether an employee is in part-time or full-time work. For full-time workers, pay increases at each level of qualification. In contrast, part-time workers with the equivalent of GCSEs or A-levels are paid almost the same as those with no qualifications at all; it is not until they have higher education qualifications that their pay seems to rise significantly.
The minimum wage has led to increases in wages for the lowest paid. The median full-time hourly pay of people with no qualifications has therefore risen faster in percentage terms than the equivalent for people with degrees, higher education or A-levels. However, because the pay of those without qualifications started from such a low level, the gap with the highest paid has still increased over time.
In 2016, people educated to degree level received median full-time hourly pay that was about £8.30 more than for those employees with no qualifications, an increase from £6.20 in 1996. The equivalent pay gaps in 2016 with those educated to higher education non-degree level and to A-level and equivalent were £4.60 and £2.20, up from £3.70 and £1.70 in 1996.
Median full-time hourly pay for 16- to 64-year-olds by highest qualification
Benefits and tax credits
The final driver of falls in poverty among some groups of working-age people with children is changes to in-work and out-of-work benefits and tax credits.
The real value of out-of-work benefits for families with children rose sharply between 1998/99 and 2003/04 and continued to rise more slowly until 2013/14 – meaning that the value of these benefits increased by more than inflation. This contributed to the fall in child poverty over that period. Since then, their real value has decreased slightly. From 2013 most working-age benefits and tax credits were restricted to rises of 1% a year, before being frozen in 2016. After a period of zero or very low inflation, it has recently started to rise, reaching 2.9% in 2017 and expected to rise above 3% in the autumn and remain above 2% for an extended period.7 This means that the real value of benefits is falling compared with prices.
Source: Labour Force Survey (JRF analysis)
Full-
time
hour
ly p
ay
£18
£12
£16
£14
£10
£0
£4
£2
£6
£8
1996/97
1997/98
1998/99
1999/00
2000/01
2001/02
2002/03
2003/04
2004/05
2005/06
2006/07
2007/08
2008/09
2009/10
2010/11
2011/12
2012/13
2013/14
2014/15
2015/16
2016/17
Degree or equivalent Higher educationGCE, A-level or equivalent
GCSE grades A*-C or equivalent
Other qualifications
No qualifications

JRF – UK Poverty 2017
23
Poverty among children and working-age adults
Out-of-work benefits for families with two children or families without children: real-terms value over time (£/pw)
The value of out-of-work benefits for families with children has not always kept up with changes in average incomes. Between 1994/95 and 1998/99 benefits fell in relation to average incomes. They then rose until 2012/13 before falling back. The rising value of out-of-work benefits for these families contributed to poverty reductions and helped to protect them from the effects of the 2008–09 recession. However, falls in recent years are contributing to rising poverty.
For working-age adults without children, the value of out-of-work benefits has generally kept up with changes in prices, but has steadily declined compared with average incomes, meaning that those dependent on them have faced an increased risk of poverty over time.
Out-of-work benefits for families with two children or without children: value over time as a percentage of median income (AHC)
Source: Institute for Fiscal Studies and Office of National Statistics
IS/JSA + IS Premiums (couple families)
JSA + CTC + Child Benefit (couple families)
IS/JSA + IS Premiums (lone parent)
JSA + CTC + Child Benefit (lone parent)
Unemployment/JSA (couple no children)
Unemployment/JSA (single no children)
Apr
il 20
16 p
rices
£300
£150
£250
£200
£100
£0
£50
1994/95
1995/96
1996/97
1997/98
1998/99
1999/00
2000/01
2001/02
2002/03
2003/04
2004/05
2005/06
2006/07
2007/08
2008/09
2009/10
2010/11
2011/12
2012/13
2013/14
2014/15
2016/17
2015/16
Source: House of Commons Library, Institute for Fiscal Studies and Office of National Statistics
IS/JSA + IS Premiums (lone parents)
JSA + CTC + Child Benefit (lone parents)
IS/JSA + IS Premiums (couple families)
JSA + CTC + Child Benefit (couple families)
Unemployment/JSA (single no children)
Unemployment/JSA (couple no children)
Med
ian
inco
me
70%
40%
60%
50%
30%
0%
20%
10%
1994/95
1995/96
1996/97
1997/98
1998/99
1999/00
2000/01
2001/02
2002/03
2003/04
2004/05
2005/06
2006/07
2007/08
2008/09
2009/10
2010/11
2011/12
2012/13
2013/14
2014/15
2015/16

JRF – UK Poverty 2017
24
Poverty among children and working-age adults
From 2003/04 to 2007/08, the real value of tax credits for working families with two children (taking inflation into account) remained stable or increased slightly. Between 2008/09 and 2009/10 their real value increased. This was due to both increases in the value of the Working Tax Credit and the child element of the Child Tax Credit, and in the annual income threshold at which the Working Tax Credit began to be reduced. From 2010/11 to 2015/16, the real value of tax credits fell for most family types, except for lone-parent families working part-time with two children where it stayed the same. In 2016/17 this trend accelerated, with steeper falls of 5% to 11% in the real value of tax credits for couple families with two children. One factor contributing to this latest decline was the increase in the national adult minimum wage of 9% in April 2016, meaning that those families affected had more of their tax credits withdrawn as their earnings rose.
For working-age adults without children, the value of tax credits fell in real terms during 2003/04 to 2007/08 as they could only claim Working Tax Credit, which was not protected against inflation in the same way as Child Tax Credit. During 2008/09 to 2009/10 the real-term value of tax credits recovered somewhat, although the real-term decline for working-age adults with children resumed from 2010/11. This meant that by 2015/16 some in-work couple families were no longer able to claim tax credits, while single adults working full-time have seen the value of their tax credits fall by 26% in real terms. In 2016/17 there was a fall in in-work support for single adults working full-time due to a steep increase in the national minimum wage.
In-work benefits for families with two children or no children: real-terms value over time (£/year)
Over 2003/04 to 2015/16 the value of tax credits remained static compared with average incomes for working families with two children. The exception to this was for a lone parent working part-time with two children where there was an increase in the value of their tax credits compared with average incomes.
The value of tax credits for working-age adults without children fell sharply compared with average incomes between 2003/04 and 2015/16. For single adults without children working full-time the value of their tax credits fell from 12% to 4% of average incomes, while for couples without children (one full-time, one part-time) the value of their tax credits fell from 7% of average incomes to zero in 2015/16.
Note: Working Tax Credit and Child Tax Credit; excludes Childcare Tax Credit, Housing Benefit, Council Tax Benefit and the extra support paid in thefirst year of a child’s life within Child Tax Credit. Assumes workers are earning the minimum wage of the oldest age group for that year. During theperiods April 2003 to September 2010, October 2010 to March 2016 and April 2016 onwards the oldest age groups are 22 years+, 21 years+ and25 years+, respectively.
Source: Institute for Fiscal Studies, Office of National Statistics
Lone parent, part-time with two children
Lone parent, full-time or couple, one full-time, one no job with two children
Couple, one full-time, one part-time with two children
Single adult, full-time without children
Couple, one full-time, one part-time without children
Med
ian
inco
me
£12,000
£6,000
£10,000
£8,000
£4,000
£0
£2,000
2003/04
2004/05
2005/06
2006/07
2007/08
2008/09
2009/10
2010/11
2011/12
2012/13
2013/14
2014/15
2016/17
2015/16
National Living Wage isintroduced in April 2017

JRF – UK Poverty 2017
25
Poverty among children and working-age adults
In-work benefits for families with two children or without children: value over time as a percentage of median income (AHC)
The net effect of wage increases, tax cuts and reduction in working-age tax credits varies across different types of families. This is illustrated by research analysing the impact of policy changes on incomes in 2022 compared with 2010.8 For example, focusing on families with two children where adults are earning the national minimum wage:
• families where two parents work full-time benefit more from better pay and tax cuts than they lose from benefit cuts; their net income increases by £8 a week
• families where one parent works part-time and the other full-time lose £2 a week
• single earner couples lose £11 a week
• lone parents working full-time lose £16 a week
• lone parents working part-time lose £26 a week.
Disability and ethnicityPoverty is not distributed randomly across the population. Some groups have far higher poverty rates than others. Two important factors shaping these patterns are disability and ethnicity.
Disability
Families that include disabled people have always had much higher poverty rates than those who do not.9 In 1995/96, 32% of working-age adults living in a family with a disabled member lived in poverty, compared with only 17% of those who did not. This poverty gap has increased slightly over the last 20 years. By 2015/16, 34% of working-age adults in families with disabled members lived in poverty, compared with 17% of those who did not.
Note: Working Tax Credit and Child Tax Credit; excludes Childcare Tax Credit, Housing Benefit, Council Tax Benefit and the extra support paid in thefirst year of a child’s life within Child Tax Credit. Assumes workers are earning the minimum wage of the oldest age group for that year. During theperiods April 2003 to September 2010, October 2010 to March 2016 and April 2016 onwards, the oldest age groups are 22 years+, 21 years+ and25 years+, respectively. This chart does not extend to 2016/17 as latest income data available is for 2015/16.
Source: Households Below Average Income, Institute for Fiscal Studies, House of Commons Library and www.gov.uk/national-minimum-wage-rates(JRF analysis)
Lone parent, part-time with two children
Lone parent, full-time with two children
Couple, one full-time, one no job with two children
Couple, one full-time, one part-time with two children
Single adult, full-time without children
Couple, one full-time, one part-time without children
Med
ian
inco
me
60%
40%
50%
30%
0%
20%
10%
2003/04
2004/05
2005/06
2006/07
2007/08
2008/09
2009/10
2010/11
2011/12
2012/13
2013/14
2014/15
2015/16

JRF – UK Poverty 2017
26
Poverty among children and working-age adults
Poverty rates for working-age adults by disability in family (removing DLA, AA, PIP from income)
There has been a slight increase in employment among disabled people, but the gap in the employment rate for disabled and non-disabled people is still very large, at more than 30 percentage points.
Working-age employment rates for disabled and non-disabled people
Ethnicity
Poverty also varies across different ethnic groups. In the past 20 years, working-age people in the White ethnic group have always had the lowest risk of poverty, with those from the Indian group having the second lowest. Those in the Bangladeshi and Pakistani groups have continuously had the highest and second highest poverty rates respectively, with the people in the Black, and Chinese and Other ethnic groups having similar rates.10
Source: Households Below Average Income (JRF analysis)
Working-age adults indisabled families
Working-age adults innon-disabled families
Gap between disabled andnon-disabled families’ poverty rates
40%
25%
35%
30%
20%
0%
5%
10%
15%
1995/96
1996/97
1997/98
1998/99
1999/00
2000/01
2001/02
2002/03
2003/04
2004/05
2005/06
2006/07
2007/08
2008/09
2009/10
2010/11
2011/12
2012/13
2013/14
2014/15
2015/16
Note: The red lines indicate changes of definition: in the first two periods, the data represents people with disabilities that limit day-to-day activities,with the first period including women aged 16 to 59 years only. There were other definitional changes in 2010. In the third period, the datarepresents people who are disabled according to the Government Statistical Service harmonised standard definition.
Source: Households Below Average Income (JRF analysis)
Non-disabled Disabled
Wor
king
-age
adu
lts
90%
70%
80%
60%
0%
50%
30%
40%
20%
10%
1998 Q2
1999 Q2
2000 Q2
2001 Q2
2002 Q2
2003 Q2
2004 Q2
2005 Q2
2006 Q2
2007 Q2
2010 Q2
2013 Q2
2014 Q2
2015 Q2
2016 Q2
2008 Q2
2009 Q2
2011 Q2
2012 Q2

JRF – UK Poverty 2017
27
Poverty among children and working-age adults
The proportions of working-age adults from Bangladeshi and Pakistani households who were in poverty by 2013/16 were, respectively, 28 and 16 percentage points lower than in 1994/97. The equivalent decreases for the Indian, Chinese and Other, and Black ethnic groups were 8, 7 and 3 percentage points, respectively, while for the White ethnic group there was little change over time. (The ethnicity of the household is defined accordingly to the recorded ethnicity of the head of the household, or the person who responded to the survey on behalf of the head of the household).
Working-age adults in poverty (AHC) by ethnicity of household (three-year averages)
Poverty among children is much higher among the Bangladeshi, Pakistani, Black and Chinese ethnic groups than it is among the Indian or White ethnic groups. Poverty rates among children are very similar to working-age adults for most ethnic groups.
Children in poverty (AHC) by ethnicity of household (three-year averages)
Source: Labour Force Survey
Asian or Asian British – Bangladeshi
Asian or Asian British – Pakistani
Chinese and Other ethnic group
Black/African/Caribbean/Black British
Asian or Asian British – Indian
White
Wor
king
-age
adu
lts
90%
70%
80%
60%
0%
50%
30%
40%
20%
10%
1994/95 to
96/97
1995/96 to
97/98
1996/97 to
98/99
1997/98 to
99/00
1998/99 to
00/01
1999/00 to
01/02
2000/01 to
02/03
2001/02 to
03/04
2002/03 to
04/05
2003/04 to
05/06
2006/07 to
08/09
2009/10 to
11/12
2010/11 to
12/13
2011/12 to
13/14
2012/13 to
14/15
2013/14 to
15/16
2004/05 to
06/07
2005/06 to
07/08
2007/08 to
09/10
2008/09 to
10/11
Source: Households Below Average Income (JRF analysis)
Asian or Asian British – Bangladeshi
Asian or Asian British – Pakistani
Chinese and Other ethnic group
Black/African/Caribbean/Black British
Asian or Asian British – Indian
White
Chi
ldre
n
100%
70%
90%
60%
0%
80%
50%
30%
40%
20%
10%
1994/95 to
96/97
1995/96 to
97/98
1996/97 to
98/99
1997/98 to
99/00
1998/99 to
00/01
1999/00 to
01/02
2000/01 to
02/03
2001/02 to
03/04
2002/03 to
04/05
2003/04 to
05/06
2006/07 to
08/09
2009/10 to
11/12
2010/11 to
12/13
2011/12 to
13/14
2012/13 to
14/15
2013/14 to
15/16
2004/05 to
06/07
2005/06 to
07/08
2007/08 to
09/10
2008/09 to
10/11

JRF – UK Poverty 2017
28
Poverty among children and working-age adults
Employment rates have increased since 2001/02 among men and women of all ethnic groups except among men in the ‘mixed’ ethnic group. The biggest percentage point rises are for those groups that started with the lowest rates of employment – particularly women in the Bangladeshi and Pakistani groups. This pattern is similar to the decrease in poverty rates, suggesting that work has enabled many families from these ethnic groups to increase their household income above 60% of the median. Research suggests that immigrants from these ethnic groups who arrived after 2008 (when skill-based immigration laws were introduced) were more likely to have higher educational qualifications than older migrants.11
Male 16- to 64-year-old employment rate by ethnic group 2001/02 and 2016/17 (four-quarter averages)
Female 16- to 64-year-old employment rate by ethnic group 2001/02 and 2016/17 (four-quarter averages)
Source: Labour Force Survey
0%
Working-age males
Total(including ethnicity not stated)
White
Mixed
Indian
Pakistani
Bangladeshi
Chinese
Black/African/Caribbean
Other
10% 20% 30% 40% 50% 60% 70% 80% 90%
2001/02 2016/17
Source: Labour Force Survey
0%
Working-age females
Total(including ethnicity not stated)
White
Mixed
Indian
Pakistani
Bangladeshi
Chinese
Black/African/Caribbean
Other
10% 20% 30% 40% 50% 60% 70% 80%
2001/02 2016/17

JRF – UK Poverty 2017
29
Poverty among children and working-age adults
Poverty across the UKRates of poverty have always varied considerably in different parts of the UK.
In England, London and the North East had the highest rates of poverty in 1994/97, and the South East and East the lowest. By 2003/06, all parts of England had seen a fall in poverty, except the East Midlands where it had remained the same. The largest falls were in the North East and South West. By 2013/16, poverty had risen again across all regions. There was a particularly sharp rise in poverty in the West Midlands.
Percentage of working-age adults in households that are in poverty (AHC): by region or country
Across the four countries of the UK, Wales has consistently had the highest poverty, only slightly lower than London and similar to the North East. Scotland has generally had the lowest poverty but has seen a rather different pattern to the rest of the UK – poverty rose slightly between 1994/97 and then remained constant to 2013/16. Its current poverty rate is the same as the South West of England. Data is only available for Northern Ireland since 2003/4, when Northern Ireland had a slightly lower rate of poverty than Wales, Scotland and many of the English regions. By 2013/16, poverty in Northern Ireland was higher than in Scotland but lower than most of the English regions except the East, South East and South West.
The challenge aheadPoverty started to rise for some groups in 2011/12, and has been rising more steeply since 2013/14. This rise is taking place in particular among those groups for whom poverty fell most over the last 20 years – lone parents, families with three or more children and families with young children. The rise in poverty is striking among lone parents in work, particularly in full-time work, and among couples where parents work but where there is not at least one full-time and one part-time worker. Projections suggest that these poverty rates are likely to continue to rise sharply over the next few years.12
There are three main drivers that explain these trends in poverty: the labour market; state support (safety-net benefits and in-work support); and the cost of living.
Wor
king
-age
adu
lts
30%
25%
0%
20%
15%
5%
10%
NorthEast
NorthWest
Yorkshireand theHumber
EastMidlands
WestMidlands
East ofEngland
London SouthEast
SouthWest
Wales Scotland NorthernIreland
Source: Family Resources Survey
1994/95 to 1996/97 2003/04 to 2005/06 2013/14 to 2015/16

JRF – UK Poverty 2017
30
Poverty among children and working-age adults
The role of work
Rising employment, skills and pay contributed greatly to reductions in poverty over the last 20 years. However, they have also led to a shift in the composition of poverty away from being primarily concentrated in workless households and towards greater in-work poverty. Poverty in the UK today is fairly evenly split between workless households and those in work.
Composition of poverty by in- and out-of-work status
The question facing the UK is how to shape a labour market that will deliver even greater reductions in poverty, particularly given that the UK already has historically high employment and a rising minimum wage.
Closing the ‘jobs gap’
Recent research13 identifies a ‘jobs gap’ that affects four groups of people who cannot get work, or as much work as they would like:
• unemployed people who are not in work but are available and actively seeking it
• economically inactive people who would like a job, including those who are seeking work but not available, and those not currently seeking work
• involuntary part-time workers, who started to work part-time because no suitable full-time work was available
• underemployed workers, who are working and want more hours but are unable to get them, including those who want more hours in their current job, those who want a different job with longer hours, and those who want an additional job. This category includes some involuntary part-time workers who are classified as such in the following analysis.
In 2016/17, around 17% of working-age people were affected by the jobs gap, about 7.6 million people in total. The percentage has decreased in recent years but was still higher than in the years before the 2008–09 recession, with the proportion of people classified as involuntarily part-time or underemployed about two percentage points higher than 10 years earlier, while the proportion that were either unemployed or inactive but wanted a job was slightly lower (0.6 percentage points).
Source: Households Below Average Income (JRF analysis)
Out-of-work poverty
Mill
ions
of p
eopl
e
16m
10m
14m
12m
6m
0m
2m
4m
8m
1996/97
1997/98
1998/99
1999/00
2000/01
2001/02
2002/03
2003/04
2004/05
2005/06
2006/07
2007/08
2008/09
2009/10
2010/11
2011/12
2012/13
2013/14
2014/15
2015/16
In-work poverty

JRF – UK Poverty 2017
31
Poverty among children and working-age adults
Proportion of working-age people affected by the jobs gap (four-quarter averages)
Younger people are at greater risk of being affected by the jobs gap, with this being true for more than a quarter of people aged 16 to 24 in 2016/17 and more than a third of this age group in the years immediately following the 2008–09 recession. For other age groups, the percentage of people affected was similar, ranging from just over 12% of those aged 55 to 64 to almost 17% of people aged 25 to 34, with the proportion decreasing as age increased.
In each age group, the pattern of change over the past 10 years was similar to that for the working-age population as a whole, with the 2016/17 percentages of people being affected being lower than in the years immediately following the 2008–09 recession but higher than in 2006/07. The percentage point increase over 10 years was highest among the oldest two age groups (about 2 percentage points) while in all age groups the change was almost entirely driven by increases in the percentages of people who were involuntarily part-time or underemployed.
Proportion of people affected by the jobs gap by age (four-quarter averages)
Wor
king
-age
adu
lts
25%
20%
10%
5%
0%
15%
1999/00
2000/01
2001/02
2002/03
2003/04
2004/05
2005/06
2006/07
2007/08
2008/09
2009/10
2010/11
2011/12
2012/13
2013/14
2014/15
2016/17
2015/16
Source: Labour Force Survey (JRF Analysis)
Underemployed (excluding involuntary part-time) Involuntary part-time Inactive – wants a job Unemployed
Source: Labour Force Survey (JRF analysis)
Aged 16 to 24
Aged 16 to 64
Aged 25 to 34
Aged 35 to 44
Aged 45 to 54
Aged 55 to 64
Wor
king
-age
adu
lts
40%
25%
35%
30%
20%
10%
5%
0%
15%
1999/00
2000/01
2001/02
2002/03
2003/04
2004/05
2005/06
2006/07
2007/08
2008/09
2009/10
2010/11
2011/12
2012/13
2013/14
2014/15
2016/17
2015/16

JRF – UK Poverty 2017
32
Poverty among children and working-age adults
How much work is enough?
The first factor is the number of workers in a household and whether they work full-time or part-time. Work gives strong protection against poverty as long as it is full-time or, for couples, one full-time and one part-time worker. Part-time work does not protect against poverty very effectively, nor does having a single full-time earner in a couple. Poverty rates have risen for single-earner couples and couples with only a part-time worker.
For working-age adults without children, couples with both adults in full-time work have poverty rates close to zero. Single people in full-time work are more likely to live in poverty but rates are still very low – 6% were in poverty in 1996/97, rising gradually to 9% by 2015/16. Couples with one full-time and one part-time worker also have very low poverty rates – 2% in 1996/97 rising to 5% by 2015/16. However, couples without children who have one full-time earner (and one not working) have a much higher rate, and this rose significantly from 12% to 18%. Couples without children who have one part-time earner (one not working) also have a higher rate and rose from 20% to 26%. The highest poverty rates among working households without children are for those with only part-time workers – over a quarter are in poverty.
For working-age couples with children, having both adults in work with at least one in full-time work ensures a very low risk of poverty. Part-time working alone leads to very high poverty rates, and having only one earner also gives fairly weak protection. Many more lone parents now work, but recent changes to benefits and tax credits have meant that this is providing less and less protection from poverty.
Couples with both adults in full-time work had a poverty rate of 3% in 1996/97, rising slowly to 5% in 2015/16. Poverty rates are also very low among couples with one person in full-time and one in part-time work, though they have risen from 6% in 1996/97 to 9% in 2015/16. Single-earner couples with children started with a fairly high poverty rate – 26% – and this rose by just under a third to reach 35% by 2015/16. Couples with children who only have part-time workers in the family have extremely high levels of poverty – nearly two-thirds.
Lone parents in full-time work began with a fairly low poverty rate of 11%. Over 20 years, as more and more of them entered employment, this has increased gradually, reaching 17% by 2014/15. In the last year, however, there has been a very sharp increase; 28% of lone parents in full-time work now live in poverty. This is likely to be mainly driven by changes to benefits and tax credits. Many lone parents work part-time, to enable them to manage caring for children and in some cases because of health conditions. Poverty rates for lone parents working part-time started very high in 1996/97 – 42% were in poverty. However, this rate fell by almost half as tax credits were introduced to increase their incomes to 23% in 2010/11. However, their poverty rate has also climbed steeply in recent years, reaching 35% by 2015/16.

JRF – UK Poverty 2017
33
Poverty among children and working-age adults
Working-age adults without children in poverty by family type and work status
Working-age adults with children in poverty by family type and work status
It is therefore important to understand the reasons why people are not working, or are not working full-time.
Reasons for not working or limiting work hours
Health and caring for young children or disabled adults play a strong role in shaping how much work the adults in a family do, but the balance of these varies across different family types.
For single-earner couples where the person in work is full-time, the vast majority of the non-working adults say that this is due to childcare responsibilities, with much smaller proportions citing either being disabled or caring for someone who is disabled. However, among those families where the person in work is part-time, disability plays a greater role in restricting the other adult’s capacity to work.
Source: Households Below Average Income (JRF analysis)
Single, part-time
Couple, one part-time, no full-time
Couple, one full-time, one no job
Single, full-time
Couple, one full-time, one part-time
Couple, both full-time
Wor
king
-age
adu
lts w
ithou
t chi
ldre
n
35%
25%
30%
20%
0%
5%
10%
15%
1996/97
1997/98
1998/99
1999/00
2000/01
2001/02
2002/03
2003/04
2004/05
2005/06
2006/07
2007/08
2008/09
2009/10
2010/11
2011/12
2012/13
2013/14
2014/15
2015/16
Source: Households Below Average Income (JRF analysis)
Couple, one part-time, no full-time
Lone parent, part-time
Couple, one full-time, one no job
Lone parent, full-time
Couple, one full-time, one part-time
Couple, both full-time
Wor
king
-age
adu
lts w
ith c
hild
ren
70%
50%
60%
40%
0%
10%
20%
30%
1996/97
1997/98
1998/99
1999/00
2000/01
2001/02
2002/03
2003/04
2004/05
2005/06
2006/07
2007/08
2008/09
2009/10
2010/11
2011/12
2012/13
2013/14
2014/15
2015/16

JRF – UK Poverty 2017
34
Poverty among children and working-age adults
Most lone parents who work part-time do not give any specific reason for not working full-time, but sizeable minorities cite either childcare or being disabled as restricting their work hours.
Families where one adult works full-time and one part-time cite childcare as the biggest reason for the part-time earner not increasing their hours, but being disabled or caring for someone who is disabled also affect smaller groups.
Single-earner couples: one full-time, one non-working – non-worker’s reason for being prevented from working
Single-earner couples: one part-time, one non-working – non-worker’s reason for being prevented from working
Source: Households Below Average Income (JRF analysis)
Only childcare 573,000 (85%)
Disabled, childcare 3,000 (0.5%)
Caring, childcare 24,000 (4%)
Disabled, caring 2,000 (0.2%)
Only disabled 39,000 (6%)
Only caring 32,000 (5%)
Source: Households Below Average Income (JRF analysis)
Only childcare 79,000 (71%)
Disabled, childcare 4,000 (4%)
Caring, childcare 6,000 (6%)
Only disabled 19,000 (17%)
Only caring 3,000 (2%)

JRF – UK Poverty 2017
35
Poverty among children and working-age adults
Single part-time earner families: presence of disability and/or caring responsibilities
One full-time, one part-time earner families: presence of disability and/or caring responsibilities
Pay and skills
Despite improvements in pay for those on the lowest wages, low pay remains endemic in the UK’s economy. Once in a low-paid job it is difficult for many workers to move to a better paid one: three out of four low-paid workers are still low-paid after 10 years.14
3.7 million workers are in poverty; 2.4 million full-time employees and self-employed workers and 1.3 million part-time employees and self-employed workers. The overall number has risen from 2.3 million in 1996/97.
Source: Households Below Average Income (JRF analysis)
None 1,091,000 (53%)Only children 414,000 (20%)
Only caring 89,000 (4%)
Caring, children 55,000 (3%)Disabled, caring 41,000 (2%)
Disabled, caring, children 20,000 (1%)
Only disabled 257,000 (12%)
Disabled, children 94,000 (5%)
Source: Households Below Average Income (JRF analysis)
None 636,000 (26%)
Only children 1,191,000 (49%) Only caring 89,000 (4%)
Caring, children 120,000 (5%)
Disabled, caring 39,000 (2%)
Disabled, caring, children 24,000 (1%)
Only disabled 172,000 (7%)
Disabled, children 152,000 (6%)

JRF – UK Poverty 2017
36
Poverty among children and working-age adults
Number of workers in poverty by employment type
However, poverty and low pay do not always go together – the vast majority of low-paid workers live in households where the income of the people they live with (such as a partner or parents) means that they are not in poverty.
The current National Living Wage is £7.50 an hour for those aged over 25. The government intends to raise the National Living Wage to two-thirds of average pay by 2020. Currently, two-thirds of average pay is £7.87. The pre-November 2017 Living Wage was £8.45 outside London and £9.75 inside London. These earlier Living Wage amounts were used in this analysis as they were the Living Wages during the period of the income data available.
• Only 27% of people earning less than £7.87 are in poverty: 2.4 million compared with 6.4 million low-paid workers not in poverty.
• Only 25% of people earning less than £8.45 (across the country) are in poverty: 2.5 million compared with 7.7 million not in poverty.
• Only 22% of those earning below £9.75 are in poverty: 2.8 million compared with 10.2 million not in poverty.
However, low pay is a very significant driver of poverty.
• 68% of households in in-work poverty include at least one person who is paid less than £7.87.
• 73% of households in in-work poverty include at least one person who is paid less than £8.45.
• 80% of households in in-work poverty include at least one person who is paid less than £9.75.
If the National Living Wage was raised across the whole country to the level of the London Voluntary Living Wage, more than eight in 10 households in working poverty could benefit (if the pay rise was not clawed back through reductions in tax credits). However, more than three-quarters of those who would benefit already have incomes that protect them from poverty.
As discussed earlier, the UK has seen rising numbers of working-age people with qualifications. This has contributed to increasing employment rates and supported earnings growth. However, there is still a significant minority of people with no or very low qualifications who are increasingly disadvantaged in getting work. In addition, the
Mill
ions
of w
orke
rs
4.0m
3.5m
2.5m
1.0m
0.0m
2.0m
1.5m
0.5m
3.0m
1996/97
1997/98
1998/99
1999/00
2000/01
2001/02
2002/03
2003/04
2004/05
2005/06
2006/07
2007/08
2008/09
2009/10
2010/11
2011/12
2012/13
2013/14
2014/15
2015/16
Source: Family Resources Survey and Households Below Average Income (JRF analysis)
Part-time self-employed Full-time self-employed Part-time employee Full-time employee
JRF – UK Poverty 2017
37
Poverty among children and working-age adults
difference in pay between those who are highly qualified and those who are not is increasing despite a rising minimum wage. It is also noticeable that people with mid-level qualifications (GCSEs or A-levels) are seeing their pay fall further behind those with higher qualifications (see the figures above: Working-age employment rate, by highest qualification (four-quarter averages) and Median full-time hourly pay for 16- to 64-year-olds by highest qualification).
Even low-paid work tends to take couples out of poverty if both adults work full-time, or there is at least one full-time and one part-time worker, or if single people work full-time and do not have children. However, many lone parents struggle to move out of poverty even in full-time work unless it is well paid, as do couples where no one has a full-time job or where only one person works.
Pay, skills and hours of work are linked. Workers with lower levels of qualifications are more likely to be part-time workers: in 2016, 32% of workers with no qualifications worked part-time and this was true for a similar proportion educated to GCSE level. However, fewer than 20% of workers with a degree worked part-time. Part-time workers are more likely to be low-paid at each skill level. It is also striking that part-time workers with the equivalent of GCSE or A-level qualifications are paid very little more than those with no qualifications.
Median hourly pay (£) by highest qualification 2016/17 (four-quarter averages)
A fraying safety net
The benefit and tax credit system has always had a dual role of supporting people who are out of work, and topping up the incomes of those in work who do not earn enough to meet their family’s needs. This follows from the acknowledgment that a wage that is sufficient to support a single adult may not be enough to support children or another adult, but employers cannot be expected to pay workers differently according to their home circumstances. The introduction of tax credits in 1999, and notable increases in 2001, 2004, 2008 and 2011, was a major factor in the reductions in child poverty in the early 2000s.6
The value of benefits and tax credits for families with children has begun to decrease compared with median income in recent years, joining a longer trend in the reducing value of benefits for those without children. The freeze on most working-age benefits (in- and out-of-work) took effect in April 2016. Inflation started to increase sharply in November 2016 and is expected to stay high. These trends are having especially strong impacts on groups for whom benefits and tax credits helped to decrease poverty sharply – lone parents, families with young children and families with three or more children.
Source: Labour Force Survey (JRF analysis)
0
Hourly pay (£)
Degree or equivalent
Higher education
GCE, A-level or equivalent
Other qualifications
GCSE grades A*-C or equivalent
No qualifications
2 4 6 8 10 12 14 16 18
Full-time Part-time

JRF – UK Poverty 2017
38
Poverty among children and working-age adults
Further reductions to family benefits and tax credits introduced in 2017 and planned for the next few years are likely to lead to significant rises in poverty among these families. Reductions in income tax, particularly through increasing the personal allowance, have benefited some working families on low incomes. However, many working parents already do not pay tax, and the gains for most other families in poverty are outweighed by cuts to in-work tax credits.15
Various other changes to the benefit and tax credit system have reduced the incomes of some groups, permanently or for periods of time. The most significant of these changes are sanctions, the benefit cap and the under-occupancy penalty (or ‘bedroom tax’).
Sanctions
More than 3.5 million people receive out-of-work benefits including Jobseeker’s Allowance (JSA), Employment and Support Allowance (ESA), Universal Credit (UC) and Income Support (IS). More than one million of these people have to show that they are complying with conditions of benefit receipt. The other 2.5 million are not subject to these conditions due to disability or caring responsibilities. Conditions can include attending the job centre, providing evidence of actively seeking work, accepting a job or attending training or external schemes such as the Work Programme. If claimants are found to have breached these conditions they can be sanctioned, meaning that their benefits are reduced or suspended for a period of between four weeks and three years.16
The number of people experiencing sanctions has varied greatly over time. The number experiencing them was fairly stable until 2009 when there was a very large increase, nearly trebling to reach a high point of nearly 80,000 in late 2013. This was not simply because more people claimed the benefit – the percentage of claimants being sanctioned rose from 2% in 2000 to over 3% in 2007, dropped back in 2009 and then rose to over 5% in 2014, before falling back to 3% in 2015. After this the numbers dropped sharply, returning to their 2005 levels. In 2016 there was another sharp increase with numbers reaching just under 30,000 people, over 3% of claimants. Sanctions for claimants of ESA have remained at an extremely low level.17
JSA + UC, and ESA sanctions on individuals as a percentage of total claimants in Great Britain (by quarter of sanction decision)
Sanctions have not been applied with equal frequency to different types of claimants. The sanction rate has always been higher for men than for women and younger people, and there have been periods when some ethnic minority groups have been far more likely to be sanctioned than the White group.
Source: Department of Work and Pensions and Office for National Statistics (JRF analysis)
JSA + UC ESA
Tota
l cla
iman
ts
6%
3%
5%
4%
2%
0%
1%
May 2000
May 2001
May 2002
May 2003
May 2004
May 2005
May 2006
May 2007
May 2008
May 2009
May 2010
May 2011
May 2012
May 2013
May 2014
May 2015
May 2016

JRF – UK Poverty 2017
39
Poverty among children and working-age adults
Percentage of people from different ethnic groups subject to JSA sanctions
Benefit cap
The benefit cap was introduced in April 2013. It applies to working-age households in receipt of out-of-work benefits and who do not work enough to receive Working Tax Credit or earn the equivalent of 16 hours a week on the minimum wage. The benefit cap is the total amount an out-of-work household can receive in benefits. If a household’s entitlement to benefits exceeds this amount their benefits are reduced to match it. When it was introduced, the cap was set at £26,000 a year for families and £18,000 for single people with no children. In November 2016 it was lowered to £20,000 for families outside London and £23,000 for families in London, and to £13,400 for single people outside London and £15,410 inside London.
The benefit cap affects relatively small numbers of households, but can have a big impact on their incomes. The vast majority of households affected by the cap include children; 72% are lone-parent families, while 21% are couples with children. Research shows that a very small minority of those affected got work or moved house to reduce the impact of the cap – the vast majority simply got poorer.18
Number of households subject to the benefit cap in Great Britain
Perc
enta
ge o
f cla
iman
ts
7%
6%
0%
5%
4%
2%
1%
3%
May 2005 February 2011 December 2016
Source: Department for Work and Pensions and Office for National Statistics (JRF analysis)
White Mixed Asian or Asian British Black or Black British Chinese or Other Ethnic Group
Source: Department for Work and Pensions
Num
ber
of h
ouse
hold
s
70,000
50,000
60,000
40,000
0
30,000
10,000
20,000
April 2
013
August
2013
Decem
ber 2
013
April 2
014
August
2014
Decem
ber 2
014
April 2
015
August
2015
Decem
ber 2
015
April 2
016
August
2016
Decem
ber 2
016
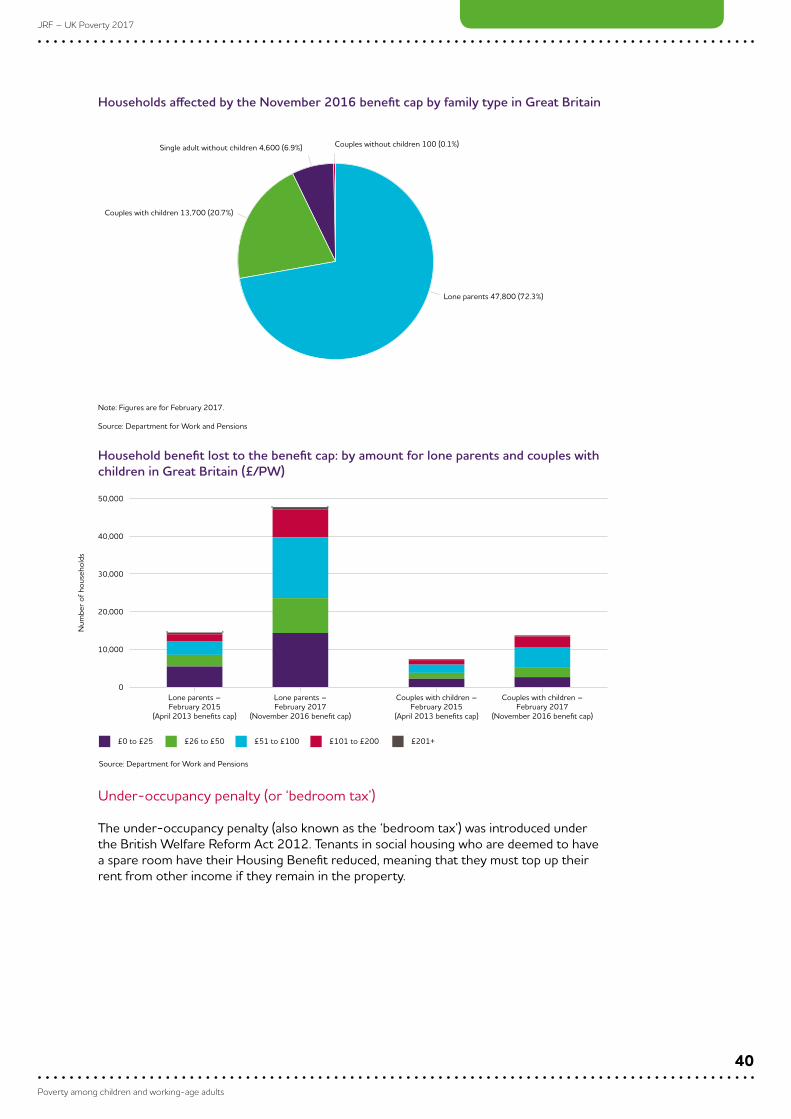
JRF – UK Poverty 2017
40
Poverty among children and working-age adults
Households affected by the November 2016 benefit cap by family type in Great Britain
Household benefit lost to the benefit cap: by amount for lone parents and couples with children in Great Britain (£/PW)
Under-occupancy penalty (or ‘bedroom tax’)
The under-occupancy penalty (also known as the ‘bedroom tax’) was introduced under the British Welfare Reform Act 2012. Tenants in social housing who are deemed to have a spare room have their Housing Benefit reduced, meaning that they must top up their rent from other income if they remain in the property.
Note: Figures are for February 2017.
Source: Department for Work and Pensions
Single adult without children 4,600 (6.9%)
Couples with children 13,700 (20.7%)
Lone parents 47,800 (72.3%)
Couples without children 100 (0.1%)
Num
ber
of h
ouse
hold
s
50,000
40,000
0
30,000
20,000
10,000
Lone parents –February 2015
(April 2013 benefits cap)
Lone parents –February 2017
(November 2016 benefit cap)
Couples with children –February 2015
(April 2013 benefits cap)
Couples with children –February 2017
(November 2016 benefit cap)
Source: Department for Work and Pensions
£0 to £25 £26 to £50 £51 to £100 £101 to £200 £201+

JRF – UK Poverty 2017
41
Poverty among children and working-age adults
Number of Housing Benefit claimants affected by the under-occupancy penalty bedroom tax in Great Britain
The number affected has declined steadily, although these are net figures and mask considerable turnover, with some households becoming eligible while others cease to be. One reason for the downward trend is people moving house in response to the policy, but this only accounts for part of the trend – in 2013/14 the numbers affected fell by 78,000 but there were only 20,000 transfers.19 The rest of the decline may be due to changes in eligibility for the penalty: people are unlikely to be allocated homes that would make them eligible for the penalty, and people reaching pension age cease to be affected by it.
There have been large variations in the patterns across different parts of the UK. The highest number of claimants affected have been in the North West and Scotland, followed by London and the West Midlands. The lowest number of claimants affected was in the South West. The largest falls have been in the North West and London. The smallest falls have been in Scotland. Scotland has low proportions of one-bedroom dwellings, and the Scottish Government has provided substantial funding to supplement discretionary housing payments to mitigate the impact of the policy.19
Rising costs
The third major challenge facing the UK is rises in the cost of living, which particularly affect people on low incomes. This is evident in looking at the cost of everyday essentials (particularly food and fuel), housing costs and childcare. In addition to these, those on low incomes are also affected by the poverty premium – having to pay more for some goods and services because of issues linked to having a low income.
Source: Department for Work and Pensions
Num
ber
of H
ousi
ng B
enefi
t cla
iman
ts
600,000
500,000
400,000
0
300,000
100,000
200,000
May 2013
May 2014
May 2015
Septe
mber 2
013
January
2014
Septe
mber 2
014
January
2015
Septe
mber 2
015
January
2016
January
2017
Septe
mber 2
016
May 2016

JRF – UK Poverty 2017
42
Poverty among children and working-age adults
Overall cost of living
Inflation affects everyone in the UK. But changing prices may have different effects on people on higher and lower incomes because of differences in the goods and services they buy.
People living in poverty spend a much higher proportion of their incomes on food and energy (as well as on housing, as discussed above).
Percentage of expenditure on food and non-alcoholic drink by income quintile
The cost of different types of goods and services have changed in different ways, particularly since 2003. In particular, the cost of electricity, gas and fuels has risen much faster than overall inflation.
Percentage of expenditure on electricity, fuel and gas by income quintile
Expe
nditu
re
25%
20%
0%
15%
10%
5%
2006 2007 2008 2011 2014 2015-162009 2010 2012 2013
Source: Living Costs and Food Survey (JRF analysis)
Bottom qunitile Second quintile Third quintile Fourth quintile Top quintile
Expe
nditu
re
14%
12%
0%
10%
8%
4%
6%
2%
2006 2007 2008 2011 2014 2015-162009 2010 2012 2013
Source: Living Costs and Food Survey (JRF analysis)
Bottom qunitile Second quintile Third quintile Fourth quintile Top quintile

JRF – UK Poverty 2017
43
Poverty among children and working-age adults
Price levels of various goods relative to 1996
Those in different income groups can therefore experience different rates of inflation. Since 2003, people in the poorest fifth of the population have experienced a higher rate of inflation than the rest of the country in every year except 2010. However, over the longer term, the evidence suggests that there is not a systematic tendency for lower-income households to experience higher inflation.20
Inflation by income quintile
People on low incomes may also find it more difficult to adapt to price rises, as they spend much more of their income on essentials and have much less flexibility to reduce consumption of other items.
Source: Office for National Statistics
Median income
Train fares
Clothing and footwear
Bus fares
Food and non-alcoholic beverages
Electricity, gas and other fuels
All goods
CPI inflation
Inde
x 19
96=1
00
300
200
250
150
0
100
50
19961997
19981999
20002001
20022003
20042005
20062007
20082009
20102011
20122013
20142015
2016
Num
ber
of w
orki
ng-a
ge a
dults
7%
6%
0%
5%
4%
2%
1%
3%
2003 2004 2005 2006 2007 2008 2009 2010 2011 2012 2013
Source: Variation in the experience of UK Households: 2003 to 2014 (JRF analysis)
Bottom quintile Second quintile Middle quintile Fourth quintile Top quintile

JRF – UK Poverty 2017
44
Poverty among children and working-age adults
Poverty premium
In addition to variations in how people on different incomes spend their money, there is also evidence that the cost of some goods and services is higher for those on low incomes than it is for the better off. This is called the poverty premium.
The evidence suggests that the poverty premium costs low-income households on average around £490 a year.21 This average cost can be broken down into the additional costs to access a range of goods and services including energy, credit and insurance. These different costs do not all affect the same households, or impose the same level of penalty. The table below sets out the different types of additional costs, the size of additional costs and the number of families affected by them.
Premiums experienced by low-income households (income is less than 70% of median income)
Premium type Examples of premiums (£ per year) Number of low-income households incurring this
type of premium (as a percentage of all
low-income households)
Use of prepayment meters (PPM)
PPM for electric (£35) or gas (£35) 2.6 million (33%)
Non-standard billing methods
Paying energy bill on receipt (£38)
Paying contents insurance monthly (£9)
Paying car insurance monthly (£81)
3.9 million (50%)
Not switched Not switched energy provider (£317) 5.8 million (73%)
Paper billing Paper bill for electric or gas (£5)
Paper bill for landline/broadband/mobile (£23)
3.9 million (49%)
Area-based premiums
Car insurance in a deprived area (£74)
Difficulty accessing good value shops (£266)
5.8 million (73%)
Insurance for specific items
Insurance for individual appliances (£132)
Mobile phone insurance (£60)
1.8 million (23%)
Access to money Fee-charging ATMs (£25)
Cheque-cashing services (£30)
2.3 million (29%)
Higher-cost credit Payday loan (£120)
Doorstep/home-collected credit (£540)
Rent-to-own (£315)
1.3 million (16%)
Source: University of Bristol and Households Below Average Income 2014/15

JRF – UK Poverty 2017
45
Poverty among children and working-age adults
The Minimum Income Standard basket
The cumulative effect on the cost of living for those on low incomes can be seen in changes to the cost of the basket of goods (and therefore the income a family needs per week) that is the socially agreed minimum required to have a basic standard of living. As can be seen in the table below, for many families this minimum has increased over the last decade. This increase has been driven not only by the addition of items society agrees are required to have a basic standard of living to the basket, but also the rising costs of many goods.15
Minimum requirements not including rent, Council Tax or childcare, (£ p/w, inflated to 2017 prices*)
2008 2017
Working-age single £176.51 £191.37
Working-age couple £277.05 £323.76
Lone parent with one child, aged 0–1 £237.43 £290.46
Lone parent with two children, aged 2–4 and in primary school
£325.66 £367.55
Couple with one child, aged 0–1 £324.16 £373.36
Couple with two children, aged 2–4 and in primary school
£425.84 £450.06
Note: * 2017 inflation rate calculated by averaging CPI inflation rates from January to August 2017.
Source: Joseph Rowntree Foundation
Housing costs
Paying for housing, whether rent or mortgage payments, is the single biggest cost for many households. Being able to afford a decent, secure home is a fundamental requirement, underpinning mental and physical health, relationships, and access to education and work. The cost of housing therefore has a major impact on whether people can meet this basic need, and what resources they have left to meet all their other needs. Here we focus on how the type and cost of housing affect poverty rates. Below, in the Housing, health and relationships chapter, we examine the quality of housing that people in poverty can afford.
There have always been more people in poverty who rent their homes than who own them (with or without a mortgage). However, since 2006 the number of people in poverty who rent has increased sharply, while the number of owner-occupiers in poverty has fallen.

JRF – UK Poverty 2017
46
Poverty among children and working-age adults
Number of working-age adults in poverty by tenure (AHC)
This reflects an increase in the number of working-age people who are private renters. The biggest driver of this is the fall in home-ownership, but there has also been a reduction in the availability of social rented accommodation, particularly local authority housing.
Composition of working-age population by tenure
The proportion of people in the poorest fifth of the working-age population who spend more than a third of their income (including Housing Benefit) on housing costs has risen from 39% in 1994/95 to 47% in 2015/16.
Source: Households Below Average Income (JRF analysis)
Working-age renting Working-age owner-occupier
Mill
ions
of w
orki
ng-a
ge a
dults
6m
3m
5m
4m
2m
0m
1m
1994/95
1995/96
1996/97
1997/98
1998/99
1999/00
2000/01
2001/02
2002/03
2003/04
2004/05
2005/06
2006/07
2007/08
2008/09
2009/10
2010/11
2011/12
2012/13
2013/14
2014/15
2015/16
Source: Households Below Average Income (JRF analysis)
Social landlord
Wor
king
-age
adu
lts
100%
70%
90%
80%
50%
0%
20%
30%
10%
40%
60%
1994/95
1997/98
1998/99
1999/00
2000/01
2001/02
2002/03
2003/04
2004/05
2005/06
2006/07
2007/08
2008/09
2009/10
2010/11
2011/12
2012/13
2013/14
2014/15
1995/96
1996/97
2015/16
Private landlord Buying with mortgage Owns outright

JRF – UK Poverty 2017
47
Poverty among children and working-age adults
Percentage of BHC income quintile spending more than one-third on housing costs (working-age adults)
People in the private rented sector are more likely to spend more than a third of their income on housing than those in any other sector. However, since 2010/11 there has been a rise in the proportion of those in the social rented sector spending this proportion of their income. This is due to the introduction in 2010/11 of affordable rent in England which allowed social landlords to charge up to 80% of market rent for new tenancies; far more than was previously the case for most social rents. There has also been a fall in the (already low) proportion of people with a mortgage spending more than a third of their income on housing.
Proportion of working-age adults spending more than a third of their net income on housing by tenure
Many low-income households, both workless and in work, receive Housing Benefit to help them meet the cost of their housing. However, this does not always cover all their housing costs. In 2006/07, 23% of working-age adults had to top up their Housing Benefit with other income because it did not cover their rent. This rose to 28% by 2012/13 and then rose very sharply reaching a peak of 41% in 2013/14 before falling to 36% in 2015/16.
Source: Households Below Average Income (JRF analysis)
Bottom quintile Second quintile Middle quintile Fourth quintile Top quintile
Wor
king
-age
adu
lts
60%
30%
50%
40%
20%
0%
10%
1994/95
1995/96
1996/97
1997/98
1998/99
1999/00
2000/01
2001/02
2002/03
2003/04
2004/05
2005/06
2006/07
2007/08
2008/09
2009/10
2010/11
2011/12
2012/13
2013/14
2014/15
2015/16
Source: Households Below Average Income (JRF analysis)
Private landlord Social landlord All Buying with mortgage Owns outright
50%
30%
45%
40%
20%
0%
10%
35%
25%
15%
5%
1994/95
1995/96
1996/97
1997/98
1998/99
1999/00
2000/01
2001/02
2002/03
2003/04
2004/05
2005/06
2006/07
2007/08
2008/09
2009/10
2010/11
2011/12
2012/13
2013/14
2014/15
2015/16

JRF – UK Poverty 2017
48
Poverty among children and working-age adults
The rise was driven by a combination of more families moving into the private rented sector (where rents tend to be higher), rising rents in the social rented sector and restrictions to benefits. Rents in the social sector were rising until 2015/16, but the government has since introduced a 1% annual rent cut. Changes to benefits have also been significant factors, including the freeze on uprating Local Housing Allowance, the introduction of the benefit cap for workless households and the under-occupancy penalty (‘bedroom tax’).
The freeze on rates of support for housing costs at a time when rents have been rising had led to a growing gap between the cash amount available and real rents. Most of those topping up Housing Benefit use less than 20% of their other income, but just under one in six use between 20% and 40% of their income. The shortfall between the rent for a two-bedroom property in the bottom third of outer London and the amount of Housing Benefit available is now an average of £192 a month.22
Percentage of working-age adults topping up their Housing Benefit with other income
The percentage of other income working-age adults are using to top up their Housing Benefit: 2015/16
Note: This chart only includes working-age adults in receipt of Income Support, income related Employment and Support Allowance, income basedJobseeker’s Allowance or, the guaranteed part of Pension Credit.
Source: Households Below Average Income (JRF Analysis)
Wor
king
-age
adu
lts
45%
35%
40%
30%
0%
25%
15%
20%
10%
5%
2006/07 2007/08 2008/09 2011/12 2014/15 2015/162009/10 2010/11 2012/13 2013/14
Note: This chart only includes working-age adults in receipt of Income Support, income-related Employment and Support Allowance,income-based Jobseeker’s Allowance or the guaranteed part of Pension Credit.
Source: Households Below Average Income (JRF analysis)
More than 60%, less than/equal to 80% (2%)
More than 40%, less than/equal to 60% (4%)
More than 20%, less than/equal to 40% (15%)
20% or less (76%)
More than 80% (3%)

JRF – UK Poverty 2017
49
Poverty among children and working-age adults
Council Tax
In 2016 in the UK, those in the poorest fifth of the income distribution were spending a larger proportion of their income on Council Tax than the rest of the population. In 2016, those in the poorest fifth spent 4.6% of their gross income on Council Tax. Those in the middle fifth spent 2.9% of their income on Council Tax and the richest fifth spent 1.6%. This means Council Tax is taking nearly three times as big a share of the incomes from the poorest fifth than the richest fifth.
Council Tax as a percentage of gross income for non-retired households by disposable income quintile: 2015/16
Since the change from a national system of Council Tax Benefit to a system of Council Tax Support devolved to local authorities in England, many families have had to pay much more in Council Tax. In 2017/18, 2 million families will pay more after the replacement of Council Tax Benefit with Council Tax Support. This is a similar number to those who were affected in 2013/14 (2.2 million). However, there has been a decrease in families who pay less than £100 extra (810,000 in 2013/14 compared with 250,000 in 2017/18), and an increase in the number of families who will pay £100 or more extra in Council Tax (1.5 million in 2013/14 compared with 1.8 million in 2017/18).23
Families paying at least £200 more in Council Tax due to the abolition of Council Tax Benefit
Gro
ss in
com
e
5%
0%
2%
4%
3%
1%
Bottom quintile Middle quintile Fourth quintile Top quintileSecond quintile
Source: Office for National Statistics
Fam
ilies
900,000
0
200,000
600,000
800,000
700,000
500,000
400,000
300,000
100,000
Less than £50 £100 to £150 £200 to £250 £250 or more£50 to £100 £150 to £200
Note: Council Tax and Northern Ireland rates.
Source: Key changes to Council Tax Support in 2017/18, NPI
2013/14 2017/18

JRF – UK Poverty 2017
50
Poverty among children and working-age adults
Childcare
The biggest cost for many working households with children, after housing, is childcare. The cost of all types of childcare has risen much faster than overall inflation.
Cost of 25 hours of childcare for under two-year-olds
Cos
t for
25
hour
s (£
s)
£180
£160
£120
£60
£0
£100
£80
£40
£20
£140
Source: Family and Childcare Trust
2005 price 2017 price if increased at rate of inflation 2017 actual price
England Nursery Scotland Nursery Wales Nursery Wales ChildminderEngland Childminder Scotland Childminder

JRF – UK Poverty 2017
JRF – UK Poverty 2017
Summary 52 Poverty rates and income growth 53 Gender and partnership status 58 Housing 60 Disability 63 Ethnicity 63 Pensioner poverty across the UK 64 Age 65 Costs 66
Pensioner povertyThis chapter examines changes in poverty among pensioners over the last 20 years. It examines the ways in which poverty has changed among different groups of pensioners, and sets out the factors that have driven falls, and more recently rises, in poverty.

JRF – UK Poverty 2017
52
Pensioner poverty
52
Pensioner povertySummaryThe reduction in pensioner poverty in the last two decades is one of the great successes of recent times: poverty among pensioners fell from 29% in 1996/97 to 13% in 2012/13. However, a small part of this success has been reversed in the last few years, with pensioner poverty rising to 16% by 2015/16.
The largest falls in the pensioner poverty rate happened in the period from 1998/99 to 2004/05. This was a sustained period in which the incomes of the poorest pensioners grew faster than anyone else’s.
This increase in income was driven mainly by increased state benefit income. There was also some effect from successive cohorts retiring with larger amounts of private pension income. In addition, average housing costs remained steady, despite rising rents, as more pensioners retired owning their own home.
However, in the past seven years for the poorest, both benefit income and private pension increases have tailed off, while housing costs have risen.
In the 1990s, the highest poverty rates were seen among single and older pensioners, and those who rent their home, and it was these groups who benefited the most from the falling pensioner poverty rate at the end of the 1990s and early 2000s.

JRF – UK Poverty 2017
53
Pensioner poverty
53
Poverty rates and income growth
Poverty rates
Between 1996/97 and 2012/13, the proportion of pensioners in poverty fell from 29% to 13%. However, in the three years to 2015/16, there has been an increase, back up to 16%.
After large falls in the pensioner poverty rate in the early 2000s, there was a rise just before the 2008-09 recession, and then gradual reductions from 2007/08. However, we have again seen a rise in pensioner poverty rates in the last couple of years.
Proportion of working-age adults and pensioners in poverty (after housing costs)
Income growth
In the late 1990s, median equivalised household income, and thus the poverty line24, rose rapidly in real terms, with incomes at the bottom of the pensioner income distribution failing to keep up.
The introduction of the Minimum Income Guarantee in 1999 resulted in much faster income growth at the bottom of the pensioner income distribution until 2005/06. The incomes of poorer pensioners grew faster than the median, leaving fewer pensioners below the poverty line and leading to rapid falls in pensioner poverty.
Just before the 2008–09 recession, there was a sudden and brief drop in income growth at the bottom of the distribution, causing the rise in pensioner poverty seen in 2006/07.
During and after the 2008–09 recession median incomes (and therefore the poverty line) stagnated and fell, but incomes for lower- and middle-income pensioners held steady. So, although their incomes were not rising, fewer pensioners found themselves below the poverty line. However, since 2013/14, overall median incomes have grown faster than pensioner incomes at the bottom, leading to three years of increases in pensioner poverty for the first time in two decades.
Source: Family Resources Survey and Households Below Average Income (JRF analysis)
Pensioners Working-age
Perc
enta
ge in
pov
erty
35%
20%
30%
25%
15%
0%
10%
5%
1994/95
1995/96
1996/97
1997/98
1998/99
1999/00
2000/01
2001/02
2002/03
2003/04
2004/05
2005/06
2006/07
2007/08
2008/09
2009/10
2010/11
2011/12
2012/13
2013/14
2014/15
2015/16

JRF – UK Poverty 2017
54
Pensioner poverty
54
Pensioner incomes compared with the poverty line (real 2015/16 prices)
Looking at year-on-year growth in pensioner incomes, the years between 1998/99 and 2004/05 were the only sustained period in which incomes in the lower part of the pensioner income distribution grew significantly faster than at the middle and top.
Year-on-year growth in pensioner incomes (real 2015/16 prices)
To illustrate this point further, it is possible to divide the years from 1994/95 to 2015/16 into five discrete periods based on the distribution of income growth among pensioners. From 1994/95 to 1998/99, income growth was highest in the middle and at the top of the distribution. Between 1998/99 and 2004/05, the gradient was steeply in favour of the lowest-income pensioners. For three years up to 2007/08, growth was fairly even in the top half of the distribution but lower at the bottom. The three years from 2007/08 saw a period of slightly higher growth in the bottom half of the distribution, while the last five years of the period saw this reverse in favour of the best-off pensioners.
Source: Family Resources Survey and Households Below Average Income (JRF analysis)
30th percentile of pensioner income distribution
Poverty line (60% of median AHC)
20th percentile of pensioner income distribution
10th percentile of pensioner income distribution
Wee
kly
pens
ione
r in
com
es
£350
£150
£250
£200
£100
£0
£300
£50
1994/95
1995/96
1996/97
1997/98
1998/99
1999/00
2000/01
2001/02
2002/03
2003/04
2004/05
2005/06
2006/07
2007/08
2008/09
2009/10
2010/11
2011/12
2012/13
2013/14
2014/15
2015/16
Source: Family Resources Survey and Households Below Average Income (JRF analysis)
Growth in 25th percentile Growth in 50th percentile Growth in 75th percentile
Year
-on-
year
gro
wth
8%
4%
6%
2%
-6%
-4%
-2%
0%
1995/96
1996/97
1997/98
1998/99
1999/00
2000/01
2001/02
2002/03
2003/04
2004/05
2005/06
2006/07
2007/08
2008/09
2009/10
2010/11
2011/12
2012/13
2013/14
2014/15
2015/16

JRF – UK Poverty 2017
55
Pensioner poverty
55
Distribution of growth in pensioner incomes
Income sources
The basic state pension provides a base level of income to pensioners with sufficient National Insurance contributions or credits. However, a full basic state pension is insufficient to keep a single pensioner, or a couple relying on one person’s contribution history, out of poverty. So low-income pensioners rely on a top-up to their income through the Pension Credit Guarantee. This means that the level of the basic state pension makes no difference to the net income of low-income pensioners: their income depends wholly on the level of the Pension Credit Guarantee.25
The main reason for the rapid increase in pensioner incomes at the bottom of the distribution was the introduction in 1999 of earnings-related increases in this support, and a large one-off increase in April 2001. The result was that the incomes of the poorest pensioners rose faster than prices for a number of years.
Unusually, since the 2008–09 recession, we have seen many years in which earnings have grown more slowly than prices. Although the annual increase in the Pension Credit Guarantee has exceeded average earnings growth, it has not kept pace with prices. The Pension Credit Guarantee was lower in real terms in the years 2010/11 to 2014/15 than it had been in 2009/10. This is in contrast to the basic state pension, whose value continued to rise in real terms due to the ‘triple lock’.
Pens
ione
r in
com
e gr
owth
45%
40%
-5%
35%
30%
20%
10%
5%
0%
15%
25%
1994/95 to 1998/99 1998/99 to 2004/05 2004/05 to 2007/08 2007/08 to 2010/11 2010/11 to 2015/16
Source: Family Resources Survey and Households Below Average Income (JRF analysis)
10th percentile 20th percentile 30th percentile 40th percentile 50th percentile
60th percentile 70th percentile 80th percentile 90th percentile

JRF – UK Poverty 2017
56
Pensioner poverty
56
Basic state pension and Pension Credit rates (real April 2016 prices)
Over the last two decades we have seen successive cohorts of pensioners retiring with ever higher occupational pension incomes. For example, the average occupational pension income of pensioners in a 65- to 69-year-old family26 nearly doubled in real terms between 1994/95 and 2015/16, from £104 to £204 a week in 2015/16 prices. This was driven by increases in the proportion of women retiring with occupational pension income, and by increases in average amounts.
Private pension coverage and average amounts for those in receipt for 65- to 69-year-old men and women
However most of the benefit from these increases went to better-off pensioner families. The proportion of 65- to 69-year-old families with no private pension income has not changed significantly over the 21 years. Over the same period the proportion of 65- to 69-year-old families with two adults receiving private pension income has risen from 12% to 22%. Thus the increase in private pension coverage among 65- to 69-year-old women (38% in 1994/95 to 54% in 2015/16) has largely benefited families that already had another adult receiving income from a private pension.
Source: Annual Abstract of Statistics 2016, Department for Work and Pensions
Pension Credit rates Basic state pension rates
Inco
me
per
wee
k
£180
£100
£140
£120
£80
£60
£160
April 1
988
April 1
990
April 1
992
April 1
994
April 1
996
April 1
998
April 2
000
April 2
002
April 2
004
April 2
006
April 2
008
April 2
010
April 2
012
April 2
014
April 2
016
Source: Family Resources Survey (JRF analysis)
Proportion of men aged 65-69 with private pension income (LH axis)
Proportion of women aged 65-69 with private pension income (LH axis)
Mean private pension income for men aged 65-69 receiving some private pension (RH axis)
Mean private pension income for women aged 65-69 receiving some private pension (RH axis)
Rece
ivin
g pr
ivat
e pe
nsio
n in
com
e
80%
70%
50%
0%
30%
£800
£700
£500
£0
£300
40% £400
10% £100
20% £200
60% £600
1994/95
1995/96
1996/97
1997/98
1998/99
1999/00
2000/01
2001/02
2002/03
2003/04
2004/05
2005/06
2006/07
2007/08
2008/09
2009/10
2010/11
2011/12
2012/13
2013/14
2015/16
2014/15
Weekly m
ean amount for those in receipt

JRF – UK Poverty 2017
57
Pensioner poverty
57
Families with oldest adult aged 65 to 69, by number of adults receiving income from a private pension
For the poorest half of pensioners in 65- to 69-year-old families, between 1994/95 and 2015/16, the increase in average occupational pension income was only £40 in real terms (2015/16 prices), going up from £21 to £62 a week. In contrast, their state benefit income went up in real terms over this period, from £110 to £233 a week. The substantial increase in state means-tested support therefore enabled lower-income pensioners to keep pace with their better-off contemporaries.
Income of the poorest half of pensioners in a 65- to 69-year-old family (real 2015/16 prices)
Source: Family Resources Survey and Households Below Average Income (JRF analysis)
Two adults in family have private pensions
Fam
ilies
100%
70%
90%
80%
50%
0%
20%
30%
10%
40%
60%
1994/95
1997/98
1998/99
1999/00
2000/01
2001/02
2002/03
2003/04
2004/05
2005/06
2006/07
2007/08
2008/09
2009/10
2010/11
2011/12
2012/13
2013/14
2014/15
1995/96
1996/97
2015/16
One adult in family has a private pension No one in family has a private pension
Wee
kly
inco
me
£500
-£100
£300
£100
-£200
£0
£200
£400
1994/95
1995/96
1996/97
1997/98
1998/99
1999/00
2000/01
2001/02
2002/03
2003/04
2004/05
2005/06
2006/07
2007/08
2008/09
2009/10
2010/11
2011/12
2012/13
2013/14
2014/15
2015/16
Source: Family Resources Survey and Households Below Average Income (JRF analysis)
Earnings Pension and investments Benefits (including state pension) Other Deductions
Housing costs Net income after housing costs
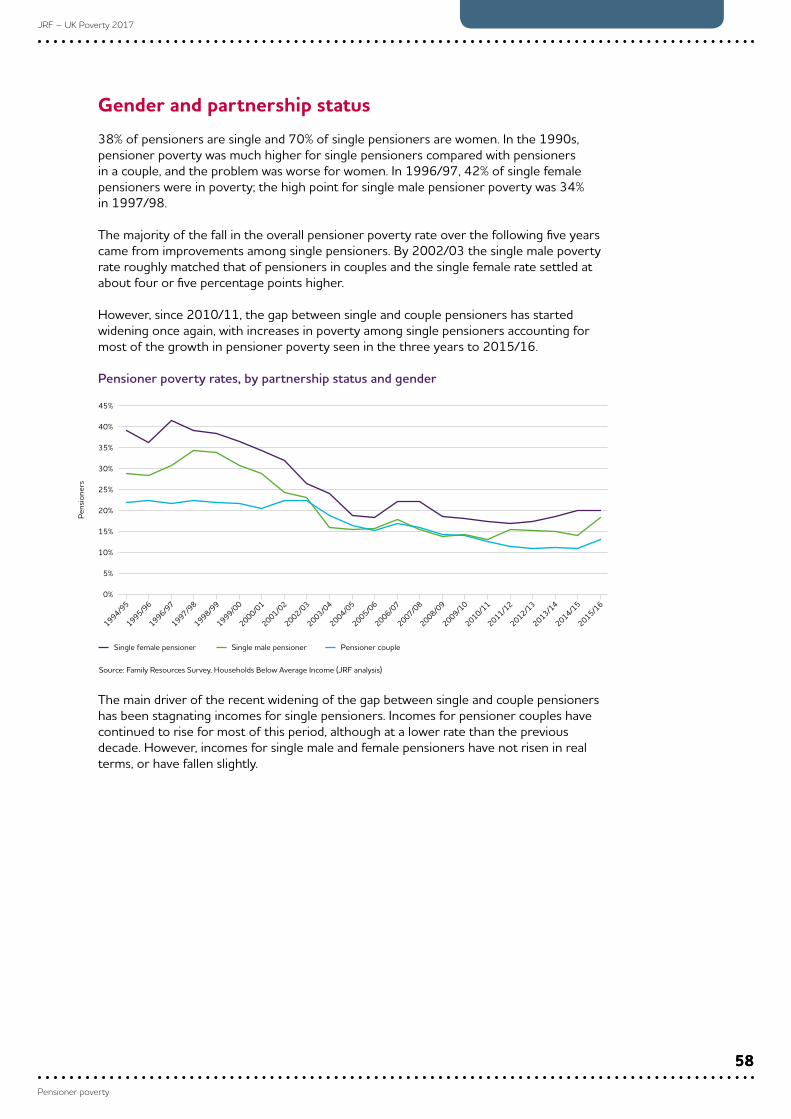
JRF – UK Poverty 2017
58
Pensioner poverty
58
Gender and partnership status38% of pensioners are single and 70% of single pensioners are women. In the 1990s, pensioner poverty was much higher for single pensioners compared with pensioners in a couple, and the problem was worse for women. In 1996/97, 42% of single female pensioners were in poverty; the high point for single male pensioner poverty was 34% in 1997/98.
The majority of the fall in the overall pensioner poverty rate over the following five years came from improvements among single pensioners. By 2002/03 the single male poverty rate roughly matched that of pensioners in couples and the single female rate settled at about four or five percentage points higher.
However, since 2010/11, the gap between single and couple pensioners has started widening once again, with increases in poverty among single pensioners accounting for most of the growth in pensioner poverty seen in the three years to 2015/16.
Pensioner poverty rates, by partnership status and gender
The main driver of the recent widening of the gap between single and couple pensioners has been stagnating incomes for single pensioners. Incomes for pensioner couples have continued to rise for most of this period, although at a lower rate than the previous decade. However, incomes for single male and female pensioners have not risen in real terms, or have fallen slightly.
Source: Family Resources Survey, Households Below Average Income (JRF analysis)
Single female pensioner Single male pensioner Pensioner couple
Pens
ione
rs
45%
20%
35%
25%
15%
0%
10%
30%
40%
5%
1994/95
1995/96
1996/97
1997/98
1998/99
1999/00
2000/01
2001/02
2002/03
2003/04
2004/05
2005/06
2006/07
2007/08
2008/09
2009/10
2010/11
2011/12
2012/13
2013/14
2014/15
2015/16

JRF – UK Poverty 2017
59
Pensioner poverty
59
Median income by family type (2015/16 prices)
Looking in more detail at single female pensioners, at the end of the 1990s poverty rates were relatively similar for separated, divorced and widowed pensioners. However, in recent years, a consistent gap of about 10 percentage points has opened up. 30% of separated single female pensioners are in poverty compared with 20% and 21% for those who are widowed and divorced.
Poverty rates for single female pensioners by marital status
Source: Households Below Average Income (JRF analysis)
Pensioner couple Single male pensioner Single female pensioner
Wee
kly
net e
quiv
alis
ed in
com
e (A
HC
)
£500
£250
£400
£300
£200
£0
£150
£350
£450
£100
£50
1994/95
1995/96
1996/97
1997/98
1998/99
1999/00
2000/01
2001/02
2002/03
2003/04
2004/05
2005/06
2006/07
2007/08
2008/09
2009/10
2010/11
2011/12
2012/13
2013/14
2014/15
2015/16
Source: Households Below Average Income (JRF analysis)
Separated female Divorced female Widowed female Single female
Sing
le fe
mal
e pe
nsio
ners
60%
20%
30%
0%
10%
40%
50%
1994/95
1995/96
1996/97
1997/98
1998/99
1999/00
2000/01
2001/02
2002/03
2003/04
2004/05
2005/06
2006/07
2007/08
2008/09
2009/10
2010/11
2011/12
2012/13
2013/14
2014/15
2015/16

JRF – UK Poverty 2017
60
Pensioner poverty
60
HousingPensioners who rent their homes are much more likely to be in poverty than owner-occupiers. This is due to pensioners who retire as owner-occupiers having higher levels of private income – occupational pensions and investment income – and having lower housing costs.
Mean income by tenure (2015/16)
Poverty rates for pensioners who rent their home were very high in the 1990s. For those in social housing, the poverty rate peaked at 54% in 1996/97, fell to 20% in 2012/13, and has risen back to 29% in 2015/16. For those renting from private landlords, the peak was 46% in 1997/98, and the low point was 27% in 2007/08, rising back up to 33% in 2015/16.
Poverty rates by tenure
Wee
kly
mea
n in
com
e
£800
-£200
£200
0
-£300
-£100
£100
£500
£700
£600
£400
£300
Source: Family Resources Survey and Housing Below Average Income (JRF analysis)
Gross earnings Gross occupational pension income Gross benefit income Other income Deductions
Housing costs Net income after housing costs
Social landlord Private landlord Owner-occupier
Source: Family Resources Survey and Households Below Average Income (JRF analysis)
Social landlord Private landlord Buying with mortgage Owns outright
Pens
ione
rs
60%
20%
30%
0%
10%
40%
50%
1994/95
1995/96
1996/97
1997/98
1998/99
1999/00
2000/01
2001/02
2002/03
2003/04
2004/05
2005/06
2006/07
2007/08
2008/09
2009/10
2010/11
2011/12
2012/13
2013/14
2014/15
2015/16

JRF – UK Poverty 2017
61
Pensioner poverty
61
Renters
The substantial reductions in the poverty rate for pensioners who rent their home arose largely from increases in benefit income. These increases have tailed off since 2009/10 while housing costs have continued to increase.
Mean income for pensioners who rent their home (real 2015/16 prices)
With housing costs, the picture has differed between social and private landlords. In the case of pensioners renting from social landlords, housing costs have risen steadily throughout the past two decades. Until around 2009/10, these increases were more than compensated for by increases in benefit income. Since then, that has no longer been the case, leading to reductions in net income after housing costs and increases in the poverty rate in the last few years.
For pensioners who rent from private landlords, housing costs started rising significantly more steeply from 2004/05. For this group, benefit income has been falling since 2010/11, although occupational pension and earnings have risen slightly. The effect has been net incomes after housing costs staying the same in real terms and a small increase in the poverty rate.
Wee
kly
mea
n in
com
e (r
eal 2
015
– 2
016
pric
es)
£500
-£100
£300
£100
-£200
£0
£200
£400
1994/95
1995/96
1996/97
1997/98
1998/99
1999/00
2000/01
2001/02
2002/03
2003/04
2004/05
2005/06
2006/07
2007/08
2008/09
2009/10
2010/11
2011/12
2012/13
2013/14
2014/15
2015/16
Source: Family Resources Survey and Housing Below Average Income (JRF analysis)
Gross earnings Gross occupational pension income Gross benefit income Other income Deductions
Housing costs Net income after housing costs

JRF – UK Poverty 2017
62
Pensioner poverty
62
Housing costs by tenure (real 2015/16 prices)
Owner-occupiers
There are many more pensioners who are owner-occupiers than who rent their home. In 1994/95, roughly two-thirds of pensioners owned their home. By 2015/16, this had risen to four out of five.
Although the poverty rate for owner-occupiers, at 12% in 2015/16, is far lower than that for renters, owner-occupiers make up the vast majority of the overall pensioner population, so there are now more owner-occupier pensioners in poverty than renters.
Pensioners by tenure and whether in poverty
Source: Family resources Survey and Households Below Average Income (JRF analysis)
Social landlord Private landlord Owner-occupier
Wee
kly
hous
ing
cost
s (r
eal 2
015
– 2
016
pric
es)
£120
£20
£80
£40
£0
£60
£100
1994/95
1995/96
1996/97
1997/98
1998/99
1999/00
2000/01
2001/02
2002/03
2003/04
2004/05
2005/06
2006/07
2007/08
2008/09
2009/10
2010/11
2011/12
2012/13
2013/14
2014/15
2015/16
Pens
ione
rs
100%
10%
60%
20%
0%
40%
80%
90%
70%
50%
30%
1994/95
1995/96
1996/97
1997/98
1998/99
1999/00
2000/01
2001/02
2002/03
2003/04
2004/05
2005/06
2006/07
2007/08
2008/09
2009/10
2010/11
2011/12
2012/13
2013/14
2014/15
2015/16
Source: Family resources Survey and Households Below Average Income (JRF analysis)
Renter in poverty Renter not in poverty Owner-occupier in poverty Owner-occupier not in poverty

JRF – UK Poverty 2017
63
Pensioner poverty
63
DisabilityMany disabled pensioners get extra-cost disability benefits27 to meet the additional costs of having a disability. Standard poverty rates reflect the income from these benefits but not the costs of being disabled, and can therefore underestimate the extent of financial poverty among disabled people.
The chart below presents poverty rates where income from extra-cost disability benefits has been removed from the calculation. If the financial costs of having a disability are exactly equal to the value of the relevant benefit income, this will give a more accurate picture of poverty among disabled people. If, on the other hand, these disability benefits do not fully compensate for the financial costs of disability, this calculation will continue to underestimate the extent of financial poverty among disabled people.
This analysis shows that, when the poverty calculation is adjusted for extra-cost disability benefits, poverty rates for pensioners in households containing at least one disabled person have been consistently higher than for other pensioners over the past 20 years.
The extent of the additional poverty increased at the end of the 1990s, started coming down in the early 2000s, and settled at 4 percentage points for many years. However, in the last three years, the gap has increased to 6 percentage points.
Pensioner poverty rates excluding extra-cost disability benefits income, by whether there is a disabled person in the household
EthnicityThe poverty rate for pensioners in White households has been lower than that for other ethnic groups throughout the last 20 years.
Pensioners in Bangladeshi households have seen the largest fall in poverty rates over this period, although most groups have also seen reductions. However, for Pakistani households, after falling in the years to 2005/06, the pensioner poverty rate in 2015/16 was higher than it was in 1994/95.
Pens
ione
r ho
useh
olds
40%
25%
35%
30%
20%
10%
5%
0%
15%
1995/96
1996/97
1997/98
1998/99
1999/00
2000/01
2001/02
2002/03
2003/04
2004/05
2005/06
2006/07
2007/08
2008/09
2009/10
2010/11
2011/12
2012/13
2013/14
2014/15
2015/16
Source: Family Resources Survey and Households Below Average Income (JRF analysis)
At least one person disabled in household No one disabled in household

JRF – UK Poverty 2017
64
Pensioner poverty
64
Pensioners in poverty (AHC), by ethnicity of household (three-year average)
Pensioner poverty across the UKIn the 1990s through to 2005/06, there was a similar trajectory for poverty rates across the four nations of the UK. The poverty rate in the 1990s was highest in Scotland and lowest in Wales28, but England, Scotland and Wales saw large falls in the poverty rate at the end of the 1990s and early 2000s.
However, in the latter part of the 2000s, the picture began to diverge. Scottish pensioners began to experience slightly lower poverty rates than the other nations and, from 2010/11, Welsh pensioners began to see significant increases in poverty rates. In Wales, the pensioner poverty rate stood at 12% in 2010/11; by 2015/16, it had risen to 21%.
Poverty rates by nation
Source: Family Resources Survey and Households Below Average Income (JRF analysis)
Asian or Asian British – Bangladeshi
Chinese and Other ethnic group
Asian or Asian British – Pakistani
Black/African/Caribbean/Black British
Asian or Asian British – Indian
White
Pens
ione
rs
100%
70%
90%
60%
0%
80%
50%
30%
40%
20%
10%
1994/95 to
96/97
1995/96 to
97/98
1996/97 to
98/99
1997/98 to
99/00
1998/99 to
00/01
1999/00 to
01/02
2000/01 to
02/03
2001/02 to
03/04
2002/03 to
04/05
2003/04 to
05/06
2006/07 to
08/09
2009/10 to
11/12
2010/11 to
12/13
2011/12 to
13/14
2012/13 to
14/15
2013/14 to
15/16
2004/05 to
06/07
2005/06 to
07/08
2007/08 to
09/10
2008/09 to
10/11
Pens
ione
rs
40%
25%
35%
30%
20%
10%
5%
0%
15%
1994/95
1995/96
1996/97
1997/98
1998/99
1999/00
2000/01
2001/02
2002/03
2003/04
2004/05
2005/06
2006/07
2007/08
2008/09
2009/10
2010/11
2011/12
2012/13
2013/14
2014/15
2015/16
Source: Family Resources Survey and Households Below Average Income (JRF analysis)
Scotland England Wales Northern Ireland

JRF – UK Poverty 2017
65
Pensioner poverty
65
AgeIn the 1990s, poverty rates for older pensioners were much higher than those for younger pensioners.29 The increases in state benefit income that reduced the pensioner poverty rate in the late 1990s and early 2000s made the most difference to older pensioners. By 2005/06, the differences in poverty rates between the oldest and youngest had narrowed considerably.
Poverty rate among pensioners by oldest person in the family
Older pensioners
In the last few years there are signs that a slightly wider gap may be emerging between the oldest pensioners and others. The incomes of lower-income older pensioners have been rising at a slower rate than their younger counterparts and were slightly lower in real terms in 2015/16 than they were in 2009/10.
Younger female pensioners
In addition to the oldest pensioners, poverty rates are higher for 60- to 64-year-old pensioners than for other age groups. Pensioners in this group are either single women, or couples where the only pensioners in the family are women aged 60 to 64.30 Because the state pension age for women is rising to 65 in 2018, this group is reducing in size each year. However, as with the oldest pensioners, in the last few years poverty rates have risen faster than for other age groups and are significantly higher than three years before.31
The group of female pensioners born between 1950 and 2010 have been affected more than any other group by changes to the state pension age. They were subject to the provisions of the 1995 Pensions Act, which was due to increase the state pension age for this group from 60 to 65. However, the Pensions Act 2011 accelerated this change, bringing forward the date at which the state pension age for women reached 65 from 2020 to 2018.
Pens
ione
rs
45%
25%
35%
30%
20%
10%
5%
0%
40%
15%
1994/95
1995/96
1996/97
1997/98
1998/99
1999/00
2000/01
2001/02
2002/03
2003/04
2004/05
2005/06
2006/07
2007/08
2008/09
2009/10
2010/11
2011/12
2012/13
2013/14
2014/15
2015/16
Source: Family Resources Survey and Households Below Average Income (JRF analysis)
60 to 64 65 to 69 70 to 74 75 to 79 80 plus

JRF – UK Poverty 2017
66
Pensioner poverty
66
Employment
The employment rate for people aged 65 and over has doubled over the past 20 years, from less than 5% in 1996 to almost 11% in 2016. The highest employment rates are seen among younger pensioners; the employment rate for 65- to 69-year-olds was more than 21% in 2016.
This is reflected in increased employment income for pensioners. Between 1994/95 and 2015/16, average earnings32 for pensioners in families whose oldest person is 65 to 69 years old increased in real terms from £93 to £207 a week (2015/16 prices). However, these increases have not been seen across all pensioners. The earnings of the poorest half of pensioners in this age group only rose from £14 to £59 a week.
Employment rates for people 65 and over, by age group (annual four-quarter averages)
Costs
Inflation
Pensioners tend to consume a slightly different range of goods to other households, which means that price rises faced by pensioners over the past two decades have been slightly different to those faced by other households. The chart below compares income growth at the 25th percentile of the pensioner income distribution with inflation faced specifically by pensioner households.33
This shows that, in the latter half of the 1990s and for the first half of the 2000s, pensioner incomes at the bottom of the income distribution rose substantially faster than the prices of goods that they tend to purchase. However, since around 2006, lower quartile pensioner incomes have not risen any faster than the price of goods purchased by pensioners.
Source: Labour Force Survey (JRF analysis)
65 to 69 70 to 74 75 to 79 80 plus65 plus
Pens
ione
rs in
wor
k
25%
20%
15%
0%
10%
5%
19961997
19981999
20002001
20022003
20042005
20062007
20082009
20102011
20122013
20142015
2016

JRF – UK Poverty 2017
67
Pensioner poverty
67
Pensioner inflation and nominal income growth at the 25th percentile of the pensioner income distribution
Three factors explain this fall in purchasing power. First, lower quartile pensioner incomes grew at a lower rate than the previous decade. Second, inflation in general was higher than previously until about 2014. And third, pensioner inflation was higher during most of the 2000s than for other households.
Difference between the Retail Prices Index for pensioners and for all households
Source: Family Resources Survey and Households Below Average Income (JRF analysis)
Growth in 25th percentile RPI growth excluding housing, couple pensioners RPI growth excluding housing, single pensioners
Perc
enta
ge
10%
6%
8%
4%
-2%
0%
2%
1995 Q2
1996 Q2
1997 Q2
1998 Q2
1999 Q2
2000 Q2
2001 Q2
2002 Q2
2003 Q2
2004 Q2
2005 Q2
2006 Q2
2007 Q2
2008 Q2
2009 Q2
2010 Q2
2011 Q2
2012 Q2
2013 Q2
2015 Q2
Source: Family Resources Survey and Households Below Average Income (JRF analysis)
Couple pensioner households Single pensioner households
Perc
enta
ge p
oint
diff
eren
ce
5%
3%
4%
2%
-3%
-1%
-2%
0%
1%
1988 Q1
1990 Q1
1992 Q1
1994 Q1
1998 Q1
1996 Q1
2000 Q1
2002 Q1
2004 Q1
2006 Q1
2008 Q1
2010 Q1
2012 Q1
2016 Q1
2014 Q1

JRF – UK Poverty 2017
JRF – UK Poverty 2017
Summary 69 Housing quality and security 70 Health 76 Relationships 80
Housing, health and relationshipsThis chapter focuses on three aspects of people’s lives that are strongly affected by poverty. First, the quality and security of the housing that those on low incomes live in, and the way this varies depending on the type of housing. Next, the links between poverty and physical and mental health, including variations in healthy life expectancy. Finally, the chapter sets out information about the ways in which relationships within families and wider social networks vary among people with different income levels.

JRF – UK Poverty 2017
69
Housing, health and relationships
69
Housing, health and relationshipsSummaryPoverty affects many aspects of people’s lives. Living on a low income reduces the options available for housing, leaving some people more vulnerable to living in poor quality or insecure homes. The social housing systems across the UK play an important part in reducing the link between poor-quality housing and low incomes, and the proportion of those living in poor-quality housing has fallen across the UK. However, those in the poorest fifth of the population are still more likely to live in poor-quality, overcrowded and insecure housing than better-off families.
Poverty is also closely linked to health. The stress of struggling to make ends meet affects both physical and mental health. Poor health also increases the risk of poverty by limiting people’s opportunities to work and increasing costs. The evidence shows that adults in the poorest 20% of the population experience worse physical health than those who are better off. Physical health has declined somewhat for all income groups except the richest 20%. Adults in the poorest fifth of the population are also much more likely to experience depression and anxiety than the rest of the population. The proportion of those in the poorest 20% in England experiencing these mental health difficulties has increased, particularly since 2008. Young people from low-income backgrounds are also somewhat more likely to experience mental health difficulties than those who are better off, especially those in the richest fifth of families.
Finally, there is an emerging body of evidence about the links between poverty and relationships – both within families and with wider support networks. Measurement of these issues and of the ways that they interact with poverty and other factors is at an early stage. This chapter presents initial analysis of indicators around relationships as a starting point to improve future understanding. Social isolation (defined as having no more than one close friend) is more common among those with lower incomes than those who are better off, but appears to have declined for all groups since 2011/12. It is also striking that pensioners overall are more likely to be socially isolated, particularly those on lower incomes.
Within families, poverty can also place a strain on relationships. Children in lower-income families are more likely to report that they quarrel with their parents and do not discuss important issues with them. The proportion of couples experiencing ‘relationship distress’ is much higher in the poorest fifth of the population and decreases as incomes rise. Separation is well known to greatly increase the risk of poverty, but the evidence also shows that couples who are on low incomes are more likely to separate than those who are better off. Domestic abuse is more commonly experienced by women in more deprived neighbourhoods than those in less deprived areas. Men are also slightly more likely to experience domestic abuse in more deprived areas, but this association is much weaker than for women.

JRF – UK Poverty 2017
70
Housing, health and relationships
70
Housing quality and securityThe cost of housing is an important driver of poverty – high housing costs leave families with less money to pay for the rest of their needs. The quality of housing that an individual or family can afford is also, of course, closely linked to their income, but also to their tenure. The housing system, with social housing, Housing Benefit and support for homeless people, has played an important role in protecting people from some of the impact of poverty. It also broke the link between poverty and poor housing conditions, at least to some extent.34
In recent years, however, the protection offered by the housing system to those in poverty has been weakened. As discussed above, the rising cost of housing and reductions in Housing Benefit have left more and more families having to cover part of the cost of their housing from income other than Housing Benefit. The increasing proportion of people in poverty living in the private rented sector has also exposed many more to the lower standards and greater insecurity of that sector, particularly families with children.
Home-ownership provides some protection against poverty, particularly for pensioners who have paid off their mortgage and thus have very low housing costs. However, owning a home is not a guarantee of escaping poverty – a third of those in poverty are home-owners.
Housing quality
Living in housing that is damp, in disrepair, overcrowded or insecure can have negative effects on people’s mental and physical health, and on children’s education and prospects.35
Various measures of housing quality are defined in different ways across the UK, and are measured using different data sources in England, Scotland, Wales and Northern Ireland, so the figures provided for different parts of the UK are not directly comparable.
‘Decent’ housing
Each part of the UK assesses whether some or all of its housing meets a standard of decency in relation to repair, damp and other conditions.
Measures of non-decent housing: UK nations
Perc
enta
ge
80%
70%
0%
60%
40%
20%
10%
30%
50%
2005 2007 2008 2011 20142006 201620152009 2010 2012 2013
England: percentage of households in sub-standard dwellings (Decent Homes Standard)
Scotland: percentage of unfit dwellings (Scottish Housing Quality Standard)
Source: English Housing Survey, Scottish Housing Survey, Welsh Housing Quality Standard
Wales: percentage of sub-standard social landlord dwellings (Welsh Housing Quality Standard)

JRF – UK Poverty 2017
71
Housing, health and relationships
71
In England, housing is assessed as being ‘decent’ or ‘non-decent’ depending on whether it meets a range of statutory minimum standards covering safety, state of repair, facilities and thermal comfort. 19% of households live in housing defined as non-decent. This is highest among private renters (28%), followed by owner-occupiers (18%), and is lowest among social renters (13%). The overall proportion of households living in non-decent housing has fallen, from just over a third in 2005/06–2006/07 to just under a fifth in 2014/15–2015/16. Since 2012 however, the number of non-decent homes has been decreasing more slowly.
Those in the poorest 20% of the population have a higher risk of living in non-decent housing (23%) than the rest of the population. The risk of living in non-decent housing has fallen across all income groups, but most sharply for those in the richest two-fifths, widening inequality. Private renters have the highest risk of non-decent housing, but have also seen the largest decrease in non-decent housing.
Percentage of households in England living in non-decent dwellings by tenure
Percentage of households in England living in non-decent dwellings by equivalised household income
In Scotland, 44% of dwellings failed to meet the Scottish Housing Quality Standard in 2015. The highest proportion are in the private rented sector (50%). The total proportion that did not meet the standard fell from 75% in 2005 to 61% in 2010, and 44% in 2015.
Hou
seho
lds
50%
45%
0%
40%
30%
20%
10%
5%
15%
25%
35%
2005/06–2006/07 2014/2015–2015/162009/10–2010/11
Private renterAll Owner Social renter
Source: English Housing Survey
Hou
seho
lds
40%
0%
30%
20%
10%
5%
15%
25%
35%
Poorest fifth Second poorest fifth Middle fifth Second richest fifth Richest fifth
Source: English Housing Survey
2005/06–2006/07 2014/2015–2015/162009/10–2010/11

JRF – UK Poverty 2017
72
Housing, health and relationships
72
In Wales, figures are based on social housing only. Overall, in 2016, 21% of social housing failed to meet the Welsh Housing Quality Standard, falling from 40% in 2013. Quality varies between housing owned by local authorities and that owned by registered social landlords. In 2013, 61% of local authority dwellings failed to meet the standard, falling to 46% by 2016. By contrast, in 2013, 26% of registered social landlords’ properties failed to meet the standard, falling to 4% by 2016.
In Northern Ireland, a Decent Homes Standard was introduced in 2004, but the most recent data is for 2011, when 11% of homes failed to meet the standard.36 New data on decent homes in Northern Ireland is due to be released in 2018.
Overcrowding
Overcrowding is defined according to the bedroom standard.37 The number of bedrooms required by a household depends on the number of people living in it, and their age, gender and relationship to each other. A household is deemed overcrowded if it has fewer bedrooms than the number required.38
In England, 3% of households live in overcrowded accommodation. This is higher among social renters (7%) and private renters (5%) than among owner-occupiers (1%). Overcrowding is more prevalent among lower-income households: 7% of those in the lowest income quintile, falling to less than 1% of those in the highest income quintile. As expected, findings vary by household size. Households with four or more children are particularly likely to live in overcrowded housing (41%). It is also more prevalent among lone-parent households (10%). The overall incidence and patterns of overcrowding have remained fairly steady, particularly in the last decade. Since the early 1990s, there have been small increases in the proportion of overcrowded households in the private and social rented sectors, and a slight decrease among owner-occupiers. The only group that has seen a big increase in overcrowding is households with four or more children (up 10 percentage points since 2002/03–2004/05).
In Scotland, 3% of households live in overcrowded accommodation, and this has remained consistent over time. Overcrowding is more prevalent in rented housing – either social rented or private rented (4% in each case), compared with owner-occupied housing (1%).
In Wales, the most recent data is from the 2011 Census which showed that 3% of households in Wales were overcrowded.
In Northern Ireland, 2% of households live in overcrowded housing. This proportion is higher among households that rent their home – either from the Housing Executive or another landlord (both 3%), compared with owner-occupiers (1%). The incidence of overcrowding is greater in larger households, especially those with four or more children (17%). Those in the poorest fifth of the population are less likely to live in overcrowded housing than those who are better off. Overcrowding has fallen, from 5% in 1993/94–1995/96 and 3% in 2001/02–2003/04 to the current level of 2%. In particular, larger households are likely to have seen a fall in the incidence of overcrowding (with a 17 percentage point drop among those with four or more children since 1993/94–1995/96). In relation to tenure, the largest decrease has been among households that rent from the Housing Executive, where rates have dropped 3 percentage points since 1993/94–1995/96.

JRF – UK Poverty 2017
73
Housing, health and relationships
73
Percentage of households living in overcrowded housing (based on the bedroom standard)
Percentage of households in overcrowded housing by household income and UK nation (based on the bedroom standard – data for Wales unavailable)
Sources: English Housing Survey, Census (Wales), Scottish Households Survey and Northern Ireland Continuous Household Survey
0%
Households
Yorkshire and the Humber
East Midlands
West Midlands
East of England
London
South East
South West
North West
North East
Northern Ireland
Scotland
Wales
England
2%1% 3% 4% 5% 6% 7% 8%
Data: 2013/14 to 2015/16 England; 2015 Scotland; 2012/13 to 2014/15 Northern Ireland. Household income measure: equivalised England;net Scotland, total gross Northern Ireland.
Source: English Housing Survey, Scottish Household Survey, Northern Ireland Continuous Household Survey
0%
Households
England: poorest fifth
England: second poorest fifth
England: middle fifth
England: second richest fifth
England: richest fifth
Scotland: poorest fifth
Scotland: second poorest fifth
Scotland: middle fifth
Scotland: second richest fifth
Scotland: richest fifth
Northern Ireland: poorest fifth
Northern Ireland: second poorest fifth
Northern Ireland: middle fifth
Northern Ireland: second richest fifth
Northern Ireland: richest fifth
1% 2% 3% 4% 5% 6% 7% 8%

JRF – UK Poverty 2017
74
Housing, health and relationships
74
Percentage of households in overcrowded housing by household tenure and UK nation (based on the bedroom standard – data for Wales unavailable)
A secure home
Having a stable and secure home is a bedrock of family life. The likelihood of losing a home depends on many factors including the level and stability of someone’s income, the type of housing they live in and the impact of housing regulations and policies. This section focuses on trends in homelessness across the UK, shown in statutory homelessness, rough sleeping and homeless placements in temporary accommodation. Measurements of homelessness and policies in relation to it vary considerably across the UK. This means that direct comparisons cannot be made between statistics for England,39 Scotland, Wales and Northern Ireland.
England
Between 2009/10 and 2016/17 the number of ‘homelessness acceptances’ by local authorities in England increased from 40,000 to 59,000; a rise of 48%.40 These figures understate the increase in ‘homelessness expressed demand’ however; the number of local authority homelessness prevention and relief cases rose from 165,000 in 2009/10, to 221,000 in 2014/15 before falling slightly to 214,000 in 2016/17.
Rough sleeping in England increased from almost 1,800 in 2010 to just over 4,100 – a rise of 134%.41
The number of households in temporary accommodation rose from 54,000 in 1998 to just over 100,000 in 2004. It then fell back to 49,000 in 2011 before rising to 77,000 in the first quarter of 2017.42
Research suggests that the increase in homelessness in recent years is partly driven by the increase in the number of people made homeless from the private rented sector, which increased fourfold from fewer than 5,000 in 2009/10 to 19,000 in 2016/17.43
Data: 2013/14 to 2015/16 England; 2015 Scotland; 2012/13 to 2014/15 Northern Ireland.
Source: English Housing Survey, Scottish Household Survey, Northern Ireland Continuous Household Survey
0%
Households
England: owner
England: private renter
England: social renter
Scotland: owner
Scotland: private renter
Scotland: social renter
Northern Ireland: owner
Northern Ireland:rent from Housing Executive
Northern Ireland:rent from housing association/privately/other
2%1% 3% 4% 5% 6% 7%

JRF – UK Poverty 2017
75
Housing, health and relationships
75
Scotland
In Scotland, the statutory duty in relation to homelessness is wider than in other parts of the UK. In 2016/17, about 28,000 households were assessed as homeless or threatened homeless44, a very slight decrease from the previous year. The number had risen from just under 40,000 in 2002/03 (the earliest year for which statistics are available) to just under 44,000 in 2009/10 and then fell over the next few years.
The Scottish Government does not carry out a regular rough sleeper count. However the scale of rough sleeping can be estimated through local authorities’ records of homelessness which show that around 1,500 people applying as homeless in Scotland in 2016/17 had slept rough on the night preceding their application.
The number of households in temporary accommodation in Scotland rose from just over 3,000 in 1991 to just under 11,000 in 2010. It then fell to just over 10,000 and remained at that number up to and including 2016, rising to almost 11,000 again in 2017.44
Wales
The number of local authority statutory homelessness acceptances in Wales was just over 2,000 in 2016/17, up from 1,600 in 2015/16.45 Despite this recent increase, this is dramatically lower than pre-2015, when homelessness acceptances stood at over 5,000. This fall is the direct and anticipated result of major changes in homelessness legislation that came into force in early 2015, and introduced ‘prevention and relief duties’ on local authorities to help prevent the need for the main rehousing duty. There is good evidence that the introduction of this new statutory homelessness framework has led to improvements in local authorities’ prevention activities and falls in homelessness.46
Until very recently, rough sleeping was only monitored in Wales occasionally. The Welsh Government started carrying out more formal surveys in 2015, counting 313 rough sleepers across Wales in 2016, compared with 240 in 2015. Distinct methods were used in these surveys, meaning that the figures are not directly comparable. There has, however, been an undisputed recent rise in rough sleeping, with the scale of this increase estimated to be between 16% and 30%.
The number of homeless households in temporary accommodation in Wales rose from almost 700 in 1997, to a high of 3,500 in 2005 before falling to 2,000 in 2016.47
Northern Ireland
In 2004, almost 8,500 people were accepted as ‘full duty applicants’ (FDA) in Northern Ireland, the equivalent of acceptance as unintentionally homeless and in priority need in England. This rose to 11,200 in 2015/16.48
Rough sleeping is not monitored regularly or comprehensively in Northern Ireland. A ‘street needs audit’ carried out in Belfast in 2015 suggested that the numbers sleeping rough on any one night were low, averaging six.
Since 2009/10, between 2,700 and 3,000 placements into temporary accommodation have been made each year in Northern Ireland.

JRF – UK Poverty 2017
76
Housing, health and relationships
76
HealthPhysical and mental health have close links to poverty. People on lower incomes are more likely to experience poor physical and mental health. The stress of living on a low income can have a negative impact on health. Being disabled or in poor health can also contribute to having a low income, as people may find it harder to work, have lower earnings and face additional costs.35 This is shown in the strong relationship between poverty and disability in the figure Poverty rates for working-age adults by disability in family (removing DLA, AA, PIP from income) in the Poverty among children and working-age adults chapter. It is also clear when examining patterns of both physical and mental health more widely.
Physical health
Physical health is measured based on a series of questions that are combined to give an individual a score between 0 and 100; a higher score indicates better physical health. People living on low incomes have a lower average score than those on higher incomes.
The difference between those on the highest incomes and others is larger among pensioners than working-age people. Among pensioners those in the poorest fifth have a slightly higher score than the second poorest fifth, suggesting that some other factor is affecting these results, such as the average age of those in each group.
Over time, the average score for working-age adults in the UK has remained very steady, while it has improved slightly for pensioners. Among both working-age adults and pensioners, inequality in physical health has increased since 2011–12.
UK mean physical health function score by net household income: working-age adults (16–64)
Source: Understanding Society
45
All
Poorest fifth
Second poorest fifth
Richest fifth
Middle fifth
Second richest fifth
46 47 48 49
Score
50 51 52 53 54
2011–12 2014–15

JRF – UK Poverty 2017
77
Housing, health and relationships
77
UK mean physical health function score by net household income: pensioners (65+)
Mental health
According to the Health Survey for England, 15% of adults showed some evidence of anxiety or depression in 2014 (the latest year for which these figures are available). Over the 16-year period since 1998, much higher proportions of those in the poorest fifth of the population experienced anxiety and depression than those with higher incomes. Between 1998 and 2014, the proportion of those in the poorest 20% experiencing anxiety or depression rose by 3.5 percentage points. Over the same period, the proportions among the rest of the population fell, leading to wider inequality.
Percentage of adults in England indicating some evidence of anxiety or depression by equivalised household income
In Scotland, the proportion of the total population showing some evidence of anxiety or depression in 2014 was 16%, with much higher figures for the poorest fifth (24%) than for the rest of the population.
36
All
Poorest fifth
Second poorest fifth
Richest fifth
Middle fifth
Second richest fifth
38 40 42 44 46 48
Source: Understanding Society
Score
2011–12 2014–15
Adu
lts
25%
0%
15%
5%
10%
20%
1998 20142008
Poorest fifth Second poorest fifthAll Middle fifth Second richest fifth Richest fifth
Source: Health Survey for England

JRF – UK Poverty 2017
78
Housing, health and relationships
78
Adults in Scotland indicating some evidence of anxiety or depression by equivalised household income
Further analysis of the UK-wide Understanding Society survey is needed to assess the proportion of people in different income groups experiencing anxiety or depression in Northern Ireland or Wales.
According to the data for children, in 2013–14, 9% of 10- to 15-year-olds in the UK had severe mental health problems, and 12% had moderate problems. There was a slight association with income – children in the richest fifth are less likely to have severe mental health problems than the rest of the population.
UK children aged 10 to 15 indicating moderate or severe mental health problems by household income 2013–14
Adu
lts
30%
25%
0%
20%
15%
5%
10%
All Secondpoorest fifth
Secondrichest fifth
Richest fifth Poorest fifth Middle fifth
Note: There is no available breakdown by household income for 1998.
Source: Scottish Health Survey
1998 2008 2014
Chi
ldre
n ag
ed 1
0 to
15
15%
0%
5%
10%
All Secondpoorest fifth
Secondrichest fifth
Richest fifth Poorest fifth Middle fifth
Source: Understanding Society
Moderate Severe

JRF – UK Poverty 2017
79
Housing, health and relationships
79
For 10- to 15-year-olds as a whole, this has not changed over recent years. However, there have been some changes in the prevalence of severe mental health problems among some groups, particularly:
• an increase among young people in workless households; up from 13% in 2009–10 and 2011–12 to 17% in 2013–14
• a reduction among young people in Northern Ireland from 10% in 2009–10 to 5% in 2013–14.
There is also a striking difference between the prevalence of both adult and children’s mental health difficulties for those living in workless households compared with households that include someone in paid work. Nearly twice as many adults in workless households have mental health difficulties as those in working households – 31% compared with 17%. Similarly, 29% of children in workless households have a severe or moderate mental health problem, compared with 19%. This is likely to be linked to a range of factors associated with worklessness, including lower incomes. It is also the case that adults with mental health difficulties, and those caring for children with such conditions are likely to find it much harder to find and sustain paid work.
Nutrition
There are a range of recommended targets for the types and amount of different foods that adults and children should eat to have a healthy diet. One of the best known is the suggestion that people should eat five portions of fruit and vegetables a day. There is a very complex mix of factors that may influence individuals’ and families’ diet. These can include the cost of different foods, habits and expectations, cooking facilities and time available to prepare food.
The proportion of people eating the recommended amount of fruit and vegetables each day varies across income groups. Over a third (39%) of people in the richest fifth of the population eat the recommended amount, falling to only 15% of those in the poorest fifth. There are no significant differences between England, Wales, Scotland and Northern Ireland.
Adults and children meeting recommendations for fruit and vegetables (five a day) by equivalised household income
Source: National Diet and Nutrition Survey
0%
Percentage
Adults (19+)
Adults: poorest fifth
Adults: second poorest fifth
Adults: middle fifth
Adults: second richest fifth
Adults: richest fifth
Children (under 19)
Children: poorest fifth
Children: second poorest fifth
Children: middle fifth
Children: second richest fifth
Children: richest fifth
10% 20% 30% 40% 50%
2008 to 2012 2012 to 2014

JRF – UK Poverty 2017
80
Housing, health and relationships
80
Healthy life expectancy
The lifelong association between health and poverty culminates in large differences in the healthy life expectancy of those with different incomes. Data limitations mean that these are measured according to the level of deprivation of the area people live in, rather than their household income. Comparisons between the countries of the UK should be treated with caution since each has its own Index of Multiple Deprivation, which is based on relative deprivation within that country rather than across the UK.
Overall, people living in more deprived areas have a lower healthy life expectancy than those in less deprived areas. The difference between the most recent healthy life expectancies in the least and most deprived fifth of areas was highest for men in Scotland, at 18 years, but in all parts of the UK it was more than 12 years for both men and women.
Healthy life expectancy at birth by quintile of area deprivation (England 2013–15, Northern Ireland 2012–14, Wales 2010–14, Scotland 2009–13)
RelationshipsThe relationships people have with family, friends and wider social networks are crucially important to most people’s lives. Support drawn from these sources plays an important role for many people, enabling them to cope with adversity, get by when in poverty or other difficulties and, for some, improving their circumstances and prospects.35 Relationships with family and wider social networks are closely linked to factors including income, geography and ethnicity.49
Relationships between parents (whether living together or not) and between parents and children have a major impact on children’s wellbeing and development, as well as on the family’s income and the wellbeing of the adults involved.35 Relationships marked by conflict can also have negative impacts on both children and adults. The stress of living on a low income can be linked to relationship breakdown in couples, and between parents and children. At the extremes, those who experience domestic abuse are at high risk of poverty (in addition to the serious risk to their physical and mental health), both during and after these traumatic experiences. There is some data available on the prevalence of domestic abuse between partners in different income groups, discussed below. Research suggests that there are also links between child abuse and neglect and poverty,50 but there is little data available to monitor those links.
Source: Healthy life expectancies by Index of Multiple Deprivation (IMD): England, 2013 to 2015, ONS; Scottish Public Health Observatory;Public Health Wales Observatory; Health Inequalities, Department of Health, Northern Ireland
0
Healthy life expectancy (years)
England: most deprived quintile
England: total
England: least deprived quintile
Scotland: most deprived quintile
Scotland: total
Scotland: least deprived quintile
Wales: most deprived quintile
Wales: total
Wales: least deprived quintile
Northern Ireland: most deprived quintile
Northern Ireland: total
Northern Ireland: least deprived quintile
30 402010 50 60 70 80
Men Women

JRF – UK Poverty 2017
81
Housing, health and relationships
81
Many people draw on their social networks for material support, information and advice, and opportunities to find work or training. However, living in poverty can also affect the family and wider social networks that people can draw on and sustain. Wider social networks can also be harder to develop and maintain for people on low incomes.49
Social isolation
Social isolation can be measured in many ways. Here the analysis is based on a question asking how many close friends people have, and focuses on the proportion of people who say they have no more than one. The proportion of people who say they have no or only one close friend is higher for those in lower-income groups than for better-off groups. It is also higher among those living in workless households (14%) than households where at least one person is in work (7%). The overall proportion of people who have no more than one close friend has decreased slightly since 2011–12, from 11% to 9%.
Adults with no more than one close friend by net household income and age group
Support networks
The analysis in this section is based on a question in the Understanding Society survey that asks whether respondents agree or disagree that ‘if I needed advice about something I could go to someone in my neighbourhood’.
The analysis examines respondents who agree or strongly agree with the statement. In 2014–15, 54% of adults said there was someone in the neighbourhood they could go to for advice. The proportion was higher among those in the poorest two-fifths of the population. The pattern that people in poorer households were more likely to agree that they could get advice was more pronounced among pensioners. This age group was also more likely as a whole to agree: 67% of pensioners compared with 49% of 16- to 64-year-olds in 2014–15.
Further work is needed to interpret this pattern and explore the range of sources of social support drawn on by people in different groups, and how far they feel that these meet their needs, including how far these are concentrated in a local area rather than being geographically spread.
The overall proportion of people who say there is someone they can go to for advice increased between 2011–12 and 2014–15 (from 50% to 54%), although this reverses a decrease between 2009–10 and 2011–12 (from 54% to 50%).
Source: Understanding Society
0%
Percentage
All adults (16 and over)
Working-age (16–64)
Working-age: poorest fifth
Working-age: second poorest fifth
Working-age: second richest fifth
Working-age: middle fifth
Working-age: richest fifth
Pensioners (65 and over)
Pensioners: poorest fifth
Pensioners: second poorest fifth
Pensioners: second richest fifth
Pensioners: middle fifth
Pensioners: richest fifth
5% 10% 15% 20% 25%
2011–12 2014–15

JRF – UK Poverty 2017
82
Housing, health and relationships
82
Adults who agree that they could go to someone in their neighbourhood for advice
Relationships between children and parents
Measuring the nature and quality of relationships between children and parents is complex. Here, the analysis focuses on situations where children aged between 10 and 15 report that they quarrel with at least one parent more than once a week, and hardly ever discuss important issues with either parent. This is defined as a poor relationship between the child and parent.
There is some association between these issues and income. The proportion of children reporting that they have a poor relationship with their parents is somewhat higher for those in the poorest fifth of the population (9%), compared with those in the richest two-fifths (5%). This has remained steady for the last few years.
UK children aged 10 to 15 with a poor relationship with parents, by net household income 2013–14
Source: Understanding Society
0%
Percentage
All adults (16 and over)
Working-age (16–64)
Working-age: poorest fifth
Working-age: second poorest fifth
Working-age: second richest fifth
Working-age: middle fifth
Working-age: richest fifth
Pensioners (65 and over)
Pensioners: poorest fifth
Pensioners: second poorest fifth
Pensioners: second richest fifth
Pensioners: middle fifth
Pensioners: richest fifth
30% 40%20%10% 50% 60% 70% 80%
2011–12 2014–15
Source: Youth Panel, Understanding Society
0%
All
Poorest fifth
Second poorest fifth
Middle fifth
Richest fifth
Second richest fifth
2% 4%
Children aged 10 to 15
6% 8% 10%

JRF – UK Poverty 2017
83
Housing, health and relationships
83
Relationship distress
Relationship distress is a concept developed by the charity Relate and used by the Department for Work and Pensions in the Improving Lives report.51 A couple family is defined as experiencing relationship distress if they say that most or all of the time they consider divorce, regret living together, quarrel or get on each other’s nerves when asked about their relationship with their partner.
Overall, 7% of parents living in a couple report relationship distress. This varies slightly by income, being higher among parents in the poorest two-fifths of the population.
Parents in couple families who report that their relationship is distressed, by net household income 2013–14
Relationship separation
When couples with children separate there is often an impact on their financial circumstances. Separation can lead to poverty for both parents but the risk of persistent poverty is greater for the parent who continues to live with the children.52 38% of children in poverty live in a lone parent family.53
Analysis of family circumstances before couples separate can give a greater understanding of the links between separation and income. Of those families who were living as a couple in 2009–10 and who separated at some point in the subsequent five years, those on lower incomes (in the poorer two-fifths) were more likely to separate.
Source: Understanding Society
0%
All
Poorest fifth
Second poorest fifth
Middle fifth
Richest fifth
Second richest fifth
2% 4% 6% 8% 10% 12%
Parents in couple families

JRF – UK Poverty 2017
84
Housing, health and relationships
84
Couple parents who separated over a five-year period, by net household income, 2009–10 to 2014–15
Domestic abuse
Women on low incomes are at greater risk of domestic violence and abuse than those with higher incomes.35 This link is complex. Financial stress can have negative effects on couple and family relationships, while economic dependency can trap people in abusive relationships. Domestic abuse can also increase the risk of poverty where someone is prevented from working by ill-health or by their partner.
Adults who were victims of domestic abuse in the previous year, by area deprivation summary (England and Wales 2015/16; Scotland 2014/15)
Source: Understanding Society
0%
All
Poorest fifth
Second poorest fifth
Middle fifth
Richest fifth
Second richest fifth
2% 4% 6% 8% 10%
Couple parents
Source: Crime Survey for England and Wales, Scottish Crime and Justice Survey
0%
England and Wales – women aged 16-59in most deprived 20%
England and Wales – women aged 16-59in middle 60%
England and Wales – men aged 16-59in most deprived 20%
England and Wales – men aged 16-59in middle 60%
England and Wales – men aged 16-59in least deprived 20%
Scotland – adults aged 16+in most deprived 15%
Scotland – adults aged 16+in other 85%
England and Wales – women aged 16-59in least deprived 20%
2% 4% 6% 8% 10% 12%
Percentage

JRF – UK Poverty 2017JRF – UK Poverty 2017
Drivers of future poverty
Summary 86 Education 87 Financial resilience: savings, debt and pensions 96
This chapter examines some of the factors that can contribute to the future risk of poverty, or protect against it. First, children’s educational attainment, which is the strongest predictor of poverty in adulthood, then changes in the qualifications held by working-age adults across the UK. The chapter then sets out the extent to which people in different groups have savings, which can help them to meet unexpected costs or weather income shocks. Likewise, the proportion of people who have problem debts can be both an indicator of financial strain, and lower living standards, even when incomes rise. Finally, the chapter sets out the proportion of people who are building up a pension, which can protect against poverty in later life.

JRF – UK Poverty 2017
86
Drivers of future poverty
86
Drivers of future povertySummaryThere are several factors that affect the future of children who experience poverty, and the chances of working-age adults experiencing poverty later in their lives. Many of these factors not only contribute to the risk of future poverty, they are also, at least to some extent, a consequence of current poverty. Living in poverty as a child increases the risk of having low attainment at school. Adults in poverty, and those in low-paid jobs, are less likely to receive training and to progress into better jobs than those who are better paid. People in low-income households are less likely to have access to the internet and to use it regularly. Adults on low incomes are less likely to save money or pay into a pension. The analysis below focuses on two areas where there is good evidence of a link with future prospects: education and financial resilience.
Research shows that the biggest driver of future poverty is the educational attainment of children when they leave full-time education.35 This has a major impact on their chances of being employed and of earning enough to avoid poverty as adults. There is also strong evidence that children growing up in poverty tend to have lower attainment than those who do not – known as the ‘attainment gap’. Similarly, among adults, both employment and earnings are linked to qualifications. Basic skills, including literacy, numeracy, and digital skills, can play an important part in enabling people to access work, public services and deals that enable them to afford essential goods and services. The analysis below uses available data to examine trends in educational attainment among children and adults, and internet use and access across the population. There is an unfortunate lack of recent data about adult literacy and numeracy, meaning that it is not possible to present up-to-date trends in these areas.
The level of financial resilience among those on low incomes can be seen in the data on the level of savings, debt and pension accumulation in this group. Having some savings can be an important buffer to cover unexpected fluctuations in income and avoid having to take on high-cost credit to meet day-to-day expenses. Likewise, getting into debt by falling behind with bills can make it much harder for someone to reach a reasonable living standard even if their income increases. Building up a pension is an important factor affecting someone’s risk of poverty in later life.
The proportion of families who have no savings has risen in the last 10 years, and is very high among those in the poorest fifth of the population. The proportion of households who are behind with bills or credit payments has decreased over time, but remains much higher among those on low incomes. The overall proportion of people paying into a pension has increased since 2012, but this increase has been concentrated among full-time employees – part-time employees and self-employed people remain unlikely to have a pension. It has also been weaker among those on lower incomes – more than two-thirds of people in the poorest fifth of the population still do not have a pension.

JRF – UK Poverty 2017
87
Drivers of future poverty
87
EducationChanges to education systems, assessment and curriculums make it difficult to be certain about changes in attainment over time. However, among children and young people, overall attainment seems to have increased across the whole of the UK. The gap between the attainment of students from richer and poorer backgrounds in each part of the country has, however, remained stubbornly large. The analysis below examines trends in attainment and in the attainment gap between children from richer and poorer backgrounds. In England and Scotland, it is possible to examine this gap among children aged five, 11 and 16. In Wales, information is available for children aged 11 and 16. In Northern Ireland, data is only published for children aged 16. Understanding changes over time is difficult due to changes in educational systems and attainment measures. Variations in the education systems of England, Wales, Scotland and Northern Ireland also mean that it is difficult to make direct comparisons.
The educational profile of the adult population has improved considerably over the last 20 years. Far fewer adults have no qualifications and far more have a degree or higher qualification. The proportions of those with GCSE or equivalent and with A-levels or equivalent qualifications has changed far less. However, there is still a significant minority of the adult population with no or very low qualifications. In addition, the link between qualifications and pay appears much weaker for part-time than for full-time workers – part-time workers with the equivalent of GCSEs or A-levels do not have higher pay than those with no qualifications.
Internet use and access has increased across the whole population, but those in the poorest two-fifths are still much less likely to have internet access or to use it regularly than those in the rest of the population.
Children’s education
The data suggests that attainment overall has risen in all four parts of the UK but that the gap in attainment between children from richer and poorer backgrounds remains stubbornly large.
In England, the proportion of children reaching a good level of development at age five has increased, but the attainment gap has remained fairly constant at 20 percentage points. The attainment gap remains fairly constant through primary school, meaning that the difference in attainment between those from richer and poorer backgrounds remains around 20 percentage points at age 11. This gap widens through secondary school, to around 28 percentage points by age 16 and 25 percentage points at age 19.
In Wales, the attainment gap at age 11 between children from richer and poorer backgrounds has fallen in recent years, from 26 percentage points to 14. At age 16, however, the attainment gap is 31 percentage points, with only a slight fall since 2010.
In Scotland, children aged five living in the most deprived areas were 16 percentage points less likely to reach the expected standard in reading, and 14 percentage points less likely in numeracy, than those living in the least deprived areas. By age 11, these gaps increased to more than 20 percentage points. They remained at this level in the results of school leavers (age 16), having fallen from 33 percentage points in 2009/10.
In Northern Ireland, the attainment of children aged 16 from poorer backgrounds is about 20 percentage points lower than those from better-off families.

JRF – UK Poverty 2017
88
Drivers of future poverty
88
England
At the Early Years Foundation Stage in England, the percentage of children reaching a good level of development increased each year from 2008 to 2016 but the percentage point gap between those receiving free school meals and others has remained fairly constant at around 19 percentage points.
Percentage of children in England reaching a good level of development at the end of the Early Years Foundation Stage by whether receiving free school meals (FSM), 2008–2016
At age 11 (the end of Key Stage 2 in England), changes in what is measured mean that a consistent time series is not available. However, in the most recent years the achievement gap between disadvantaged and other pupils has consistently been around 20 percentage points, and the same is true of the gap between pupils eligible for free school meals and other pupils.
Percentage of pupils in England reaching the expected level at Key Stage 2 by whether receiving free school meals (FSM), 2008–2016
The percentage point gap between disadvantaged and non-disadvantaged pupils was consistently wider at Key Stage 4 (28 percentage points) than at Key Stage 2 (20 percentage points) between 2012 and 2016.
Chi
ldre
n
80%
0%
60%
40%
10%
20%
30%
50%
70%
2008 20102009 2011 2012 2013 2014 2015 2016
All otherEngland FSM Gap between FSM and all other
Source: Department for Education
Break in the time series
Pupi
ls
90%
0%
60%
40%
10%
20%
30%
50%
70%
80%
2008 20102009 2011 2012 2013 2014 2015 2016
Non-FSMEngland FSM Gap between FSM and all other
Source: Department for Education
Breaks in the time series

JRF – UK Poverty 2017
89
Drivers of future poverty
89
Percentage of pupils in England achieving five or more A*–C grades at GCSE and equivalent, including English and maths, at the end of Key Stage 4, by whether disadvantaged, 2010–2016
Among 19-year-olds in England, the gap between pupils receiving free school meals and other pupils has remained fairly constant at 24 to 25 percentage points in each year from 2008 to 2016, having been slightly higher in the years immediately before this.
Percentage of pupils in England achieving National Qualifications Framework Level 3 by the age of 19 by whether receiving free school meals (FSM), 2005–2016
Pupi
ls
80%
0%
60%
40%
10%
20%
30%
50%
70%
2010 2011 2012 2013 2014 2015 2016
All otherEngland Disadvantaged pupils Gap
Source: Department for Education
Break in the time series
Pupi
ls
70%
0%
60%
30%
10%
20%
40%
50%
2005 2006 2007 2008 2009 2010 2011 2012 2013 2014 2015 2016
All otherEngland (state-funded at 16) GapFSM
Note: The measure of whether a pupil is receiving free school meals is based on their status at the end of Key Stage 4.
Source: Department for Education
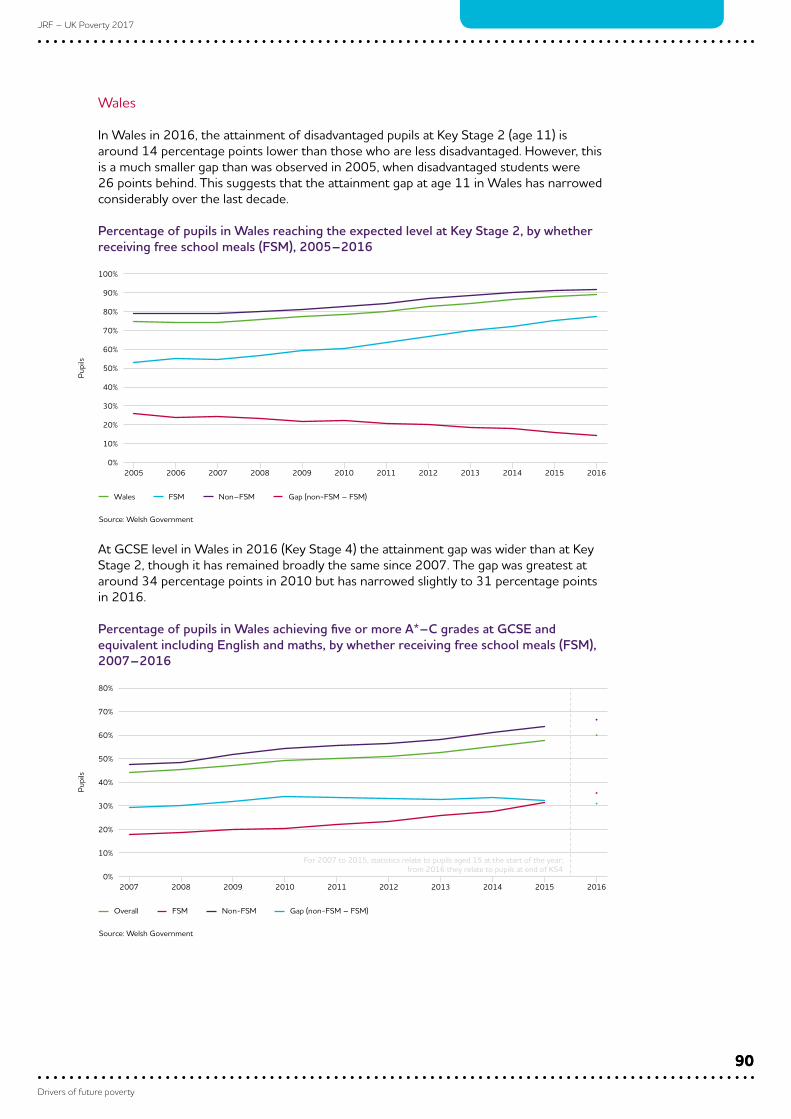
JRF – UK Poverty 2017
90
Drivers of future poverty
90
Wales
In Wales in 2016, the attainment of disadvantaged pupils at Key Stage 2 (age 11) is around 14 percentage points lower than those who are less disadvantaged. However, this is a much smaller gap than was observed in 2005, when disadvantaged students were 26 points behind. This suggests that the attainment gap at age 11 in Wales has narrowed considerably over the last decade.
Percentage of pupils in Wales reaching the expected level at Key Stage 2, by whether receiving free school meals (FSM), 2005–2016
At GCSE level in Wales in 2016 (Key Stage 4) the attainment gap was wider than at Key Stage 2, though it has remained broadly the same since 2007. The gap was greatest at around 34 percentage points in 2010 but has narrowed slightly to 31 percentage points in 2016.
Percentage of pupils in Wales achieving five or more A*–C grades at GCSE and equivalent including English and maths, by whether receiving free school meals (FSM), 2007–2016
Pupi
ls
100%
0%
80%
60%
30%
10%
20%
40%
50%
70%
90%
2005 2006 2007 2008 2009 2010 2011 2012 2013 2014 2015 2016
Non–FSMWales FSM Gap (non-FSM – FSM)
Source: Welsh Government
Pupi
ls
80%
0%
60%
40%
10%
20%
30%
50%
70%
2007 2008 20102009 2011 2012 2013 2014 2015 2016
Non-FSMOverall Gap (non-FSM – FSM)FSM
Source: Welsh Government
For 2007 to 2015, statistics relate to pupils aged 15 at the start of the year;from 2016 they relate to pupils at end of KS4

JRF – UK Poverty 2017
91
Drivers of future poverty
91
Scotland
Data for Scottish children at age five is only available for 2015, so trend analysis is not possible. Increasing deprivation was strongly associated with lower attainment, with gaps of 16 percentage points and 14 percentage points between children from the least, and the most, deprived areas for reading and numeracy respectively.
Percentage of children in Scotland at age five reaching the required Primary 1 standard in numeracy and reading by level of deprivation of area, 2015
At age 11 in Scotland, there continued to be marked differences in performance based on the deprivation of the area a child lives in. In 2016, the attainment gap between the most and least deprived areas was 21 percentage points for reading and 22 points for numeracy.
Percentage of children in Scotland at age 11 reaching the required Primary 7 standard in numeracy and reading, by level of deprivation of area, 2016
* Scottish Index of Multiple Deprivation
Source: Scottish Government
0%
Children
SIMD* quintile 1 – most deprived
SIMD quintile 2
SIMD quintile 3
SIMD quintile 4
SIMD quintile 5 – least deprived
Overall
Gap (Q5 – Q1)
SIMD* quintile 1 – most deprived
SIMD quintile 2
SIMD quintile 3
SIMD quintile 4
SIMD quintile 5 – least deprived
Overall
Gap (Q5 – Q1)
20%10% 30% 40% 50% 60% 70% 80% 90% 100%
Num
erac
yRe
adin
g
* Scottish Index of Multiple Deprivation
Source: Scottish Government
0%
Pupils
SIMD* quintile 1 – most deprived
SIMD quintile 2
SIMD quintile 3
SIMD quintile 4
SIMD quintile 5 – least deprived
Overall
Gap (Q5 – Q1)
SIMD* quintile 1 – most deprived
SIMD quintile 2
SIMD quintile 3
SIMD quintile 4
SIMD quintile 5 – least deprived
Overall
Gap (Q5 – Q1)
20%10% 30% 40% 50% 60% 70% 80% 90% 100%
Num
erac
yRe
adin
g

JRF – UK Poverty 2017
92
Drivers of future poverty
92
The percentage of school leavers in Scotland achieving one or more Level 5 qualifications increased from 77% in 2009/10 to 86% in 2015/16. The gap between the least and most deprived areas has decreased from 33 to 20 percentage points in this period due to the improving performance of the most deprived groups.
Percentage of school leavers in Scotland who achieved one or more qualification at Scottish Credit and Qualifications Framework Level 5 or better, by level of deprivation of area
Northern Ireland
Northern Ireland results for pupils aged 16 who are eligible for free school meals were only available for four years, from 2013 to 2016, and only two of these years are comparable with the previous year due to a change in eligibility criteria. There was a considerable decline in the attainment gap between 2014 and 2015, but this is likely to be due to a change in the eligibility for free school meals. Looking more broadly between comparable periods (2013 to 2014 and 2015 to 2016), there was evidence for a slight narrowing in the attainment gap, by about half a percentage point across each period.
Percentage of pupils in Northern Ireland achieving five or more A*–C grades at GCSE and equivalent including English and maths 2009–16, and by whether receiving free school meals, 2013–16
Scho
ol le
aver
s
100%
0%
80%
60%
30%
10%
20%
40%
50%
70%
90%
2009/10 2010/11 2011/12 2012/13 2013/14 2014/15 2015/16
Least deprived fifthAll leavers Most deprived fifth Gap (least deprived – most deprived)
Source: Scottish Government
Pupi
ls
80%
0%
60%
40%
10%
20%
30%
50%
70%
2009 2010 2011 2012 2013 2014 2015 2016
Overall FSM Gap (Overall – FSM)
Source: Department of Education, Northern Ireland
From 2015, there was a change in the free school meal (FSM) eligibility criteria, resulting in an increasein the number of recipients. Hence FSM statistics before this date are not directly comparable

JRF – UK Poverty 2017
93
Drivers of future poverty
93
Adult skills
Since 1996, there has been a large decrease in the proportion of working-age people with no qualifications and an increase in the proportion with higher education qualifications across the whole country.
Northern Ireland stands out as having started the period with the highest proportion of adults with no qualification (30%), and still having a much higher proportion in 2016 (16%) despite a reduction of nearly half.
By 2016, fewer than one in 10 working-age adults in England, Scotland and Wales had no qualifications, a reduction of more than half. Wales had caught up with England and Scotland by this time, having had a higher proportion of adults with no qualifications in 1996.
The proportion of adults with higher education had also nearly doubled in England, Wales and Scotland, resulting in 45% of adults in Scotland, 38% in England and 35% in Wales having this qualification level. Northern Ireland had the lowest proportion with higher education qualifications in 1996 (at 17%) and the lowest in 2016 (at 31%).
Working-age population by highest level of qualification 1996, 2006 and 2016
Young people not in education, employment or training
Young people who spend time not in education, employment or training (NEET) are at high risk of future unemployment, low earnings and poverty.54
In 2017, 10% of people aged 16 to 24 in the UK were not in education, employment or training, falling from 14% in 2007. Young women and people from the Pakistani, Bangladeshi, mixed ethnicity and White groups were the most likely to be classified as NEET.
Source: Labour Force Survey (JRF Analysis)
0%
Percentage
England: 1996
England: 2006
England: 2016
Wales: 1996
Wales: 2006
Wales: 2016
Scotland: 1996
Scotland: 2006
Scotland: 2016
Northern Ireland: 1996
Northern Ireland: 2006
Northern Ireland: 2016
30% 40%20%10% 50% 60% 90%80%70% 100%
Degree or equivalent GCSE grades A*-C or equivalentGCE, A-level or equivalentHigher education
Other qualifications No qualifications

JRF – UK Poverty 2017
94
Drivers of future poverty
94
Percentage of UK 16- to 24-year-olds not in education, employment or training by nation, first quarter 2007 and first quarter 2017
Percentage of UK 16- to 24-year-olds not in education, employment or training by gender and by ethnicity, first quarter 2007 and first quarter 2017
In England, Wales and Scotland, the proportion of young people classified as NEET fell between 2007 and 2017. In England, this is probably a result of all young people in England being required to continue in education or training to at least their 18th birthday since 2014. In Northern Ireland, the proportion of young people recorded as being NEET has risen since 2007.
Internet access and use
Having access to the internet, and the skills and confidence to use it, has become an important way of accessing work, training and services. Those who do not have access or do not use the internet are at higher risk of missing out on opportunities to improve their income or reduce costs.35
Source: Labour Force Survey
0%
16- to 24-year-olds
UK
England
Wales
Northern Ireland
Scotland
2% 4% 6% 8% 10% 12% 14% 16% 18%
January to March 2007 January to March 2017
Source: Labour Force Survey
0%
16- to 24-year-olds
UK
Male
Female
White
Pakistani/Bangladeshi
Black
Indian
Mixed
Other
2% 4% 6% 8% 10% 12% 14% 16% 18% 20%
January to March 2007 January to March 2017

JRF – UK Poverty 2017
95
Drivers of future poverty
95
A significant majority of people in Great Britain (87%) and in Northern Ireland (79%) have access to the internet. These proportions have increased markedly since 2002, up from 43% in Great Britain and 32% in Northern Ireland. However, access is still linked to income with the poorest 20% being significantly less likely to have access.
The proportion accessing the internet on a daily basis has risen considerably from just over half the population of Great Britain (57%) in 2009 to more than three-quarters in 2015 (77%). Similarly, growth in daily access in Northern Ireland went up from around a quarter (26%) in 2008/09 to more than two-thirds (68%) in 2014/15. Daily use varies greatly by age, but is also associated with income; the richest 20% were roughly twice as likely to report daily use than the poorest 20% in Northern Ireland and 50% more likely in Great Britain.
Percentage of Great Britain households with internet access, by gross individual income
Percentage of adults who use the internet daily (NI) and daily or almost daily (GB), by gross household income (NI) and gross individual income (GB), 2009 and 2015
Hou
seho
lds
100%
0%
80%
60%
30%
40%
20%
10%
50%
70%
90%
2002 20152009
Richest fifth Second richest fifthGB: all households Middle fifth Poorest fifthSecond poorest fifth
Source: Opinions and Lifestyle Survey and Continuous Household Survey, Northern Ireland
Note: Northern Ireland data is for financial years 2008/09 and 2014/15. The questions for Great Britain and Northern Ireland are not identical(as the chart title indicates).
Source: Opinions and Lifestyle Survey and Continuous Household Survey, Northern Ireland
0%
Adults
GB: Total
GB: poorest fifth
GB: second poorest fifth
GB: middle fifth
GB: second richest fifth
GB: richest fifth
NI: Total
NI: poorest fifth
NI: second poorest fifth
NI: middle fifth
NI: second richest fifth
NI: richest fifth
10% 20% 30% 40% 50% 60% 70% 80% 90% 100%
2009 2015

JRF – UK Poverty 2017
96
Drivers of future poverty
96
Financial resilience: savings, debt and pensionsIn 2015/16, six in 10 of those in the poorest fifth of households had no savings at all, while a further one in nine had savings less than £1,500. This is in stark contrast to those in the better-off parts of the population: most households in the richest three-fifths of the population have savings of more than £1,500.
Between 1995/96 and 2005/06, the proportion of those with no savings at all fell in all income levels. However, in the most recent decade these proportions rose again to a higher level than was the case 20 years ago.
The proportion of households with some savings but not more than £1,500 rose between 1995/96 and 2005/06 before falling back to an even lower level in 2015/16. In 1995/96, 18% of those in the poorest fifth had some savings, but less than £1,500. By 2005/06, this rose to 21%, but fell to only 12% by 2015/16.
Percentage of households with total savings and investments of less than £1,500
Just under one in 10 households report having had problem debt, defined by the Family Resources Survey as being behind with any household bill or credit commitment. This is much higher among those in the poorest fifth compared with the rest of the population; 20% of those in the poorest fifth report problem debt, 11% of the second poorest fifth and 1% of the richest fifth.
However, it is important to note that this measure of problem debt does not include debt incurred on store cards, mail order payments and informal loans from friends or family. It does include electricity, gas and other household fuel bills, Council Tax, phone bills, hire purchase, water rates, and rent or mortgage payments. From 2012/13, the survey also included rent, mortgage and loan payments, and from 2015/16 credit card or other loan repayments.
Hou
seho
lds
80%
70%
50%
20%
0%
40%
30%
10%
60%
Poorest
fifth
Second p
oorest
fifth
Second r
iches
t fifth
Middle
fifth
Riches
t fifth
Poorest
fifth
Second p
oorest
fifth
Second r
iches
t fifth
Middle
fifth
Riches
t fifth
Poorest
fifth
Second p
oorest
fifth
Second r
iches
t fifth
Middle
fifth
Riches
t fifth
Note: 1995/96 data for GB only. GB percentages similar to UK in later years. Other sources of information about household savings are available,but this analysis uses the Family Resources Survey because of the availability of a 20-year time series.
Source: Family Resources Survey
No savings
1995/96 2005/06 2015/16
Savings of greater than zero but less than £1,500

JRF – UK Poverty 2017
97
Drivers of future poverty
97
Changes in problem debt between 2005/06 and 2012/13 do not appear to be closely associated with income, however these percentage point changes are very small so should be interpreted with caution. Between 2012/13 and 2015/15, changes to problem debts are highly correlated with income.
Proportion of UK households behind with any household bill or credit commitment by quintile of household income 2015/16, showing percentage point changes for two periods before this date
The proportion of the population contributing to a pension scheme, as an employee or self-employed, increased from 45% to 55% following the introduction of a new pension scheme and auto-enrolment for employees in 2012.55 However, there are large variations in the proportions contributing to a pension scheme in different groups:
• only 30% of people in work in the poorest fifth of the population have a pension, compared with 67% of those in the richest fifth
• employees are far more likely to have a pension (60%) than the self-employed (18%); the increase after 2012 was concentrated among employees, while the rate actually fell for self-employed people
• people working full-time hours are more likely to have a pension (60%) than those working part-time (37%).
-4%
Percentage of households
2015–16
Change 2005–06 to 2012–13
Change 2012–13 to 2015–16
0%-2% 2% 4% 6% 8% 12% 16% 18% 20%14%10% 22%
Note: Different items were included for each time period and cannot be directly compared. In 2012/13 rent, mortgage and loan payments wereadded (these were excluded from change data for 2005/06 to 2012/13); in 2015/16 credit card payments repayments was added.
Source: Family Resources Survey
All Middle fifthSecond poorest fifthPoorest fifth
Second richest fifth Richest fifth

JRF – UK Poverty 2017
98
Drivers of future poverty
98
Percentage of working-age people in employment in a pension scheme, by employment status, hours worked and equivalised household income, 2015/16
Source: Family Resources Survey
0%
Working-age adults
Part-time
Poorest fifth
Second poorest fifth
Middle fifth
Second richest fifth
Richest fifth
Full-time
Self-employed
Employee
All
20%10% 30% 40% 50% 60% 70% 80%

99
JRF – UK Poverty 2017
99
Conclusion
ConclusionOver the last 20 years the UK has succeeded in reducing poverty significantly among those groups traditionally most risk – pensioners and families with children.
These reductions were achieved in three main ways:
• the choices of successive governments to increase the support given to these groups through benefits, tax credits and pensions
• rising employment
• increasing home-ownership.
However, very little progress has been made in reducing poverty among working-age households without children. Poverty rates among the groups where the UK was successful in reducing poverty – pensioners and some types of families with children – have started to increase again. Poverty rates have risen for pensioners and for families with children whether they are in work or not. The continuing rise in employment is no longer leading to lower poverty. Support for low-income pensioners through the Pension Credit Guarantee has failed to keep up with prices and growth in occupational pensions has tended to benefit better-off pensioners more than those on lower incomes.
The prospects for solving UK poverty currently look worrying. Changes to benefits and tax credits for working-age families are reducing the incomes of many of those on low incomes. High housing costs continue to reduce the amount those in poverty have to meet other needs. Inflation is rising and is higher for those on lower incomes than for better-off groups. This squeeze on living standards is also storing up problems for the future. The majority of those on low incomes have no savings and are not building up a pension. In addition, the decreasing proportion of the working-age population buying their own home means that in the future more older people are likely to still be renting than is currently the case.
The UK’s success in increasing employment rates means that many of those who are now out of work are disabled or have health conditions, have young children or are caring for disabled adults; some experience several of these circumstances. This makes it far harder for them to find and sustain work, and more likely that when they do get work it is low-paid and part-time. Improving the opportunities for disabled people, carers and those working part-time to not only find work but earn more could greatly reduce the pressure on the benefit and tax credit system. Reducing housing costs and increasing the availability of truly affordably housing would also contribute to this.
Education and skills are the strongest predictors of future poverty. Equipping young people and adults with the qualifications they need to get a secure, decently paid job are essential building blocks for raising living standards. However, while overall attainment is increasing, the gap in attainment between students from richer and poorer backgrounds remains stubbornly large.

100
JRF – UK Poverty 2017
100
Conclusion
The skills profile of the adult population has improved considerably over the last 20 years, enabling more people to get work and improve their earnings. But there is still a group with no or low qualifications who are at an increasing disadvantage in the labour market. Qualifications are also far less effective in improving pay prospects for people working part-time. Part-time workers are paid less than their full-time counterparts, regardless of how high their qualifications are. Part-time workers also see no pay gains from qualifications until they reach degree-level – having the equivalent of GCSEs or A-levels does not lead to higher pay than for those with no qualifications at all for those in part-time work.
The impact of poverty on physical and mental health and on relationships within families adds to the disadvantages facing those growing up or living on low incomes, and makes it harder for them to move out of poverty. Enabling those in poverty to improve their incomes and reduce their costs, as well as addressing the negative impacts of low incomes, would help to prevent future poverty.
Solving poverty in the UK will require urgent action in five areas:
1. Reform of Universal Credit so people keep more of what they earn and a lifting of the working-age benefits freeze so incomes keep up with prices.
2. Reduce the cost of living, particularly housing, for those on low incomes.
3. Improve education and skills, especially among children from low-income backgrounds and adults in low-paid work.
4. Work with employers and business to create more and better jobs where they are needed, and to offer more opportunities and better pay to people who currently struggle to enter and gain from work – particularly disabled people, those caring for adults or children, and part-time workers.
5. Work with communities and service providers to improve health, family relationships and social support to reduce the damage done by poverty and improve prospects.

101
JRF – UK Poverty 2017
101
Conclusion
Notes1 Average incomes refer to median household income.
2 Fitzpatrick, S, Bramley, G, Sosenko, F, Blenkinsopp, J, Johnsen, S, Littlewood, M, Netto, G and Watts, B (2016) Destitution in the UK. York: Joseph Rowntree Foundation. Available at: www.jrf.org.uk/report/destitution-uk.
3 This is different to the definition of persistent poverty used by the Department for Work and Pensions which defines someone as being in poverty if they have been in poverty for three of the last four years, regardless of whether they are currently in poverty.
4 Office of National Statistics (2017) Persistent poverty in the UK and EU: 2015. Available at: www.ons.gov.uk/peoplepopulationandcommunity/personalandhouseholdfinances/incomeandwealth/articles/persistentpovertyintheukandeu/2015.
5 Items included in a basket used to define material deprivation: to not have arrears on your mortgage or rent payments, hire purchase instalments or other loan payments; afford a one-week annual holiday away from home; afford a meal with meat, chicken, fish or a vegetarian equivalent every other day; be able to face unexpected financial expenses; afford a telephone or mobile phone; afford a colour television; afford a washing machine; afford a car; afford to keep the home adequately warm.
6 Brewer, M, Browne, J, Joyce, R and Sibieta, L (2010) Child poverty in the UK since 1998–99: Lessons from the past decade. London: Institute for Fiscal Studies. Available at: www.ifs.org.uk/wps/wp1023.pdf.
7 Bank of England Inflation Report, August 2017.
8 Hirsch, D (2017) How is public policy affecting households’ ability to reach minimum income requirements? Loughborough: Centre for Research in Social Policy, Loughborough University.
9 These rates of disability poverty have been calculated without including disability costs benefits in disabled individuals’ incomes, to provide a more realistic understanding of their standard of living. In standard poverty analysis, disabled individuals’ benefits are included in their income, but the costs these benefits are designed to meet are not, resulting in inflated living standards for disabled people. While there are some uncertainties with this method, it is regarded as appropriate for analysis of disability poverty, as evidenced by its use by the DWP for part of its Households Below Average Income publication. (For more, see Disability and poverty, www.npi.org.uk/files/3414/7087/2429/Disability_and_poverty_MAIN_REPORT_FINAL.pdf).
10 Analysis of poverty by ethnicity has been carried out using broad categories that can be tracked over time and are large enough to provide robust statistics.
11 Fisher, P and Nandi, A (2015) Poverty across ethnic groups through recession and austerity York: Joseph Rowntree Foundation. Available at: www.jrf.org.uk/report/poverty-across-ethnic-groups-through-recession-and-austerity.
12 Hood, A and Waters, T (2017) Living standards, poverty and inequality in the UK: 2016–17 to 2021–22. London: Institute for Fiscal Studies.
13 Pike, A, Lee, N, MacKinnon, D, Kempton, L and Iddawela, Y (2017) Job creation for inclusive growth in cities. York: Joseph Rowntree Foundation. Available at: www.jrf.org.uk/report/job-creation-inclusive-growth-cities.
14 Hurrell, A (2013) Starting out or getting stuck? An analysis of who gets stuck in low paid work – and who escapes. London: Resolution Foundation. Available at: www.resolutionfoundation.org/app/uploads/2014/08/Starting-out-or-getting-stuck-FINAL.pdf.

102
JRF – UK Poverty 2017
102
Conclusion
15 Padley, M and Hirsch, D (2017) A Minimum Income Standard for the UK. York: Joseph Rowntree Foundation. Available at: www.jrf.org.uk/report/minimum-income-standard-uk-2017.
16 Benefit sanctions (2016) London: National Audit Office. Available at: www.nao.org.uk/wp-content/uploads/2016/11/Benefit-sanctions.pdf.
17 Statistics show adverse sanction decisions. Source: DWP.
18 Hood, A and Joyce, R (2016) A tighter benefit cap. London: Institute for Fiscal Studies.
19 UK Housing Review 2017, Chartered Institute of Housing.
20 Adams, A and Levell, P (2014) Measuring poverty when inflation varies across households. York: Joseph Rowntree Foundation. Available at: www.jrf.org.uk/sites/default/files/jrf/migrated/files/poverty-inflation-households-full.pdf.
21 Davies, S, Finney, A and Hartfree, H (2016) The poverty premium - when low-income households pay more for essential goods and services. Bristol: University of Bristol. Available at: www.bristol.ac.uk/geography/research/pfrc/themes/finexc/poverty-premium.
22 Clarke, A, Hamilton, C, Jones, M and Muir, K (2017) Poverty, evictions and forced moves. York: Joseph Rowntree Foundation. Available at: www.jrf.org.uk/report/poverty-evictions-and-forced-moves.
23 Long, O and Ayrton, C (2017) Key changes to council tax support in 2017/18. London: New Policy Institute. Available at: www.npi.org.uk/publications/council-tax/key-changes-council-tax-support-201718.
24 The poverty line is calculated as 60% of median income, and so rises and falls in line with the median.
25 A new basic state pension was introduced from April 2016. Over the course of several decades, it will gradually reduce the number of people reliant on the Pension Credit Guarantee. So, for many years, the net income of low-income pensioners will still be determined by the level of the Pension Credit Guarantee.
26 In this analysis, the age of the pensioner couple is determined by the age of the oldest person in the couple.
27 For example Attendance Allowance, Disability Living Allowance, Personal Independence Payment.
28 Family Resources Survey data for Northern Ireland was not available until 2002/03.
29 Pensioners in couples are classified by the age of the oldest person in the couple.
30 Throughout this analysis, family age is defined by the age of the oldest person.
31 Significance tested at the 95% confidence level.
32 Employee earnings + self-employed income.
33 These calculations use the Office for National Statistics’ Retail Prices Index for pensioner households as the ONS does not publish a version of the Consumer Prices Index for pensioners.
34 Tunstall, R, Bevan, M, Bradshaw, J, Croucher, K, Duffy, S, Hunter, C, Jones, A, Rugg, J, Wallace, A and Wilcox, S (2013) The links between housing and poverty: an evidence review. London: Joseph Rowntree Foundation. Available at: www.jrf.org.uk/report/links-between-housing-and-poverty.
35 Joseph Rowntree Foundation (2016) UK poverty: causes, costs and solutions (2016). London: Joseph Rowntree Foundation. Available at: www.jrf.org.uk/report/uk-poverty-causes-costs-and-solutions.
36 Frey, J (2011) Northern Ireland House Condition Survey, main report. Belfast: Housing Executive.

103
JRF – UK Poverty 2017
103
Conclusion
37 A standard number of bedrooms is calculated for each household in accordance with its age/gender/marital status composition and the relationship of the members to one another. A separate bedroom is allowed for each married or cohabiting couple, any other person aged 21 or over, each pair of adolescents aged 10 to 20 of the same sex, and each pair of children under 10. Any unpaired person aged 10 to 20 is notionally paired, if possible, with a child under 10 of the same gender, or, if that is not possible, he or she is counted as requiring a separate bedroom, as is any unpaired child under 10. This notional standard number of bedrooms is then compared with the actual number of bedrooms (including bedsitters) available for the sole use of the household, and differences are tabulated. Bedrooms converted to other uses are not counted as available unless they have been denoted as bedrooms by the respondents; bedrooms not actually in use are counted unless uninhabitable. Households are said to be overcrowded if they have fewer bedrooms available than the notional number needed. Households are said to be under-occupying if they have two or more bedrooms more than the notional number needed.
38 The statutory standard is set out in the Housing Act 1985. See: Overcrowded housing (England) briefing paper Number 1013, 14 November 2016, House of Commons Library.
39 Unless otherwise stated, figures drawn from Fitzpatrick, S, Pawson, H, Bramley, G, Wilcox, S and Watts, B (2017) The homelessness monitor: England 2017. London: Crisis.
40 Department for Communities and Local Government, homelessness statistics 2017. Available at: www.gov.uk/government/statistical-data-sets/live-tables-on-homelessness.
41 Department for Communities and Local Government, homelessness statistics 2017. Available at: www.gov.uk/government/statistics/rough-sleeping-in-england-autumn-2016.
42 Analysis of households in temporary accommodation data from the Department for Communities and Local Government.
43 Fitzpatrick, S, Pawson, H, Bramley, G, Wilcox, S and Watts, B (2017) The homelessness monitor: England 2017. London: Crisis.
44 Homelessness statistics in Scotland 2016–17, Scottish Government. Available at: http://www.gov.scot/Publications/2017/06/8907/downloads.
45 Unless otherwise stated, figures drawn from Fitzpatrick, S, Pawson, H, Bramley, G, Wilcox, S and Watts, B (2017) The homelessness monitor: Wales 2017. London: Crisis.
46 Evaluation of homelessness legislation (Part 2 of the Housing Act (Wales) 2014) (2017), Welsh Government. Available at: http://gov.wales/statistics-and-research/evaluation-homelessness-legislation/?lang=en.
47 Welsh housing statistics, Table 91b, homeless households in temporary accommodation in Wales. Available at: https://statswales.gov.wales/Catalogue/Housing/Homelessness/Temporary-Accommodation.
48 Unless otherwise stated, figures drawn from Fitzpatrick, S, Pawson, H, Bramley, G, Wilcox, S and Watts, B (2016) The homelessness monitor: Northern Ireland 2016. London: Crisis.
49 Finney, N, Kapadia D and Peters S (2015) How are poverty, ethnicity and social networks linked? York: Joseph Rowntree Foundation. Available at: www.jrf.org.uk/report/how-are-poverty-ethnicity-and-social-networks-related.
50 Bywaters, P, Bunting, L, Davidson, G, Hanratty, J, Mason, W, McCartan, C and Steils, N. The relationship between poverty, child abuse and neglect: an evidence review (2016). York: Joseph Rowntree Foundation. Available at: www.jrf.org.uk/report/relationship-between-poverty-child-abuse-and-neglect-evidence-review.

104
JRF – UK Poverty 2017
104
Conclusion
51 Department for Work and Pensions (2017) Improving lives, helping workless families. Available at: www.gov.uk/government/uploads/system/uploads/attachment_data/file/621364/improving-lives-helping-workless-families-web-version.pdf.
52 Stock, L, Corlyon, J, Serrano CC and Gieve, M (2014) Personal relationships and poverty: an evidence and policy review. London: The Tavistock Institute.
53 Households Below Average Income.
54 Scottish Government (2015) Consequences, risk factors, and geography of young people not in education, employment or training (NEET) (2015) Edinburgh: Scottish Government. Available at: www.gov.scot/Publications/2015/10/6731/downloads.
55 Pension participation information from the Family Resources Survey before 2011/12 is not directly comparable to later data, as the latter has additional checks to ensure that only active pensions are included.

105
JRF – UK Poverty 2017
105
Appendix: UK poverty 2017: methodology
Appendix: UK Poverty 2017: methodologyUK poverty 2017 (‘the report’) provides information about long-term trends in poverty rates and underlying drivers of poverty. This methodology section includes the background to each of the key topics covered in the report, with details of data sources and explanations of the main concepts. It also describes the individual and family characteristics that have been used to break down statistics relating to these topics.
Poverty ratesThe main source of statistical information about people living in low-income households is Households Below Average Income (HBAI) from the Department for Work and Pensions (DWP). There is an annual HBAI statistical release1, the latest of which is for the 2015/16 financial year, accompanied by a detailed set of supporting data tables with a consistent time series dating back more than 20 years. The underlying, unpublished HBAI data can be accessed via the UK Data Service2 and is the source for much of the report’s analysis.
The poverty measure used in the report is, unless otherwise stated, the percentage of people in households with an income after housing costs (AHC) that is below 60% of the median household income. The household income is equivalised to ensure that income and, therefore, poverty rates, take account of different sizes and compositions of households.
IncomeHBAI uses data from the Family Resources Survey (FRS) to derive household income measures. The FRS provides additional information about the incomes and living circumstances of households and families in the UK, and is the source data for an annual publication.3 Further analysis of the FRS can be undertaken through the UK Data Service4
and some income analysis is included in the report.
Household income in the report includes earnings from employment; profit or loss from self-employment; state support (including state pensions); income from occupational and private pensions; investment income; and receipt of maintenance payments, educational grants and certain forms of income in kind. Household income is net of income tax, National Insurance and Council Tax payments, as well as of contributions to occupational pension schemes, maintenance payments, student loan repayments and parental contributions to non-resident students.
Income can be measured before or after housing costs (BHC or AHC). The income AHC measure used to derive the poverty rate subtracts costs such as rent (including the contribution of Housing Benefit income); water rates and charges; mortgage interest payments; structural insurance premiums; and ground rent and service charges. It is possible for a household to have a negative AHC income. The BHC measure includes Housing Benefit income and housing costs.

106
JRF – UK Poverty 2017
106
Appendix: UK poverty 2017: methodology
The report focuses on the AHC measure because it provides a clearer picture of the disposable income available to households to meet their needs once housing costs have been met. This enables greater understanding of the impact of changes in housing costs on living standards. It also avoids the problem that arises when using the BHC measure, that when rents increase and Housing Benefit rises to offset them, this is counted as an income rise even though the household is not increasing its disposable income.
The report includes information about employee earnings from two additional sources. The Annual Survey of Hours and Earnings (ASHE)5 is thought to be the most accurate source of information about the distribution of earnings in the UK because the information is provided by employers rather than being self-reported. The Labour Force Survey (LFS) is the key source of employment data (see below), but also allows the report to include analysis of pay by personal characteristics.
The report includes estimates of how incomes (and benefits) have changed in real terms by adjusting for inflation. For example, an annual percentage increase in income that is less than the annual inflation rate is a decrease in real terms. The inflation measure used is based on Office for National Statistics (ONS) consumer price inflation data.6
Employment and worklessnessThe Labour Force Survey (LFS) provides much of the content in the comprehensive monthly Labour Market Statistical Bulletins7 from the ONS and the report includes additional analysis of the LFS via the UK Data Service.8
Among the outputs of the LFS are the official estimates of the numbers and percentages of people in employment, unemployed or economically inactive and, because the survey has a lot of respondents and an extensive questionnaire, these measures can be analysed alongside many personal, household and geographic characteristics.
People in employment are those who are aged 16 and over and either:
• did paid work (as an employee or self-employed)
• had a job that they were temporarily away from
• were on government-supported training and employment programmes
• were doing unpaid work in a family business.
The LFS provides information about the industry and occupation of employment, whether it is full-time or part-time, and whether it is permanent or temporary. Respondents also answer further questions about their employment, such as whether they wish to change jobs or increase or decrease hours, and what their reasons for part-time or temporary working are.
The UK definition of unemployment matches that specified by the International Labour Organisation (ILO). This defines unemployed people as either:
• being without a job, having been actively seeking work in the past four weeks and available to start work in the next two weeks; or
• being out of work, having found a job and waiting to start it in the next two weeks.
107
JRF – UK Poverty 2017
107
Appendix: UK poverty 2017: methodology
Economically active people are defined as being either in employment or unemployed, with economically inactive people making up the remainder of the adult population. These include retired people; students; people looking after family and home; people who are sick and disabled (either long-term or temporarily); and discouraged workers, who state that their main reason for not seeking work is because they believe that there are no jobs available. Some economically inactive people have been seeking work but are not available to start immediately due to, for example, caring or study commitments, or sickness. Others want a job but have not recently sought work and this can be, again, due to their current commitments or circumstances.
The LFS allows for analyses of households as well as providing information about the economic status of individuals with the ONS publication Working and workless households in the UK9 being a key output. This provides information about the number of adults and children in households with at least one working-age person where no one is in employment. The HBAI dataset also includes information about people in and out of employment and features questions that allow analysis of reasons for not working.
BenefitsThe report includes information about the value and take-up of out-of-work and in-work benefits. The Institute for Fiscal Studies (IFS) provides a detailed set of spreadsheets10 for each type of benefit, and these are used in conjunction with data from the DWP Stat-Xplore tool11 and the Nomis official labour market statistics website12. The Stat-Xplore tool also provides information about benefit sanctions, benefit caps and the under-occupancy penalty.
As with incomes, the values of specific benefits are expressed within the report in real terms, adjusted to take account of inflation. The report also compares how the values of different benefits have changed over time compared with the HBAI measure of median household income after housing costs. In addition, it looks at the extent to which Housing Benefit meets the costs of housing, again using HBAI data.
ExpenditureThe report uses data from the Living Costs and Food Survey (LCF), which collects information on spending patterns and the cost of living that reflect household budgets. Key facts from the LCF are reported in the annual ONS publication Family spending in the UK13 and detailed analysis of the source data is available via the UK Data Service.14
The LCF includes an income quintile variable that enables analysis of the different percentages of spending on specific goods by different income groups, and an estimate of annual inflation for each group. The report also includes an analysis of housing costs by income quintile and tenure using HBAI data, also expressed as percentages of total spend. In addition, the report has a comparison of childcare costs with Consumer Prices Index (CPI) inflation using data sourced from the Family and Childcare Trust15 and income requirement data from the JRF Minimum Income Standards basket16, inflated to 2015 values.
Savings, pensions and debtThese topics are covered in the report’s Drivers of future poverty chapter and include analysis of underlying data from the Family Resources Survey. This source has been used because of the relatively long time-series of statistics. However, information about the proportion of households behind with any household bill or credit commitment is available for two non-comparable periods as different items were included in each. Methodological changes mean that the same is true for data about participation in pension schemes.

108
JRF – UK Poverty 2017
108
Appendix: UK poverty 2017: methodology
Education and skillsResponsibility for children’s education is a devolved responsibility so the statistics used for this topic are from a different source for England17, Scotland18, Wales19 and Northern Ireland20 and are inconsistent in scope and availability. In addition, changes to curriculums and definitions of pupils from poorer households mean that the availability of time-series data varies. Changes to measures, curriculum and other aspects of education systems also means that attainment over time within those jurisdictions is not always comparable over time. This is noted in the text and charts where relevant.
The report includes information about the highest qualification level of working-age people with data extracted from the Labour Force Survey and aggregated to consistent summary levels. The same source provides statistics about young people not in education, employment or training (NEET).
Statistics about internet use in Great Britain are from analysis of the ONS Opinions and Lifestyle survey21, while the Northern Ireland equivalent source is the Continuous Household survey22.
HousingAs well as information about the cost of housing, the report gives information about housing quality, overcrowding, evictions, repossessions and homelessness from published data. Because responsibility for many of these topics is devolved, there are different data sources for England23, Scotland24, Wales25 and Northern Ireland26. In addition, definitions are not always consistent between each nation, meaning that some statistics are not directly comparable across jurisdictions.
Health and relationshipsThe report includes analysis of data from the Understanding Society27 study (also known as the UK Household Longitudinal Study) to provide information about physical health, children’s mental health, adult experience of social isolation and support networks, and aspects of relationships.
Statistics about adult mental health in the report are based on analysis via English28 and Scottish29 health surveys. Similar surveys are not available for Wales or Northern Ireland.
The report also includes separate healthy life expectancy (HLE) data by area deprivation classification for England30, Scotland31, Wales32 and Northern Ireland33. HLE is the expected number of years in good health people would have if they experienced the same health status rates as observed in the period that the data relates to. The report also includes analysis of healthy eating using data from the National Diet and Nutrition Survey (NDNS).34
As well as analysis of relationship difficulties and separation using Understanding Society, the report includes domestic abuse data for England and Wales35 and for Scotland36 from the relevant national crime surveys.

109
JRF – UK Poverty 2017
109
Appendix: UK poverty 2017: methodology
Equivalisation of incomeThe report includes information about how factors vary across income groups in the population, mainly examining differences between quintiles, for example comparing the poorest fifth of the population with those who are better off.
In most cases, the analysis uses a measure of income that has been equivalised to take account of the number and type of people in households. This enables a better understanding of the experiences of households with different levels of spending power and living standards.
In a few cases, the analysis uses unequivalised net income, which is not adjusted to take account of household size and composition. We aim to improve future analysis to use equivalised income wherever possible. This should improve our understanding of the ways in which these factors vary across households at different points in the income distribution.
Families and householdsMost of the report’s analysis is of individuals rather than families but this is broken down by family or household type in some cases.
Families in HBAI, the main source for poverty rate data, are also known as ‘benefit units’, and each consists of a single adult or a couple living as married and any dependent children. A dependent child in HBAI is a person aged under 16 or aged 16 to 19 who is: not married, in a civil partnership or living with a partner and who is living with parents or a responsible adult and who is in full-time, non-advanced education or in unwaged government training.
Households in HBAI each consist of one or more families (benefit units). It should be noted that a family as defined in HBAI may not fit with everyday definitions of a family as, for example, a household containing parents, dependent children and a working adult child would be considered as two families (benefit units) with the working adult child being a single-person family (benefit unit). It should also be noted that a benefit unit does not always receive a benefit.
The definition of a ‘family unit’ in the Labour Force Survey is broader than that of a benefit unit or family in HBAI. In the former, a family unit can include non-dependent ‘children’ (who may be adults by their age), provided they have never married and have no children of their own living with them. People who live with their parents and are married or have children of their own living with them are treated (with their spouse/children) as being a separate family unit from their parents in the LFS, and this is consistent with HBAI.
Age groupsWhere analysis of HBAI refers to a pensioner family or a pensioner household, there is at least one person above state pension age (SPA) within the specific family or household.
In the analysis of employment and worklessness in the report, the group of people aged 16 to 64 are used as the equivalent of the working-age population, except where stated otherwise. This gives a consistent age group across the period for which analysis is presented, but includes some women above the female SPA, which has been rising since 2010 when it was 60, and will be the same as the male SPA (65) by the end of 2018.

110
JRF – UK Poverty 2017
110
Appendix: UK poverty 2017: methodology
Appendix notes1 Households Below Average Income, DWP release:
www.gov.uk/government/collections/households-below-average-income-hbai--2
2 Department for Work and Pensions. (2017). Households Below Average Income, 1994/95–2015/16. [data collection]. 10th Edition. UK Data Service. SN: 5828, http://doi.org/10.5255/UKDA-SN-5828-8
3 Family Resources Survey, DWP Annual Report: www.gov.uk/government/collections/family-resources-survey--2
4 Department for Work and Pensions, National Centre for Social Research, Office for National Statistics. Social and Vital Statistics Division. (2017). Family Resources Survey, 2015–2016. [data collection]. UK Data Service. SN: 8171, http://doi.org/10.5255/UKDA-SN-8171-1
5 Annual Survey of Hours and Earnings (ASHE) statistical bulletins: www.ons.gov.uk/employmentandlabourmarket/peopleinwork/earningsandworkinghours/bulletins/annualsurveyofhoursandearnings/previousReleases
6 ONS UK consumer price inflation statistical bulletins: www.ons.gov.uk/economy/inflationandpriceindices/bulletins/consumerpriceinflation/previousReleases
7 ONS UK labour market statistical bulletins: www.ons.gov.uk/employmentandlabourmarket/peopleinwork/employmentandemployeetypes/bulletins/uklabourmarket/previousReleases
8 Office for National Statistics. Social Survey Division, Northern Ireland Statistics and Research Agency. Central Survey Unit. (2017). Quarterly Labour Force Survey, April – June, 2017. [data collection]. UK Data Service. SN: 8235, http://doi.org/10.5255/UKDA-SN-8235-1
9 Working and workless households in the UK statistical bulletins (ONS): www.ons.gov.uk/employmentandlabourmarket/peopleinwork/employmentandemployeetypes/bulletins/workingandworklesshouseholds/previousReleases
10 Institute for Fiscal Studies, Fiscal facts tax and benefits: www.ifs.org.uk/tools_and_resources/fiscal_facts/
11 DWP Stat-Xplore tool: https://stat-xplore.dwp.gov.uk
12 Nomis official labour market statistics website: www.nomisweb.co.uk
13 Family spending in the UK statistical bulletins: www.ons.gov.uk/peoplepopulationandcommunity/personalandhouseholdfinances/expenditure/bulletins/familyspendingintheuk/previousReleases
14 Office for National Statistics, Department for Environment, Food and Rural Affairs. (2017). Living Costs and Food Survey, 2015–2016. [data collection]. 2nd Edition. UK Data Service. SN: 8210, http://doi.org/10.5255/UKDA-SN-8210-4
15 Childcare Survey and Holiday Childcare Survey (Family and Childcare Trust): www.familyandchildcaretrust.org/childcare-survey-and-holiday-childcare-survey
16 A Minimum Income Standard for the UK in 2017 (JRF): www.jrf.org.uk/report/minimum-income-standard-uk-2017
17 Department for Education, education statistics (England): www.gov.uk/government/organisations/department-for-education/about/statistics
18 Scottish Government school education statistics: www.gov.scot/Topics/Statistics/Browse/School-Education/Datasets

111
JRF – UK Poverty 2017
111
Appendix: UK poverty 2017: methodology
19 StatsWales schools and teacher statistics: https://statswales.gov.wales/Catalogue/Education-and-Skills/Schools-and-Teachers
20 Department of Education Northern Ireland statistics and research: www.education-ni.gov.uk/topics/statistics-and-research-1
21 Office for National Statistics. Social Survey Division. (2016). Opinions and Lifestyle Survey, Internet Access Module, January, February and April, 2015. [data collection]. UK Data Service. SN: 8079, http://doi.org/10.5255/UKDA-SN-8079-1
22 Northern Ireland Statistics and Research Agency. Central Survey Unit. (2016). Continuous Household Survey, 2014-2015. [data collection]. UK Data Service. SN: 8083, http://doi.org/10.5255/UKDA-SN-8083-1
23 DCLG statistics (including housing) (England): www.gov.uk/government/organisations/department-for-communities-and-local-government/about/statistics
24 Housing statistics for Scotland: www.gov.scot/Topics/Statistics/Browse/Housing-Regeneration/HSfS
25 StatsWales, housing: https://statswales.gov.wales/Catalogue/Housing
26 Department for Communities housing statistics (Northern Ireland): www.communities-ni.gov.uk/topics/housing-statistics
27 University of Essex. Institute for Social and Economic Research, NatCen Social Research, Kantar Public. (2016). Understanding Society: Waves 1–6, 2009-2015. [data collection]. 8th Edition. UK Data Service. SN: 6614, http://doi.org/10.5255/UKDA-SN-6614-9
28 NatCen Social Research, University College London. Department of Epidemiology and Public Health. (2017). Health Survey for England, 2015. [data collection]. UK Data Service. SN: 8280, http://doi.org/10.5255/UKDA-SN-8280-1
29 ScotCen Social Research. (2016). Scottish Health Survey, 2015. [data collection]. UK Data Service. SN: 8100, http://doi.org/10.5255/UKDA-SN-8100-1
30 Health state life expectancies by Index of Multiple Deprivation (IMD): England 2013 to 2015: www.ons.gov.uk/peoplepopulationandcommunity/healthandsocialcare/healthinequalities/bulletins/healthstatelifeexpectanciesbyindexofmultipledeprivationimd/england2013to2015
31 Healthy life expectancy: Scotland: www.scotpho.org.uk/population-dynamics/healthy-life-expectancy/data/scotland
32 Measuring inequalities 2016 (Wales): www.publichealthwalesobservatory.wales.nhs.uk/measuring-inequalities-2016-overview
33 Health inequalities regional report 2016 (Northern Ireland): www.health-ni.gov.uk/publications/health-inequalities-regional-report-2016
34 NatCen Social Research, MRC Elsie Widdowson Laboratory, University College London. Medical School. (2017). National Diet and Nutrition Survey Years 1–6, 2008/09–2013/14. [data collection]. 8th Edition. UK Data Service. SN: 6533, http://doi.org/10.5255/UKDA-SN-6533-7
35 Office for National Statistics. (2017). Crime Survey for England and Wales, 2015-2016. [data collection]. UK Data Service. SN: 8140, http://doi.org/10.5255/UKDA-SN-8140-1
36 TNS BMRB Scotland. (2017). Scottish Crime and Justice Survey, 2014-2015. [data collection]. UK Data Service. SN: 8141, http://doi.org/10.5255/UKDA-SN-8141-1

112
JRF – UK Poverty 2017
112
The Joseph Rowntree Foundation has supported this project as part of its programme of research and innovative development projects, which it hopes will be of value to policy-makers, practitioners and service users.
A pdf version of this publication is available from the JRF website (www.jrf.org.uk). Further copies of this report, or any other JRF publication, can be obtained from the JRF website (www.jrf.org.uk/publications) or by emailing [email protected]
A CIP catalogue record for this report is available from the British Library.
All rights reserved. Reproduction of this report by photocopying or electronic means for non-commercial purposes is permitted. Otherwise, no part of this report may be reproduced, adapted, stored in a retrieval system or transmitted by any means, electronic, mechanical, photocopying, or otherwise without the prior written permission of the Joseph Rowntree Foundation.
© Joseph Rowntree Foundation 2017
First published December 2017 by the Joseph Rowntree Foundation
ISBN 978-1-911581-16-1
Produced by: Pinnacle Graphic Design Ltd
Joseph Rowntree Foundation The Homestead 40 Water End York YO30 6WP www.jrf.org.uk
Ref 3271