Embed Size (px)
Citation preview
7/30/2019 UK Monthly Economic Briefing April 2013
http://slidepdf.com/reader/full/uk-monthly-economic-briefing-april-2013 1/4
UK Monthly Economic ReviewApril 2013
(Based on March 2013 data releases)
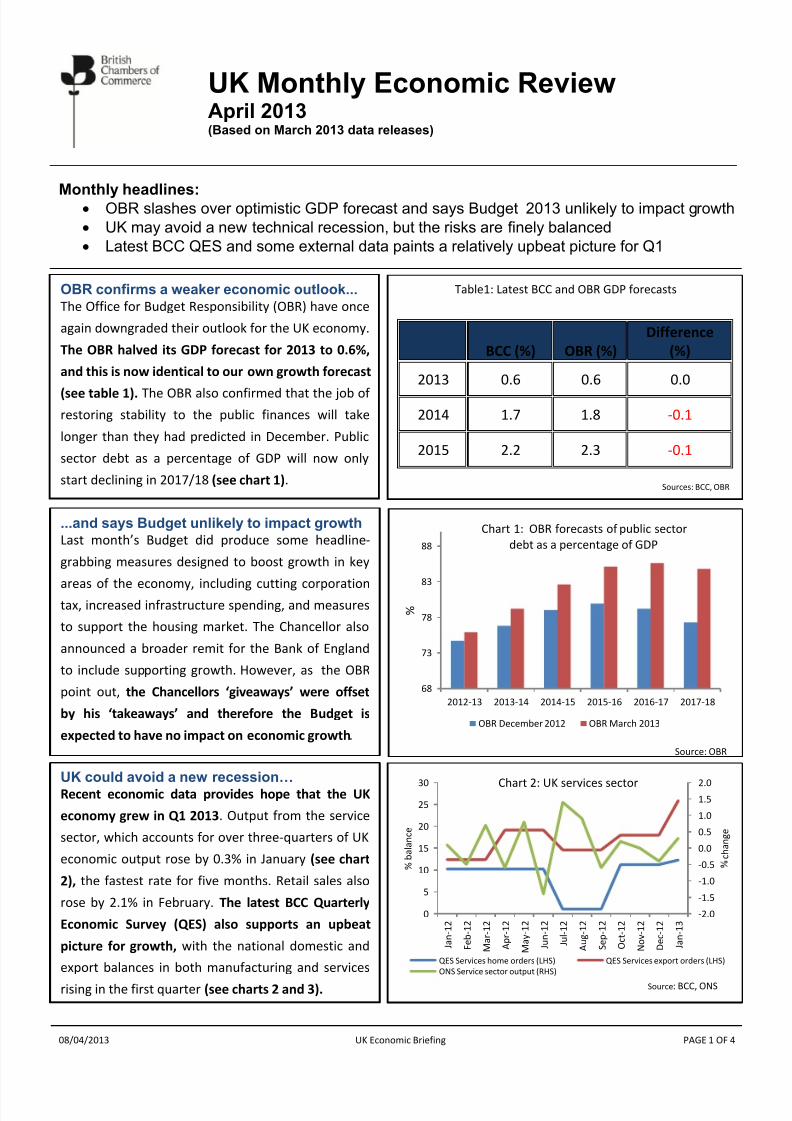
Monthly headlines:
OBR slashes over optimistic GDP forecast and says Budget 2013 unlikely to impact growth
UK may avoid a new technical recession, but the risks are finely balanced
Latest BCC QES and some external data paints a relatively upbeat picture for Q1
+OBR confirms a weaker economic outlook...The Office for Budget Responsibility (OBR) have once
again downgraded their outlook for the UK economy.
The OBR halved its GDP forecast for 2013 to 0.6%,
and this is now identical to our own growth forecast
(see table 1). The OBR also confirmed that the job of
restoring stability to the public finances will take
longer than they had predicted in December. Public
sector debt as a percentage of GDP will now only
start declining in 2017/18 (see chart 1).
Table1: Latest BCC and OBR GDP forecasts
BCC (%) OBR (%)
Difference
(%)
2013 0.6 0.6 0.0
2014 1.7 1.8 -0.1
2015 2.2 2.3 -0.1
...and says Budget unlikely to impact growth
Last month’s Budget did produce some headline 88
Chart 1: OBR forecasts of public sector
debt as a percentage of GDP
Sources: BCC, OBR
7/30/2019 UK Monthly Economic Briefing April 2013
http://slidepdf.com/reader/full/uk-monthly-economic-briefing-april-2013 2/4
Last month’s Budget did produce some headline 88 debt as a percentage of GDP
+
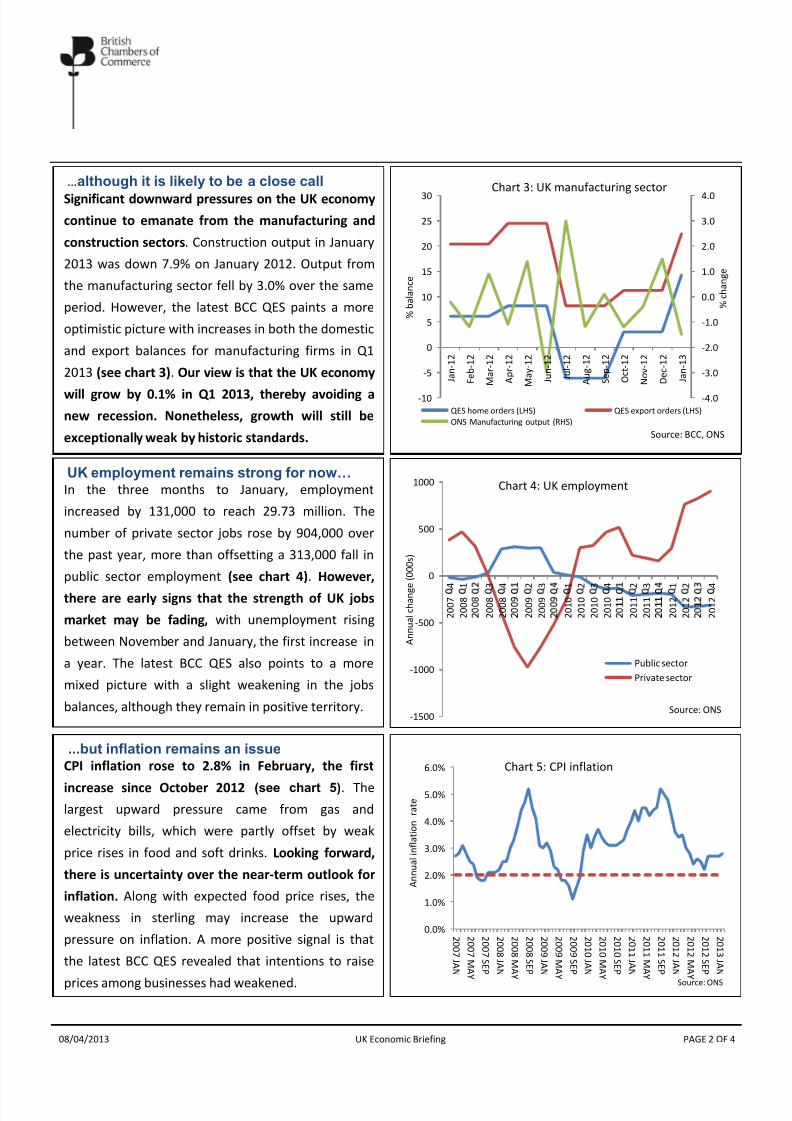
…although it is likely to be a close call
Significant downward pressures on the UK economy
continue to emanate from the manufacturing and
construction sectors. Construction output in January
2013 was down 7.9% on January 2012. Output fromthe manufacturing sector fell by 3.0% over the same
period. However, the latest BCC QES paints a more
optimistic picture with increases in both the domestic
and export balances for manufacturing firms in Q1
2013 (see chart 3). Our view is that the UK economy
will grow by 0.1% in Q1 2013, thereby avoiding a
new recession. Nonetheless, growth will still be
exceptionally weak by historic standards.
-4.0
-3.0
-2.0
-1.0
0.0
1.0
2.0
3.0
4.0
-10
-5
0
5
10
15
20
25
30
J a n - 1 2
F e b - 1 2
M a r - 1 2
A p r - 1 2
M a y - 1 2
J u n - 1 2
J u l - 1 2
A u g - 1 2
S e p - 1 2
O c t - 1 2
N o v - 1 2
D e c - 1 2
J a n - 1 3
% c h a n g e
% b a l a n c e
QES home orders (LHS) QES export orders (LHS)
ONS Manufacturing output (RHS)
500
1000
UK employment remains strong for now… In the three months to January, employment
increased by 131,000 to reach 29.73 million. The
number of private sector jobs rose by 904,000 over
Chart 3: UK manufacturing sector
Source: BCC, ONS
Chart 4: UK employment
7/30/2019 UK Monthly Economic Briefing April 2013
http://slidepdf.com/reader/full/uk-monthly-economic-briefing-april-2013 3/4
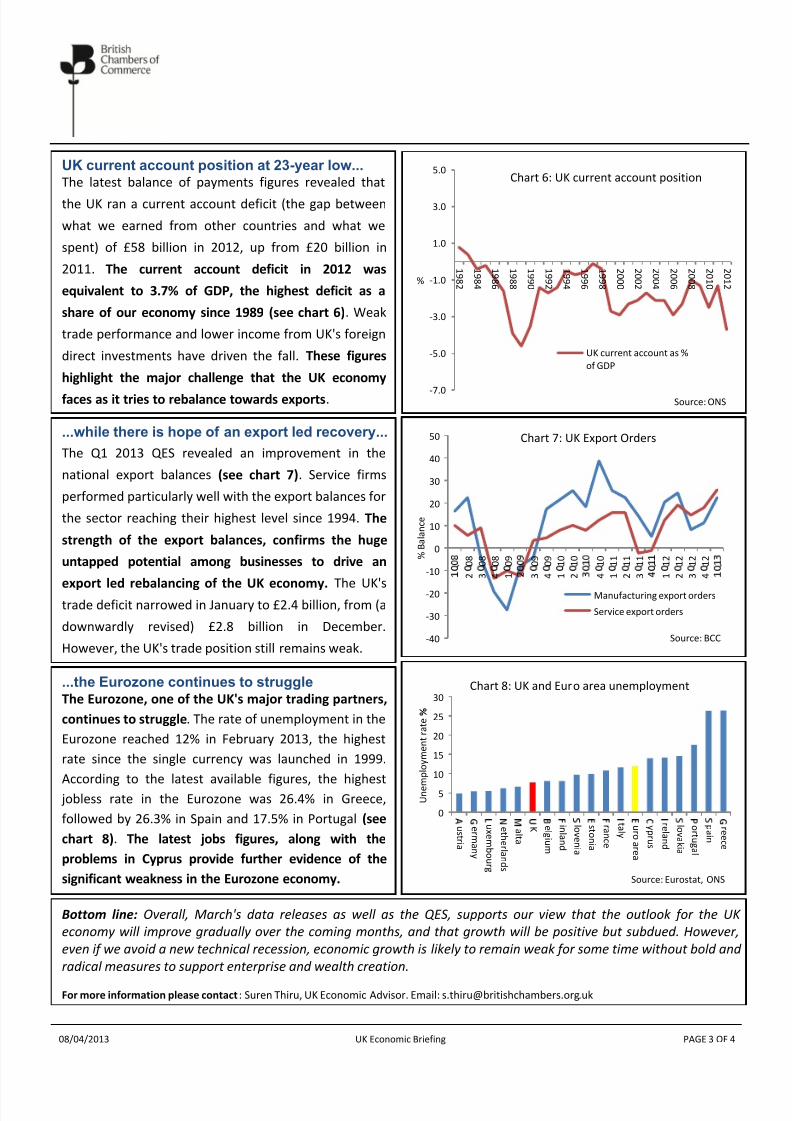
UK current account position at 23-year low...The latest balance of payments figures revealed that
the UK ran a current account deficit (the gap between
what we earned from other countries and what we
spent) of £58 billion in 2012, up from £20 billion in
2011. The current account deficit in 2012 wasequivalent to 3.7% of GDP, the highest deficit as a
share of our economy since 1989 (see chart 6). Weak
trade performance and lower income from UK's foreign
direct investments have driven the fall. These figures
highlight the major challenge that the UK economy
faces as it tries to rebalance towards exports.
...while there is hope of an export led recovery...
The Q1 2013 QES revealed an improvement in the
national export balances (see chart 7). Service firms
performed particularly well with the export balances for
the sector reaching their highest level since 1994. The
strength of the export balances confirms the huge
-7.0
-5.0
-3.0
-1.0
1.0
3.0
5.0
1 9 8 2
1 9 8 4
1 9 8 6
1 9 8 8
1 9 9 0
1 9 9 2
1 9 9 4
1 9 9 6
1 9 9 8
2 0 0 0
2 0 0 2
2 0 0 4
2 0 0 6
2 0 0 8
2 0 1 0
2 0 1 2 %
UK current account as %
of GDP
Chart 6: UK current account position
Source: ONS
10
20
30
40
50
l a n c e
Chart 7: UK Export Orders

7/30/2019 UK Monthly Economic Briefing April 2013
http://slidepdf.com/reader/full/uk-monthly-economic-briefing-april-2013 4/4
08/04/2013 UK Economic Briefing PAGE 4 OF 4
Chart 8: UK economic summary*, April 2013 (Based on March 2013 data releases)Deteriorating No change Improving
*Colours indicate an improvement or deteriorating of each indicator and refer to monthly changes unless stated. For example, an improvement in employment refers to an increase, while an improvement in
unemployment refers to a fall.
**Annual changes. ***Quarterly changes. ****Latest figures are estimates.
Sector Indictors (sources) Feb-12 Mar-12 Apr-12 May-12 Jun-12 Jul-12 Aug-12 Sep-12 Oct-12 Nov-12 Dec-12 Jan-13 Feb-13
Household Retail Sales (ONS)
Consumer Confidence (GfK NOP)
House Prices (Halifax)
New car sales (SMMT)**
Mortgage approvals (Bank of England)
Bus iness Bus iness confidence (BCC )***
Business lendi ng (Bank of England)
Service sector output (ONS)
Production output (ONS)
Investment intentions (Bank of England)**
Labour market Employment (ONS)
Unemployment (ONS)Claimant count (ONS)
Earnings (ONS)
Economic Activity (ONS)
F inancial FTSE1 00 (Bank of England)
Wholesale funding (Bank of England)
Retail funding (Bank of England)
Oil prices (Bank of England)
Gold prices (Bank of England)
Government 10 year Government bonds (Bloomberg)
Public sector net borrowing (ONS)
Public sector ne t debt (ONS)
Tax receipts (ONS)
Current Budget (ONS)
Ex te rn al UK t ra de b al an ce (ONS)
Exchange rate (Bank of England)
Eurozone GDP (Eurostat)****
Export deliveries (BCC)***
Export orders (BCC)***