Embed Size (px)
Citation preview

Ugandan oil —a blessing or a curse?
John Hassler∗, Per Krusell†, Abdulaziz Shifa‡, Daniel Spiro.§
March 31, 2013
1 Introduction
This paper addresses a number of macroeconomic concerns facing a devel-oping country that falls upon a large stock of a valuable natural resource.Our focus is on Uganda, on whose territory substantial amounts of oil wererecently discovered. Although this rather unexpected event is likely to af-fect the lives of many– in fact, arguably most– Ugandans, history is fullof examples illustrating that natural-resource discoveries cannot simply beconsidered manna from heaven. The finding of oil may indeed be a blessingbut it can also easily turn into a curse. The purpose of this report is toanalyze the key implications of an increase in revenue and to discuss somecentral related policy issues, such as how fast to extract the oil, how to man-age the revenues, and how and when to use the revenues. Our treatmentdoes not aim to be definitive but is rather designed to build a frameworkwith the perspective of which one can discern and analyze the key issues.
We will start by briefly describing Uganda’s economy and some recentmacroeconomic trends. We then report estimates we collected concerningthe size and value of the oil discovery. In order to analyze how the oil useought to influence the macroeconomic growth process, we then construct atractable macroeconomic and use it to look the key macroeconomic tradeoffsfacing Uganda. In particular, the model is well suited for a quantitativestudy of the tradeoffs between investing and consuming are affected by theoil discovery.
∗IIES, Stockholm University.†IIES, Stockholm University.‡IIES, Stockholm University.§University of Oslo.
1
Since the model necessarily abstracts from a host of important issueswe then move on and “think outside the theory box”, i.e., we discuss someconcerns that our model cannot directly be used to analyze on a less formallevel. Among these issues are risk and uncertainty, political transparency,the so-called “Dutch disease”, and whether oil revenues should be used fortax reductions. Finally, we try to draw some overall conclusions from ourformal and less formal analyses.
1.1 Some key characteristics of Uganda’s economy
Uganda is a developing landlocked country in east-central Africa. The GDPin 2011 was $16.8 billion (throughout, we use $ to denote USD) at nominalexchange rates with a population of 35 million. This makes for a GDPper capita of $487.1. Using a purchasing power parity adjustment to takeaccount of a lower domestic price level, income is almost three times as highat a GDP per capita of $1,345. Compared to its neighbors, Uganda has aGDP per capita that is slightly lower than those in Kenya and Tanzania,but substantially higher those in South Sudan and the Democratic Republicof Congo.
Like many other countries in Africa, growth in recent years has beenhigher than previously reported.2 In Figure 1, we show the growth rate ofpurchasing power-adjusted GDP per capita in constant prices. The solid linerepresents the average growth rate over the preceding ten years while thedotted line represents yearly growth rates. As we see, the average growthrate has been higher over the more recent period and also substantially lessvolatile. The average real per capita growth rate over the last 15 years in thesample was 3.0% per year. Over the last decades, population growth rateshave been fairly stable at around 3%, implying an average GDP growth rateof around 6%.
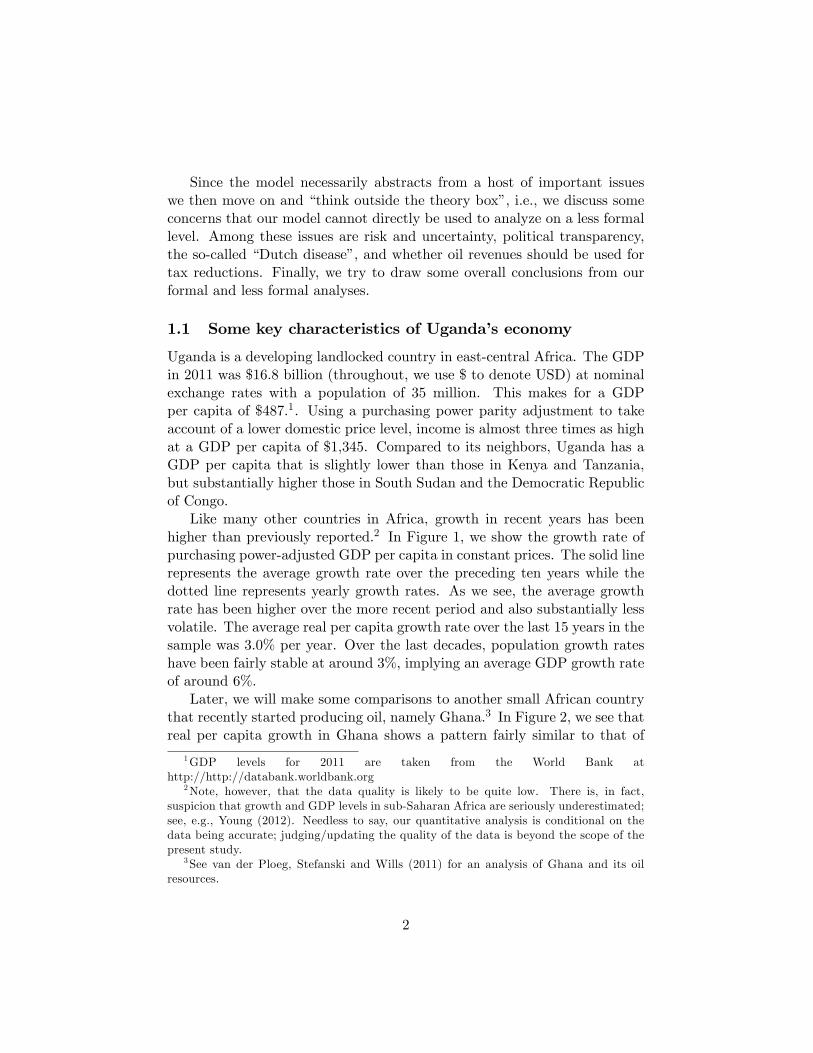
Later, we will make some comparisons to another small African countrythat recently started producing oil, namely Ghana.3 In Figure 2, we see thatreal per capita growth in Ghana shows a pattern fairly similar to that of
1GDP levels for 2011 are taken from the World Bank athttp://http://databank.worldbank.org
2Note, however, that the data quality is likely to be quite low. There is, in fact,suspicion that growth and GDP levels in sub-Saharan Africa are seriously underestimated;see, e.g., Young (2012). Needless to say, our quantitative analysis is conditional on thedata being accurate; judging/updating the quality of the data is beyond the scope of thepresent study.
3See van der Ploeg, Stefanski and Wills (2011) for an analysis of Ghana and its oilresources.
2
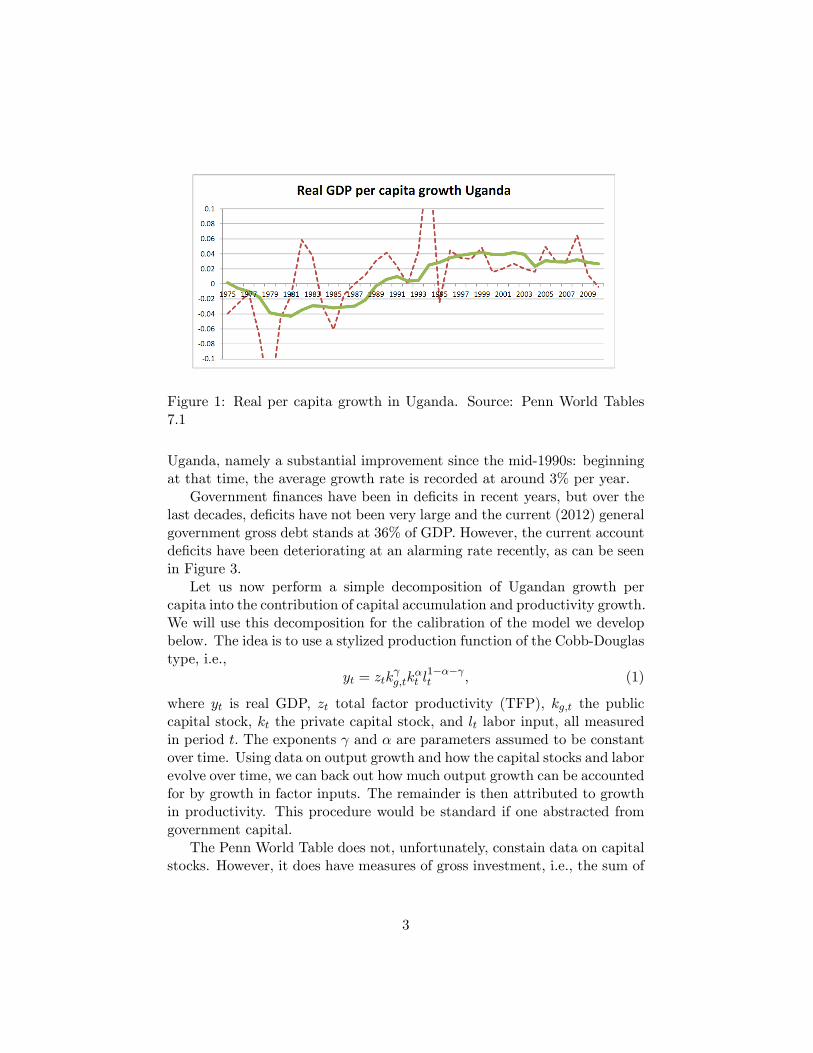
Figure 1: Real per capita growth in Uganda. Source: Penn World Tables7.1
Uganda, namely a substantial improvement since the mid-1990s: beginningat that time, the average growth rate is recorded at around 3% per year.
Government finances have been in deficits in recent years, but over thelast decades, deficits have not been very large and the current (2012) generalgovernment gross debt stands at 36% of GDP. However, the current accountdeficits have been deteriorating at an alarming rate recently, as can be seenin Figure 3.
Let us now perform a simple decomposition of Ugandan growth percapita into the contribution of capital accumulation and productivity growth.We will use this decomposition for the calibration of the model we developbelow. The idea is to use a stylized production function of the Cobb-Douglastype, i.e.,
yt = ztkγg,tk
αt l1−α−γt , (1)
where yt is real GDP, zt total factor productivity (TFP), kg,t the publiccapital stock, kt the private capital stock, and lt labor input, all measuredin period t. The exponents γ and α are parameters assumed to be constantover time. Using data on output growth and how the capital stocks and laborevolve over time, we can back out how much output growth can be accountedfor by growth in factor inputs. The remainder is then attributed to growthin productivity. This procedure would be standard if one abstracted fromgovernment capital.
The Penn World Table does not, unfortunately, constain data on capitalstocks. However, it does have measures of gross investment, i.e., the sum of
3
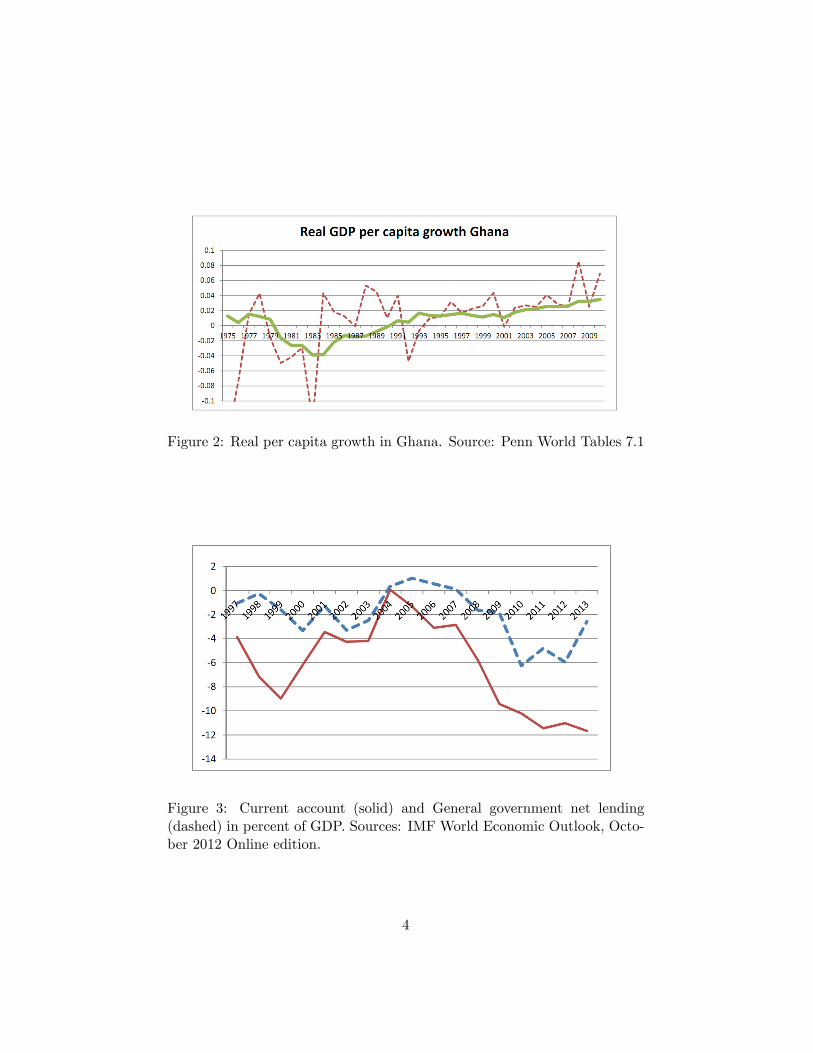
Figure 2: Real per capita growth in Ghana. Source: Penn World Tables 7.1
Figure 3: Current account (solid) and General government net lending(dashed) in percent of GDP. Sources: IMF World Economic Outlook, Octo-ber 2012 Online edition.
4

public and private capital. We can then use the relation
kt+1 = (1− δ) kt + it (1− κt)
to construct a series of capital stocks. Here δ is the average rate of depreci-ation, it is investment, and κt is a parameter between 0 and 1 intended tocapture the assumption that some investment spending is wasted and notactually transformed into productive capital.4 This parameter will also playan important part in the analysis below. Finally, assuming that the growthrates of public and private capital stocks are approximately equal, we canconstruct the growth rate of zt, denoted gzt , by noting that
gzt = gyt − (α+ γ) (gkt − glt) (2)
where gyt is the growth rate of real GDP per capita, gkt is the commongrowth rate of the two types of capital and glt is the population growthrate. We use data from the Penn World Table for the period 1950 to 2010.We set the depreciation rate to 10% per year and κt to 1
3 .5 Finally, we set
γ = 1/6 and α = 1/3.In Figure 4, we show the growth rate of total factor productivity in
Uganda. As in the previous graphs, we show the average over the preceding10 years. As we see, the growth rate of productivity increased substantiallybetween the 1980s and the 1990s, from negative numbers to levels between2 and 3% per year. However, there is quite a clear sign of a productivityslowdown and over the last 15 years; the average productivity growth ratehas been a fairly low 0.65% per year.
Note that (2) implies that the difference between the growth rate of GDPper capita and the growth rate of productivity is the contribution from thechange in capital per capita. Using this, we can conclude that productivitygrowth contributed to a bit more than half of the growth in per capita GDPfrom about the mid-1980s to the early 2000s. For example, over the period1991—2000, the average growth in per capita GDP was 3.9 %, of which 2.4percentage points can be accounted for by productivity growth. Over thenext decade, GDP per capita grew by 2.7% per year, of which only 0.1percentage points can be accounted for by productivity growth.
4We will later allow different κs for the two types of capital.5The results are quite insensitive to reasonable variations in the values of δ and κ as
well as to the α′s. We also need to set the initial level of capital. However, the effect ofthe choice of the value for the initial capital stock vanishes fairly quickly and we reportestimates of productivity only from 1975 and onwards.
5

Figure 4: Ten year backward average of TFP growth Uganda.
It is interesting to note that a similar productivity slowdown did notoccur in Ghana. As seen in Figure 5, the productivity growth has beenfairly stable at 2% per year over the last decades.
Finally, we note that our production function in (1) allows for bal-anced growth– a situation where investment rates are constant and GDPper capita and the capital stocks per capita grow at the same rate. Such abalanced growth path is a key feature of the model we will present belowsince the economy tends to converge to such a growth path as long as theproductivity growth rate and other parameters of the economy are stable.For now, we note that we can use (2) to calculate the relation between theproductivity growth rate and the growth rate of GDP per capita along abalanced growth path. Using the fact that the growth rate of per capitaGDP and the per-capita capital stocks are equal under balanced growth(i.e., gy = gk − gl) in (2), we obtain
gy =gz
1− α− γ . (3)
Under the assumption that 1 − α − γ = 12 , GDP per capita thus grows
twice as fast as productivity under balanced growth. In conclusion, GDPgrowth was close to balanced during the 90s but unless productivity growthpicks up, one might worry that growth will tend to fall in Uganda unlessimportant structural change occurs. It is important to note in this contextthat the discovery of oil, however positive as a source of wealth, is in itselfnot source of structural change.
6

Figure 5: Ten year backward average of TFP growth Ghana.
1.2 Oil resources
There is substantial uncertainty about the amounts of recoverable oil inUganda. Over one billion recoverable barrels have been discovered in theLake Albert Rift Basin.6 There is also potential for more discoveries. Ac-cording to the organization Oil in Uganda, a reasonable estimate is 2.5 billionbarrels. After discussion with Tullow oil, we use as a somewhat conserva-tive benchmark the assumption that there are 1.8 billion barrels that canbe recovered.
Recovering and selling this oil is associated with costs in the form ofexploration (around $1/barrel), extraction ($10-$15/barrel) and transport($4-$5/barrel).7 This sums to roughly $15—$20/barrel of costs. This isnot meant to be an exact calculation of costs but suffi ces for producing anestimate of the economic magnitude of the Ugandan oil resource.
The quality of the oil is somewhat low; it is estimated to generate aprice of around $10 below the Brent crude oil index. With the recent Brentprice being around 110 US$/barrel, these figures would mean revenues of$100/barrel and profits of around $80/barrel. At current prices and theassumed costs, the oil resource thus amounts to $180 billion in revenuesand $144 billion in profits. With a population of 35 million, the lattermeans $4,100 per capita. Clearly, this is a very sizable amount compared to
6Stated on, e.g., the Web site of Tullow oil, http://www.tullowoil.com.7This assumes that an effi cient infrastructure for transportation is constructed in
Uganda. Transportation by truck is likely to be substantially more costly. Henstridgeand Page (2012) claim that current truck transportation costs are $23 per barrel.
7

per-capita income of $487 per year.8 Since income is a flow, it may be morereasonable to compare the income that could be generated by the oil revenueto GDP per capita. If Uganda, as does Norway, invested all oil profits in asovereign wealth fund and we assume a real rate of return of 4% per year,an added income flow of $160 per year, i.e., an increase of current incomeby 33%, could be sustained forever.9 Another perspective on the value ofthe oil resource is arrived at by noting that with a growth rate of 3% peryear, a 33% higher level of income is achieved after less than ten years. Thepurpose of this back-of-the-envelope calculation is to show that the value ofthe discovered oil is not large enough to itself lead to a revolutionary changein the living conditions of the average Ugandan. However, although the oilwill not make the average Ugandan a rich oil sheik, if the oil resource iswisely spent, it certainly may make a difference.
2 Key macroeconomic trade-offs
2.1 When to consume and invest
Many macroeconomic questions arise when considering the added resourcesthat the oil revenues generate for Uganda. A very basic question is whatto use the revenues for: consumption or investment. This question hasat least two separate dimensions attached to it. One aspect is the purelyintertemporal consumption allocation issue: for any given amount of income,how much should be consumed in Uganda now and how much should beconsumed in the future, by future generations? Another issue is that ofproduction effi ciency: the investment in a country such as Uganda alsoserves to build future production capacity, namely if the investment is inphysical capital, private or public. This issue is intimately connected withthe issue of growth and development.
In the section below where we provide a formal analysis of Uganda’sgrowth process and how oil revenue ought to affect it, we provide a precise,and quantitative, answers to these questions. Here we will just briefly discussthe main conceptual issues. An important point to be made is that the
8Another comparison is to the PPP-adjusted GDP of $1,345. This level of GDP is com-puted using world market prices, i.e., not the actual valuations of the Ugandan economy.Thus, we prefer the comparison with local, market-valued GDP.
9 In reality, there is substantial uncertainty about the value of the Ugandan oil resource.First, no one knows exactly how much oil there is. Second, since the oil resource cannotbe extracted immediately, uncertainty about future oil prices affects its value. We willreturn to this issue below.
8

two questions– that of intertemporal consumption choice and that of howmuch to invest at different points in time– do not need to be more thanvery distantly related. This is the case, namely, if the domestic economyis well connected with international markets for borrowing and lending andthere are no obvious restrictions on any of these activities. The reasonis that the international market could then be used in the consumptionchoice separately from the investment decisions: investment decisions affectoutput at different points in time but since saving does not have to equalinvestment the two decisions are really independent. There are many reasonsto suggest that Uganda is not unconstrained in its access to internationalborrowing, thus creating a tighter link between consumption and investmentdecisions. Thus, oil revenues might be productively used by building up themanufacturing sector, for instance, but that likely implies that consumptionhas to be held back now in favor of only increasing the consumption in thefuture. Our formal model below makes this point very clear by consideringdifferent assumptions as regards the access to international capital markets.
By the same token, it is also clear that the timing of the oil extractionlinks in with the consumption-investment decision to the extent there arerestrictions on capital/credit markets. For example, if the current situa-tions is described by a need to increase consumption– with the argument ofsmoothing consumption across generations, relying on the assumption thatUganda’s future looks relatively good so that its future generations will besignificantly richer than its current inhabitants– and consumption is con-strained by a limited ability to borrow against future incomes, then rapidextraction is beneficial, and building up an oil fund that limits the possibili-ties to consume is not. If, on the other hand, current consumption is not con-strained or one has a more pessimistic outlook for the future– so that savingis more desirable than consuming from an intergenerational perspective–then rapid extraction is not particularly beneficial and the costs of buildingup an oil fund are limited. This is likely the case of Norway, but it is farfrom a foregone conclusion that it fits the case of Uganda.
The benefits of investment, and what forms of investments are needed,need to be studied as well. This is of course a very diffi cult topic to the ex-tent one wishes to give specific advice. The present report can therefore notpresume to be very helpful in this regard, since much more detailed institu-tional and business knowledge would be needed than what has been possibleto collect during the course of this study. The general principle should ofcourse be a standard cost-benefit analysis: invest if the returns exceed theinterest rate (whether an international or domestic rate). Our perspectiveon Uganda’s growth potentials is that investment will be increasingly pro-
9
ductive as we expect ineffi ciencies in the economy to fall over time. Ourmodel below makes this quite clear at least in a general sense, but thereis significant uncertainty as to how fast these effi ciency improvements willarrive, whether they will be general or differ across sectors of the economy,and so on.
Finally, one cannot abstract completely from short-run aspects: thoughconsumption and investment involve a tradeoff, they may also be comple-mentary in that they both constitute the key components of aggregate de-mand. Thus, if output is demand-determined in the short run, it mightbe beneficial to spend resources on consumption and investment simply toraise capacity utilization. Here, of course, one can imagine different multi-pliers associated to consumption and investment but the main point is thatboth can be beneficial for the same reason. Business-cycle aspects are notconsidered in the formal model but are briefly touched on in the discussionfollowing the formal section.
2.2 When to extract
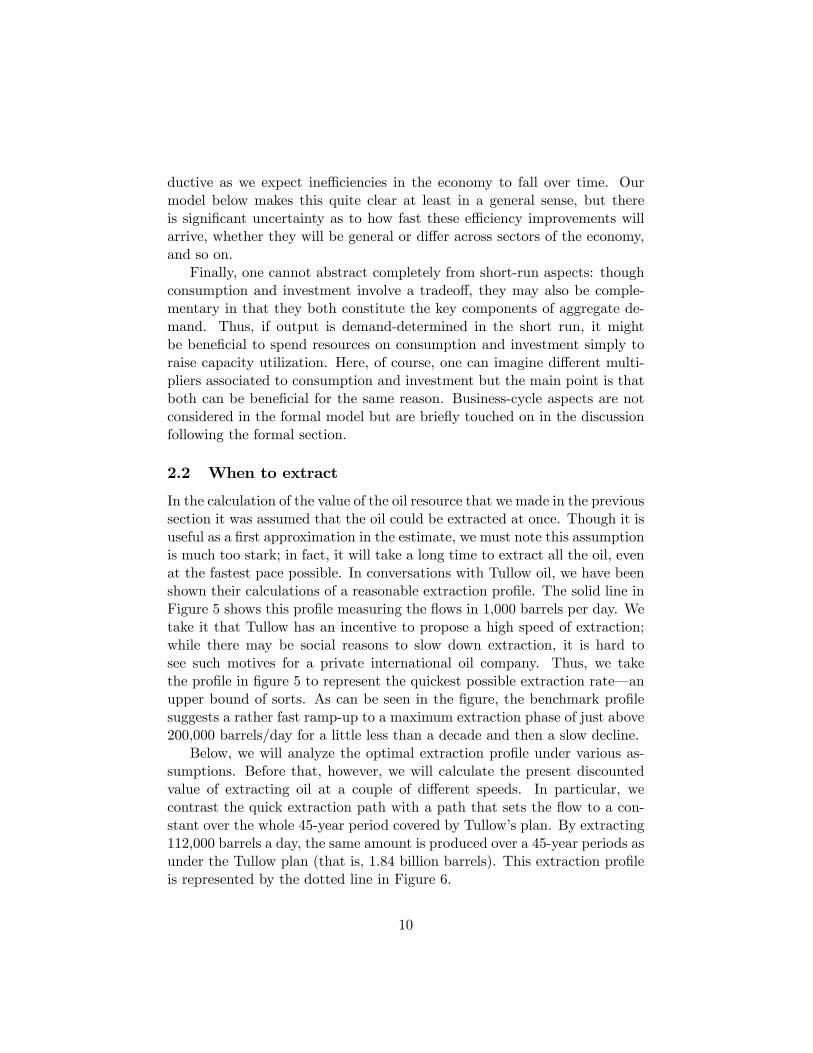
In the calculation of the value of the oil resource that we made in the previoussection it was assumed that the oil could be extracted at once. Though it isuseful as a first approximation in the estimate, we must note this assumptionis much too stark; in fact, it will take a long time to extract all the oil, evenat the fastest pace possible. In conversations with Tullow oil, we have beenshown their calculations of a reasonable extraction profile. The solid line inFigure 5 shows this profile measuring the flows in 1,000 barrels per day. Wetake it that Tullow has an incentive to propose a high speed of extraction;while there may be social reasons to slow down extraction, it is hard tosee such motives for a private international oil company. Thus, we takethe profile in figure 5 to represent the quickest possible extraction rate– anupper bound of sorts. As can be seen in the figure, the benchmark profilesuggests a rather fast ramp-up to a maximum extraction phase of just above200,000 barrels/day for a little less than a decade and then a slow decline.
Below, we will analyze the optimal extraction profile under various as-sumptions. Before that, however, we will calculate the present discountedvalue of extracting oil at a couple of different speeds. In particular, wecontrast the quick extraction path with a path that sets the flow to a con-stant over the whole 45-year period covered by Tullow’s plan. By extracting112,000 barrels a day, the same amount is produced over a 45-year periods asunder the Tullow plan (that is, 1.84 billion barrels). This extraction profileis represented by the dotted line in Figure 6.
10
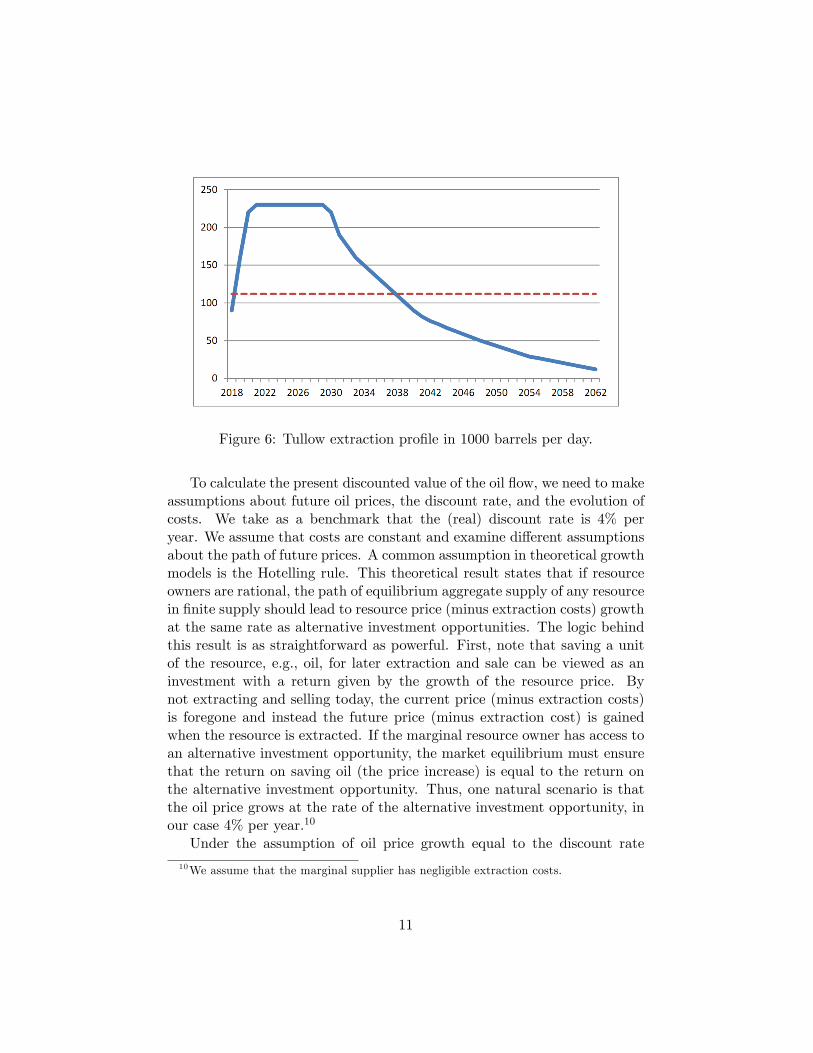
Figure 6: Tullow extraction profile in 1000 barrels per day.
To calculate the present discounted value of the oil flow, we need to makeassumptions about future oil prices, the discount rate, and the evolution ofcosts. We take as a benchmark that the (real) discount rate is 4% peryear. We assume that costs are constant and examine different assumptionsabout the path of future prices. A common assumption in theoretical growthmodels is the Hotelling rule. This theoretical result states that if resourceowners are rational, the path of equilibrium aggregate supply of any resourcein finite supply should lead to resource price (minus extraction costs) growthat the same rate as alternative investment opportunities. The logic behindthis result is as straightforward as powerful. First, note that saving a unitof the resource, e.g., oil, for later extraction and sale can be viewed as aninvestment with a return given by the growth of the resource price. Bynot extracting and selling today, the current price (minus extraction costs)is foregone and instead the future price (minus extraction cost) is gainedwhen the resource is extracted. If the marginal resource owner has access toan alternative investment opportunity, the market equilibrium must ensurethat the return on saving oil (the price increase) is equal to the return onthe alternative investment opportunity. Thus, one natural scenario is thatthe oil price grows at the rate of the alternative investment opportunity, inour case 4% per year.10
Under the assumption of oil price growth equal to the discount rate
10We assume that the marginal supplier has negligible extraction costs.
11

and extractions following the Tullow profile, the present discounted value ofoil revenues minus costs is $132 billion. Assuming a flat extraction profileinstead, the value is $136 billion, i.e., it is almost the same.11 In fact, underthe assumptions underlying the Hotelling result, the timing of extraction hasno effect on the value of the oil resource. Under alternative assumptions,the value can be quite sensitive to the extraction path. To illustrate this, letus consider the value of the oil resource for the two extraction paths underalternative assumptions on the oil price development.
First, suppose that the oil price is constant in real terms. Clearly, in thiscase, delaying extraction is costly. But how costly? With a constant realoil price, the value of the Tullow extraction profile is $76 billion, while theflat profile gives a value of $58 billion. Thus, the delayed extraction profileimplies a loss of $18 billion, or almost one fourth, relative to the Tullowprofile. We should also note that the Tullow profile has a much lower valuethan the (unrealistic) immediate full extraction hypothesis. This suggeststhan under the assumption that oil prices are constant, any delay is rathercostly. In fact, the cost of delaying the whole extraction profile by one yearis equal to the discount rate times the total value when prices are assumed tobe constant. We conclude this analysis by noting that a delayed extractionprofile makes the value of the oil resource more sensitive to variations infuture oil prices.
A second consideration is that under the realistic assumption that Ugandadoes not have access to a perfect capital market, domestic discount rates maydiffer from their world counterparts. Specifically, if Uganda is credit con-strained, the implicit discount rate is higher that the 4% assumed to applyon the world market. In such a situation, there is a cost of waiting to extractalso if oil prices grow at the world market interest rate. As we will see below,the credit-constrained scenario seems quite realistic.
3 A macroeconomic model
In this section we provide a formal analysis, using a calibrated theoreticalmodel, of the role of oil in Uganda’s economy. The use of formal methodsis beneficial in that these force discipline, both logical and quantitative. Wetake a growth perspective, since the main issue here is to examine the roleof oil over time; thus, the maintained time horizon is rather long– on the
11The fact that the flat profile gives a slightly higher value is due to the presence ofextraction costs: since those are assumed not to grow, there is a (small) value of postponingextraction.
12
order of 100 years. With this long-run perspective we take a stand on thedevelopment process and capture the sources of long-run growth and catchupvia gradual, but rather slow, elimination of ineffi ciencies. This approach isconsistent with the recent growth literature, as for example exposited andsummarized very nicely in Jones (textbook). The removal of ineffi cienciesimplies direct benefits to output but also indirect benefits through inducedcapital accumulation. The model thus displays this process and how oilrevenues accruing at different points in time will affect it.
We abstract from a number of important issues, but these issues are thendiscussed in some detail later in the text. For example, although centralfor the practical discussion of oil management, business-cycle fluctuationsare not studied in the formal analysis but the discussion in Section 4.4below discusses their relevance. Further, the often-discussed Dutch diseaseproblems arising from income shocks– particularly deriving from naturalresources– are absent formally in the model in this section but they canbe easily introduced, at least in a basic form, and Section 4.2 discusses theassociated results and interpretations.
3.1 Model description and discussion
We use an extension of the basic Cass-Koopmans model of optimal growth,the cornerstone of growth theory. This model focuses on a macroeconomicaggregate output which can be used for investment or consumption. Whenoil is included in the analysis, extracted oil is also assumed to be part ofthe aggregate output. The focus on one aggregate good implies that weabstract from international trade in different types of goods, an abstractionwhich is arguably not a severe one for Uganda. A version of the model–though not the baseline– describes Uganda as an open economy with accessto borrowing and lending on international credit markets. In all versionsof the model one presumes that oil is traded internationally at competitiveprices.
3.1.1 A benchmark setup
The resource constraint is
ct + it + igt = yt + ptot,
where international trade is abstracted from and where c is consumption(government and private), i is private investment, ig is government invest-ment in infrastructure, and y is output from domestic production (manufac-turing, services, and agriculture together in one macroeconomic aggregate).
13

The term ptot refers to oil revenue, using a world price pt and a quantityof barrels ot. We thus distinguish the private from the public capital stock;the former is structures and equipment used in the private sector and thelatter is various forms of infrastructure. Separately including governmentcapital is important in an economy such as Uganda’s; the infrastructurenecessary for private production is not in place other than partially, unlikein most developed economies where the main issue is infrastructure mainte-nance and improvements, not basic build-up. The associated capital stocksevolve according to
kt+1 = (1− δ)kt + (1− κt)it
andkg,t+1 = (1− δg)kgt + (1− κgt)igt,
where δ and δg are the associated depreciation rates. The parameters κand κg are time-varying measures of ineffi ciencies in the private and pub-lic investment sectors, respectively. We thus take the perspective here thatwhen one unit of resources is invested, a fraction disappears. The gradualelimination of these wedges will be a source of long-run growth in this econ-omy as any unit invested will result in a higher eventual capital stock (andthus higher output) and also in higher returns from accumulating capital,potentially inducing more of this activity.
Output is produced according to
z1−α−γt kαt kγgt.
We thus assume a Cobb-Douglas production, giving constant shares to capi-tal and labor income.12 The labor input is suppressed (i.e., it can be viewedas set to 1 and to be inelastic). Population growth is not modeled hereand although growth in the labor force clearly will be a source of outputgrowth, growth in output per capita is much less dependent on populationgrowth so we abstract from it here. Government capital, as modeled, dis-plays complementarity with private capital: with a higher stock of it, thereturns from investing in private capital go up. Importantly, zt is a produc-tivity parameter which both captures technical progress (making z high)and ineffi ciencies (making z low). Thus, temporarily low zs is thought of as
12We change notation slightly relative to the previous section by defining total factorproductivity as z1−α−γt . This change of variables implies that the growth rate of GDP isequal to that of z in balanced growth rather than (1− a− γ)−1 times the growth of z asin (3). This change is for convenience only and does not affect any part of the analysis.
14

a source of underdevelopment and as the zs grow and catch up with thoseof the developed world, the country’s economy catches up more generallyin terms of capital accumulation and output since higher zs induce capitalaccumulation. Thus, as with the lowering of the κs, improved effi ciency hasboth direct and indirect benefits. Notice, finally, that we abstract from oilas an input here, since oil in this model is not of primary importance as aproduction input but as a source of extra revenue. This is in line with theapproach taken in the literature on economic growth.
In order to evaluate welfare for this economy, we assume a representativeagent with preferences ∑
t=0
βtu(ct)
where u(c) = c1−σ−11−σ . Here, β < 1 represents discounting, which can be
interpreted both as a weight on a given individual’s own future utility flowsand as a weight on the utility flows of future generations. The parameterσ is a measure of how costly fluctuations in consumption are perceived tobe– the higher is σ, the more painful are consumption adjustments. Tofind an optimal path we thus maximize the above utility function underthe restrictions implied by the macroeconomic resource constraint and thecapital accumulation equations.
We can implicitly define a government budget in the model, with igt (pos-sibly plus a public part of consumption) defining spending and ptot definingrevenues; the difference is made up by a lump-sum tax or transfer betweenthe government and the private sector. Our focus here, however, will bethat of the aggregate economy and not the government-private breakdown,since our aim is to take the perspective of the average Ugandan citizen.
3.1.2 Analysis
In the long run, the economy (i.e., its consumption, output, investments, andcapital stocks) will grow at a constant rate: the rate at which z grows. Thus,in what follows we use the methods common to all undergraduate macroeco-nomic textbooks in the context of Solow’s growth model with technologicalchange. In this context, however, there will be a transition, as z will notnecessarily grow at a constant rate at all times– it will grow fast initially,representing catch-up, and then slow down to the rate at which total-factorproductivity grows in the rest of the world– and as κ and κg will be assumedto converge to zero. Because there will be sustained growth, we will analyzea transformed version of the model with stationary variables. For a genericvariable x, we thus let xt ≡ xt/zt.
15
Having transformed all equations and the expression for the objective tobe maximized, we obtain the following planning problem:
max{ct,kt+1,kg,t+1}∞t=0
∑t=0
(βtz1−σt
) c1−σt − zσ−1t
1− σ
subject to
ct +kt+11− κt
zt+1zt
+kg,t+11− κgt
zt+1zt
= kαt kγgt + ptot +
1− δ1− κt
kt +1− δg1− κgt
kgt.
Conveniently, thus, we can think of a planner choosing the two capital stocksover time (with an implied consumption path). Notice that we have notconsidered {ot}∞t=0 a choice here; we will, rather, consider different stylizedextraction paths and their consequences for welfare.
The implications of the above maximization problem can be summarizedin two equations:(
1− δ + (1− κt+1)αkα−1t+1 kγg,t+1
) 1− κt1− κt+1
=
(1− δg + (1− κg,t+1)γkαt+1k
γ−1g,t+1
) 1− κgt1− κgt+1
and
β(1− δ + (1− κt+1)αkα−1t+1 k
γg,t+1
) 1− κt1− κt+1
=
(ct+1ct
zt+1zt
)σ.
The first of these equations equates the return from investments in the pri-vate sector to that in the public sector (taking into account the ineffi cienciesin each). Thus, this represents optimal investment behavior in the port-folio (private versus government) sense. The second equation is the usualconsumption Euler equation, setting the marginal rate of transformation ofresources over time equal to the marginal rate of intertemporal substitution,thus determining the solution to the optimal consumption-investment trade-offs. Eliminating c using the resource constraint, one can combine these twoequations into one second-order difference equation in k.
We solve the model, as described by these equations, numerically fora long time horizon.13 The model is such that the transformed variables
13The solution technique relies on global, nonlinear solution and is not discussed here.The programs are available upon request.
16

converge to a steady state (and the untransformed variables, hence, convergeto a balanced growth path).
The steady state is thus characterized by the portfolio equation
1− δ + (1− κ)αkα−1kγg = 1− δg + (1− κg)γkαkγ−1g
and by the stationary version of the Euler equation
β(1− δ + (1− κ)αkα−1kγg
)= (1 + g)σ ,
where g is the net long-run growth in z.
3.2 The open economy
The economy that is open to international borrowing and lending has aresource constraint that reads (in transformed form)
ct + at+1zt+1zt
+kt+11− κt
zt+1zt
+kg,t+11− κgt
zt+1zt
=
kαt kγgt + ptot +
1− δ1− κt
kt + at(1 + r) +1− δg1− κgt
kgt.
where a denotes transformed international lending (i.e., the gross level adivided by z) and r the net international real interest rate. The planningproblem is thus to maximize utility subject to this constraint, with an ad-ditional choice of {at}∞t=0. This problem is easier to solve than that underthe closed-economy assumption, since it delivers the following conditions:(
1− δ + (1− κt+1)αkα−1t+1 kγg,t+1
) 1− κt1− κt+1
=
(1− δg + (1− κg,t+1)γkαt+1k
γ−1g,t+1
) 1− κgt1− κgt+1
= 1 + r
and
β (1 + r) =
(ct+1ct
zt+1zt
)σ.
The first two of these equations can be solved directly for kt+1 and kg,t+1,independently of the rest of the capital sequences: given that the economycan borrow and lend at r, it is optimal to simply invest in the two kindsof capital until their net returns equal r. In particular, the path of oilextraction will not influence these choices. The last equation determines
17

the growth rate of consumption, independently of the investment decisions.The level of consumption does depend on the investment decisions but issolved for easily in a permanent-income fashion by defining a consolidated,time-zero budget constraint
∞∑t=0
ztz0(1 + r)t
(ct +
zt+1ztkt+1 − (1− δ)kt1− κt
+
zt+1ztkg,t+1 − (1− δ)kgt
1− κgt
)=
∞∑t=0
ztz0(1 + r)t
(y∗t + ptot) + a0(1 + r),
where y∗t defines output given optimal investments in the two capital stocks(notice that the gross return between time 0 and time t equals zt(1+ r)t/z0in the transformed economy). The part pertaining to consumption on theleft-hand side can be simplified, given the consumption Euler equation, toequal c0
1−(β(1+r)1−σ)1σ. Thus, consumption is very easy to solve for given that
the capital accumulation path is solved for from the above equations. Onecan, finally, obtain the evolution of net debt from the budget constraint.
3.3 Calibration
We calibrate the parts of our baseline economy not having to do with oil asfollows
• α = 1/3, representing a typical share of private capital of 1/3, withthe labor share earning 2/3.
• γ = 1/6, representing a cost share of government capital of 1/6, thoughthis capital is not traded and hence should be viewed as an externalityfrom the perspective of the private sector.
• δ = 0.1, depicting a wear-and-tear of structures and equipment of anaverage of 10% per year.
• δg = 0.04, capturing a significantly lower depreciation rate on in-frastructure than on private capital.
• zt+1zt= 1+g+g0ρ
t1, with g = 0.025, g0 = 0.015, and ρ1 = 0.85. Thus, we
take initial growth situation to be one where total-factor productivitygrows relatively fast, indicating catch-up (relative to the rest of theworld not explicitly modeled here). The long-run growth rate of z,and thus output, implied by these assumption is 2.5%, which is still a
18

bit high relative to the average rate of developed countries but the ideahere is that the catchup will continue beyond the horizon consideredhere and this process is reasonably approximated by assuming a long-run growth rate of 2.5%. The short-run growth rate is 4% which isin line with the recent growth history of Uganda reported above. Theconvergence in productivity is rather slow, with persistence parameterof 0.95, thus implying that the gap away from the long-run growthrate closes by 5% per year.
• κt = κ0ρt2, with κ0 = 0.25 and ρ2 = 0.95. Thus, the private-sector
investment ineffi ciencies are 25% to start with and fall slowly overtime (as for total-factor productivity, the convergence rate is 5% peryear).
• κgt = κg0ρt2, with κg0 = 0.5, indicating that the government sector
has twice the amount of ineffi ciencies of the private sector. We ob-tained the number 50% from discussions with Ugandan offi cials andthe estimate for the private sector is simply our best guess.
• k0 and kg0 set at balanced-growth levels consistent with a z growth of2.5 percentage points, κ = 0.25, and κg = 0.5 at all past times.
• σ = 1, representing an intermediate value of the intertemporal substi-tution elasticity, a value that is common in the growth literature.
• r = 0.04, capturing a world interest rate of 4%; notice that this shouldbe viewed as a return on capital and as a long-run average (the currentlow international rates being strongly influenced by the world-widerecession).
• β such that β (1 + r) = (1 + g)σ: the long-run discounting within thecountry will be consistent with balanced-growth behavior at the sameinterest rate as in the international economy.
Thus, in summary, we view the past as quite distorted both in the pri-vate and public investment sectors, though more in the latter. However,these distortions are assumed to asymptotically vanish. We regard past andcurrent total-productivity growth as historically high (to capture reasonablegrowth experience the last twenty years) and then declining toward a rateconsistent with the rest of the world. Asymptotically, the closed economywill generate the same interest rate as currently in the rest of the world (therate 4% refers to a return to capital, which exceeds that of safe bonds).
19

As for oil revenues, we consider the baseline scenario as the “maximumextraction path” obtained by Tullow oil (discussed above). This path im-plies 32,850,000 barrels extracted in an initial year of 2018 and then a riseto a maximum of 83,950,000 in just a few years (obtained in 2021), with amaintained high level of production for nine years and then a gradual ta-pering down with the last oil production occurring in 2062. We value oilby taking a current world price of $100 per barrel as baseline. We thenassume a Hotelling price path, thus implying a growth of 4% per year in theoil price. A more conservative price path would, for example, maintain aconstant oil price, and it is of course straightforward to alter these assump-tions as one wishes. A more or less rapidly increasing price path would beinteresting to consider but would likely not influence our main conclusionsmarkedly aside from the remarks that were already made in our benchmarkcalculations above. We set the net revenue from oil to be barrel productiontimes the world price per barrel minus costs estimated to be $20 per barrel;we assume these costs to be constant over time in real terms.
A crucial feature of the calibration is the size of the oil revenue relative to(net-of-oil) GDP. In terms of the model, given any normalization of z0, andwith an initial oil price of 100, this size is obtained by selecting the barrelunit relative to total output appropriately. Uganda’s GDP in 2011 wasmeasured at $16.8 billion. Tullow’s estimate for 2018 of 32,850,000 barrelsproduced mean a revenue of (100 ·1.047−20) ·32.85 ·106, which equals $3.666billion. Relative to 2011 GDP this gives 21.8%, which is how the model oilunits are thus chosen. We note here that offi cial GDP figures and a currentexchange rate are used, as opposed to a PPP-adjusted measure. We deemthe PPP adjustment inappropriate for the model analysis since it involvesusing a relative price between traded and non-traded goods which is not inline with the domestic evaluation of these goods.14 Thus, Ugandan GDPincluding oil would rise at the order of magnitude of 50% at the peak of theextraction path, whereas when using PPP-adjusted GDP the level is on theorder of 15—20%.
A fund setup will also be examined as an alternative; the details arediscussed below.
3.4 Results
We look at a sequence of illustrations, beginning with the case where Ugandaproceeds without any oil income. This case is not interesting per se but it
14The model here does not have the distinction between traded and non-traded goodsbut the discussion in Section 4.2 does.
20

serves as a comparison and as a way of explaining the basic features of theeconomy. We then look at how oil revenues affect outcomes if they accruesaccording to the Tullow scheme– one that can be regarded as a maximallyfast extraction– and the economy is closed, i.e., where any revenue is con-sumed or invested immediately. Next, this case is compared to one wherethere is unlimited access to borrowing and lending. We also look at a casewhere although the oil revenue is extracted according to the Tullow scheme,they are not used up as they arrive but rather put in a fund from which onlya limited amount is withdrawn for consumption or investment each year. Al-though our analysis could be amended to allow any intermediate schemesfor extraction and use of the oil resources, we believe these different casesbracket most of the remaining possibilities because they emphasize the pos-sible advantages and disadvantages of different setups. Throughout we usethe calibration detailed in the previous section; any additional assumptions(such as the details of the fund construction) will be highlighted below.
3.4.1 The case without oil
Under the assumption that Uganda received no oil revenue, the economyshould be expected to converge rather smoothly to the balanced growthpath, as TFP growth is initially high and is gradually slowing down andas the investment wedges gradually disappear. Indeed the private capitalstock moves from an initial value (relative to the technology trend) of 2.1 toone of 5.4, i.e., almost a tripling, and the public capital stock moves from1.1 to 4.7, i.e., almost a fivefold increase. These changes occur slowly bothbecause the ineffi ciencies disappear slowly and because transition dynamicsare a little less fast in this model, where the decreasing returns to capitalbroadly defined (private plus government) are weaker than in the standardmodel.
Let us now look in some more detail at the two key variables in theirtransformed versions, as graphed in Figure 7 below.
We see that the transition path is somewhat nonsmooth at the outset,reflecting an initial boost to private investment at the expense of public in-vestment due to the fact that the falls in the wedges are larger in percentageterms for private investment. The reason is that these wedges do not accrueto the undepreciated part of capital, which is much larger for public capi-tal, so the initial drops in the wedges work like a boost to private capitalin relative terms. Thus, the initial opposite reactions of the capital stocksare somewhat surprising but logical given our setting. However, they arequantitatively unimportant in the comparison of the different setups for oil
21
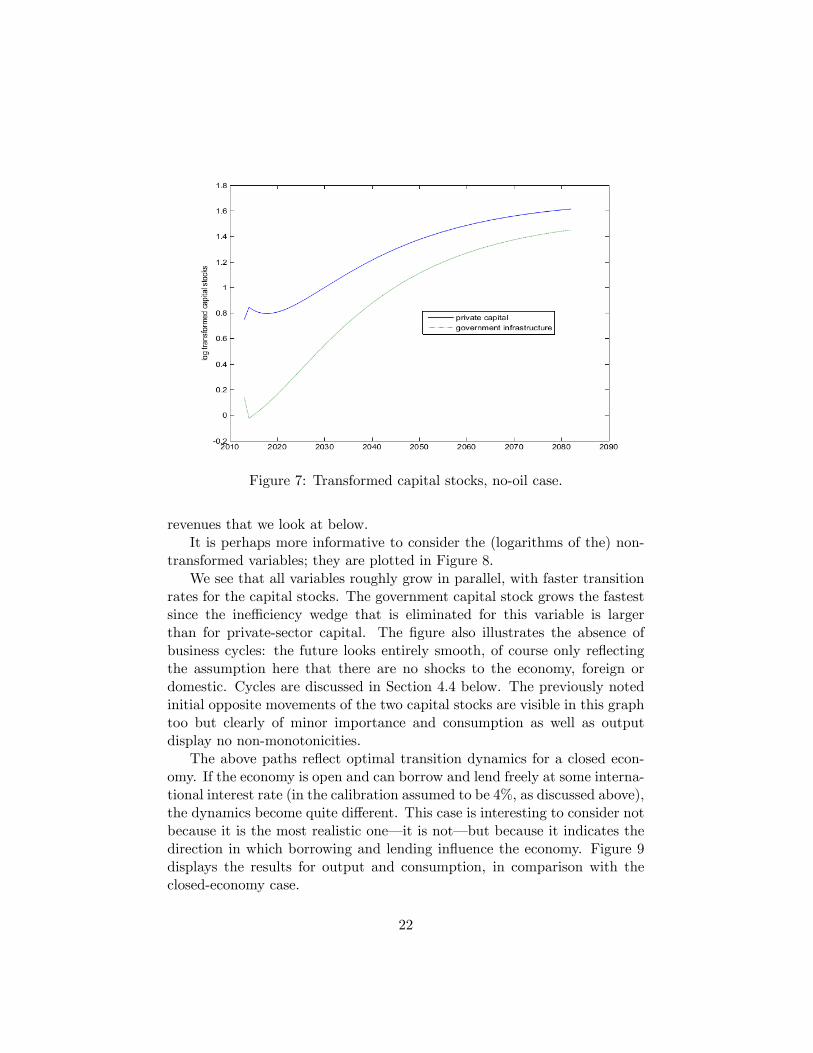
Figure 7: Transformed capital stocks, no-oil case.
revenues that we look at below.It is perhaps more informative to consider the (logarithms of the) non-
transformed variables; they are plotted in Figure 8.We see that all variables roughly grow in parallel, with faster transition
rates for the capital stocks. The government capital stock grows the fastestsince the ineffi ciency wedge that is eliminated for this variable is largerthan for private-sector capital. The figure also illustrates the absence ofbusiness cycles: the future looks entirely smooth, of course only reflectingthe assumption here that there are no shocks to the economy, foreign ordomestic. Cycles are discussed in Section 4.4 below. The previously notedinitial opposite movements of the two capital stocks are visible in this graphtoo but clearly of minor importance and consumption as well as outputdisplay no non-monotonicities.
The above paths reflect optimal transition dynamics for a closed econ-omy. If the economy is open and can borrow and lend freely at some interna-tional interest rate (in the calibration assumed to be 4%, as discussed above),the dynamics become quite different. This case is interesting to consider notbecause it is the most realistic one– it is not– but because it indicates thedirection in which borrowing and lending influence the economy. Figure 9displays the results for output and consumption, in comparison with theclosed-economy case.
22

Figure 8: Capital, output and consumption, no-oil case.
Figure 9: The closed vs. the open economies, no-oil case.
23

Several points are noteworthy here. First, the long-run path for out-put will be the same whether the economy is open or closed: the modelis calibrated so that the real interest rate will be the same. We see thatthe open-economy output is above closed-economy output throughout (ex-cept in the first year) but with a decreasing gap. The reason why output ishigher is that the internal interest rate in the closed-economy case is higherduring the transition and only gradually falls to 4%, so less capital is usedwhen foreign borrowing cannot be used to (partly) finance investment. Sec-ond, and most importantly, we see that consumption is quite a bit higher inthe open-economy case initially and for several decades.15 This is becausemarginal utility is very high initially; Ugandan output is low at the outsetcompared to its future potentials, given that the ineffi ciencies are expectedto go away over time, so it is optimal to borrow significantly right at theoutset to boost consumption. The growth path for consumption in the openeconomy is therefore less steep than in the closed economy, and eventuallythe paths cross, as loans need to be paid back. Third, although welfare isnot plotted, it is clear that welfare is higher in the open-economy case: con-sumption smoothing is beneficial, and to the extent international marketsallow it and the economy can commit to paying back, borrowing is optimal.Note, however, that we are abstracting from intergenerational considerationshere; in 2050, when the two consumption paths cross, many of the citizensenjoying the higher consumption with borrowing are no longer alive, leavingdebt repayment to later generations. We will return to these issues below.
3.4.2 Spend-as-you-go under Tullow’s extraction scheme
We now add Tullow’s extraction scheme (refer to graph above) in the contextof the economy just studied. The maintained assumption in this benchmarkcase is that the oil revenues (i.e., the price obtained in the world market mi-nus the costs) go straight into the domestic budget and that these resourcesare allocated optimally between consumption and investment: “spend-as-you-go”. Our main focus is on a closed economy and the benchmark case isone where oil price grow according to Hotelling’s rule, i.e., at 4% per yearin real terms. Such an assumption is fairly optimistic compared to manyscenarios discussed in the literature. As we discussed in subsection 2.2, analternative scenario with no real price growth would reduce the value of theoil by almost one half.16
15The initial consumption gap is as high as 71%.16 It should be pointed out that the discounting of future revenues in a closed economy
does not involve a international rate but a domestic one, which we have argued is higher
24

Figure xyz below displays the paths for the transformed capital stocks;once again the focus on the transformed stocks is to emphasize the logic ofthe transition.
We see that the case with oil leads to significantly lower capital accumu-lation right from the outset. This may seem surprising but the reason is thatin a closed economy that foresees increased income in the future there willbe a consumption reaction: the “wealth effect”from the new future revenuesmakes it optimal to consume more now. Given an increase in consumption,if the economy is closed, there must be a fall in investment. In this case,we see that as the oil revenues come in– in 2018 according to the scheme–there is a strong rebound of investment and within a little less than ten yearsthe capital stocks under the oil scenario are above those that would haveprevailed had the oil revenue not been present. The model exaggerates theinitial fall in the capital stocks somewhat since investment is assumed to bereversible and not subject to adjustment costs.17 The initial consumptionboom would not be as strong if it were harder to move resources to theconsumption-producing sector. Furthermore, note that we are abstractingfrom investments in oil extraction. Clearly, such investments are initiallyvery large.18
The paths for (untransformed, log) consumption and output are plottedin Figure 10.
We confirm that consumption indeed is significantly higher with oil; al-ready from the beginning of time, there is an increase in consumption of over30%. We see that as a result, output is very sluggish– given that invest-ment is falling so markedly– but that it catches up around 10 years afterthe first oil revenue is collected. Output is then permanently higher, thoughasymptotically the output paths with and without oil are of course identical.
As observed, the spend-as-you-go benchmark allows a rather stark in-crease in consumption already in the first year by reducing investment dra-matically. Thus, even in a closed economy the initial consumption responseis strong. Of course, the response is even stronger in one considers anopen economy: there, the added oil revenue allows consumption to react
in Uganda along the transition to the balanced growth path.17A second reason for the large initial drop in the capital stocks is that the loss expe-
rienced when investing due to κ and κg being positive is received back when the capitalstocks are reduced. Relaxing this assumption would only affect the analysis for the initialperiod when capital stocks are falling, however, and would not influence the aggregateanalysis more than very marginally.18We could include these investments exogenously by subtracting them from oil rev-
enues.
25

Figure 10: Transformed capital stocks, Tullow extraction, spend-as-you-go.
even more, since it is possible to borrow against all the future revenue in-creases. Figure 11 below compares the consumption and output paths inthree economies: it displays the variables with oil and an open economy andwithout oil relative to the Tullow, closed-economy benchmark.
Looking at consumption first, clearly there is a major additional boostto consumption initially if borrowing is unrestricted.19 The open-economyboost to consumption is also prolonged and the consumption path of thebenchmark closed-economy case only catches up at around 2070. One rea-son for this is the effect on output: output also experiences a major boost inthe open economy, since it is now possible to invest immediately at a lowerrate, without any adverse impact on consumption. Thus, overall welfare isincreased both by allowing better consumption smoothing– in particular,consuming early when marginal utility is very high– and by increasing pro-duction in a present-value sense. The figure also graphs the no-oil cases forcomparison.
19The boost is almost 50% initially.
26
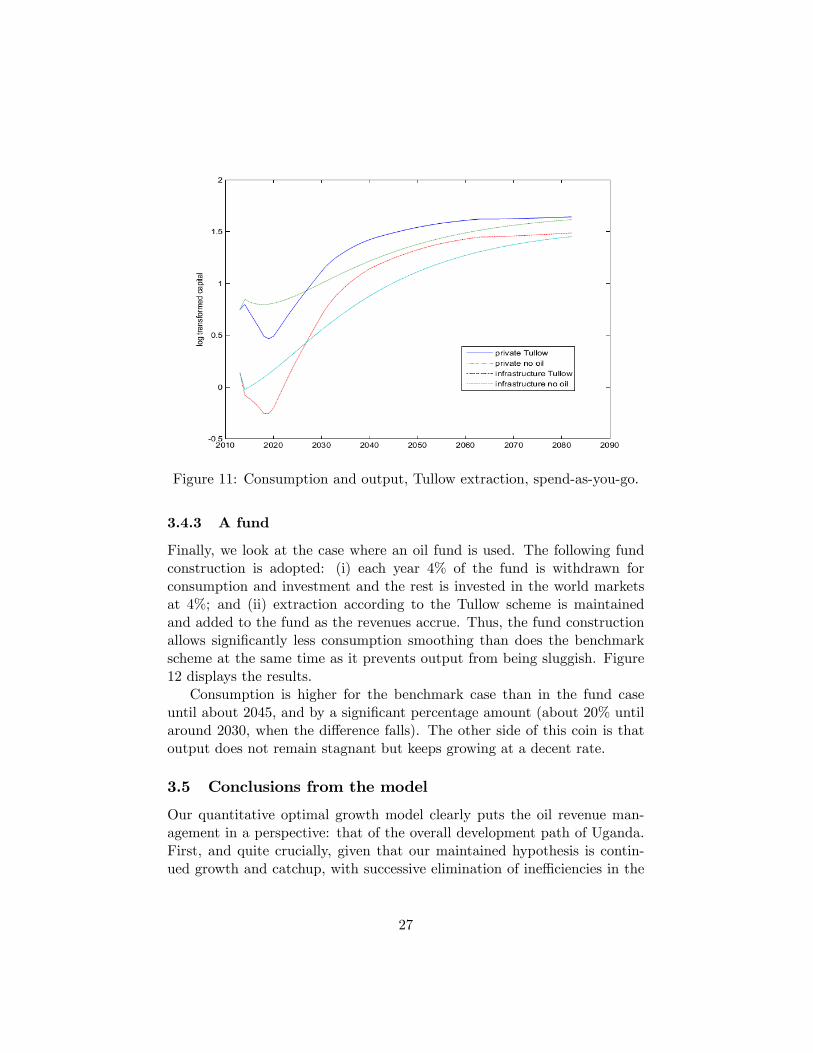
Figure 11: Consumption and output, Tullow extraction, spend-as-you-go.
3.4.3 A fund
Finally, we look at the case where an oil fund is used. The following fundconstruction is adopted: (i) each year 4% of the fund is withdrawn forconsumption and investment and the rest is invested in the world marketsat 4%; and (ii) extraction according to the Tullow scheme is maintainedand added to the fund as the revenues accrue. Thus, the fund constructionallows significantly less consumption smoothing than does the benchmarkscheme at the same time as it prevents output from being sluggish. Figure12 displays the results.
Consumption is higher for the benchmark case than in the fund caseuntil about 2045, and by a significant percentage amount (about 20% untilaround 2030, when the difference falls). The other side of this coin is thatoutput does not remain stagnant but keeps growing at a decent rate.
3.5 Conclusions from the model
Our quantitative optimal growth model clearly puts the oil revenue man-agement in a perspective: that of the overall development path of Uganda.First, and quite crucially, given that our maintained hypothesis is contin-ued growth and catchup, with successive elimination of ineffi ciencies in the
27
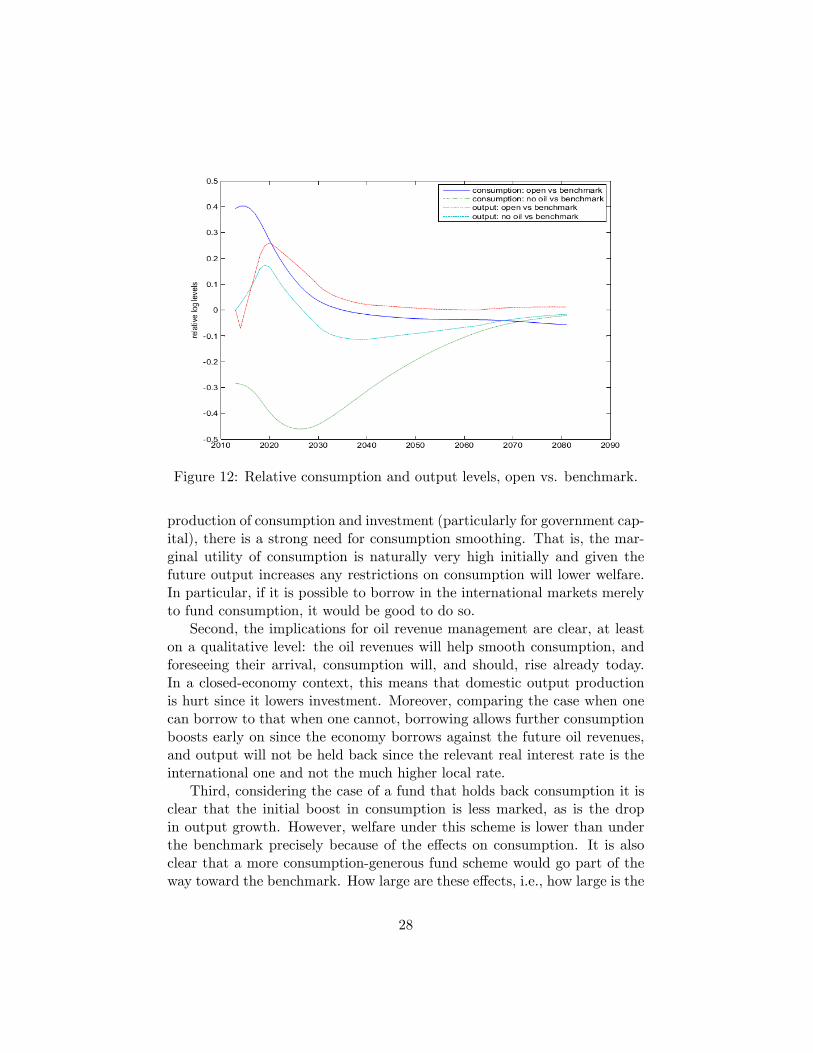
Figure 12: Relative consumption and output levels, open vs. benchmark.
production of consumption and investment (particularly for government cap-ital), there is a strong need for consumption smoothing. That is, the mar-ginal utility of consumption is naturally very high initially and given thefuture output increases any restrictions on consumption will lower welfare.In particular, if it is possible to borrow in the international markets merelyto fund consumption, it would be good to do so.
Second, the implications for oil revenue management are clear, at leaston a qualitative level: the oil revenues will help smooth consumption, andforeseeing their arrival, consumption will, and should, rise already today.In a closed-economy context, this means that domestic output productionis hurt since it lowers investment. Moreover, comparing the case when onecan borrow to that when one cannot, borrowing allows further consumptionboosts early on since the economy borrows against the future oil revenues,and output will not be held back since the relevant real interest rate is theinternational one and not the much higher local rate.
Third, considering the case of a fund that holds back consumption it isclear that the initial boost in consumption is less marked, as is the dropin output growth. However, welfare under this scheme is lower than underthe benchmark precisely because of the effects on consumption. It is alsoclear that a more consumption-generous fund scheme would go part of theway toward the benchmark. How large are these effects, i.e., how large is the
28

loss in reducing consumption smoothing under the fund scheme considered inthe section above? Arguably not giant. We saw significant early losses fromusing the fund but, of course, later gains. Any such losses must be weighedagainst other drawbacks of the spend-as-you-go benchmark scheme, such asa possible Dutch disease, strains on the local consumption-producing sector,incentives for ineffi cient/opportunistic use of the revenues, and so on. Thus,the basic observations and recommendations we deliver here come with anumber of qualifications and these are discussed in the following sections.
4 Considerations outside of the model
The model we constructed and analyzed in the previous section is obviouslystylized and necessarily abstracts from a number of important considera-tions. In this section, we will go beyond the formal analysis and discuss anumber of issues to which particular attention must be paid.
4.1 Transparency and accountability
Countries abundant in natural resources such as oil and metals have experi-enced highly disparate economic, political, and social developments. Thereis a vast amount of studies that document how countries are affected bynatural resource discoveries (see, e.g., van de Ploeg, 2011, for a survey).Some experiences are clearly positive ones: the added resources lead to im-provements along most economic and social dimensions. However, for othercountries– unfortunately a majority– the experience is instead rather neg-ative. The consensus today is that the largest risks arise in the politicalarena. The rents from the resources may, and often do, spark or reinforcecorruption at various political and social levels and lead to the underminingof democratic institutions, all with the purpose of gaining control over theresource rents. These effects, in turn, trigger economic stagnation, inequal-ity and sometimes even armed conflicts. To uphold and develop the politicalinstitutions is therefore of first-order importance also for Uganda.
One needs to be extremely wary of the possibility of these negative devel-opments and it is important to realize that they are not set in stone: thereare measures one can undertake to minimize the risks that they will surface.One problem that can be addressed has to do with transparency. One ex-ample of lack of transparency is the sharing agreements of oil revenues inUganda: they are not public. This clearly limits the ability of media and thecitizens of Uganda to scrutinize the agreements and to investigate whether
29
they contain problematic elements and whether they address all the impor-tant issues in a proper way. An explanation often raised to defend the lackof transparency is that the sharing agreements contain sensitive informationfor the oil companies. This explanation does not, however, seem satisfac-tory. First, our clear impression from discussing the agreements with the oilcompanies is that these companies themselves do not ask for confidentiality.Second, there are many countries where the sharing agreements are publicwithout hindering international investments.
The recent oil bill that was approved by parliament gives the Ministerof Energy and Mineral Development the authority to sign and revoke agree-ments with oil companies. To avoid the risks of considerations not in linewith the welfare of the Ugandan people, i.e., an undue influence on the oilexploration and the extraction process, it would be preferred if the rulesgoverning the formation and signing of agreements were drawn by the min-ister and approved by parliament but, importantly, that the execution ofthese rules would be carried out by an independent authority. This way (i)the authority can be held accountable if they fail to implement the rulescorrectly and (ii) the politicians can be held accountable if they create ruleswhich are not publicly approved. We want to emphasize that the lack oftransparency certainly is problem also in developed countries.
A closely related problem in resource-rich countries is that large revenuesmay make spending decisions worse from a social point of view. Adversepartisan influence over these decisions is hard to avoid also in developedcountries and call for caution in Uganda as well. First of all, oil incomecreates the risk of using more of the revenues for public spending in electionyears to boost the popularity of incumbent politicians. In Uganda, followingthe oil bill, the parliament decides on how much of the oil revenues each yearthat will be invested in the sovereign wealth fund and how much that will bespent right away. Likewise, the parliament decides on how much that will betaken out from the sovereign wealth fund. The beneficial democratic effectof this is obvious and it allows for using the sovereign wealth fund as a toolfor mitigating business-cycle fluctuations, an issue we will return to below.However, it naturally also creates a temptation to over-spend in electionyears. To avoid this, some countries have created a spending rule whichstates how much can be used in a certain year. For example, the Norwegianspending rule stipulates that all of the revenues from the oil go straight tothe SWF and that no more than 4% of the fund’s value can be used in agiven year. This precise formulation implies a spending of oil revenues whichis increasing over time. As we showed in the theoretical sections, such a pathmay imply too low a consumption flow for current generations and should
30

thus not be taken as a blueprint for a developing country such as Uganda.However, a modified version of such a rule may still be useful in order toavoid political temptations. One possibility would be a rule that specified apath for investment in the sovereign wealth fund over time. Currently, sucha rule or consensus does not seem to be available in Uganda but it would bedesirable to arrive at one.
An issue related to how to use the resource income is the selection ofspecific investment projects. Earlier research has documented that resourcespending quite often goes toward projects with low returns, motivated bypleasing various political groups or electorates. A key optimality condi-tion that came out of our theoretical model was that the return on publicand private investments should be equalized. Since the return on publicinvestments are not measured by markets, they have to be calculated byeconomists trained at cost-benefit analysis. These skills are available in theUgandan authorities. However, the fact that individual public investmentprojects may benefit some groups of individuals more than others createsstrong incentives to distort these calculations. In addition, of course, out-right corruption is an obvious danger.
The above considerations imply that it is necessary to strengthen thestate comptroller and other authorities monitoring the conduct of govern-ment, politicians and the bureaucracy. We want to emphasize that theseare measures that should be undertaken before the resource revenues startflowing, as strong institutions will not only be beneficial for avoiding corrup-tion but also for protecting themselves against the risk of being underminedby politicians with personal agendas. Deciding on how to spend on publicinvestments is a political task that hardly can be delegated to an indepen-dent agency, at least when the investment project is large. However, a rulestating that public investments over a certain size needs to be evaluated byan independent agency can increase transparency and enhance the qualityof decisions without compromising democratic principles. Here, it may beadvisable to use international consulting agencies until domestic institutionswith suffi cient competence and independence are built. It may also be rea-sonable that when large infrastructure projects are proposed, the runner-upalternative in terms of social profitability is also presented.
4.2 The Dutch disease
One often raised concern is a detrimental effect that added natural-resourcerevenues can have on other sectors. This mechanism is the so-called Dutch
31

disease.20 This concept captures the tendency that oil extraction leads to acurrency appreciation, lowering competitiveness in other export sectors. Inan analysis of this issue, it is important to first note that the mechanismsbehind a loss of competitiveness in other export sectors following an expan-sion of oil exporting exist also in economies that function perfectly. After awindfall income gain, domestic demand for non-tradables produced domesti-cally increases. To meet the higher demand, output expands, which requiresa resources reallocation from the export sector to the non-tradables sector.This is achieved by a real appreciation that reduces the relative profitabilityof non-oil exports. Thus, an increase in the real exchange rate should notnecessarily be judged as a failure or an unwanted side effect. In this senselabeling it a “disease”may be quite misleading.
To illustrate this, consider a very simple static model where individu-als consume two goods c and s. Good c is a tradable good and its price,normalized to unity, is given from the world market. The price of the non-tradable is denoted p and this is also a measure of the real exchange rate.A representative household derives utility from the two goods according to
U = ln(sγc1−γ).
Here, we can think of C ≡ sγc1−γ as a measure of aggregate consumption.Domestic production of good c is exposed to foreign competition: it
is import-competing. However, the production of good s is shielded fromcompetition from abroad. The representative household purchases the twogoods under a budget constraint
ps+ c = w
where w is income. Now, it is straightforward to show that the representativehousehold will spend an income share on each good that is determined bythe parameter γ. Specifically, γw is spent on the non-tradable and (1− γ)wis spent on the tradable. Thus, ps = γw and c = (1− γ)w, implying that
p =γ
1− γc
s. (4)
Suppose now that economy finds oil so that w goes up. Consider twopossibilities, the first being that the supply of the non-tradable is inelastic.To make the point clear, suppose it is perfectly inelastic. Then, by assump-tion, s cannot change and all the oil revenue is used on the tradable. In this
20See, for instance, Corden & Neary (1982) and Matsuyama (1992).
32
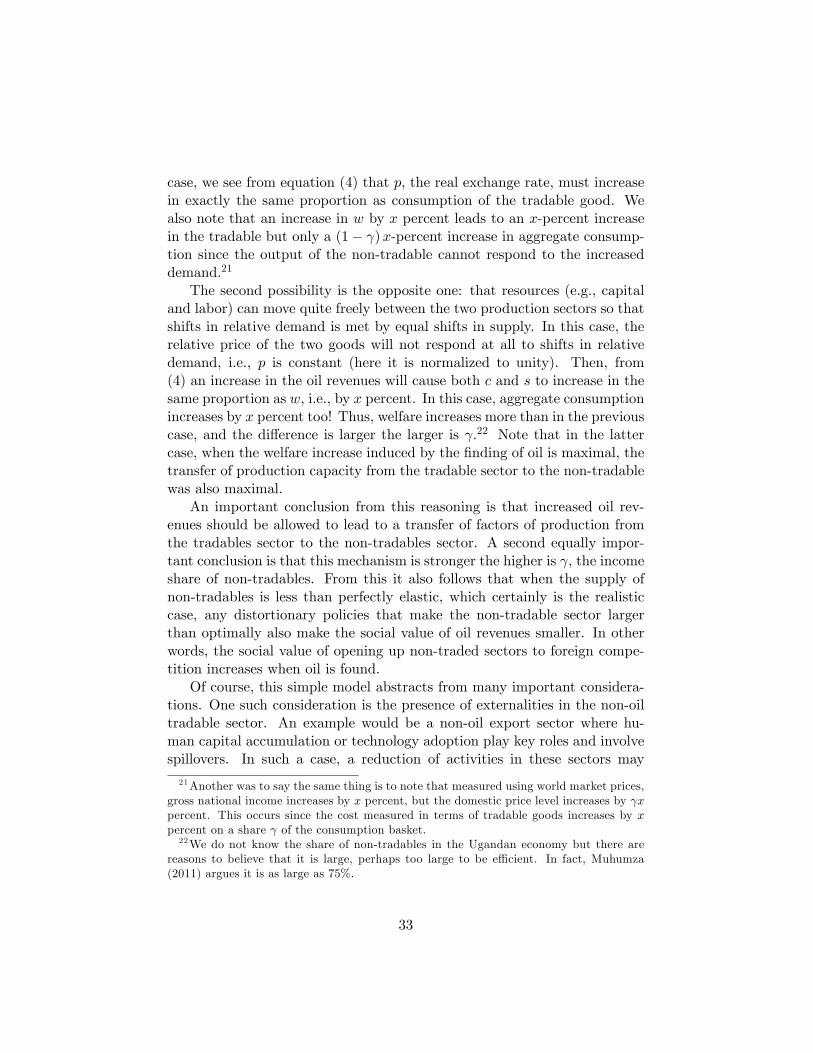
case, we see from equation (4) that p, the real exchange rate, must increasein exactly the same proportion as consumption of the tradable good. Wealso note that an increase in w by x percent leads to an x-percent increasein the tradable but only a (1− γ)x-percent increase in aggregate consump-tion since the output of the non-tradable cannot respond to the increaseddemand.21
The second possibility is the opposite one: that resources (e.g., capitaland labor) can move quite freely between the two production sectors so thatshifts in relative demand is met by equal shifts in supply. In this case, therelative price of the two goods will not respond at all to shifts in relativedemand, i.e., p is constant (here it is normalized to unity). Then, from(4) an increase in the oil revenues will cause both c and s to increase in thesame proportion as w, i.e., by x percent. In this case, aggregate consumptionincreases by x percent too! Thus, welfare increases more than in the previouscase, and the difference is larger the larger is γ.22 Note that in the lattercase, when the welfare increase induced by the finding of oil is maximal, thetransfer of production capacity from the tradable sector to the non-tradablewas also maximal.
An important conclusion from this reasoning is that increased oil rev-enues should be allowed to lead to a transfer of factors of production fromthe tradables sector to the non-tradables sector. A second equally impor-tant conclusion is that this mechanism is stronger the higher is γ, the incomeshare of non-tradables. From this it also follows that when the supply ofnon-tradables is less than perfectly elastic, which certainly is the realisticcase, any distortionary policies that make the non-tradable sector largerthan optimally also make the social value of oil revenues smaller. In otherwords, the social value of opening up non-traded sectors to foreign compe-tition increases when oil is found.
Of course, this simple model abstracts from many important considera-tions. One such consideration is the presence of externalities in the non-oiltradable sector. An example would be a non-oil export sector where hu-man capital accumulation or technology adoption play key roles and involvespillovers. In such a case, a reduction of activities in these sectors may
21Another was to say the same thing is to note that measured using world market prices,gross national income increases by x percent, but the domestic price level increases by γxpercent. This occurs since the cost measured in terms of tradable goods increases by xpercent on a share γ of the consumption basket.22We do not know the share of non-tradables in the Ugandan economy but there are
reasons to believe that it is large, perhaps too large to be effi cient. In fact, Muhumza(2011) argues it is as large as 75%.
33

hamper growth both in the short and the long run. Similarly, there mayexist irreversibilities where a lowering of investments in a sector makes itdiffi cult to re-stimulate it once the oil runs out. In itself, such irreversibili-ties do not invalidate the arguments put forth above. However, there maybe other imperfections that lead to such irreversibilities not being properlytaken into account by markets and governments. For example, it is possiblethat individual occupational and educational choices– perhaps because oflack of information– do not fully take into account the temporary nature ofthe change in relative profitability of different occupations associated witha real exchange rate appreciation due to a temporary boost in export rev-enues. In such a case the Dutch disease may cause problems also in the longrun.
Political considerations are important in this context as well. One caneasily imagine that the pressure to remove ineffi cient regulation in the exportsector and undertake other measures to enhance its competitiveness falls asthe economy finds a new source of export revenues. This is a clear dangerthat needs to be addressed at its root, i.e., by making sure that the reformpressure remains high. Measures focused on affecting the real exchangerate are thus not likely to be helpful. However, a strong real appreciationassociated with serious problems of competitiveness may be a warning signalthat productivity enhancing measures need to be strengthened. The simpleback-of-the envelope calculation in section 1.2 may serve as a warning: ifgrowth over just a few years is permanently lost due to bad economic policy,the cost of this can easily be of the same order of magnitude as the value ofthe Ugandan oil.
Another potential problem associated with a real exchange rate appre-ciation is that it can have unwanted distributional consequences. A realexchange rate appreciation by definition implies that the relative price ofdomestically produced goods increase. To the extent that low-income house-holds consume a larger share of such goods than does the average household,real income inequality may rise. A real exchange rate appreciation will tendto raise the relative price of domestically produced non-traded food. It iswell known that this can lead to increased social tension and even severe vio-lence. Also, as was discussed in a previous section, research has documentedthe strongest resource curse effects coming through an institutional channelwhere resources lead to more corruption and institutional decline and anamassment of the oil profits in the political and economic elite, which exac-erbates the economic inequality. These problems may certainly overshadowany macroeconomic problems associated with the Dutch disease.
34
4.3 Lowering taxes
With revenues from oil, it is possible to lower taxes while keeping totalgovernment revenues unchanged. Would such a policy be effi cient?
To answer this question, one needs to ask how distortionary Ugandantaxes are currently. On the one hand, general government revenue is lowcompared to that in developed countries, totaling 15.6% of GDP in 2010.23
This suggests that tax rates, and therefore distortions, are low. On the otherhand, low total tax revenues may be the result of a combination of high taxrates and pervasive activities to avoid taxes. In such a situation, the taxdistortions may be high despite the low revenues.
A complete description of the Ugandan tax system is beyond the scope ofthis report. However, we note that at least some Ugandan tax rates appearto be high also from an international perspective. According to the web sitehttp://www.tax rates.cc, the standard VAT rate is 18% and the corpo-rate income tax is 30%. A clear possibility is also that actual tax paymentsare concentrated in certain sectors and larger firms. Similarly, taxes are nat-urally higher in the formal sector, which is also typically the most importantfor technology adoption and export activities. This creates a wedge that notonly distorts the economy in a static sense but also hinders development andreduces growth. In fact, it is precisely this mechanism that is argued to be amain cause behind the low degree of competitiveness of the Greek economy.Greece has a very high share of self-employed workers, arguably due to ahighly distorting effect of tax rates in combination with loopholes that moreeasily can be taken advantage of by small firms and the self-employed.24
As in Greece, there is also reason to suspect that taxes create distortionsthat disproportionately affect export- and import-competing sectors, thusconstituting a prime suspect behind tendencies toward real exchange rateappreciations and current account deficits.
Clearly, higher state capacity and higher-quality public institutions gen-erally make it possible to create a more effi cient tax system, i.e., a systemthat can generate a given revenue with less distortions. However, one mayalso consider the reverse causal chain. It has been emphasized in the liter-ature that financing government expenditures with taxes rather than withforeign aid may lead to a more effective democratic control over how gov-ernment resources are used.25 The idea here is that citizens may have atendency to care more about how their own tax payments are spent than
23Source:IMF, WEO Database, October 2012.24See Corsetti et al. (2011).25See Moss et al., (2008).
35

about other government revenues. This creates an argument in favor of taxesand may have the implication that tax distortions are lower than withoutthis mechanism. A tax system with broad tax bases where a large share ofthe population participate in the financing of public goods may, thus, gener-ate high levels of democratic control. In contrast, a system full of loopholesis more likely to generate activity aimed at reducing tax payments.
Taxation capacity is not built over night and efforts to make the systemmore effi cient should not be diminished. As discussed in the previous subsec-tion, there is an obvious risk that windfall income, like that from expandingoil revenues, reduces the pressure to deal with a badly constructed tax sys-tem. It is very important that the Ugandan economy not pretend that “itcan afford not to undertake reforms”Our impression that current taxes arequite distortionary and growth-hampering leads us to conclude that the re-duced financial pressure on the government coming from future oil revenuesshould be used to reduce taxes on the formal sector of the economy. Reduc-tions in profit taxes and capital income taxation should, therefore, be a verywelcome aspect of a tax reform. By using oil revenues to reduce taxes, thereis thus a possibility of a “double dividend”from the new oil revenues, sincethe reductions in tax rates have secondary benefits on Ugandan citizens andare likely to be growth-enhancing.
4.4 Income volatility and sovereign wealth funds
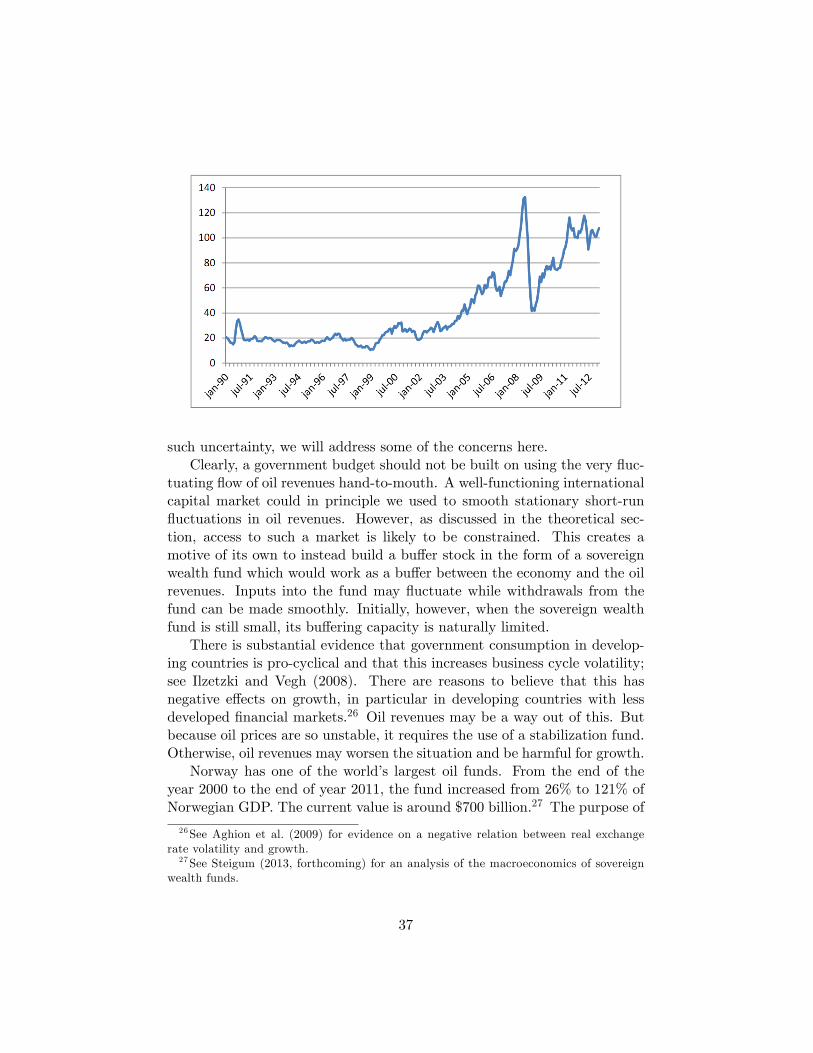
The oil price is notoriously volatile, as seen in Figure 12. Over as shorta period as the last five years, the monthly average crude oil price hasvaried between over $130 per barrel in July 2008 and close to $40 per barrelduring the spring of 2009. As the financial crisis has been calming down, theoil price has stabilized somewhat but certainly remains extremely volatilerelative to, e.g., manufactured goods traded on the world market. The exactcauses of these fluctuations are not known but both long-run and short-runexpectations of supply and demand seem to play important roles. Clearly,the safest prediction about future oil prices is that they are likely to remainvolatile and uncertain for the foreseeable future.
The price volatility has (at least) two important implications. The firstis that the income stream from a given smooth extraction path becomesvolatile. Since extraction is partly determined by physical constraints andby capital investments that are made many years in advance, it is not eco-nomically reasonable to change the extraction path in order to perfectlysmooth revenues. The second implication is that the total value of not yetextracted resources is unknown. Since our theoretical model abstracted from
36
such uncertainty, we will address some of the concerns here.Clearly, a government budget should not be built on using the very fluc-
tuating flow of oil revenues hand-to-mouth. A well-functioning internationalcapital market could in principle we used to smooth stationary short-runfluctuations in oil revenues. However, as discussed in the theoretical sec-tion, access to such a market is likely to be constrained. This creates amotive of its own to instead build a buffer stock in the form of a sovereignwealth fund which would work as a buffer between the economy and the oilrevenues. Inputs into the fund may fluctuate while withdrawals from thefund can be made smoothly. Initially, however, when the sovereign wealthfund is still small, its buffering capacity is naturally limited.
There is substantial evidence that government consumption in develop-ing countries is pro-cyclical and that this increases business cycle volatility;see Ilzetzki and Vegh (2008). There are reasons to believe that this hasnegative effects on growth, in particular in developing countries with lessdeveloped financial markets.26 Oil revenues may be a way out of this. Butbecause oil prices are so unstable, it requires the use of a stabilization fund.Otherwise, oil revenues may worsen the situation and be harmful for growth.
Norway has one of the world’s largest oil funds. From the end of theyear 2000 to the end of year 2011, the fund increased from 26% to 121% ofNorwegian GDP. The current value is around $700 billion.27 The purpose of
26See Aghion et al. (2009) for evidence on a negative relation between real exchangerate volatility and growth.27See Steigum (2013, forthcoming) for an analysis of the macroeconomics of sovereign
wealth funds.
37

the Norwegian fund is “to avoid excessive and non-sustainable governmentspending of petroleum revenues”(Steigum, 2013). In Norway, it seems rea-sonable to assume that the private as well as the public sector has goodaccess to the international capital market. Therefore, using the large oilrevenues to finance domestic investments would to a large extent only crowdout other sources of financing. Therefore, quickly building a large sovereignwealth fund that invests in foreign fixed income securities and shares was aquite natural choice. According to the fiscal guidelines set by the Norwegianparliament, the government can withdraw 4% of the asset value of the fundper year to be used in the budget. An important feature of the Norwe-gian fiscal framework, however, is that these 4% are measured as an averageover the business cycle. Thus, the fund is used as a source of stabilizinggovernment revenues, even allowing for counter-cyclical expenditures.
The second consideration we want to bring up is the fact that an un-certain future oil price makes the value of not yet extracted oil resourcesunknown. There are reasons to believe that the oil price is driven by a non-stationary stochastic process. This implies that oil price fluctuations do nottend to average out in the long-run. Instead, uncertainty about the oil priceshould increase as the forecast horizon is extended. This may create anincentive to reduce uncertainty by extracting quickly. Probably more im-portantly still, this creates a precautionary motive for saving, counteractingany borrowing against expected future oil incomes. This is an importantconsideration that was not included in the formal analysis in section 3.
For all the above reasons, we conclude that there are important argu-ments in favor of implementing a Ugandan sovereign wealth fund. There issubstantial academic work on sovereign wealth funds.28 There is also sub-stantial practical experience. An important example to study is Ghana’sPetroleum Funds that where set up shortly after commercial oil extractionbegan. Consistently with the two considerations mentioned above in thissubsection, Ghana has separated its wealth holdings into two separate funds,one intended to help smooth government budgets in the short and mediumrun and one intended to consider long-run objectives, like inter-generationalfairness. In Norway, it was decided that one wealth fund could serve bothpurposes by imposing the relatively flexible rule that as an average over thebusiness cycle, 4% of financial assets could be used by the government. Sucha rule allows flexibility but is problematic from an accountability point ofview. Since business cycles are irregular and since it is a matter of judgement
28See, for example Das et al. (2009). Bartsch (2006) focuses on the first of our consid-erations, namely the stabilization motive.
38

whether a given change in GDP is cyclical or more permanent, it is diffi -cult to evaluate whether the 4% rule is actually followed in any given year.Due to these considerations, the Ghanaian example seems more suitable toUganda. With a separation of the funds, limits are placed on how muchresources can be used for stabilization purposes; this is likely to enhance ac-countability. Portfolio considerations too may speak in favor of a separation.A stabilization fund should aim for a higher level of liquidity than a fundcreated for long-run objectives. Therefore, the benchmarks against whichthe two types of funds should be measured should likely differ. A separationthus makes it easier to create clear benchmarks which can facilitate fundaccountability.
Compared to Norway’s cas, where most of oil revenues are currentlysaved for future generations, 50-70% of the oil revenues in Ghana are not putin the oil fund but used immediately by the government (the “spend-as-you-go”part). Of the remaining 30-50%, about 2/3 are put in the stabilizationfund.29 A reason for the relatively large share put into the building of astabilization fund is for the fund to grow large, and therefore useful, fairlyquickly. Furthermore, as noted above, to the extent that a stabilizationfund can stabilize the macroeconomic fluctuations and possibly be growth-enhancing as well, building such a fund may reasonably be a high priority.
5 Conclusion and recommendations
We will now draw some tentative general conclusions from our analysis. Afirst important conclusion comes directly from the theoretical model. Thevalue of the oil discovered in Uganda is large. We have made relativelyoptimistic assumptions about the general outlook in Uganda, in particularabout the future oil price and about the possibility for Uganda to catch upwith the developed world in terms of TFP and investment effi ciency. Un-der such assumptions about the future, the model delivers the conclusionthat there is quite a strong argument for letting current generations sharein the prosperity promised by the future oil revenues. On the other hand,we have emphasized that future income is not safe manna from heaven: itis uncertain and requires that many challenging choices be made success-fully and temptations be avoided systematically. History is full of examplesof resource-rich countries that have found themselves in a situation whereoptimistic forecasts of future wealth have been replaced by despair– goldturning into sand, or something worse than sand.
29See, van der Ploeg (2011).
39
Our recommendation is therefore, first, to exercise caution in consumingthe expected proceeds from oil revenues, more so than what our modelsays is optimal. The large current account deficits need to be analyzedand government deficits should not be allowed to grow to fast. It is wellknown, not the least from the recent developments in the Euro area, thatlarge debts can be dangerous and often are destabilizing. Nevertheless, wemaintain that substantial amounts of oil revenues should be used for thebenefit of current generations. How much exactly is, of course, a politicaldecision. However, we insist on the importance of transparency in makingthis political decision. One possible way to achieve this is to set aside ashare of revenues in a sovereign wealth fund that invests in a broad worldmarket portfolio as, e.g., practiced by the Norwegian oil fund. In order tohave a well functioning process for making decisions about how to use oilrevenues, information about contracts and forecasts must be made public ina much freer way than currently.
We have also argued that oil revenues can yield a “double dividend”bymaking it possible to reduce distorting taxation. We do not have suffi cientknowledge about the Ugandan tax system to be able to suggest a specifictax reform, but reducing capital and corporate income tax rates may beparticularly important for growth while a reduction of value added taxesmay be more important for static effi ciency and perhaps equality.
Another possible form of double dividend is the use of oil revenue asa stabilization device. Properly employed, they can help the governmentsovercome the tendency for procyclical fiscal policy that is endemic in thedeveloping world. However, in itself, the oil revenue is likely to be bothhighly volatile and procyclical. Therefore, Uganda is well advised to set upan explicit stabilization fund that can be used for this purpose. The stabi-lization fund and the wealth fund, moreover, should be set up separately.Since they have different purposes and should be evaluated against differ-ent benchmarks, such a separation is important for ensuring accountability.Here, Ghana can provide an important example but lessons can also bedrawn from as far away as Norway. In particular, Norway provides a goodexample when it comes to transparency and clarity of goals, the investmentpractices, and accountability.
A final recommendation is to introduce a law that requires cost-benefitanalyses to be undertaken before large public investments are decided on.Such analyses should be made by independent agencies. In the near future,it seems reasonable to use international consulting firms for this. However,independent domestic agencies for the evaluation of how public resourcesare spent should also be set up. Moreover, this endeavor should not wait
40
until oil revenues start to arrive.All in all, after writing this report, we are optimistic: it seems possible,
and in power of Uganda’s citizens, to make oil a blessing and not a curse.
6 References
Bacchetta, P., R. Rancière and K. Rogoff,. (2009), "Exchange rate volatilityand productivity growth: The role of financial development". Journal ofMonetary Economics, 56(4).
Bartsch, U., "How Much is Enough? Monte Carlo Simulations of an OilStabilization Fund for Nigeria", IMF Working Paper 2006:142.
Corden, W. M. and Neary, J. P. (1982), "Booming Sector and De-industrialisation in a Small Open Economy", Economic Journal 92 (De-cember), 825-48.
Corsetti, G., M. P. Devereux, J. Hassler, G. Saint-Paul, H.W. Sinn, J.-E. Sturm and X. Vives, (2011), "Chapter 3: Greece", EEAG Report on theEuropean Economy 2011.
Das, U. S, Y. Lu, C. Mulder, and A. Sy, (2009), "Setting up a SovereignWealth Fund: Some Policy and Operational Considerations", IMF WorkingPaper 179:2009.
Henstridge, M. and J. Page, (2012), "Making a Modest Boom: Oil Rev-enues in Uganda", OxCarre Research Paper 90, Oxford Centre for the Analy-sis of Resource Rich Economies.
Ilzetzki, E., and C. A. Vegh, (2008), "Procyclical Fiscal Policy in Devel-oping Countries: Truth or Fiction", NBER WP 14191.
Jones, C. and D. Vollrath (2013), Introduction to Economic Growth,W.W. Norton.
Matsuyama, K. (1992), “Agricultural Productivity, Comparative Advan-tage, and Economic Growth”Journal of Economic Theory, 58(2): 317-34.
Moss, T., G. Petterson and N. van de Walle, "An Aid-Institutions Para-dox? A Review Essay on Aid Dependency and State Building in Sub-Saharan Africa", in ed. W. Easterly, Reinventing Foreign Aid, MIT Press,Cambridge USA.
Muhumuza, F. K., "Like Europe, Uganda needs major economic reform",Daily Monitor, Uganda, August 28, 2011.
Steigum, E., (2013 forthcoming), "Soveriegn wealth funds for macroeco-nomic purposes", Report for the Swedish Fiscal Policy Council, Stockholm,Sweden.
41
van der Ploeg, R. (2011), “Natural Resources: Curse or Blessing?”, Jour-nal of Economic Literature, Vol. 49, No. 2, pp. 366-420(55).
van der Ploeg, R., R. Stefanski and S. Wills, (2011), "Harnessing OilRevenues in Ghana", IGC.
Young, A., (2012), "The African Growth Miracle", Journal of PoliticalEconomy, 120:4.
42