Embed Size (px)
Citation preview

Twin Cities AreaEconomic and Business Conditions ReportFourth Quarter 2017
This issue is part of a series for the six planning areas of Minnesota: Central, Northeast, Northwest, Southeast, Southwest, and Twin Cities. The Twin Cities Planning Area consists of seven counties:
Anoka, Carver, Dakota, Hennepin, Ramsey, Scott, and Washington.
1
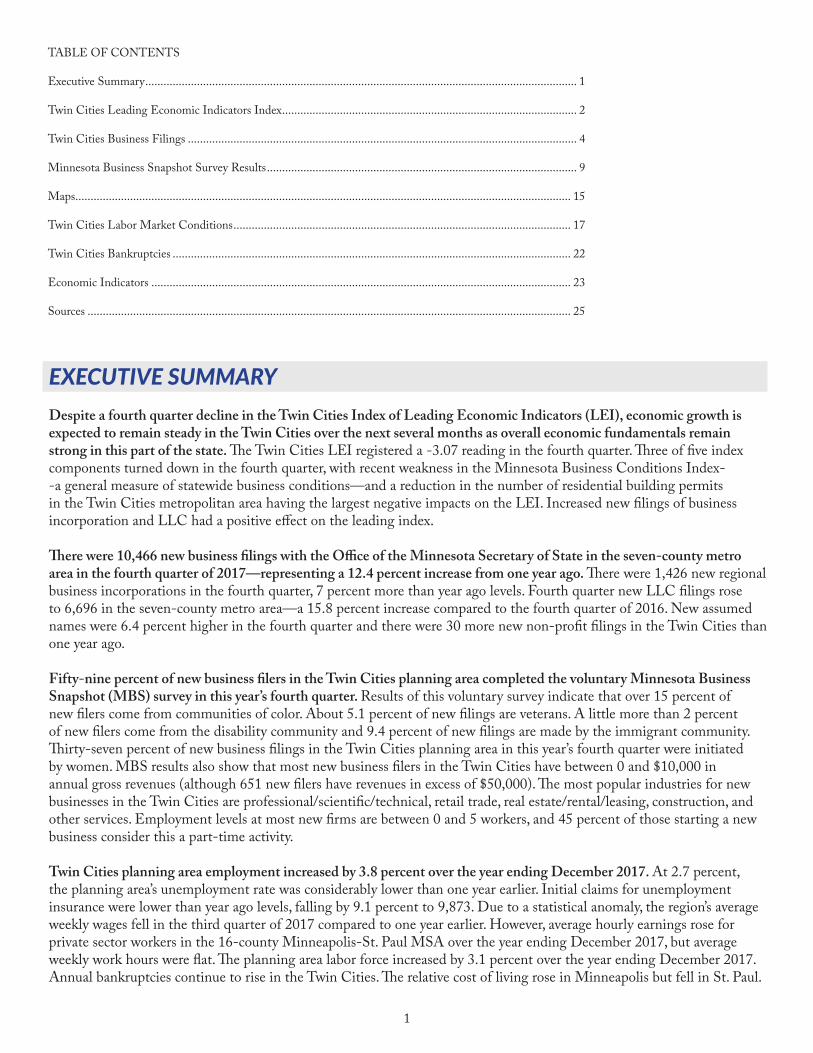
ExEcutivE SummaryDespite a fourth quarter decline in the Twin Cities Index of Leading Economic Indicators (LEI), economic growth is expected to remain steady in the Twin Cities over the next several months as overall economic fundamentals remain strong in this part of the state. The Twin Cities LEI registered a -3.07 reading in the fourth quarter. Three of five index components turned down in the fourth quarter, with recent weakness in the Minnesota Business Conditions Index--a general measure of statewide business conditions—and a reduction in the number of residential building permits in the Twin Cities metropolitan area having the largest negative impacts on the LEI. Increased new filings of business incorporation and LLC had a positive effect on the leading index.
There were 10,466 new business filings with the Office of the Minnesota Secretary of State in the seven-county metro area in the fourth quarter of 2017—representing a 12.4 percent increase from one year ago. There were 1,426 new regional business incorporations in the fourth quarter, 7 percent more than year ago levels. Fourth quarter new LLC filings rose to 6,696 in the seven-county metro area—a 15.8 percent increase compared to the fourth quarter of 2016. New assumed names were 6.4 percent higher in the fourth quarter and there were 30 more new non-profit filings in the Twin Cities than one year ago.
Fifty-nine percent of new business filers in the Twin Cities planning area completed the voluntary Minnesota Business Snapshot (MBS) survey in this year’s fourth quarter. Results of this voluntary survey indicate that over 15 percent of new filers come from communities of color. About 5.1 percent of new filings are veterans. A little more than 2 percent of new filers come from the disability community and 9.4 percent of new filings are made by the immigrant community. Thirty-seven percent of new business filings in the Twin Cities planning area in this year’s fourth quarter were initiated by women. MBS results also show that most new business filers in the Twin Cities have between 0 and $10,000 in annual gross revenues (although 651 new filers have revenues in excess of $50,000). The most popular industries for new businesses in the Twin Cities are professional/scientific/technical, retail trade, real estate/rental/leasing, construction, and other services. Employment levels at most new firms are between 0 and 5 workers, and 45 percent of those starting a new business consider this a part-time activity.
Twin Cities planning area employment increased by 3.8 percent over the year ending December 2017. At 2.7 percent, the planning area’s unemployment rate was considerably lower than one year earlier. Initial claims for unemployment insurance were lower than year ago levels, falling by 9.1 percent to 9,873. Due to a statistical anomaly, the region’s average weekly wages fell in the third quarter of 2017 compared to one year earlier. However, average hourly earnings rose for private sector workers in the 16-county Minneapolis-St. Paul MSA over the year ending December 2017, but average weekly work hours were flat. The planning area labor force increased by 3.1 percent over the year ending December 2017. Annual bankruptcies continue to rise in the Twin Cities. The relative cost of living rose in Minneapolis but fell in St. Paul.
TABLE OF CONTENTS
Executive Summary .............................................................................................................................................. 1
Twin Cities Leading Economic Indicators Index ................................................................................................. 2
Twin Cities Business Filings ................................................................................................................................ 4
Minnesota Business Snapshot Survey Results ...................................................................................................... 9
Maps ................................................................................................................................................................... 15
Twin Cities Labor Market Conditions ............................................................................................................... 17
Twin Cities Bankruptcies ................................................................................................................................... 22
Economic Indicators .......................................................................................................................................... 23
Sources ............................................................................................................................................................... 25

2
twin citiES LEading Economic indicatorS indEx
SCSU Twin Cities Index of Leading Economic Indicators (December 1999 = 100)
Components of SCSU Twin Cities Leading Economic Indicators Index
Component of Index Contribution to LEI, 4th quarter 2017
Contribution to LEI, 3rd quarter 2017
Minnesota Business Conditions Index -1.36 -4.12Twin Cities initial claims for
unemployment insurance -0.67 -1.66
Twin Cities new filings of incorporation and LLCs 0.37 0.86
Mpls.-St. Paul MSA residential building permits -1.94 -0.42
Philadelphia Fed Minnesota leading indicators 0.53 -0.07
TOTAL CHANGE -3.07 -5.41
The SCSU Twin Cities Leading Economic Indicators (LEI) index is designed to predict performance of the regional economy with a four-to-six month lead time. After falling by 5.41 points in the third quarter, the Twin Cities LEI fell another 3.07 points in the last quarter of 2017. Despite this, the Twin Cities index is still 7 percent higher than one year ago.
Year
Inde
x

3
Leading Economic Indicators Index
The Twin Cities LEI contains five components—two reflecting state business conditions and three for local conditions (the LEI is an index equal to 100 in December 1999). The Federal Reserve Bank of Philadelphia (which creates a leading economic indicator series for each of the 50 states) reported a value for its Minnesota Leading Indicators series that made a small positive contribution to the LEI this quarter. In addition, an increase in new filings of incorporation and LLC in the Twin Cities also contributed favorably to the Twin Cities regional outlook. A decrease in single family residential permits across the Minneapolis-St. Paul MSA weighed on the leading index as did recent higher regional initial claims for unemployment insurance. The Minnesota Business Conditions Index (constructed by Creighton University)—another general indicator of statewide economic conditions—also had a negative impact on this quarter’s LEI.
2017 2016 Percentage Change
Minnesota Business Conditions IndexDecember 56.8 52.3 8.6%
Twin Cities initial claims for unemployment insuranceDecember 9,873 10,861 -9.1%
Twin Cities new filings of incorporation and LLCsFourth Quarter 8,131 7,117 14.2%
Twin Cities MSA single-family building permits, December 550 606 -9.2%
Index of Leading Economic IndicatorsPhiladelphia Federal Reserve, December 2.68 1.47 82.3%
Twin Cities Leading Economic Indicators IndexDecember (December 1999 = 100) 97.7 91.3 7.0%
SCSU Twin CitiesLeading Economic Indicators Index

4
twin citiES BuSinESS FiLingS
Total New Business Filings—Twin Cities Planning Area (12-month moving total)
Quarter IV: 2016
I: 2017
II: 2017
III: 2017
IV: 2017
2017 Quarter IV: Percent change from prior year
Twin Cities TotalNew Business Filings 9,315 11,380 10,835 10,214 10,466 12.4%
Total new business filings in the Twin Cities planning area have generally trended upward since the second half of 2011. This upward trend continued in the fourth quarter, as new filings rose 12.4 percent to 10,466 compared to one year earlier. The abrupt increase in new filings in the middle of 2008 is largely a result of increased new LLC filings. This outlier (resembling a shark fin) is related to considerably higher filings in the construction industry due to legal and regulatory issues, and appears to be a one-time only transitory event seen in the data in all regions of Minnesota.
Note: The graphs in this section show the 12-month moving total for the various new business filings in the Twin Cities that are registered with the Office of the Minnesota Secretary of State. This adjustment removes seasonal patterns in the data.
Year
Filin
gs
5
Business Filings
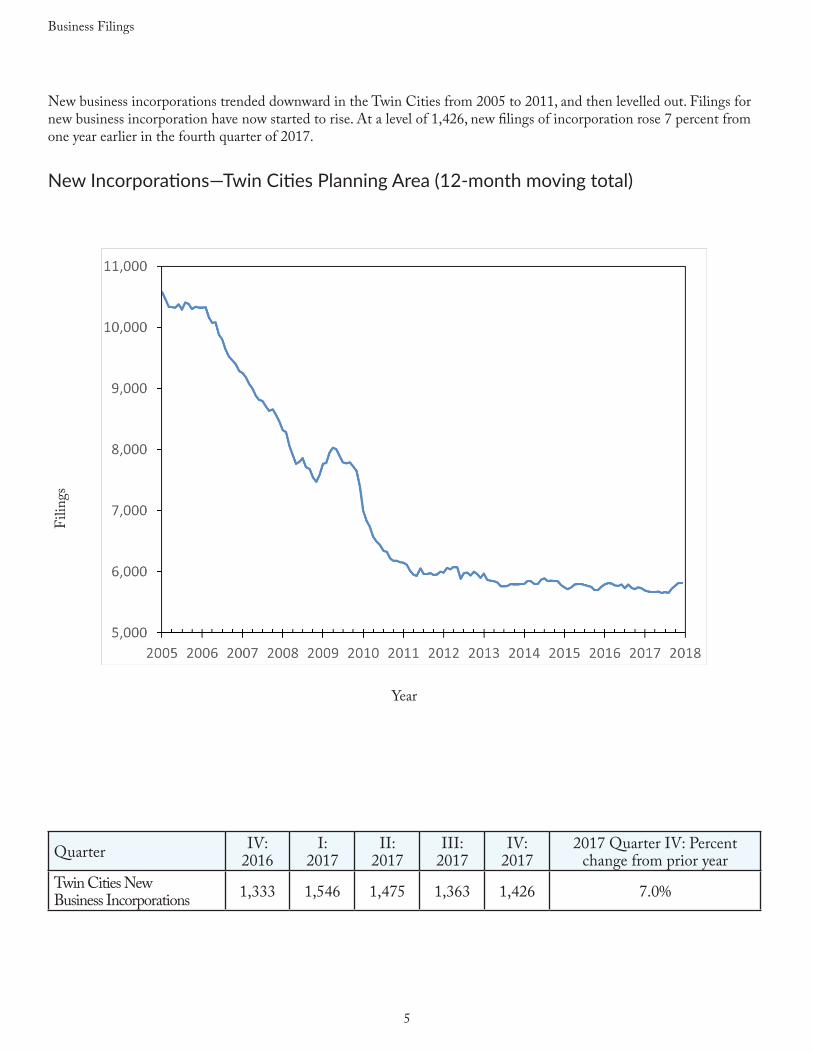
New business incorporations trended downward in the Twin Cities from 2005 to 2011, and then levelled out. Filings for new business incorporation have now started to rise. At a level of 1,426, new filings of incorporation rose 7 percent from one year earlier in the fourth quarter of 2017.
New Incorporations—Twin Cities Planning Area (12-month moving total)
Quarter IV: 2016
I: 2017
II: 2017
III: 2017
IV: 2017
2017 Quarter IV: Percent change from prior year
Twin Cities New Business Incorporations 1,333 1,546 1,475 1,363 1,426 7.0%
Year
Filin
gs

6
Business Filings
New Limited Liability Companies—Twin Cities Planning Area (12-month moving total)
Quarter IV: 2016
I: 2017
II: 2017
III: 2017
IV: 2017
2017 Quarter IV: Percent change from prior year
Twin Cities New Limited Liability Companies
5,784 7,217 6,975 6,508 6,696 15.8%
There has been a move in the Twin Cities (and the rest of the state) away from the traditional incorporation form of business organization toward LLCs. While new business incorporations remain an important indicator of new business formation in the Twin Cities, LLCs are increasingly useful in evaluating regional economic performance. As seen below, there is a considerable upward trend in LLCs in the Twin Cities. With the exception of the outlier period in 2008-2009, new LLC formation has shown a fairly steady rate of growth since 2005. At a level of 6,696, new filings for LLC in the fourth quarter of 2017 were 15.8 percent higher than one year earlier.
Year
Filin
gs

7
Business Filings
Assumed names, which include sole proprietors or organizations that do not have limited liability, rose 6.4 percent in the fourth quarter relative to the same period in 2016.
New Assumed Names—Twin Cities Planning Area (12-month moving total)
Quarter IV: 2016
I: 2017
II: 2017
III: 2017
IV: 2017
2017 Quarter IV: Percent change from prior year
Twin CitiesNew Assumed Names 1,800 2,180 1,983 1,941 1,916 6.4%
Year
Filin
gs

8
Business Filings
After bottoming out in 2010, the number of new Twin Cities non-profits registered with the Office of the Minnesota Secretary of State has slowly increased to a level last seen in the mid-2000s. With 428 new non-profits registered in the fourth quarter, new filings in this sector rose by 7.5 percent compared to one year earlier.
New Non-Profits—Twin Cities Planning Area (12-month moving total)
Quarter IV: 2016
I: 2017
II: 2017
III: 2017
IV: 2017
2017 Quarter IV: Percent change from prior year
Twin CitiesNew Non-Profits 398 437 402 402 428 7.5%
Year
Filin
gs

9
minnESota BuSinESS SnapShot SurvEy rESuLtSIn Fall 2016, the Office of the Minnesota Secretary of State initiated a short voluntary survey (known as Minnesota Business Snapshot) for both new and continuing business filers. Questions found in the survey address basic questions related to the background of business filers, industry classification, employment levels and annual revenue of the filer, and whether the business is a full- or part-time activity for the filing entity. While a comprehensive analysis of this promising new data set is the beyond the scope of this regional economic and business conditions report, the survey results do provide useful additional background information to complement the business filing data.
To match up the Minnesota Business Snapshot (MBS) information with the data analyzed in this report, only surveys accompanying new filings in the fourth quarter of 2017 are analyzed. For the entire State of Minnesota, the overall response rate for this voluntary survey is approximately 59 percent. This yields thousands of self-reported records in this emerging data set. For the Twin Cities 59 percent of new business filers completed at least some portion of the MBS survey. The results are reported in this section.
Nearly 15 percent of those new filers completing the MBS from the Twin Cities planning area report being from a community of color. With the exception of the Southeast Minnesota region, this is more than twice the rate recorded in any of the other planning areas in the state.

10
Minnesota Business Snapshot Survey Results
A small percentage of Twin Cities’ new filers—around 2.3 percent—are from the disability community.
More than 9 percent of new business filings in the Twin Cities come from the immigrant community. This is a considerably higher rate than is found in other Minnesota planning areas.
11
Minnesota Business Snapshot Survey Results
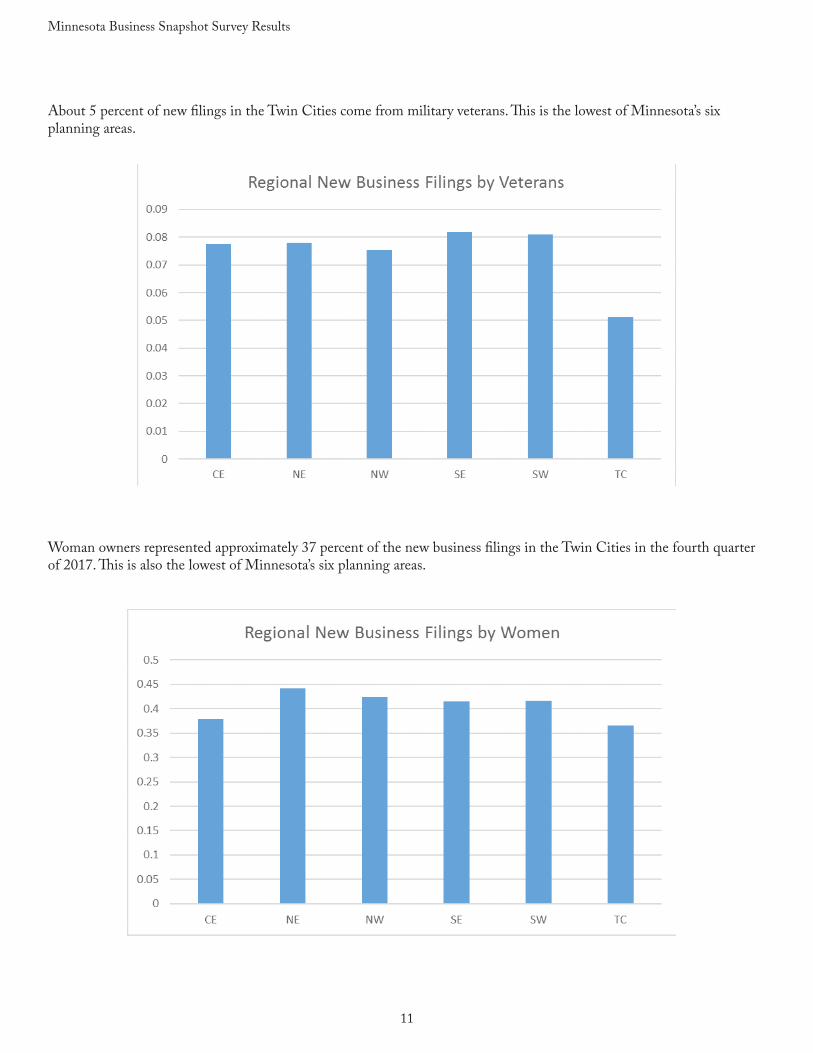
About 5 percent of new filings in the Twin Cities come from military veterans. This is the lowest of Minnesota’s six planning areas.
Woman owners represented approximately 37 percent of the new business filings in the Twin Cities in the fourth quarter of 2017. This is also the lowest of Minnesota’s six planning areas.

12
Minnesota Business Snapshot Survey Results
While not all of those participating in the survey completed all portions of the Minnesota Business Snapshot (those not responding to a particular question are represented in this section by “NAP”—no answer provided), 5,994 responses were tallied to a question asking the new business filer to indicate the range of employment at the business. As expected, most new businesses start small—employment at most companies submitting a new filing ranges from 0-5 employees.

13
Minnesota Business Snapshot Survey Results
Using the North American Industry Classification System (NAICS), businesses submitting new filings were asked to identify the industry in which their company was operating. While a range of industries were reported, professional/scientific/technical services, retail trade, real estate/rental/leasing, construction and “other services” lead the way. Since businesses are often unsure of their industrial classification, the “other services” category is likely to represent a “catch-all” category for service-related businesses who were unable to specify their industry. 543 new firms did not provide an answer to this survey item (see “NAP”)
14
Minnesota Business Snapshot Survey Results
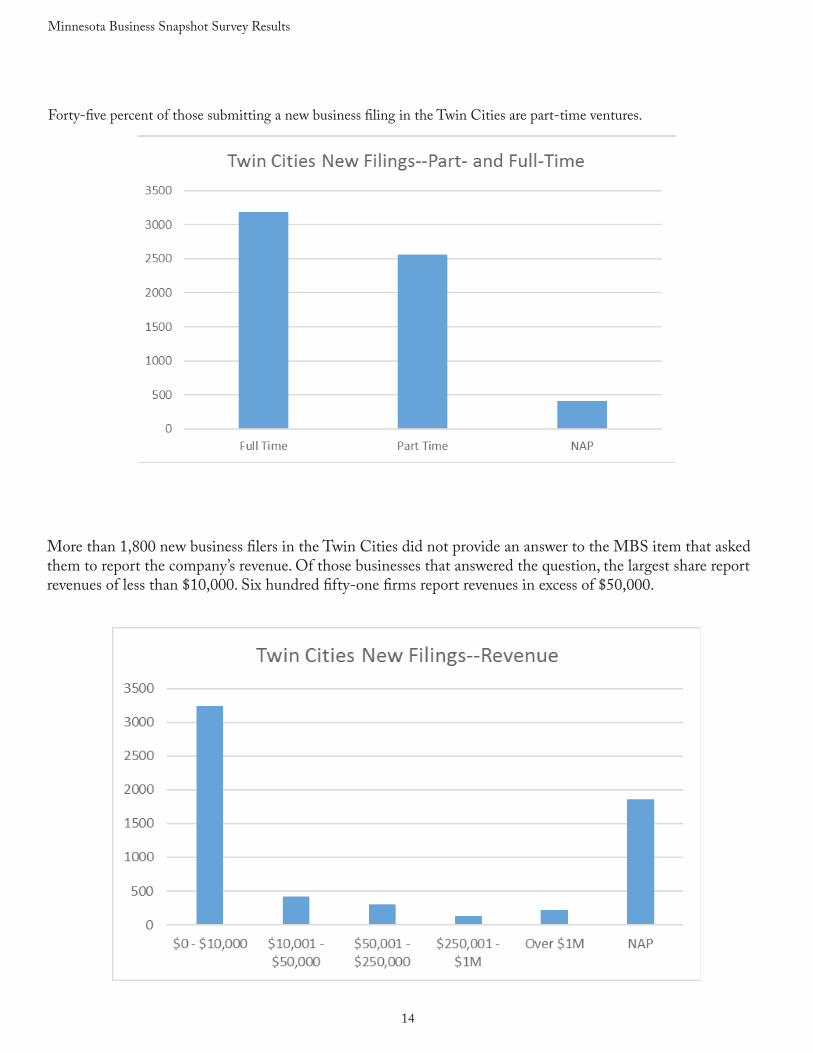
Forty-five percent of those submitting a new business filing in the Twin Cities are part-time ventures.
More than 1,800 new business filers in the Twin Cities did not provide an answer to the MBS item that asked them to report the company’s revenue. Of those businesses that answered the question, the largest share report revenues of less than $10,000. Six hundred fifty-one firms report revenues in excess of $50,000.

15
mapS
The first map shown below is a visual representation of new business formation around the Twin Cities planning area in the fourth quarter of 2017. The densest areas of new business formation are concentrated in the middle of the planning area, although virtually all portions of the area experienced some type of new business formation. Well-traveled roadways are a predictor of new business formation in the Twin Cities planning area.
Twin Cities Planning Area--New Business Formation--Quarter 4: 2017
16
Maps
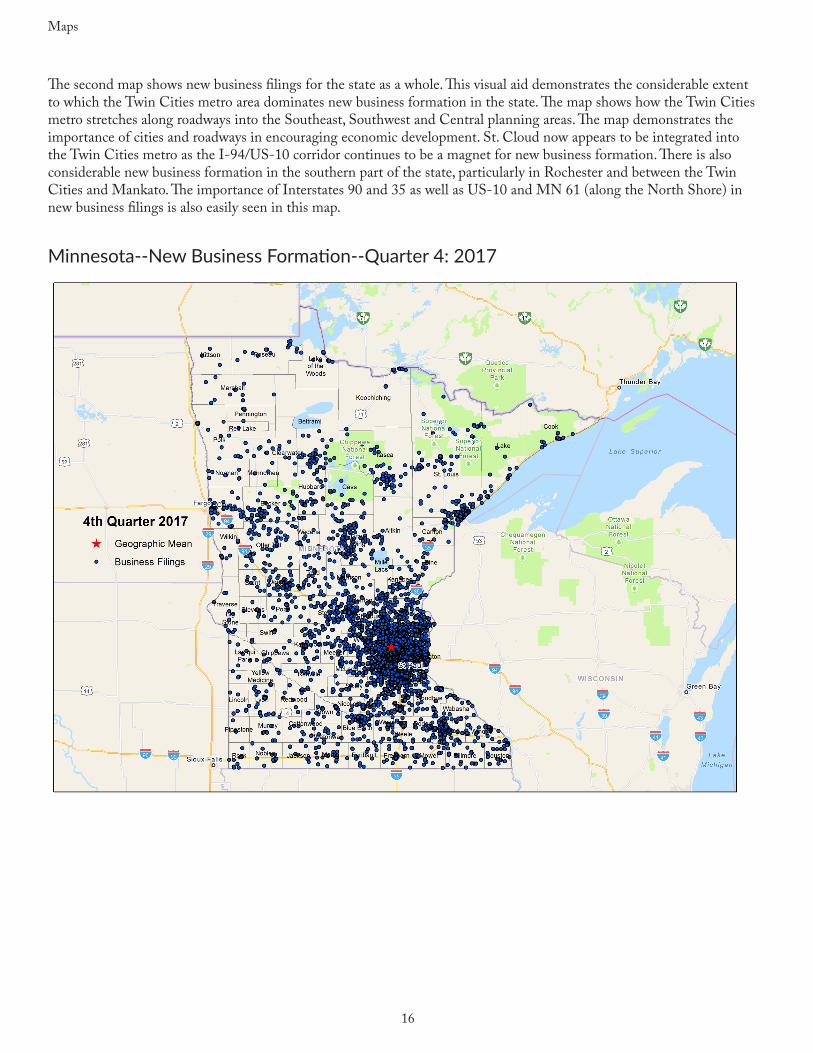
The second map shows new business filings for the state as a whole. This visual aid demonstrates the considerable extent to which the Twin Cities metro area dominates new business formation in the state. The map shows how the Twin Cities metro stretches along roadways into the Southeast, Southwest and Central planning areas. The map demonstrates the importance of cities and roadways in encouraging economic development. St. Cloud now appears to be integrated into the Twin Cities metro as the I-94/US-10 corridor continues to be a magnet for new business formation. There is also considerable new business formation in the southern part of the state, particularly in Rochester and between the Twin Cities and Mankato. The importance of Interstates 90 and 35 as well as US-10 and MN 61 (along the North Shore) in new business filings is also easily seen in this map.
Minnesota--New Business Formation--Quarter 4: 2017

17
twin citiES LaBor markEt conditionS
Employment of Twin Cities planning area residents increased 3.8 percent over the past year. After relative stagnation through 2007 and a decline during the Great Recession, the area has experienced fairly steady employment growth since the start of 2010. Note: seasonally adjusted labor market data are typically not available to evaluate regional economic performance. While there are seasonally adjusted labor market data for the Twin Cities metro area, these data include parts of Wisconsin. These seasonally adjusted data therefore do not accurately capture the Twin Cities planning area (which is confined to seven counties). Some graphs of labor market indicators found in this section of the report are adjusted so as to remove seasonal patterns from the data. Tabular data are not seasonally adjusted.
Employment—Twin Cities Planning Area (12-month moving average)
Month December 2016
July 2017
August 2017
September 2017
October 2017
November 2017
December 2017
Employment (Not seasonally
adjusted)1,592,147 1,665,268 1,660,147 1,668,951 1,662,049 1,664,849 1,653,422
Year
Empl
oym
ent

18
Labor Market Conditions
Until flattening out in 2015, the seasonally adjusted unemployment rate in the Twin Cities had declined since the end of the Great Recession in 2009. However, the accompanying graph shows the seasonally adjusted unemployment rate has once again continued to decline over most of 2017. The non-seasonally adjusted unemployment rate now stands at 2.7 percent, lower than the 3.4 percent rate recorded one year earlier.
Unemployment Rate, seasonally adjusted—Twin Cities Planning Area
Month December 2016
July 2017
August 2017
September 2017
October 2017
November 2017
December 2017
Unemployment Rate(Not seasonally adjusted) 3.4% 3.3% 3.4% 2.8% 2.3% 2.3% 2.7%
Year
Une
mpl
oym
ent R
ate

19
Labor Market Conditions
New claims for unemployment insurance were 9.1 percent below year ago levels in December 2017. The graph of the seasonally adjusted series suggests claims have slowly declined for the past several years.
Total Initial Claims for Unemployment Insurance, seasonally adjusted—Twin Cities Planning Area
Period December 2016
July 2017
August 2017
September 2017
October 2017
November 2017
December 2017
Initial claims(Not seasonally adjusted) 10,861 5,741 5,718 5,287 5,802 9,613 9,873
Year
Clai
ms

20
Labor Market Conditions
Average weekly wages in the Twin Cities were lower in the third quarter of 2017 than they were one year earlier. This same data pattern is observed in all of Minnesota’s other regions, except the Southeast Minnesota planning area. This reported decline in average weekly wages across the state appears to be related to a different pattern of data collection in 2016 (when there were 14 payment periods in the third quarter) compared to 2017 (when there were only thirteen payment periods). This statistical anomaly runs counter to what is seen in most other regional wage data in Minnesota—earnings appear to be rising across the state.
Average Weekly Wages---Twin Cities Planning Area
Quarter 2012:III 2013:III 2014:III 2015:III 2016:III 2017:III
Average Weekly Wage $1,027 $1,054 $1,073 $1,099 $1,166 $1,134
Quarter
Wag
e

21
Labor Market Conditions
The size of the Twin Cities labor force rose by 3.1 percent over the past twelve months. The 12-month moving average (see accompanying graph) of the Twin Cities labor force continues to trend upward.
Labor Force—Twin Cities Planning Area (12-month moving average)
Year (December) 2012 2013 2014 2015 2016 2017Labor Force
(Not seasonally adjusted) 1,614,292 1,622,062 1,624,238 1,631,844 1,648,696 1,700,094
Year
Labo
r For
ce

22
Bankruptcies
The figure below shows the 12-month moving total for Twin Cities bankruptcies since the second quarter of 2007 (shortly before the beginning of the Great Recession). As can be seen in the figure, this moving total increased through the second quarter of 2010, and generally declined until the beginning of this year, at which time it began leveling out. With 5,940 bankruptcies over the past twelve months, the annual number of bankruptcies reported in the Twin Cities is higher than it was one year ago (when 5,756 annual bankruptcies were reported).
Twin Cities Bankruptcies (12-month moving total)
twin citiES BankruptciES
Year (Fourth Quarter) 2012 2013 2014 2015 2016 2017Annual Bankruptcies
(not seasonally adjusted) 10,350 8,930 7,385 6,615 5,756 5,940
Quarter
Bank
rupt
cies

23
Economic indicatorS
Twin Cities MSA Indicators
Period Covered Current Period Prior Year Annual Percent
Change
Long Term Average (since 1999 unless
noted)Employment December 2017 (m) 2,019,121 1,972,482 2.4% ↑ 0.7%Manufacturing Employment December 2017 (m) 201,341 197,007 2.2% ↑ -1.0%Average Weekly Work Hours--Private Sector December 2017 (m) 34.7 34.7 0.0% ↔ 34 (since
2006)Average Earnings Per Hour--Private Sector December 2017 (m) $29.34 $28.59 2.6% ↑ 1.2% (since
2006)Average Weekly Work Hours--Manufacturing (Production Workers)
December 2017 (m) 42.2 41.5 1.7% ↑ 41 (since 2005)
Average Earnings Per Hour--Manufacturing (Production Workers)
December 2017 (m) $22.07 $21.52 2.6% ↑ 1.6% (since 2005)
Unemployment Rate December 2017 (m) 2.9% 3.6% NA ↓ 4.3%Labor Force December 2017 (m) 1,990,904 1,931,869 3.1% ↑ 0.6%MSP Residential Building Permit Valuation December 2017 (m) 274,507 347,142 -20.9% ↓ NA
Minneapolis Cost of Living Index Third Quarter 2017 (q) 104.9 104.8 0.1% ↑ NA
St. Paul Cost of Living Index Third Quarter 2017 (q) 103.6 104.5 -0.9% ↓ NA
The Minneapolis-St. Paul Metropolitan Statistical Area (an MSA is a grouping of counties and municipalities identified by the Census as having economic and demographic forces in common) includes 14 Minnesota counties (the definition of the MSA was recently expanded to include Le Sueur, Mille Lacs, and Sibley counties): Anoka, Carver, Chisago, Dakota, Hennepin, Isanti, Le Sueur, Mille Lacs, Ramsey, Scott, Sherburne, Sibley, Washington and Wright. This MSA also includes the Wisconsin counties of Pierce and St. Croix. It is thus much larger than the seven-county Twin Cities planning area. Still, activity outside of the area influences economic behavior within it, and vice versa. The larger Minneapolis-St. Paul MSA experienced mostly favorable economic performance over the past 12 months. Overall employment increased 2.4 percent in the Twin Cities MSA (and manufacturing employment also expanded). Average hourly earnings rose in the private sector and for production workers in the manufacturing sector. Average weekly work hours also rose for production workers (but were unchanged in the private sector overall). The Twin Cities MSA unemployment rate was lower and the labor force was larger in December than it was one year ago. The relative cost of living rose in Minneapolis but fell in St. Paul. The value of residential building permits in the Twin Cities MSA experienced a 20.9 percent year-over-year decline in December 2017.
(m) represents a monthly series(q) represents a quarterly series

24
Economic Indicators
StatE and nationaL indicatorS
For the state as a whole, most categories of economic performance found in the State and National Indicators table are favorable. There was growth in payrolls, higher earnings per hour, and a lower seasonally adjusted unemployment rate compared to last quarter as well as one year ago. Coincident and leading Indicators from the Federal Reserve Bank of Philadelphia are each higher than last quarter and last year, and the Minnesota Business Conditions index is higher than one year ago. Enplanements at the Minneapolis-St. Paul airport increased over the past year. However, average weekly work hours were unchanged from December 2016 and milk prices continue to fall.
The national economic indicators found in the table are also highly favorable. Over the past quarter as well as the past year, stock prices rose (recent declines in the stock market are not reflected in this table), employment increased, real income and consumer expenditures expanded, and retail sales picked up. The national unemployment rate also fell. Industrial production also rose. National building permits were lower than in September 2017 but were higher than one year earlier. Consumers also saw higher oil prices last quarter. Oil prices are now 11.4 percent higher than they were one year ago.
MINNESOTA Indicators Dec 2017 Sep 2017 Dec 2016
Change from one
quarter agoAnnual Change
Nonfarm payroll employment, SA 2,958,700 2,955,500 2,921,400 0.1% 1.3%Average weekly hours worked, private sector 33.9 34.1 33.9 -0.6% 0.0%
Unemployment rate, seasonally adjusted 3.1% 3.7% 4.0% NA NAEarnings per hour, private sector $28.59 $28.58 $27.85 0% 2.7%Philadelphia Fed Coincident Indicator, MN 203.74 199.43 194.23 2.2% 4.9%Philadelphia Fed Leading Indicator, MN 2.68 1.91 1.44 40.3 % 86.1%Minnesota Business Conditions Index 56.8 59.4 52.3 -4.4% 8.6%Price of milk received by farmers (cwt) $17.10 $17.90 $19.60 -4.5% -12.8%Enplanements, MSP airport, thousands 1,471.6 1,522.7 1,456.8 -3.4% 1.0%
NATIONAL Indicators Dec 2017 Sep 2017 Dec 2016
Change from one
quarter agoAnnual Change
Nonfarm payroll employment, SA, thousands 147,610 146,963 145,437 0.4% 1.5%
Industrial production, index, SA 107.5 104.8 103.8 2.6% 3.6%Real retail sales, SA ($) 199,780 197,348 193,475 1.2% 3.3%Real personal income less transfers, billions 12,153.6 12,066.3 11,840.1 0.7% 2.6%Real personal consumption expenditures, bill. 12,071.4 11,962.1 11,740.1 0.9% 2.8%Unemployment rate, SA 4.1% 4.2% 4.7% NA NANew building permits, SA, thousands 18,355 20,470 17,581 -10.3% 4.4%Standard & Poor’s 500 stock price index 2,664.3 2,492.8 2,246.6 6.9% 18.6%Oil, price per barrel in Cushing, OK $57.88 $49.82 $51.97 16.2% 11.4%

25
Sources
The Twin Cities Quarterly Economic and Business Conditions Report is a collaboration between the Office of the Minnesota Secretary of State and the School of Public Affairs Research Institute (SOPARI) of St. Cloud State University. All calculations and text are the result of work by SOPARI, which is solely responsible for errors and omissions herein.
Text authored by Professors King Banaian and Rich MacDonald of the Economics Department of St. Cloud State University. Research assistance provided by Alex Franta and Natalie Hughes. Professor David Wall of the SCSU Geography Department provided GIS assistance.
Sources
Council for Community and Economic Research: Cost of Living Index.Creighton University Heider College of Business: Minnesota Business Conditions Index, Rural MainStreet Index.Federal Reserve Bank of Philadelphia: Minnesota Coincident Indicator Index, Minnesota Leading Indicators Index.Federal Reserve Board of Governors: Industrial Production.Institute for Supply Management: Manufacturing Business Survey, Purchasing Managers Index.Metropolitan Airports Commission: MSP Enplanements.Minnesota Department of Employment and Economic Development (and U.S. Department of Labor Bureau of Labor Statistics): Average Hourly Earnings, Average Weekly Work Hours, Employment, Initial Claims for Unemployment Insurance, Job Vacancies, Labor Force, Manufacturing Employment, Unemployment Rate.Office of the Minnesota Secretary of State: Assumed Names, Business Incorporations, Limited Liability Companies, Non-Profits. Standard & Poor’s: Standard & Poor’s 500 Stock Price Index.Thomson Reuters and University of Michigan, Index of Consumer SentimentU.S. Bankruptcy Courts: BankruptciesU.S. Bureau of Census: Durable Goods Orders, Housing Permits, Residential Building Permits, Retail Sales.U.S. Department of Agriculture: Milk Prices.U.S. Department of Commerce Bureau of Economic Analysis: Real Personal Consumption, Real Personal Income, Real Wages and Salaries.U.S. Energy Information Administration: Oil Prices.


![Twin Cities Catholic [March 2013]](https://img.dokumen.tips/doc/110x75/568bf1221a28ab8933921384/twin-cities-catholic-march-2013.jpg)