Embed Size (px)
Citation preview

TUALATIN RIVERTUALATIN RIVERTUALATIN RIVERTUALATIN RIVERFLOW MANAGEMENTFLOW MANAGEMENTFLOW MANAGEMENTFLOW MANAGEMENTTECHNICAL COMMITTEETECHNICAL COMMITTEETECHNICAL COMMITTEETECHNICAL COMMITTEE
2002Annual Report
prepared by
Barney Reservoir
Scoggins Dam—Henry Hagg Lake

Photo Credit:Barney Reservoir, Alan Bathke, Summer 2001
Scoggins Dam—Henry Hagg Lake, Bureau of Reclamation, circa 1985-1990

TTTTUALATIN RIVERUALATIN RIVERUALATIN RIVERUALATIN RIVER F F F FLOW MANAGEMENTLOW MANAGEMENTLOW MANAGEMENTLOW MANAGEMENTTECHNICAL COMMITTEETECHNICAL COMMITTEETECHNICAL COMMITTEETECHNICAL COMMITTEE
2002 Annual Report2002 Annual Report2002 Annual Report2002 Annual Report
Prepared by:Clean Water Services, Watershed Management Division
In cooperation with:Oregon Water Resources Department, District 18 Watermaster

TUALATIN RIVER FLOW MANAGEMENT TECHNICAL COMMITTEETUALATIN RIVER FLOW MANAGEMENT TECHNICAL COMMITTEETUALATIN RIVER FLOW MANAGEMENT TECHNICAL COMMITTEETUALATIN RIVER FLOW MANAGEMENT TECHNICAL COMMITTEECommittee MembersCommittee MembersCommittee MembersCommittee Members OrganizationOrganizationOrganizationOrganizationJan Miller, Chair Clean Water Services
Charlie Harrison City of Beaverton
Randy Smith City of Forest Grove
Bernadine Bonn Clean Water ServicesTom Vanderplaat
Mark Rosenkranz Lake Oswego Corporation
Chuck Kingston Joint Water Commission
Darrell Hedin, Secretary Oregon Water Resources Department
Wally Otto Tualatin Valley Irrigation District
Scott Porter Washington County Emergency Management
Chris Wayland Washington County Parks — Hagg Lake
ACRONYMS USED IN THIS REPORTACRONYMS USED IN THIS REPORTACRONYMS USED IN THIS REPORTACRONYMS USED IN THIS REPORT
FULL NAME ACRONYM
Facilities
Springhill Pumping Plant SHPP
Wastewater Treatment Plant WWTP
Organization
Clean Water Services(formerly Unified Sewerage Agency)
CWS
Joint Water Commission JWC
Lake Oswego Corporation LOC
National Marine Fisheries Service NMFS
Oregon Department of Environmental Quality ODEQ
Oregon Department of Transportation ODOT
Oregon Water Resources Department OWRD
Tualatin Basin Technical Advisory Committee TBTAC
Tualatin Valley Irrigation District TVID
U.S. Army Corps of Engineers ACE
U.S. Bureau of Reclamation BOR
U.S. Geological Survey USGS
Water Resources Commission WRC
Water Quality Parameters
Dissolved Oxygen DO
Sediment Oxygen Demand SOD
Units of Measurement
Acre-Feet AC-FT
Cubic Feet per Second CFS
Micrograms per liter µg/L
Milligrams per Liter mg/L
Million Gallons per Day MGD
Pounds lbs
Pounds per Square Inch PSI
River Mile RM
Water Year WY
Other
Endangered Species Act ESA
Load Allocation LA
Total Maximum Daily Load TMDL
Wasteload Allocation WLA
Willamette Restoration Initiative WRI
FULL NAME ACRONYM

2002 Tualatin River Flow Management Report 3
TABLE OF CONTENTSTABLE OF CONTENTSTABLE OF CONTENTSTABLE OF CONTENTS2002 Summary . . . . . . . . . . . . . . . . . . . . . . . . . . . . . . . . . . . . . . . . . . . . . . . . . . . . . . . . . . . . . . . . . . . . 4
BackgroundBasin Description and Tualatin River Basin Map . . . . . . . . . . . . . . . . . . . . . . . . . . . . . . . . . . . . . . . 5
Tualatin Basin Flow Management Technical Committee . . . . . . . . . . . . . . . . . . . . . . . . . . . . . . . . . 7
Member Reports for 2002Reservoir Status and Contractor Allocations. . . . . . . . . . . . . . . . . . . . . . . . . . . . . . . . . . . . . . . . . . . 8
Clean Water Services . . . . . . . . . . . . . . . . . . . . . . . . . . . . . . . . . . . . . . . . . . . . . . . . . . . . . . . . . . . . . 9
Hagg Lake Monitoring Program . . . . . . . . . . . . . . . . . . . . . . . . . . . . . . . . . . . . . . . . . . . . . . . . . . . 13
Joint Water Commission/Joint Barney Commission . . . . . . . . . . . . . . . . . . . . . . . . . . . . . . . . . . . . 16
Lake Oswego Corporation . . . . . . . . . . . . . . . . . . . . . . . . . . . . . . . . . . . . . . . . . . . . . . . . . . . . . . . . 17
Oregon Water Resources Department . . . . . . . . . . . . . . . . . . . . . . . . . . . . . . . . . . . . . . . . . . . . . . . 20
Tualatin Valley Irrigation District . . . . . . . . . . . . . . . . . . . . . . . . . . . . . . . . . . . . . . . . . . . . . . . . . . 24
Water Quality Status Report . . . . . . . . . . . . . . . . . . . . . . . . . . . . . . . . . . . . . . . . . . . . . . . . . . . . . . 26
AppendicesAppendicesAppendicesAppendicesA. Flow Monitoring Sites—Hydrographs of Monthly Data
B. Natural Flow Determination—Data Tables and Hydrographs
C. Scoggins Reservoir (Henry Hagg Lake) Operations—Monthly Data Reports
D. Barney Reservoir Operations—Monthly Data Reports
E. Stream Gauge Records—Data Tables and Hydrographs of Monthly Data
F. Temperature Records—Data Tables and Graphs
G. Hagg Lake—Monitoring Results for 2002
H. Precipitation Records—
I. River Mile Indices—

4 2002 Tualatin River Flow Managment Report
2002 SUMMARY2002 SUMMARY2002 SUMMARY2002 SUMMARYThis is the fifteenth year that the Tualatin River Flow Management Technical Committee has prepared an annual report documenting the flow management of Tualatin River. Members of the committee include Clean Water Services (CWS), Tualatin Valley Irrigation District (TVID), Joint Water Commission (JWC), Lake Oswego Corporation (LOC) and Oregon Water Resources Department (OWRD).
Water management in 2002 was uneventful compared to 2001 in which allocations were severely reduced due to drought. The reports and graphs that follow describe the those efforts and their results. Some of the highlights include
• Both Barney and Scoggins Reservoirs filled.
• All partners (Clean Water Services, Tualatin Valley Irrigation District and the cities of Beaverton, Hillsboro and Forest Grove and Lake Oswego Corporation) received their normal water allocations from the reservoirs.
• Concerns about vulnerability prompted many of the organizations to upgrade security systems at their installations.
• Dissolved oxygen levels and pH levels in the mainstem Tualatin River at RM 24.5 and RM 1.8 met water quality standards during the entire low-flow period (May through mid-December).
• The summer low flow period persisted into fall and rains did not resume until December.

2002 Tualatin River Flow Management Report 5
BACKGROUNDBACKGROUNDBACKGROUNDBACKGROUNDBasin DescriptionBasin DescriptionBasin DescriptionBasin DescriptionThe Tualatin River Basin comprises an area of 712 square miles situated in the Northwest corner of Oregon and is a subbasin of the Willamette River. The headwaters are in the Coast Range and flow in a generally east-erly direction to the confluence with the Willamette River. The basin lies almost entirely in Washington County. (See map below)
The Tualatin River is about 80 miles long and changes dramatically from its headwaters to its mouth. The mountain or headwater reach (upstream of RM 55) is narrow (about 15 ft) and steep with an average slope of about 74 ft/mi. The meander reach (RM 55–33) is wider with an average slope of about 1.3 ft/mi. The reser-voir reach (RM 33–3.4) is very wide (up to 150 ft) and has an estimated slope of only 0.08 ft/mi. It includes several deep pools. Travel times through this reach are very long. The slow movement of the water causes this reach to act much like a lake. In the riffle reach (RM 3.4–0), the Tualatin River flows through a short reservoir section and then drops into a narrow gorge near the City of West Linn before it enters the Willamette River just upstream of Willamette Falls. The average slope in this reach is 10 ft/mi.
Nyberg Cr
CO
L UM
B IAR IV E R
RI V
ER
WIL
LA
M
E T T E
LakeOswego
Tigard
Beaverton
Tualatin
Sherwood
Scholls
Farmington
Hillsboro
Banks
Cornelius
Dilley
ForestGrove
NorthPlains
CherryGrove
5
205
Basin boundary
C L A C K A M A S
C O L U M B I A WA S H I N GT O N
T I L L A M O O K
YA M H I L L
Scoggin
Creek
HenryHaggLake
Gales
Creek
Wes
t
Eas t
Fork Fork
Dairy
Creek
McK
ayC
reek
Fanno
Cre
ek
Beaverton
Creek
Creek
RockBronso
n
Butternut Cr
Chris tensen Cree
Burris Creek
McFee
Creek
He
ato
n
Cr
Cr
Bake
r
Ch icke
n
Creek
Creek
Creek
Cedar MillC
anal
Osw
ego
RIVER
O R E G O N
WA S H I N GT O N
123°00' 122°37'30''122°45'123°15'123°22'30''
45°45'
45°30'
45°15'Base modified from U.S. Geological Survey
0
0 5 10 KILOMETERS
5 10 MILES
Portland
O R E G O N
Studyarea
CO
AS
T
RA
NG
E
TU
AL
AT
I N
MO
UN
TA
I NS
PA
RR
ET
TM
OU
NTA
IN
CH
EH
AL
EM
MO
U
NT
A I N S
RM60
RM70
RM30
RM40
RM50
RM10
RM20
RM0
s
k
TUALATIN
26
26
5
WestLinn
1:100,000 topographic quadrangles, 1978–84 Designated urban growth area from Metro, 1998 RM10
River mile
M U LT N O M A H
Tualatin River Basin

6 2002 Tualatin River Flow Managment Report
Water sources to the Tualatin RiverPrecipitation: Seasonal rainfall accounts for most of the flow in the Tualatin Basin; stream flow from snowmelt is minimal. The amount of rainfall ranges from 110 inches on the eastern slopes of the Coast Range to 37 inches in the southeastern area of the drainage basin. Peak months for rainfall are November through February while the driest months are normally June through October. The peak streamflow month is usually February, and the lowest streamflow month is August.
Barney Reservoir: Barney Reservoir is located on the Middle Fork of the North Fork of the Trask River. It has a capacity 20,000 acre-feet and stores water for the Cities of Beaverton, Hillsboro and Forest Grove, Clean Water Services, and Tualatin Valley Water District. Water released from Barney Reservoir enters the Tualatin River at RM 78 via an aqueduct over a low Coast Range divide and via a pipeline. Water is released during the summer low-flow season to supplement shortages in natural flow.
Scoggins Reservoir: Scoggins Creek enters the Tualatin River at RM 60.0. In the early 1970's the Bureau of Reclamation built an earthen dam on Scoggins Creek. Scoggins reservoir (Henry Hagg Lake) has an active storage capacity of 53,640 acre-feet. It is a multipurpose facility with contracted water for irriga-tion, municipal and industrial, and water quality uses. Recreation is a major activity during the summer months on the reservoir. During the winter it serves as a flood control structure.
Clean Water Services: Clean Water Services (CWS) provides sanitary and stormwater services to the urban areas of Washington County. CWS has two major wastewater treatment plants (WWTPs) that have permits to discharge water into the Tualatin River. The Rock Creek WWTP discharges an average of 41 cfs (27 MGD) at RM 38.1; the Durham WWTP discharges an average of 26 cfs (17 MGD) at RM 9.4. CWS also releases storage water from Scoggins Reservoir for flow augmentation during the seasonal low flow periods. The goal is to maintain 150 cfs (100 MGD) at the Tualatin River at Farmington Road Bridge gauge (RM 33.3).
Tualatin Valley Irrigation District: Tualatin Valley Irrigation District (TVID) is the agricultural water service agency for the area and serves approximately 20,000 acres of irrigated cropland. TVID operates the Patton Valley Pump Station near RM 5 on Scoggins Creek which can divert water via a low-pressure pipeline into the upper Tualatin River above the city of Gaston (outfalls at RM 63.2 and RM 64). This water is used to serve irrigators upstream of the Scoggins confluence (RM 60.0).
Water diversions from the Tualatin RiverCherry Grove Intake (RM 73.2): The City of Hillsboro diverts water for municipal and industrial uses at the Cherry Grove Intake.
Springhill Pumping Plant (RM 56.3): The Springhill Pumping Plant (SHPP) is the largest diversion facility on the river. It is operated jointly by the Tualatin Valley Irrigation District (TVID) and the Joint Water Commission (JWC). TVID delivers water from SHPP to about 10,000 acres of irrigated cropland via a pressure pipeline. TVID has a pumping capacity of approximately 90 MGD (140 cfs) at the SHPP. JWC delivers water from SHPP to the cities of Beaverton, Hillsboro, and Forest Grove. JWC has a pump-ing capacity of approximately 60 MGD (90 cfs) at the SHPP. Both TVID and JWC have natural flow water rights that are used when flows are high; they release contracted stored water from Scoggins and Barney Reservoirs to augment declined natural flow in the summer.
Irrigation withdrawals: Water is obtained directly from the Tualatin River for irrigation purposes by members of the Wapato Improvement District (Onion Lake), members of the TVID, and irrigators with natural flow water rights. About 10,000 acres of cropland served by TVID is irrigated with water obtained directly from the Tualatin River.
Lake Oswego Canal Diversion: The Lake Oswego Corporation (LOC) diverts a portion of the Tualatin flow into the Lake Oswego Canal at RM 6.7. A headwork structure regulates the flow into this mile long

2002 Tualatin River Flow Management Report 7
canal that feeds into Lake Oswego. The water is used to generate power below the dam at the east end of Lake Oswego. The Lake Oswego Corporation has a natural flow water right for 57.5 cfs (priority date: 1906) and has 500 acre-feet of contracted stored water for consumptive uses from Hagg Lake. At RM 3.4, a combination diversion dam/fish ladder structure is used during low flow periods to elevate the Tualatin River enough to divert the flow into the canal. During most of year, river elevation is adequate to allow diversion of the LOC water right; in the summer, however, flash boards are installed to increase the water level. This dam raises the Tualatin 2–3 feet which affects the water surface elevation for about 25 river miles.
Tualatin River Flow Management Technical CommitteeTualatin River Flow Management Technical CommitteeTualatin River Flow Management Technical CommitteeTualatin River Flow Management Technical CommitteeThe Tualatin River Flow Management Technical Committee provides a mechanism for the coordination and management of flow in the Tualatin River. The members of the committee are technical staff with detailed knowledge of the specific characteristics of flow in this river. The committee meets monthly from February through November. Meetings focus mainly on the review of the hydrographs and current status of the reservoirs. In addition, a variety of other water issues and any problems are discussed. Each mem-ber updates the committee on any changes that could impact the flow management of the Tualatin. Min-utes are recorded and reviewed at the next meeting.
Data collection systemA coordinated information system was developed to provide flow information to all members of the com-mittee. Because use or release of water by any one of the entities can impact the other users, coordination of flow information is an important aspect of the committee's work. The data is collected by field staff from the cooperating entities or from the Corps of Engineers via telemetry. A system of gauging stations, precipitation and other flow monitoring equipment has been developed during the past several years to monitor the flows on the Tualatin and the major tributaries. Significant releases and diversions are also monitored. The data collected is relayed to the District 18 Watermaster office on a weekly basis. Hydro-graphs (Appendix A) which show the previous year and current year's data, were developed to identify and address problems related to the flow. Rainfall is shown as total weekly accumulation and three sta-tions are currently being graphed.
A second set of hydrographs (Appendix B) was developed to show the available natural flow at various points on the mainstem of the Tualatin. These graphs depict the volume of natural flow by taking the mea-sured flow and subtracting the storage flow. The storage flow is calculated on the releases from Scoggins (Hagg Lake) and Trask (Barney) Reservoirs. An evaporation loss factor reduces the storage flow and is based on an estimated loss of 0.25 percent of the flow per river mile. The main purpose for calculation of the natural flow is to determine when natural flow is no longer adequate in various river reaches. The key point in the analysis of the graphs is to detect when the available natural flow is below zero. When the nat-ural flow graphs show flows less than zero, the reach does not have adequate water to serve all users and regulation is needed. Regulation is handled by the local Watermaster office and is done on a priority basis as required by Oregon Water Law.
An expanding, on-going flow monitoring system continues to provide valuable information for the man-agement of stored water and natural flow availability in the basin. It also makes the calculation of pollut-ant loads possible, which is necessary to the Total Maximum Daily Load program (TMDL). New monitoring includes temperature as well as flow at some sites. As water quality issues have come to the forefront, the monitoring system has been an excellent example of interagency cooperation.

8 2002 Tualatin River Flow Managment Report
RESERVOIR STATUS AND WATER CONTRACTOR ALLOCATIONSRESERVOIR STATUS AND WATER CONTRACTOR ALLOCATIONSRESERVOIR STATUS AND WATER CONTRACTOR ALLOCATIONSRESERVOIR STATUS AND WATER CONTRACTOR ALLOCATIONS
Unlike 2001, both Scoggins and Barney Reservoirs filled in 2002. The fill curve for 2002 and the reser-voir filling history are shown below.
The allocations and water usage are summarized in the following table.
WATER USAGE FOR 2002
Water ContractorScoggins Reservoir Barney Reservoir
Allocation*(acre- ft)
Total Used(acre- ft)
Allocation**(acre- ft)
Total Used(acre- ft)
City of Beaverton 4,000 3,712 3,655 2,235
City of Hillsboro 5,000 3,664 5,270 2,009
City of Forest Grove 4,500 1,508 425 265
Clean Water Services 12,618 12,618 1,700 1,667
Lake Oswego Corporation 500 496 — —
TVID 27,022 19,093 — —
TVWD — — 5,950 5,923
Total 53,640 41,091 17,000 12,099
*Natural flow portion has been subtracted from CWS and TVID share**15% for ODF&W release to the Trask R was subtracted from each share to obtain allocation
10/1
10/1
6
10/3
1
11/1
5
11/3
0
12/1
5
12/3
0
1/14
1/29
2/13
2/28
3/15
3/30
4/14
4/29
5/14
5/29
6/13
6/28
7/13
7/28
8/12
8/27
9/11
9/26
60
50
40
30
20
10
0
Sco
gg
ins
Res
ervo
ir S
tora
ge
(tho
usan
ds o
f acr
e-ft)
Rule CurveWater Years1981-2000
Water Year 2002
Water Year 2001

2002 Tualatin River Flow Management Report 9
CLEAN WATER SERVICESCLEAN WATER SERVICESCLEAN WATER SERVICESCLEAN WATER SERVICESBY JAN MILLER, CLEAN WATER SERVICESWater is released by Clean Water Services (CWS) from Scoggins and Barney reservoirs to improve water quality in the Tualatin River. The primary water quality issue in the lower Tualatin River is dissolved oxy-gen. The most critical time period starts in mid-September when the production of oxygen by algae is reduced due to lower light conditions. During the earlier parts of the summer, the oxygen produced by algae through photosynthesis effectively meets the needs of the decaying substances in the river sediment (sediment oxygen demand). Once algal production is reduced, the sediment oxygen demand can be expressed. By increasing the flow of water when the algal oxygen production decreases, the impact of sediment oxygen demand can be minimized because the water moves past the sediment faster.
2002 Water Releases2002 Water Releases2002 Water Releases2002 Water ReleasesUnlike 2001, when the reservoirs did not fill, in 2002 both reservoirs filled. The goal for the summer of 2002 was to release water very conservatively so as not to need to buy water at the end of the season. This was based on lessons learned the previous year when buying water at the end of the summer of 2000 resulted in CWS having a much reduced water allocation for the summer of 2001. No water was pur-chased at the end of the 2002 season to supplement the Scoggins or Barney Reservoir allocations.
Clean Water Services released water from Scoggins Reservoir starting on June 12, 2002 for six days. The water was released to help retard an algal bloom which might have caused the pH to be too high. The pH values did not exceed the Oregon standard (8.5) during this algal bloom. Releases were then suspended until July 13, 2002. Once resumed, the releases were maintained until November 19, 2002 when Clean Water Services exhausted its allocation of 12,618 acre-feet. The daily amount of the release varied depending on the river conditions.
Clean Water Services initiated a constant release of 14 cfs from Barney Reservoir on August 26, 2002. It was maintained until October 24, 2002 when Clean Water Services exhausted its allocation of 1,667 acre-feet.
Clean Water Services flow augmentation accounts for a significant fraction of flow in the Tualatin River, especially during the late summer and early fall time period (see graphs of the page).
CLEAN WATER SERVICES WATER RELEASE SCHEDULE
Month
Scoggins Release Barney ReleaseTotal Release
(acre-ft)Average Release*
(cfs)Volume(acre-ft)
DatesVolume(acre-ft)
Dates
May 0 — 0 — 0 0
June 351 6/12–6/17 0 — 351 30
July 665 7/13–7/31 0 — 665 17
August 1964 8/1–8/31 167 8/26–8/31 2,131 *32/46
September 4365 9/1–9/30 833 9/1–9/30 5,198 87
October 4408 10/3–10/31 667 10/1–10/24 5,075 *84/75
November 441 11/1–11/9 0 — 441 49
Total release 12,618 — 1,667 — 14,285 —
Allocation 12,618 — 1,667 — 14,285 —
Purchase 0 — 0 — 0 —
* Two values are shown if both reservoirs did not release for the entire month.

10 2002 Tualatin River Flow Managment Report
CWS release from Scoggins ReservoirCWS Release from Barney ReservoirRock Creek WWTP effluentNatural flow
Measured flow at Farmington (RM 33.3)Calculated flow without CWS releases**
Tualatin River Flow at Farmington (RM 33.3) — 2002
5/29
6/12
6/26
7/10
7/24 8/
7
8/21 9/
4
9/18
10/2
10/1
6
10/3
0
0
100
200
300
400F
low
(cf
s)
0
100
200
300
400
5/29
6/12
6/26
7/10
7/24 8/
7
8/21 9/
4
9/18
10/2
10/1
6
10/3
0
CWS release from Scoggins ReservoirCWS Release from Barney ReservoirDurham WWTP effluentRock Creek WWTP effluent
Measured flow at West LinnCalculated flow without CWS releases**
Natural flow
Tualatin River Flow at West Linn (RM 1.75) — 2002
Flo
w (
cfs)
*To account for travel time and evaporative losses, flows without CWS releases were calculated as follows.
+ Measured flow at West Linn– 0.977 x Durham WWTP flow from 3 days before– 0.891 x Rock Ck WWTP flow from 14 days before– 0.825 x CWS Scoggins Release from 17 days before– 0.771 x CWS Barney Release from 19 days before
These calculations assume a uniform evaporative loss of 0.3% per mile.
+ Measured flow at Farmington– 0.986 x Rock Ck WWTP flow from the same day– 0.920 x CWS Scoggins Release from 2 days before – 0.866 x CWS Barney Release from 4 days before

2002 Tualatin River Flow Management Report 11
Flow TargetsFlow TargetsFlow TargetsFlow TargetsClean Water Services began actively managing the release of its stored water in 1987. Prior to 1987, the water was released according to the contract with the BOR based on minimum flows at West Linn (RM 1.8). Beginning in 1987, Clean Water Services released its water with the goal of maintaining a monthly average of 150 CFS at the Tualatin River at Farmington (RM 33.3). Work by the US Geological Survey in the early 1990’s indicated that it was more important to have higher flows in the fall to maintain dissolved oxygen levels rather than in the early summer to prevent algal blooms. The flow goals were changed to maintaining 120 cfs in the early summer, 150 cfs in August and 180–200 cfs from September until the winter flows start. The winter flow level can be described by either of the following two statistics for the Tualatin River gauge at Farmington (RM 33.3):• the seven-day median of the daily mean flow values exceeds 350 cfs, OR• the daily mean flow exceeds 1,000 cfs.
In 2002, the daily mimimum flow target was not met in August and the monthly mean flow targets were not met in August, September and October. In addition, water releases were discontinued before the river reached winter flow levels on December 13, 2002. Water quality during these times, however, was ade-quate. River pH values never exceeded 8.5 and the 30-day dissolved oxygen standard of 6.5 was met dur-ing the entire low-flow season. During the late fall low flow period, the river was able to maintain sufficient dissolved oxygen levels because the river temperatures were low. River temperatures dropped dramatically after Octover 23, 2002 and were less than 11ºC on November 1, 2002. Cold temperatures reduce the rate of sediment oxygen demand. Clean Water Services’ Wastewater Treatment Plants remained in nitrification mode until river flows reached winter flow levels.
FLOW TARGETS FOR CLEAN WATER SERVICES WATER RELEASES
Month
Historic Bureau of Reclamation Schedule Current Clean Water Services Release Targets
Release Volume(cfs)
Mean Tualatin R Flow at West Linn (RM 1.8)
(cfs)
Tualatin R Flow at Farmington (RM 33.3)
Minimum**(cfs)
Mean**(cfs)
Maximum(cfs)
May 13 374 [ 85] 214 [120] 322 [120] 494
June 21 250 [140] 159 [120] 204 [120] 404
July 73 181 [270] 129 [120] 160 [120] 313
August 73 141 [260] 103 [120] 128 [150] 149
September 62 175 [200] 144 [120] 167 [180] 216
October 16 202 [ 95] 157 [120] 174 [180] 238
November 21 154 [110] 124 [120] 195 [180] 345
** Values in brackets are the flow targets

12 2002 Tualatin River Flow Managment Report
Historical perspective Historical perspective Historical perspective Historical perspective Clean Water Services releases from Scoggins Reservoir are summarized below.
Clean Water Services releases water from Barney Reservoir at a constant rate during the late summer to supplement the water released from Scoggins Reservoir. The following table summarizes the releases of water from Barney Reservoir. Clean Water Services owns 10% of the 20,000 acre-foot reserervoir. Each year the Joint Water Commission decides how much water is to be released for the Department of Fish and Wildlife. This is subtracted from the available water and the remainder is allocated to the owners.
CLEAN WATER SERVICES — SCOGGINS RESERVOIR RELEASES
Year Start Date End DateTotal
Release Days
Total Release(acre-ft)
Average per Release Day
(cfs)
Minimum Monthly Flow at Farmington (RM 33.3)
(cfs)
1987 6/9 11/30 175 16,722 48.2 138
1988 7/2 11/4 126 15,071 60.3 149
1989 6/27 11/15 141 16,586 59.3 158
1990 7/12 11/1 113 11,889 53.0 172
1991 7/12 11/4 116 13,024 56.6 181
1992 6/5 11/19 168 12,730 38.2 138
1993 7/3 12/1 150 11,486 38.6 154
1994 6/21 10/27 129 10,917 42.7 137
1995 6/24 11/8 138 9,824 35.9 174
1996 7/27 11/10 114 10,952 48.4 205
1997 7/4 10/2 91 6,716 37.2 202
1998 8/12 11/7 87 9,407 54.5 175
1999 7/27 11/12 109 12,001 55.5 188
2000 7/21 11/27 130 15,275 59.2 174
2001 9/25 11/14 50 2,403 24.0 114
2002 6/12 11/9 151 12,618 42.0 103
CLEAN WATER SERVICES — BARNEY RESERVOIR RELEASES
Year Start Date End DateTotal
Release(acre-ft)
Average per Release Day
(cfs)Comment
1998 7/12 8/27 2,779 24.6 extra water released to draw down reservoir
1999 9/1 10/19 1,025 10 10 cfs also released 6/4–6/10
2000 9/8 10/23 1,461 18 —
20019/18 10/29
1,416 171000 acre-ft purchased in addtion to allocationreservoir did not fill;4,000 acre-ft held in reserve
2002 8/26 10/24 1,667 14 —
2002 Tualatin River Flow Management Report 13
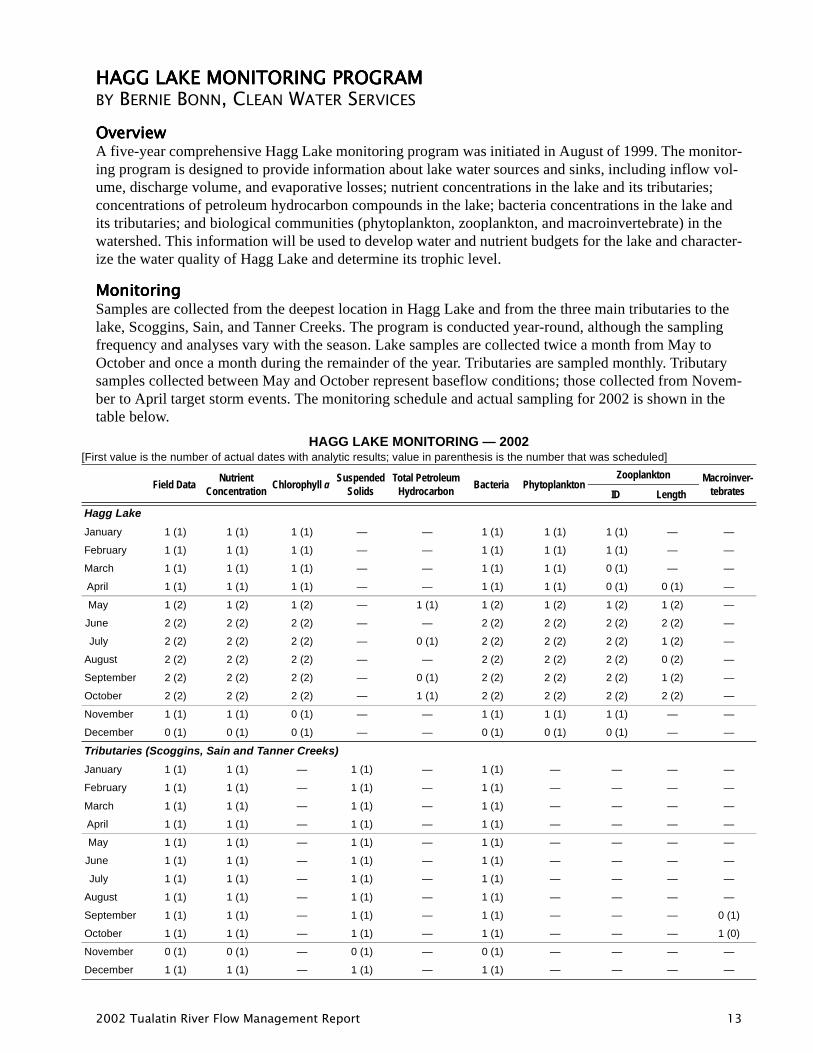
HAGG LAKE MONITORING PROGRAMHAGG LAKE MONITORING PROGRAMHAGG LAKE MONITORING PROGRAMHAGG LAKE MONITORING PROGRAMBY BERNIE BONN, CLEAN WATER SERVICES
OverviewOverviewOverviewOverviewA five-year comprehensive Hagg Lake monitoring program was initiated in August of 1999. The monitor-ing program is designed to provide information about lake water sources and sinks, including inflow vol-ume, discharge volume, and evaporative losses; nutrient concentrations in the lake and its tributaries; concentrations of petroleum hydrocarbon compounds in the lake; bacteria concentrations in the lake and its tributaries; and biological communities (phytoplankton, zooplankton, and macroinvertebrate) in the watershed. This information will be used to develop water and nutrient budgets for the lake and character-ize the water quality of Hagg Lake and determine its trophic level.
MonitoringMonitoringMonitoringMonitoringSamples are collected from the deepest location in Hagg Lake and from the three main tributaries to the lake, Scoggins, Sain, and Tanner Creeks. The program is conducted year-round, although the sampling frequency and analyses vary with the season. Lake samples are collected twice a month from May to October and once a month during the remainder of the year. Tributaries are sampled monthly. Tributary samples collected between May and October represent baseflow conditions; those collected from Novem-ber to April target storm events. The monitoring schedule and actual sampling for 2002 is shown in the table below.
HAGG LAKE MONITORING — 2002[First value is the number of actual dates with analytic results; value in parenthesis is the number that was scheduled]
Field DataNutrient
ConcentrationChlorophyll a
SuspendedSolids
Total PetroleumHydrocarbon
Bacteria PhytoplanktonZooplankton Macroinver-
tebratesID Length
Hagg Lake
January 1 (1) 1 (1) 1 (1) — — 1 (1) 1 (1) 1 (1) — —
February 1 (1) 1 (1) 1 (1) — — 1 (1) 1 (1) 1 (1) — —
March 1 (1) 1 (1) 1 (1) — — 1 (1) 1 (1) 0 (1) — —
April 1 (1) 1 (1) 1 (1) — — 1 (1) 1 (1) 0 (1) 0 (1) —
May 1 (2) 1 (2) 1 (2) — 1 (1) 1 (2) 1 (2) 1 (2) 1 (2) —
June 2 (2) 2 (2) 2 (2) — — 2 (2) 2 (2) 2 (2) 2 (2) —
July 2 (2) 2 (2) 2 (2) — 0 (1) 2 (2) 2 (2) 2 (2) 1 (2) —
August 2 (2) 2 (2) 2 (2) — — 2 (2) 2 (2) 2 (2) 0 (2) —
September 2 (2) 2 (2) 2 (2) — 0 (1) 2 (2) 2 (2) 2 (2) 1 (2) —
October 2 (2) 2 (2) 2 (2) — 1 (1) 2 (2) 2 (2) 2 (2) 2 (2) —
November 1 (1) 1 (1) 0 (1) — — 1 (1) 1 (1) 1 (1) — —
December 0 (1) 0 (1) 0 (1) — — 0 (1) 0 (1) 0 (1) — —
Tributaries (Scoggins, Sain and Tanner Creeks)
January 1 (1) 1 (1) — 1 (1) — 1 (1) — — — —
February 1 (1) 1 (1) — 1 (1) — 1 (1) — — — —
March 1 (1) 1 (1) — 1 (1) — 1 (1) — — — —
April 1 (1) 1 (1) — 1 (1) — 1 (1) — — — —
May 1 (1) 1 (1) — 1 (1) — 1 (1) — — — —
June 1 (1) 1 (1) — 1 (1) — 1 (1) — — — —
July 1 (1) 1 (1) — 1 (1) — 1 (1) — — — —
August 1 (1) 1 (1) — 1 (1) — 1 (1) — — — —
September 1 (1) 1 (1) — 1 (1) — 1 (1) — — — 0 (1)
October 1 (1) 1 (1) — 1 (1) — 1 (1) — — — 1 (0)
November 0 (1) 0 (1) — 0 (1) — 0 (1) — — — —
December 1 (1) 1 (1) — 1 (1) — 1 (1) — — — —
14 2002 Tualatin River Flow Managment Report
All samples are collected by JWC, except macroinvertebrate samples which are collected by Clean Water Services. JWC also collects all field measurements and weather conditions. Most of the chemical analyses are done by the Bureau of Reclamation laboratory in Boise, Idaho. JWC makes, arranges and pays for bac-teria testing. Clean Water Services arranges and pays for macroinvertebrate, zooplankton, phytoplankton, and total petroleum hydrocarbon analyses.
Additional information about Hagg Lake is also available.
• OWRD maintains gauges on the tributaries that flow into Hagg Lake. • The USGS maintains a gauge on Scoggins Creek downstream of Scoggins Dam. • TVID is responsible for flow releases and maintains records of reservoir height and discharge. They
also collect weekly data for water turbidity, transparency, and temperature. In addition, TVID collects weekly water samples immediately downstream of the discharge from Scoggins Dam during the sum-mer; these samples are sent to the Clean Water Services laboratory which analyzes them for nutrient and major ions.
• The Washington County Parks Department collects weekly samples at key sites around Hagg Lake; these samples are sent to the Oregon State Health Department for bacteria analysis.
Results for 2002Results for 2002Results for 2002Results for 2002Hagg Lake began to thermally stratify in April this year and continued to be stratified through mid-November (see graphs on the opposite page). Significant oxygen depletion in the hypolimnion (the lower level of the lake) was not observed until mid-June. By September, the bottom of the lake was anoxic.
Once the oxygen is depleted, denitrification can occur which produces ammonia. There was concern that if the intake structure in the reservoir tapped into the hypolimnion, ammonia would be discharged into Scoggins Creek. If the ammonia concentrations were high enough, several problem could result.
• It could be toxic to fish; • Nitrification of the ammonia could deplete oxygen levels in Scoggins Creek;• If the water reaching JWC’s drinking water plant at Springhill contained significant ammonia, it
would consume extra chlorine in the disinfection process, causing an increase in costs and in the con-centration of choramines in the treated water.
The first detection of ammonia in Hagg Lake in 2002 occurred in June and only for the deepest sample. The value was at or just above the detection limit (replicate samples had concentrations of 0.01 mg/L and 0.2 mg/L as N). Ammonia remained at low or undetectable concentrations until late October when it was 0.38 mg/L in the deepest sample. By the time the next sample was collected (November 19th), the lake had turned over and was well mixed. At that time, ammonia concentrations at all lake depths were unde-tectable or just at the detection limit (0.10 mg/L as N).
Ammonia production in the lower parts of Hagg Lake probably did not cause significant problems. Flows in the Tualatin River were high enough that the ammonia was diluted before it reached the intake for JWC.

2002 Tualatin River Flow Management Report 15
0 10 20
010
200
10Te
mpe
ratu
reD
isso
lved
Oxy
gen
1/15
/200
22/
12/2
002
3/19
/200
24/
23/2
002
5/20
/200
26/
3/20
026/
24/2
002
010
200
10Te
mpe
ratu
reD
isso
lved
Oxy
gen
010
200
10Te
mpe
ratu
reD
isso
lved
Oxy
gen
010
200
10Te
mpe
ratu
reD
isso
lved
Oxy
gen
010
200
10Te
mpe
ratu
reD
isso
lved
Oxy
gen
010
200
10Te
mpe
ratu
reD
isso
lved
Oxy
gen
010
200
10Te
mpe
ratu
reD
isso
lved
Oxy
gen
7/15
/200
2
010
200
10Te
mpe
ratu
reD
isso
lved
Oxy
gen
7/30
/200
2
010
200
10Te
mpe
ratu
reD
isso
lved
Oxy
gen
8/20
/200
2
010
200
10Te
mpe
ratu
reD
isso
lved
Oxy
gen
9/16
/200
2
010
200
10Te
mpe
ratu
reD
isso
lved
Oxy
gen
8/26
/200
2
010
200
10Te
mpe
ratu
reD
isso
lved
Oxy
gen
9/24
/200
2
010
200
10Te
mpe
ratu
reD
isso
lved
Oxy
gen
10/8
/200
2
010
200
10Te
mpe
ratu
reD
isso
lved
Oxy
gen
10/2
2/20
02
010
200
10Te
mpe
ratu
reD
isso
lved
Oxy
gen
11/1
9/20
02
010
200
10Te
mpe
ratu
reD
isso
lved
Oxy
gen
(ºC
)(m
g/L)
(ºC
)(º
C)
(ºC
)
(ºC
)(º
C)
(ºC
)(º
C)
(ºC
)(º
C)
(ºC
)(º
C)
(ºC
)(º
C)
(ºC
)(º
C)
(mg/
L)(m
g/L)
(mg/
L)
(mg/
L)(m
g/L)
(mg/
L)(m
g/L)
(mg/
L)(m
g/L)
(mg/
L)(m
g/L)
(mg/
L)(m
g/L)
(mg/
L)(m
g/L)
amm
on
ian
ot
det
ecte
dam
mo
nia
no
t d
etec
ted
amm
on
ian
ot
det
ecte
dam
mo
nia
no
t d
etec
ted
amm
on
ian
ot
det
ecte
d)
amm
on
ia(<
0.05
mg
/L)
amm
on
ia(<
0.05
mg
/L)
amm
on
ia(<
0.05
mg
/L)
amm
on
ian
ot
det
ecte
dam
mo
nia
(<0.
05 m
g/L
)am
mo
nia
(<0.
05 m
g/L
)am
mo
nia
(<0.
05 m
g/L
)
amm
on
ia(<
0.05
mg
/L)
amm
on
ia(<
0.05
mg
/L)
amm
on
ia(>
0.05
mg
/L)
Depth (m) Depth (m) Depth (m) Depth (m)
amm
on
ia(<
0.05
mg
/L)
30
0 10 20 30
0 10 20 30
0 10 20 30
0 10 20 30 0 10 20 30 0 10 20 30
0 10 20 30
0 10 20 30
0 10 20 30
0 10 20 30
0 10 20 30
0 10 20 30
0 10 20 30
0 10 20 30
0 10 20 30
oxyg
en d
ata
not a
vaila
ble
oxyg
en d
ata
not a
vaila
ble

16 2002 Tualatin River Flow Managment Report
JOINT WATER COMMISSION & JOINT BARNEY COMMISSIONJOINT WATER COMMISSION & JOINT BARNEY COMMISSIONJOINT WATER COMMISSION & JOINT BARNEY COMMISSIONJOINT WATER COMMISSION & JOINT BARNEY COMMISSIONBY CHUCK KINGSTON, WATER SUPPLY & WATER TREATMENT PLANT SUPERVISORJWC provides potable water to its member agencies: the Cities of Hillsboro, Forest Grove, and Beaverton, and to the Tualatin Valley Water District. About 250,000 people receive at least a portion of their water from JWC. JWC's water production averages approximately 25 million gallons per day. During the peak periods of the summer, production has reached 48 million gallons per day.
JWC's water treatment plant is supplied water from the nearby Tualatin River. Water is pumped from an intake facility that was constructed by the Bureau of Reclamation and is shared with the Tualatin Valley Irrigation District (TVID). Flows in the Tualatin River are supplemented from water that is impounded behind Scoggins Dam (Hagg Lake) and water that is stored in Barney Reservoir. Scoggins Dam is owned by the Bureau of Reclamation and is operated by TVID. The Barney Joint Operating Commission (BJOC) is the owner of Barney Reservoir, which is formed behind the Eldon Mills Dam on the Trask River. The BJOC includes all members of the JWC as well as Clean Water Services.
The JWC water treatment plant uses conventional, dual media filtration, along with disinfection to pro-duce potable water. Treated water is pumped from the plant to the member agencies either directly through finished water pipelines leaving the plant or via the Fern Hill Reservoir. Fern Hill Reservoir is a 20 million gallon covered, concrete tank located about one-third mile to the east of the water treatment plant. The JWC finished water pipelines include master meter and pressure reducing stations at the con-nection points to the member agencies.
This year JWC continued t he cooperative water quality monitoring project with the BOR and CWS. The data collected is a model for other reservoirs and will greatly enhance the picture we have of this reservoir as it continues to meet the M & I, irrigation and recreation needs of the future.
JWC began a concerted effort to better track and capture the water released from the two reservoirs this year. I would like to thank Jean Woll of the Hillsboro—JWTP staff for her magnificent work at making this effort through the use of compounded spreadsheets. Her work gives us a tool that we didn't have before and takes what was a monument to objectivity and puts it closer to reality.
We appreciate the efforts of our partners on the Flow Management Committee and extend our thanks for all of their involvements. The communication and coordination that comes from this committee is invalu-able.
2002 Tualatin River Flow Management Report 17
LAKE OSWEGO CORPORATIONLAKE OSWEGO CORPORATIONLAKE OSWEGO CORPORATIONLAKE OSWEGO CORPORATIONBY MARK ROSENKRANZ, WATER RESOURCE SPECIALIST
IntroductionIntroductionIntroductionIntroductionThe Lake Oswego Corporation (LOC), a non-profit organization, owns and manages Oswego Lake, a 168-hectare (403 acre) reservoir located 10 miles south of Portland, Oregon. LOC was formed in 1942 when the Oregon Iron and Steel Company, then owner of the land around the Lake, deeded to LOC the land, three dam structures, and all water rights. The original dam was constructed in 1871 and later upgraded in 1921. Oswego Lake is a private water body whose primary water right is hydropower genera-tion. Secondary uses include irrigation, aesthetic viewing, contact recreation, fishing, and boating.
Oswego Lake and Watershed MorphologyOswego Lake and Watershed MorphologyOswego Lake and Watershed MorphologyOswego Lake and Watershed MorphologyThe original natural lake, called Waluga, was formed 10,000 years ago by the Missoula glacial floods, altering the old Tualatin River channel. Today, the Lake is comprised of three basins: West Bay, the Main Lake, and Lakewood Bay. There are also two shallow, man-made canals, Blue Heron Canal and Oswego Canal (inlet). Oswego Canal is the 2.4-km conduit from the Tualatin River (RM 6.7). The total surface area of these waterbodies is 1.63 km2 (403 acres). Total volume of the Lake is 12.7 x 10+6 m3 (10,300 acre-feet). The shoreline length, including bays and canals, is 18.62 km (11.56 mi.). Oswego Lake has a 5.08-km (3.15-mi) fetch and a narrow 0.56-km (0.34-mi) width . The hydraulic residence time is 390 days.
Oswego Lake's two watersheds include the natural, 7.5-mi2 urban basin around the Lake (10:1 watershed to lake-area ratio) and the larger 700-mi2 Tualatin River basin (1,000:1 ratio) when the LOC Headgate is opened. Major inflows from the watershed include Springbrook Creek, Lostdog Creek, Blue Heron Creek, and 60+ storm drains from the City of Lake Oswego.
LOC Water RightsLOC Water RightsLOC Water RightsLOC Water RightsHydro PowerThe primary hydro power water right is 57.5 cubic feet per second (cfs) obtained in 1906 that allows year around diversion. To guarantee this flow during the dry season, LOC owns and operates a "flaps dam" located downstream of the Oswego Canal (RM 3.4). Flaps are erected on an "as needed" basis. In 2002, 23 out of 45 flaps were erected on 6/14, 9 on 7/30 and six on 8/3 for a total of 38. Eight flaps were lowered on 8/30, eight on 9/20 and the remaining 22 on 10/23.
IrrigationThere is also a 1974 irrigation water right of 500 acre-feet for the March–October irrigation season. LOC proved up their irrigation water right in 2000 with the Bureau of Reclamation and the Oregon Water Resources Department. The largest irrigator on the Lake is the Lake Oswego Country Club (approxi-mately 175 acre-feet). Due to the lack of water, the Bureau of Reclamation reduced LOC's water right to 383 acre-feet.
Maintenance/EvaporationThe third water right is the 1985 maintenance/evaporation water right of 3.36 cfs. This water can be diverted between September 16th and July 30th.

18 2002 Tualatin River Flow Managment Report
2002 Oswego Lake Management Summary2002 Oswego Lake Management Summary2002 Oswego Lake Management Summary2002 Oswego Lake Management SummaryWater quality improvements and safety are the top priorities for LOC. The goal for the annual LOC Water Quality Management Plan is to reduce Cyanobacteria productivity and maximize the aesthetic values of the Lake by focusing on flow management, water quality treatment, and macrophyte issues.
Lake Water QualityIn 2002, the continued Oswego Lake water quality-monitoring program included six sites where water clarity, nutrient content, biological productivity, and chemical profiles were recorded. The year-round monitoring was conducted weekly with more emphasis during the summer season, June–September.
2002 OSWEGO LAKE WATER QUALITY SUMMARY AVERAGES
Algae: The dominant algae species in 2002 was the Cyanophyte Coelosphaerium. In previous years Glo-etrichia dominated the system, creating surface mats. A healthy population of Coelosphaerium has turned the water green, but since it stays suspended in the water column surface matting has not been an issue. Gleotrichia is present in the lake but in very small numbers.
Macrophytes: Macrophytes were less of a problem this year because of a spring herbicide treatment that targeted non-native plants in Oswego Canal, Blue Heron Canal, Lakewood Bay and Half Moon Bay. Lakewood Bay has been dominated by the non-native plant Potamogeton crispus (Curly-leaf Pondweed) since 1999 resulting in impaired navigation. Oswego Canal and Blue Heron Canal have a small, pioneer-ing population of Egeria densa (Brazilian elodea) that was controlled effectively with herbicides and physical removal methods.
Dissolved Oxygen (DO): Low DO levels in Blue Heron Canal and the Main Lake have been a major water quality problem in past years. Since 2001 an aeration system has been operating in Blue Heron Canal. Prior to aeration, anoxia from decaying organic matter would cause fish mortality and odor prob-lems. Aeration during 2002 kept DO levels above 6 mg/L year around and there were no reports of major fish mortality in the canal.
A layered aeration system was installed in the Main Lake during the summer of 2001 and activated in August that same year. The first full year of Main Lake aeration was in 2002. Prior to aeration the entire hypolimnion would be anoxic. In 2002 only the bottom meter was anoxic.
Location SeasonChl-a(µg/L)
TP(µg/L)
SRP(µg/L)
TN(µg/L)
Secchi(m)
Turb(m)
Temp(C)
DO(mg/L)
DO(%)
pH
Lakewood Bay Annual 14.2 83.4 12.3 626.6 2.1 3.9 14.4 10.5 99 8.09
Summer 17.9 128.6 19.8 861.7 1.0 8.0 22.7 7.8 91 7.99
Main Lake Annual 16.2 55.1 6.1 715.9 2.3 4.4 12.4 9.7 88 8.21
Summer 10.4 53.0 5.3 565.5 1.5 7.4 17.7 5.8 64 8.2
West Bay Annual 16.1 134.6 46.0 1533.4 1.0 9.5 14.7 12.3 121 8.43
Summer 17.8 174.1 62.5 919.2 0.7 15.1 22.3 11.4 132 8.95
Oswego Canal Annual 2.8 125.8 85.9 3673.6 1.2 5.1 13.6 10.0 95 7.8
Summer 2.8 91.1 47.6 3570.0 1.1 4.7 19.8 8.9 97 8.0
Blue HeronCanal
Annual 17.8 289.0 86.9 1659.6 0.8 13.2 13.2 7.5 70 7.6
Summer 23.4 378.6 83.5 2090.0 0.8 21.6 20.5 5.7 63 7.6
Outlet Annual 12.0 40.8 5.4 953.9 2.4 3.5 14.0 11.8 112 8.54
Summer 8.6 42.9 4.4 1224.2 1.6 5.1 21.6 10.0 115 8.94
Bold = highest average during the summer; Underline = lowest average during the summer Summer=June–September
Abbreviations: Chl-a = Chlorophyll-a, TP = Total Phosphorus, SRP = Soluble Reactive Phosphorus, TN = Total Nitrogen, Secchi = Secchi depth, Turb = Turbidity, Temp = Temperature, D.O. = Dissolved Oxygen, pH = Acidity, ug/L = micrograms per liter, m = meters, NTU = nephelometric turbidity units, C = Celsius

2002 Tualatin River Flow Management Report 19
Chemical Treatments: No copper was used in Oswego Lake in 2002. Chemical treatments were limited to herbicide applications to control non-native aquatic weeds. In spring of 2002 Lakewood Bay, Half Moon Bay, Oswego Canal and Blue Heron Canal were treated with herbicide. Later in 2002 West Bay was treated for non-native vegetation.
Oswego Lake Watershed ManagementOswego Lake Watershed ManagementOswego Lake Watershed ManagementOswego Lake Watershed ManagementTo provide long-term water quality solutions and to be pro-active in preserving the quality of the Lake, watershed activities are a major part of the LOC management plan.
Tualatin River Flows: The 2002 flow policy called for daytime flows of approximately 3 cfs and night-time flow of 30 cfs. Nighttime flow occurred only when water was necessary to maintain lake level.
Lake-Friendly Fertilizer: LOC developed an inorganic non-phosphorus turf fertilizer in 2000 that has been very popular. The next step was to initiate a turf fertilizer ordinance with the City of Lake Oswego. Additional soil samples were collected around the City and City engineers researched the possibility of having restrictions on what people apply to their lawns. The goal is to improve water quality for all three water bodies, the Tualatin River, the Willamette River, and Oswego Lake. No additional work towards a City ordinance was performed in 2002.
Stream Restoration: The City of Lake Oswego installed a flow meter on Springbrook Creek in August of 2000 and has added an autosampler in 2001. The City's largest stream restoration project was completed in 2001. The City spent $300,000 restoring 2,316 feet of Springbrook Creek. The goal of the project was to reintroduce the natural floodplain and to lengthen the stream with new meanders. In 2002 the City had plans to restore approximately 1200 feet of Springbrook Creek near the outfall to Oswego Lake. This project would greatly reduce sediment outfall into the lake by intercepting debris from upstream and pre-venting additional bank undercutting at the restoration site. Due to budget and engineering concerns, the project has been delayed.
Oswego Lake Water Quality Improvement ProjectOswego Lake Water Quality Improvement ProjectOswego Lake Water Quality Improvement ProjectOswego Lake Water Quality Improvement ProjectIn 2001, LOC installed and operated a 2-layer aeration system for the Main Lake. During the summer of 2002 the compressors were activated on April 24 and shut down on October 10. During that period DO levels in the main lake hypolimnion were significantly higher than in 2001. This is the beginning of a five year commitment to improve lake water quality.
Oswego Lake Fish Screen ProjectOswego Lake Fish Screen ProjectOswego Lake Fish Screen ProjectOswego Lake Fish Screen ProjectOn Monday, August 19, 2002 sheet piling was installed to block Tualatin water from Oswego Canal. Sheet piling was removed on September 19th allowing water to again flow through the headgate. During construction two large pumps were used to move water past the construction site into the canal.
Management in the FutureManagement in the FutureManagement in the FutureManagement in the FutureLOC continues to monitor the Lake and watershed to better understand the ecosystem. Future plans are:
• Implement an integrated aquatic plant management plan involving herbicides and harvesting• Continue educating watershed residents about water quality impacts• Assess conditions in bays and canals and propose localized solutions• Work with City to improve surface water runoff to the Lake• Construct a 2-D water quality model of the Lake to help make management decisions• Maximize the water quality improvements with the 2-layer lake aeration system

20 2002 Tualatin River Flow Managment Report
OREGON WATER RESOURCES DEPARTMENTOREGON WATER RESOURCES DEPARTMENTOREGON WATER RESOURCES DEPARTMENTOREGON WATER RESOURCES DEPARTMENTBY DARRELL C. HEDIN, WATERMASTER, DISTRICT 182002 Overview2002 Overview2002 Overview2002 OverviewThe District 18 Watermaster's office experienced a more normal water year in 2002 as compared with the drought of the previous year. The water right regulation season for 2002 is summarized below.
The year, however, brought about major changes for the Watermaster and staff. The boundaries of the dis-trict were expanded to include eastern Columbia County. The new area includes management responsibil-ity of all drainages that flow into the lower Willamette and Columbia Rivers extending northward to Clatsop County. The Watermaster formerly in Saint Helens was relocated to Oregon City, and a new office was established in Tillamook to cover the coastal area. These changes are providing an increased emphasis to high priority areas in support of the Governor's Oregon Plan.
TABLE A. SURFACE WATER REGULATION SUMMARY FOR 2002 Date Stream Earliest Priority Date Regulated
June 3 Tualatin River & tributaries above mile 44.73 2/5/1974
June 12 Tualatin River & tributaries below mile 44.73 2/20/1963
July 16 Sain Creek above Hagg Lake (all) 1/22/1912
July 31 Tualatin River & tributaries below mile 44.73 10/12/1976
August 6 McKay Creek above Northrup Road 8/8/1963
August 15 EF Dairy & tributaries above mile 13.0 3/6/1967
Sept 30 Tualatin Basin—end of irrigation season All

2002 Tualatin River Flow Management Report 21
The Oregon Plan for salmon & watershedsThe Oregon Plan for salmon & watershedsThe Oregon Plan for salmon & watershedsThe Oregon Plan for salmon & watershedsWithin District 18, efforts have and are continuing to be made to establish streamflow restoration priori-ties for Salmonid species.The prioritization process is a cooperative effort with ODFW district biologists
to identify watersheds in which flow restoration is needed to support fish recovery. The Water-master also identifies watersheds where there are opportunities to restore flows through improve-ment of water management and the transfer of water rights to instream use. These evaluations have resulted in the classification of High Prior-ity Water Availability Basins or WAB's within each Watermaster district where species are listed. Priority streams have been identified and opportunity rankings developed for each subba-sin. Current information is available at: www.wrd.state.or.us/programs/salmon/priority.
Significant Diversion InventorySignificant Diversion InventorySignificant Diversion InventorySignificant Diversion InventoryWithin each priority WAB, the Watermaster has identified withdrawals that are listed as significant, based upon the quantity of water diverted. Field verification is underway to assess compliance with water right permit conditions. A second task addresses the installation of measuring devices for signifi-cant diversions, within high priority areas, that do not currently have water right condi-tion measurement requirements. ORS 540.310 provides the authority for the Water-master to post a headgate notice to require measurement devices when deemed war-ranted for regulation purposes.
Workable strategies have been developed which incorporate efforts into a broad, programmatic context. This coordinated endeavor seeks to build on previous efforts and will be focused within the highest priority areas for streamflow restoration. The area identified within the Tualatin River Basin with the highest priority is the Dairy Creek drainage, the largest by geographical size within the basin. This area consists of the main stem, east and west forks of Dairy Creek, including tributary streams, and the McKay Creek drainage. The combined area totals 231 square miles and is intensively farmed with various irrigated crops.
Watersheds 2000 Watersheds 2000 Watersheds 2000 Watersheds 2000 This year marked the first full year that the District 18 Watermaster's office participated in the Watersheds 2000 program by constructing and operating 17 streamflow gaging stations. The study is sponsored by Clean Water Services and is a key component of the Healthy Streams Plan. An inventory will assess the location and condition of selected stream systems within the largely urbanized areas of the Tualatin Basin. Streamflow data combined with water quality, habitat, floodplain, vegetation type and condition, and other information has been gathered. The information will also help focus the attention on other projects that may improve the health of the system.
A complete listing of streamflow gaging stations that are operated by OWRD within the Tualatin River Basin are listed on the following page

22 2002 Tualatin River Flow Managment Report
WATERMASTER DISTRICT 18 GAUGING STATIONS FOR 2002Station Number
Stream Stream Mile Latitude Longitude Type
14206933 Ash Creek @ Metzger Park @ Metzger, OR 1.25 45°27’00”N 122°45’45”W Logger
14206435 Beaverton Creek @ 216th Ave near Orenco, OR. 1.2 45°31’15”N 122°53’59”W Logger
14206400 Beaverton Creek @ 170th near Aloha, OR 5.0 45°30’03”N 122°51’03”W Staff
14206360 Beaverton Creek @ Cedar Hills Blvd @ Beaverton, OR 7.45 45°49’31”N 122°81’05”W Logger
14206423 Bronson Creek @ Bronson Rd near Orenco, OR 2.1 45°32’18”N 122°51’15”W Logger
14206421 Bronson Creek @ West Union near Orenco, OR 3.1 45°32’42”N 122°50’18”W Staff
14206419 Bronson Creek @ Saltzman Rd near Orenco, OR 5.1 45°33’19”N 122°48’25”W Logger
14206748 Cedar Creek @ Edy Rd near Sherwood, OR 0.62 45°22’05”N 122°51’22”W Logger
14206395 Cedar Mill Creek @ Murray Blvd near Beaverton, OR 1.64 45°30’37”N 122°49’18”W Logger
14206750 Chicken Creek @ Scholls-Sherwood Rd near Sherwood, OR 2.3 45°22’31”N 122°51’24”W Logger
14206200 Dairy Creek at Hwy 8 near Hillsboro, OR 2.06 45°30’38”N 123°06’56”W *Logger
14205480 E. Fk. Dairy Creek at Dairy Creek Rd near Mountaindale, OR 12.33 45°40’32”N 123°03’54”W Staff
14205000 W. Fk. Dairy Creek @ Banks, OR 7.7 45°37’26”N 123°06’59”W Staff
14205160 W. Fk. Dairy Creek @ Evers Rd near Roy, OR 1.96 45°34’34”N 123°05’34”W Staff
14206443 Dawson Creek @ Brookwood Rd near Hillsboro, OR 0.7 45°31’27”N 122°56’01”W Logger
14206441 Dawson Creek @ Airport Rd near Hillboro, OR 2.2 45°32’18”N 122°56’05”W Staff
14206365 Erickson Creek @ Menlo Dr @ Beaverton, OR 0.76 45°29’14”N 122°58’54”W Logger
14206950 Fanno Creek @ Durham Rd near Tigard, OR 1.2 45°24’12”N 122°45’18”W *Logger
14206928 Fanno Creek nr SW Parkview Loop near Metzger, OR 7.3 45°27’27”N 122°47’43”W Staff
14206925 Fanno Creek @ Scholls Ferry Rd near Garden Home, OR 9.4 45°28’16”N 122°46’25”W Staff
14204530 Gales Creek @ Old Hwy 47 @ Forest Grove, OR 2.36 45°30’39”N 123°06’56”W *Logger
14204540 Gales Creek @ Clapshaw Hill Rd near Gales Creek, OR 12.36 45°35’39”N 123°12’38”W Staff
14206957 Hedges Creek Wetland near Tualatin, OR 1.2 45°22’53”N 122°46’35”W Logger
14206958 Hedges Creek @ Tualatin Park @ Tualatin, OR 0.3 45°23’08”N 122°45’37”W Logger
14206372 Johnson Creek @ Davis Rd near Beaverton, OR 1.3 45°28’30”N 122°49’52”W Logger
14206070 McKay Creek above Waible Cr @ Scotch Church Rd near North Plains, OR 6.3 45°57’21”N 122°99’18”W Logger
14206180 McKay Creek @ near Hillsboro, OR (Hornecker Rd.) 2.2 45°32’33”N 123°00’14”W Staff
14205980 McKay Creek @ Northrup Rd near North Plains, OR 15.5 45°38’36”N 122°59’32”W Staff
14205960 E. Fk. McKay Creek above Neil Cr @ Dixie Mtn. Rd near North Plains, OR 0.5 45°39’15”N 122°58’33”W Staff
14207000 Oswego Canal near Lake Oswego, OR 6.7 45°23’18”N 122°43’10”W Logger
14206450 Rock Creek @ Hwy 8 near Hillsboro, OR 1.2 45°30’08”N 122°56’52”W Logger
14206347 Rock Creek @ Quatama Rd @ Orenco, OR 4.9 45°31’25”N 122°54’34”W Logger
14206305 Rock Creek @ Rock Creek Rd near Bowers Junction, OR 15.8 45°37’04”N 122°53’13”W Logger
14206338 Rock Creek near Bethany, OR (West Union Rd) 9.0 45°33’34”N 122°52’30”W Logger
14202920 Sain Creek above Hagg Lake near Gaston, OR 1.6 45°28’50”N 123°14’40”W Logger
14202850 Scoggins Creek above Hagg Lake near Gaston, OR 8.0 45°30’06”N 123°15’06”W *Logger
14211116 Springbrook Creek @ Iron Mtn Rd near Lake Oswego, OR 0.18 45°24’46”N 122°42’13”W Logger
SLAB Summer Creek above Summer Lake near Tigard, OR 1.52 45°26’20”N 122°48’38”W Logger
SLBE Summer Creek below Summer Lake near Tigard, OR 1.32 45°26’14”N 122°48’19”W Logger
14206938 Summer Creek @ 121st Ave near Tigard, OR 1.0 45°26’06”N 122°47’55”W Logger
14206905 Sylvan Creek @ Raleighwood Ln near West Slope, OR 1.0 45°29’35”N 122°44’48”W Logger
14202860 Tanner Creek above Hagg Lake near Gaston, OR 1.6 45°30’21”N 123°13’10”W Staff
14202450 Tualatin River below Lee Falls near Cherry Grove, OR 70.7 45°30’21”N 123°13’06”W Logger

2002 Tualatin River Flow Management Report 23
Web page updateWeb page updateWeb page updateWeb page updateIn early 2002, the Watermaster web page was redesigned and expanded in an effort to provide the public with a variety of useful information. Beginning in 2001, the Tualatin Basin Flow Management Report became available for viewing and downloading, in addition to streamflow and water right information. The address of this site is http://www.co.washington.or.us/watermaster.
14202510 Tualatin River @ Gaston, OR 62.3 45°26’21”N 123°07’85”W *Logger
14204800 Tualatin River @ Golf Course Rd near Cornelius, OR 51.5 45°30’08”N 123°03’22”W *Logger
14206241 Tualatin River @ Hwy 219 near Hillsboro, OR 44.4 45°30’01”N 122°59’24”W Staff
14206295 Tualatin River @ Rood Bridge 38.4 45°29’24”N 122°57’06”W *Logger
14206500 Tualatin River @ Farmington 33.3 45°26’58”N 122°57’02”W *Logger
14206600 Tualatin River @ Elsner 16.2 45°23’17”N 122°51’03”W Staff
14206960 Tualatin River @ Tualatin 8.9 45°23’14”N 122°45’46”W Logger
14206990 Tualatin River @ Oswego Canal near Lake Oswego, OR 6.7 45°22’57”N 122°43’17”W Logger
14206100 Waible Creek at Jackson School Rd near Hillsboro, OR 1.0 45°33’55”N 122°58’12”W Logger
WAPO Wapato Canal near Gaston, OR (from Tualatin R) 61.9 Staff
14206410 Willow Creek @ NW 143rd Ave near Beaverton, OR 3.5 45°32’12”N 122°49’24”W Logger
14206413 Willow Creek @ Heritage Pkwy near Beaverton, OR 0.75 45°31’12”N 122°51’35”W Logger
*Telemetry
WATERMASTER DISTRICT 18 GAUGING STATIONS FOR 2002Station Number
Stream Stream Mile Latitude Longitude Type
Gauging station at Scoggins Creek above Hagg Lake (RM 4.8)

24 2002 Tualatin River Flow Managment Report
TUALATIN VALLEY IRRIGATION DISTRICTTUALATIN VALLEY IRRIGATION DISTRICTTUALATIN VALLEY IRRIGATION DISTRICTTUALATIN VALLEY IRRIGATION DISTRICTBY WALLY OTTO, RESERVOIR SUPERINTENDENT
IntroductionIntroductionIntroductionIntroductionThe Tualatin Valley Irrigation District (TVID), located in Forest Grove Oregon, delivers irrigation water to about 17,000 acres in the Tualatin basin. The water is supplied from natural flows, return flows and from storage behind Scoggins dam in Henry Hagg Lake. Water from these sources is pumped from the Tualatin River at the Spring Hill Pump Plant. It is then delivered to patrons through approximately 120 miles of pressurized pipeline. Additional water flows down the river and is withdrawn by irrigators at their individual pump sites. Crops irrigated with the water range from row crops including numerous ber-ries, corn, peppers and beans to nursery stock.
2002 TVID Overview2002 TVID Overview2002 TVID Overview2002 TVID OverviewThe drought of 2001 lasted only one year. Regular and heavy rains returned on October 23rd and contin-ued for the winter season. While many areas in Oregon remained "water-short" for the year, the Tualatin basin saw a return to typical weather conditions. Scoggins reservoir was at 100% capacity (53,640 Acre feet) by April 28, 2002 and the natural flows remained adequate for District water needs until early June. Water regulation began on June 3rd and both the District and the JWC began using stored water to aug-ment their demand.
The District continues its cooperation with Washington County in preparation for the two intersection "Round About" projects on Martin and Cornelius Schefflin roads. Construction is scheduled for the Spring and Summer of 2003. District Personnel have also worked closely with the Oregon Water Resources Department to change the lost acreage of these projects to other agriculturally viable lands that had no previous Final Proof coverage but are owned by the affected District patrons. The entire Final Proof process that the District has been working on for several years is to certify permitted water rights of the District and its patrons. The required documentation has currently been submitted to the Oregon Water Resources Department for approval.
2002 TVID Water Use2002 TVID Water Use2002 TVID Water Use2002 TVID Water UseSmall amounts of water were delivered beginning in March and continued until December. The heavy usage was during the months of June through September. The water at the beginning and end of the sea-son was used primarily for frost control and by the container nursery industry. The District used 19,093 acre feet of storage water during the season. This compared to 10,702 acre feet used during the drought year of 2001 and to its annual average use of 16,894 acre feet. The District still had over 8,000 acre feet remaining in storage at the end of the season.
Scoggins DamScoggins DamScoggins DamScoggins DamScoggins Dam, the primary feature of the Tualatin Project, is located on Scoggins Ck, a tributary of the Tualatin River. Owned by the United States Bureau of Reclamation, Scoggins Dam was built in the early 1970's for the purpose of storing water in the winter to augment low summertime flows in the Tualatin River. Operation and Maintenance of the dam is conducted under contract by TVID with the Federal Bureau of Reclamation. Scoggins Dam provides flood control for the cities of Gaston, Forest Grove, Cor-nelius and other downstream communities. Irrigation water is supplied to 17,000 acres in the Tualatin basin from the Project. Fourteen thousand acre feet of Municipal and Industrial water is provided from the reservoir for Forest Grove, Hillsboro and Beaverton and the Lake Oswego Corporation. Clean Water Services has 16,900 acre feet contracted from the Project which includes 12,618 acre feet from storage. This water is used to augment the Tualatin river stream flows to meet water quality standards set for the river. The reservoir (Henry Hagg Lake) is also a major recreational focal point for Washington County. The lake provides over 600,000 user-days annually for recreational activities including fishing, swimming and boating.

2002 Tualatin River Flow Management Report 25
Security at Scoggins dam continued to be upgraded. The Department of Homeland Security was created and soon issued a new five level terror alert system for the federal government. The Bureau of Reclama-tion-Department of the Interior then adopted the Advisory System and Response Measures for its Projects including Scoggins dam. They immediately were put into effect as follows:
Each level has protective measures to implement. Site security and other responses increase as the alert level increases. New security measures were implemented during 2002 at Scoggins dam as a result. Many more are anticipated. Two separate Vulnerability Assessments are currently underway. High priority is placed on Project integrity, reliability and safety. As a result, new measures were incorporated during 2002 to protect the structure and the water source it provides.
Flood Control: The Project provided four major flood control benefits for the 2002 water year. The first event came in early December, 2001 and marked the beginning of the end of the 2001 drought. The last event came in early March 2002. In anticipation of this event, the water surface was actually drawn down. Before it was over, over five inches of precipitation was recorded in eleven days. This marked a sharp contrast to the previous year when all available water was being retained in storage for as long as possible! A total of 55.7" of precipitation (105% of normal) was collected at the dam from October 2001 to Septem-ber 2002.
Water Deliveries: The Irrigation District began drawing water from storage in early April. Early in June, the natural flow in the Tualatin River dropped to the 78 cfs and regulation of withdrawals was increased by the Watermaster. The Joint Water Commission began pulling water from Scoggins storage on June 3rd in order to meet their demand. Heavy demand continued for the District for July and August with about 5500 acre feet released both months. Clean Water Services (CWS) began augmenting the Tualatin River flows on July 12. CWS gradually increased their demand during August and by mid September surpassed the District in daily usage. District patrons began to cut back as various crops were harvested. CWS exhausted it 12,618 acre feet of stored water on November 9. Several inches of rainfall were recorded by November 13 which brought the Tualatin River natural flow back up and regulation was lifted. The JWC demand picked back up again near the end of November and early December during a two week dry period. This ended on December 9 when significant rains returned to the area and all storage releases ceased. The total amounts delivered from Scoggins storage for 2002 are given below and compared to the previous five years.
Green alert Low risk of terrorist attacks
Blue alert General risk of terrorist attacks
Yellow alert Significant risk of terrorist attacks
Orange alert High risk of terrorist attacks
Red alert Severe risk of terrorist attacks
SIX YEAR WATER DELIVERY SUMMARY FROM SCOGGINS DAMThe following totals reflect water delivered from storage and is in addition to all water used by the contracting agencies from natural and return flow. One-acre foot equals 325,390 gallons. Reservoir full pool is 53,640-acre-ft.
Agency 2002 2001 2000 1999 1998 1997
TVID 19,093 ac-ft 10,704 ac-ft 15,012 ac-ft 18,248 ac-ft 14,758 ac-ft 16,463 ac-ft
CWS (formerly USA) 12,618 ac-ft 2,403 ac-ft 15,276 ac-ft 11,971 ac-ft 9,407 ac-ft 6,716 ac-ft
Hillsboro 3,712 ac-ft 3,490 ac-ft 2,867 ac-ft 4,543 ac-ft 4,522 ac-ft 2,286 ac-ft
Forest Grove 3,664 ac-ft 2,243 ac-ft 572 ac-ft 910 ac-ft 818 ac-ft 253 ac-ft
Beaverton 1,508 ac-ft 3,053 ac-ft 2,236 ac-ft 2,912 ac-ft 3,719 ac-ft 1,807 ac-ft
Lake Oswego 496 383 ac-ft 500 ac-ft 500 ac-ft 499 ac-ft 500 ac-ft
Other 898 * 825 ac-ft 1,309 ac-ft 878 ac-ft 687 ac-ft
Total 41,989 ac-ft 22,276 ac-ft 37,688 ac-ft 41,530 ac-ft 34,599 ac-ft 28,712 ac-ft
(*Provisions were made to supply other M & I needs)
26 2002 Tualatin River Flow Managment Report
WATER QUALITY STATUS REPORTWATER QUALITY STATUS REPORTWATER QUALITY STATUS REPORTWATER QUALITY STATUS REPORTBY JAN MILLER, CLEAN WATER SERVICES
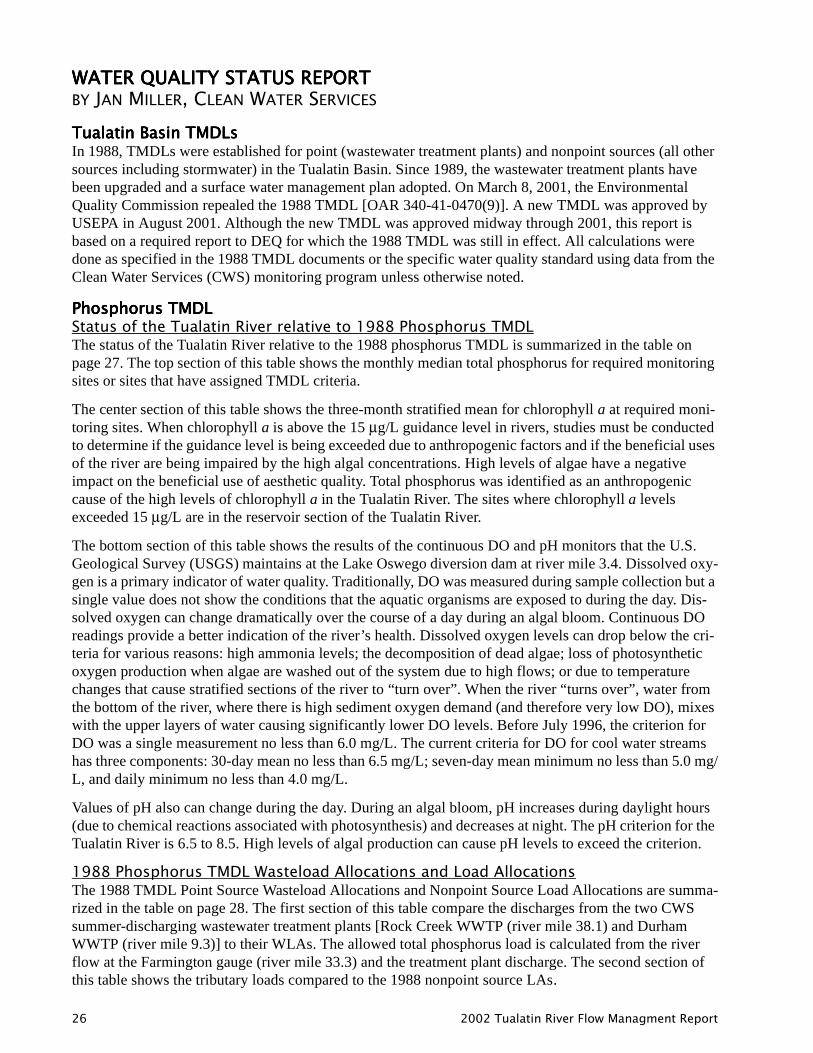
Tualatin Basin TMDLsTualatin Basin TMDLsTualatin Basin TMDLsTualatin Basin TMDLsIn 1988, TMDLs were established for point (wastewater treatment plants) and nonpoint sources (all other sources including stormwater) in the Tualatin Basin. Since 1989, the wastewater treatment plants have been upgraded and a surface water management plan adopted. On March 8, 2001, the Environmental Quality Commission repealed the 1988 TMDL [OAR 340-41-0470(9)]. A new TMDL was approved by USEPA in August 2001. Although the new TMDL was approved midway through 2001, this report is based on a required report to DEQ for which the 1988 TMDL was still in effect. All calculations were done as specified in the 1988 TMDL documents or the specific water quality standard using data from the Clean Water Services (CWS) monitoring program unless otherwise noted.
Phosphorus TMDLPhosphorus TMDLPhosphorus TMDLPhosphorus TMDLStatus of the Tualatin River relative to 1988 Phosphorus TMDLThe status of the Tualatin River relative to the 1988 phosphorus TMDL is summarized in the table on page 27. The top section of this table shows the monthly median total phosphorus for required monitoring sites or sites that have assigned TMDL criteria.
The center section of this table shows the three-month stratified mean for chlorophyll a at required moni-toring sites. When chlorophyll a is above the 15 µg/L guidance level in rivers, studies must be conducted to determine if the guidance level is being exceeded due to anthropogenic factors and if the beneficial uses of the river are being impaired by the high algal concentrations. High levels of algae have a negative impact on the beneficial use of aesthetic quality. Total phosphorus was identified as an anthropogenic cause of the high levels of chlorophyll a in the Tualatin River. The sites where chlorophyll a levels exceeded 15 µg/L are in the reservoir section of the Tualatin River.
The bottom section of this table shows the results of the continuous DO and pH monitors that the U.S. Geological Survey (USGS) maintains at the Lake Oswego diversion dam at river mile 3.4. Dissolved oxy-gen is a primary indicator of water quality. Traditionally, DO was measured during sample collection but a single value does not show the conditions that the aquatic organisms are exposed to during the day. Dis-solved oxygen can change dramatically over the course of a day during an algal bloom. Continuous DO readings provide a better indication of the river’s health. Dissolved oxygen levels can drop below the cri-teria for various reasons: high ammonia levels; the decomposition of dead algae; loss of photosynthetic oxygen production when algae are washed out of the system due to high flows; or due to temperature changes that cause stratified sections of the river to “turn over”. When the river “turns over”, water from the bottom of the river, where there is high sediment oxygen demand (and therefore very low DO), mixes with the upper layers of water causing significantly lower DO levels. Before July 1996, the criterion for DO was a single measurement no less than 6.0 mg/L. The current criteria for DO for cool water streams has three components: 30-day mean no less than 6.5 mg/L; seven-day mean minimum no less than 5.0 mg/L, and daily minimum no less than 4.0 mg/L.
Values of pH also can change during the day. During an algal bloom, pH increases during daylight hours (due to chemical reactions associated with photosynthesis) and decreases at night. The pH criterion for the Tualatin River is 6.5 to 8.5. High levels of algal production can cause pH levels to exceed the criterion.
1988 Phosphorus TMDL Wasteload Allocations and Load AllocationsThe 1988 TMDL Point Source Wasteload Allocations and Nonpoint Source Load Allocations are summa-rized in the table on page 28. The first section of this table compare the discharges from the two CWS summer-discharging wastewater treatment plants [Rock Creek WWTP (river mile 38.1) and Durham WWTP (river mile 9.3)] to their WLAs. The allowed total phosphorus load is calculated from the river flow at the Farmington gauge (river mile 33.3) and the treatment plant discharge. The second section of this table shows the tributary loads compared to the 1988 nonpoint source LAs.

2002 Tualatin River Flow Management Report 27
STATUS OF THE TUALITIN RIVER: 1988 TMDL – TOTAL PHOSPHORUS
2002 MONTHLY MEDIAN TOTAL PHOSPHORUS (mg/L as P) (at compliance or required monitoring sites)
RIVER MILE
TMDLSAMPLES/
MONTHMAY JUNE JULY AUG SEPT OCT
TUALATIN RIVER
CHERRY GROVE 71.5 0.02 4 0.01 0.01 0.01 0.01 0.01 0.01
DILLEY 61.2 0.04 4 0.02 0.01 0.01 0.01 0.01 0.01
GOLF COURSE 52.8 0.045 4 0.03 0.03 0.03 0.03 0.01 0.02
ROOD ROAD 39.1 0.05 4 0.06 0.06 0.06 0.05 0.04 0.04
FARMINGTON 33.3 0.07 1 0.07 0.09 0.18 0.07 0.05 0.06
SCHOLLS 27.1 0.07 4 0.08 0.08 0.10 0.09 0.06 0.06
ELSNER 16.5 0.07 4 0.07 0.09 0.09 0.08 0.07 0.06
BOONES FERRY 8.7 0.07 4 0.09 0.10 0.08 0.07 0.07 0.06
STAFFORD 5.4 0.07 4 0.08 0.10 0.08 0.08 0.07 0.06
TRIBUTARIES
SCOGGINS CREEK 60 0.06 4 0.03 0.01 0.01 0.01 0.01 0.01
GALES CREEK 56.8 0.045 4 0.03 0.04 0.04 0.06 0.05 0.04
DAIRY CREEK 44.7 0.045 4 0.08 0.10 0.12 0.12 0.14 0.13
MCKAY CREEK 44.7 0.045 4 0.07 0.09 0.11 0.13 0.13 0.11
ROCK CREEK 38.1 0.07 4 0.14 0.19 0.22 0.25 0.21 0.17
CHICKEN CREEK 15.5 0.07 4 0.10 0.12 0.12 0.12 0.14 0.12
FANNO CREEK 9.3 0.07 4 0.19 0.13 0.14 0.15 0.14 0.13
2002 THREE MONTH STRATIFIED MEAN CHLOROPHYLL a (µg/L)(at required monitoring sites)
RIVER MILE
WQ GUIDANCEMARCH–
MAYAPRIL–JUNE
MAY–JULY
JUNE–AUGUST
JULY–SEPT
AUG–OCT
TUALATIN RIVER
ROOD ROAD 39.1 15 3.7 4.0 3.7 3.2 2.8 2.8
FARMINGTON 33.3 15 4.1 3.8 3.2 2.7 2.0 1.9
SCHOLLS 27.1 15 3.8 4.6 4.7 4.9 3.8 2.9
ELSNER 16.5 15 5.2 9.4 12.3 13.7 9.5 6.1
BOONES FERRY 8.7 15 6.2 16.0 18.0 17.5 8.7 6.2
STAFFORD 5.4 15 7.0 22.3 26.6 29.2 16.0 11.4
TRIBUTARIES
DAIRY CREEK 44.7 15 3.9 5.4 5.1 4.9 2.9 2.2
ROCK CREEK 38.1 15 2.7 2.5 1.5 1.1 1.0 1.2
CHICKEN CREEK 15.5 15 2.7 3.0 2.8 2.2 2.3 1.9
FANNO CREEK 9.3 15 6.0 6.3 5.9 3.4 3.4 3.4
Tributaries are sampled near their confluence with the Tualatin River.River mile indicates where on the Tualatin River a tributary intersects.“Less than” values are used in the calculations at half their value (0.5 times the detection limit).
2002 USGS CONTINUOUS MONITOR (hourly readings at River Mile 3.4)
MAY JUN JUL AUG SEP OCT
DISSOLVED OXYGEN (Percent of days criterion not met)
30-Day floating average of the daily DO mean < 6.5 mg/L 0% 0% 0% 0% 0% 0%
7-Day floating average of the daily minimum DO < 5.0 mg/L 0% 0% 0% 0% 0% 0%
Daily minimum DO < 4.0 mg/l 0% 0% 0% 0% 0% 0%
pH
Percent of time greater than 8.5 0% 0% 0% 0% 0% 0%
Percent of time less than 6.5 0% 0% 0% 0% 0% 0%

28 2002 Tualatin River Flow Managment Report
1988 TMDL POINT SOURCE WASTELOAD ALLOCATIONS & NONPOINT SOURCE LOAD ALLOCATIONS – TOTAL PHOSPHORUS
2002 TREATMENT PLANT 1988 WASTELOAD ALLOCATION (WLA)
SITE INFO STAT. UNITS MAY JUNE JULY AUG SEPT OCT
FARMINGTON FLOW MEAN CFS 322 204 160 128 167 174
FARMINGTON GOAL FLOW MEAN CFS 120 120 120 150 180 180
CWS RELEASE* FROM HAGG LAKE
FLOW MEAN CFS 0 6 11 32 73 72
FLOW TOTAL AC-FT 0 351 655 1964 4364 4407
FLOW YTD AC-FT 0 351 1006 2970 7334 11741
CWS RELEASE** FROM BARNEY RES.
FLOW MEAN CFS 0 0 0 2 14 11
FLOW TOTAL AC-FT 0 0 0 139 861 667
FLOW YTD AC-FT 0 0 0 139 1000 1667
DURHAM EFFLUENT
FLOW MEAN MGD 17.27 16.23 15.90 15.46 15.21 15.39
T-PO4-P MEDIAN mg/L 0.16 0.04 0.04 0.02 0.03 0.02
T-PO4-P WLA lbs. 14.00 13.00 10.00 10.00 10.00 10.00
T-PO4-P MEDIAN lbs. 23.1 5.14 5.18 3.27 3.70 3.29
ROCK CREEK EFFLUENT
FLOW MEAN MGD 27.76 26.19 25.57 24.78 24.94 25.32
T-PO4-P MEDIAN mg/L 0.08 0.06 0.07 0.09 0.03 0.03
T-PO4-P WLA lbs. 40.00 30.00 25.00 22.00 25.00 25.00
T-PO4-P MEDIAN lbs. 17.82 12.62 14.80 18.39 6.97 6.15
Based on daily values. *CWS RELEASE from Hagg Lake for flow augmentation (total volume available from storage is normally 12,618 acre-ft). I November, CWS released an additional 877 acre-ft. Total release for the year was 12,618 acre-ft.**CWS RELEASE from Barney Reservoir for flow augmentation. The maximum volume available from storage for 2002 was 1667 acre-ft. The entire amount was released in 2002.
2002 TRIBUTARY LOADS RELATIVE TO 1988 LOAD ALLOCATIONS (LA)
SITE INFO STAT. UNITS MAY JUNE JULY AUG SEPT OCT
SCOGGINS CREEK
FLOW MEAN CFS 49.3 96.5 141.6 149.5 164.3 115.8
T-PO4-P LA lbs. 5.4 10.8 21.6 21.6 32.3 21.6
T-PO4-P MEDIAN lbs. 8.5 12.1 18.5 20.6 21.8 17.2
GALES CREEK
FLOW MEAN CFS 98.0 35.0 13.2 10.0 9.2 9.2
T-PO4-P LA lbs. 12.1 6.1 2.4 2.4 1.2 1.2
T-PO4-P MEDIAN lbs. 18.5 6.4 2.9 2.4 2.4 1.9
DAIRY CREEK
FLOW MEAN CFS 132.3 67.7 39.9 23.7 24.1 172.2
T-PO4-P LA lbs. 24.2 12.1 6.1 2.4 2.4 24.2
T-PO4-P MEDIAN lbs. 50.8 35.0 23.8 15.4 17.1 28.2
ROCK CREEK
FLOW MEAN CFS 36.6 18.2 16.0 9.8 16.2 24.0
T-PO4-P LA lbs. 9.4 3.8 3.8 1.9 3.8 3.8
T-PO4-P MEDIAN lbs. 28.9 17.1 16.4 12.9 13.0 17.6
FANNO CREEK
FLOW MEAN CFS 22.2 10.7 8.2 6.1 24.8 19.2
T-PO4-P LA lbs. 3.8 3.8 1.9 1.9 3.8 3.8
T-PO4-P MEDIAN lbs. 16.4 7.3 4.6 4.3 3.4 2.9
Based on weekly samples.Below detection limit values are used in the calculations at half their value (0.5 times the detection limit).

2002 Tualatin River Flow Management Report 29
Ammonia TMDLAmmonia TMDLAmmonia TMDLAmmonia TMDLAmmonia treatment at the wastewater treatment plants was upgraded between 1988 and 1994. The Tual-atin Basin currently meets the 1988 ammonia TMDL. Tables on the following pages describe the condi-tions in the Tualatin Basin relative to the ammonia TMDL. All calculations were done as specified in the 1988 TMDL document or the specific water quality standard using data from the CWS monitoring pro-gram, unless otherwise specified.
Status of the Tualatin River relative to 1988 Ammonia TMDLThe status of the Tualatin River relative to the 1988 ammonia TMDL is summarized in the table on page 30. The top section of this table shows the monthly median ammonia for required monitoring sites or sites that have assigned TMDL criteria.
The center section of this table shows the DO levels relative to the criterion of 6.5 mg/L. Grab samples were collected four times a month at all the sites except Farmington (river mile 33.3). Dissolved oxygen is a primary indicator of water quality conditions in terms of aquatic life.
The bottom section of this table shows the results of the continuous monitors, which USGS maintains at Neal’s property (river mile 24.5) and at the Lake Oswego diversion dam (river mile 3.4). Because this data is collected continuously (recorded on an hourly basis), it is a much better representation of the DO levels in the river than a single measurement. The data are reported relative to the three-part DO criteria as shown in the table below.
Incidences of chronic ammonia toxicity are shown in the bottom two rows of the table on page 30. To determine toxicity, the ammonia level, pH, and temperature must be considered together. Ammonia con-centrations are considered detrimental if the four consecutive day average ammonia concentration exceeds chronic ammonia levels.
1988 Ammonia TMDL Wasteload Allocations and Load AllocationsThe TMDL Point Source Waste Load Allocations & Nonpoint Source Load Allocations are summarized on the table on page 31. The first section of this table shows the point source discharges compared to their 1988 WLA. The first section of this table compare the discharges from the two CWS summer-discharging wastewater treatment plants [Rock Creek WWTP (river mile 38.1) and Durham WWTP (river mile 9.3)] to their WLAs. The allowed ammonia load is calculated from the river flow at the Farmington gauge (river mile 33.3) and the treatment plant discharge. The treatment plants met their point source WLAs by releasing significantly fewer pounds of ammonia than are allowed by their WLA. The second section of Table 12 shows the tributary loads compared to the 1988 nonpoint source LAs.
COOL WATER AQUATIC RESOURCES
Criteria Statistic Description
6.5 mg/L 30-Day MeanThe minimum value of the 30-consecutive-day floating mean must not go below 6.5 mg/L. Daily means are calculated and used to determine compliance.
5.0 mg/L 7-Day MinimumThe seven-day floating average of the daily minimum concentration must not fall below 5.0 mg/L.
4.0 mg/L Minimum The minimum recorded concentration must not fall below 4.0 mg/L at any time.

30 2002 Tualatin River Flow Managment Report
STATUS OF THE TUALATIN RIVER: 1988 TMDL — AMMONIA
2002 MONTHLY MEDIAN AMMONIA (mg/L as N) (at compliance or required monitoring sites)
RIVER MILE
TMDLSAMPLES/
MONTHMAY JUNE JULY AUG SEPT OCT
TUALATIN RIVER
CHERRY GROVE 71.5 0.03 4 0.01 0.01 0.01 0.01 0.01 0.01
DILLEY 61.2 0.03 4 0.01 0.01 0.01 0.01 0.01 0.01
GOLF COURSE 52.8 0.04 4 0.01 0.01 0.01 0.01 0.01 0.01
ROOD ROAD 39.1 0.05 4 0.02 0.02 0.01 0.01 0.01 0.01
FARMINGTON 33.3 1.00 1 0.30 0.21 0.09 0.03 0.11 0.02
SCHOLLS 27.1 0.85 4 0.13 0.07 0.02 0.02 0.02 0.01
ELSNER 16.5 0.85 4 0.07 0.01 0.01 0.02 0.03 0.01
BOONES FERRY 8.7 0.85 4 0.03 0.01 0.04 0.04 0.03 0.02
STAFFORD 5.4 0.85 4 0.02 0.01 0.01 0.02 0.02 0.02
TRIBUTARIES
SCOGGINS CREEK 60 0.03 4 0.02 0.01 0.01 0.01 0.01 0.01
GALES CREEK 56.8 0.04 4 0.02 0.02 0.02 0.02 0.01 0.01
DAIRY CREEK 44.7 0.04 4 0.02 0.02 0.03 0.03 0.03 0.01
MCKAY CREEK 44.7 0.04 4 0.02 0.03 0.03 0.03 0.03 0.01
ROCK CREEK 38.1 0.10 4 0.04 0.04 0.04 0.04 0.03 0.01
CHICKEN CREEK 15.5 0.10 4 0.04 0.04 0.04 0.03 0.03 0.03
FANNO CREEK (DHM) 9.3 0.10 4 0.05 0.04 0.04 0.06 0.04 0.02
2002 Percent of days when the Dissolved Oxygen Criteria of 6.5 mg/L was not achieved (*upper 10 feet only)
RIVER MILE
TMDLSAMPLES/
MONTHMAY JUNE JULY AUG SEPT OCT
TUALATIN RIVER
ROOD ROAD 39.1 6.5 4 0% 0% 0% 0% 0% 0%
FARMINGTON 33.3 6.5 1 0% 0% 0% 0% 0% 0%
SCHOLLS* 27.1 6.5 4 0% 0% 0% 0% 0% 0%
ELSNER* 16.5 6.5 4 0% 0% 0% 0% 25% 0%
BOONES FERRY* 8.7 6.5 4 0% 0% 40% 25% 25% 0%
STAFFORD* 5.4 6.5 4 0% 0% 20% 25% 17% 25%
TRIBUTARIES
DAIRY CREEK 44.7 6.5 4 0% 0% 0% 0% 0% 0%
ROCK CREEK 38.1 6.5 4 0% 0% 25% 75% 25% 20%
CHICKEN CREEK 15.5 6.5 4 0% 0% 20% 50% 25% 0%
FANNO CREEK 9.3 6.5 4 0% 0% 20% 75% 0% 0%
Tributaries are sampled near their confluence with the Tualatin River.River mile indicates where on the Tualatin River a tributary intersects.
2001 USGS CONTINUOUS MONITOR (hourly readings)
DISSOLVED OXYGEN mg/L (Percent of days criterion not met) MAY JUNE JULY AUG SEPT OCT
NEAL’S PROPERTY (RIVER MILE 24.5)
30-Day floating average of the daily DO mean < 6.5 mg/L 0% 0% 0% 0% 0% 0%
7-Day floating average of the daily minimum DO < 5.0 mg/L 0% 0% 0% 0% 0% 0%
Daily minimum DO < 4.0 mg/l 0% 0% 0% 0% 0% 0%
LAKE OSWEGO DIVERSION DAM (RIVER MILE 3.4)
30-Day floating average of the daily DO mean < 6.5 mg/L 0% 0% 0% 0% 0% 0%
7-Day floating average of the daily minimum DO < 5.0 mg/L 0% 0% 0% 0% 0% 0%
Daily minimum DO < 4.0 mg/l 0% 0% 0% 0% 0% 0%
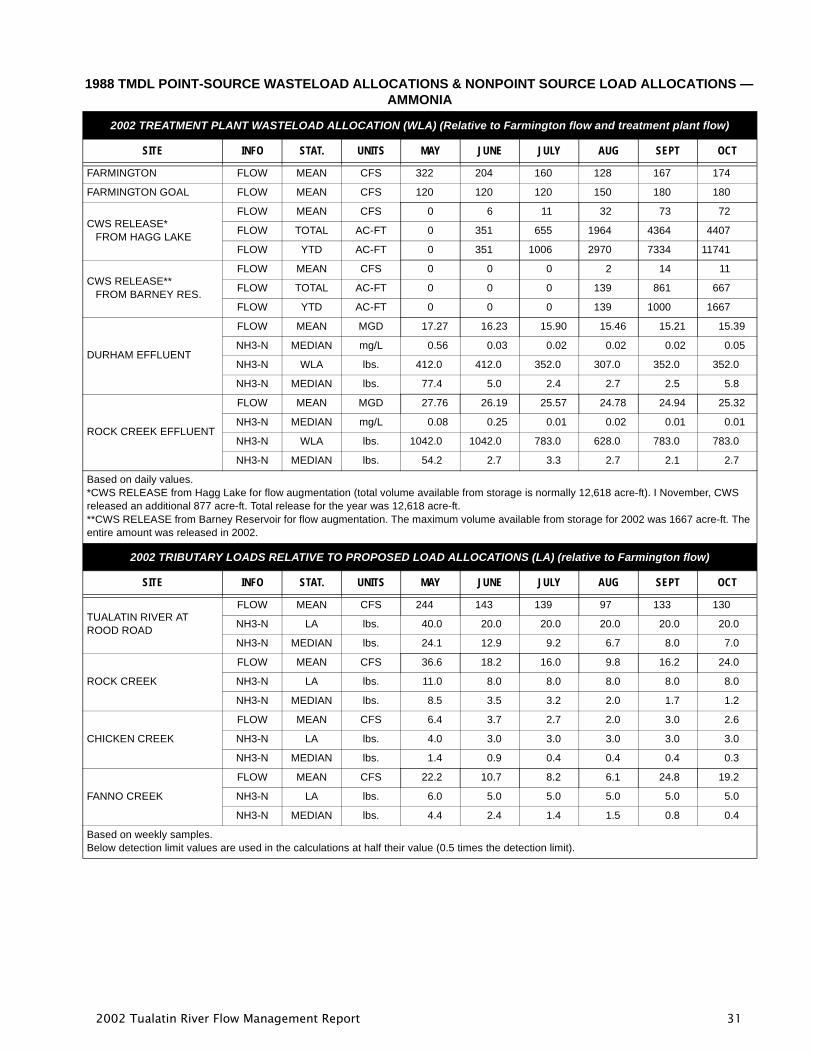
2002 Tualatin River Flow Management Report 31
1988 TMDL POINT-SOURCE WASTELOAD ALLOCATIONS & NONPOINT SOURCE LOAD ALLOCATIONS — AMMONIA
2002 TREATMENT PLANT WASTELOAD ALLOCATION (WLA) (Relative to Farmington flow and treatment plant flow)
SITE INFO STAT. UNITS MAY JUNE JULY AUG SEPT OCT
FARMINGTON FLOW MEAN CFS 322 204 160 128 167 174
FARMINGTON GOAL FLOW MEAN CFS 120 120 120 150 180 180
CWS RELEASE* FROM HAGG LAKE
FLOW MEAN CFS 0 6 11 32 73 72
FLOW TOTAL AC-FT 0 351 655 1964 4364 4407
FLOW YTD AC-FT 0 351 1006 2970 7334 11741
CWS RELEASE** FROM BARNEY RES.
FLOW MEAN CFS 0 0 0 2 14 11
FLOW TOTAL AC-FT 0 0 0 139 861 667
FLOW YTD AC-FT 0 0 0 139 1000 1667
DURHAM EFFLUENT
FLOW MEAN MGD 17.27 16.23 15.90 15.46 15.21 15.39
NH3-N MEDIAN mg/L 0.56 0.03 0.02 0.02 0.02 0.05
NH3-N WLA lbs. 412.0 412.0 352.0 307.0 352.0 352.0
NH3-N MEDIAN lbs. 77.4 5.0 2.4 2.7 2.5 5.8
ROCK CREEK EFFLUENT
FLOW MEAN MGD 27.76 26.19 25.57 24.78 24.94 25.32
NH3-N MEDIAN mg/L 0.08 0.25 0.01 0.02 0.01 0.01
NH3-N WLA lbs. 1042.0 1042.0 783.0 628.0 783.0 783.0
NH3-N MEDIAN lbs. 54.2 2.7 3.3 2.7 2.1 2.7
Based on daily values. *CWS RELEASE from Hagg Lake for flow augmentation (total volume available from storage is normally 12,618 acre-ft). I November, CWS released an additional 877 acre-ft. Total release for the year was 12,618 acre-ft.**CWS RELEASE from Barney Reservoir for flow augmentation. The maximum volume available from storage for 2002 was 1667 acre-ft. The entire amount was released in 2002.
2002 TRIBUTARY LOADS RELATIVE TO PROPOSED LOAD ALLOCATIONS (LA) (relative to Farmington flow)
SITE INFO STAT. UNITS MAY JUNE JULY AUG SEPT OCT
TUALATIN RIVER AT ROOD ROAD
FLOW MEAN CFS 244 143 139 97 133 130
NH3-N LA lbs. 40.0 20.0 20.0 20.0 20.0 20.0
NH3-N MEDIAN lbs. 24.1 12.9 9.2 6.7 8.0 7.0
ROCK CREEK
FLOW MEAN CFS 36.6 18.2 16.0 9.8 16.2 24.0
NH3-N LA lbs. 11.0 8.0 8.0 8.0 8.0 8.0
NH3-N MEDIAN lbs. 8.5 3.5 3.2 2.0 1.7 1.2
CHICKEN CREEK
FLOW MEAN CFS 6.4 3.7 2.7 2.0 3.0 2.6
NH3-N LA lbs. 4.0 3.0 3.0 3.0 3.0 3.0
NH3-N MEDIAN lbs. 1.4 0.9 0.4 0.4 0.4 0.3
FANNO CREEK
FLOW MEAN CFS 22.2 10.7 8.2 6.1 24.8 19.2
NH3-N LA lbs. 6.0 5.0 5.0 5.0 5.0 5.0
NH3-N MEDIAN lbs. 4.4 2.4 1.4 1.5 0.8 0.4
Based on weekly samples.Below detection limit values are used in the calculations at half their value (0.5 times the detection limit).

32 2002 Tualatin River Flow Managment Report
River ResponseRiver ResponseRiver ResponseRiver ResponseThe following three graphs illustrate spatial and temporal trends in water quality. The mean value between May and October was used for each data point. Each graph has the river mile along the Tualatin River on the x-axis going from the upper watershed on the left to the mouth on the right.
The line labelled TMDL is the 1988 TMDL at the river mile indicated. Dramatic reductions in ammonia have occurred since 1988.
19891995199619971998199920002001
50 40 30 20 10 080 70 60
River Mile
Mea
n A
mm
on
ia C
on
cen
trat
ion
(m
g/L
as
N)
May
–Oct
ober
1.2
1.0
0.8
0.6
0.4
0
0.2
TMDL
2002
Tualatin River Ammonia Concentrations

2002 Tualatin River Flow Management Report 33
The line labelled TMDL is the 1988 TMDL at the river mile indicated. Reductions in total phospho-rus that have occurred since 1989 downstream of river mile 40 are mostly due to lower phospho-rus loads coming from the wastewater treatment plants.
0.30
0.25
0.20
0.15
0.10
0
0.05
19891995199619971998199920002001
Mea
n T
ota
l Ph
osp
ho
rus
Co
nce
ntr
atio
n (
mg
/L a
s P
)M
ay–O
ctob
er
50 40 30 20 10 080 70 60
River Mile
TMDL
2002
45
40
35
30
25
20
15
0
10
5
50 40 30 20 10 080 70 60
River Mile
Guidance level
Mea
n (
corr
ecte
d)
Ch
loro
ph
yl-a
Co
nce
ntr
atio
n (
µg/L
)M
ay–O
ctob
er
19891995199619971998199920002001
2002
Tualatin River Phosphorus Concentrations
Tualatin River Chlorophyll-a Concentrations

Appendix AAppendix AAppendix AAppendix A
Hydrographs for Flow Monitoring SitesHydrographs for Flow Monitoring SitesHydrographs for Flow Monitoring SitesHydrographs for Flow Monitoring Sitesand Reservoir Releasesand Reservoir Releasesand Reservoir Releasesand Reservoir Releases

APPENDIX A—Hydrographs for Flow Monitoring SitesA-2 2002 Tualatin River Flow Management Report
FLOW MONITORING SITES — LOCATIONS
North
SCHEMATIC MAPSCHEMATIC MAPSCHEMATIC MAPSCHEMATIC MAPNot to Scale
Fanno Creek
Cr
Cr
Cr
S. Rock
McF
ee C
r
Christensen
Creek
Creek
Rock
Gales
SCHO
TANOSCOO
DLLO
TRTRTRNF
CGIC
TRLF
PVR1 & PVR2
WAPO
PVPP
Scog
Barney Reservoir
Scoggins Reservoir
SHPP
DAIRY
TRJB
ROODRCTV
TRGC
USARC
FRMO
USADH
FANO
LOCL
Lake Oswego
SDMO
WI L L A M
E T T E RI V
ER
TU
AL
R
Sampling and Flow Sites
Withdrawal Points
Wastewater Treatment Plants
Precipitation Monitoring Station
JWCS
LOCS
LOCD
WSLO
TBRC
HFOP
SCOP
JWOP
FGOP
Dairy
Creek
Burris Cr
He Cr
Baker CrChicken
Cedar Cr
Canal
(Hagg Lake)SCO
GASO
Ash C
r
Hedges C
r
Sain Cr
Ta
gins
Car
pe
Dawson Cr
Beav
erto
n Cre
ek
nner Cr
nter
Cr
onat
Lake Oswego
AT
IN
VE
RI
SCHO
Coun
cil
Cr
S. Johns on Cr
Springbrook Cr
Saum Cr
Butternut Cr
CreekMcKay
East
West Fork
Fork
Brons
CedarMill Cr
on Cr
GALES
Creek
SCLO
SECO

APPENDIX A—Hydrographs for Flow Monitoring Sites2002 Tualatin River Flow Management Report A-3
FLOW MONITORING SITES — ALPHABETICAL LISTING BY SITE CODESITE CODE SITE NAME RIVER MILE STATION ID PAGE
CGIC Cherry Grove Intake — Hillsboro 73.3 — A-6DAIRY Dairy Creek at Hwy 8 near Hillsboro, Oregon 2.06 14206200 A-14DLLO Tualatin River near Dilley, Oregon 58.82 14203500 A-12
FANO Fanno Creek at Durham Road 1.2 14206950 A-16FRMO Tualatin River at Farmington, Oregon 33.3 14206500 A-15GALES Gales Creek at Old Hwy 47 near Forest Grove, Oregon 2.36 14204530 A-12
GASO Tualatin River at Gaston 62.3 14202510 A-7JWCS Joint Water Diversion at SHPP Plant 56.1 — A-13LOCD Tualatin River at LOC Dam 3.45 — A-17
LOCL Lake Oswego Corp. Canal Diversion 6.7 — A-16LOCS Tualatin River at LOC Canal 6.7 14206990 A-17PVPP TVID—Patton Valley Pump Plant Diversion — A-12
PVR1 TVID—Patton Valley River Turnout #1 63.13 — A-7PVR2 TVID—Patton Valley River Turnout #2 64.26 — A-7RCTV Rock Creek at Hwy 8 near Hillsboro, Oregon 1.2 14206450 A-15
ROOD Tualatin River at Rood Bridge Road near Hillsboro, Oregon 38.4 14206440 A-14SCHO Sain Creek above Hagg Lake 1.6 14202920 A-8SCLO Scoggins Creek above Henry Hagg Lake near Gaston, Oregon 8.0 14202850 A-8
SCO Scoggins Reservoir — — A-4SCOO Scoggins Creek below Henry Hagg Lake near Gaston, Oregon 4.80 14202980 A-11SHPP TVID–Springhill Pump Plant Diversion 56.1 — A-13
TANO Tanner Creek above Hagg Lake 1.6 14202860 A-9TBRC Barney Reservoir — — A-4TRGC Tualatin River at Golf Course Road near Cornelius, Oregon 51.5 14204800 A-13
TRJB Tualatin River at Hwy 219 Bridge 44.4 14206239 A-14TRLF Tualatin River below Lee Falls 70.7 14202450 A-6
TRNF Barney Release to North Fork Trask River — — A-6TRTR Barney Release to Tualatin River 78.0 — A-5USADH CWS Durham WWTP 9.33 — A-16
USARC CWS Rock Creek WWTP 38.08 — A-15WAPO Wapato Canal Diversion 61.9 — A-8WSLO Tualatin River at West Linn 1.75 14207500 A-17
OTHER — ALPHABETICAL LISTING BY SITE CODESITE CODE SITE NAME PAGE
PrecipitationStations
FGOP Forest Grove Precipitation Station A-18HFOP Haines Falls Precipitation Station A-18
JWOP Joint Water Plant Precipitation Station A-19SCOP Scoggins Reservoir Precipitation Station A-18SDMO Saddle Mountain Precipitation Station A-19
SECO Sain Creek Precipitation Station A-19ScogginsReleases
SCO Other Scoggins Reservoir Other Deliveries A-4SRBV Beaverton Release from Scoggins Reservoir A-10
SRCI Scoggins Reservoir Measured Inflow A-9SRFG Forest Grove Release from Scoggins Reservoir A-10SRHL Hillsboro Release from Scoggins Reservoir A-9
SRLO LOC Release from Scoggins Reservoir A-11SRTV TVID Release from Scoggins Reservoir A-9SRUS CWS Release from Scoggins Reservoir A-10
BarneyReleases
TRWQ CWS/Barney Release for Water Quality A-5TREX Barney Release for Exchange A-5

APPENDIX A—Hydrographs for Flow Monitoring SitesA-4 2002 Tualatin River Flow Management Report
BARNEY RESERVOIR CONTENT(TBRC)
0
5,000
10,000
15,000
20,000
25,000
5/1
5/16
5/31
6/15
6/30
7/15
7/30
8/14
8/29
9/13
9/28
10/1
3
10/2
8
11/1
2
11/2
7
12/1
2
12/2
7
Acr
e F
eet
2001
2002
SCOGGINS RESERVOIR STORAGE CONTENT(SCO)
0
20,000
40,000
60,000
SCOGGINS RESERVOIR OTHER DELIVERIES(SCO Other)
0
1
2
3
4
Source Agency: District 18 Watermaster
25
50
75
100 Percen
t of F
ull P
oo
l
Acr
e F
eet
2001
2002
Source Agency: District 18 Watermaster
37.3
55.9
93.2 Percen
t of F
ull P
oo
l
5/1
5/16
5/31
6/15
6/30
7/15
7/30
8/14
8/29
9/13
9/28
10/1
3
10/2
8
11/1
2
11/2
7
12/1
2
12/2
7
CF
S
2001
2002
Source Agency: District 18 Watermaster
5/1
5/16
5/31
6/15
6/30
7/15
7/30
8/14
8/29
9/13
9/28
10/1
3
10/2
8
11/1
2
11/2
7
12/1
2
12/2
7
74.6
18.6
50,000
30,000
20,000

APPENDIX A—Hydrographs for Flow Monitoring Sites2002 Tualatin River Flow Management Report A-5
BARNEY RELEASE (TOTAL) TO TUALATIN RIVER [RM 78.0](TRTR)
0
20
40
60
80
CWS/BARNEY RELEASE FOR WATER QUALITY(TRWQ)
0
10
20
30
40
BARNEY RELEASE FOR EXCHANGE(TREX)
0.0
0.5
1.0
1.5
2.0
CF
S2001
2002
Source Agency: District 18 Watermaster
CF
S
2001
2002
Source Agency: District 18 Watermaster
5/1
5/16
5/31
6/15
6/30
7/15
7/30
8/14
8/29
9/13
9/28
10/1
3
10/2
8
11/1
2
11/2
7
12/1
2
12/2
7
5/1
5/16
5/31
6/15
6/30
7/15
7/30
8/14
8/29
9/13
9/28
10/1
3
10/2
8
11/1
2
11/2
7
12/1
2
12/2
7
CF
S
2001
2002
Source Agency: District 18 Watermaster
5/1
5/16
5/31
6/15
6/30
7/15
7/30
8/14
8/29
9/13
9/28
10/1
3
10/2
8
11/1
2
11/2
7
12/1
2
12/2
7

APPENDIX A—Hydrographs for Flow Monitoring SitesA-6 2002 Tualatin River Flow Management Report
BARNEY RELEASE TO NORTH FORK TRASK RIVER(TRNF)
0
2
4
6
8
10
CHERRY GROVE INTAKE – HILLSBORO [RM 73.3](CGIC)
0
1
2
3
4
5
TUALATIN RIVER BELOW LEE FALLS [RM 70.7](TRLF — 14202450)
0
20
40
60
80
100
120
140
CF
S2001
2002
Source Agency: District 18 Watermaster
5/1
5/16
5/31
6/15
6/30
7/15
7/30
8/14
8/29
9/13
9/28
10/1
3
10/2
8
11/1
2
11/2
7
12/1
2
12/2
7
CF
S
2001
2002
Source Agency: District 18 Watermaster
5/1
5/16
5/31
6/15
6/30
7/15
7/30
8/14
8/29
9/13
9/28
10/1
3
10/2
8
11/1
2
11/2
7
12/1
2
12/2
7
CF
S
2001
2002
Source Agency: District 18 Watermaster
5/1
5/16
5/31
6/15
6/30
7/15
7/30
8/14
8/29
9/13
9/28
10/1
3
10/2
8
11/1
2
11/2
7
12/1
2
12/2
7

APPENDIX A—Hydrographs for Flow Monitoring Sites2002 Tualatin River Flow Management Report A-7
CF
S2001
2002
Source Agency: District 18 Watermaster
5/1
5/16
5/31
6/15
6/30
7/15
7/30
8/14
8/29
9/13
9/28
10/1
3
10/2
8
11/1
2
11/2
7
12/1
2
12/2
7
TUALATIN RIVER AT GASTON [RM 62.3](GASO — 14202510)
0
50
100
150
200
TVID — PATTON VALLEY RIVER TURNOUT #1 [RM 63.13](PVR1)
0
1
2
3
4
5
TVID — PATTON VALLEY RIVER TURNOUT #2 [RM 64.26](PVR2)
0.0
0.5
1.0
1.5
2.0
2.5
CF
S
2001
2002
Source Agency: District 18 Watermaster
5/1
5/16
5/31
6/15
6/30
7/15
7/30
8/14
8/29
9/13
9/28
10/1
3
10/2
8
11/1
2
11/2
7
12/1
2
12/2
7
CF
S
2001
2002
Source Agency: District 18 Watermaster
5/1
5/16
5/31
6/15
6/30
7/15
7/30
8/14
8/29
9/13
9/28
10/1
3
10/2
8
11/1
2
11/2
7
12/1
2
12/2
7

APPENDIX A—Hydrographs for Flow Monitoring SitesA-8 2002 Tualatin River Flow Management Report
WAPATO CANAL DIVERSION [RM 62.0](WAPO)
0
5
10
15
20
25
30
SCOGGINS CREEK ABOVE HENRY HAGG LAKE NEAR HILLSBORO, OREGON [RM 8.0](SCLO — 14202850)
0
10
20
30
40
50
60
70
80
90
100
SAIN CREEK ABOVE HAGG LAKE [RM 1.6](SCHO — 14202920)
0
5
10
15
20
25
30
CF
S2001
2002
Source Agency: District 18 Watermaster
5/1
5/16
5/31
6/15
6/30
7/15
7/30
8/14
8/29
9/13
9/28
10/1
3
10/2
8
11/1
2
11/2
7
12/1
2
12/2
7
CF
S
2001
2002
Source Agency: District 18 Watermaster
5/1
5/16
5/31
6/15
6/30
7/15
7/30
8/14
8/29
9/13
9/28
10/1
3
10/2
8
11/1
2
11/2
7
12/1
2
12/2
7
CF
S
2001
2002
Source Agency: District 18 Watermaster
5/1
5/16
5/31
6/15
6/30
7/15
7/30
8/14
8/29
9/13
9/28
10/1
3
10/2
8
11/1
2
11/2
7
12/1
2
12/2
7

APPENDIX A—Hydrographs for Flow Monitoring Sites2002 Tualatin River Flow Management Report A-9
TANNER CREEK ABOVE HAGG LAKE [RM 1.6](TANO — 14202860)
0.0
0.5
1.0
1.5
2.0
2.5
3.0
3.5
4.0
SCOGGINS RESERVOIR MEASURED INFLOW(SRCI)
0
15
30
45
60
75
90
105
120
135
150
TVID RELEASE FROM SCOGGINS RESERVOIR(SRTV)
0
25
50
75
100
125
CF
S2001
2002
Source Agency: District 18 Watermaster
5/1
5/16
5/31
6/15
6/30
7/15
7/30
8/14
8/29
9/13
9/28
10/1
3
10/2
8
11/1
2
11/2
7
12/1
2
12/2
7
CF
S
2001
2002
Source Agency: District 18 Watermaster
5/1
5/16
5/31
6/15
6/30
7/15
7/30
8/14
8/29
9/13
9/28
10/1
3
10/2
8
11/1
2
11/2
7
12/1
2
12/2
7
CF
S
2001
2002
Source Agency: District 18 Watermaster
5/1
5/16
5/31
6/15
6/30
7/15
7/30
8/14
8/29
9/13
9/28
10/1
3
10/2
8
11/1
2
11/2
7
12/1
2
12/2
7

APPENDIX A—Hydrographs for Flow Monitoring SitesA-10 2002 Tualatin River Flow Management Report
CWS RELEASE FROM SCOGGINS RESERVOIR(SRUS)
0
20
40
60
80
100
BEAVERTON RELEASE FROM SCOGGINS RESERVOIR(SRBV)
0
5
10
15
20
25
FOREST GROVE RELEASE FROM SCOGGINS RESERVOIR(SRFG)
0
2
4
6
8
10
12
14
16
CF
S2001
2002
5/1
5/16
5/31
6/15
6/30
7/15
7/30
8/14
8/29
9/13
9/28
10/1
3
10/2
8
11/1
2
11/2
7
12/1
2
12/2
7
CF
S
2001
2002
Source Agency: District 18 Watermaster
5/1
5/16
5/31
6/15
6/30
7/15
7/30
8/14
8/29
9/13
9/28
10/1
3
10/2
8
11/1
2
11/2
7
12/1
2
12/2
7
CF
S
2001
2002
Source Agency: District 18 Watermaster
5/1
5/16
5/31
6/15
6/30
7/15
7/30
8/14
8/29
9/13
9/28
10/1
3
10/2
8
11/1
2
11/2
7
12/1
2
12/2
7
Source Agency: District 18 Watermaster

APPENDIX A—Hydrographs for Flow Monitoring Sites2002 Tualatin River Flow Management Report A-11
HILLSBORO RELEASE FROM SCOGGINS RESERVOIR(SRHL)
0
10
20
30
LOC RELEASE FROM SCOGGINS RESERVOIR(SRLO)
0
1
2
6
7
SCOGGINS CREEK BELOW HENRY HAGG LAKE NEAR GASTON, OREGON [RM 4.8](SCOO – 14202980)
0
50
100
150
200
250
CF
S2001
2002
Source Agency: District 18 Watermaster
5/1
5/16
5/31
6/15
6/30
7/15
7/30
8/14
8/29
9/13
9/28
10/1
3
10/2
8
11/1
2
11/2
7
12/1
2
12/2
7
CF
S
2001
2002
Source Agency: District 18 Watermaster
5/1
5/16
5/31
6/15
6/30
7/15
7/30
8/14
8/29
9/13
9/28
10/1
3
10/2
8
11/1
2
11/2
7
12/1
2
12/2
7
CF
S
2001
2002
Source Agency: District 18 Watermaster
5/1
5/16
5/31
6/15
6/30
7/15
7/30
8/14
8/29
9/13
9/28
10/1
3
10/2
8
11/1
2
11/2
7
12/1
2
12/2
7
5
4
3

APPENDIX A—Hydrographs for Flow Monitoring SitesA-12 2002 Tualatin River Flow Management Report
TVID — PATTON VALLEY PUMP PLANT DIVERSION(PVPP)
0
1
2
3
4
5
TUALATIN RIVER NEAR DILLEY, OREGON [RM 58.82](DLLO — 14203500)
0
50
100
150
200
250
300
350
GALES CREEK ON OLD HWY 47 BRIDGE NEAR FOREST GROVE, OREGON [RM 2.36](GALES — 14204530)
0
30
60
90
120
150
180
CF
S2001
2002
Source Agency: District 18 Watermaster
5/1
5/16
5/31
6/15
6/30
7/15
7/30
8/14
8/29
9/13
9/28
10/1
3
10/2
8
11/1
2
11/2
7
12/1
2
12/2
7
CF
S
2001
2002
Source Agency: District 18 Watermaster
5/1
5/16
5/31
6/15
6/30
7/15
7/30
8/14
8/29
9/13
9/28
10/1
3
10/2
8
11/1
2
11/2
7
12/1
2
12/2
7
CF
S
2001
2002
Source Agency: District 18 Watermaster
5/1
5/16
5/31
6/15
6/30
7/15
7/30
8/14
8/29
9/13
9/28
10/1
3
10/2
8
11/1
2
11/2
7
12/1
2
12/2
7

APPENDIX A—Hydrographs for Flow Monitoring Sites2002 Tualatin River Flow Management Report A-13
CF
S2001
2002
Source Agency: District 18 Watermaster
5/1
5/16
5/31
6/15
6/30
7/15
7/30
8/14
8/29
9/13
9/28
10/1
3
10/2
8
11/1
2
11/2
7
12/1
2
12/2
7
TVID — SPRINGHILL PUMP PLANT DIVERSION [RM 56.1](SHPP)
0
20
40
60
80
JOINT WATER DIVERSION AT SHPP PLANT [RM 56.1](JWCS)
0
10
20
30
40
70
TUALATIN RIVER AT GOLF COURSE ROAD NEAR CORNELIUS, OREGON [RM 51.5](TRGC — 14204800)
0
75
150
225
300
375
450
CF
S
2001
2002
Source Agency: District 18 Watermaster
5/1
5/16
5/31
6/15
6/30
7/15
7/30
8/14
8/29
9/13
9/28
10/1
3
10/2
8
11/1
2
11/2
7
12/1
2
12/2
7
CF
S
2001
2002
Source Agency: District 18 Watermaster
5/1
5/16
5/31
6/15
6/30
7/15
7/30
8/14
8/29
9/13
9/28
10/1
3
10/2
8
11/1
2
11/2
7
12/1
2
12/2
7
50
60

APPENDIX A—Hydrographs for Flow Monitoring SitesA-14 2002 Tualatin River Flow Management Report
CF
S2001
2002
Source Agency: District 18 Watermaster
5/1
5/16
5/31
6/15
6/30
7/15
7/30
8/14
8/29
9/13
9/28
10/1
3
10/2
8
11/1
2
11/2
7
12/1
2
12/2
7
DAIRY CREEK AT HWY 8 NEAR HILLSBORO, OREGON [RM 2.06](DAIRY — 14206200)
0
50
100
150
TUALATIN RIVER AT HWY 219 BRIDGE [RM 44.4](TRJB — 14206239)
0
200
400
500
TUALATIN RIVER AT ROOD BRIDGE ROAD NEAR HILLSBORO, OREGON [RM 38.4](ROOD — 14206440)
0
100
200
300
400
CF
S
2001
2002
Source Agency: District 18 Watermaster
5/1
5/16
5/31
6/15
6/30
7/15
7/30
8/14
8/29
9/13
9/28
10/1
3
10/2
8
11/1
2
11/2
7
12/1
2
12/2
7
CF
S
2001
2002
Source Agency: District 18 Watermaster
5/1
5/16
5/31
6/15
6/30
7/15
7/30
8/14
8/29
9/13
9/28
10/1
3
10/2
8
11/1
2
11/2
7
12/1
2
12/2
7
100

APPENDIX A—Hydrographs for Flow Monitoring Sites2002 Tualatin River Flow Management Report A-15
CF
S2001
2002
Source Agency: District 18 Watermaster
5/1
5/16
5/31
6/15
6/30
7/15
7/30
8/14
8/29
9/13
9/28
10/1
3
10/2
8
11/1
2
11/2
7
12/1
2
12/2
7
ROCK CREEK AT HWY 8 NEAR HILLSBORO, OREGON [RM 1.2](RCTV — 14206450)
0
50
100
150
CWS ROCK CREEK WWTP DISCHARGE [RM 38.08 Tualatin R](USARC)
0
10
40
50
60
TUALATIN RIVER AT FARMINGTON RD BRIDGE [RM 33.3](FRMO – 14206500)
0
200
400
600
CF
S
2001
2002
Source Agency: District 18 Watermaster
5/1
5/16
5/31
6/15
6/30
7/15
7/30
8/14
8/29
9/13
9/28
10/1
3
10/2
8
11/1
2
11/2
7
12/1
2
12/2
7
CF
S
2001
2002
Source Agency: District 18 Watermaster
5/1
5/16
5/31
6/15
6/30
7/15
7/30
8/14
8/29
9/13
9/28
10/1
3
10/2
8
11/1
2
11/2
7
12/1
2
12/2
7
20
30
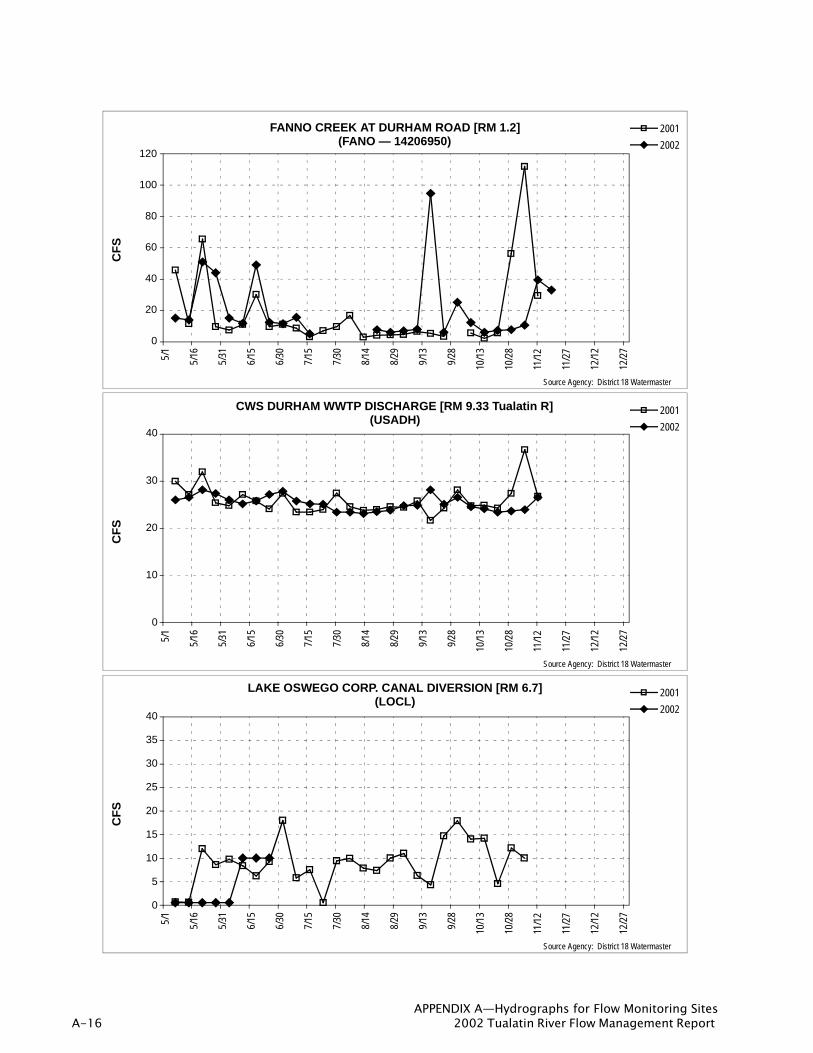
APPENDIX A—Hydrographs for Flow Monitoring SitesA-16 2002 Tualatin River Flow Management Report
CF
S2001
2002
Source Agency: District 18 Watermaster
5/1
5/16
5/31
6/15
6/30
7/15
7/30
8/14
8/29
9/13
9/28
10/1
3
10/2
8
11/1
2
11/2
7
12/1
2
12/2
7
FANNO CREEK AT DURHAM ROAD [RM 1.2](FANO — 14206950)
0
20
40
60
120
CWS DURHAM WWTP DISCHARGE [RM 9.33 Tualatin R](USADH)
0
20
30
40
LAKE OSWEGO CORP. CANAL DIVERSION [RM 6.7](LOCL)
CF
S
2001
2002
Source Agency: District 18 Watermaster
5/1
5/16
5/31
6/15
6/30
7/15
7/30
8/14
8/29
9/13
9/28
10/1
3
10/2
8
11/1
2
11/2
7
12/1
2
12/2
7
CF
S
2001
2002
Source Agency: District 18 Watermaster
5/1
5/16
5/31
6/15
6/30
7/15
7/30
8/14
8/29
9/13
9/28
10/1
3
10/2
8
11/1
2
11/2
7
12/1
2
12/2
7
10
100
80
0
10
30
35
40
20
25
5
15

APPENDIX A—Hydrographs for Flow Monitoring Sites2002 Tualatin River Flow Management Report A-17
Gag
e H
eig
ht
2001
2002
Source Agency: District 18 Watermaster
5/1
5/16
5/31
6/15
6/30
7/15
7/30
8/14
8/29
9/13
9/28
10/1
3
10/2
8
11/1
2
11/2
7
12/1
2
12/2
7
TUALATIN RIVER AT LOC CANAL [RM 6.7](LOCS — 14206990)
97.0
98.0
99.0
100.0
103.0
TUALATIN RIVER AT LOC DAM [RM 3.45](LOCD)
0
0.5
1.0
1.5
2.0
TUALATIN RIVER AT WEST LINN [RM 1.75](WSLO — 14207500)
Gag
e H
eig
ht
2001
2002
Source Agency: District 18 Watermaster
5/1
5/16
5/31
6/15
6/30
7/15
7/30
8/14
8/29
9/13
9/28
10/1
3
10/2
8
11/1
2
11/2
7
12/1
2
12/2
7
CF
S
2001
2002
Source Agency: District 18 Watermaster
5/1
5/16
5/31
6/15
6/30
7/15
7/30
8/14
8/29
9/13
9/28
10/1
3
10/2
8
11/1
2
11/2
7
12/1
2
12/2
7
102.0
101.0
0
800
1000
1200
400
600
200
afte
r Ju
ne 1
8, 2
002
Dat
a no
t rep
orte
d

APPENDIX A—Hydrographs for Flow Monitoring SitesA-18 2002 Tualatin River Flow Management Report
Inch
es2001
2002
Source Agency: District 18 Watermaster
5/1
5/16
5/31
6/15
6/30
7/15
7/30
8/14
8/29
9/13
9/28
10/1
3
10/2
8
11/1
2
11/2
7
12/1
2
12/2
7
SCOGGINS RESERVOIR STATION (SCOP)PREVIOUS 7 DAYS ACCUMULATED PRECIPITATION
0.0
0.5
1.0
2.0
3.5
FOREST GROVE STATION (FGOP)PREVIOUS 7 DAYS ACCUMULATED PRECIPITATION
HAINES FALLS STATION (HFOP)PREVIOUS 7 DAYS ACCUMULATED PRECIPITATION
Inch
es
2001
2002
Source Agency: District 18 Watermaster
5/1
5/16
5/31
6/15
6/30
7/15
7/30
8/14
8/29
9/13
9/28
10/1
3
10/2
8
11/1
2
11/2
7
12/1
2
12/2
7
Inch
es
2001
2002
Source Agency: District 18 Watermaster
5/1
5/16
5/31
6/15
6/30
7/15
7/30
8/14
8/29
9/13
9/28
10/1
3
10/2
8
11/1
2
11/2
7
12/1
2
12/2
7
3.0
1.5
2.5
0.0
0.5
1.0
2.0
2.5
1.5
2.5
0.0
0.5
1.0
2.0
4.5
4.0
3.0
1.5
2.5
3.5

APPENDIX A—Hydrographs for Flow Monitoring Sites2002 Tualatin River Flow Management Report A-19
Inch
es2001
2002
Source Agency: District 18 Watermaster
5/1
5/16
5/31
6/15
6/30
7/15
7/30
8/14
8/29
9/13
9/28
10/1
3
10/2
8
11/1
2
11/2
7
12/1
2
12/2
7
JOINT WATER PLANT STATION (JWOP)PREVIOUS 7 DAYS ACCUMULATED PRECIPITATION
0.0
0.5
1.0
2.0
2.5
SAIN CREEK STATION (SECO)PREVIOUS 7 DAYS ACCUMULATED PRECIPITATION
SADDLE MOUNTAIN STATION (SDMO)PREVIOUS 7 DAYS ACCUMULATED PRECIPITATION
Inch
es
2001
2002
Source Agency: District 18 Watermaster
5/1
5/16
5/31
6/15
6/30
7/15
7/30
8/14
8/29
9/13
9/28
10/1
3
10/2
8
11/1
2
11/2
7
12/1
2
12/2
7
Inch
es
2001
2002
Source Agency: District 18 Watermaster
5/1
5/16
5/31
6/15
6/30
7/15
7/30
8/14
8/29
9/13
9/28
10/1
3
10/2
8
11/1
2
11/2
7
12/1
2
12/2
7
1.5
0
0.5
3.0
1.5
1.0
2.5
2.0
0
0.5
3.0
1.5
1.0
2.5
2.0

Appendix BAppendix BAppendix BAppendix B
Data Tables & HydrographsData Tables & HydrographsData Tables & HydrographsData Tables & Hydrographsfor Natural Flow Determinationfor Natural Flow Determinationfor Natural Flow Determinationfor Natural Flow Determination

APPENDIX B—Data Tables & Hydrographs for Natural Flow DeterminationB-2 2002 Tualatin River Flow Management Report
NATURAL FLOW SITES — LOCATIONS
Fanno Creek
Cr
Cr
Cr
S. Rock
McF
ee C
r
Christensen
Creek
Creek
Rock
Gales
Creek
SCHO
DLLO
TRLF
Scog
Barney Reservoir
Scoggins Reservoir
TRJB
ROOD
TRGC
FRMO
Lake Oswego
WI L L A M
E T T E RI V
ER
TU
AL
R
Sampling and Flow Sites
Withdrawal Points
Wastewater Treatment Plants
WSLO
Dairy
Creek
Burris Cr
He Cr
Baker CrChicken
Cedar Cr
Canal
(Hagg Lake)
Ash C
r
Hedges C
r
Sain Cr
Ta
gins
Car
pe
Dawson Cr
Beav
erto
n Cre
ek
nner Cr
nter
Cr
onat
Lake Oswego
AT
IN
VE
RI
Coun
sil
Cr
S. Johns on Cr
Saum Cr
GASO
Springbrook Cr
Butternut Cr
CreekMcKay
East
West Fork
Fork
Brons
CedarMill Cr
on Cr
North
SCHEMATIC MAPSCHEMATIC MAPSCHEMATIC MAPSCHEMATIC MAPNot to Scale

APPENDIX B—Data Tables & Hydrographs for Natural Flow Determination2002 Tualatin River Flow Management Report B-3
NATURAL FLOW SITES — ALPHABETICAL LISTING BY SITE CODE
SITE CODE SITE NAME RIVER MILE STATION ID PAGE
DLLO Tualatin River at Dilley 58.82 14203500 B-6
FRMO Tualatin River at Farmington Rd Bridge 33.3 14206500 B-10
GASO Tualatin River at Gaston 62.3 14202510 B-5
ROOD Tualatin River at Rood Bridge 38.4 14206440 B-9
TRGC Tualatin River at Golf Course Road 51.5 14204800 B-7
TRJB Tualatin River at Hwy 219 Bridge 44.4 14206239 B-8
TRLF Tualatin River below Lee Falls 70.5 14202450 B-4
WSLO Tualatin River at West Linn 1.75 14207500 B-11

APPENDIX B—Data Tables & Hydrographs for Natural Flow DeterminationB-4 2002 Tualatin River Flow Management Report
NFTRLF – 14202450 – NATURAL FLOW AT TUALATIN RIVER BELOW LEE FALLS [RM 70.5]
Abbreviations: NFTRLF=Natural Flow at Tualatin River below Lee Falls; TRLF=Tualatin River Flow at Lee Falls; TRTR=Barney Release to Tualatin River.Calculations: NFTRLF=TRLF–STORAGE; STORAGE=TRTR-LOSS
DATE2002 Daily Mean Discharge in Cubic Feet per Second
NFTRLF TRLF STORAGE TRTR LOSS (2%)7-May 59.90 59.90 0.00 0.00 0.0014-May 42.00 42.00 0.00 0.00 0.0021-May 35.30 35.30 0.00 0.00 0.0028-May 32.60 32.60 0.00 0.00 0.004-Jun 24.90 24.90 0.00 0.00 0.0011-Jun 28.36 46.00 17.64 18.00 0.3618-Jun 24.48 48.00 23.52 24.00 0.4825-Jun 25.48 49.00 23.52 24.00 0.482-Jul 27.58 51.10 23.52 24.00 0.489-Jul 23.48 47.00 23.52 24.00 0.4816-Jul 19.12 54.40 35.28 36.00 0.7223-Jul 19.12 54.40 35.28 36.00 0.7230-Jul 18.02 53.30 35.28 36.00 0.726-Aug 21.04 62.20 41.16 42.00 0.8413-Aug 12.14 53.30 41.16 42.00 0.8420-Aug 12.86 59.90 47.04 48.00 0.9627-Aug 17.46 64.50 47.04 48.00 0.963-Sep 6.26 53.30 47.04 48.00 0.9610-Sep 21.18 74.10 52.92 54.00 1.0817-Sep 18.68 71.60 52.92 54.00 1.0824-Sep 11.58 64.50 52.92 54.00 1.081-Oct 11.58 64.50 52.92 54.00 1.088-Oct 11.58 64.50 52.92 54.00 1.0815-Oct 9.78 48.00 38.22 39.00 0.7822-Oct 8.78 47.00 38.22 39.00 0.7829-Oct -1.30 23.20 24.50 25.00 0.505-Nov 1.20 25.70 24.50 25.00 0.5012-Nov -24.50 0.00 24.50 25.00 0.5019-Nov 18.70 18.70 0.00 0.00 0.00
CF
S
Source Agency: District 18 Watermaster
5/1
5/16
5/31
6/15
6/30
7/15
7/30
8/14
8/29
9/13
9/28
10/1
3
10/2
8
11/1
2
11/2
7
12/1
2
NATURAL FLOW TUALATIN RIVER BELOW LEE FALLS [RM 70.5](NFTRLF — 14202450)
0
20
40
60
140
100
80
Measured
Natural
Storage
120

APPENDIX B—Data Tables & Hydrographs for Natural Flow Determination2002 Tualatin River Flow Management Report B-5
NFGASO – 14202510 – NATURAL FLOW AT TUALATIN RIVER AT GASTON [RM 62.3]
Abbreviations: NFGSTO=Natural Flow at Tualatin River at Gaston; GSTO=Tualatin River Flow atGaston; TRTR=Barney Release to Tualatin River; PVR2=TVID–Patton River Turnout DiversionCalculations: NFGASO=GASO–STORAGE; STORAGE=TRTR+PVR2-LOSS
DATE2002 Daily Mean Discharge in Cubic Feet per Second
NFGASO GASO STORAGE TRTR PVR2 LOSS (3%)7-May 77.00 77.00 0.00 0.00 0.00 0.0014-May 58.00 58.00 0.00 0.00 0.00 0.0021-May 48.00 48.00 0.00 0.00 0.00 0.0028-May 51.00 51.00 0.00 0.00 0.00 0.004-Jun 35.00 35.00 0.00 0.00 0.00 0.0011-Jun 27.54 45.00 17.46 18.00 0.00 0.5418-Jun 36.72 60.00 23.28 24.00 0.00 0.7225-Jun 19.72 43.00 23.28 24.00 0.00 0.722-Jul 23.72 47.00 23.28 24.00 0.00 0.729-Jul 16.72 40.00 23.28 24.00 0.00 0.7216-Jul 11.08 46.00 34.92 36.00 0.00 1.0823-Jul 9.08 44.00 34.92 36.00 0.00 1.0830-Jul -3.92 31.00 34.92 36.00 0.00 1.086-Aug 6.26 47.00 40.74 42.00 0.00 1.2613-Aug 6.26 47.00 40.74 42.00 0.00 1.2620-Aug 2.44 49.00 46.56 48.00 0.00 1.4427-Aug -0.56 46.00 46.56 48.00 0.00 1.443-Sep -2.56 44.00 46.56 48.00 0.00 1.4410-Sep -0.38 52.00 52.38 54.00 0.00 1.6217-Sep 3.62 56.00 52.38 54.00 0.00 1.6224-Sep -2.38 50.00 52.38 54.00 0.00 1.621-Oct 2.62 55.00 52.38 54.00 0.00 1.628-Oct 1.62 54.00 52.38 54.00 0.00 1.6215-Oct 4.17 42.00 37.83 39.00 0.00 1.1722-Oct 3.17 41.00 37.83 39.00 0.00 1.1729-Oct 3.75 28.00 24.25 25.00 0.00 0.755-Nov 1.75 26.00 24.25 25.00 0.00 0.7512-Nov 27.75 52.00 24.25 25.00 0.00 0.75
NATURAL FLOW AT TUALATIN RIVER GASTON [RM 62.3](NFGASO – 14202510)
0
100
CF
S
Source Agency: District 18 Watermaster
50
75
25
Measured
Natural
Storage
5/1
5/16
5/31
6/15
6/30
7/15
7/30
8/14
8/29
9/13
9/28
10/1
3
10/2
8
11/1
2
11/2
7
12/1
2

APPENDIX B—Data Tables & Hydrographs for Natural Flow DeterminationB-6 2002 Tualatin River Flow Management Report
DLLO – 14203500 – NATURAL FLOW AT TUALATIN RIVER AT DILLEY [RM 58.82]
Abbreviations: NFDLLO=Natural Flow at Tualatin River at Dilley; DLLO=Tualatin River Flow at Dilley; TRTR=Barney Release to Tualatin River; SRUS, SRTV, SRHL, SRFG, SRLO and SRBV= Releases from Scoggins Reservoir for CWS, TVID, Hillsboro, Forest Grove, LOC and Beaverton, respectivelyCalculations: NFDLLO=DLLO–STORAGE; STORAGE=TRTR+SRUS+(0.95*SRTV)+SRHL+SRFG+SRLO+SRBV+Other-LOSS
DATE2002 Daily Mean Discharge in Cubic Feet per Second
NFDLLO DLLO STORAGE TRTR SRUS SRTV SRHL SRFG SRLO SRBV Other LOSS (1.0%)7-May 161.02 163.00 1.98 0.00 0.00 0.00 0.00 0.00 0.00 0.00 2.00 0.0214-May 142.02 144.00 1.98 0.00 0.00 0.00 0.00 0.00 0.00 0.00 2.00 0.0221-May 112.02 114.00 1.98 0.00 0.00 0.00 0.00 0.00 0.00 0.00 2.00 0.0228-May 109.02 111.00 1.98 0.00 0.00 0.00 0.00 0.00 0.00 0.00 2.00 0.024-Jun 86.40 136.00 49.60 0.00 0.00 18.00 15.00 2.00 0.00 14.00 2.00 0.5011-Jun 60.21 116.00 55.79 18.00 0.00 13.00 4.00 2.00 0.00 18.00 2.00 0.5618-Jun 79.30 178.00 98.70 24.00 0.00 46.00 12.00 2.00 0.00 16.00 2.00 1.0025-Jun 69.14 202.00 132.86 24.00 0.00 76.00 13.00 5.00 0.00 17.00 3.00 1.342-Jul 56.75 176.00 119.25 24.00 0.00 71.00 5.00 5.00 0.00 16.00 3.00 1.209-Jul 34.43 166.00 131.57 24.00 0.00 82.00 11.00 2.00 0.00 15.00 3.00 1.3316-Jul 19.85 173.00 153.15 36.00 10.00 86.00 2.00 5.00 0.00 17.00 3.00 1.5523-Jul 16.09 208.00 191.91 36.00 20.00 103.00 25.00 8.00 0.00 4.00 3.00 1.9430-Jul 9.06 178.00 168.94 36.00 20.00 87.00 22.00 6.00 0.00 1.00 3.00 1.716-Aug 6.69 169.00 162.31 42.00 15.00 81.00 0.00 4.00 5.00 18.00 3.00 1.6413-Aug -14.78 180.00 194.78 42.00 20.00 105.00 3.00 6.00 0.00 23.00 3.00 1.9720-Aug -7.05 196.00 203.05 48.00 40.00 98.00 15.00 6.00 0.00 0.00 3.00 2.0527-Aug -127.27 202.00 329.27 48.00 165.00 88.00 22.00 6.00 0.00 5.00 3.00 3.333-Sep -2.32 223.00 225.32 48.00 60.00 88.00 8.00 7.00 0.00 18.00 3.00 2.2810-Sep 110.53 326.00 215.47 54.00 80.00 67.00 0.00 5.00 0.00 12.00 3.00 2.1817-Sep 22.12 212.00 189.88 54.00 70.00 44.00 0.00 5.00 6.00 12.00 3.00 1.9224-Sep 4.82 195.00 190.18 54.00 80.00 38.00 13.00 1.00 6.00 0.00 2.00 1.921-Oct 26.61 132.00 105.39 54.00 0.00 31.00 12.00 3.00 6.00 0.00 2.00 1.068-Oct 16.16 176.00 159.84 54.00 80.00 11.00 0.00 3.00 6.00 7.00 1.00 1.6115-Oct 24.82 190.00 165.18 39.00 80.00 23.00 9.00 5.00 0.00 11.00 1.00 1.6722-Oct 30.94 198.00 167.06 39.00 80.00 25.00 12.00 4.00 0.00 9.00 1.00 1.6929-Oct 32.20 176.00 143.80 25.00 80.00 15.00 11.00 4.00 0.00 10.00 1.00 1.455-Nov 35.44 138.00 102.56 25.00 50.00 8.00 6.00 4.00 0.00 10.00 1.00 1.0412-Nov 73.79 107.00 33.21 25.00 0.00 9.00 0.00 0.00 0.00 0.00 0.00 0.34
NATURAL FLOW AT TUALATIN RIVER AT DILLEY [RM 58.82](NFDLLO — 14203500)
CF
S
Source Agency: District 18 Watermaster
0
240
300
360
120
180
60
Measured
Natural
Storage
5/1
5/16
5/31
6/15
6/30
7/15
7/30
8/14
8/29
9/13
9/28
10/1
3
10/2
8
11/1
2
11/2
7
12/1
2

APPENDIX B—Data Tables & Hydrographs for Natural Flow Determination2002 Tualatin River Flow Management Report B-7
NFTRGC – 14204800 – NATURAL FLOW AT TUALATIN RIVER AT GOLF COURSE ROAD [RM 51.5]
Abbreviations: NFTRGC=Natural Flow at Tualatin River at Golf Course Road; TRGC=Tualatin River Flow at Golf Course Rd; SRUS, SRTV, and, SRLO= Releases from Scoggins Reservoir for CWS, TVID and LOC, respectivelyCalculations: NFTRGC=TRGC–STORAGE; STORAGE=SRUS+(0.16*SRTV)+SRLO-LOSS
DATE2002 Daily Mean Discharge in Cubic Feet per Second
NFTRGC TRGC STORAGE SRUS SRTV SRLO LOSS (3.4%)7-May 229.00 229.00 0.00 0.00 0.00 0.00 0.0014-May 172.00 172.00 0.00 0.00 0.00 0.00 0.0021-May 150.00 150.00 0.00 0.00 0.00 0.00 0.0028-May 97.00 97.00 0.00 0.00 0.00 0.00 0.004-Jun 90.22 93.00 2.78 0.00 18.00 0.00 0.1011-Jun 79.99 82.00 2.01 0.00 13.00 0.00 0.0718-Jun 128.89 136.00 7.11 0.00 46.00 0.00 0.2525-Jun 92.25 104.00 11.75 0.00 76.00 0.00 0.412-Jul 103.03 114.00 10.97 0.00 71.00 0.00 0.399-Jul 84.33 97.00 12.67 0.00 82.00 0.00 0.4516-Jul 52.05 75.00 22.95 10.00 86.00 0.00 0.8123-Jul 56.76 92.00 35.24 20.00 103.00 0.00 1.2430-Jul 32.23 65.00 32.77 20.00 87.00 0.00 1.156-Aug 41.16 73.00 31.84 15.00 81.00 5.00 1.1213-Aug 16.45 52.00 35.55 20.00 105.00 0.00 1.2520-Aug 25.21 79.00 53.79 40.00 98.00 0.00 1.8927-Aug -78.99 94.00 172.99 165.00 88.00 0.00 6.093-Sep 68.44 140.00 71.56 60.00 88.00 0.00 2.5210-Sep 49.36 137.00 87.64 80.00 67.00 0.00 3.0817-Sep 74.78 155.00 80.22 70.00 44.00 6.00 2.8224-Sep 21.05 110.00 88.95 80.00 38.00 6.00 3.131-Oct 74.41 85.00 10.59 0.00 31.00 6.00 0.378-Oct 35.22 120.00 84.78 80.00 11.00 6.00 2.9815-Oct 52.17 133.00 80.83 80.00 23.00 0.00 2.8522-Oct 84.86 166.00 81.14 80.00 25.00 0.00 2.8629-Oct 52.40 132.00 79.60 80.00 15.00 0.00 2.805-Nov 48.46 98.00 49.54 50.00 8.00 0.00 1.7412-Nov 138.61 140.00 1.39 0.00 9.00 0.00 0.05
CF
S
Source Agency: District 18 Watermaster
5/1
5/16
5/31
6/15
6/30
7/15
7/30
8/14
8/29
9/13
9/28
10/1
3
10/2
8
11/1
2
11/2
7
12/1
2
NATURAL FLOW AT TUALATIN RIVER AT GOLF COURSE ROAD [RM 51.5](NFTRGC — 14204800)
0
50
100
250
Measured
Natural
Storage
150
200

APPENDIX B—Data Tables & Hydrographs for Natural Flow DeterminationB-8 2002 Tualatin River Flow Management Report
NFTRJB – 14206239 – NATURAL FLOW AT TUALATIN RIVER AT HWY 219 BRIDGE [RM 44.4]
Abbreviations: NFTRJB=Natural Flow at Tualatin River at Hwy 219 Bridge; TRJB=Tualatin River Flow at Hwy 219 Bridge; SRUS, SRTV, and, SRLO= Releases from Scoggins Reservoir for CWS, TVID and LOC, respectivelyCalculations: NFTRJB=TRJB–STORAGE; STORAGE=SRUS+(0.11*SRTV)+SRLO-LOSS
DATE2001 Daily Mean Discharge in Cubic Feet per Second
NFTRJB TRJB STORAGE SRUS SRTV SRLO LOSS (5.2%)7-May 390.00 390.00 0.00 0.00 0.00 0.00 0.0014-May 267.00 267.00 0.00 0.00 0.00 0.00 0.0021-May 273.00 273.00 0.00 0.00 0.00 0.00 0.0028-May 165.00 165.00 0.00 0.00 0.00 0.00 0.004-Jun 131.12 133.00 1.88 0.00 18.00 0.00 0.1011-Jun 142.64 144.00 1.36 0.00 13.00 0.00 0.0718-Jun -4.80 0.00 4.80 0.00 46.00 0.00 0.2625-Jun 108.07 116.00 7.93 0.00 76.00 0.00 0.432-Jul 184.60 192.00 7.40 0.00 71.00 0.00 0.419-Jul 159.45 168.00 8.55 0.00 82.00 0.00 0.4716-Jul 73.25 91.70 18.45 10.00 86.00 0.00 1.0123-Jul 54.60 84.30 29.70 20.00 103.00 0.00 1.6330-Jul -28.03 0.00 28.03 20.00 87.00 0.00 1.546-Aug 59.49 86.90 27.41 15.00 81.00 5.00 1.5013-Aug -29.91 0.00 29.91 20.00 105.00 0.00 1.6420-Aug 43.56 91.70 48.14 40.00 98.00 0.00 2.6427-Aug -67.40 98.20 165.60 165.00 88.00 0.00 9.083-Sep 85.94 152.00 66.06 60.00 88.00 0.00 3.6210-Sep 65.17 148.00 82.83 80.00 67.00 0.00 4.5417-Sep 100.36 177.00 76.64 70.00 44.00 6.00 4.2024-Sep 30.51 116.00 85.49 80.00 38.00 6.00 4.691-Oct 130.08 139.00 8.92 0.00 31.00 6.00 0.498-Oct 58.32 141.00 82.68 80.00 11.00 6.00 4.5315-Oct -78.24 0.00 78.24 80.00 23.00 0.00 4.2922-Oct 77.55 156.00 78.45 80.00 25.00 0.00 4.3029-Oct 46.60 124.00 77.40 80.00 15.00 0.00 4.255-Nov 56.77 105.00 48.23 50.00 8.00 0.00 2.6512-Nov -0.94 0.00 0.94 0.00 9.00 0.00 0.0519-Nov 129.40 129.40 0.00 0.00 0.00 0.00 0.00
NATURAL FLOW AT TUALATIN RIVER AT HWY 219 BRIDGE [RM 44.40](NFTRJB — 14206239)
0
300
375
450
CF
S
Source Agency: District 18 Watermaster
50
225
75
Measured
Natural
Storage
5/1
5/16
5/31
6/15
6/30
7/15
7/30
8/14
8/29
9/13
9/28
10/1
3
10/2
8
11/1
2
11/2
7
12/1
2

APPENDIX B—Data Tables & Hydrographs for Natural Flow Determination2002 Tualatin River Flow Management Report B-9
NFROOD – 14206440 – NATURAL FLOW AT TUALATIN RIVER AT ROOD BRIDGE [RM 38.4]
Abbreviations: NFROOD=Natural Flow at Tualatin River at Rood Bridge; TRJB=Tualatin River Flow at Rood Bridge; SRUS, SRTV, and, SRLO= Releases from Scoggins Reservoir for CWS, TVID and LOC, respectivelyCalculations: NFROOD=ROOD–STORAGE; STORAGE=SRUS+(0.08*SRTV)+SRLO-LOSS
DATE2001 Daily Mean Discharge in Cubic Feet per Second
NFROOD ROOD STORAGE SRUS SRTV SRLO LOSS (6.6%)7-May 322.00 322.00 0.00 0.00 0.00 0.00 0.0014-May 207.00 207.00 0.00 0.00 0.00 0.00 0.0021-May 240.00 240.00 0.00 0.00 0.00 0.00 0.0028-May 165.00 165.00 0.00 0.00 0.00 0.00 0.004-Jun 112.66 114.00 1.34 0.00 18.00 0.00 0.1011-Jun 126.03 127.00 0.97 0.00 13.00 0.00 0.0718-Jun 183.56 187.00 3.44 0.00 46.00 0.00 0.2425-Jun 106.32 112.00 5.68 0.00 76.00 0.00 0.402-Jul 178.69 184.00 5.31 0.00 71.00 0.00 0.379-Jul 158.87 165.00 6.13 0.00 82.00 0.00 0.4316-Jul 89.23 105.00 15.77 10.00 86.00 0.00 1.1123-Jul 69.62 96.00 26.38 20.00 103.00 0.00 1.8630-Jul 72.82 98.00 25.18 20.00 87.00 0.00 1.786-Aug 74.27 99.00 24.73 15.00 81.00 5.00 1.7513-Aug 66.47 93.00 26.53 20.00 105.00 0.00 1.8720-Aug 51.32 96.00 44.68 40.00 98.00 0.00 3.1627-Aug -60.69 100.00 160.69 165.00 88.00 0.00 11.353-Sep 57.38 120.00 62.62 60.00 88.00 0.00 4.4210-Sep 43.27 123.00 79.73 80.00 67.00 0.00 5.6317-Sep 63.73 138.00 74.27 70.00 44.00 6.00 5.2524-Sep 26.84 110.00 83.16 80.00 38.00 6.00 5.881-Oct 174.08 182.00 7.92 0.00 31.00 6.00 0.568-Oct 34.85 116.00 81.15 80.00 11.00 6.00 5.7315-Oct 40.56 117.00 76.44 80.00 23.00 0.00 5.4022-Oct 42.41 119.00 76.59 80.00 25.00 0.00 5.4129-Oct 34.16 110.00 75.84 80.00 15.00 0.00 5.365-Nov 55.70 103.00 47.30 50.00 8.00 0.00 3.3412-Nov 184.33 185.00 0.67 0.00 9.00 0.00 0.05
NATURAL FLOW AT TUALATIN RIVER AT ROOD BRIDGE RD [RM 38.4](NFROOD — 14206440)
CF
S
Source Agency: District 18 Watermaster
0
200
300
400
100
Measured
Natural
Storage
5/1
5/16
5/31
6/15
6/30
7/15
7/30
8/14
8/29
9/13
9/28
10/1
3
10/2
8
11/1
2
11/2
7
12/1
2

APPENDIX B—Data Tables & Hydrographs for Natural Flow DeterminationB-10 2002 Tualatin River Flow Management Report
NFFRMO – 14206500 – NATURAL FLOW AT TUALATIN RIVER AT FARMINGTON [RM 33.3]
Abbreviations: NFFRMO=Natural Flow at Tualatin River at Farmington; FRMO=Tualatin River Flow at Farmington; SRUS, SRTV, and, SRLO= Releases from Scoggins Reservoir for CWS, TVID and LOC, respectivelyCalculations: NFFRMO=FRMO–STORAGE; STORAGE=SRUS+(0.07*SRTV)+SRLO-LOSS
DATE2001 Daily Mean Discharge in Cubic Feet per Second
NFFRMO FRMO STORAGE SRUS SRTV SRLO LOSS (8.0%)7-May 402.00 402.00 0.00 0.00 0.00 0.00 0.0014-May 270.00 270.00 0.00 0.00 0.00 0.00 0.0021-May 309.00 309.00 0.00 0.00 0.00 0.00 0.0028-May 224.00 224.00 0.00 0.00 0.00 0.00 0.004-Jun 161.84 163.00 1.16 0.00 18.00 0.00 0.1011-Jun 189.16 190.00 0.84 0.00 13.00 0.00 0.0718-Jun 234.04 237.00 2.96 0.00 46.00 0.00 0.2625-Jun 157.11 162.00 4.89 0.00 76.00 0.00 0.432-Jul 255.43 260.00 4.57 0.00 71.00 0.00 0.409-Jul 221.72 227.00 5.28 0.00 82.00 0.00 0.4616-Jul 131.26 146.00 14.74 10.00 86.00 0.00 1.2823-Jul 106.97 132.00 25.03 20.00 103.00 0.00 2.1830-Jul 110.00 134.00 24.00 20.00 87.00 0.00 2.096-Aug 114.38 138.00 23.62 15.00 81.00 5.00 2.0513-Aug 103.84 129.00 25.16 20.00 105.00 0.00 2.1920-Aug 87.89 131.00 43.11 40.00 98.00 0.00 3.7527-Aug -20.47 137.00 157.47 165.00 88.00 0.00 13.693-Sep 105.13 166.00 60.87 60.00 88.00 0.00 5.2910-Sep 99.09 177.00 77.91 80.00 67.00 0.00 6.7817-Sep 113.25 186.00 72.75 70.00 44.00 6.00 6.3324-Sep 71.43 153.00 81.57 80.00 38.00 6.00 7.091-Oct 231.48 239.00 7.52 0.00 31.00 6.00 0.658-Oct 94.17 174.00 79.83 80.00 11.00 6.00 6.9415-Oct 91.92 167.00 75.08 80.00 23.00 0.00 6.5322-Oct 97.79 173.00 75.21 80.00 25.00 0.00 6.5429-Oct 86.43 161.00 74.57 80.00 15.00 0.00 6.485-Nov 100.48 147.00 46.52 50.00 8.00 0.00 4.0412-Nov 255.42 256.00 0.58 0.00 9.00 0.00 0.05
CF
S
Source Agency: District 18 Watermaster
5/1
5/16
5/31
6/15
6/30
7/15
7/30
8/14
8/29
9/13
9/28
10/1
3
10/2
8
11/1
2
11/2
7
12/1
2
NATURAL FLOW AT TUALATIN RIVER AT FARMINGTON [RM 33.3](NFFRMO — 14206500)
0
100
600
300
200
Measured
Natural
Storage
400
500

APPENDIX B—Data Tables & Hydrographs for Natural Flow Determination2002 Tualatin River Flow Management Report B-11
NFWSLO – 14207500 – NATURAL FLOW AT TUALATIN RIVER AT WEST LINN [RM 1.75]
Abbreviations: NFWSLO=Natural Flow at Tualatin River at West Linn; WSLO=Tualatin River Flow at West Linn; SRUS= Release from Scoggins Reservoir for CWSCalculations: NFFRMO=FRMO–STORAGE; STORAGE=SRUS-LOSS
DATE NFWSLO WSLO STORAGE SRUS LOSS (16%)7-May 667.00 667.00 0.00 0.00 0.0014-May 496.00 496.00 0.00 0.00 0.0021-May 600.00 600.00 0.00 0.00 0.0028-May 445.00 445.00 0.00 0.00 0.004-Jun 336.00 336.00 0.00 0.00 0.0011-Jun 347.00 347.00 0.00 0.00 0.0018-Jun 440.00 440.00 0.00 0.00 0.0025-Jun 264.00 264.00 0.00 0.00 0.002-Jul 454.00 454.00 0.00 0.00 0.009-Jul 295.00 295.00 0.00 0.00 0.0016-Jul 195.60 204.00 8.40 10.00 1.6023-Jul 170.20 187.00 16.80 20.00 3.2030-Jul 165.20 182.00 16.80 20.00 3.206-Aug 132.40 145.00 12.60 15.00 2.4013-Aug 135.20 152.00 16.80 20.00 3.2020-Aug 140.40 174.00 33.60 40.00 6.4027-Aug 58.40 197.00 138.60 165.00 26.403-Sep 204.60 255.00 50.40 60.00 9.6010-Sep 215.80 283.00 67.20 80.00 12.8017-Sep 293.20 352.00 58.80 70.00 11.2024-Sep 114.80 182.00 67.20 80.00 12.801-Oct 338.00 338.00 0.00 0.00 0.008-Oct 238.80 306.00 67.20 80.00 12.8015-Oct 200.80 268.00 67.20 80.00 12.8022-Oct 212.80 280.00 67.20 80.00 12.8029-Oct 193.80 261.00 67.20 80.00 12.805-Nov 196.00 238.00 42.00 50.00 8.0012-Nov 477.00 477.00 0.00 0.00 0.00
NATURAL FLOW AT TUALATIN RIVER AT AT WEST LINN [RM 1.75](NFWSLO — 14207500)
0
600
700
800
CF
S
Source Agency: District 18 Watermaster
300
500
200
Measured
Natural
Storage
5/1
5/16
5/31
6/15
6/30
7/15
7/30
8/14
8/29
9/13
9/28
10/1
3
10/2
8
11/1
2
11/2
7
12/1
2
400
100

Appendix CAppendix CAppendix CAppendix C
Scoggins Reservoir OperationsScoggins Reservoir OperationsScoggins Reservoir OperationsScoggins Reservoir OperationsMonthly RecordsMonthly RecordsMonthly RecordsMonthly Records

APPENDIX C—Scoggins Reservoir Operations Monthly ReportsC-2 2002 Tualatin River Flow Management Report
SC
OG
GIN
S D
AM
- R
ES
ER
VO
IR O
PE
RA
TIO
NS
For
the M
onth
of
January
2002
File
:1
02
----
---
INF
LO
W -
----
----
---
----
----
----
- H
EN
RY
HA
GG
LA
KE
---
----
----
----
----
----
----
----
----
----
- T
UA
LA
TIN
RIV
ER
---
----
----
----
----
----
-- W
EA
TH
ER
---
----
----
---
WA
TE
R D
EL
IVE
RIE
S -
----
----
----
----
SC
HO
SC
LO
TA
NO
TO
TA
L W
.S.
ST
OR
CH
NG
CH
NG
CO
MP
GA
SO
DLLO
GO
LF
RO
OD
FR
MO
WS
LO
T
EM
PT
VID
US
ALO
HLS
FG
BV
RO
TH
INF
LO
EL
EV
CO
NT
ST
OR
ST
OR
RE
LIN
FL
O P
RE
CM
AX
MIN
CW
S
DA
Y C
FS
CF
SC
FS
CF
S F
TA
FA
FC
FS
CF
S C
FS
CF
S C
FS
CF
SC
FS
CF
SC
FS
INC
HF
F C
FS
CF
SC
FS
CF
SC
FS
C
FS
CF
S
(1)
(2)
(3)
(4)
(5)
(6)
(7)
(8)
(9)
(10)
(11)
(12)
(13)
(14)
(15)
(16)
(17)
(18)
(19)
(20)
(21)
(22)
(23)
(24)
(25)
(26)
33
87
5
14
05
45
99
28
4.4
03
37
90
-85
-43
11
47
11
54
40
17
30
16
63
19
59
25
50
0.0
04
33
5
25
27
77
13
62
84
.58
34
05
52
65
13
41
14
24
82
60
58
58
89
17
48
19
68
24
84
0.8
44
24
0
34
97
87
13
42
84
.69
34
16
01
05
53
11
41
67
19
64
97
89
71
86
32
09
82
52
10
.14
49
35
44
57
16
12
22
84
.79
34
25
59
54
81
14
16
22
22
49
28
71
17
80
20
38
25
21
0.0
64
63
7
54
87
06
12
42
84
.64
34
11
2-1
43
-72
21
11
39
21
25
76
88
51
65
21
90
22
39
10
.15
42
35
66
72
94
83
69
28
4.6
13
40
64
-48
-24
21
31
89
36
26
67
10
33
18
90
21
03
26
07
1.0
34
44
0
72
36
68
42
99
49
28
5.9
13
53
21
12
57
63
49
77
31
93
31
41
51
61
52
74
13
25
24
42
21
.68
53
44
82
45
79
03
61
07
12
88
.85
38
17
42
85
31
43
81
41
45
29
36
33
10
40
74
39
92
42
25
63
07
1.4
75
74
59
15
94
28
21
60
82
90
.51
39
82
01
64
68
30
14
84
48
99
22
44
45
19
56
86
47
97
59
18
0.0
55
53
7
10
11
82
54
17
38
92
91
.54
40
85
41
03
45
21
14
53
56
63
15
30
34
58
66
83
59
08
62
46
0.0
04
83
7
11
96
14
61
32
55
29
2.1
84
15
01
64
73
26
71
39
75
22
11
30
27
57
63
47
60
68
68
03
0.0
04
63
8
12
92
16
81
12
71
29
2.3
24
16
43
14
27
22
51
32
34
71
10
92
22
09
57
28
56
87
70
88
0.0
04
83
4
13
81
12
69
21
62
92
.35
41
67
43
11
62
48
26
44
51
10
42
19
45
50
68
51
59
68
03
0.3
34
73
3
14
71
10
78
18
62
91
.30
40
61
2-1
06
2-5
35
75
72
22
41
51
46
51
78
04
53
44
68
76
24
60
.00
43
32
15
63
89
61
58
29
0.1
83
94
90
-11
22
-56
66
94
12
83
74
14
53
18
21
39
75
42
79
56
42
0.0
04
32
9
16
61
73
61
40
28
9.0
93
84
10
-10
80
-54
56
30
85
33
81
30
51
76
13
59
83
88
65
03
60
.00
45
28
17
57
73
61
36
28
8.0
63
73
99
-10
11
-51
05
53
43
31
01
20
21
62
73
81
53
53
94
51
90
.05
40
34
18
50
67
61
23
28
6.9
43
63
41
-10
58
-53
36
12
79
28
01
15
01
44
13
22
83
24
04
07
40
.04
41
35
19
50
71
61
27
28
5.8
43
52
55
-10
86
-54
85
80
32
30
41
12
31
36
42
68
32
97
43
75
00
.30
43
35
20
70
11
17
18
82
85
.16
34
60
7-6
48
-32
74
36
10
93
61
98
01
34
62
49
72
77
23
50
40
.70
45
36
21
12
11
88
11
32
02
85
.58
35
00
63
99
20
11
36
33
76
70
92
41
42
52
43
42
71
83
42
70
.68
46
36
22
95
14
69
25
02
86
.10
35
50
34
97
25
11
18
36
95
39
10
12
16
19
24
93
27
61
34
71
0.6
63
83
3
23
84
10
97
20
02
86
.00
35
40
8-9
5-4
83
25
27
74
85
12
49
17
37
26
01
28
64
35
04
0.1
94
03
1
24
95
15
49
25
82
85
.80
35
21
6-1
92
-97
32
32
26
50
11
18
21
77
22
64
92
90
03
52
60
.09
43
35
25
33
39
88
57
13
78
28
7.4
03
67
57
15
41
77
79
78
74
96
51
68
32
22
12
98
73
28
84
55
62
.13
45
37
26
20
54
79
30
71
42
89
.46
38
77
62
01
91
01
81
11
02
98
52
25
91
37
85
37
82
39
18
51
14
0.2
23
53
0
27
13
13
08
20
45
92
90
.76
40
07
01
29
46
52
11
66
36
97
19
38
36
67
49
00
44
64
54
19
0.4
53
63
1
28
11
11
99
11
32
12
91
.65
40
96
58
95
45
11
14
62
57
31
38
23
09
25
71
65
04
45
88
90
.03
37
33
29
98
13
27
23
72
91
.76
41
05
69
14
62
47
29
34
90
14
44
24
53
54
48
51
59
61
86
0.0
04
12
8
30
84
11
98
21
12
91
.31
40
62
2-4
34
-21
94
50
23
14
39
15
63
21
55
50
30
49
46
62
46
0.0
33
63
0
31
77
10
97
19
32
90
.59
39
90
0-7
22
-36
45
46
18
24
12
15
63
19
80
45
98
46
45
60
21
0.0
44
13
2
TO
T1
1.3
6
CF
S3
18
46
76
23
96
10
34
23
03
88
12
61
11
64
15
28
64
01
90
62
92
81
13
80
91
15
24
81
44
79
1M
AX
57
45
00
00
00
0
AF
63
15
13
41
27
85
20
51
36
02
56
02
51
61
18
22
14
33
03
20
79
71
71
24
81
82
25
74
02
28
59
42
87
19
3M
IN3
52
80
00
00
00
RE
SE
RV
OIR
ST
OR
AG
ES
NO
TE
L S
UM
MA
RY
FO
R W
AT
ER
YE
AR
20
02
RE
SE
RV
OIR
DE
LIV
ER
Y S
TA
TU
SU
SE
DR
EM
AIN
ING
ST
AT
US
:J
an
ua
ry 3
1,
20
02
Up
da
ted
:Ja
n.
31
, 2
00
2
Dat
e:T
VID
Tim
e:
0800 h
rs
S
EC
O:
W/Y
pc:
4
8.6
"sn
o d
ep
th/w
ate
r co
nte
nt: 1
3.2
"/3
.8"
US
A
SD
MO
: W
/Y p
c:
70
.9"
sn
o d
ep
th/w
ate
r co
nte
nt
30
.0"/
6.0
"
T
he
se
allo
ca
tio
ns,
am
ou
nts
use
d a
nd
re
ma
inin
gL
O
are
pro
vis
ion
al a
nd
su
bje
ct
to d
aily
ch
an
ge
as
HL
SB
O
Wate
r sto
rag
e e
levati
on
+/-
to
fill cu
rve:
3.5
3M
inim
um
Req
uir
ed
Dis
ch
arg
es
th
e W
S e
lv.
rise
s a
nd
fa
lls.
Th
ese
nu
mb
ers
are
FG
Wate
r sto
rag
e in
acre
ft
+/-
to
fill cu
rve:
3448
De
c -
Se
pt:
1
0 c
fs
a
re f
or
pla
nn
ing
pu
rpo
se
s o
nly
.B
VT
NP
erc
en
tag
e o
f fu
ll r
es
erv
oir
:7
4.4
%O
ct -
Nov: 2
0 c
fsT
ota
l:

APPENDIX C—Scoggins Reservoir Operations Monthly Reports2002 Tualatin River Flow Management Report C-3
SC
OG
GIN
S D
AM
- R
ES
ER
VO
IR O
PE
RA
TIO
NS
For
the M
onth
of
Febru
ary
2002
File
:2
02
----
---
INF
LO
W -
----
----
---
----
----
----
- H
EN
RY
HA
GG
LA
KE
---
----
----
----
----
----
----
----
----
----
- T
UA
LA
TIN
RIV
ER
---
----
----
----
----
----
-- W
EA
TH
ER
---
----
----
---
WA
TE
R D
EL
IVE
RIE
S -
----
----
----
----
SC
HO
SC
LO
TA
NO
TO
TA
L W
.S.
ST
OR
CH
NG
CH
NG
CO
MP
GA
SO
DLLO
GO
LF
RO
OD
FR
MO
WS
LO
T
EM
PT
VID
US
ALO
HLS
FG
BV
RO
TH
INF
LO
EL
EV
CO
NT
ST
OR
ST
OR
RE
LIN
FL
O P
RE
CM
AX
MIN
CW
S
DA
Y C
FS
CF
SC
FS
CF
S F
TA
FA
FC
FS
CF
S C
FS
CF
S C
FS
CF
SC
FS
CF
SC
FS
INC
HF
F C
FS
CF
SC
FS
CF
SC
FS
C
FS
CF
S
(1)
(2)
(3)
(4)
(5)
(6)
(7)
(8)
(9)
(10)
(11)
(12)
(13)
(14)
(15)
(16)
(17)
(18)
(19)
(20)
(21)
(22)
(23)
(24)
(25)
(26)
39
90
0
17
91
09
81
96
28
9.8
53
91
62
-73
8-3
72
55
01
78
41
61
61
81
94
84
18
84
37
85
75
70
.25
44
36
27
31
00
71
80
28
9.1
03
84
20
-74
2-3
74
52
01
46
38
51
40
71
88
53
83
94
09
25
32
50
.00
43
34
37
19
87
17
62
88
.44
37
77
1-6
49
-32
74
68
14
13
81
12
58
17
64
35
72
38
21
49
46
0.3
84
73
5
47
31
02
71
82
28
7.8
73
72
14
-55
7-2
81
42
41
43
38
71
16
31
66
63
32
03
57
14
55
60
.00
49
29
57
09
66
17
22
88
.16
37
49
72
83
14
35
01
93
34
56
77
14
98
30
91
33
38
41
94
0.0
35
03
0
67
09
86
17
42
88
.60
37
92
84
31
21
71
62
33
34
15
44
12
24
28
96
31
52
39
42
0.1
34
53
2
78
41
81
82
73
28
9.2
03
85
19
59
12
98
16
31
44
97
58
01
18
32
68
52
97
63
88
60
.60
46
37
81
36
27
62
14
33
29
0.2
03
95
10
99
15
00
16
51
66
43
90
11
51
03
00
43
27
85
85
91
.41
43
30
91
15
23
31
83
66
29
1.1
04
04
11
90
14
54
16
47
06
04
11
70
20
28
32
69
34
93
44
22
0.1
04
53
1
10
98
17
51
42
87
29
1.8
74
11
87
77
63
91
16
40
75
09
94
72
10
93
27
73
49
34
37
30
.00
48
30
11
90
14
31
02
43
29
2.4
64
17
86
59
93
02
16
31
84
47
79
01
84
33
34
43
52
24
33
70
.02
50
30
12
80
11
98
20
72
92
.96
42
29
65
10
25
71
62
73
40
26
97
15
15
32
95
34
86
42
65
0.0
04
93
0
13
72
10
06
17
82
93
.42
42
76
74
71
23
71
62
53
36
36
13
12
97
31
38
33
60
41
48
0.0
05
12
9
14
67
87
61
60
29
3.7
44
30
96
32
91
66
45
21
13
21
58
01
13
12
91
43
16
63
93
10
.00
54
28
15
66
79
61
51
29
4.0
04
33
63
26
71
35
51
18
62
87
51
69
91
26
39
29
16
36
32
0.0
05
83
2
16
64
76
51
45
29
4.2
04
35
70
20
71
04
52
15
62
65
46
48
75
24
22
26
37
33
24
0.1
05
53
6
17
59
71
51
35
29
4.4
34
38
08
23
81
20
52
17
22
51
42
67
99
20
36
23
43
30
38
0.0
05
73
9
18
54
84
51
43
29
4.6
24
40
05
19
79
95
21
51
23
83
97
70
91
69
31
99
22
60
20
.00
46
33
19
68
10
27
17
72
94
.88
44
27
52
70
13
65
21
88
32
14
37
73
71
48
01
75
72
43
70
.50
50
40
20
63
98
21
63
29
5.1
54
45
56
28
11
42
51
19
33
66
49
88
28
15
49
19
05
23
13
0.0
05
23
5
21
70
14
95
22
42
95
.17
44
57
72
11
11
71
18
23
40
61
38
53
14
71
17
31
22
26
0.3
05
63
8
22
63
14
34
21
02
95
.35
44
76
51
88
95
12
72
22
31
06
35
10
27
15
51
17
59
21
58
0.0
05
84
6
23
61
12
73
19
12
95
.68
45
11
03
45
17
44
82
22
41
15
78
10
44
17
63
19
66
27
53
0.2
75
84
1
24
52
10
23
15
72
95
.95
45
39
32
83
14
34
81
91
37
15
52
98
22
05
02
29
82
87
90
.02
52
34
25
46
85
31
34
29
6.1
84
56
34
24
11
22
48
17
03
03
48
78
77
18
32
21
22
27
73
0.0
04
53
1
26
42
74
21
18
29
6.4
64
59
29
29
51
49
10
15
92
59
38
47
54
15
77
18
67
24
73
0.0
05
23
0
27
40
67
21
09
29
6.7
44
62
25
29
61
49
10
15
92
31
33
76
83
13
46
16
23
21
83
0.0
05
62
9
28
38
59
29
92
96
.94
46
43
72
12
10
71
01
17
20
83
11
62
01
17
81
44
11
93
40
.00
59
29
29
NA
NA
30
NA
NA
31
NA
NA
TO
T4
.11
CF
S1
96
43
23
31
86
53
83
32
96
29
67
62
63
10
20
21
95
80
34
38
07
04
19
77
48
31
00
66
6M
AX
59
46
00
00
00
0
AF
38
96
64
13
36
91
06
77
65
37
65
37
58
85
12
42
22
02
36
38
83
76
81
93
13
96
76
15
36
88
19
96
71
MIN
43
28
00
00
00
0
RE
SE
RV
OIR
ST
OR
AG
ES
NO
TE
L S
UM
MA
RY
FO
R W
AT
ER
YE
AR
20
02
RE
SE
RV
OIR
DE
LIV
ER
Y S
TA
TU
SU
SE
DR
EM
AIN
ING
ST
AT
US
:F
eb
rua
ry 2
8,
20
02
Up
da
ted
:Fe
b 2
8,
20
02
D
ate:
TV
ID
Tim
e:
0800 h
rs
S
EC
O:
W/Y
pc:
5
3.7
"sn
o d
ep
th/w
ate
r co
nte
nt:
1.3
"/1
.2"
US
A
SD
MO
: W
/Y p
c: 7
9.1
"sn
o d
ep
th/w
ate
r co
nte
nt
6.0
"/0
Th
ese
allo
ca
tio
ns,
am
ou
nts
use
d a
nd
re
ma
inin
gL
O
are
pro
vis
ion
al a
nd
su
bje
ct
to d
aily
ch
an
ge
as
HL
SB
O
Wate
r sto
rag
e e
levati
on
+/-
to
fill cu
rve:
-1.2
9M
inim
um
Req
uir
ed
Dis
ch
arg
es
th
e W
S e
lv.
rise
s a
nd
fa
lls.
Th
ese
nu
mb
ers
are
FG
Wate
r sto
rag
e in
acre
ft
+/-
to
fill cu
rve:
-1389
De
c -
Se
pt:
1
0 c
fs
a
re f
or
pla
nn
ing
pu
rpo
se
s o
nly
.B
VT
NP
erc
en
tag
e o
f fu
ll r
es
erv
oir
:8
6.6
%O
ct -
Nov: 2
0 c
fsT
ota
l:

APPENDIX C—Scoggins Reservoir Operations Monthly ReportsC-4 2002 Tualatin River Flow Management Report
SC
OG
GIN
S D
AM
- R
ES
ER
VO
IR O
PE
RA
TIO
NS
For
the M
onth
of
Marc
h 2
002
File
:3
02
----
---
INF
LO
W -
----
----
---
----
----
----
- H
EN
RY
HA
GG
LA
KE
---
----
----
----
----
----
----
----
----
----
- T
UA
LA
TIN
RIV
ER
---
----
----
----
----
----
-- W
EA
TH
ER
---
----
----
---
WA
TE
R D
EL
IVE
RIE
S -
----
----
----
----
SC
HO
SC
LO
TA
NO
TO
TA
L W
.S.
ST
OR
CH
NG
CH
NG
CO
MP
GA
SO
DLLO
GO
LF
RO
OD
FR
MO
WS
LO
T
EM
PT
VID
US
ALO
HLS
FG
BV
RO
TH
INF
LO
EL
EV
CO
NT
ST
OR
ST
OR
RE
LIN
FL
O P
RE
CM
AX
MIN
CW
S
DA
Y C
FS
CF
SC
FS
CF
S F
TA
FA
FC
FS
CF
S C
FS
CF
S C
FS
CF
SC
FS
CF
SC
FS
INC
HF
F C
FS
CF
SC
FS
CF
SC
FS
C
FS
CF
S
(1)
(2)
(3)
(4)
(5)
(6)
(7)
(8)
(9)
(10)
(11)
(12)
(13)
(14)
(15)
(16)
(17)
(18)
(19)
(20)
(21)
(22)
(23)
(24)
(25)
(26)
46
43
7
13
65
42
92
29
7.1
14
66
22
18
59
31
01
03
18
92
79
56
61
05
21
29
81
75
50
.00
54
29
0
23
55
02
87
29
7.2
84
68
03
18
19
11
01
01
17
62
56
53
79
29
11
64
15
92
0.0
05
32
81
33
14
62
79
29
7.4
84
70
16
21
31
07
10
11
71
63
23
84
87
85
51
05
91
45
90
.00
55
30
0
43
14
32
76
29
7.6
44
71
87
17
18
61
09
61
54
22
24
65
78
89
69
13
60
0.0
06
22
80
52
94
12
72
29
7.7
64
73
15
12
86
51
07
51
46
21
44
25
73
89
06
12
76
0.0
06
13
22
64
05
53
98
29
8.0
14
75
83
26
81
35
11
14
61
74
23
04
38
76
09
06
14
16
0.5
84
94
00
73
14
22
75
29
8.1
64
77
44
16
18
11
09
11
60
24
24
85
10
84
13
08
18
51
0.0
04
83
00
82
94
02
71
29
8.3
24
79
17
17
38
71
19
81
49
22
54
40
91
41
16
51
76
20
.09
41
28
09
28
38
26
82
98
.49
48
10
01
83
92
11
10
31
39
21
14
10
78
29
41
15
17
0.0
04
33
10
10
36
50
38
92
98
.71
48
32
62
26
11
41
11
25
18
22
47
45
47
27
91
21
40
20
.41
44
30
0
11
67
12
14
19
22
99
.10
48
76
04
34
21
91
12
30
35
93
85
67
29
47
11
09
15
25
0.7
94
93
50
12
13
63
85
16
53
73
00
.20
49
96
01
20
06
05
53
65
87
50
10
73
13
91
23
08
25
05
33
53
1.5
15
23
50
13
12
92
85
15
42
93
01
.08
50
94
09
80
49
45
45
48
63
31
29
32
04
32
93
93
15
94
12
50
.65
50
36
0
14
11
52
14
12
34
13
01
.36
51
23
92
99
15
12
54
40
55
66
15
22
23
08
30
37
32
42
41
83
0.1
04
53
10
15
95
14
31
12
49
30
1.4
15
12
95
56
28
25
12
79
52
81
27
22
26
03
21
33
34
54
13
60
.06
49
34
0
16
84
12
48
21
63
01
.52
51
41
71
22
62
18
02
42
42
19
47
19
92
33
51
34
69
42
18
0.1
54
23
40
17
73
10
05
17
83
01
.64
51
55
01
33
67
18
02
47
38
28
27
16
71
33
59
35
03
42
65
0.1
54
33
20
18
64
91
31
58
30
1.6
65
15
72
22
11
17
91
90
33
07
41
13
93
32
46
34
18
41
94
0.0
04
42
90
19
11
01
52
92
71
30
1.5
05
13
95
-17
7-8
93
25
23
64
83
89
61
33
23
10
73
30
54
34
91
.12
43
33
0
20
11
11
65
72
83
30
1.4
55
13
39
-56
-28
34
73
19
56
91
34
61
47
93
07
63
28
54
17
10
.23
48
39
0
21
95
14
36
24
43
01
.27
51
13
9-2
00
-10
13
45
24
44
80
12
93
16
97
29
36
31
83
40
33
0.0
05
53
80
22
76
11
96
20
13
00
.99
50
89
9-2
40
-12
13
44
22
34
22
11
70
16
84
28
69
29
42
38
30
0.0
05
03
40
23
72
94
61
72
30
1.2
45
11
07
20
81
05
10
12
06
37
06
85
15
05
27
82
29
97
35
99
0.0
05
53
70
24
68
84
51
57
30
1.3
65
12
41
13
46
81
01
16
93
32
60
21
24
42
62
52
86
63
39
70
.00
60
38
0
25
56
82
41
42
30
1.3
95
12
74
33
17
10
11
18
29
95
81
10
32
23
71
26
43
33
03
0.0
05
33
30
26
54
74
41
32
30
1.5
25
14
17
14
37
27
61
48
26
74
92
86
82
03
22
32
02
95
80
.00
58
35
0
27
47
68
31
18
30
1.6
35
15
40
12
36
27
61
38
24
74
42
77
51
63
11
92
32
53
70
.00
55
32
0
28
43
64
31
10
30
1.7
65
16
85
14
57
37
61
49
24
84
04
71
31
30
71
58
12
12
30
.00
56
36
0
29
41
57
31
01
30
1.8
25
17
51
66
33
76
10
92
07
37
56
64
99
71
36
31
83
50
.00
60
35
0
30
NA
NA
31
NA
NA
TO
T5
.84
CF
S1
86
23
02
41
52
50
38
26
79
32
34
59
13
95
25
18
71
03
14
30
56
76
26
27
86
81
52
4M
AX
62
40
30
00
00
0
AF
36
93
59
98
30
19
99
35
31
45
31
46
41
51
17
29
18
89
33
71
11
62
34
11
12
58
71
24
53
61
61
70
3M
IN4
12
86
00
00
00
RE
SE
RV
OIR
ST
OR
AG
ES
NO
TE
L S
UM
MA
RY
FO
R W
AT
ER
YE
AR
20
02
RE
SE
RV
OIR
DE
LIV
ER
Y S
TA
TU
SU
SE
DR
EM
AIN
ING
ST
AT
US
:M
arc
h 2
9,
20
02
Up
da
ted
: M
arc
h 2
7 2
00
2
Dat
e:M
arch
31
, 2
00
2T
VID
6
Tim
e:
0800 h
rs
S
EC
O:
W/Y
pc:
60
.4"
sn
o d
ep
th/w
ate
r co
nte
nt:
1.9
"/.1
"U
SA
SD
MO
: W
/Y p
c: 8
9.8
"sn
o d
ep
th/w
ate
r co
nte
nt
9.0
"/1
.6"
Th
ese
allo
ca
tio
ns,
am
ou
nts
use
d a
nd
re
ma
inin
gL
O
are
pro
vis
ion
al a
nd
su
bje
ct
to d
aily
ch
an
ge
as
HL
SB
O
Wate
r sto
rag
e e
levati
on
+/-
to
fill cu
rve:
0.4
1M
inim
um
Req
uir
ed
Dis
ch
arg
es
th
e W
S e
lv.
rise
s a
nd
fa
lls.
Th
ese
nu
mb
ers
are
FG
Wate
r sto
rag
e in
acre
ft
+/-
to
fill cu
rve:
452
De
c -
Se
pt:
1
0 c
fs
a
re f
or
pla
nn
ing
pu
rpo
se
s o
nly
.B
VT
NP
erc
en
tag
e o
f fu
ll r
es
erv
oir
:9
6.5
%O
ct -
Nov: 2
0 c
fsT
ota
l:

APPENDIX C—Scoggins Reservoir Operations Monthly Reports2002 Tualatin River Flow Management Report C-5
SC
OG
GIN
S D
AM
- R
ES
ER
VO
IR O
PE
RA
TIO
NS
For
the M
onth
of
April 2002
File
:4
02
----
---
INF
LO
W -
----
----
---
----
----
----
- H
EN
RY
HA
GG
LA
KE
---
----
----
----
----
----
----
----
----
----
- T
UA
LA
TIN
RIV
ER
---
----
----
----
----
----
-- W
EA
TH
ER
---
----
----
---
WA
TE
R D
EL
IVE
RIE
S -
----
----
----
----
SC
HO
SC
LO
TA
NO
TO
TA
L W
.S.
ST
OR
CH
NG
CH
NG
CO
MP
GA
SO
DLLO
GO
LF
RO
OD
FR
MO
WS
LO
T
EM
PT
VID
CW
SLO
HLS
FG
BV
RO
TH
INF
LO
EL
EV
CO
NT
ST
OR
ST
OR
RE
LIN
FL
O P
RE
CM
AX
MIN
DA
Y C
FS
CF
SC
FS
CF
S F
TA
FA
FC
FS
CF
S C
FS
CF
S C
FS
CF
SC
FS
CF
SC
FS
INC
HF
F C
FS
CF
SC
FS
CF
SC
FS
C
FS
CF
S
(1)
(2)
(3)
(4)
(5)
(6)
(7)
(8)
(9)
(10)
(11)
(12)
(13)
(14)
(15)
(16)
(17)
(18)
(19)
(20)
(21)
(22)
(23)
(24)
(25)
(26)
51
82
9
13
54
82
85
30
1.9
45
18
84
55
28
77
10
51
70
31
75
56
84
91
03
21
39
50
.00
57
35
23
24
42
78
30
1.9
65
19
07
23
12
77
89
16
23
04
53
57
86
96
11
31
10
.00
64
36
32
94
32
74
30
2.0
25
19
74
67
34
41
75
15
32
51
47
47
25
88
81
24
10
.00
66
38
42
94
12
72
30
2.1
15
20
74
10
05
04
19
11
47
23
94
46
65
78
03
11
81
0.0
06
93
91
2
52
84
02
70
30
2.1
95
21
64
90
45
41
86
14
22
31
42
36
08
74
51
07
00
.00
77
42
11
62
73
91
67
30
2.1
25
20
85
-79
-40
12
78
71
45
35
65
10
62
67
51
10
89
0.1
55
04
31
1
72
73
71
65
30
1.9
05
18
40
-24
5-1
24
15
22
81
35
35
35
28
68
58
22
10
83
0.0
06
03
99
82
63
61
63
30
1.7
15
16
28
-21
2-1
07
15
14
41
26
34
75
13
65
37
92
11
09
0.0
05
83
41
39
27
37
26
63
01
.70
51
61
7-1
1-6
62
56
12
22
26
40
26
00
74
21
07
00
.12
68
37
13
10
42
76
31
21
30
1.9
15
18
51
23
41
18
31
14
92
00
25
54
61
64
77
61
11
21
0.7
35
74
61
3
11
36
67
21
05
30
2.1
15
20
74
22
31
12
31
14
32
35
30
95
67
82
19
61
12
55
0.2
66
04
71
3
12
33
62
29
73
02
.08
52
04
1-3
3-1
71
24
10
72
06
39
96
07
81
29
78
13
25
0.0
36
04
91
31
13
37
70
21
09
30
2.0
05
19
51
-90
-45
12
98
42
01
38
96
06
79
59
51
12
90
0.0
25
94
91
01
14
84
19
55
28
43
02
.14
52
10
81
57
79
12
92
08
53
35
34
72
98
79
10
33
15
25
0.6
85
83
97
1
15
61
13
54
20
03
02
.44
52
44
43
36
16
96
72
36
38
05
45
89
51
16
41
33
61
56
90
.03
53
36
41
16
51
10
93
16
33
02
.66
52
69
02
46
12
46
71
91
31
04
41
81
41
16
61
38
91
74
70
.03
57
38
41
17
47
96
31
46
30
2.8
25
28
70
18
09
16
71
58
28
84
33
75
51
08
61
31
61
77
00
.11
51
37
41
18
44
87
31
34
30
3.0
15
30
84
21
41
08
68
17
62
54
39
97
02
10
53
12
76
16
92
0.4
85
43
63
1
19
41
76
21
19
30
3.1
35
32
19
13
56
86
81
36
22
13
56
64
39
40
11
56
15
69
0.0
05
73
52
1
20
38
68
21
08
30
3.1
45
32
31
12
69
71
03
19
83
65
61
68
38
10
27
14
30
0.0
05
83
31
1
21
36
62
21
00
30
3.1
55
32
42
11
69
71
03
18
03
43
58
17
84
96
11
32
50
.00
59
37
11
22
32
57
29
13
03
.16
53
25
31
16
97
10
31
64
32
45
45
74
79
04
12
55
0.0
05
63
67
1
23
30
51
28
33
03
.14
53
23
1-2
2-1
19
78
61
51
31
25
09
68
48
20
11
94
0.0
05
83
38
1
24
29
46
17
63
03
.16
53
25
32
21
15
26
31
38
23
24
33
62
67
75
11
28
0.0
06
03
58
1
25
27
38
16
63
03
.31
53
42
31
70
86
20
10
61
29
19
03
73
52
86
64
10
45
0.0
07
03
78
1
26
26
36
16
33
03
.35
53
46
84
52
32
04
31
21
17
93
46
47
45
89
94
60
.00
69
36
10
1
27
25
39
16
53
03
.48
53
61
51
47
74
20
94
11
81
77
35
04
97
59
99
40
0.1
55
53
71
01
28
24
37
16
23
03
.56
53
70
69
14
62
06
61
09
16
53
27
49
56
18
94
00
.00
60
41
91
29
23
35
15
93
03
.53
53
67
2-3
4-1
77
55
81
04
22
03
70
44
75
52
88
60
.00
70
43
18
1
30
22
33
15
63
03
.53
53
67
20
05
15
19
71
86
32
54
43
54
88
63
0.0
07
54
11
91
31
NA
NA
TO
T2
.79
CF
S1
04
81
84
05
92
94
79
29
21
96
31
25
56
39
93
77
15
94
12
21
15
26
75
03
73
64
MA
X7
74
92
41
00
00
01
9
AF
20
79
36
50
11
75
84
51
84
31
84
34
35
66
19
91
11
85
18
59
93
16
19
43
86
55
30
59
74
11
1M
IN5
03
34
78
00
00
038
RE
SE
RV
OIR
ST
OR
AG
ES
NO
TE
L S
UM
MA
RY
FO
R W
AT
ER
YE
AR
20
02
RE
SE
RV
OIR
DE
LIV
ER
Y S
TA
TU
SU
SE
DR
EM
AIN
ING
ST
AT
US
:A
pri
l 3
0,
20
02
Up
da
ted
:Ap
ril 3
0,
20
02
D
ate:
Ap
ril
30
, 2
00
2T
VID
48
4
Tim
e:
0800 h
rs
S
EC
O:
W/Y
pc:
65
.5"
sn
o d
ep
th/w
ate
r co
nte
nt:
0U
SA
01
26
18
SD
MO
: W
/Y p
c: 9
7.4
"sn
o d
ep
th/w
ate
r co
nte
nt
0
Th
ese
allo
ca
tio
ns,
am
ou
nts
use
d a
nd
re
ma
inin
gL
O0
50
0
are
pro
vis
ion
al a
nd
su
bje
ct
to d
aily
ch
an
ge
as
HL
SB
O0
50
00
Wate
r sto
rag
e e
levati
on
+/-
to
fill cu
rve:
0.0
7M
inim
um
Req
uir
ed
Dis
ch
arg
es
th
e W
S e
lv.
rise
s a
nd
fa
lls.
Th
ese
nu
mb
ers
are
FG
04
50
0
Wate
r sto
rag
e in
acre
ft
+/-
to
fill cu
rve:
77
De
c -
Se
pt:
1
0 c
fs
a
re f
or
pla
nn
ing
pu
rpo
se
s o
nly
.B
VT
N0
40
00
Pe
rce
nta
ge
of
full
re
se
rvo
ir:
10
0.1
%O
ct -
Nov: 2
0 c
fsT
ota
l:

APPENDIX C—Scoggins Reservoir Operations Monthly ReportsC-6 2002 Tualatin River Flow Management Report
SC
OG
GIN
S D
AM
- R
ES
ER
VO
IR O
PE
RA
TIO
NS
For
the M
onth
of
May 2
002
File
:5
02
----
---
INF
LO
W -
----
----
---
----
----
----
- H
EN
RY
HA
GG
LA
KE
---
----
----
----
----
----
----
----
----
----
- T
UA
LA
TIN
RIV
ER
---
----
----
----
----
----
-- W
EA
TH
ER
---
----
----
---
WA
TE
R D
EL
IVE
RIE
S -
----
----
----
----
SC
HO
SC
LO
TA
NO
TO
TA
L W
.S.
ST
OR
CH
NG
CH
NG
CO
MP
GA
SO
DLLO
GO
LF
RO
OD
FR
MO
WS
LO
T
EM
PT
VID
CW
SLO
HLS
FG
BV
RO
TH
INF
LO
EL
EV
CO
NT
ST
OR
ST
OR
RE
LIN
FL
O P
RE
CM
AX
MIN
DA
Y C
FS
CF
SC
FS
CF
S F
TA
FA
FC
FS
CF
S C
FS
CF
S C
FS
CF
SC
FS
CF
SC
FS
INC
HF
F C
FS
CF
SC
FS
CF
SC
FS
C
FS
CF
S
(1)
(2)
(3)
(4)
(5)
(6)
(7)
(8)
(9)
(10)
(11)
(12)
(13)
(14)
(15)
(16)
(17)
(18)
(19)
(20)
(21)
(22)
(23)
(24)
(25)
(26)
53
67
2
12
13
21
54
30
3.5
35
36
72
00
51
51
98
18
03
24
39
84
98
81
60
.00
65
87
1
22
03
11
52
30
3.5
45
36
83
11
65
15
78
91
75
27
73
76
47
27
70
0.0
06
84
61
32
03
01
51
30
3.5
55
36
94
11
65
15
78
31
69
26
73
50
43
97
31
0.0
06
53
62
41
92
91
49
30
3.5
35
36
72
-22
-11
51
40
79
16
62
61
34
04
24
71
00
.00
60
37
2
52
02
91
50
30
3.5
35
36
72
00
51
51
76
16
12
50
32
84
11
68
80
.00
61
37
2
61
92
91
49
30
3.5
25
36
60
-12
-65
14
58
61
73
25
63
26
40
66
72
0.0
95
43
82
71
92
71
47
30
3.5
15
36
49
-11
-65
14
57
71
63
22
93
22
40
26
67
0.0
05
33
52
81
82
51
44
30
3.5
25
36
60
11
63
74
37
21
40
20
32
95
37
46
51
0.0
35
53
42
91
72
51
43
30
3.5
25
36
60
00
37
37
69
13
61
96
38
03
56
62
00
.00
63
34
2
10
14
27
24
33
03
.56
53
70
64
62
32
34
66
41
09
16
02
47
37
85
89
0.0
05
53
52
11
14
27
24
33
03
.57
53
71
71
16
27
33
60
12
31
42
24
23
13
55
70
.00
63
37
2
12
13
26
24
13
03
.59
53
74
02
31
22
73
95
91
18
16
02
07
27
75
31
0.0
07
04
22
13
13
25
24
03
03
.61
53
76
22
21
12
73
85
51
14
14
42
12
27
74
96
0.0
08
04
52
14
13
25
24
03
03
.60
53
75
1-1
1-6
51
45
58
14
41
72
20
72
70
49
60
.09
55
45
2
15
13
25
24
03
03
.57
53
71
7-3
4-1
75
33
65
41
41
17
42
29
29
04
96
0.0
25
73
62
16
12
24
23
83
03
.52
53
66
0-5
7-2
96
03
15
41
29
16
02
15
28
35
16
0.0
07
03
22
17
13
24
23
93
03
.54
53
68
32
31
24
05
25
51
10
13
32
27
28
35
52
0.3
37
14
42
18
13
24
23
93
03
.54
53
68
30
04
04
04
91
07
12
32
29
30
45
46
0.0
06
54
62
19
12
25
23
93
03
.54
53
68
30
04
04
04
81
05
12
31
93
26
45
26
0.0
76
64
92
20
12
24
23
83
03
.56
53
70
62
31
24
05
25
21
03
13
92
39
27
65
06
0.2
55
84
62
21
12
22
23
63
03
.56
53
70
60
04
74
74
81
14
15
02
40
30
96
00
0.1
16
44
22
22
11
21
23
43
03
.56
53
70
2-4
-24
64
44
61
10
14
42
25
30
15
73
0.0
56
14
42
23
10
20
23
23
03
.51
53
64
9-5
3-2
74
61
94
41
09
14
12
16
29
45
67
0.0
36
24
82
24
10
20
23
23
03
.48
53
61
4-3
5-1
84
32
54
31
05
12
41
94
26
45
16
0.0
06
64
22
25
10
19
23
13
03
.49
53
62
61
26
41
47
41
89
87
17
22
44
48
70
.00
73
46
2
26
10
19
23
13
03
.49
53
62
60
04
04
04
08
78
51
47
21
54
54
0.0
07
15
42
27
11
19
23
23
03
.51
53
64
92
31
24
25
44
28
27
01
49
21
44
14
0.0
07
25
02
28
12
23
23
73
03
.54
53
68
33
41
74
66
35
11
11
97
16
52
24
44
50
.26
69
49
2
29
15
28
24
53
03
.57
53
71
73
41
74
66
36
51
32
15
12
57
31
06
40
0.2
56
45
32
30
NA
NA
31
NA
NA
TO
T1
.58
CF
S4
16
72
44
91
18
92
31
25
61
27
91
75
73
70
54
94
27
32
79
37
21
68
32
MA
X8
08
70
00
00
05
6
AF
82
51
43
69
72
35
84
54
52
49
12
53
63
48
57
34
99
80
21
45
33
18
58
93
33
86
MIN
53
32
00
00
00
111
RE
SE
RV
OIR
ST
OR
AG
ES
NO
TE
L S
UM
MA
RY
FO
R W
AT
ER
YE
AR
20
02
RE
SE
RV
OIR
DE
LIV
ER
Y S
TA
TU
SU
SE
DR
EM
AIN
ING
ST
AT
US
:M
ay 2
9,
20
02
Up
da
ted
:Ma
y 2
1,
20
02
D
ate:
Ap
ril
30
, 2
00
2T
VID
48
4
Tim
e:
0800 h
rs
S
EC
O:
W/Y
pc:
66
.2"
sn
o d
ep
th/w
ate
r co
nte
nt:
0C
WS
01
26
18
SD
MO
: W
/Y p
c: 9
9.8
" sn
o d
ep
th/w
ate
r co
nte
nt
0
Th
ese
allo
ca
tio
ns,
am
ou
nts
use
d a
nd
re
ma
inin
gL
O0
50
0
are
pro
vis
ion
al a
nd
su
bje
ct
to d
aily
ch
an
ge
as
HL
SB
O0
50
00
Wate
r sto
rag
e e
levati
on
+/-
to
fill cu
rve:
0.0
7M
inim
um
Req
uir
ed
Dis
ch
arg
es
th
e W
S e
lv.
rise
s a
nd
fa
lls.
Th
ese
nu
mb
ers
are
FG
04
50
0
Wate
r sto
rag
e in
acre
ft
+/-
to
fill cu
rve:
77
De
c -
Se
pt:
1
0 c
fs
a
re f
or
pla
nn
ing
pu
rpo
se
s o
nly
.B
VT
N0
40
00
Pe
rce
nta
ge
of
full
re
se
rvo
ir:
10
0.1
%O
ct -
Nov: 2
0 c
fsT
ota
l:

APPENDIX C—Scoggins Reservoir Operations Monthly Reports2002 Tualatin River Flow Management Report C-7
SC
OG
GIN
S D
AM
- R
ES
ER
VO
IR O
PE
RA
TIO
NS
For
the M
onth
of
June 2
002
File
:6
02
----
---
INF
LO
W -
----
----
---
----
----
----
- H
EN
RY
HA
GG
LA
KE
---
----
----
----
----
----
----
----
----
----
- T
UA
LA
TIN
RIV
ER
---
----
----
----
----
----
-- W
EA
TH
ER
---
----
----
---
WA
TE
R D
EL
IVE
RIE
S -
----
----
----
----
SC
HO
SC
LO
TA
NO
TO
TA
L W
.S.
ST
OR
CH
NG
CH
NG
CO
MP
GA
SO
DLLO
GO
LF
RO
OD
FR
MO
WS
LO
T
EM
PT
VID
US
ALO
HLS
FG
BV
RO
TH
INF
LO
EL
EV
CO
NT
ST
OR
ST
OR
RE
LIN
FL
O P
RE
CM
AX
MIN
CW
S
DA
Y C
FS
CF
SC
FS
CF
S F
TA
FA
FC
FS
CF
S C
FS
CF
S C
FS
CF
SC
FS
CF
SC
FS
INC
HF
F C
FS
CF
SC
FS
CF
SC
FS
C
FS
CF
S
(1)
(2)
(3)
(4)
(5)
(6)
(7)
(8)
(9)
(10)
(11)
(12)
(13)
(14)
(15)
(16)
(17)
(18)
(19)
(20)
(21)
(22)
(23)
(24)
(25)
(26)
53
66
0
11
01
91
30
30
3.5
15
36
49
-11
-63
12
53
98
56
61
55
23
24
96
0.0
07
25
00
00
00
02
29
19
12
93
03
.50
53
63
8-1
1-6
31
25
37
80
59
12
41
86
41
80
.00
75
43
00
00
00
2
39
18
12
83
03
.49
53
62
6-1
2-6
31
25
36
78
56
12
01
73
36
30
.00
74
46
00
00
00
2
48
16
12
53
03
.40
53
52
5-1
01
-51
76
25
35
13
69
31
14
16
33
36
0.0
07
35
21
80
01
62
13
2
58
16
12
53
03
.31
53
42
3-1
02
-51
79
28
45
13
29
71
30
18
43
28
0.0
07
55
52
20
09
318
2
68
16
12
53
03
.21
53
31
0-1
13
-57
75
18
47
13
59
91
32
19
13
28
0.0
07
54
42
50
06
316
2
77
15
12
33
03
.13
53
21
9-9
1-4
65
61
04
71
12
78
12
41
83
33
20
.00
65
41
40
09
317
2
87
14
12
23
03
.07
53
15
2-6
7-3
46
12
74
71
19
87
11
81
71
31
30
.00
64
41
80
07
319
29
81
51
24
30
3.0
25
30
95
-57
-29
61
32
51
12
51
20
12
81
83
32
80
.18
60
43
60
012
215
2
10
71
41
22
30
2.9
45
30
05
-90
-45
61
16
47
12
01
05
14
81
85
35
50
.00
71
45
60
09
119
2
11
71
41
22
30
2.8
95
29
49
-56
-28
61
33
45
11
68
21
27
19
03
47
0.0
07
44
71
30
06
216
2
12
61
31
20
30
2.7
25
27
58
-19
1-9
68
6-1
04
31
64
93
11
51
67
27
80
.00
84
50
26
27
01
03
18
2
13
61
21
19
30
2.4
75
24
77
-28
1-1
42
14
75
47
21
01
32
12
01
70
28
50
.00
93
60
61
30
01
45
16
2
14
61
21
19
30
2.1
75
21
41
-33
6-1
69
14
7-2
24
62
10
12
91
40
19
72
88
0.0
09
65
26
13
00
12
51
82
15
61
21
19
30
1.9
35
18
73
-26
8-1
35
14
05
45
20
21
39
13
72
00
30
60
.00
72
53
54
30
01
45
16
2
16
51
21
18
30
1.6
85
15
95
-27
8-1
40
14
0-0
47
20
51
48
14
82
08
32
10
.00
70
52
55
30
01
54
16
2
17
61
21
19
30
2.4
15
12
95
-30
0-1
51
14
0-1
14
72
04
14
41
65
22
23
40
0.0
06
35
15
43
00
17
41
42
18
81
61
25
30
1.2
75
11
39
-15
6-7
91
03
24
60
17
81
36
18
72
37
44
00
.18
58
50
46
00
11
31
62
19
61
41
21
30
1.1
25
09
73
-16
6-8
48
95
52
15
61
34
19
71
97
26
00
.08
65
41
41
00
11
11
32
20
61
21
19
30
0.9
65
07
96
-17
7-8
91
00
11
48
10
91
20
14
42
18
37
10
.00
72
43
50
00
13
21
42
21
51
11
17
30
0.7
85
05
98
-19
8-1
00
10
66
45
16
69
11
26
18
33
13
0.0
08
55
15
60
01
63
11
3
22
51
11
17
30
0.6
05
03
99
-19
9-1
00
10
77
43
16
07
61
16
17
02
95
0.0
08
85
35
70
01
65
93
23
51
11
17
30
0.4
15
01
90
-20
9-1
05
10
72
43
16
09
11
11
15
72
64
0.0
07
35
25
70
01
44
12
3
24
51
11
17
30
0.2
14
99
71
-21
9-1
10
10
7-3
43
16
39
41
18
16
62
55
0.0
07
35
45
70
01
53
12
3
25
41
11
16
29
9.9
64
96
97
-27
4-1
38
13
0-8
43
20
21
04
11
21
62
26
40
.00
81
54
76
00
17
31
53
26
49
11
42
99
.68
49
39
1-3
06
-15
41
47
-74
02
00
98
11
41
62
23
90
.00
93
59
94
00
20
51
13
27
49
11
42
99
.40
49
08
6-3
05
-15
41
46
-83
91
96
10
11
11
15
62
39
0.0
09
26
09
30
01
76
13
3
28
51
01
16
29
9.1
14
87
70
-31
6-1
59
15
9-0
42
21
61
43
11
31
62
23
30
.03
75
56
10
40
01
65
15
3
29
13
28
34
42
96
.98
48
63
0-1
40
-71
12
85
71
01
22
12
35
28
53
11
51
60
.99
58
52
83
00
12
22
23
30
61
41
21
29
6.7
84
84
12
-21
8-1
10
12
61
65
62
00
19
43
36
42
05
73
0.0
05
95
08
10
01
31
22
3
31
NA
NA
TO
T1
.46
CF
S1
99
41
63
26
47
-26
46
29
78
33
21
40
64
76
03
34
44
31
55
90
61
00
24
MA
X9
66
01
30
81
77
03
47
88
41
67
0
AF
39
58
25
63
12
83
-52
48
-52
48
59
07
65
92
78
99
44
16
63
38
55
91
17
15
19
88
3M
IN5
84
12
59
43
51
06
88
17
58
25
13
9
RE
SE
RV
OIR
ST
OR
AG
ES
NO
TE
L S
UM
MA
RY
FO
R W
AT
ER
YE
AR
20
02
RE
SE
RV
OIR
DE
LIV
ER
Y S
TA
TU
SU
SE
DR
EM
AIN
ING
ST
AT
US
:J
un
e 3
0,
20
02
Up
da
ted
:Ju
ne
25
, 2
00
2
Dat
e:Ju
ne
30
, 2
00
2T
VID
30
78
Tim
e:
0800 h
rs
S
EC
O:
W/Y
pc:
68
.1"
sn
o d
ep
th/w
ate
r co
nte
nt:
0U
SA
35
11
22
67
SD
MO
: W
/Y p
c: n
asn
o d
ep
th/w
ate
r co
nte
nt
0
Th
ese
allo
ca
tio
ns,
am
ou
nts
use
d a
nd
re
ma
inin
gL
O0
50
0
are
pro
vis
ion
al a
nd
su
bje
ct
to d
aily
ch
an
ge
as
HL
SB
O6
88
43
12
Wate
r sto
rag
e e
levati
on
+/-
to
fill cu
rve:
-6.7
2M
inim
um
Req
uir
ed
Dis
ch
arg
es
th
e W
S e
lv.
rise
s a
nd
fa
lls.
Th
ese
nu
mb
ers
are
FG
17
54
32
5
Wate
r sto
rag
e in
acre
ft
+/-
to
fill cu
rve:
-5228
De
c -
Se
pt:
1
0 c
fs
a
re f
or
pla
nn
ing
pu
rpo
se
s o
nly
.B
VT
N8
25
31
75
Pe
rce
nta
ge
of
full
re
se
rvo
ir:
90
.3%
Oct -
Nov: 2
0 c
fsO
ther
288
527

APPENDIX C—Scoggins Reservoir Operations Monthly ReportsC-8 2002 Tualatin River Flow Management Report
SC
OG
GIN
S D
AM
- R
ES
ER
VO
IR O
PE
RA
TIO
NS
For
the M
onth
of
July
2002
File
:7
02
----
---
INF
LO
W -
----
----
---
----
----
----
- H
EN
RY
HA
GG
LA
KE
---
----
----
----
----
----
----
----
----
----
- T
UA
LA
TIN
RIV
ER
---
----
----
----
----
----
-- W
EA
TH
ER
---
----
----
---
WA
TE
R D
EL
IVE
RIE
S -
----
----
----
----
SC
HO
SC
LO
TA
NO
TO
TA
L W
.S.
ST
OR
CH
NG
CH
NG
CO
MP
GA
SO
DLLO
GO
LF
RO
OD
FR
MO
WS
LO
T
EM
PT
VID
US
ALO
HLS
FG
BV
RO
TH
INF
LO
EL
EV
CO
NT
ST
OR
ST
OR
RE
LIN
FL
O P
RE
CM
AX
MIN
CW
S
DA
Y C
FS
CF
SC
FS
CF
S F
TA
FA
FC
FS
CF
S C
FS
CF
S C
FS
CF
SC
FS
CF
SC
FS
INC
HF
F C
FS
CF
SC
FS
CF
SC
FS
C
FS
CF
S
(1)
(2)
(3)
(4)
(5)
(6)
(7)
(8)
(9)
(10)
(11)
(12)
(13)
(14)
(15)
(16)
(17)
(18)
(19)
(20)
(21)
(22)
(23)
(24)
(25)
(26)
48
41
3
15
13
11
92
98
.52
48
13
2-2
81
-14
21
26
-16
50
18
91
69
24
23
32
55
20
.00
68
47
68
00
93
24
3
25
12
11
82
98
.32
47
91
7-2
15
-10
81
18
10
47
17
61
14
18
42
60
45
40
.00
74
46
71
00
12
31
13
34
11
11
62
98
.14
47
72
4-1
93
-97
10
71
04
61
66
89
13
01
96
36
70
.00
79
46
62
00
74
15
3
44
10
11
52
97
.89
47
45
5-2
69
-13
61
36
04
51
81
10
51
16
16
92
99
0.0
07
24
97
20
01
15
16
3
54
91
14
29
7.6
74
72
19
-23
6-1
19
13
71
84
41
80
11
71
25
17
42
64
0.0
06
94
77
40
01
04
18
3
64
91
14
29
7.4
44
69
73
-24
6-1
24
13
61
24
11
74
88
12
01
74
25
80
.00
79
54
87
00
12
31
73
73
91
13
29
7.1
84
66
96
-27
7-1
40
13
6-4
40
17
39
01
12
16
62
48
0.0
08
56
28
80
09
419
3
84
91
14
29
6.9
64
64
58
-23
8-1
20
13
61
64
21
77
12
41
24
18
32
85
0.1
37
25
68
70
01
04
18
39
49
11
42
96
.74
46
22
5-2
33
-11
71
27
10
40
16
69
71
65
22
72
95
0.0
07
65
58
20
01
12
15
3
10
48
11
32
96
.52
45
99
3-2
32
-11
71
38
21
42
13
38
11
81
76
32
10
.00
93
61
90
00
10
41
83
11
37
11
12
96
.20
45
65
6-3
37
-17
01
71
14
72
07
94
10
61
49
25
10
.00
99
58
10
00
02
19
27
3
12
27
11
02
95
.92
45
36
1-2
95
-14
91
51
24
61
90
88
10
71
50
21
50
.00
93
55
10
60
06
620
3
13
26
19
29
5.6
84
51
10
-25
1-1
27
14
41
74
71
87
80
10
61
53
20
90
.00
94
65
90
10
05
62
13
14
26
19
29
5.4
14
48
27
-28
3-1
43
14
41
46
18
89
01
05
14
62
04
0.0
08
85
29
01
00
36
23
3
15
26
19
29
5.1
24
45
25
-30
2-1
52
14
4-8
47
18
79
71
10
15
31
98
0.0
07
84
89
01
00
27
23
3
16
26
19
29
4.8
74
42
65
-26
0-1
31
13
21
46
17
37
51
05
14
62
04
0.0
08
65
28
61
00
25
17
3
17
26
19
29
4.6
44
40
26
-23
9-1
20
14
42
44
51
89
76
94
13
42
09
0.0
08
65
69
41
00
20
62
3
18
26
19
29
4.3
44
37
15
-31
1-1
57
14
7-1
04
51
89
79
96
12
91
82
0.0
08
25
79
61
00
19
64
3
19
26
19
29
4.0
44
34
05
-31
0-1
56
16
15
46
20
17
71
05
13
81
72
tr7
86
09
22
00
21
79
3
20
26
19
29
3.7
74
31
26
-27
9-1
41
15
31
24
71
89
92
11
01
43
18
20
.00
72
52
90
20
01
96
63
21
26
19
29
3.4
64
28
08
-31
8-1
60
14
9-1
14
61
96
94
10
51
44
19
50
.00
94
63
88
20
02
35
13
22
25
18
29
3.1
84
25
21
-28
7-1
45
15
61
14
42
03
83
10
61
45
19
80
.00
93
61
92
20
02
16
63
23
15
17
29
2.8
64
21
93
-32
8-1
65
17
05
44
20
89
29
61
32
18
70
.00
97
67
10
32
00
25
84
3
24
25
18
29
2.5
34
18
57
-33
6-1
69
17
45
43
19
98
89
91
31
16
90
.00
87
57
10
62
00
24
85
3
25
15
17
29
2.2
24
15
42
-31
5-1
59
16
34
42
18
98
69
91
36
16
70
.00
88
57
98
20
02
47
43
26
25
18
29
1.9
34
12
48
-29
4-1
48
15
02
43
18
27
69
71
31
17
40
.00
89
57
90
20
02
06
33
27
15
17
29
1.6
24
09
35
-31
3-1
58
15
80
42
19
18
39
21
28
17
20
.00
85
50
97
20
01
97
33
28
15
17
29
1.3
24
06
32
-30
3-1
53
15
74
42
19
01
06
98
13
31
67
0.0
07
75
39
82
00
25
31
3
29
15
17
29
1.0
14
03
20
-31
2-1
57
15
7-0
42
19
28
61
07
14
31
77
0.0
08
55
59
82
00
22
61
3
30
15
17
29
0.7
24
00
30
-29
0-1
46
14
6-0
31
17
86
59
81
34
18
20
.00
86
56
87
20
02
26
13
31
15
17
29
0.4
03
97
10
-32
0-1
61
15
8-3
32
19
19
19
11
23
15
70
.00
80
50
89
30
02
06
33
TO
T0
.13
CF
S7
72
17
31
32
5-4
38
84
52
61
38
13
50
57
34
28
72
34
68
49
78
73
14
MA
X9
96
72
76
13
30
04
64
16
83
55
93
AF
15
34
30
61
64
5-8
70
3-8
70
38
97
72
74
26
78
11
37
35
69
76
87
99
87
41
45
07
MIN
68
46
54
76
65
50
92
03
33
70
41
84
RE
SE
RV
OIR
ST
OR
AG
ES
NO
TE
L S
UM
MA
RY
FO
R W
AT
ER
YE
AR
20
02
RE
SE
RV
OIR
DE
LIV
ER
Y S
TA
TU
SU
SE
DR
EM
AIN
ING
ST
AT
US
:J
uly
31
, 2
00
2U
pd
ate
d:J
uly
31
, 2
00
2
Dat
e:Ju
ly 3
1,
20
02
TV
ID8
55
4
Tim
e:
0800 h
rs
S
EC
O:
W/Y
pc:
69
.3"
sn
o d
ep
th/w
ate
r co
nte
nt:
0U
SA
10
06
11
61
2
SD
MO
: W
/Y p
c: n
asn
o d
ep
th/w
ate
r co
nte
nt
0
Th
ese
allo
ca
tio
ns,
am
ou
nts
use
d a
nd
re
ma
inin
gL
O0
50
0
are
pro
vis
ion
al a
nd
su
bje
ct
to d
aily
ch
an
ge
as
HL
SB
O1
60
83
39
2
Wate
r sto
rag
e e
levati
on
+/-
to
fill cu
rve:
-13.1
0M
inim
um
Req
uir
ed
Dis
ch
arg
es
th
e W
S e
lv.
rise
s a
nd
fa
lls.
Th
ese
nu
mb
ers
are
FG
50
83
99
2
Wate
r sto
rag
e in
acre
ft
+/-
to
fill cu
rve:
-13930
De
c -
Se
pt:
1
0 c
fs
a
re f
or
pla
nn
ing
pu
rpo
se
s o
nly
.B
VT
N1
52
92
47
1
Pe
rce
nta
ge
of
full
re
se
rvo
ir:
74
.0%
Oct -
Nov: 2
0 c
fsO
ther
472
443

APPENDIX C—Scoggins Reservoir Operations Monthly Reports2002 Tualatin River Flow Management Report C-9
SC
OG
GIN
S D
AM
- R
ES
ER
VO
IR O
PE
RA
TIO
NS
For
the M
onth
of
August 2002
File
:8
02
----
---
INF
LO
W -
----
----
---
----
----
----
- H
EN
RY
HA
GG
LA
KE
---
----
----
----
----
----
----
----
----
----
- T
UA
LA
TIN
RIV
ER
---
----
----
----
----
----
-- W
EA
TH
ER
---
----
----
---
WA
TE
R D
EL
IVE
RIE
S -
----
----
----
----
SC
HO
SC
LO
TA
NO
TO
TA
L W
.S.
ST
OR
CH
NG
CH
NG
CO
MP
GA
SO
DLLO
GO
LF
RO
OD
FR
MO
WS
LO
T
EM
PT
VID
US
ALO
HLS
FG
BV
RO
TH
INF
LO
EL
EV
CO
NT
ST
OR
ST
OR
RE
LIN
FL
O P
RE
CM
AX
MIN
CW
S
DA
Y C
FS
CF
SC
FS
CF
S F
TA
FA
FC
FS
CF
S C
FS
CF
S C
FS
CF
SC
FS
CF
SC
FS
INC
HF
F C
FS
CF
SC
FS
CF
SC
FS
C
FS
CF
S
(1)
(2)
(3)
(4)
(5)
(6)
(7)
(8)
(9)
(10)
(11)
(12)
(13)
(14)
(15)
(16)
(17)
(18)
(19)
(20)
(21)
(22)
(23)
(24)
(25)
(26)
39
71
0
11
51
72
90
.09
39
40
1-3
09
-15
61
54
-24
21
88
72
95
13
01
52
0.0
08
04
28
93
00
19
51
3
21
40
52
89
.81
39
12
2-2
79
-14
11
44
34
21
80
63
88
12
31
57
0.0
08
44
59
02
00
25
15
3
31
41
62
89
.54
38
85
5-2
67
-13
51
42
74
61
82
69
87
11
81
48
0.0
07
64
89
11
54
03
20
3
41
41
62
89
.24
38
58
8-2
67
-13
51
42
74
71
85
82
86
11
71
24
0.0
07
85
19
11
55
04
18
3
51
51
72
88
.97
38
29
2-2
96
-14
91
41
-84
71
85
96
10
11
28
13
4tr
74
49
89
15
50
51
73
61
51
72
88
.70
38
02
6-2
66
-13
41
33
-14
71
69
73
99
13
81
45
0.1
37
44
68
11
55
04
18
3
71
51
72
88
.44
37
77
1-2
55
-12
91
36
74
91
81
71
88
13
41
55
0.0
37
44
48
11
55
04
21
3
81
51
72
88
.14
37
47
8-2
93
-14
81
40
-84
51
79
62
90
12
71
39
0.0
08
04
58
41
55
06
20
39
14
16
28
7.8
63
72
04
-27
4-1
38
14
79
42
18
76
78
41
21
15
20
.00
84
43
92
15
50
62
03
10
14
16
28
7.5
23
68
73
-33
1-1
67
16
4-3
43
19
56
98
51
23
14
50
.00
89
56
98
20
53
62
33
11
14
16
28
7.1
93
65
53
-32
0-1
61
16
32
44
19
58
78
81
18
13
20
.00
83
48
97
20
52
62
43
12
14
16
28
6.8
63
62
34
-31
9-1
61
16
32
45
19
58
59
71
30
13
90
.00
88
69
97
20
53
62
33
13
14
16
28
6.5
63
59
45
-28
9-1
46
14
82
47
18
05
29
31
29
15
20
.00
96
66
87
20
05
62
13
14
14
16
28
6.1
83
55
80
-36
5-1
84
18
3-1
48
20
76
57
81
03
14
80
.00
10
36
18
74
00
11
92
73
15
13
15
28
5.8
23
52
35
-34
5-1
74
18
28
48
21
07
78
41
06
14
30
.00
98
50
10
64
00
06
22
3
16
13
15
28
5.4
63
48
92
-34
3-1
73
17
2-1
50
20
27
18
91
17
12
60
.00
88
51
98
40
01
61
00
3
17
13
15
28
5.1
13
45
59
-33
3-1
68
17
24
51
20
58
78
81
21
13
90
.00
84
53
98
40
01
79
03
18
13
15
28
4.7
43
42
07
-35
2-1
77
17
1-6
52
20
51
01
91
12
91
57
0.0
09
04
89
74
00
17
90
3
19
13
15
28
4.3
83
38
66
-34
1-1
72
17
1-1
53
20
71
01
10
01
33
16
70
.00
82
49
97
40
01
88
03
20
14
16
28
4.0
73
35
73
-29
3-1
48
16
11
34
91
96
79
96
13
11
74
0.0
38
05
59
14
00
15
60
3
21
14
16
28
3.7
13
32
33
-34
0-1
71
15
7-1
45
71
95
10
69
61
32
19
00
.00
73
48
87
40
01
47
03
22
14
16
28
3.3
93
29
33
-30
0-1
51
15
0-1
56
18
98
91
00
14
02
08
0.0
07
14
88
84
00
76
03
23
14
16
28
3.0
33
25
96
-33
7-1
70
15
0-2
05
91
89
85
94
12
92
18
0.0
08
45
49
14
00
46
03
24
03
14
28
2.7
63
23
44
-25
2-1
27
15
02
36
11
88
71
92
13
12
10
0.0
08
75
38
94
00
86
03
25
03
14
28
2.4
53
20
56
-28
8-1
45
15
05
62
19
07
98
61
24
20
00
.00
84
54
88
40
09
60
3
26
03
14
28
2.1
13
17
41
-31
5-1
59
15
0-9
62
19
21
02
95
12
71
97
0.0
07
56
08
84
00
10
50
3
27
03
14
28
1.7
73
14
27
-31
4-1
58
16
57
46
20
29
41
00
13
71
97
0.0
07
45
28
54
00
22
65
3
28
23
16
28
1.4
33
11
14
-31
3-1
58
16
57
46
20
19
11
01
13
72
05
0.0
08
85
48
34
00
20
67
3
29
13
15
28
1.0
53
07
66
-34
8-1
75
17
2-3
45
20
89
19
81
34
20
80
.00
94
59
86
45
02
06
73
30
23
16
28
0.6
73
04
19
-34
7-1
75
17
50
47
21
11
08
98
13
02
08
0.0
08
34
68
35
00
18
69
3
31
23
16
28
0.2
83
00
64
-35
5-1
79
19
11
24
52
20
12
31
06
14
32
58
0.0
07
65
28
96
00
18
69
3
TO
T0
.19
CF
S3
01
16
30
17
6-4
86
34
90
44
11
52
36
01
82
56
82
87
33
94
05
22
7M
AX
10
36
92
79
89
90
49
27
81
89
32
79
3
AF
60
23
06
03
49
-96
46
-96
46
97
27
81
30
21
11
93
75
09
45
69
97
81
51
03
68
MIN
71
42
55
50
19
64
97
55
13
75
64
91
84
RE
SE
RV
OIR
ST
OR
AG
ES
NO
TE
L S
UM
MA
RY
FO
R W
AT
ER
YE
AR
20
02
RE
SE
RV
OIR
DE
LIV
ER
Y S
TA
TU
SU
SE
DR
EM
AIN
ING
ST
AT
US
:A
ug
ust
31, 2002
Up
da
ted
:Au
gu
st
32
00
2
Dat
e:A
ug
ust
31
, 2
00
2T
VID
14
10
4
Tim
e:
0800 h
rs
S
EC
O:
W/Y
pc:
69
.0"
sn
o d
ep
th/w
ate
r co
nte
nt:
0U
SA
29
70
96
48
SD
MO
: W
/Y p
c: n
asn
o d
ep
th/w
ate
r co
nte
nt
0
Th
ese
allo
ca
tio
ns,
am
ou
nts
use
d a
nd
re
ma
inin
gL
O9
74
03
are
pro
vis
ion
al a
nd
su
bje
ct
to d
aily
ch
an
ge
as
HL
SB
O2
15
92
84
1
Wate
r sto
rag
e e
levati
on
+/-
to
fill cu
rve:
-23.2
2M
inim
um
Req
uir
ed
Dis
ch
arg
es
th
e W
S e
lv.
rise
s a
nd
fa
lls.
Th
ese
nu
mb
ers
are
FG
88
33
61
7
Wate
r sto
rag
e in
acre
ft
+/-
to
fill cu
rve:
-23576
De
c -
Se
pt:
1
0 c
fs
a
re f
or
pla
nn
ing
pu
rpo
se
s o
nly
.B
VT
N2
17
81
82
2
Pe
rce
nta
ge
of
full
re
se
rvo
ir:
56
.0%
Oct -
Nov: 2
0 c
fsO
ther
656
257

APPENDIX C—Scoggins Reservoir Operations Monthly ReportsC-10 2002 Tualatin River Flow Management Report
SC
OG
GIN
S D
AM
- R
ES
ER
VO
IR O
PE
RA
TIO
NS
For
the M
onth
of
Septe
mber
2002
File
:9
02
----
---
INF
LO
W -
----
----
---
----
----
----
- H
EN
RY
HA
GG
LA
KE
---
----
----
----
----
----
----
----
----
----
- T
UA
LA
TIN
RIV
ER
---
----
----
----
----
----
-- W
EA
TH
ER
---
----
----
---
WA
TE
R D
EL
IVE
RIE
S -
----
----
----
----
SC
HO
SC
LO
TA
NO
TO
TA
L W
.S.
ST
OR
CH
NG
CH
NG
CO
MP
GA
SO
DLLO
GO
LF
RO
OD
FR
MO
WS
LO
T
EM
PT
VID
US
ALO
HLS
FG
BV
RO
TH
INF
LO
EL
EV
CO
NT
ST
OR
ST
OR
RE
LIN
FL
O P
RE
CM
AX
MIN
CW
S
DA
Y C
FS
CF
SC
FS
CF
S F
TA
FA
FC
FS
CF
S C
FS
CF
S C
FS
CF
SC
FS
CF
SC
FS
INC
HF
F C
FS
CF
SC
FS
CF
SC
FS
C
FS
CF
S
(1)
(2)
(3)
(4)
(5)
(6)
(7)
(8)
(9)
(10)
(11)
(12)
(13)
(14)
(15)
(16)
(17)
(18)
(19)
(20)
(21)
(22)
(23)
(24)
(25)
(26)
30
06
4
12
31
62
79
.85
29
67
4-3
90
-19
71
90
-74
52
22
13
61
11
15
16
60
.00
84
55
87
60
02
16
63
22
31
62
79
.45
29
31
4-3
60
-18
21
89
74
52
24
14
51
20
16
32
35
0.0
07
85
28
76
00
67
20
3
31
31
52
79
.03
28
93
7-3
77
-19
01
89
-14
42
23
14
01
20
16
62
55
0.0
08
65
08
86
00
87
18
3
42
31
62
78
.65
28
59
7-3
40
-17
11
72
14
42
08
12
01
16
16
22
61
0.0
07
54
47
06
00
87
18
3
52
31
62
78
.29
28
27
6-3
21
-16
21
64
25
22
04
11
01
07
14
82
52
0.0
07
44
27
16
00
26
18
3
62
41
72
77
.93
27
95
7-3
19
-16
11
60
-15
32
06
12
01
03
14
22
38
0.0
07
44
56
86
00
03
19
3
73
61
10
27
7.5
42
76
12
-34
5-1
74
17
95
55
22
51
42
11
11
48
23
20
.01
72
45
64
80
00
61
63
83
41
82
77
.15
27
26
9-3
43
-17
31
79
65
52
27
16
11
22
14
72
38
0.0
26
44
46
68
00
04
18
39
24
17
27
6.7
82
69
45
-32
4-1
63
17
81
55
52
26
16
21
29
18
22
64
0.0
06
94
86
68
00
04
18
3
10
24
17
27
6.4
12
66
22
-32
3-1
63
17
41
15
22
26
13
71
23
17
72
83
0.0
08
34
96
78
00
05
12
3
11
23
16
27
6.0
02
62
65
-35
7-1
80
17
4-6
52
22
21
54
11
71
64
27
70
.00
84
58
68
80
00
61
13
12
13
15
27
5.6
02
59
19
-34
6-1
74
18
61
25
12
34
13
51
17
16
62
64
0.0
08
95
36
98
09
07
13
3
13
13
15
27
5.2
22
55
92
-32
7-1
65
17
05
51
20
91
13
11
91
62
26
40
.00
88
53
63
70
90
71
33
14
13
15
27
4.8
42
52
66
-32
6-1
64
17
06
51
20
71
27
11
01
51
25
50
.00
68
56
63
70
90
61
43
15
13
15
27
4.4
42
49
24
-34
2-1
72
17
0-2
50
20
81
39
11
41
57
24
90
.00
78
54
63
70
90
61
43
16
23
16
27
4.0
52
45
92
-33
2-1
67
16
92
51
21
01
49
12
21
66
25
80
.00
87
53
64
70
90
61
43
17
35
19
27
3.7
42
43
30
-26
2-1
32
14
91
75
62
12
15
51
38
18
63
52
0.3
66
85
24
47
06
12
50
3
18
24
17
27
3.4
42
40
77
-25
3-1
28
13
79
53
19
21
66
15
42
15
35
90
.00
67
46
37
70
69
50
3
19
24
17
27
3.1
02
37
91
-28
6-1
44
13
7-7
52
18
71
38
14
02
01
36
30
.00
76
44
37
70
69
50
3
20
23
16
27
2.7
82
35
12
-27
9-1
41
13
7-4
51
19
51
36
12
21
73
31
00
.00
76
44
38
70
69
50
3
21
13
15
27
2.4
22
32
22
-29
0-1
46
14
0-6
51
19
01
27
11
61
65
27
40
.00
75
49
40
80
67
00
2
22
13
15
27
2.1
22
29
72
-25
0-1
26
13
91
35
11
93
12
21
13
16
01
97
0.0
07
85
33
98
06
70
02
23
13
15
27
1.7
72
26
82
-29
0-1
46
14
5-1
50
19
71
26
11
31
57
24
10
.00
85
52
38
80
61
31
02
24
13
15
27
1.4
22
23
93
-28
9-1
46
14
5-1
50
19
51
10
11
01
53
18
20
.00
91
50
38
80
61
31
02
25
13
15
27
1.0
62
21
06
-28
7-1
45
15
05
49
20
01
19
10
61
45
16
40
.00
89
54
43
80
61
13
02
26
13
15
27
0.6
42
17
57
-34
9-1
76
17
2-4
50
21
71
33
10
61
47
15
90
.00
85
53
59
80
61
64
02
27
13
15
27
0.2
42
14
32
-32
5-1
64
17
28
52
22
31
49
11
41
55
15
90
.00
81
51
49
80
62
04
02
28
13
15
26
9.8
62
11
23
-30
9-1
56
15
93
49
20
81
38
11
61
62
15
90
.00
75
49
46
80
61
64
02
29
13
15
26
9.4
82
08
17
-30
6-1
54
15
95
50
21
21
47
11
31
59
15
90
.00
82
49
46
80
61
64
02
30
24
17
26
9.0
92
05
04
-31
3-1
58
15
80
54
21
81
49
13
51
82
15
80
.18
65
47
43
80
61
44
22
31
NA
NA
TO
T0
.57
CF
S4
91
02
30
18
1-4
82
04
91
29
21
52
46
32
04
10
53
55
74
91
27
12
7M
AX
91
58
17
21
22
00
12
92
17
13
82
44
80
AF
97
20
26
03
59
-95
60
-95
60
97
43
18
33
02
31
25
36
81
42
70
55
97
43
14
13
6M
IN6
44
23
41
44
36
42
56
43
02
74
48
41
59
RE
SE
RV
OIR
ST
OR
AG
ES
NO
TE
L S
UM
MA
RY
FO
R W
AT
ER
YE
AR
20
02
RE
SE
RV
OIR
DE
LIV
ER
Y S
TA
TU
SU
SE
DR
EM
AIN
ING
ST
AT
US
:S
ep
tem
be
r 3
0,
20
02
Up
da
ted
:Se
pt.
30
, 2
00
2
Dat
e:S
ept.
30
, 2
00
2T
VID
17
51
8
Tim
e:
0800 h
rs
S
EC
O:
W/Y
pc:
na
sn
o d
ep
th/w
ate
r co
nte
nt:
0U
SA
73
34
52
84
SD
MO
: W
/Y p
c: n
asn
o d
ep
th/w
ate
r co
nte
nt
0
Th
ese
allo
ca
tio
ns,
am
ou
nts
use
d a
nd
re
ma
inin
gL
O3
53
14
7
are
pro
vis
ion
al a
nd
su
bje
ct
to d
aily
ch
an
ge
as
HL
SB
O2
58
92
41
1
Wate
r sto
rag
e e
levati
on
+/-
to
fill cu
rve:
-34.4
1M
inim
um
Req
uir
ed
Dis
ch
arg
es
th
e W
S e
lv.
rise
s a
nd
fa
lls.
Th
ese
nu
mb
ers
are
FG
11
57
33
43
Wate
r sto
rag
e in
acre
ft
+/-
to
fill cu
rve:
-33136
De
c -
Se
pt:
1
0 c
fs
a
re f
or
pla
nn
ing
pu
rpo
se
s o
nly
.B
VT
N2
66
21
33
8
Pe
rce
nta
ge
of
full
re
se
rvo
ir:
38
.2%
Oct -
Nov: 2
0 c
fsO
ther
815
100
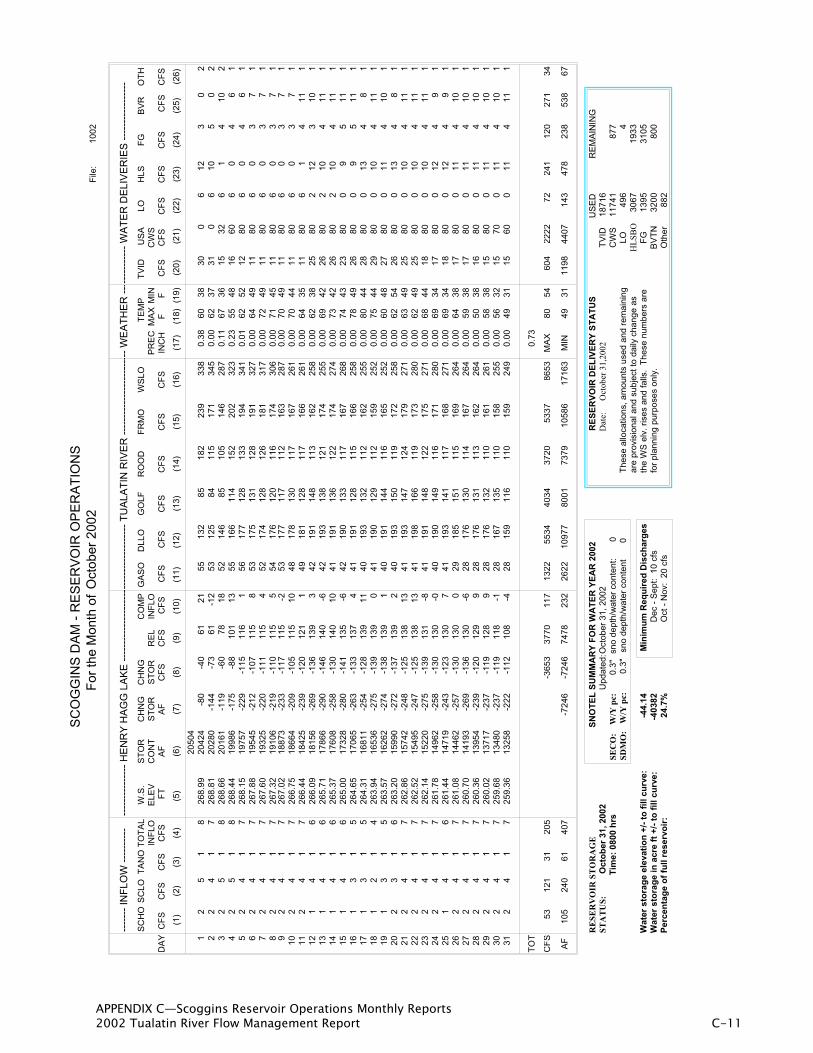
APPENDIX C—Scoggins Reservoir Operations Monthly Reports2002 Tualatin River Flow Management Report C-11
SC
OG
GIN
S D
AM
- R
ES
ER
VO
IR O
PE
RA
TIO
NS
For
the M
onth
of
Octo
ber
2002
File
:1
00
2
----
---
INF
LO
W -
----
----
---
----
----
----
- H
EN
RY
HA
GG
LA
KE
---
----
----
----
----
----
----
----
----
----
- T
UA
LA
TIN
RIV
ER
---
----
----
----
----
----
-- W
EA
TH
ER
---
----
----
---
WA
TE
R D
EL
IVE
RIE
S -
----
----
----
----
SC
HO
SC
LO
TA
NO
TO
TA
L W
.S.
ST
OR
CH
NG
CH
NG
CO
MP
GA
SO
DLLO
GO
LF
RO
OD
FR
MO
WS
LO
T
EM
PT
VID
US
ALO
HLS
FG
BV
RO
TH
INF
LO
EL
EV
CO
NT
ST
OR
ST
OR
RE
LIN
FL
O P
RE
CM
AX
MIN
CW
S
DA
Y C
FS
CF
SC
FS
CF
S F
TA
FA
FC
FS
CF
S C
FS
CF
S C
FS
CF
SC
FS
CF
SC
FS
INC
HF
F C
FS
CF
SC
FS
CF
SC
FS
C
FS
CF
S
(1)
(2)
(3)
(4)
(5)
(6)
(7)
(8)
(9)
(10)
(11)
(12)
(13)
(14)
(15)
(16)
(17)
(18)
(19)
(20)
(21)
(22)
(23)
(24)
(25)
(26)
20
50
4
12
51
82
68
.99
20
42
4-8
0-4
06
12
15
51
32
85
18
22
39
33
80
.38
60
38
30
06
12
30
2
22
41
72
68
.81
20
28
0-1
44
-73
61
-12
53
12
58
41
15
17
13
45
0.0
06
23
73
10
61
05
02
32
51
82
68
.66
20
16
1-1
19
-60
78
18
52
14
68
51
05
14
62
87
0.1
16
73
61
53
26
14
10
2
42
51
82
68
.44
19
98
6-1
75
-88
10
11
35
51
66
11
41
52
20
23
23
0.2
35
54
81
66
06
04
61
52
41
72
68
.15
19
75
7-2
29
-11
51
16
15
61
77
12
81
33
19
43
41
0.0
16
25
21
28
06
04
61
62
41
72
67
.88
19
54
5-2
12
-10
71
15
85
31
75
13
11
28
19
13
27
0.0
06
44
91
18
06
03
71
72
41
72
67
.60
19
32
5-2
20
-11
11
15
45
21
74
12
81
26
18
13
17
0.0
07
24
91
18
06
03
71
82
41
72
67
.32
19
10
6-2
19
-11
01
15
55
41
76
12
01
16
17
43
06
0.0
07
14
51
18
06
03
71
92
41
72
67
.02
18
87
3-2
33
-11
71
15
-25
31
77
11
71
12
16
32
87
0.0
07
04
91
18
06
03
71
10
24
17
26
6.7
51
86
64
-20
9-1
05
11
51
04
81
78
13
01
17
16
72
61
0.0
07
04
41
18
06
03
71
11
24
17
26
6.4
41
84
25
-23
9-1
20
12
11
49
18
11
28
11
71
66
26
10
.00
64
35
11
80
61
41
11
12
14
16
26
6.0
91
81
56
-26
9-1
36
13
93
42
19
11
48
11
31
62
25
80
.00
62
38
25
80
21
23
10
1
13
14
16
26
5.7
11
78
66
-29
0-1
46
14
0-6
42
19
31
38
12
11
74
25
50
.00
69
42
26
80
21
04
11
1
14
14
16
26
5.3
71
76
08
-25
8-1
30
14
01
04
11
91
13
61
22
17
42
74
0.0
07
34
22
68
02
10
41
11
15
14
16
26
5.0
01
73
28
-28
0-1
41
13
5-6
42
19
01
33
11
71
67
26
80
.00
74
43
23
80
09
51
11
16
13
15
26
4.6
51
70
65
-26
3-1
33
13
74
41
19
11
28
11
51
66
25
80
.00
78
49
26
80
09
51
11
17
13
15
26
4.3
11
68
11
-25
4-1
28
13
91
14
01
93
13
21
12
16
22
55
0.0
08
04
42
88
00
13
48
1
18
12
14
26
3.9
41
65
36
-27
5-1
39
13
90
41
19
01
29
11
21
59
25
20
.00
75
44
29
80
01
04
11
1
19
13
15
26
3.5
71
62
62
-27
4-1
38
13
91
40
19
11
44
11
61
65
25
20
.00
60
48
27
80
01
14
10
1
20
23
16
26
3.2
01
59
90
-27
2-1
37
13
92
40
19
31
50
11
91
72
25
80
.00
62
54
26
80
01
34
81
21
24
17
26
2.8
61
57
42
-24
8-1
25
13
81
34
11
93
14
71
24
17
92
71
0.0
06
34
92
58
00
10
41
11
22
24
17
26
2.5
21
54
95
-24
7-1
25
13
81
34
11
98
16
61
19
17
32
80
0.0
06
24
92
58
00
10
41
11
23
24
17
26
2.1
41
52
20
-27
5-1
39
13
1-8
41
19
11
48
12
21
75
27
10
.00
68
44
18
80
01
04
11
1
24
24
17
26
1.7
81
49
62
-25
8-1
30
13
0-0
40
19
01
49
11
61
71
28
00
.00
69
34
17
80
01
24
91
25
14
16
26
1.4
41
47
19
-24
3-1
23
13
07
41
19
31
41
11
71
68
27
10
.00
69
34
18
80
01
24
91
26
24
17
26
1.0
81
44
62
-25
7-1
30
13
00
29
18
51
51
11
51
69
26
40
.00
64
38
17
80
01
14
10
1
27
24
17
26
0.7
01
41
93
-26
9-1
36
13
0-6
28
17
61
30
11
41
67
26
40
.00
59
38
17
80
01
14
10
1
28
24
17
26
0.3
61
39
54
-23
9-1
20
12
99
28
17
61
31
11
31
62
26
40
.00
50
38
16
80
01
14
10
1
29
24
17
26
0.0
21
37
17
-23
7-1
19
12
89
28
17
61
32
11
01
61
26
10
.00
58
38
15
80
01
14
10
1
30
24
17
25
9.6
81
34
80
-23
7-1
19
11
8-1
28
16
71
35
11
01
58
25
50
.00
56
32
15
70
01
14
10
1
31
24
17
25
9.3
61
32
58
-22
2-1
12
10
8-4
28
15
91
16
11
01
59
24
90
.00
49
31
15
60
01
14
11
1
TO
T0
.73
CF
S5
31
21
31
20
5-3
65
33
77
01
17
13
22
55
34
40
34
37
20
53
37
86
53
MA
X8
05
46
04
22
22
72
24
11
20
27
13
4
AF
10
52
40
61
40
7-7
24
6-7
24
67
47
82
32
26
22
10
97
78
00
17
37
91
05
86
17
16
3M
IN4
93
11
19
84
40
71
43
47
82
38
53
86
7
RE
SE
RV
OIR
ST
OR
AG
ES
NO
TE
L S
UM
MA
RY
FO
R W
AT
ER
YE
AR
20
02
RE
SE
RV
OIR
DE
LIV
ER
Y S
TA
TU
SU
SE
DR
EM
AIN
ING
ST
AT
US
:O
cto
ber
31, 2002
Up
da
ted
:Octo
be
r 3
1,
20
02
D
ate:
Oct
ob
er 3
1,2
00
2T
VID
18
71
6
Tim
e:
0800 h
rs
S
EC
O:
W/Y
pc:
0.3
"sn
o d
ep
th/w
ate
r co
nte
nt:
0C
WS
11
74
18
77
SD
MO
: W
/Y p
c:
0
.3"
sn
o d
ep
th/w
ate
r co
nte
nt
0
Th
ese
allo
ca
tio
ns,
am
ou
nts
use
d a
nd
re
ma
inin
gL
O4
96
4
are
pro
vis
ion
al a
nd
su
bje
ct
to d
aily
ch
an
ge
as
HL
SB
O3
06
71
93
3
Wate
r sto
rag
e e
levati
on
+/-
to
fill cu
rve:
-44.1
4M
inim
um
Req
uir
ed
Dis
ch
arg
es
th
e W
S e
lv.
rise
s a
nd
fa
lls.
Th
ese
nu
mb
ers
are
FG
13
95
31
05
Wate
r sto
rag
e in
acre
ft
+/-
to
fill cu
rve:
-40382
De
c -
Se
pt:
1
0 c
fs
f
or
pla
nn
ing
pu
rpo
se
s o
nly
.B
VT
N3
20
08
00
Pe
rce
nta
ge
of
full
re
se
rvo
ir:
24
.7%
Oct -
Nov: 2
0 c
fsO
ther
882

APPENDIX C—Scoggins Reservoir Operations Monthly ReportsC-12 2002 Tualatin River Flow Management Report
SC
OG
GIN
S D
AM
- R
ES
ER
VO
IR O
PE
RA
TIO
NS
For
the M
onth
of
Novem
ber
2002
File
:1
10
2
----
---
INF
LO
W -
----
----
---
----
----
----
- H
EN
RY
HA
GG
LA
KE
---
----
----
----
----
----
----
----
----
----
- T
UA
LA
TIN
RIV
ER
---
----
----
----
----
----
-- W
EA
TH
ER
---
----
----
---
WA
TE
R D
EL
IVE
RIE
S -
----
----
----
----
SC
HO
SC
LO
TA
NO
TO
TA
L W
.S.
ST
OR
CH
NG
CH
NG
CO
MP
GA
SO
DLLO
GO
LF
RO
OD
FR
MO
WS
LO
T
EM
PT
VID
US
ALO
HLS
FG
BV
RO
TH
INF
LO
EL
EV
CO
NT
ST
OR
ST
OR
RE
LIN
FL
O P
RE
CM
AX
MIN
CW
S
DA
Y C
FS
CF
SC
FS
CF
S F
TA
FA
FC
FS
CF
S C
FS
CF
S C
FS
CF
SC
FS
CF
SC
FS
INC
HF
F C
FS
CF
SC
FS
CF
SC
FS
C
FS
CF
S
(1)
(2)
(3)
(4)
(5)
(6)
(7)
(8)
(9)
(10)
(11)
(12)
(13)
(14)
(15)
(16)
(17)
(18)
(19)
(20)
(21)
(22)
(23)
(24)
(25)
(26)
13
25
8
12
41
72
59
.09
13
07
2-1
86
-94
97
32
91
48
12
31
01
14
72
41
0.0
05
13
19
60
01
12
71
22
41
72
58
.86
12
91
8-1
54
-78
88
10
28
13
69
91
01
14
72
47
0.0
05
52
61
05
00
83
91
32
41
72
58
.63
12
75
6-1
62
-82
88
62
81
36
94
95
14
32
47
0.0
05
62
81
05
00
74
91
42
51
82
58
.35
12
56
6-1
90
-96
87
-93
01
39
11
09
61
41
23
80
.00
59
34
95
00
74
91
52
51
82
58
.14
12
42
4-1
42
-72
87
15
26
13
89
81
03
14
72
38
0.0
25
73
38
50
07
31
01
62
51
82
57
.93
12
28
2-1
42
-72
87
15
30
13
81
04
10
11
44
24
10
.09
58
40
85
00
92
91
73
51
92
57
.64
12
08
8-1
94
-98
86
-12
31
14
01
18
10
41
47
24
70
.09
52
42
85
00
82
10
1
81
52
12
38
25
7.5
21
20
08
-80
-40
86
46
76
17
91
52
14
01
86
35
90
.95
52
46
85
00
73
10
19
10
29
24
12
57
.55
12
02
82
01
02
93
96
21
22
17
02
07
25
54
05
0.0
04
64
58
32
07
49
0
10
18
26
24
62
57
.65
12
09
56
73
42
96
37
41
41
20
92
71
35
05
50
0.0
04
74
47
00
65
90
11
13
24
23
92
57
.66
12
10
27
42
93
37
01
20
13
72
46
32
55
27
0.0
05
04
47
00
74
90
12
91
92
30
25
7.6
81
21
15
13
72
93
65
21
07
14
01
85
25
64
77
1.7
75
34
59
00
00
00
13
20
32
25
42
57
.82
12
20
89
34
72
47
19
31
29
14
62
17
28
75
55
0.4
65
64
64
00
00
00
14
21
37
36
12
57
.91
12
26
96
13
12
45
56
31
10
17
52
43
28
45
08
0.3
15
34
34
00
00
00
15
10
25
23
72
57
.98
12
31
54
62
32
44
74
51
01
16
62
39
31
74
94
0.0
25
03
84
00
00
00
16
10
33
24
52
58
.04
12
35
64
12
12
44
52
97
87
81
69
24
44
72
0.0
04
94
04
00
00
00
17
15
26
24
32
58
.06
12
36
91
37
23
30
43
96
65
12
51
91
37
10
.00
52
38
30
00
00
0
18
11
23
23
62
58
.06
12
36
90
02
32
34
08
91
12
12
11
75
33
80
.29
50
39
30
00
00
0
19
40
49
49
32
58
.15
12
43
16
23
12
45
59
38
37
61
25
18
33
30
0.3
75
14
34
00
00
00
20
17
21
24
02
58
.27
12
51
28
14
12
36
49
31
49
22
71
23
17
63
13
0.0
05
64
43
00
00
00
21
12
16
23
02
58
.30
12
53
22
01
02
33
34
99
71
39
17
42
34
31
30
.00
66
44
30
00
00
0
22
91
11
21
25
8.3
21
25
46
14
72
33
03
47
77
91
25
18
93
48
0.0
05
84
23
00
00
00
23
81
21
21
25
8.3
21
25
46
00
22
22
28
69
59
10
81
59
31
00
.00
49
45
30
00
00
0
24
71
11
19
25
8.3
41
25
59
13
72
22
92
46
14
51
00
14
32
69
0.0
05
14
33
00
00
00
25
59
11
52
58
.34
12
55
90
02
22
22
25
63
89
31
34
24
70
.00
50
30
30
00
00
0
26
58
11
42
58
.34
12
55
90
03
73
72
07
12
98
91
24
22
10
.00
57
29
30
013
16
0
27
57
11
32
58
.28
12
51
8-4
1-2
14
42
31
97
64
78
51
18
20
80
.00
53
28
10
00
14
25
0
28
57
11
32
58
.21
12
47
1-4
7-2
44
42
01
77
64
58
91
26
20
00
.00
52
31
10
00
13
26
0
29
46
11
12
58
.12
12
41
0-6
1-3
14
41
31
77
44
48
91
26
20
30
.00
54
33
11
00
14
26
0
30
46
11
12
58
.04
12
35
8-5
2-2
64
41
81
66
64
58
81
25
20
30
.00
52
33
11
00
14
26
0
31
NA
NA
TO
T4
.37
CF
S2
88
49
04
78
25
-45
41
33
68
82
12
81
32
02
31
69
41
52
57
23
99
20
MA
X6
64
61
90
44
20
15
24
51
29
8
AF
57
19
72
93
16
36
-90
0-9
00
26
50
17
50
25
41
63
51
62
86
82
35
11
35
21
96
76
MIN
46
26
37
78
77
03
01
89
25
61
6
RE
SE
RV
OIR
ST
OR
AG
ES
NO
TE
L S
UM
MA
RY
FO
R W
AT
ER
YE
AR
20
02
RE
SE
RV
OIR
DE
LIV
ER
Y S
TA
TU
SU
SE
DR
EM
AIN
ING
ST
AT
US
:N
ove
mb
er
30
, 2
00
2U
pd
ate
d:N
ove
mb
er
30
, 2
00
2
Dat
e:N
ov
emb
er 3
0,
20
02
TV
ID1
90
93
Tim
e:
0800 h
rs
S
EC
O:
W/Y
pc:
8.1
" sn
o d
ep
th/w
ate
r co
nte
nt:
0U
SA
12
61
80
SD
MO
: W
/Y p
c: 6
.3"
sn
o d
ep
th/w
ate
r co
nte
nt
0
Th
ese
allo
ca
tio
ns,
am
ou
nts
use
d a
nd
re
ma
inin
gL
O4
96
4
are
pro
vis
ion
al a
nd
su
bje
ct
to d
aily
ch
an
ge
as
HL
SB
O3
36
81
63
2
Wate
r sto
rag
e e
levati
on
+/-
to
fill cu
rve:
-25.4
6M
inim
um
Req
uir
ed
Dis
ch
arg
es
th
e W
S e
lv.
rise
s a
nd
fa
lls.
Th
ese
nu
mb
ers
are
FG
14
84
30
16
Wate
r sto
rag
e in
acre
ft
+/-
to
fill cu
rve:
-20682
De
c -
Se
pt:
1
0 c
fs
a
re f
or
pla
nn
ing
pu
rpo
se
s o
nly
.B
VT
N3
45
65
44
Pe
rce
nta
ge
of
full
re
se
rvo
ir:
23
.0%
Oct -
Nov: 2
0 c
fsO
ther
898
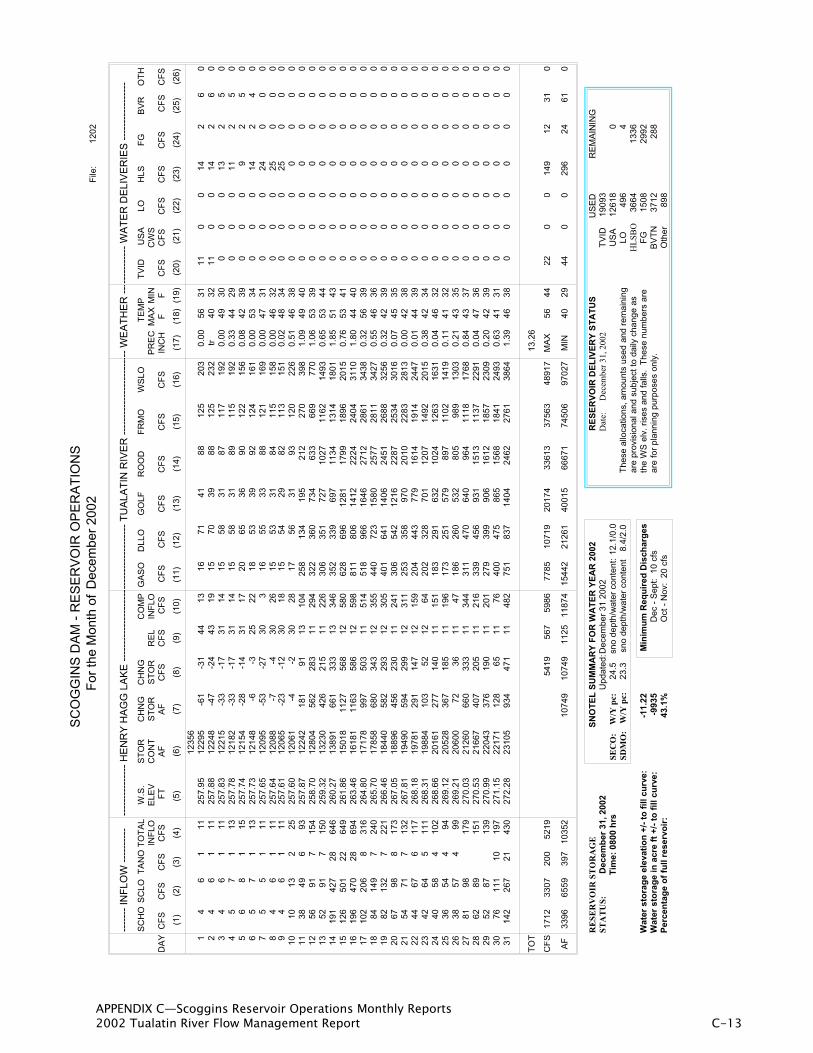
APPENDIX C—Scoggins Reservoir Operations Monthly Reports2002 Tualatin River Flow Management Report C-13
SC
OG
GIN
S D
AM
- R
ES
ER
VO
IR O
PE
RA
TIO
NS
For
the M
onth
of
Decem
ber
2002
File
:1
20
2
----
---
INF
LO
W -
----
----
---
----
----
----
- H
EN
RY
HA
GG
LA
KE
---
----
----
----
----
----
----
----
----
----
- T
UA
LA
TIN
RIV
ER
---
----
----
----
----
----
-- W
EA
TH
ER
---
----
----
---
WA
TE
R D
EL
IVE
RIE
S -
----
----
----
----
SC
HO
SC
LO
TA
NO
TO
TA
L W
.S.
ST
OR
CH
NG
CH
NG
CO
MP
GA
SO
DLLO
GO
LF
RO
OD
FR
MO
WS
LO
T
EM
PT
VID
US
ALO
HLS
FG
BV
RO
TH
INF
LO
EL
EV
CO
NT
ST
OR
ST
OR
RE
LIN
FL
O P
RE
CM
AX
MIN
CW
S
DA
Y C
FS
CF
SC
FS
CF
S F
TA
FA
FC
FS
CF
S C
FS
CF
S C
FS
CF
SC
FS
CF
SC
FS
INC
HF
F C
FS
CF
SC
FS
CF
SC
FS
C
FS
CF
S
(1)
(2)
(3)
(4)
(5)
(6)
(7)
(8)
(9)
(10)
(11)
(12)
(13)
(14)
(15)
(16)
(17)
(18)
(19)
(20)
(21)
(22)
(23)
(24)
(25)
(26)
12
35
6
14
61
11
25
7.9
51
22
95
-61
-31
44
13
16
71
41
88
12
52
03
0.0
05
63
11
10
01
42
60
24
61
11
25
7.8
81
22
48
-47
-24
43
19
15
70
39
88
12
52
32
tr4
03
21
10
01
42
60
34
61
11
25
7.8
31
22
15
-33
-17
31
14
15
58
31
87
11
71
92
0.0
04
930
00
013
25
0
45
71
13
25
7.7
81
21
82
-33
-17
31
14
15
58
31
89
11
51
92
0.3
34
42
90
00
11
25
0
56
81
15
25
7.7
41
21
54
-28
-14
31
17
20
65
36
90
12
21
56
0.0
84
23
90
00
92
50
65
71
13
25
7.7
31
21
48
-6-3
25
22
18
53
39
92
12
41
61
0.0
05
33
40
00
14
24
0
75
51
11
25
7.6
51
20
95
-53
-27
30
31
65
53
38
81
21
16
90
.00
47
31
00
024
00
0
84
61
11
25
7.6
41
20
88
-7-4
30
26
15
53
31
84
11
51
58
0.0
04
63
20
00
25
00
09
46
11
12
57
.61
12
06
5-2
3-1
23
01
81
55
42
98
21
13
15
10
.02
48
34
00
025
00
0
10
10
13
22
52
57
.60
12
06
1-4
-23
02
81
75
63
19
31
20
22
60
.51
46
38
00
00
00
0
11
38
49
69
32
57
.87
12
24
21
81
91
13
10
42
58
13
41
95
21
22
70
39
81
.09
49
40
00
00
00
0
12
56
91
71
54
25
8.7
01
28
04
56
22
83
11
29
43
22
36
07
34
63
36
69
77
01
.06
53
39
00
00
00
0
13
52
91
71
50
25
9.3
21
32
30
42
62
15
11
22
63
06
35
17
27
10
27
11
62
14
93
0.6
55
34
40
00
00
00
14
19
14
27
28
64
62
60
.27
13
89
16
61
33
31
33
46
35
23
39
69
71
13
41
31
41
80
11
.85
51
43
00
00
00
0
15
12
65
01
22
64
92
61
.86
15
01
81
12
75
68
12
58
06
28
69
61
28
11
79
91
89
62
01
50
.76
53
41
00
00
00
0
16
19
64
70
28
69
42
63
.46
16
18
11
16
35
86
12
59
88
11
80
61
41
22
22
42
40
43
11
01
.80
44
40
00
00
00
0
17
10
22
06
83
16
26
4.8
01
71
78
99
75
03
11
51
45
18
96
61
64
62
71
22
86
13
43
80
.32
56
39
00
00
00
0
18
84
14
97
24
02
65
.70
17
85
86
80
34
31
23
55
44
07
23
15
80
25
77
28
11
34
27
0.5
54
63
60
00
00
00
19
82
13
27
22
12
66
.46
18
44
05
82
29
31
23
05
40
16
41
14
06
24
51
26
88
32
56
0.3
24
23
90
00
00
00
20
67
98
81
73
26
7.0
51
88
96
45
62
30
11
24
13
06
54
21
21
62
28
72
53
43
01
60
.07
45
35
00
00
00
0
21
54
71
71
32
26
7.8
11
94
90
59
42
99
12
31
12
53
35
89
70
20
10
22
83
28
13
0.0
04
23
80
00
00
00
22
44
67
61
17
26
8.1
81
97
81
29
11
47
12
15
92
04
44
37
79
16
14
19
14
24
47
0.0
14
43
90
00
00
00
23
42
64
51
11
26
8.3
11
98
84
10
35
21
26
42
02
32
87
01
12
07
14
92
20
15
0.3
84
23
40
00
00
00
24
40
58
41
02
26
8.6
62
01
61
27
71
40
11
15
11
83
29
16
32
10
24
12
63
16
31
0.0
44
63
20
00
00
00
25
36
54
49
42
69
.12
20
52
83
67
18
51
11
96
17
32
51
57
98
97
11
02
14
19
0.1
14
13
20
00
00
00
26
38
57
49
92
69
.21
20
60
07
23
61
14
71
86
26
05
32
80
59
89
13
03
0.2
14
33
50
00
00
00
27
81
98
17
92
70
.03
21
26
06
60
33
31
13
44
31
14
70
64
09
64
11
18
17
68
0.8
44
33
70
00
00
00
28
62
89
15
12
70
.53
21
66
74
07
20
51
12
16
33
94
56
93
11
51
31
13
72
29
10
.04
47
36
00
00
00
0
29
52
87
13
92
70
.99
22
04
33
76
19
01
12
01
27
93
99
90
61
61
21
85
72
30
90
.20
42
39
00
00
00
0
30
76
11
11
01
97
27
1.1
52
21
71
12
86
51
17
64
00
47
58
65
15
68
18
41
24
93
0.6
34
13
10
00
00
00
31
14
22
67
21
43
02
72
.28
23
10
59
34
47
11
14
82
75
18
37
14
04
24
62
27
61
38
64
1.3
94
63
80
00
00
00
TO
T1
3.2
6
CF
S1
71
23
30
72
00
52
19
54
19
56
75
98
67
78
51
07
19
20
17
43
36
13
37
56
34
89
17
MA
X5
64
42
20
01
49
12
31
0
AF
33
96
65
59
39
71
03
52
10
74
91
07
49
11
25
11
87
41
54
42
21
26
14
00
15
66
67
17
45
06
97
02
7M
IN4
02
94
40
02
96
24
61
0
RE
SE
RV
OIR
ST
OR
AG
ES
NO
TE
L S
UM
MA
RY
FO
R W
AT
ER
YE
AR
20
02
RE
SE
RV
OIR
DE
LIV
ER
Y S
TA
TU
SU
SE
DR
EM
AIN
ING
ST
AT
US
:D
ec
em
be
r 3
1,
20
02
Up
da
ted
:De
ce
mb
er
31
20
02
D
ate:
Dec
emb
er 3
1,
20
02
TV
ID1
90
93
Tim
e:
0800 h
rs
S
EC
O:
W/Y
pc:
24
.5sn
o d
ep
th/w
ate
r co
nte
nt:
12
.1/0
.0U
SA
12
61
80
SD
MO
: W
/Y p
c: 2
3.3
sn
o d
ep
th/w
ate
r co
nte
nt
8
.4/2
.0
T
he
se
allo
ca
tio
ns,
am
ou
nts
use
d a
nd
re
ma
inin
gL
O4
96
4
are
pro
vis
ion
al a
nd
su
bje
ct
to d
aily
ch
an
ge
as
HL
SB
O3
66
41
33
6
Wate
r sto
rag
e e
levati
on
+/-
to
fill cu
rve:
-11.2
2M
inim
um
Req
uir
ed
Dis
ch
arg
es
th
e W
S e
lv.
rise
s a
nd
fa
lls.
Th
ese
nu
mb
ers
are
FG
15
08
29
92
Wate
r sto
rag
e in
acre
ft
+/-
to
fill cu
rve:
-9935
De
c -
Se
pt:
1
0 c
fs
a
re f
or
pla
nn
ing
pu
rpo
se
s o
nly
.B
VT
N3
71
22
88
Pe
rce
nta
ge
of
full
re
se
rvo
ir:
43
.1%
Oct -
Nov: 2
0 c
fsO
ther
898

Appendix DAppendix DAppendix DAppendix D
Barney Reservoir OperationsBarney Reservoir OperationsBarney Reservoir OperationsBarney Reservoir OperationsMonthly RecordsMonthly RecordsMonthly RecordsMonthly Records

APPENDIX D—Barney Reservoir Operations Monthly ReportsD-2 2002 Tualatin River Flow Management Report
BA
RN
EY
RE
SE
RV
OIR
OP
ER
AT
ION
S F
OR
TH
E M
ON
TH
OF
JA
NU
AR
Y 2
002
DAY
SURF
ACE
ELEV
ATIO
NST
OR
AGE
CHAN
GE
INST
OR
AGE
RAI
N @
BA
RNEY
MEA
SURE
D FL
OW T
OST
OR
AGE
REL
EASE
D TO
TR
ASK
—O
DFW
STO
RAG
E RE
LEAS
ED T
O T
UALA
TIN
BRE
AKD
OW
N O
F M
UNCI
PAL
USE
BY
WAT
ER P
RO
VID
ER
TRA
SKTU
ALAT
INC
WS
MUN
ICIP
ALH
ILLS
BO
RO
FORE
ST G
RO
VEB
EAVE
RTO
NTV
WD
feet
ac-ft
ac-ft
in.
cfs
cfs
cfs
ac-ft
cfs
ac-ft
cfs
ac-ft
cfs
ac-ft
cfs
ac-ft
cfs
ac-ft
cfs
ac-ft
10
00
00
00.
000
0.00
00.
000
0.00
0
216
33.5
1706
394
0.84
1.4
0.0
00
00
00
0.00
00.
000
0.00
00.
000
30
00
00
00.
000
0.00
00.
000
0.00
0
416
33.9
1721
315
00.
541.
40.
00
00
00
00.
000
0.00
00.
000
0.00
0
50
00
00
00.
000
0.00
00.
000
0.00
0
60
00
00
00.
000
0.00
00.
000
0.00
0
716
35.6
1785
063
72.
155.
20.
00
00
00
00.
000
0.00
00.
000
0.00
0
80
00
00
00.
000
0.00
00.
000
0.00
0
916
38.2
1908
012
301.
803.
50.
00
00
00
00.
000
0.00
00.
000
0.00
0
100
00
00
00.
000
0.00
00.
000
0.00
0
1116
39.1
1944
036
00.
052.
90.
00
00
00
00.
000
0.00
00.
000
0.00
0
120
00
00
00.
000
0.00
00.
000
0.00
0
130
00
00
00.
000
0.00
00.
000
0.00
0
140
00
00
00.
000
0.00
00.
000
0.00
0
1516
40.4
1996
052
01.
252.
00.
00
00
00
00.
000
0.00
00.
000
0.00
0
1616
40.6
2000
040
0.00
9.4
0.0
00
00
00
0.00
00.
000
0.00
00.
000
170
00
00
00.
000
0.00
00.
000
0.00
0
1816
40.7
2000
00
0.32
143.
90.
00
00
00
00.
000
0.00
00.
000
0.00
0
190
00
00
00.
000
0.00
00.
000
0.00
0
200
00
00
00.
000
0.00
00.
000
0.00
0
2116
41.0
2000
00
1.85
144.
00.
00
00
00
00.
000
0.00
00.
000
0.00
0
220
00
00
00.
000
0.00
00.
000
0.00
0
2316
40.8
2000
00
1.10
80.8
0.0
00
00
00
0.00
00.
000
0.00
00.
000
240
00
00
00.
000
0.00
00.
000
0.00
0
2516
41.3
2000
00
1.95
325.
80.
00
00
00
00.
000
0.00
00.
000
0.00
0
260
00
00
00.
000
0.00
00.
000
0.00
0
270
00
00
00.
000
0.00
00.
000
0.00
0
2816
40.8
2000
00
0.44
93.1
0.0
00
00
00
0.00
00.
000
0.00
00.
000
290
00
00
00.
000
0.00
00.
000
0.00
0
3016
40.7
2000
00
0.14
68.2
0.0
00
00
00
0.00
00.
000
0.00
00.
000
310
00
00
00.
000
0.00
00.
000
0.00
0
Mon
thly
Tot
als
3125
12.4
30
00
00
00
Yea
r to
Dat
e To
tals
3125
12.4
30
00
00
00

APPENDIX D—Barney Reservoir Operations Monthly Reports2002 Tualatin River Flow Management Report D-3
BA
RN
EY
RE
SE
RV
OIR
OP
ER
AT
ION
S F
OR
TH
E M
ON
TH
OF
FE
BR
UA
RY
200
2
DAY
SURF
ACE
ELEV
ATIO
NST
OR
AGE
CHAN
GE
INST
OR
AGE
RAI
N @
BA
RNEY
MEA
SURE
D FL
OW T
OST
OR
AGE
REL
EASE
D TO
TR
ASK
—O
DFW
STO
RAG
E RE
LEAS
ED T
O T
UALA
TIN
BRE
AKD
OW
N O
F M
UNCI
PAL
USE
BY
WAT
ER P
RO
VID
ER
TRA
SKTU
ALAT
INC
WS
MUN
ICIP
ALH
ILLS
BO
RO
FORE
ST G
RO
VEB
EAVE
RTO
NTV
WD
feet
ac-ft
ac-ft
in.
cfs
cfs
cfs
ac-ft
cfs
ac-ft
cfs
ac-ft
cfs
ac-ft
cfs
ac-ft
cfs
ac-ft
cfs
ac-ft
116
40.7
2000
00
0.74
67.2
0.0
00
00
00
0.00
00.
000
0.00
00.
000
20
00
00
00.
000
0.00
00.
000
0.00
0
30
00
00
00.
000
0.00
00.
000
0.00
0
416
40.7
2000
00
1.60
62.0
0.0
00
00
00
0.00
00.
000
0.00
00.
000
50
00
00
00.
000
0.00
00.
000
0.00
0
616
40.7
2000
00
0.64
61.2
0.0
00
00
00
0.00
00.
000
0.00
00.
000
70
00
00
00.
000
0.00
00.
000
0.00
0
816
40.9
2000
00
1.95
128.
90.
00
00
00
00.
000
0.00
00.
000
0.00
0
90
00
00
00.
000
0.00
00.
000
0.00
0
100
00
00
00.
000
0.00
00.
000
0.00
0
1116
40.8
2000
00
0.64
75.1
0.0
00
00
00
0.00
00.
000
0.00
00.
000
120
00
00
00.
000
0.00
00.
000
0.00
0
1316
40.7
2000
00
0.00
58.1
0.0
00
00
00
0.00
00.
000
0.00
00.
000
140
00
00
00.
000
0.00
00.
000
0.00
0
1516
40.7
2000
00
0.00
50.4
0.0
00
00
00
0.00
00.
000
0.00
00.
000
160
00
00
00.
000
0.00
00.
000
0.00
0
170
00
00
00.
000
0.00
00.
000
0.00
0
1816
40.7
2000
00
0.20
51.1
0.0
00
00
00
0.00
00.
000
0.00
00.
000
1916
40.8
2000
00
0.94
83.4
0.0
00
00
00
0.00
00.
000
0.00
00.
000
200
00
00
00.
000
0.00
00.
000
0.00
0
210
00
00
00.
000
0.00
00.
000
0.00
0
2216
40.8
2000
00
0.62
108.
70.
00
00
00
00.
000
0.00
00.
000
0.00
0
230
00
00
00.
000
0.00
00.
000
0.00
0
240
00
00
00.
000
0.00
00.
000
0.00
0
2516
40.6
2000
00
0.50
93.3
0.0
00
00
00
0.00
00.
000
0.00
00.
000
260
00
00
00.
000
0.00
00.
000
0.00
0
270
00
00
00.
000
0.00
00.
000
0.00
0
2816
40.5
2000
00
0.15
45.6
0.0
00
00
00
0.00
00.
000
0.00
00.
000
Mon
thly
Tot
als
07.
980
00
00
00
Yea
r to
Dat
e To
tals
3125
20.4
10
00
00
00

APPENDIX D—Barney Reservoir Operations Monthly ReportsD-4 2002 Tualatin River Flow Management Report
BA
RN
EY
RE
SE
RV
OIR
OP
ER
AT
ION
S F
OR
TH
E M
ON
TH
OF
MA
RC
H 2
002
DAY
SURF
ACE
ELEV
ATIO
NST
OR
AGE
CHAN
GE
INST
OR
AGE
RAI
N @
BA
RNEY
MEA
SURE
D FL
OW T
OR
ELEA
SED
TO
TRAS
K—
OD
FWST
OR
AGE
RELE
ASED
TO
TUA
LATI
NB
REA
KDO
WN
OF
MUN
CIPA
L U
SE B
Y W
ATER
PR
OVI
DER
TRA
SKTU
ALAT
INC
WS
MUN
ICIP
ALH
ILLS
BO
RO
FORE
ST G
RO
VEB
EAVE
RTO
NTV
WD
feet
ac-ft
ac-ft
in.
cfs
cfs
cfs
ac-ft
cfs
ac-ft
cfs
ac-ft
cfs
ac-ft
cfs
ac-ft
cfs
ac-ft
cfs
ac-ft
116
40.6
2000
00
0.00
17.1
0.0
00
00
00
0.00
00.
000
0.00
00.
000
20
00
00
00.
000
0.00
00.
000
0.00
0
30
00
00
00.
000
0.00
00.
000
0.00
0
416
40.5
2000
00
0.00
30.6
0.0
00
00
00
0.00
00.
000
0.00
00.
000
50
00
00
00.
000
0.00
00.
000
0.00
0
616
40.7
2000
00
0.90
46.8
0.0
00
00
00
0.00
00.
000
0.00
00.
000
70
00
00
00.
000
0.00
00.
000
0.00
0
816
40.7
2000
00
0.20
36.0
0.0
00
00
00
0.00
00.
000
0.00
00.
000
90
00
00
00.
000
0.00
00.
000
0.00
0
100
00
00
00.
000
0.00
00.
000
0.00
0
1116
40.9
2000
00
2.00
138.
80.
00
00
00
00.
000
0.00
00.
000
0.00
0
120
00
00
00.
000
0.00
00.
000
0.00
0
1316
40.8
2000
00
1.70
135.
20.
00
00
00
00.
000
0.00
00.
000
0.00
0
140
00
00
00.
000
0.00
00.
000
0.00
0
1516
40.8
2000
00
0.50
84.8
0.0
00
00
00
0.00
00.
000
0.00
00.
000
160
00
00
00.
000
0.00
00.
000
0.00
0
170
00
00
00.
000
0.00
00.
000
0.00
0
1816
40.9
2000
00
0.80
55.9
0.0
00
00
00
0.00
00.
000
0.00
00.
000
190
00
00
00.
000
0.00
00.
000
0.00
0
2016
40.8
2000
00
0.45
105.
90.
00
00
00
00.
000
0.00
00.
000
0.00
0
210
00
00
00.
000
0.00
00.
000
0.00
0
2216
40.7
2000
00
0.02
78.4
0.0
00
00
00
0.00
00.
000
0.00
00.
000
230
00
00
00.
000
0.00
00.
000
0.00
0
240
00
00
00.
000
0.00
00.
000
0.00
0
2516
40.7
2000
00
0.16
58.6
0.0
00
00
00
0.00
00.
000
0.00
00.
000
260
00
00
00.
000
0.00
00.
000
0.00
0
2716
40.7
2000
00
0.14
52.0
0.0
00
00
00
0.00
00.
000
0.00
00.
000
280
00
00
00.
000
0.00
00.
000
0.00
0
2916
40.7
2000
00
0.04
46.2
0.0
00
00
00
0.00
00.
000
0.00
00.
000
300
00
00
00.
000
0.00
00.
000
0.00
0
310
00
00
00.
000
0.00
00.
000
0.00
0
Mon
thly
Tot
als
06.
910
00
00
00
Yea
r to
Dat
e To
tals
3125
27.3
20
00
00
00

APPENDIX D—Barney Reservoir Operations Monthly Reports2002 Tualatin River Flow Management Report D-5
BA
RN
EY
RE
SE
RV
OIR
OP
ER
AT
ION
S F
OR
TH
E M
ON
TH
OF
AP
RIL
200
2
DAY
SURF
ACE
ELEV
ATIO
NST
OR
AGE
CHAN
GE
INST
OR
AGE
RAI
N @
BA
RNEY
MEA
SURE
D FL
OW T
OST
OR
AGE
REL
EASE
D TO
TR
ASK
—O
DFW
STO
RAG
E RE
LEAS
ED T
O T
UALA
TIN
BRE
AKD
OW
N O
F M
UNCI
PAL
USE
BY
WAT
ER P
RO
VID
ER
TRA
SKTU
ALAT
INC
WS
MUN
ICIP
ALH
ILLS
BO
RO
FORE
ST G
RO
VEB
EAVE
RTO
NTV
WD
feet
ac-ft
ac-ft
in.
cfs
cfs
cfs
ac-ft
cfs
ac-ft
cfs
ac-ft
cfs
ac-ft
cfs
ac-ft
cfs
ac-ft
cfs
ac-ft
116
40.7
2000
00
0.00
47.1
0.0
00
00
00
0.00
00.
000
0.00
00.
000
20
00
00
00.
000
0.00
00.
000
0.00
0
316
40.7
2000
00
0.00
45.0
0.0
00
00
00
0.00
00.
000
0.00
00.
000
40
00
00
00.
000
0.00
00.
000
0.00
0
516
40.7
2000
00
0.00
43.8
0.0
00
00
00
0.00
00.
000
0.00
00.
000
60
00
00
00.
000
0.00
00.
000
0.00
0
70
00
00
00.
000
0.00
00.
000
0.00
0
816
40.6
2000
00
0.24
38.3
0.0
00
00
00
0.00
00.
000
0.00
00.
000
90
00
00
00.
000
0.00
00.
000
0.00
0
1016
40.7
2000
00
1.45
68.5
0.0
00
00
00
0.00
00.
000
0.00
00.
000
110
00
00
00.
000
0.00
00.
000
0.00
0
1216
40.7
2000
00
0.70
54.7
0.0
00
00
00
0.00
00.
000
0.00
00.
000
130
00
00
00.
000
0.00
00.
000
0.00
0
140
00
00
00.
000
0.00
00.
000
0.00
0
1516
40.8
2000
00
1.70
79.3
0.0
00
00
00
0.00
00.
000
0.00
00.
000
160
00
00
00.
000
0.00
00.
000
0.00
0
1716
40.7
2000
00
0.90
67.0
0.0
00
00
00
0.00
00.
000
0.00
00.
000
180
00
00
00.
000
0.00
00.
000
0.00
0
1916
40.7
2000
00
0.10
53.0
0.0
00
00
00
0.00
00.
000
0.00
00.
000
200
00
00
00.
000
0.00
00.
000
0.00
0
210
00
00
00.
000
0.00
00.
000
0.00
0
2216
40.7
2000
00
0.00
41.0
0.0
00
00
00
0.00
00.
000
0.00
00.
000
230
00
00
00.
000
0.00
00.
000
0.00
0
2416
40.7
2000
00
0.00
38.0
0.0
00
00
00
0.00
00.
000
0.00
00.
000
250
00
00
00.
000
0.00
00.
000
0.00
0
2616
40.6
2000
00
0.00
33.8
0.0
00
00
00
0.00
00.
000
0.00
00.
000
270
00
00
00.
000
0.00
00.
000
0.00
0
280
00
00
00.
000
0.00
00.
000
0.00
0
2916
40.6
2000
00
0.30
21.8
0.0
00
00
00
0.00
00.
000
0.00
00.
000
300
00
00
00.
000
0.00
00.
000
0.00
0
Mon
thly
Tot
als
05.
390
00
00
00
Yea
r to
Dat
e To
tals
3125
32.7
10
00
00
00

APPENDIX D—Barney Reservoir Operations Monthly ReportsD-6 2002 Tualatin River Flow Management Report
BA
RN
EY
RE
SE
RV
OIR
OP
ER
AT
ION
S F
OR
TH
E M
ON
TH
OF
MA
Y 2
002
DAY
SURF
ACE
ELEV
ATIO
NST
OR
AGE
CHAN
GE
INST
OR
AGE
RAI
N @
BA
RNEY
MEA
SURE
D FL
OW T
OST
OR
AGE
REL
EASE
D TO
TR
ASK
—O
DFW
STO
RAG
E RE
LEAS
ED T
O T
UALA
TIN
BRE
AKD
OW
N O
F M
UNCI
PAL
USE
BY
WAT
ER P
RO
VID
ER
TRA
SKTU
ALAT
INC
WS
MUN
ICIP
ALH
ILLS
BO
RO
FORE
ST G
RO
VEB
EAVE
RTO
NTV
WD
feet
ac-ft
ac-ft
in.
cfs
cfs
cfs
ac-ft
cfs
ac-ft
cfs
ac-ft
cfs
ac-ft
cfs
ac-ft
cfs
ac-ft
cfs
ac-ft
116
40.7
2000
00
0.00
21.1
0.0
00
00
00
0.00
00.
000
0.00
00.
000
20
00
00
00.
000
0.00
00.
000
0.00
0
316
40.6
2000
00
0.07
18.7
0.0
00
00
00
0.00
00.
000
0.00
00.
000
40
00
00
00.
000
0.00
00.
000
0.00
0
50
00
00
00.
000
0.00
00.
000
0.00
0
616
40.7
2000
00
0.78
28.1
0.0
00
00
00
0.00
00.
000
0.00
00.
000
70
00
00
00.
000
0.00
00.
000
0.00
0
816
40.6
2000
00
0.17
17.8
0.0
00
00
00
0.00
00.
000
0.00
00.
000
90
00
00
00.
000
0.00
00.
000
0.00
0
1016
40.6
2000
00
0.02
15.3
0.0
00
00
00
0.00
00.
000
0.00
00.
000
110
00
00
00.
000
0.00
00.
000
0.00
0
120
00
00
00.
000
0.00
00.
000
0.00
0
1316
40.6
2000
00
0.10
15.8
0.0
00
00
00
0.00
00.
000
0.00
00.
000
140
00
00
00.
000
0.00
00.
000
0.00
0
1516
40.6
2000
00
0.16
15.5
0.0
00
00
00
0.00
00.
000
0.00
00.
000
160
00
00
00.
000
0.00
00.
000
0.00
0
1716
40.6
2000
00
0.10
14.3
0.0
00
00
00
0.00
00.
000
0.00
00.
000
180
00
00
00.
000
0.00
00.
000
0.00
0
190
00
00
00.
000
0.00
00.
000
0.00
0
2016
40.6
2000
00
0.32
15.1
0.0
00
00
00
0.00
00.
000
0.00
00.
000
210
00
00
00.
000
0.00
00.
000
0.00
0
2216
40.6
2000
00
0.10
13.2
0.0
00
00
00
0.00
00.
000
0.00
00.
000
230
00
00
00.
000
0.00
00.
000
0.00
0
2416
40.6
2000
00
0.00
11.9
0.0
00
00
00
0.00
00.
000
0.00
00.
000
250
00
00
00.
000
0.00
00.
000
0.00
0
260
00
00
00.
000
0.00
00.
000
0.00
0
2716
40.6
2000
00
0.00
12.0
0.0
00
00
00
0.00
00.
000
0.00
00.
000
280
00
00
00.
000
0.00
00.
000
0.00
0
2916
40.6
2000
00
0.94
19.5
0.0
00
00
00
0.00
00.
000
0.00
00.
000
3016
40.6
2000
00
0.00
12.3
0.0
00
00
00
0.00
00.
000
0.00
00.
000
310
00
00
00.
000
0.00
00.
000
0.00
0
Mon
thly
Tot
als
02.
760
00
00
00
Yea
r to
Dat
e To
tals
3125
35.4
70
00
00
00

APPENDIX D—Barney Reservoir Operations Monthly Reports2002 Tualatin River Flow Management Report D-7
BA
RN
EY
RE
SE
RV
OIR
OP
ER
AT
ION
S F
OR
TH
E M
ON
TH
OF
JU
NE
200
2
DAY
SURF
ACE
ELEV
ATIO
NST
OR
AGE
CHAN
GE
INST
OR
AGE
RAI
N @
BA
RNEY
MEA
SURE
D FL
OW T
OST
OR
AGE
REL
EASE
D TO
TR
ASK
—O
DFW
STO
RAG
E RE
LEAS
ED T
O T
UALA
TIN
BRE
AKD
OW
N O
F M
UNCI
PAL
USE
BY
WAT
ER P
RO
VID
ER
TRA
SKTU
ALAT
INC
WS
MUN
ICIP
ALH
ILLS
BO
RO
FORE
ST G
RO
VEB
EAVE
RTO
NTV
WD
feet
ac-ft
ac-ft
in.
cfs
cfs
cfs
ac-ft
cfs
ac-ft
cfs
ac-ft
cfs
ac-ft
cfs
ac-ft
cfs
ac-ft
cfs
ac-ft
10
00
00
00.
000
0.00
00.
000
0.00
0
20
00
00
00.
000
0.00
00.
000
0.00
0
316
40.6
2000
00
0.00
10.1
0.0
00
00
00
-9.5
4-1
90.
240
0.27
19.
0318
416
40.6
2000
00
0.00
15.6
14.0
816
00
1428
-0.6
0-1
0.02
00.
872
13.7
227
516
40.5
2000
00
0.02
9.0
16.0
816
00
1632
1.64
30.
080
0.61
113
.66
27
68
160
016
321.
723
0.06
00.
802
13.4
227
716
40.3
1992
0-8
00.
008.
918
.08
160
018
360.
882
0.19
00.
641
16.2
932
88
160
018
36-0
.39
-10.
531
0.54
117
.33
34
98
160
018
363.
307
0.73
10.
070
13.9
028
1016
40.1
1980
0-1
200.
368.
618
.08
160
018
365.
3711
0.48
10.
611
11.5
423
118
160
018
364.
699
0.58
10.
822
11.9
124
1216
39.9
1976
0-4
00.
008.
224
.08
160
018
363.
377
0.29
10.
541
13.7
927
138
160
024
487.
8616
0.48
10.
301
15.3
630
1416
39.6
1964
0-1
200.
008.
424
.08
160
024
485.
3511
0.24
00.
982
17.4
335
158
160
024
481.
583
0.21
00.
311
21.8
943
168
160
024
480.
190
0.28
17.
8816
15.6
431
1716
39.2
1948
0-1
600.
008.
424
.08
160
024
480.
501
0.01
01.
192
22.3
044
188
160
024
480.
461
0.57
1-0
.77
-223
.74
47
1916
39.0
1940
0-8
00.
568.
224
.08
160
024
480.
050
0.64
11.
152
22.1
744
208
160
024
480.
661
0.35
13.
297
19.7
139
2116
38.8
1932
0-8
00.
009.
224
.08
160
024
480.
070
0.03
06.
2112
17.6
935
228
160
024
480.
591
0.52
14.
198
18.6
937
238
160
024
480.
331
0.61
13.
777
19.2
938
2416
38.3
1912
0-2
000.
028.
624
.08
160
024
480.
922
0.49
14.
108
18.4
937
258
160
024
480.
291
0.04
05.
0210
18.6
537
2616
38.1
1904
0-8
00.
008.
124
.08
160
024
480.
391
0.01
03.
437
20.1
740
278
160
024
480.
862
0.57
12.
154
20.4
241
2816
37.8
1890
0-1
400.
058.
124
.08
160
024
480.
120
0.56
1-2
.68
-525
.99
52
298
160
024
480.
741
0.76
2-3
.60
-726
.10
52
308
160
024
480.
361
0.47
1-5
.22
-10
28.4
056
Mon
thly
Tot
als
-110
01.
0142
90
1163
6320
7410
05
Yea
r to
Dat
e To
tals
2025
36.4
842
90
1163
6320
7410
05

APPENDIX D—Barney Reservoir Operations Monthly ReportsD-8 2002 Tualatin River Flow Management Report
BA
RN
EY
RE
SE
RV
OIR
OP
ER
AT
ION
S F
OR
TH
E M
ON
TH
OF
JU
LY 2
002
DAY
SURF
ACE
ELEV
ATIO
NST
OR
AGE
CHAN
GE
INST
OR
AGE
RAI
N @
BA
RNEY
MEA
SURE
D FL
OW T
OST
OR
AGE
REL
EASE
D TO
TR
ASK
—O
DFW
STO
RAG
E RE
LEAS
ED T
O T
UALA
TIN
BRE
AKD
OW
N O
F M
UNCI
PAL
USE
BY
WAT
ER P
RO
VID
ER
TRA
SKTU
ALAT
INC
WS
MUN
ICIP
ALH
ILLS
BO
RO
FORE
ST G
RO
VEB
EAVE
RTO
NTV
WD
feet
ac-ft
ac-ft
in.
cfs
cfs
cfs
ac-ft
cfs
ac-ft
cfs
ac-ft
cfs
ac-ft
cfs
ac-ft
cfs
ac-ft
cfs
ac-ft
116
37.6
1880
0-1
001.
508.
124
.08
160
024
480.
641
0.13
02.
305
20.9
442
28
160
024
482.
515
0.05
00.
311
21.1
442
316
37.3
1865
0-1
500.
038.
124
.08
160
024
482.
525
0.36
10.
671
20.4
541
48
160
024
48-0
.74
-10.
080
0.05
024
.61
49
516
37.0
1850
0-1
500.
038.
024
.08
160
024
48-0
.28
-10.
261
0.44
123
.57
47
68
160
024
482.
575
0.18
00.
501
20.7
541
78
160
024
48-0
.25
-10.
271
0.04
023
.95
48
816
36.6
1830
0-2
000.
078.
124
.08
160
024
48-1
.33
-30.
381
0.68
124
.27
48
98
160
024
482.
926
0.04
00.
341
20.7
041
1016
36.3
1815
0-1
500.
008.
030
.08
160
030
60-0
.62
-10.
872
0.70
129
.05
58
118
160
036
7112
.84
250.
952
0.34
121
.88
43
1216
35.9
1796
3-1
870.
008.
036
.08
160
036
7113
.84
270.
220
0.43
121
.51
43
138
160
036
7114
.22
280.
792
0.10
020
.90
41
148
160
036
7117
.10
340.
782
0.53
117
.59
35
1516
35.3
1778
3-1
800.
008.
036
.08
160
036
7114
.73
290.
972
0.58
119
.73
39
168
160
036
710.
762
0.58
115
.69
3118
.98
38
1716
34.8
1755
0-2
330.
008.
036
.08
160
036
710.
050
0.71
114
.81
2920
.43
41
188
160
036
710.
291
0.46
112
.30
2422
.94
46
1916
34.4
1740
0-1
500.
008.
036
.08
160
036
710.
872
0.30
113
.33
2621
.49
43
208
160
036
710.
281
0.76
216
.91
3418
.06
36
218
160
036
710.
922
0.61
115
.97
3218
.50
37
2216
33.7
1713
8-2
620.
008.
036
.08
160
036
710.
661
0.04
018
.52
3716
.78
33
238
160
036
710.
321
0.34
117
.81
3517
.53
35
2416
33.3
1698
8-1
500.
008.
036
.08
160
036
710.
150
0.44
118
.19
3617
.23
34
258
160
036
710.
200
0.76
217
.59
3517
.45
35
2616
32.8
1680
0-1
880.
008.
036
.08
160
036
710.
942
0.06
016
.80
3318
.19
36
278
160
036
710.
301
0.08
020
.75
4114
.88
30
288
160
036
710.
140
1.29
320
.05
4014
.52
29
2916
32.0
1650
0-3
000.
008.
036
.08
160
036
710.
741
0.30
119
.87
3915
.08
30
308
160
036
710.
481
1.02
218
.40
3716
.10
32
3116
31.6
1635
0-1
500.
008.
036
.08
160
036
711.
874
1.67
317
.50
3514
.96
30
Mon
thly
Tot
als
-255
01.
6349
20
1988
178
3156
012
18
Yea
r to
Dat
e To
tals
-525
38.1
192
10
3151
241
5163
522
24

APPENDIX D—Barney Reservoir Operations Monthly Reports2002 Tualatin River Flow Management Report D-9
B
AR
NE
Y R
ES
ER
VO
IR O
PE
RA
TIO
NS
FO
R T
HE
MO
NT
H O
F A
UG
US
T 2
002
DAY
SURF
ACE
ELEV
ATIO
NST
OR
AGE
CHAN
GE
INST
OR
AGE
RAI
N @
BA
RNEY
MEA
SURE
D FL
OW T
OST
OR
AGE
REL
EASE
D TO
TR
ASK
—O
DFW
STO
RAG
E RE
LEAS
ED T
O T
UALA
TIN
BRE
AKD
OW
N O
F M
UNCI
PAL
USE
BY
WAT
ER P
RO
VID
ER
TRA
SKTU
ALAT
INC
WS
MUN
ICIP
ALH
ILLS
BO
RO
FORE
ST G
RO
VEB
EAVE
RTO
NTV
WD
feet
ac-ft
ac-ft
in.
cfs
cfs
cfs
ac-ft
cfs
ac-ft
cfs
ac-ft
cfs
ac-ft
cfs
ac-ft
cfs
ac-ft
cfs
ac-ft
18
160
036
7117
.56
350.
701
0.50
117
.24
34
216
31.2
1620
0-1
500.
008.
042
.08
160
042
8318
.10
363.
958
0.11
019
.83
39
38
160
042
8320
.44
411.
864
0.92
218
.78
37
48
160
042
8319
.04
380.
942
0.84
221
.18
42
516
30.3
1586
3-3
370.
008.
042
.08
160
042
8318
.98
381.
814
0.76
220
.46
41
68
160
042
8320
.21
401.
653
0.49
119
.65
39
716
29.8
1567
5-1
880.
058.
042
.08
160
042
8320
.08
40-0
.26
-13.
938
18.2
636
88
160
042
8320
.20
40-0
.36
-14.
319
17.8
535
916
29.3
1548
9-1
860.
008.
042
.08
160
042
8321
.30
420.
461
-0.4
4-1
20.6
941
108
160
042
8318
.47
370.
751
-0.1
10
22.8
945
118
160
042
8318
.29
360.
421
0.26
123
.04
46
1216
28.5
1518
8-3
010.
008.
042
.08
160
042
8320
.76
410.
862
0.07
020
.31
40
138
160
042
8317
.79
350.
541
0.65
123
.02
46
1416
28.0
1500
0-1
880.
008.
048
.08
160
048
9526
.30
523.
327
0.35
118
.03
36
158
160
048
955.
6811
0.53
122
.12
4419
.67
39
1616
27.4
1477
5-2
250.
008.
048
.08
160
048
954.
9910
0.83
222
.17
4420
.01
40
178
160
048
955.
6111
0.90
221
.18
4220
.31
40
188
160
048
954.
619
0.32
122
.45
4520
.62
41
1916
26.5
1443
8-3
370.
008.
048
.08
160
048
955.
7611
0.49
120
.45
4121
.30
42
208
160
048
957.
4015
0.56
119
.86
3920
.18
40
2116
25.9
1421
3-2
250.
008.
048
.08
160
048
9513
.21
260.
301
17.9
936
16.4
933
228
160
048
9513
.11
260.
010
19.4
139
15.4
731
2316
25.2
1395
0-2
630.
008.
048
.08
160
048
9510
.50
210.
461
18.0
736
18.9
738
248
160
048
959.
4919
0.19
020
.12
4018
.20
36
258
160
048
956.
9714
0.65
122
.18
4418
.20
36
2616
24.3
1361
3-3
370.
008.
048
.08
1614
2834
670.
190
0.24
017
.37
3416
.20
32
278
1614
2834
670.
160
0.37
116
.04
3217
.43
35
2816
23.7
1338
8-2
250.
008.
048
.08
1614
2834
670.
731
0.79
213
.27
2619
.22
38
298
1614
2834
670.
551
0.68
112
.21
2420
.56
41
3016
23.2
1320
0-1
880.
008.
048
.08
1614
2834
670.
371
0.72
110
.68
2122
.22
44
318
1614
2834
670.
451
0.77
213
.90
2818
.88
37
Mon
thly
Tot
als
-315
00.
0549
216
726
1972
950
639
1201
Yea
r to
Dat
e To
tals
-367
538
.16
1413
167
5769
970
102
1274
3424

APPENDIX D—Barney Reservoir Operations Monthly ReportsD-10 2002 Tualatin River Flow Management Report
BA
RN
EY
RE
SE
RV
OIR
OP
ER
AT
ION
S F
OR
TH
E M
ON
TH
OF
SE
PT
EM
BE
R 2
002
DAY
SURF
ACE
ELEV
ATIO
NST
OR
AGE
CHAN
GE
INST
OR
AGE
RAI
N @
BA
RNEY
MEA
SURE
D FL
OW T
OST
OR
AGE
REL
EASE
D TO
TR
ASK
—O
DFW
STO
RAG
E RE
LEAS
ED T
O T
UALA
TIN
BRE
AKD
OW
N O
F M
UNCI
PAL
USE
BY
WAT
ER P
RO
VID
ER
TRA
SKTU
ALAT
INC
WS
MUN
ICIP
ALH
ILLS
BO
RO
FORE
ST G
RO
VEB
EAVE
RTO
NTV
WD
feet
ac-ft
ac-ft
in.
cfs
cfs
cfs
ac-ft
cfs
ac-ft
cfs
ac-ft
cfs
ac-ft
cfs
ac-ft
cfs
ac-ft
cfs
ac-ft
18
1614
2834
6712
.58
250.
471
0.69
120
.25
40
216
22.2
1282
5-3
750.
008.
048
.08
1614
2834
6711
.56
230.
511
0.25
021
.69
43
38
1614
2834
6710
.61
210.
130
0.02
023
.24
46
416
21.5
1256
3-2
620.
008.
054
.08
1614
2840
7917
.80
350.
551
0.35
121
.29
42
58
1614
2840
7916
.29
323.
106
0.11
020
.49
41
616
20.8
1230
0-2
630.
008.
054
.08
1614
2840
7919
.51
390.
361
0.96
219
.17
38
78
1614
2840
7915
.31
302.
064
0.62
122
.02
44
88
1614
2840
7917
.42
351.
884
0.92
219
.78
39
916
19.8
1193
3-3
670.
008.
054
.08
1614
2840
7916
.38
320.
020
2.87
620
.73
41
108
1614
2840
7915
.96
320.
441
6.37
1317
.23
34
1116
19.1
1170
0-2
330.
008.
054
.08
1614
2840
7919
.51
390.
000
6.19
1214
.30
28
128
1614
2840
7919
.93
400.
381
7.84
1611
.84
23
1316
18.3
1143
3-2
670.
008.
054
.08
1614
2840
7919
.14
380.
571
3.86
816
.43
33
148
1614
2840
7915
.75
310.
160
3.58
720
.51
41
158
1614
2840
7914
.19
280.
912
4.90
1020
.00
40
1616
17.1
1103
3-4
000.
078.
054
.08
1614
2840
794.
379
0.98
214
.86
2919
.79
39
178
1614
2840
796.
0712
0.76
214
.42
2918
.75
37
1816
16.5
1083
3-2
000.
368.
054
.08
1614
2840
797.
3115
1.85
416
.25
3214
.58
29
198
1614
2840
797.
8015
1.04
214
.27
2816
.90
34
2016
15.7
1056
6-2
670.
008.
054
.08
1614
2840
796.
1612
5.09
1010
.60
2118
.14
36
218
1614
2840
796.
8013
4.47
911
.34
2317
.39
35
228
1614
2840
797.
3615
5.51
1119
.13
388.
0016
2316
14.6
1020
0-3
660.
008.
054
.08
1614
2840
793.
437
4.99
1014
.95
3016
.63
33
248
1614
2840
790.
711
3.47
715
.95
3219
.86
39
2516
13.7
9925
-275
0.00
8.0
54.0
816
1428
4079
1.97
41.
683
16.5
533
19.8
039
268
1614
2840
790.
040
2.61
514
.09
2823
.26
46
2716
13.0
9750
-175
0.00
8.0
54.0
816
1428
4079
0.03
02.
214
14.5
729
23.1
846
288
1614
2840
790.
982
1.72
315
.18
3022
.12
44
298
1614
2840
790.
611
1.72
313
.71
2723
.96
48
3016
11.9
9475
-275
0.82
8.0
54.0
816
1428
4079
1.43
31.
834
13.5
927
23.1
546
Mon
thly
Tot
als
-372
51.
2547
683
323
4558
910
251
411
40
Yea
r to
Dat
e To
tals
-740
039
.41
1889
1000
8115
1559
204
1788
4564

APPENDIX D—Barney Reservoir Operations Monthly Reports2002 Tualatin River Flow Management Report D-11
BA
RN
EY
RE
SE
RV
OIR
OP
ER
AT
ION
S F
OR
TH
E M
ON
TH
OF
OC
TOB
ER
200
2
DAY
SURF
ACE
ELEV
ATIO
NST
OR
AGE
CHAN
GE
INST
OR
AGE
RAI
N @
BA
RNEY
MEA
SURE
D FL
OW T
OST
OR
AGE
REL
EASE
D TO
TR
ASK
—O
DFW
STO
RAG
E RE
LEAS
ED T
O T
UALA
TIN
BRE
AKD
OW
N O
F M
UNCI
PAL
USE
BY
WAT
ER P
RO
VID
ER
TRA
SKTU
ALAT
INC
WS
MUN
ICIP
ALH
ILLS
BO
RO
FORE
ST G
RO
VEB
EAVE
RTO
NTV
WD
feet
ac-ft
ac-ft
in.
cfs
cfs
cfs
ac-ft
cfs
ac-ft
cfs
ac-ft
cfs
ac-ft
cfs
ac-ft
cfs
ac-ft
cfs
ac-ft
18
1614
2840
7915
.04
300.
792
0.27
123
.90
47
216
11.2
9300
-175
0.06
8.0
54.0
816
1428
4079
13.4
627
1.36
34.
309
20.8
841
38
1614
2840
7912
.71
250.
361
5.20
1021
.74
43
416
10.5
9125
-175
0.26
8.0
54.0
816
1428
4079
10.5
421
0.08
06.
8814
22.5
045
58
1614
2840
7911
.42
230.
932
4.18
823
.47
47
68
1614
2840
7911
.54
231.
443
4.17
822
.84
45
716
09.3
8766
-359
0.02
8.0
54.0
816
1428
4079
10.2
220
1.67
34.
349
23.7
747
88
1614
2840
7910
.45
211.
713
4.28
823
.57
47
916
08.5
8500
-266
0.00
8.0
48.0
816
1428
3467
9.14
181.
393
1.77
421
.70
43
108
1614
2834
677.
9116
0.55
10.
842
24.6
949
1116
07.7
8233
-267
0.00
8.0
39.0
816
1428
2550
0.69
10.
922
0.62
122
.77
45
128
1614
2825
501.
533
0.38
10.
431
22.6
645
138
1614
2825
501.
904
0.53
10.
311
22.2
644
1416
06.7
7900
-333
0.00
8.0
39.0
816
1428
2550
2.94
60.
220
0.32
121
.51
43
158
1614
2825
502.
685
0.19
00.
932
21.1
942
1616
06.0
7666
-234
0.00
8.0
39.0
816
1428
2550
0.53
10.
451
3.37
720
.64
41
178
1614
2825
500.
802
0.54
12.
535
21.1
442
1816
05.4
7466
-200
0.00
8.0
39.0
816
1428
2550
0.67
10.
601
2.38
521
.35
42
198
1614
2825
500.
611
0.11
03.
377
20.9
141
208
1614
2825
500.
922
0.17
01.
473
22.4
445
2116
04.3
7100
-366
0.00
8.0
39.0
816
1428
2550
0.96
20.
421
2.07
421
.55
43
228
1614
2825
500.
972
0.81
20.
932
22.3
044
2316
03.9
6975
-125
0.00
8.0
39.0
816
1428
2550
0.93
20.
140
3.06
620
.87
41
248
1614
2825
500.
160
0.11
02.
826
21.9
243
2516
03.0
6750
-225
0.00
8.0
25.0
816
00
2550
0.67
10.
521
1.37
322
.44
45
268
160
025
500.
351
0.18
02.
084
22.3
944
278
160
025
500.
822
0.18
01.
804
22.2
044
2816
02.3
6575
-175
0.00
8.0
25.0
816
00
2550
0.47
10.
220
2.06
422
.25
44
298
160
025
500.
321
0.51
11.
553
22.6
245
3016
01.9
6475
-100
0.00
8.0
25.0
816
00
2550
0.49
10.
932
0.39
123
.19
46
318
160
025
502.
415
2.03
43.
577
16.9
934
Mon
thly
Tot
als
-300
00.
3449
266
718
1126
641
146
1358
Yea
r to
Dat
e To
tals
-104
0039
.75
2381
1667
9926
1825
244
1934
5923

APPENDIX D—Barney Reservoir Operations Monthly ReportsD-12 2002 Tualatin River Flow Management Report
B
AR
NE
Y R
ES
ER
VO
IR O
PE
RA
TIO
NS
FO
R T
HE
MO
NT
H O
F N
OV
EM
BE
R 2
002
DAY
SURF
ACE
ELEV
ATIO
NST
OR
AGE
CHAN
GE
INST
OR
AGE
RAI
N @
BA
RNEY
MEA
SURE
D FL
OW T
OST
OR
AGE
REL
EASE
D TO
TR
ASK
—O
DFW
STO
RAG
E RE
LEAS
ED T
O T
UALA
TIN
BRE
AKD
OW
N O
F M
UNCI
PAL
USE
BY
WAT
ER P
RO
VID
ER
TRA
SKTU
ALAT
INC
WS
MUN
ICIP
ALH
ILLS
BO
RO
FORE
ST G
RO
VEB
EAVE
RTO
NTV
WD
feet
ac-ft
ac-ft
in.
cfs
cfs
cfs
ac-ft
cfs
ac-ft
cfs
ac-ft
cfs
ac-ft
cfs
ac-ft
cfs
ac-ft
cfs
ac-ft
116
01.4
6350
-125
0.00
8.0/
7.0
25.0
714
00
2550
7.49
150.
491
17.0
234
0.00
0
27
140
025
508.
0816
0.44
116
.48
330.
000
37
140
025
507.
5815
0.47
116
.95
340.
000
416
00.7
6175
-175
0.00
7.0/
6.0
25.0
612
00
2550
7.21
140.
882
16.9
034
0.00
0
56
120
025
506.
4913
0.66
117
.85
350.
000
616
00.4
6100
-75
0.22
6.0
25.0
612
00
2550
7.69
150.
491
16.8
233
0.00
0
76
120
025
506.
7113
0.22
018
.07
360.
000
816
00.2
6050
-50
2.05
6.0/
5.0
25.0
510
00
2550
7.23
140.
431
17.3
434
0.00
0
95
100
025
507.
6315
0.66
116
.72
330.
000
105
100
025
508.
5817
0.20
016
.23
320.
000
1116
00.1
6025
-25
1.80
5.0
25.0
510
00
2550
7.84
160.
962
16.2
032
0.00
0
125
100
025
5010
.15
204.
439
10.4
221
0.00
0
1316
00.1
6025
01.
655.
00.
05
100
00
00.
000
0.00
00.
000
0.00
0
145
100
00
00.
000
0.00
00.
000
0.00
0
1516
00.3
6075
500.
625.
00.
05
100
00
00.
000
0.00
00.
000
0.00
0
165
100
00
00.
000
0.00
00.
000
0.00
0
175
100
00
00.
000
0.00
00.
000
0.00
0
1816
00.5
6125
500.
845.
00.
05
100
00
00.
000
0.00
00.
000
0.00
0
195
100
00
00.
000
0.00
00.
000
0.00
0
2016
00.9
6225
100
1.50
5.0
0.0
510
00
00
0.00
00.
000
0.00
00.
000
215
100
00
00.
000
0.00
00.
000
0.00
0
2216
01.0
6250
250.
005.
00.
05
100
00
00.
000
0.00
00.
000
0.00
0
235
100
00
00.
000
0.00
00.
000
0.00
0
245
100
00
00.
000
0.00
00.
000
0.00
0
2516
01.1
6275
250.
105.
00.
05
100
00
00.
000
0.00
00.
000
0.00
0
265
100
00
00.
000
0.00
00.
000
0.00
0
2716
01.1
6275
00.
005.
00.
05
100
00
00.
000
0.00
00.
000
0.00
0
285
100
00
00.
000
0.00
00.
000
0.00
0
2916
01.0
6250
-25
0.00
5.0
0.0
510
00
00
0.00
00.
000
0.00
00.
000
305
100
00
00.
000
0.00
00.
000
0.00
0
Mon
thly
Tot
als
-225
8.78
317
059
518
420
391
0
Yea
r to
Dat
e To
tals
-106
2548
.53
2698
1667
1052
120
0926
523
2559
23
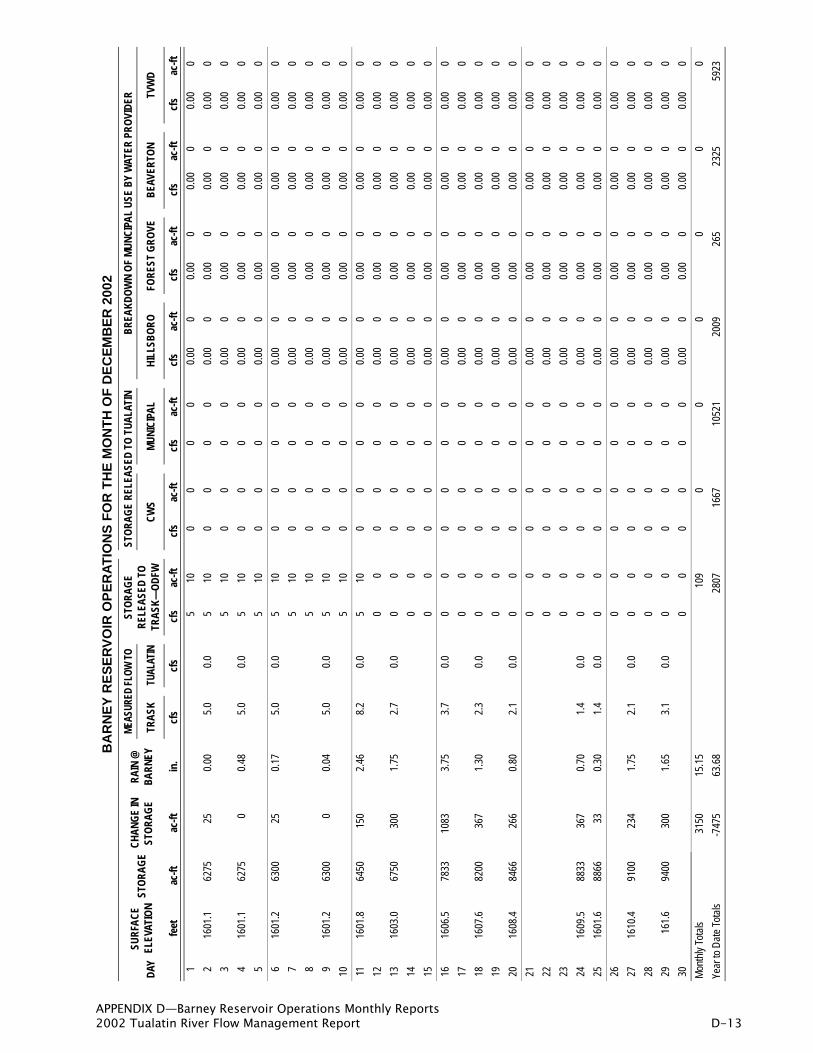
APPENDIX D—Barney Reservoir Operations Monthly Reports2002 Tualatin River Flow Management Report D-13
BA
RN
EY
RE
SE
RV
OIR
OP
ER
AT
ION
S F
OR
TH
E M
ON
TH
OF
DE
CE
MB
ER
200
2
DAY
SURF
ACE
ELEV
ATIO
NST
OR
AGE
CHAN
GE
INST
OR
AGE
RAI
N @
BA
RNEY
MEA
SURE
D FL
OW T
OST
OR
AGE
REL
EASE
D TO
TR
ASK
—O
DFW
STO
RAG
E RE
LEAS
ED T
O T
UALA
TIN
BRE
AKD
OW
N O
F M
UNCI
PAL
USE
BY
WAT
ER P
RO
VID
ER
TRA
SKTU
ALAT
INC
WS
MUN
ICIP
ALH
ILLS
BO
RO
FORE
ST G
RO
VEB
EAVE
RTO
NTV
WD
feet
ac-ft
ac-ft
in.
cfs
cfs
cfs
ac-ft
cfs
ac-ft
cfs
ac-ft
cfs
ac-ft
cfs
ac-ft
cfs
ac-ft
cfs
ac-ft
15
100
00
00.
000
0.00
00.
000
0.00
0
216
01.1
6275
250.
005.
00.
05
100
00
00.
000
0.00
00.
000
0.00
0
35
100
00
00.
000
0.00
00.
000
0.00
0
416
01.1
6275
00.
485.
00.
05
100
00
00.
000
0.00
00.
000
0.00
0
55
100
00
00.
000
0.00
00.
000
0.00
0
616
01.2
6300
250.
175.
00.
05
100
00
00.
000
0.00
00.
000
0.00
0
75
100
00
00.
000
0.00
00.
000
0.00
0
85
100
00
00.
000
0.00
00.
000
0.00
0
916
01.2
6300
00.
045.
00.
05
100
00
00.
000
0.00
00.
000
0.00
0
105
100
00
00.
000
0.00
00.
000
0.00
0
1116
01.8
6450
150
2.46
8.2
0.0
510
00
00
0.00
00.
000
0.00
00.
000
120
00
00
00.
000
0.00
00.
000
0.00
0
1316
03.0
6750
300
1.75
2.7
0.0
00
00
00
0.00
00.
000
0.00
00.
000
140
00
00
00.
000
0.00
00.
000
0.00
0
150
00
00
00.
000
0.00
00.
000
0.00
0
1616
06.5
7833
1083
3.75
3.7
0.0
00
00
00
0.00
00.
000
0.00
00.
000
170
00
00
00.
000
0.00
00.
000
0.00
0
1816
07.6
8200
367
1.30
2.3
0.0
00
00
00
0.00
00.
000
0.00
00.
000
190
00
00
00.
000
0.00
00.
000
0.00
0
2016
08.4
8466
266
0.80
2.1
0.0
00
00
00
0.00
00.
000
0.00
00.
000
210
00
00
00.
000
0.00
00.
000
0.00
0
220
00
00
00.
000
0.00
00.
000
0.00
0
230
00
00
00.
000
0.00
00.
000
0.00
0
2416
09.5
8833
367
0.70
1.4
0.0
00
00
00
0.00
00.
000
0.00
00.
000
2516
01.6
8866
330.
301.
40.
00
00
00
00.
000
0.00
00.
000
0.00
0
260
00
00
00.
000
0.00
00.
000
0.00
0
2716
10.4
9100
234
1.75
2.1
0.0
00
00
00
0.00
00.
000
0.00
00.
000
280
00
00
00.
000
0.00
00.
000
0.00
0
2916
1.6
9400
300
1.65
3.1
0.0
00
00
00
0.00
00.
000
0.00
00.
000
300
00
00
00.
000
0.00
00.
000
0.00
0
Mon
thly
Tot
als
3150
15.1
510
90
00
00
0
Yea
r to
Dat
e To
tals
-747
563
.68
2807
1667
1052
120
0926
523
2559
23

Appendix EAppendix EAppendix EAppendix E
Stream Gauge RecordsStream Gauge RecordsStream Gauge RecordsStream Gauge Records

STREAM GAUGE SITES — LOCATIONS
North
SCHEMATIC MAPSCHEMATIC MAPSCHEMATIC MAPSCHEMATIC MAPNot to Scale
Fanno
Creek
Cr
Cr
Cr
S. Rock
McF
ee C
r
Christensen
Creek
Creek
Cr
Ro
McKay
East
West
Gales
Creek
SCHO SCLO
SCOO
DLLO
Scog
Barney Reservoir
Scoggins Reservoir
DAIRY
ROODRCTV
FRMO
Lake Oswego
WI L L A M
E T T E RI V
ER
TU
AL
R
GALES
Dairy
Creek
Burris Cr
He Cr
Baker Cr
Chicken
Cedar Cr
Canal
(Hagg Lake)
Ash
Hedges
Sain Cr
Ta
gins
Car
pe
Dawson Cr
Brons
Beav
nner Cr
nter
Cr
Fork
Fork
onat
Lake Oswego
AT
IN
VE
RI
CedarMill Cr
S. on Cr
Springbrook Cr
Saum Cr
Butternut Cr
DCBR
on Cr
BCBR
BCSR
CMMB
SPBR
TRT
SCHO
FANO
HCWL
JCDV
MCSCWCJS
WC143
WCHP
BCCH
WSLO
LOCS
HCTP ASMP
SLAB
SC121
6900
SCRL
Sylvan Cr
Cr
Cr Sum
mer
Ck
Johns
Ericks
on
CkECMR
BVTS
Wil
wCr
lo
CCER
RCQR
ck
eek
RCWU RCRRCre
ek
erto
n
CCSR
TRGC
5400
GASO
Sampling and Flow Sites
Withdrawal Points
Wastewater Treatment Plants

APPENDIX E—Stream Gauge Records2002 Tualatin River Flow Management Report E-3
STREAM GAUGE SITES — ALPHABETICAL LISTING BY SITE CODESITE CODE SITE NAME RIVER MILE STATION ID PAGE
5400 East Fork Dairy Creek near Meacham Corner, OR 14205400 E-11
6900 Fanno Creek at 56th Avenue 11.9 14206900 E-32
ASMP Ash Creek at Metzger Park at Metzger, Oregon 1.25 14206933 E-34
BCBR Bronson Creek at Bronson Road near Orenco, Oregon 2.1 14206423 E-25
BCCH Beaverton Creek at Cedar Hills Blvd at Beaverton, Oregon 7.45 14206360 E-18
BCSR Bronson Creek at Saltzman Road near Orenco, Oregon 5.1 14206419 E-24
BVTS Beaverton Creek at 216th near Orenco, Oregon 1.2 14206435 E-26
CCER Cedar Creek at Edy Road near Sherwood, Oregon 0.62 14206748 E-30
CCSR Chicken Creek at Scholls-Sherwood Road near Sherwood, Oregon 2.3 14206750 E-31
CMMB Cedar Mill Creek at Murray Boulevard near Beaverton, Oregon 1.64 14206395 E-21
DAIRY Dairy Creek at Hwy 8 near Hillsboro, Oregon 2.06 14206200 E-14
DCBR Dawson Creek at Brookwood Road near Hillsboro, Oregon 0.07 14206443 E-27
DLLO Tualatin River at Dilley, Oregon 58.8 14203500 E-8
ECMR Erickson Creek at Menlo Drive at Beaverton, Oregon 0.76 14206365 E-19
FANO Fanno Creek at Durham Road near Tigard, Oregon 1.2 14206950 E-37
FRMO Tualatin River at Farmington, Oregon 33.3 14206500 E-29
GALES Gales Creek at Old Hwy 47 near Forest Grove, Oregon 2.36 14204530 E-9
GASO Tualatin River at Gaston, Oregon 62.3 14202510 E-4
HCTP Hedges Creek at Tualatin Community Park at Tualatin, Oregon 0.3 14206958 E-39
HCWL Hedges Creek Wetland near Tualatin 1.2 14206957 E-38
JCDV Johnson Creek at Davis Road near Beaverton, Oregon 1.3 14206372 E-20
LOCS Tualatin River at Oswego Canal near Lake Oswego, Oregon 6.7 14206990 E-41
MCSC McKay Creek at Scotch Church Rd near North Plains, Oregon 6.3 14206070 E-12
RCQR Rock Creek at Quatama near Orenco, Oregon 4.9 14206347 E-17
RCRR Rock Creek at Rock Creek Road near Bowers Junction, Oregon 15.8 14206305 E-16
RCTV Rock Creek at Hwy 8 near Hillsboro, Oregon 1.2 14206450 E-28
RCWU Rock Creek at West Union Road near Bethany, Oregon 9.0 14206338 bad data
ROOD Tualatin River at Rood Bridge Road near Hillsboro, Oregon 38.4 14206295 E-15
SC121 Summer Creek at 121st Avenue near Tigard, Oregon 1.0 14206938 E-36
SCHO Sain Creek above Henry Hagg Lake near Gaston, Oregon 1.6 14202920 E-6
SCLO Scoggins Creek above Henry Hagg Lake near Gaston, Oregon 8.0 14202850 E-5
SCOO Scoggins Creek below Henry Hagg Lake near Gaston, Oregon 4.80 14202980 E-7
SCRL Sylvan Creek at Raleighwood Lane near West Slope, Oregon 1.0 14206905 E-33
SLAB Summer Creek above Summer Lake near Tigard, Oregon 1.52 — E-35
SPBR Springbrook Creek at Iron Mountain Rd near Lake Oswego, Oregon 0.18 14211116 E-43
TRGC Tualatin River at Golf Course Road near Cornelius, Oregon 51.5 14204800 E-10
TRT Tualatin River at Tualatin, Oregon 8.9 14206960 E-40
WC143 Willow Creek at 143rd Avenue near Beaverton, Oregon 3.5 14206410 E-22
WCHP Willow Creek at Heritage Parkway near Beaverton, Oregon 0.75 14206413 E-23
WCJS Waible Creek at Jackson School Road near Hillsboro, Oregon 1.0 14206100 E-13
WSLO Tualatin River at West Linn 1.75 14207500 E-42

APPENDIX E—Stream Gauge RecordsE-4 2002 Tualatin River Flow Management Report
GASO – 14202510 – TUALATIN RIVER AT GASTON, OREGON [RM 62.3]Latitude: 45 26 21 Longitude: 123 07 85 Source Agency: District 18 Watermaster
Day2002 Daily Mean Discharge in Cubic Feet per Second
JAN* FEB MAR* APR MAY JUN JUL AUG SEP OCT NOV DEC* 1 272 450 211 187 102 44.9 53.3 47.3 49.9 59.8 31.9 18.2 2 334 423 196 178 97.6 42.0 50.4 47.8 49.8 57.5 31.5 17.5 3 311 427 183 170 93.7 40.8 48.4 52.0 49.1 58.5 32.1 17.2 4 297 418 174 163 89.8 39.7 46.8 52.8 49.6 59.6 33.2 19.3 5 294 384 168 160 90.3 51.0 46.9 52.3 57.3 57.5 33.5 22.2 6 r 392 197 158 94.3 52.5 45.9 53.0 58.6 57.1 34.0 20.4 7 r 567 181 150 87.4 52.1 45.2 53.2 60.6 56.4 38.2 18.8 8 r 701 168 141 82.2 53.7 46.1 50.0 60.1 58.2 69.9 17.9 9 r 631 159 150 77.2 55.3 44.5 49.1 58.9 56.7 75.8 17.6
10 645 536 245 246 72.2 52.2 42.4 48.8 57.6 53.0 74.4 39.011 547 479 r 253 69.1 50.8 46.8 48.2 56.9 52.8 67.7 22912 530 433 r 223 66.8 48.7 51.7 47.7 55.5 46.2 62.0 32013 493 389 664 226 64.0 52.2 52.1 46.5 55.1 45.4 90.6 28614 453 346 581 477 65.0 51.4 51.8 46.6 54.8 45.3 74.7 56515 412 313 494 392 61.2 51.5 51.7 50.4 55.4 46.0 46.9 60916 376 293 446 330 58.7 51.9 50.6 51.4 56.2 45.2 32.617 344 276 399 301 58.6 53.9 51.1 52.0 60.2 44.5 48.8 51518 317 268 366 264 55.9 62.7 51.1 52.4 58.1 44.8 41.6 42919 340 378 556 233 56.8 56.4 51.3 52.3 56.7 44.3 113 39720 483 388 585 210 57.7 52.5 51.9 52.4 56.0 44.6 90.1 31321 691 423 497 190 55.0 49.7 50.7 52.4 55.5 45.1 49.5 25722 587 464 440 175 53.0 48.0 49.1 52.4 55.2 45.6 36.5 22023 528 434 389 161 50.2 48.2 48.5 51.4 54.4 45.1 30.5 21524 r 389 351 149 49.0 48.4 48.2 51.6 54.2 44.4 26.5 20025 r 326 317 140 47.6 47.1 47.7 51.6 54.2 45.1 24.4 18526 r 282 286 133 46.3 45.7 48.1 51.8 54.3 33.6 22.5 19727 r 253 264 128 48.7 44.6 47.6 50.8 53.9 31.3 21.1 34828 604 230 242 119 55.7 50.2 47.0 50.0 54.3 31.2 20.2 35329 525 — 226 113 68.1 86.7 47.0 49.3 54.8 31.3 19.4 28830 475 — 210 107 53.8 60.4 47.1 50.6 60.5 31.3 18.6 44431 464 — 197 — 47.9 — 47.0 50.2 — 31.5 —
TOTAL 10,322 11,293 9,392 6,027 2,075.8 1,545.2 1,508.0 1,568.3 1,667.7 1,448.9 1,391.7 6,578.1MEAN 449 403 324 201 67.0 51.5 48.6 50.6 55.6 46.7 46.4 227MAX 691 701 664 477 102 86.7 53.3 53.2 60.6 59.8 113 609MIN 272 230 159 107 46.3 39.7 42.4 46.5 49.1 31.2 18.6 17.2AC-FT 20,470 22,400 18,630 11,950 4,120 3,060 2,990 3,110 3,310 2,870 2,760 13,050YEAR 2002* TOTAL=54,817.70 MEAN=155 MAX=701 MIN=17.2 AC-FT=108,700*Incomplete record; r = Mean flow & stage exceed rating curve
1/1
/02
2/1
/02
3/1
/02
4/1
/02
5/1
/02
6/1
/02
7/1
/02
8/1
/02
9/1
/02
10/1
/02
11/1
/02
12/1
/02
1/1
/03
10
100
1000
Dai
ly M
ean
Dis
char
ge
(cfs
)
GASO — 14202510 — Tualatin River at Gaston, Oregon [RM 62.3]

APPENDIX E—Stream Gauge Records2002 Tualatin River Flow Management Report E-5
SCLO – 14202850 – SCOGGINS CREEK ABOVE HENRY HAGG LAKE NEAR GASTON, OREGON [RM 8.0]Latitude: 45 30 06 Longitude: 123 15 06 Source Agency: District 18 Watermaster
Day2002 Daily Mean Discharge in Cubic Feet per Second
JAN FEB MAR APR MAY JUN JUL AUG SEP OCT NOV DEC 1 64.6 121 61.5 54.3 36.4 18.3 13.4 5.11 3.26 3.63 2.23 3.58 2 72.8 112 56.8 51.4 34.1 17.6 12.0 4.83 3.26 2.81 1.98 3.48 3 70.6 119 52.9 49.1 32.9 16.9 11.0 4.83 3.01 3.03 2.00 3.26 4 67.6 118 49.8 47.1 32.1 16.4 10.5 4.99 3.26 3.41 2.01 4.59 5 71.0 112 47.4 46.4 32.0 16.2 10.4 5.77 3.36 2.87 2.17 4.91 6 204 134 54.0 44.8 32.1 15.7 9.88 6.03 5.44 2.56 2.37 4.10 7 825 236 47.2 42.8 30.3 15.7 9.76 5.59 7.12 2.44 4.77 3.66 8 737 308 44.4 41.2 29.3 16.2 9.98 4.78 5.03 2.36 15.3 3.23 9 392 251 45.3 59.6 27.8 16.3 9.77 4.45 4.55 2.34 22.0 2.89
10 242 195 72.5 78.3 27.4 14.9 9.37 4.15 4.15 2.17 17.8 16.911 170 159 317 72.2 26.5 14.1 8.56 3.91 3.83 2.17 16.1 91.612 154 132 397 68.7 25.2 13.4 8.33 3.83 3.54 2.17 17.1 89.613 125 112 300 82.6 24.8 12.6 8.03 3.62 3.37 2.17 22.6 77.814 104 96.7 221 204 25.1 12.1 7.84 3.52 2.94 2.05 24.9 28815 89.8 87.2 169 142 24.2 12.2 7.84 3.26 2.89 1.97 14.7 24216 82.0 82.5 140 119 23.5 12.2 7.32 3.26 3.26 1.97 14.8 33217 75.3 78.3 116 104 23.0 14.5 7.32 3.26 4.94 1.89 19.7 16118 69.6 76.9 106 91.9 22.7 16.5 7.57 3.26 3.74 1.81 16.0 11719 72.4 113 174 81.9 23.2 14.1 7.84 3.26 3.27 1.79 31.7 10120 119 108 179 74.5 22.9 13.3 7.73 3.53 3.07 1.87 18.7 77.321 198 154 152 68.0 21.9 12.2 6.80 3.69 2.77 2.00 12.2 62.522 154 158 129 61.9 21.2 11.9 6.28 3.83 2.58 2.00 9.83 52.223 129 136 111 56.3 20.9 11.7 6.19 3.81 2.36 2.13 7.83 48.924 239 111 98.5 52.0 20.1 11.9 6.38 3.52 2.32 2.17 6.51 44.225 819 93.5 88.7 48.6 19.4 11.2 5.98 3.30 2.17 1.96 5.65 40.726 482 82.5 80.6 46.4 19.3 10.6 6.15 3.54 2.14 1.81 5.00 42.127 306 74.1 74.0 44.3 20.6 9.98 5.95 3.68 2.00 1.83 4.70 79.828 211 67.3 70.2 41.3 25.2 13.8 5.94 3.45 2.07 1.89 4.26 75.829 162 — 65.5 39.5 27.6 26.1 5.55 3.18 2.18 1.96 4.05 64.930 131 — 61.0 37.6 22.1 15.4 5.18 3.01 3.25 2.11 3.83 11731 132 — 57.5 — 19.7 — 5.18 3.17 — 2.50 — 206
TOTAL 6,770.7 3,628.0 3,638.8 2,051.7 793.5 433.98 250.02 123.42 101.13 69.84 332.79 2,462.00MEAN 218 130 117 68.4 25.6 14.5 8.07 3.98 3.37 2.25 11.1 79.4MAX 825 308 397 204 36.4 26.1 13.4 6.03 7.12 3.63 31.7 332MIN 64.6 67.3 44.4 37.6 19.3 9.98 5.18 3.01 2.00 1.79 1.98 2.89AC-FT 13,430 7,200 7,220 4,070 1,570 861 496 245 201 139 660 4,880YEAR 2002 TOTAL=20,655.88 MEAN=56.6 MAX=825 MIN=1.79 AC-FT=40,970
1/1
/02
2/1
/02
3/1
/02
4/1
/02
5/1
/02
6/1
/02
7/1
/02
8/1
/02
9/1
/02
10/1
/02
11/1
/02
12/1
/02
1/1
/03
1
10
100
1000
Dai
ly M
ean
Dis
char
ge
(cfs
)
SCLO — 14202850 — Scoggins Creek above Henry Hagg Lake near Gaston, Oregon [RM 8.0]

APPENDIX E—Stream Gauge RecordsE-6 2002 Tualatin River Flow Management Report
SCHO – 14202920 – SAIN CREEK ABOVE HAGG LAKE NEAR GASTON, OREGON [RM 1.6]
Latitude: 45 28 50 Longitude: 123 14 40 Source Agency: District 18 Watermaster
Day2002 Daily Mean Discharge in Cubic Feet per Second
JAN FEB MAR APR MAY JUN JUL AUG SEP OCT NOV DEC 1 44.4 69.3 31.3 30.0 18.4 10.0 7.45 2.54 1.39 2.15 .85 2.44 2 48.1 64.8 29.5 28.4 17.8 9.59 6.59 2.44 1.40 1.82 .78 2.34 3 45.3 68.0 28.2 27.1 17.2 9.48 6.17 2.51 1.33 2.27 .85 2.27 4 43.0 67.1 27.0 26.0 16.7 9.47 6.14 2.62 1.53 2.54 .78 4.06 5 45.7 64.1 26.3 25.4 17.0 9.15 6.06 2.74 1.48 2.14 .82 3.78 6 97.4 69.1 31.2 24.6 16.8 8.93 5.43 2.85 1.75 1.97 .98 3.02 7 272 99.8 27.1 23.0 15.7 8.90 5.95 2.90 2.74 1.71 3.81 2.65 8 235 128 25.4 21.9 15.2 9.07 6.20 2.45 2.24 1.68 10.0 2.61 9 148 113 26.6 25.0 14.7 9.24 5.47 2.29 1.96 1.67 10.4 2.64
10 111 95.7 43.9 35.1 14.4 8.49 4.68 2.24 1.67 1.53 8.20 18.411 90.1 81.7 106 31.2 14.2 8.43 4.36 2.10 1.50 1.53 7.23 64.412 86.1 72.5 128 28.8 13.6 7.69 4.12 1.73 1.27 1.49 8.95 58.013 74.7 65.3 120 34.2 13.1 7.13 3.96 1.37 1.21 1.36 10.3 50.514 66.5 58.5 103 76.8 13.4 6.82 3.86 1.21 1.14 1.26 12.0 13915 58.9 53.4 84.2 54.9 12.8 6.97 3.83 1.28 1.21 1.24 5.36 11816 53.1 50.1 72.9 47.4 12.5 7.14 3.71 1.33 1.51 1.09 5.33 16017 48.6 47.4 64.8 42.6 12.7 8.65 3.79 1.30 2.47 1.04 7.77 92.718 45.5 46.1 61.3 38.5 11.9 10.0 3.84 1.35 1.96 1.02 6.36 76.519 48.1 59.3 101 35.2 12.8 8.00 3.89 1.47 1.55 1.19 21.8 73.820 75.6 53.2 102 32.8 12.9 7.31 3.98 1.71 1.51 1.30 12.0 58.321 111 58.0 85.6 30.5 11.9 6.66 3.35 1.85 1.32 1.39 7.88 46.922 90.5 55.3 73.3 28.6 11.3 6.44 3.19 1.89 1.14 1.35 5.86 40.123 80.2 51.4 64.8 26.9 11.1 6.56 3.05 1.60 1.05 1.19 4.74 37.324 110 45.1 56.5 25.5 10.6 6.39 3.11 1.46 1.04 1.02 4.04 34.325 271 40.7 50.4 24.1 10.3 5.82 3.16 1.51 1.04 .94 3.47 32.226 177 37.9 45.6 23.4 10.4 5.39 3.24 1.78 1.01 .93 3.07 34.027 126 35.5 41.3 22.3 12.7 5.60 3.10 1.79 .99 .94 2.85 63.628 105 33.3 38.1 20.9 15.5 8.94 3.07 1.46 1.09 1.03 2.68 56.229 88.3 — 35.5 20.0 16.0 15.7 2.94 1.26 1.14 1.00 2.67 47.730 75.9 — 33.3 19.2 12.2 8.65 2.83 1.32 2.50 .88 2.53 86.231 73.9 — 31.6 — 10.6 — 2.76 1.60 — .85 — 126
TOTAL 3,045.9 1,783.6 1,795.7 930.3 426.4 246.61 133.28 57.95 45.14 43.52 174.36 1,539.91MEAN 98.3 63.7 57.9 31.0 13.8 8.22 4.30 1.87 1.50 1.40 5.81 49.7MAX 272 128 128 76.8 18.4 15.7 7.45 2.90 2.74 2.54 21.8 160MIN 43.0 33.3 25.4 19.2 10.3 5.39 2.76 1.21 .99 .85 .78 2.27AC-FT 6,040 3,540 3,560 1,850 846 489 264 115 90 86 346 3,050YEAR 2002 TOTAL=10,222.67 MEAN=28.0 MAX=272 MIN=0.78 AC-FT 20,280
1/1
/02
2/1
/02
3/1
/02
4/1
/02
5/1
/02
6/1
/02
7/1
/02
8/1
/02
9/1
/02
10/1
/02
11/1
/02
12/1
/02
1/1
/03
0.1
1
10
100
1000
Dai
ly M
ean
Dis
char
ge
(cfs
)
SCHO — 14202920 — Sain Creek above Hagg Lake near Gaston, Oregon [RM 1.6]

APPENDIX E—Stream Gauge Records2002 Tualatin River Flow Management Report E-7
UNITED STATES DEPARTMENT OF THE INTERIOR – GEOLOGICAL SURVEY – OREGON DISTRICTSTATION NUMBER: 14202980 SCOGGINS CREEK BL HENRY HAGG LK NR GASTON,OREG.
LATITUDE: 452810 LONGITUDE: 1231156 DRAINAGE AREA: 38.80 DATUM: 87.48
Discharge, Cubic Feet per Second, Calendar Year January to December 2002 Daily Mean ValuesDay JAN FEB MAR APR MAY JUN JUL AUG SEP OCT† NOV† DEC†
1 127 620 9.2 92 60 31 141 153 190 64 96 452 128 557 9.2 65 59 31 126 148 189 74 91 383 128 502 9.2 47 60 61 134 147 181 101 91 334 190 231 9.3 47 60 93 141 146 171 114 91 335 237 16 9.3 101 60 82 141 143 164 122 91 296 187 16 9.5 181 60 67 141 137 170 122 90 287 9.7 17 9.4 180 50 59 141 145 181 122 90 318 9.1 17 9.2 111 42 63 136 148 180 122 62 319 9.2 16 9.3 44 36 63 140 160 178 121 29 31
10 41 16 9.6 35 27 64 161 166 175 124 29 2211 209 16 38 100 31 88 165 166 181 136 29 8.812 278 16 62 155 31 151 152 159 178 146 26 8.113 621 37 202 156 48 170 150 167 172 145 24 9.014 859 59 288 110 62 166 150 183 172 142 24 9.915 786 59 252 80 62 162 143 178 171 142 24 9.516 714 59 211 80 50 162 143 174 162 143 24 1017 680 59 210 81 40 137 152 173 148 145 24 9.518 740 60 306 80 40 109 159 173 142 145 24 9.619 580 60 394 101 40 107 160 167 142 144 24 9.520 267 141 394 117 44 122 154 161 144 144 24 9.721 132 186 392 117 47 122 155 159 144 143 24 9.922 276 82 254 117 47 122 169 155 148 140 23 9.923 367 55 123 83 47 122 175 155 150 136 22 9.124 230 55 123 32 39 139 169 155 152 135 22 8.525 13 25 105 21 33 168 159 155 166 134 29 8.526 9.4 9.2 92 21 29 168 158 160 173 134 43 8.627 9.3 9.3 92 21 27 178 161 168 167 133 46 8.828 163 9.3 92 66 47 164 161 171 163 — 46 8.629 452 — 92 72 47 146 155 178 162 127 45 8.630 563 — 92 60 47 146 156 181 104 117 45 9.631 656 — 92 — 38 — 160 190 — 106 — 9.1
TOTAL 9670.7 3004.8 3999.2 2573 1410 3463 4708 5021 4920 3823 1352 513.8MEAN 312 107 129 85.8 45.5 115 152 162 164 127 45.1 16.6MAX 859 620 394 181 62 178 175 190 190 146 96 45MIN 9.1 9.2 9.2 21 27 31 126 137 104 64 22 8.1AC-FT 19180 5960 7930 5100 2800 6870 9340 9960 9760 7580 2680 1020YEAR 2002 TOTAL=44458.5 MEAN=122 MAX=859 MIN=8.1 AC-FT=88180
† Provisional data–subject to revision
1/1
/02
2/1
/02
3/1
/02
4/1
/02
5/1
/02
6/1
/02
7/1
/02
8/1
/02
9/1
/02
10/1
/02
11/1
/02
12/1
/02
1/1
/03
1
10
100
1000
Dai
ly M
ean
Dis
char
ge
(cfs
)
SCOO — 14202980 — Scoggins Creek below Henry Hagg Lake near Gaston, Oregon [RM 4.8]

APPENDIX E—Stream Gauge RecordsE-8 2002 Tualatin River Flow Management Report
UNITED STATES DEPARTMENT OF THE INTERIOR – GEOLOGICAL SURVEY – OREGON DISTRICTSTATION NUMBER: 14203500 TUALATIN RIVER NEAR DILLEY, OREG.
LATITUDE: 452830 LONGITUDE: 1230723 DRAINAGE AREA: 125.00 DATUM: 147.57
Discharge, Cubic Feet per Second, Calendar Year January to December 2002 Daily Mean ValuesDay JAN FEB MAR APR MAY JUN JUL AUG SEP OCT† NOV† DEC†
1 448 1560 264 302 170 90 202 199 241 135 140 672 524 1350 243 277 166 85 184 194 240 125 132 623 516 1210 224 238 162 93 184 196 235 148 133 544 530 1020 211 227 158 141 195 200 222 163 134 555 599 626 204 239 156 139 194 197 218 170 134 596 726 523 233 343 161 135 190 183 223 169 135 487 2270 599 229 340 151 120 189 194 241 168 138 528 3480 921 211 297 134 128 188 192 244 170 164 499 2540 1080 199 214 127 132 183 202 241 172 122 49
10 1720 872 260 273 105 128 195 211 242 173 130 6411 1260 738 461 326 116 133 215 211 238 178 118 18812 1220 655 1050 383 113 186 204 206 238 186 104 32813 1250 584 1210 384 116 222 203 200 224 186 126 31814 1810 548 1280 508 138 220 203 222 224 183 117 44315 1750 490 1100 515 135 215 197 224 225 184 91 69916 1540 445 871 450 127 217 189 219 223 185 69 88217 1310 407 767 412 112 206 204 221 220 186 86 89618 1260 384 722 378 110 184 207 222 207 184 83 70619 1220 440 899 352 111 168 214 220 205 186 125 62320 1020 503 1220 348 115 182 204 211 207 187 135 52321 1030 599 1180 327 118 177 209 210 205 187 91 42222 1170 596 1000 308 112 174 216 205 209 190 72 34223 1380 558 716 279 113 175 221 204 211 185 63 31524 1310 523 616 211 107 180 212 204 211 185 56 28525 2340 446 543 179 94 216 202 205 222 187 53 25926 2510 361 466 170 91 214 198 207 237 177 68 25627 1950 320 421 166 84 217 206 217 234 171 73 38728 1380 290 386 176 112 225 206 216 226 170 71 46029 1500 — 358 200 133 236 201 223 228 167 70 42430 1560 — 337 176 120 214 196 226 206 159 67 51631 1590 — 317 — 108 — 204 239 — 149 — 941
TOTAL 44713 18648 18198 8998 3875 5152 6215 6480 6747 5365 3100 10772 MEAN 1442 666 587 300 125 172 200 209 225 173 103 347 MAX 3480 1560 1280 515 170 236 221 239 244 190 164 941 MIN 448 290 199 166 84 85 183 183 205 125 53 48 AC-FT 88690 36990 36100 17850 7690 10220 12330 12850 13380 10640 6150 21370YEAR 2002 TOTAL=138,263 MEAN=379 MAX=3480 MIN=48 AC-FT=274,200
† Provisional data–subject to revision
DLLO — 14203500 — Tualatin River near Dilley, Oregon [RM 58.8]
1/1
/02
2/1
/02
3/1
/02
4/1
/02
5/1
/02
6/1
/02
7/1
/02
8/1
/02
9/1
/02
10/1
/02
11/1
/02
12/1
/02
1/1
/03
10
100
1000
10000
Dai
ly M
ean
Dis
char
ge
(cfs
)

APPENDIX E—Stream Gauge Records2002 Tualatin River Flow Management Report E-9
GALES – 14204530 – GALES CREEK AT OLD HWY 47 NEAR FOREST GROVE, OREGON [RM 2.36]Latitude: 45 30 39 Longitude: 123 06 56 Source Agency: District 18 Watermaster
Day2002 Daily Mean Discharge in Cubic Feet per Second
JAN FEB MAR* APR* MAY JUN JUL AUG SEP OCT NOV DEC 1 290 601 251 122 53.9 36.8 9.76 7.82 10.0 12.0 31.6 2 359 557 247 118 50.2 29.9 12.1 7.70 9.55 13.7 30.7 3 336 560 246 182 114 47.9 29.3 11.3 7.84 9.19 15.6 27.4 4 322 534 245 174 110 49.6 26.6 13.0 6.96 9.93 16.6 32.6 5 325 500 223 168 108 47.2 27.4 12.0 6.91 9.76 17.6 40.9 6 648 500 219 165 108 45.3 24.8 10.4 8.01 9.50 18.7 35.9 7 2,280 774 200 156 104 45.1 24.4 11.6 9.43 9.08 31.6 28.6 8 3,500 1,150 185 149 96.9 46.0 28.1 10.5 9.12 9.00 85.3 24.6 9 1,620 1,010 177 158 94.0 50.1 22.2 9.79 8.55 9.00 94.5 23.5
10 1,040 809 255 221 90.8 43.3 17.2 9.92 8.39 8.74 94.3 58.611 775 659 684 209 86.7 41.5 15.2 9.91 7.93 8.49 86.2 23012 664 550 1,280 197 84.7 38.5 15.3 8.24 7.42 8.63 79.1 32013 567 471 1,170 203 80.8 36.6 16.0 7.07 6.74 8.52 102 31314 492 409 1,020 430 80.4 36.4 15.4 5.92 6.89 8.23 104 70915 433 364 793 381 78.3 38.4 14.9 7.28 7.52 8.07 84.0 78716 385 339 642 337 74.6 38.0 14.7 7.94 8.03 8.08 70.3 97517 350 312 532 308 75.8 39.5 13.9 8.18 9.37 8.31 90.9 64618 315 293 454 279 72.6 44.2 14.6 7.74 9.22 8.70 82.4 54219 320 347 582 252 74.6 41.1 14.1 7.32 8.60 9.21 94.6 50320 437 335 628 232 75.1 38.1 15.0 6.95 8.27 9.49 98.2 39621 679 425 565 217 72.8 34.6 12.4 7.43 7.93 9.76 83.7 31622 694 515 494 202 69.5 34.9 10.4 7.64 7.34 9.95 72.6 26123 656 476 426 188 67.2 36.0 10.6 6.93 7.04 10.0 65.5 23924 738 403 370 176 63.7 36.4 10.6 6.93 6.46 10.0 58.5 21925 2,530 349 327 168 61.0 32.8 10.8 6.75 6.56 9.94 52.0 20426 2,120 313 298 160 58.8 29.6 11.6 7.17 6.32 10.3 47.5 20527 1,290 284 277 157 57.5 29.0 10.8 6.84 6.52 11.0 44.1 35028 950 264 256 148 66.4 36.6 12.8 7.16 6.64 12.3 40.5 37729 746 — 239 141 75.7 62.0 11.2 6.05 7.56 12.8 37.9 33030 626 — 131 63.6 42.5 11.0 7.06 8.27 11.7 34.8 48931 601 — — 56.8 — 9.47 7.27 — 12.2 — 928
TOTAL 27,088 14,103 13,285 5,889 2,562.3 1,245.3 537.47 264.15 231.36 299.43 1,828.7 9,673.4MEAN 874 504 458 210 82.7 41.5 17.3 8.52 7.71 9.66 61.0 312MAX 3,500 1,150 1,280 430 122 62.0 36.8 13.0 9.43 12.8 104 975MIN 290 264 177 131 56.8 29.0 9.47 5.92 6.32 8.07 12.0 23.5AC-FT 53,730 27,970 26,350 11,680 5,080 2,470 1,070 524 459 594 3,630 19,190YEAR 2002* TOTAL=77,007.11MEAN=213 MAX=3,500 MIN=5.92 AC-FT=52,700
*Incomplete record
1/1
/02
2/1
/02
3/1
/02
4/1
/02
5/1
/02
6/1
/02
7/1
/02
8/1
/02
9/1
/02
10/1
/02
11/1
/02
12/1
/02
1/1
/03
1
10
100
1000
10000
Dai
ly M
ean
Dis
char
ge
(cfs
)
GALES — 14204530 — Gales Creek at Old Hwy 47 near Forest Grove, Oregon [RM 2.36]

APPENDIX E—Stream Gauge RecordsE-10 2002 Tualatin River Flow Management Report
TRGC – 14204800 – TUALATIN RIVER AT GOLF COURSE ROAD NEAR CORNELIUS, OREGON [RM 51.5]
Latitude: 45 30 08 Longitude: 123 03 22 Source Agency: District 18 Watermaster
Day2002 Daily Mean Discharge in Cubic Feet per Second
JAN FEB MAR APR MAY JUN JUL AUG SEP OCT NOV DEC 1 791 1,780 570 579 273 52.5 153 63.2 137 83.5 113 40.8 2 938 1,730 518 545 250 45.6 102 58.2 138 72.6 92.7 37.2 3 940 1,670 474 470 244 39.1 79.1 61.5 128 83.0 92.0 31.0 4 915 1,610 439 430 235 65.3 97.7 79.5 108 113 102 29.0 5 941 1,470 414 408 228 75.7 101 79.4 99.2 124 96.2 41.1 6 1,140 1,240 473 529 229 71.4 78.8 59.9 109 126 101 37.1 7 1,770 1,260 482 541 205 58.3 87.3 62.1 137 122 114 35.2 8 2,590 1,580 432 507 185 69.6 116 55.0 152 115 179 34.9 9 2,640 1,840 401 393 155 93.3 81.8 56.6 140 115 163 34.5
10 2,380 1,850 501 519 144 75.0 66.3 62.9 123 121 186 41.611 2,130 1,690 854 591 112 58.1 77.0 77.7 128 117 141 24812 1,900 1,500 1,530 647 125 70.6 77.5 71.8 126 136 129 71513 1,760 1,320 1,880 651 113 116 73.7 47.8 108 137 162 72714 1,690 1,160 2,000 843 143 115 84.1 56.5 120 130 177 89515 1,700 1,020 1,950 926 140 130 78.6 69.4 133 124 149 1,32016 1,660 915 1,800 844 127 146 60.5 67.3 148 119 73.3 1,49017 1,570 835 1,620 778 106 139 66.7 77.3 155 120 82.3 1,64018 1,470 775 1,440 725 92.1 142 78.0 94.9 158 124 102 1,55019 1,410 808 1,410 668 102 110 82.6 87.3 129 137 96.2 1,38020 1,400 871 1,540 644 117 86.9 80.7 78.0 122 149 208 1,17021 1,490 942 1,640 601 126 75.6 84.6 91.5 115 143 123 94022 1,600 1,080 1,620 547 115 66.9 70.6 80.0 115 154 74.3 76123 1,660 1,080 1,490 508 104 82.9 78.8 73.3 111 137 56.4 68924 1,690 1,010 1,260 399 94.2 76.2 79.6 63.3 99.9 141 43.7 62225 2,010 900 1,050 335 70.5 79.9 76.5 80.3 104 137 37.8 57126 2,540 778 898 316 72.5 81.8 68.2 90.7 123 137 34.9 54727 2,450 702 808 313 58.4 85.9 77.7 86.6 134 126 44.1 73028 2,240 643 743 297 87.9 132 92.8 80.3 125 120 43.4 92729 2,020 — 694 329 135 202 74.2 82.5 141 125 42.0 88630 1,880 — 656 285 120 187 61.5 99.6 149 128 42.9 96031 1,800 — 619 — 82.7 — 74.9 114 — 112 — 1,430
TOTAL 53,115 34,059 32,206 16,168 4,391.3 2,829.6 2,561.8 2,308.4 3,815.1 3,828.1 3,101.2 20,560.4MEAN 1,713 1,216 1,039 539 142 94.3 82.6 74.5 127 123 103 663MAX 2,640 1,850 2,000 926 273 202 153 114 158 154 208 1,640MIN 791 643 401 285 58.4 39.1 60.5 47.8 99.2 72.6 34.9 29.0AC-FT 105,400 67,560 63,880 32,070 8,710 5,610 5,080 4,580 7,570 7,590 6,150 40,780YEAR 2002 TOTAL=178,944 MEAN=490 MAX=2,640 MIN=29.0 AC-FT=354,900
1/1
/02
2/1
/02
3/1
/02
4/1
/02
5/1
/02
6/1
/02
7/1
/02
8/1
/02
9/1
/02
10/1
/02
11/1
/02
12/1
/02
1/1
/03
10
100
1000
10000
Dai
ly M
ean
Dis
char
ge
(cfs
)
TRGC — 14204800 — Tualatin River at Golf Course Road near Cornelius, Oregon [RM 51.5]

APPENDIX E—Stream Gauge Records2002 Tualatin River Flow Management Report E-11
UNITED STATES DEPARTMENT OF THE INTERIOR – GEOLOGICAL SURVEY – OREGON DISTRICT STATION NUMBER: 14205400 EAST FORK DAIRY CREEK NEAR MEACHAM CORNER, OR
LATITUDE: 454051 LONGITUDE: 1230412 DRAINAGE AREA: 32.92 DATUM: 290
Discharge, Cubic Feet per Second, Calendar Year January to December 2002 Daily Mean ValuesDay JAN FEB MAR APR MAY JUN JUL AUG SEP OCT† NOV† DEC†
1 32 22 13 10 e11 10 112 31 21 13 10 e10 11 113 30 20 13 10 11 11 114 30 20 13 10 11 11 115 29 19 14 10 9.9 11 116 29 19 13 11 9.5 11 107 29 19 13 11 9.3 13 108 47 30 20 13 11 9.2 17 109 46 29 19 13 11 9.0 24 10
10 46 28 18 12 9.8 e10 17 2211 44 27 18 12 9.8 e9.0 15 4212 43 26 17 12 9.6 8.5 16 4413 42 25 16 12 9.3 8.3 17 4314 42 25 16 12 9.0 8.3 20 11315 40 26 16 12 9.3 7.8 14 8816 39 24 16 12 9.7 7.7 14 27117 42 26 16 11 10 8.8 15 12218 39 27 16 11 9.9 e8.0 13 11419 39 25 16 11 9.5 7.9 15 9820 39 24 16 11 9.3 8.1 14 7821 38 23 16 11 8.9 8.4 13 6222 36 23 15 12 8.7 8.4 12 5223 36 22 15 11 8.6 9.3 12 4824 35 22 15 11 8.5 8.0 12 4425 34 21 15 12 9.6 8.0 11 4126 34 21 15 11 8.3 8.0 11 4227 35 21 14 11 8.2 8.1 11 6328 38 25 14 11 8.4 8.3 11 6029 — 39 28 14 10 8.8 8.5 11 5930 — 34 23 14 10 e12 9.1 11 14031 — — 33 — 14 10 — 10 — 308
TOTAL 781 521 366 289.2 276.4 404 2049MEAN 26.0 16.8 11.8 9.64 8.92 13.5 66.1MAX 32 22 14 12 11 24 308MIN 21 14 10 8.2 7.7 10 10AC-FT 1550 1030 726 574 548 801 4060† Provisional data–subject to revision
1/1
/02
2/1
/02
3/1
/02
4/1
/02
5/1
/02
6/1
/02
7/1
/02
8/1
/02
9/1
/02
10/1
/02
11/1
/02
12/1
/02
1/1
/03
1
10
100
1000
Dai
ly M
ean
Dis
char
ge
(cfs
)
5400 — 14205400 — East Fork Dairy Creek near Meacham Corner, Oregon

APPENDIX E—Stream Gauge RecordsE-12 2002 Tualatin River Flow Management Report
MCSC – 14206070 – MCKAY CREEK AT SCOTCH CHURCH RD NEAR NORTH PLAINS, OREGON [RM 6.3]Latitude: 45 57 21 Longitude: 122 99 18 Source Agency: District 18 Watermaster
Day2002 Daily Mean Discharge in Cubic Feet per Second
JAN* FEB* MAR* APR MAY JUN JUL AUG SEP OCT NOV DEC* 1 93.6 194 73.9 49.6 27.6 11.4 7.91 .97 .44 9.70 4.35 6.18 2 159 188 66.1 46.4 25.8 10.8 6.66 1.62 .49 5.70 4.61 6.30 3 135 184 59.1 43.8 24.5 10.4 5.68 .99 .30 8.06 5.42 6.57 4 118 183 55.0 41.4 22.8 9.81 4.42 .77 .29 9.54 5.85 6.93 5 118 178 53.3 40.4 22.2 10.8 3.75 1.80 .22 7.73 6.18 7.50 6 247 168 70.8 41.5 23.6 9.83 4.17 2.09 .42 4.33 7.21 7.85 7 r r 73.3 36.9 21.9 9.12 4.26 .93 .60 3.80 8.30 7.59 8 r r 62.0 34.1 20.6 9.23 6.40 .73 1.18 3.45 11.5 7.46 9 r r 58.0 34.8 19.5 9.94 6.75 .60 1.37 3.05 14.8 7.46
10 r r 63.6 51.2 18.9 9.74 5.30 .51 1.26 3.56 20.7 11.311 r 260 r 52.6 18.0 9.46 3.18 .55 .75 2.84 14.0 31.612 225 192 r 48.1 17.2 8.82 2.87 .70 .47 2.54 12.2 46.413 177 157 r 45.8 16.8 7.58 3.14 .44 .49 2.55 13.2 52.714 144 129 r 67.6 17.5 7.45 3.71 .27 .91 2.58 14.7 84.815 120 109 307 76.0 16.1 7.98 2.80 .18 .67 3.15 13.9 10216 102 103 256 74.7 15.3 8.00 2.46 .28 .55 3.42 10.1 21417 96.9 93.6 205 73.5 17.6 8.30 2.01 .18 1.36 3.81 9.14 19718 88.4 83.6 166 68.1 17.0 10.0 2.81 .21 3.18 4.20 9.48 14419 97.8 89.6 217 59.3 15.6 11.3 3.16 .37 2.83 4.16 8.49 13020 126 82.1 284 56.1 17.0 9.45 3.67 .32 2.80 5.76 8.74 98.821 189 80.2 256 53.5 16.3 8.22 3.42 .38 1.30 4.41 8.13 76.022 257 85.1 204 48.9 15.4 7.26 2.31 .36 .75 4.34 7.18 59.623 258 130 163 43.8 15.0 6.41 2.29 .66 .59 4.45 6.63 58.224 238 127 130 39.4 13.2 6.71 1.82 .45 .70 4.36 6.21 53.025 r 110 107 37.3 12.7 5.92 2.05 .48 .59 4.15 6.04 50.126 r 100 91.8 35.9 12.8 5.56 2.42 .38 .87 3.90 5.95 48.327 r 91.4 80.2 39.5 12.5 5.11 3.26 .26 .48 3.92 5.82 85.128 r 83.3 70.9 34.5 15.0 6.57 2.78 .38 .93 4.09 5.94 10529 274 — 63.1 30.6 16.6 14.4 2.98 .15 1.28 4.21 6.09 10330 208 — 57.2 29.0 14.7 11.9 1.59 .20 2.45 4.17 6.25 14431 176 — 53.2 — 12.5 — 1.48 .25 — 3.89 —
TOTAL 3,647.7 3,200.9 3,346.5 1,434.3 552.2 267.47 111.51 18.46 30.52 139.82 267.11 1,958.74MEAN 166 133 124 47.8 17.8 8.92 3.60 .60 1.02 4.51 8.90 65.3MAX 274 260 307 76.0 27.6 14.4 7.91 2.09 3.18 9.70 20.7 214MIN 88.4 80.2 53.2 29.0 12.5 5.11 1.48 .15 .22 2.54 4.35 6.18AC-FT 7,240 6,350 6,640 2,840 1,100 531 221 37 61 277 530 3,890YEAR 2002* TOTAL=14,975.23 MEAN=43.2 MAX=307 MIN=0.15 AC-FT=29,700
*Incomplete record; r = Mean flow & stage exceed rating curve
1/1
/02
2/1
/02
3/1
/02
4/1
/02
5/1
/02
6/1
/02
7/1
/02
8/1
/02
9/1
/02
10/1
/02
11/1
/02
12/1
/02
1/1
/03
0.1
1
10
100
1000
Dai
ly M
ean
Dis
char
ge
(cfs
)
MCSC — 14206070 — McKay Creek at Scotch Church Road near Hillsboro, Oregon [RM 6.3]

APPENDIX E—Stream Gauge Records2002 Tualatin River Flow Management Report E-13
WCJS – 14206100 – WAIBLE CREEK AT JACKSON SCHOOL RD NEAR HILLSBORO, OREGON [RM 1.0]Latitude: 45 33 55 Longitude: 122 58 12 Source Agency: District 18 Watermaster
Day2002 Daily Mean Discharge in Cubic Feet per Second
JAN* FEB* MAR* APR MAY JUN JUL AUG SEP OCT NOV DEC 1 36 32 7.3 2.1 .36 1.8 1.6 .25 .10 .13 .29 .45 2 48 25 6.1 1.9 .39 1.7 1.5 .24 .10 .14 .27 .42 3 32 22 5.4 1.7 .80 1.7 1.3 .23 .11 .15 .26 .40 4 26 18 5.0 1.6 1.2 1.6 1.2 .22 .11 .13 .26 .43 5 32 18 4.7 1.7 1.4 1.5 1.1 .21 .12 .13 .26 .46 6 r 19 17 1.8 1.5 1.3 1.0 .20 .11 .13 .26 .48 7 r r 12 1.5 1.5 1.3 .96 .20 .12 .14 .28 .47 8 r r 1.4 1.5 1.2 1.1 .19 .12 .13 .36 .46 9 69 53 1.6 1.6 1.2 1.3 .18 .12 .13 1.5 .46
10 48 38 3.3 1.6 1.1 1.2 .17 .12 .13 2.5 1.511 37 30 2.4 1.6 .97 1.1 .16 .13 .12 1.8 7.212 31 24 2.0 1.5 .90 .96 .16 .13 .13 1.6 5.813 27 19 1.9 1.5 .82 .87 .15 .13 .13 1.9 9.014 22 15 4.8 1.7 .75 .78 .14 .13 .14 2.4 3315 17 12 2.6 1.7 .70 .72 .14 .13 .14 1.9 1916 15 14 2.3 1.8 .66 .66 .14 .12 4.5 1.6 r17 15 12 2.1 2.2 .64 .63 .14 .13 4.6 1.6 3618 15 10 1.9 2.1 .64 .61 .14 .13 2.2 1.5 2919 20 22 1.8 2.0 .63 .58 .14 .14 .71 1.4 2120 39 14 1.8 2.4 .61 .55 .14 .14 .41 1.3 1321 44 15 1.8 2.2 .58 .51 .14 .15 1.9 1.2 9.422 61 13 1.8 2.0 .55 .47 .14 .15 2.0 1.1 8.123 43 57 1.3 2.1 .52 .44 .15 .15 1.3 .96 1124 40 27 .51 1.9 .49 .41 .15 .15 .93 .86 8.425 r 18 .39 1.8 .45 .39 .13 .14 .72 .75 7.026 88 14 4.6 .36 1.7 .40 .37 .14 .14 .59 .67 8.627 73 11 3.8 .38 1.7 .35 .35 .13 .15 .49 .61 4828 49 8.9 3.3 .38 2.2 .37 .32 .13 .12 .44 .56 3129 36 — 2.9 .37 2.5 1.1 .31 .13 .12 .40 .52 3130 32 — 2.5 .36 2.1 1.7 .29 .11 .13 .36 .48 r31 30 — 2.3 — 2.0 — .27 .10 — .32 — r
TOTAL 1,025 560.9 76.9 49.85 52.55 28.23 23.85 4.99 3.84 23.87 30.95 341.03MEAN 38.0 21.6 5.92 1.66 1.70 .94 .77 .16 .13 .77 1.03 12.2MAX 88 57 17 4.8 2.5 1.8 1.6 .25 .15 4.6 2.5 48MIN 15 8.9 2.3 .36 .36 .35 .27 .10 .10 .12 .26 .40AC-FT 2,030 1,110 153 99 104 56 47 9.9 7.6 47 61 676YEAR 2002* TOTAL=2,221.96 MEAN=6.57 MAX=88 MIN=.10 AC-FT=4,410*Incomplete record; r = Mean flow & stage exceed rating curve
1/1
/02
2/1
/02
3/1
/02
4/1
/02
5/1
/02
6/1
/02
7/1
/02
8/1
/02
9/1
/02
10/1
/02
11/1
/02
12/1
/02
1/1
/03
0.01
0.1
1
10
100
Dai
ly M
ean
Dis
char
ge
(cfs
)
WCJS — 14206100 — Waible Creek at Jackson School Road near Hillsboro, Oregon [RM 1.0]

APPENDIX E—Stream Gauge RecordsE-14 2002 Tualatin River Flow Management Report
DAIRY – 14206200 – DAIRY CREEK AT HWY 8 NEAR HILLSBORO, OREGON [RM 2.06]Latitude: 45 30 38 Longitude: 123 06 56 Source Agency: District 18 Watermaster
Day2002 Daily Mean Discharge in Cubic Feet per Second
JAN* FEB* MAR* APR MAY JUN JUL AUG SEP OCT NOV DEC* 1 r r 801 545 185 83.4 75.4 14.8 13.9 30.8 35.6 57.6 2 r r 701 478 175 76.7 64.3 18.7 12.3 36.2 41.9 59.0 3 r r 618 424 164 73.1 59.3 15.7 14.2 40.4 45.5 59.4 4 r r 554 382 157 70.8 51.6 18.4 12.2 41.0 49.7 63.2 5 r r 511 358 149 69.2 49.2 23.3 14.4 40.8 50.6 63.9 6 r r 585 364 152 66.9 46.3 22.9 19.8 36.3 53.3 63.9 7 r r 720 345 145 63.7 42.9 21.1 26.4 35.1 59.3 63.2 8 r r 593 311 139 61.9 50.8 22.0 29.8 31.4 71.7 61.6 9 r r 516 285 133 67.8 53.1 23.2 31.8 31.7 94.7 61.5
10 r r 527 380 129 72.0 46.5 16.1 28.2 29.2 118 82.611 r r r 511 124 64.7 37.7 18.3 29.8 27.2 112 14812 r r r 460 117 59.4 31.1 22.5 25.9 32.5 109 35413 r r r 416 115 47.2 27.8 15.5 32.7 31.5 96.8 50814 r r r 545 115 50.6 26.7 11.7 24.5 32.5 110 r15 r r r 798 114 48.0 27.9 9.76 21.3 31.5 106 r16 r r r 763 107 49.0 28.6 12.2 16.1 30.1 90.5 r17 r r r 704 114 49.1 27.2 10.0 22.9 30.1 81.8 r18 r r r 635 117 51.8 23.3 6.43 21.5 43.4 83.9 r19 r r r 541 108 55.5 24.3 11.7 22.2 36.5 83.4 r20 r r r 474 111 52.2 23.0 17.8 20.6 33.3 69.2 r21 r r r 439 115 47.0 24.0 20.2 18.6 36.9 65.1 r22 r r r 394 106 43.8 24.5 23.0 16.4 38.6 66.2 r23 r r r 351 102 43.9 17.0 23.2 14.5 42.6 64.3 76424 r r r 303 97.7 43.5 12.9 23.3 12.5 40.1 62.6 64025 r r r 267 91.6 43.4 13.9 19.6 10.8 41.0 60.2 54526 r r r 251 89.4 47.7 14.9 19.2 8.30 39.7 59.9 48327 r r r 259 88.1 46.3 16.6 21.4 9.55 39.6 57.9 r28 r r r 243 93.0 53.9 18.1 23.7 10.7 37.6 57.8 r29 r — 794 218 108 84.7 23.4 19.2 12.5 39.7 56.8 r30 r — 678 199 111 100 22.8 23.4 19.5 36.4 57.4 r31 r — 606 — 93.8 — 15.3 17.7 — 34.4 — r
TOTAL 8,204 12,643 3,765.6 1,787.2 1,020.4 565.99 573.85 1,108.1 2,171.1 4,077.9MEAN 631 421 121 59.6 32.9 18.3 19.1 35.7 72.4 240MAX 801 798 185 100 75.4 23.7 32.7 43.4 118 764MIN 511 199 88.1 43.4 12.9 6.43 8.30 27.2 35.6 57.6AC-FT 16,270 25,080 7,470 3,540 2,020 1,120 1,140 2,200 4,310 8,090YEAR 2002* TOTAL=35,917.14 MEAN=131 MAX=801 MIN=6.43 AC-FT=71,240*Incomplete record; r = Mean flow & stage exceed rating curve
1/1
/02
2/1
/02
3/1
/02
4/1
/02
5/1
/02
6/1
/02
7/1
/02
8/1
/02
9/1
/02
10/1
/02
11/1
/02
12/1
/02
1/1
/03
1
10
100
1000
Dai
ly M
ean
Dis
char
ge
(cfs
)
DAIRY — 14206200 — Dairy Creek at Hwy 8 near Hillsboro, Oregon [RM 2.06]

APPENDIX E—Stream Gauge Records2002 Tualatin River Flow Management Report E-15
ROOD –14206295 – TUALATIN RIVER AT ROOD BRIDGE ROAD NEAR HILLSBORO, OREGON [RM 38.44]Latitude: 45 29 24 Longitude: 122 57 06 Source Agency: District 18 Watermaster
Day2002 Daily Mean Discharge in Cubic Feet per Second
JAN FEB MAR APR MAY JUN JUL AUG SEP OCT NOV DEC 1 1,600 3,710 1,040 841 400 161 244 99.3 119 173 108 92.5 2 1,700 3,410 933 780 379 131 183 92.9 129 118 108 92.2 3 1,770 3,180 847 713 357 125 137 91.1 127 121 104 90.2 4 1,680 2,980 784 651 348 123 123 93.4 121 157 105 90.4 5 1,600 2,800 733 613 337 142 133 109 113 146 108 93.4 6 1,890 2,640 846 655 335 144 124 102 112 140 106 96.1 7 2,810 2,520 1,050 685 325 130 119 92.5 119 134 112 91.6 8 3,730 2,810 892 651 300 127 153 93.2 134 126 160 89.1 9 5,520 2,970 773 596 282 146 164 90.3 141 122 233 87.4
10 6,470 2,990 762 690 255 159 122 90.4 129 122 278 13211 5,930 3,030 1,150 824 243 134 112 95.3 125 122 241 29212 5,110 2,980 2,280 817 221 122 113 103 123 122 206 70613 4,460 2,840 2,700 792 219 134 110 93.6 123 126 216 1,04014 3,970 2,660 2,790 937 222 154 111 82.7 118 127 259 1,23015 3,530 2,430 2,930 1,170 239 155 114 89.5 121 122 237 1,73016 3,200 2,180 3,030 1,150 225 165 108 94.6 131 121 171 2,18017 2,940 1,900 3,010 1,080 242 178 98.0 95.2 156 118 131 2,49018 2,670 1,600 2,910 1,040 232 203 104 100 163 119 128 2,39019 2,430 1,470 2,820 927 202 200 109 107 147 124 131 2,29020 2,340 1,500 2,780 836 233 152 112 102 128 126 154 2,13021 2,300 1,450 2,690 784 252 133 111 105 123 129 172 1,86022 2,370 1,520 2,620 734 234 120 110 106 120 126 129 1,50023 2,450 1,760 2,550 677 218 119 101 100 120 127 113 1,19024 2,490 1,910 2,410 609 202 125 105 95.4 115 122 105 1,01025 2,870 1,710 2,180 521 178 118 104 92.5 114 123 96.5 88726 3,520 1,490 1,860 476 160 120 102 104 115 123 91.8 81727 4,570 1,300 1,520 508 157 118 100 106 122 120 90.8 1,08028 5,150 1,160 1,250 487 186 134 107 106 123 119 94.6 1,48029 4,880 — 1,090 454 267 304 111 102 124 116 92.6 1,54030 4,440 — 983 435 269 328 100 106 155 116 92.6 1,59031 4,050 — 901 — 212 — 98.4 114 — 114 — 2,430
TOTAL 104,440 64,900 55,114 22,133 7,931 4,604 3,742.4 3,053.9 3,810 3,921 4,373.9 32,816.9MEAN 3,369 2,318 1,778 738 256 153 121 98.5 127 126 146 1,059MAX 6,470 3,710 3,030 1,170 400 328 244 114 163 173 278 2,490MIN 1,600 1,160 733 435 157 118 98.0 82.7 112 114 90.8 87.4AC-FT 207,200 128,700 109,300 43,900 15,730 9,130 7,420 6,060 7,560 7,780 8,680 65,090YEAR 2002 TOTAL=310,840 MEAN=852 MAX=6,470 MIN=82.7 AC-FT 616,600
1/1
/02
2/1
/02
3/1
/02
4/1
/02
5/1
/02
6/1
/02
7/1
/02
8/1
/02
9/1
/02
10/1
/02
11/1
/02
12/1
/02
1/1
/03
10
100
1000
10000
Dai
ly M
ean
Dis
char
ge
(cfs
)
ROOD — 14206295 — Tualatin River at Rood Bridge Road near Hillsboro, Oregon [RM 38.4]

APPENDIX E—Stream Gauge RecordsE-16 2002 Tualatin River Flow Management Report
RCRR – 14206305 – ROCK CREEK AT ROCK CREEK RD NEAR BOWERS JUNCTION, OREGON [RM 15.8]Latitude: 45 37 04 Longitude: 12 53 13 Source Agency: District 18 Watermaster
Day2002 Daily Mean Discharge in Cubic Feet per Second
JAN* FEB* MAR* APR* MAY JUN JUL AUG SEP OCT NOV DEC* 1 .92 .28 .21 .01 0 .03 .02 .24 2 .87 .26 .15 .01 0 .01 .02 .24 3 .81 .22 .13 .01 0 .07 .02 .24 4 .71 .30 .11 .01 0 .04 .02 .31 5 .84 .32 .11 .01 0 .02 .04 .31 6 .78 .25 .10 .01 0 .02 .08 .29 7 .69 .22 .10 .01 0 .03 .23 .27 8 .68 .25 .26 .01 0 .03 .52 .25 9 .62 .33 .16 .01 0 .03 .87 .28
10 .60 .27 .09 .01 0 .03 .78 1.3511 .54 .22 .07 .01 0 .03 .57 2.7712 .50 .18 .05 .01 0 .02 .67 2.7013 .55 .14 .04 0 0 .02 .79 3.5114 .59 .11 .03 0 0 .01 .92 8.9815 .49 .13 .03 0 0 .01 .57 5.2816 .46 .14 .03 0 0 .01 .73 29.517 .75 .25 .03 0 .01 .01 .95 6.3718 .56 .45 .03 0 .01 .01 .79 7.9419 .54 .38 .04 0 .01 .01 .60 5.1120 .84 .27 .04 0 .01 .02 .22 2.9621 .59 .19 .03 0 0 .06 .23 1.9922 .52 .16 .01 0 0 .05 .24 1.6623 .46 .14 .03 0 0 .04 .25 1.9124 .41 .12 .08 0 0 .04 .26 1.7325 .38 .09 .09 0 0 .04 .22 1.5126 1.55 .37 .10 .09 0 0 .04 .21 1.7027 1.65 .40 .10 .08 0 0 .04 .23 10.828 1.31 .76 .38 .07 0 0 .05 .22 7.5329 — 1.13 .70 1.03 .04 0 .01 .06 .22 6.0830 — 1.02 .45 .35 .02 0 .07 .05 .23 r31 — — .35 — .01 0 — .04 — r
TOTAL 6.66 18.73 7.63 2.36 0.12 0.12 0.97 11.72 113.81MEAN 1.33 .60 .25 .076 .004 .004 .031 .39 3.92MAX 1.65 .92 1.03 .26 .01 .07 .07 .95 29.5MIN 1.02 .35 .09 .01 0 0 .01 .02 .24AC-FT 13 37 15 4.7 .2 .2 1.9 23 226YEAR 2002* TOTAL=162.12 MEAN=0.65 MAX=29.5 MIN=0 AC-FT=322*Incomplete record; r = Mean flow & stage exceed rating curve
1/1
/02
2/1
/02
3/1
/02
4/1
/02
5/1
/02
6/1
/02
7/1
/02
8/1
/02
9/1
/02
10/1
/02
11/1
/02
12/1
/02
1/1
/03
0.01
0.1
1
10
100
Dai
ly M
ean
Dis
char
ge
(cfs
)
RCRR — 14206305 — Rock Creek at Rock Creek Road near Bowers Junction, Oregon [RM 15.8]
NO FLOW
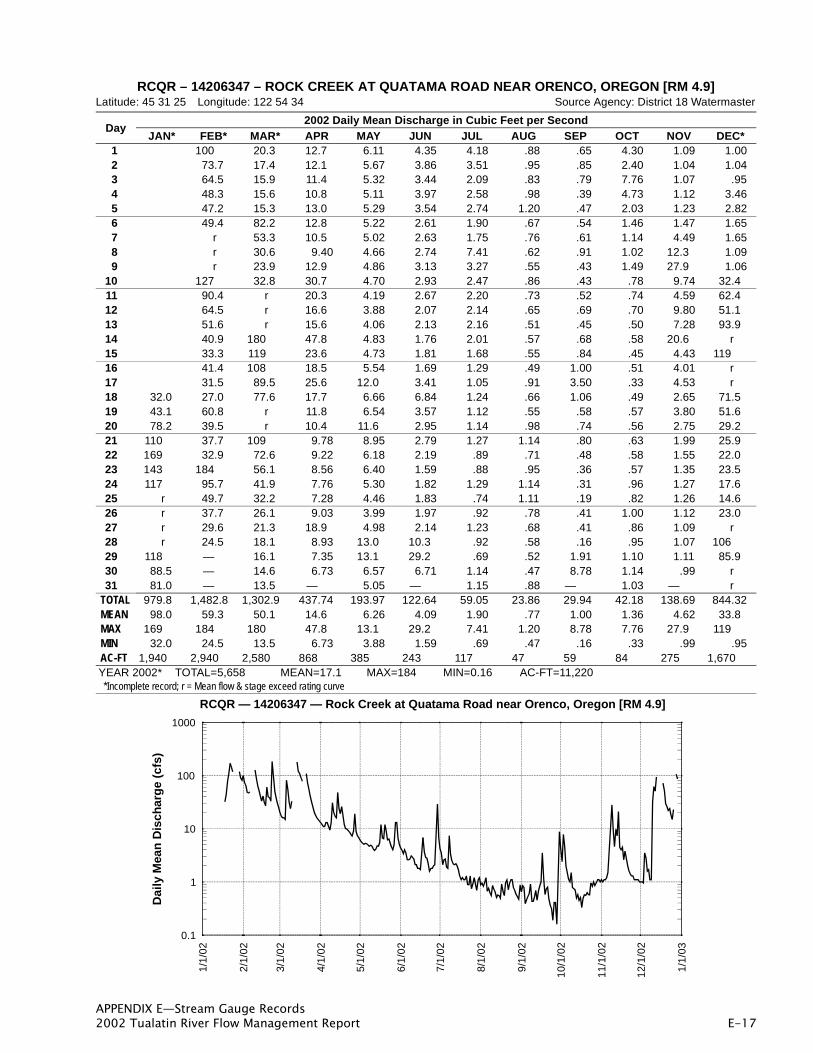
APPENDIX E—Stream Gauge Records2002 Tualatin River Flow Management Report E-17
RCQR – 14206347 – ROCK CREEK AT QUATAMA ROAD NEAR ORENCO, OREGON [RM 4.9]Latitude: 45 31 25 Longitude: 122 54 34 Source Agency: District 18 Watermaster
Day2002 Daily Mean Discharge in Cubic Feet per Second
JAN* FEB* MAR* APR MAY JUN JUL AUG SEP OCT NOV DEC* 1 100 20.3 12.7 6.11 4.35 4.18 .88 .65 4.30 1.09 1.00 2 73.7 17.4 12.1 5.67 3.86 3.51 .95 .85 2.40 1.04 1.04 3 64.5 15.9 11.4 5.32 3.44 2.09 .83 .79 7.76 1.07 .95 4 48.3 15.6 10.8 5.11 3.97 2.58 .98 .39 4.73 1.12 3.46 5 47.2 15.3 13.0 5.29 3.54 2.74 1.20 .47 2.03 1.23 2.82 6 49.4 82.2 12.8 5.22 2.61 1.90 .67 .54 1.46 1.47 1.65 7 r 53.3 10.5 5.02 2.63 1.75 .76 .61 1.14 4.49 1.65 8 r 30.6 9.40 4.66 2.74 7.41 .62 .91 1.02 12.3 1.09 9 r 23.9 12.9 4.86 3.13 3.27 .55 .43 1.49 27.9 1.06
10 127 32.8 30.7 4.70 2.93 2.47 .86 .43 .78 9.74 32.411 90.4 r 20.3 4.19 2.67 2.20 .73 .52 .74 4.59 62.412 64.5 r 16.6 3.88 2.07 2.14 .65 .69 .70 9.80 51.113 51.6 r 15.6 4.06 2.13 2.16 .51 .45 .50 7.28 93.914 40.9 180 47.8 4.83 1.76 2.01 .57 .68 .58 20.6 r15 33.3 119 23.6 4.73 1.81 1.68 .55 .84 .45 4.43 11916 41.4 108 18.5 5.54 1.69 1.29 .49 1.00 .51 4.01 r17 31.5 89.5 25.6 12.0 3.41 1.05 .91 3.50 .33 4.53 r18 32.0 27.0 77.6 17.7 6.66 6.84 1.24 .66 1.06 .49 2.65 71.519 43.1 60.8 r 11.8 6.54 3.57 1.12 .55 .58 .57 3.80 51.620 78.2 39.5 r 10.4 11.6 2.95 1.14 .98 .74 .56 2.75 29.221 110 37.7 109 9.78 8.95 2.79 1.27 1.14 .80 .63 1.99 25.922 169 32.9 72.6 9.22 6.18 2.19 .89 .71 .48 .58 1.55 22.023 143 184 56.1 8.56 6.40 1.59 .88 .95 .36 .57 1.35 23.524 117 95.7 41.9 7.76 5.30 1.82 1.29 1.14 .31 .96 1.27 17.625 r 49.7 32.2 7.28 4.46 1.83 .74 1.11 .19 .82 1.26 14.626 r 37.7 26.1 9.03 3.99 1.97 .92 .78 .41 1.00 1.12 23.027 r 29.6 21.3 18.9 4.98 2.14 1.23 .68 .41 .86 1.09 r28 r 24.5 18.1 8.93 13.0 10.3 .92 .58 .16 .95 1.07 10629 118 — 16.1 7.35 13.1 29.2 .69 .52 1.91 1.10 1.11 85.930 88.5 — 14.6 6.73 6.57 6.71 1.14 .47 8.78 1.14 .99 r31 81.0 — 13.5 — 5.05 — 1.15 .88 — 1.03 — r
TOTAL 979.8 1,482.8 1,302.9 437.74 193.97 122.64 59.05 23.86 29.94 42.18 138.69 844.32MEAN 98.0 59.3 50.1 14.6 6.26 4.09 1.90 .77 1.00 1.36 4.62 33.8MAX 169 184 180 47.8 13.1 29.2 7.41 1.20 8.78 7.76 27.9 119MIN 32.0 24.5 13.5 6.73 3.88 1.59 .69 .47 .16 .33 .99 .95AC-FT 1,940 2,940 2,580 868 385 243 117 47 59 84 275 1,670YEAR 2002* TOTAL=5,658 MEAN=17.1 MAX=184 MIN=0.16 AC-FT=11,220*Incomplete record; r = Mean flow & stage exceed rating curve
1/1
/02
2/1
/02
3/1
/02
4/1
/02
5/1
/02
6/1
/02
7/1
/02
8/1
/02
9/1
/02
10/1
/02
11/1
/02
12/1
/02
1/1
/03
0.1
1
10
100
1000
Dai
ly M
ean
Dis
char
ge
(cfs
)
RCQR — 14206347 — Rock Creek at Quatama Road near Orenco, Oregon [RM 4.9]

APPENDIX E—Stream Gauge RecordsE-18 2002 Tualatin River Flow Management Report
BCCH – 14206360 – BEAVERTON CREEK AT CEDAR HILLS BLVD [RM 7.45]Latitude: 45 49 31 Longitude: 122 81 05 Source Agency: District 18 Watermaster
Day2002 Daily Mean Discharge in Cubic Feet per Second
JAN* FEB MAR APR MAY JUN JUL AUG SEP OCT NOV DEC 1 7.56 3.61 2.20 2.93 1.90 .92 1.59 2.46 3.23 1.69 2 9.10 7.00 3.53 2.00 2.48 1.54 1.11 1.71 1.08 3.18 1.89 3 10.7 6.51 3.29 1.88 2.81 1.46 1.31 1.70 11.1 2.77 1.76 4 8.30 5.99 3.07 2.13 2.15 1.46 1.50 1.70 2.54 2.08 3.29 5 11.4 6.11 9.51 2.28 2.54 1.50 1.49 1.60 1.30 1.77 1.65 6 19.5 53.7 4.27 2.19 2.21 1.35 1.48 1.60 .95 1.88 1.41 7 72.4 11.8 3.53 2.23 2.28 2.18 1.67 1.75 .84 9.14 1.34 8 50.7 8.72 3.34 1.83 3.16 5.02 1.61 1.74 .77 6.23 1.43 9 12.4 8.21 15.9 2.06 2.69 1.71 1.47 1.91 .76 17.6 3.66
10 12.2 16.5 16.5 2.20 2.17 1.44 1.56 1.68 .78 4.68 21.711 9.75 89.1 8.66 2.21 1.95 1.47 1.68 1.71 .78 3.76 27.912 8.69 47.2 5.05 1.24 2.03 1.81 1.76 1.73 .76 13.4 35.113 8.01 18.6 12.6 1.63 2.11 1.85 1.78 1.72 .72 8.19 22.314 7.34 13.4 14.6 1.44 1.88 1.74 2.20 1.75 .91 8.46 59.415 6.85 12.9 5.56 1.47 2.08 1.63 2.27 1.65 1.00 2.11 29.016 11.2 11.7 6.37 1.55 2.21 1.40 2.64 8.41 1.00 6.78 10417 6.75 11.9 8.28 9.03 8.51 1.33 3.92 6.63 1.07 3.20 17.218 7.96 12.0 5.21 1.76 5.02 1.41 5.27 1.19 1.03 6.08 13.919 34.9 28.8 3.83 2.88 2.06 1.41 5.84 1.10 1.02 3.27 10.220 8.50 11.8 3.46 7.46 1.78 1.52 5.64 1.21 1.05 1.60 7.7021 9.45 9.74 3.15 4.39 1.67 1.69 1.85 1.31 1.14 1.25 12.022 7.15 8.98 2.66 2.98 1.49 1.76 1.95 1.74 1.11 1.11 11.323 85.8 8.37 2.27 1.85 1.58 1.49 2.09 1.71 1.19 1.11 7.8924 12.8 7.70 2.18 1.44 1.57 1.26 2.06 1.65 1.28 .97 7.7425 10.4 7.29 2.60 1.57 1.73 1.32 1.85 1.75 1.35 1.02 5.4626 9.44 6.70 9.63 1.41 1.73 1.20 1.80 1.73 1.20 1.25 17.727 8.72 4.92 10.9 8.69 1.46 1.10 1.69 1.65 1.11 1.41 44.528 8.14 4.56 3.33 15.2 16.5 1.05 1.75 1.67 2.13 1.23 24.629 — 4.23 2.64 6.86 14.9 1.08 1.70 6.95 .98 1.40 14.830 — 3.96 2.28 3.31 2.82 .98 1.49 10.4 1.02 1.52 95.331 — 3.75 — 3.49 — .96 1.74 — 3.17 — 82.4
TOTAL 468.55 459.70 181.81 102.86 100.50 49.02 67.09 74.64 47.60 121.68 690.21MEAN 17.4 14.8 6.06 3.32 3.35 1.58 2.16 2.49 1.54 4.06 22.3MAX 85.8 89.1 16.5 15.2 16.5 5.02 5.84 10.4 11.1 17.6 104MIN 6.75 3.75 2.18 1.24 1.46 .96 .92 1.10 .72 .97 1.34AC-FT 929 912 361 204 199 97 133 148 94 241 1,370YEAR 2002* TOTAL=2,363.66 MEAN=7.10 MAX=104 MIN=0.72 AC-FT=4,690
*Incomplete record
1/1
/02
2/1
/02
3/1
/02
4/1
/02
5/1
/02
6/1
/02
7/1
/02
8/1
/02
9/1
/02
10/1
/02
11/1
/02
12/1
/02
1/1
/03
0.1
1
10
100
1000
Dai
ly M
ean
Dis
char
ge
(cfs
)
BCCH — 14206360 — Beaverton Creek at Cedar Hills Blvd at Beaverton, Oregon [RM 7.45]

APPENDIX E—Stream Gauge Records2002 Tualatin River Flow Management Report E-19
ECMR – 14206365 – ERICKSON CREEK AT MENLO DRIVE AT BEAVERTON, OREGON [RM 0.76]Latitude: 45 29 14 Longitude: 122 58 54 Source Agency: District 18 Watermaster
Day2002 Daily Mean Discharge in Cubic Feet per Second
JAN* FEB* MAR APR MAY JUN JUL AUG SEP OCT NOV DEC* 1 0.77 0.35 0.27 0.15 0.12 0.2 0.1 0.12 0.23 0.08 0.08 2 0.58 0.35 0.26 0.13 0.1 0.19 0.07 0.06 0.09 0.09 0.1 3 0.8 0.31 0.24 0.1 0.1 0.16 0.07 0.06 1.2 0.09 0.1 4 0.49 0.31 0.23 0.1 0.1 0.18 0.08 0.09 0.18 0.15 0.24 5 0.92 0.36 0.82 0.14 0.09 0.16 0.08 0.09 0.07 0.08 0.12 6 1.5 5.1 0.29 0.11 0.08 0.24 0.09 0.18 0.06 0.15 0.08 7 8.6 0.83 0.2 0.11 0.09 0.32 0.11 0.12 0.06 1 0.08 8 2.9 0.52 0.19 0.12 0.12 0.62 0.07 0.1 0.06 0.67 0.08 9 1.1 0.5 1.4 0.1 0.07 0.21 0.04 0.08 0.05 2 0.31
10 1 1.3 1.3 0.1 0.08 0.15 0.06 0.07 0.06 0.54 211 0.71 7.6 0.52 0.1 0.08 0.13 0.07 0.08 0.06 0.44 2.412 0.58 2.7 0.31 0.09 0.09 0.12 0.07 0.08 0.06 1.3 4.213 0.5 1.6 1.3 0.13 0.09 0.14 0.06 0.07 0.06 0.87 1.614 0.44 0.92 1.0 0.09 0.09 0.11 0.05 0.1 0.07 0.74 1015 0.41 0.9 0.36 0.09 0.11 0.14 0.03 0.1 0.05 0.16 5.916 0.83 0.72 0.43 0.1 0.25 0.06 0.02 1.0 0.06 0.8 r17 0.4 0.71 0.64 0.88 1.5 0.07 0.02 0.76 0.06 0.23 4.818 0.54 0.9 0.36 0.14 0.71 0.08 0.05 0.08 0.06 0.61 2.919 2.7 2.5 0.36 0.21 0.22 0.07 0.04 0.07 0.06 0.3 0.6720 0.59 0.8 0.34 0.61 0.09 0.14 0.55 0.07 0.06 0.15 0.521 0.7 0.62 0.28 0.25 0.08 0.07 0.09 0.07 0.06 0.11 0.8922 0.47 0.51 0.27 0.25 0.09 0.08 0.08 0.06 0.06 0.11 0.923 r 0.44 0.25 0.14 0.09 0.06 0.06 0.07 0.05 0.1 0.4924 0.83 0.39 0.24 0.1 0.09 0.05 0.07 0.07 0.06 0.09 0.5125 6.3 0.6 0.37 0.31 0.11 0.1 0.06 0.1 0.07 0.08 0.08 0.3226 2.2 0.52 0.35 0.72 0.09 0.09 0.05 0.11 0.07 0.07 0.08 1.727 2.7 0.44 0.33 0.53 1.4 0.09 0.07 0.07 0.06 0.07 0.08 3.628 1.3 0.39 0.31 0.34 1.8 3.3 0.08 0.07 0.06 0.07 0.08 2.429 0.85 — 0.29 0.29 0.44 2.3 0.07 0.09 1.3 0.07 0.08 1.330 0.73 — 0.29 0.19 0.18 0.25 0.08 0.08 1.1 0.07 0.08 r31 0.99 — 0.28 0.13 — 0.09 0.12 — 0.08 — r
TOTAL 15.07 30.31 33.46 14.24 8.49 10.66 4.25 2.67 6.31 3.4 11.34 48.27MEAN 2.15 1.12 1.08 0.47 0.27 0.36 0.14 0.09 0.21 0.11 0.38 1.72MAX 6.3 8.6 7.6 1.4 1.8 3.3 0.62 0.55 1.3 1.2 2 10MIN 0.73 0.39 0.28 0.19 0.09 0.07 0.05 0.02 0.06 0.05 0.08 0.08AC-FT 30 60 66 28 17 21 8 5 13 7 22 96YEAR 2002* TOTAL=188.47 MEAN=0.56 MAX=10.00 MIN=0.02 AC-FT=374*Incomplete record; r = Mean flow & stage exceed rating curve
1/1
/02
2/1
/02
3/1
/02
4/1
/02
5/1
/02
6/1
/02
7/1
/02
8/1
/02
9/1
/02
10/1
/02
11/1
/02
12/1
/02
1/1
/03
0.01
0.1
1
10
100
Dai
ly M
ean
Dis
char
ge
(cfs
)
ECMR — 14206365 — Erickson Creek at Menlo Drive at Beaverton, Oregon [RM 0.76]

APPENDIX E—Stream Gauge RecordsE-20 2002 Tualatin River Flow Management Report
JCDV – 14206372 – JOHNSON CREEK AT DAVIS ROAD [RM 1.3]Latitude:45 28 30 Longitude:122 49 52 Source Agency: District 18 Watermaster
Day2002 Daily Mean Discharge in Cubic Feet per Second
JAN* FEB MAR APR MAY JUN* JUL AUG SEP OCT NOV DEC* 1 11.7 4.69 1.41 .89 .76 .54 .86 .27 .16 1.84 .02 .16 2 7.08 3.78 1.24 .84 .67 .42 .84 .20 .14 .93 .03 .22 3 5.51 4.16 1.16 .86 .58 .30 .72 .25 .13 4.27 .03 .17 4 4.20 3.18 1.11 .81 .42 .34 .52 .37 .11 1.81 .03 .83 5 10.1 3.96 1.14 2.23 .44 .35 .42 .39 .11 1.08 .03 1.13 6 r 5.44 16.9 1.08 .48 .31 .41 .25 .61 .88 .06 .80 7 r 28.9 3.93 .85 .39 .31 .51 .21 .43 .76 2.25 .64 8 33.2 17.8 2.67 .75 .35 .28 2.12 .16 .28 .81 3.52 1.11 9 11.9 8.26 2.21 3.51 .31 .26 .88 .26 .20 .51 6.65 .61
10 7.61 6.92 3.47 3.79 .41 .22 .80 .38 .14 .27 3.12 8.8611 5.62 5.07 32.1 2.05 .35 .23 .45 .59 .10 .16 2.75 13.312 5.88 4.13 15.3 1.34 .35 .20 .54 .32 .07 .16 5.92 19.713 3.94 3.61 9.80 5.28 .52 .21 .67 .24 .07 .44 3.84 11.814 3.43 3.12 5.91 4.94 .41 .24 .50 .27 .09 .17 4.47 r15 2.94 2.78 4.64 2.04 .32 .42 .54 .29 .13 .43 1.83 15.016 2.71 4.23 3.74 2.06 .25 .19 .51 .21 2.47 .27 3.79 r17 2.58 3.68 3.13 4.14 2.65 1.54 .49 .14 3.82 .12 2.23 11.618 3.01 3.75 3.26 1.97 .78 1.37 .37 .11 1.00 .08 2.00 9.2919 4.04 14.3 7.84 1.43 .90 .78 .39 .19 .78 .06 2.03 6.4620 7.39 5.82 3.38 1.29 2.61 .46 .44 1.20 .55 .07 1.44 4.8221 7.77 3.75 2.58 1.19 1.02 .30 .34 .64 .28 .07 1.26 6.3122 7.16 1.97 2.22 1.10 1.06 .31 .47 .74 .18 .07 1.12 5.7023 4.83 20.6 1.95 .97 .84 .31 .42 .64 .14 .06 1.06 4.5624 6.52 3.66 1.67 .99 .62 .20 .45 .27 .15 .05 .91 4.0925 33.1 2.65 1.48 .91 .60 .28 .45 .18 .12 .04 1.08 3.2426 13.4 2.21 1.32 1.54 .47 .18 .29 .34 .11 .02 1.19 7.0427 14.0 1.82 1.16 1.59 2.20 .20 .32 .24 .10 .02 .90 19.728 8.23 1.62 1.09 .94 3.57 4.52 .36 .19 .13 .04 .55 12.529 5.87 — .98 .81 1.94 5.43 .31 .18 3.12 .04 .32 9.2330 4.90 — .93 .77 1.00 1.25 .35 .20 3.45 .04 .13 r31 5.80 — .90 — .80 — .35 .20 — .03 — r
TOTAL 244.42 175.86 140.62 52.96 28.07 21.95 17.09 10.12 19.17 15.60 54.56 178.87MEAN 8.43 6.28 4.54 1.77 .91 .73 .55 .33 .64 .50 1.82 6.62MAX 33.2 28.9 32.1 5.28 3.57 5.43 2.12 1.20 3.82 4.27 6.65 19.7MIN 2.58 1.62 .90 .75 .25 .18 .29 .11 .07 .02 .02 .16AC-FT 485 349 279 105 56 44 34 20 38 31 108 355YEAR 2002* TOTAL=959.29 MEAN=2.67 MAX=33.2 MIN=0.02 AC-FT=1,900*Incomplete record; r = Mean flow & stage exceed rating curve
1/1
/02
2/1
/02
3/1
/02
4/1
/02
5/1
/02
6/1
/02
7/1
/02
8/1
/02
9/1
/02
10/1
/02
11/1
/02
12/1
/02
1/1
/03
0.01
0.1
1
10
100
Dai
ly M
ean
Dis
char
ge
(cfs
)
JCDV — 14206372 — Johnson Creek at Davis Road near Beaverton, Oregon [RM 1.3]

APPENDIX E—Stream Gauge Records2002 Tualatin River Flow Management Report E-21
CMMB – 14206395 – CEDAR MILL CREEK AT MURRAY BLVD [RM 1.64] Latitude: 45 30 37 Longitude: 122 49 18 Source Agency: District 18 Watermaster
Day2002 Daily Mean Discharge in Cubic Feet per Second
JAN* FEB* MAR* APR MAY JUN JUL AUG* SEP* OCT NOV DEC* 1 39.4 17.9 6.97 5.06 5.39 7.50 4.61 2.50 3.93 1.75 2.27 2 31.6 12.5 6.40 4.89 5.02 7.22 4.19 2.67 2.20 1.84 2.37 3 15.8 12.4 6.11 5.21 4.59 7.65 3.98 2.10 12.2 2.11 2.45 4 11.1 9.82 5.82 6.39 4.91 7.69 3.57 2.06 4.93 2.37 3.11 5 28.2 12.8 6.35 9.96 7.46 7.15 3.32 1.97 2.79 2.55 2.63 6 r 17.7 57.0 6.16 6.72 7.17 3.03 2.15 1.51 2.39 4.28 2.37 7 r r 15.7 5.18 6.47 7.53 3.39 2.23 1.55 2.14 8.91 2.21 8 r 96.7 8.13 4.62 7.35 7.91 8.57 2.06 1.60 2.04 11.1 2.27 9 37.4 23.2 7.52 31.1 7.65 7.60 3.64 1.85 1.59 2.84 20.2 2.67
10 22.2 17.8 19.4 25.0 7.43 7.61 2.57 1.98 1.65 1.78 8.14 24.311 16.8 13.9 12.6 7.72 6.70 2.57 2.00 1.79 2.23 5.69 37.112 21.2 10.6 87.3 7.13 7.44 6.27 2.20 1.90 1.65 1.49 13.9 47.613 14.4 9.19 35.4 12.0 9.84 5.27 2.12 1.91 1.46 1.46 10.2 47.414 12.0 8.51 21.7 23.1 8.23 4.09 1.98 1.70 1.52 1.65 21.6 10415 10.2 8.61 17.7 7.62 7.33 3.61 1.87 1.69 1.45 1.81 5.22 50.916 9.95 12.8 14.5 6.35 7.84 3.35 1.95 1.75 1.87 1.70 6.77 r17 9.86 8.26 14.6 7.16 13.7 13.8 1.90 1.91 4.52 1.98 4.89 35.318 15.3 8.49 13.5 5.82 8.55 13.3 1.89 1.95 2.24 2.37 5.90 16.819 19.1 29.9 59.9 4.99 9.77 6.29 1.96 2.04 1.78 2.12 5.87 14.120 23.4 10.2 20.3 4.83 19.2 4.51 2.24 2.36 1.59 1.87 3.67 8.2921 24.7 10.5 11.2 4.78 11.9 3.28 2.45 2.13 1.43 1.89 3.18 14.022 33.4 8.08 10.9 5.60 10.4 2.72 2.60 2.02 1.37 1.84 2.95 11.523 17.1 r 9.61 3.80 9.65 2.59 2.25 1.47 1.69 2.70 9.8824 22.7 20.3 8.03 4.01 8.94 2.78 2.14 1.62 1.72 2.46 8.0825 r 10.8 7.01 4.35 8.84 2.18 2.11 1.52 1.64 2.50 6.4926 51.2 9.15 6.34 8.90 8.42 2.06 2.43 1.42 1.71 2.46 17.527 45.1 8.30 6.15 14.2 13.6 2.17 2.44 1.47 1.73 2.47 87.328 28.5 7.55 6.27 6.35 26.5 19.7 2.17 1.57 2.03 2.40 36.029 18.6 — 5.23 5.68 18.3 31.4 2.07 4.23 2.37 2.68 26.230 15.8 — 5.42 6.29 11.8 6.60 2.13 10.5 1.78 2.56 r31 20.5 — 5.20 — 7.93 — 2.14 — 1.73 — r
TOTAL 615.51 415.96 505.66 259.13 298.89 217.70 86.48 44.93 54.37 76.05 173.32 625.09MEAN 22.8 16.0 16.9 8.64 9.64 7.26 2.79 2.04 2.17 2.45 5.78 22.3MAX 51.2 96.7 87.3 31.1 26.5 31.4 8.57 2.67 10.5 12.2 21.6 104MIN 9.86 7.55 5.20 3.80 4.59 2.06 1.87 1.69 1.37 1.46 1.75 2.21AC-FT 1,220 825 1,000 514 593 432 172 89 108 151 344 1,240YEAR 2002* TOTAL=3,373.09 MEAN=9.89 MAX=104 MIN=1.37 AC-FT=6,690*Incomplete record; r = Mean flow & stage exceed rating curve
1/1
/02
2/1
/02
3/1
/02
4/1
/02
5/1
/02
6/1
/02
7/1
/02
8/1
/02
9/1
/02
10/1
/02
11/1
/02
12/1
/02
1/1
/03
1
10
100
1000
Dai
ly M
ean
Dis
char
ge
(cfs
)
CMMB — 14206395 — Cedar Mill Creek at Murray Boulevard near Beaverton, Oregon [RM 1.64]

APPENDIX E—Stream Gauge RecordsE-22 2002 Tualatin River Flow Management Report
WC143 – 14206410 – WILLOW CREEK AT NW 143RD AVE NEAR BEAVERTON, OREGON [RM 3.5]Latitude: 45 32 12 Longitude: 122 49 24 Source Agency: District 18 Watermaster
Day2002 Daily Mean Discharge in Cubic Feet per Second
JAN FEB MAR* APR MAY JUN JUL AUG SEP OCT NOV DEC 1 5.9 3.8 2.1 1.6 1.1 1 0.67 0.25 0.17 1.1 0.27 0.28 2 5 3.2 2 1.6 1.1 0.95 0.52 0.25 0.45 0 0.15 0.28 3 3.9 3.3 2 1.5 1.1 0.93 0.49 0.24 0.47 2.2 0.25 0.27 4 3.2 2.9 1.9 1.5 1 1.2 0.44 0.31 0.26 0.85 0.28 0.8 5 6 3.5 2 2.3 1.2 1 0.39 0.28 0.19 0.55 0.31 0.36 6 17 3.9 7.3 1.9 1.1 0.89 0.4 0.27 0.18 0.34 0.45 0.27 7 31 14 3.2 1.5 1.1 0.92 0.38 0.24 0.25 0.28 1.7 0.24 8 10 8.6 2.5 1.4 0.99 0.98 1.7 0.18 0.24 0.29 1.6 0.34 9 4.9 4.2 2.3 3.2 0.95 0.96 0.58 0.11 0.25 0.26 3.5 0.41
10 3.9 3.8 3.6 3.9 0.98 0.9 0.46 0.08 0.31 0.21 1.3 4.411 3.4 3.4 22 2.5 0.95 0.92 0.38 0.09 0.29 0.2 0.98 5.412 4.1 3 11 1.9 0.92 0.83 0.36 0.13 0.25 0.21 2.5 7.313 3.4 3.1 5.7 2.5 1.1 0.79 0.31 0.15 0.23 0.15 1.6 5.214 3.1 2.7 4.2 3.9 1.2 0.6 0.29 0.13 0.24 0.16 2.9 1215 2.9 2.5 4 2 0.93 0.57 0.3 0.15 0.27 0.18 0.71 7.316 2.9 3.3 3.5 1.8 0.91 0.62 0.26 0.16 0.54 0.18 1.4 2417 3 2.5 3.6 2.3 2.3 2.2 0.3 0.14 1.7 0.19 0.68 4.818 3.6 2.5 3.4 1.9 1.2 1.9 0.31 0.14 0.43 0.21 1.1 3.319 3.9 5 8.1 1.5 1.3 1 0.3 0.18 0.32 0.24 0.87 2.520 4.6 2.8 3.8 1.4 2.7 0.85 0.32 0.22 0.28 0.26 0.49 1.721 5.1 2.9 3 1.4 1.6 0.79 0.28 0.2 0.23 0.24 0.4 2.522 5.9 2.5 2.7 1.3 1.3 0.74 0.28 0.22 0.13 0.42 0.36 2.323 3.8 13 2.6 1.2 1.2 0.71 0.24 0.23 0.13 0.22 0.34 1.924 4.7 3.5 2.4 1.2 1 0.67 0.25 0.2 0.18 0.17 0.36 1.625 24 2.8 2.2 1.1 1 0.61 0.27 0.18 0.17 0.2 0.29 1.226 6.6 2.5 2.2 2.4 1 0.51 0.27 0.25 0.16 0.24 0.27 3.227 6.9 2.3 2 3 1.4 0.5 0.25 0.25 0.18 0.25 0.27 1128 4.8 2.2 2 1.5 3.2 3.6 0.26 0.26 0.18 0.29 0.26 4.529 3.9 — 1.9 1.3 2.3 3.6 0.27 0.24 1.1 0.32 0.26 3.430 3.6 — 1.8 1.2 1.3 0.95 0.28 0.23 2 0.2 0.31 2331 4.3 — 1.7 — 1.1 — 0.25 0.24 — 0.16 — 13
TOTAL 199.3 113.7 122.7 57.7 40.53 32.69 12.06 6.2 11.78 10.77 26.16 148.75MEAN 6.43 4.06 3.96 1.92 1.31 1.09 0.39 0.20 0.39 0.35 0.87 4.80MAX 31 14 22 3.9 3.2 3.6 1.7 0.31 2 2.2 3.5 24MIN 2.9 2.2 1.7 1.1 0.91 0.5 0.24 0.08 0.13 0 0.15 0.24AC-FT 395 226 243 114 80 65 24 12 23 21 52 295YEAR 2002 TOTAL=782.34 MEAN=2.14 MAX=31.00 MIN=0.00 AC-FT=1552
1/1
/02
2/1
/02
3/1
/02
4/1
/02
5/1
/02
6/1
/02
7/1
/02
8/1
/02
9/1
/02
10/1
/02
11/1
/02
12/1
/02
1/1
/03
0.01
0.1
1
10
100
Dai
ly M
ean
Dis
char
ge
(cfs
)
WC143 — 14206410 — Willow Creek at 143rd Avenue near Beaverton, Oregon [RM 3.5]

APPENDIX E—Stream Gauge Records2002 Tualatin River Flow Management Report E-23
WCHP – 14206413 – WILLOW CREEK AT HERITAGE PKWY NEAR BEAVERTON, OREGON [RM 0.75]Latitude: 45 31 12 Longitude: 122 51 35 Source Agency: District 18 Watermaster
Day2002 Daily Mean Discharge in Cubic Feet per Second
JAN* FEB* MAR* APR MAY JUN* JUL AUG SEP* OCT NOV DEC* 1 2.78 1.87 1.24 1.03 1.35 .38 .54 2.19 .31 .67 2 5.43 2.48 1.72 1.20 .94 1.09 .38 .33 .65 .47 .68 3 6.17 2.25 1.70 1.15 .88 .95 .43 .55 8.01 .57 .66 4 4.34 2.14 1.63 1.06 1.31 .90 .53 .30 2.22 .63 3.82 5 7.10 2.31 4.41 1.90 1.00 .88 .55 .39 1.08 .85 1.87 6 8.59 r 2.60 1.36 .78 .84 .52 .39 .80 1.41 .81 7 r 8.91 1.70 1.16 .73 .87 .45 .40 .54 4.72 .65 8 r 5.41 1.54 1.05 .86 5.10 .42 .39 .49 6.91 .64 9 10.3 4.30 10.1 .95 .89 1.31 .31 .32 .43 15.3 1.20
10 8.91 11.7 12.8 .91 .77 1.04 .31 .32 .42 5.92 r11 7.21 r 5.06 .87 .71 .81 .35 .35 .33 4.08 r12 5.09 r 2.84 .87 .66 .68 .30 .34 r 11.8 r13 4.42 17.6 5.38 1.46 .61 .67 .36 .25 .22 7.37 r14 3.99 11.1 12.8 1.33 .58 .56 .37 .30 .22 14.5 r15 3.39 9.61 3.14 .93 .61 .56 .35 .36 .22 3.39 r16 7.95 8.42 2.73 .88 .79 .64 .32 .92 .26 5.51 r17 3.76 8.39 5.32 6.41 4.12 .60 .29 3.51 .24 4.22 22.018 4.33 7.66 3.11 1.37 5.27 .64 .31 1.00 .34 3.49 14.519 16.0 r 1.88 1.53 1.43 .63 .36 .57 .43 5.46 12.420 4.96 9.69 1.73 5.13 1.07 .66 .67 .43 .43 1.76 7.8421 5.40 6.54 1.65 2.86 .93 .64 .52 .40 .44 1.02 11.922 3.72 5.37 1.51 1.63 .81 .55 .49 .26 .40 .93 11.223 r 4.40 1.39 1.41 .78 .55 .42 .21 .59 .87 9.8324 8.01 3.58 1.31 1.05 .71 .51 .34 r .42 .78 7.9025 5.10 3.01 1.27 1.31 .71 .54 .30 .21 .41 .71 5.9426 4.08 2.71 3.01 1.05 .63 .53 .31 .23 .50 .69 r27 3.56 2.46 6.60 2.28 .61 .48 .41 r .64 .72 r28 3.13 2.25 1.67 8.80 r .48 .34 r .71 .66 22.529 — 2.18 1.38 5.77 r .42 .28 2.66 .81 .71 17.030 — 2.03 1.31 1.74 2.05 .46 .29 7.11 .64 .62 r31 — 2.00 — 1.21 — .41 .47 — .41 — r
TOTAL 144.94 151.28 105.16 61.87 32.27 26.35 12.13 23.04 25.49 106.38 154.01MEAN 6.04 5.60 3.51 2.00 1.15 .85 .39 .85 .85 3.55 7.70MAX 16.0 17.6 12.8 8.80 5.27 5.10 .67 7.11 8.01 15.3 22.5MIN 3.13 2.00 1.27 .87 .58 .41 .28 .21 .22 .31 .64AC-FT 287 300 209 123 64 52 24 46 51 211 305YEAR 2002* TOTAL=842.92 MEAN=2.73 MAX=22.5 MIN=0.21 AC-FT=1,670
*Incomplete record; r = Mean flow & stage exceed rating curve
1/1
/02
2/1
/02
3/1
/02
4/1
/02
5/1
/02
6/1
/02
7/1
/02
8/1
/02
9/1
/02
10/1
/02
11/1
/02
12/1
/02
1/1
/03
0.1
1
10
100
Dai
ly M
ean
Dis
char
ge
(cfs
)
WCHP — 14206413 — Willow Creek at Heritage Parkway near Beaverton, Oregon [RM 0.75]

APPENDIX E—Stream Gauge RecordsE-24 2002 Tualatin River Flow Management Report
BCSR – 14206419 – BRONSON CREEK AT SALTZMAN ROAD [RM 5.1]Latitude: 45 33 19 Longitude: 122 48 25 Source Agency: District 18 Watermaster
Day2002 Daily Mean Discharge in Cubic Feet per Second
JAN FEB MAR APR MAY JUN JUL AUG* SEP* OCT* NOV DEC 1 1.51 2.49 .71 .88 .27 .15 .11 .07 .02 .04 .10 2 1.43 2.14 .57 .78 .27 .14 .10 .06 r .08 .11 3 .92 2.04 .49 .73 .22 .13 .10 .06 .10 .11 4 .61 1.76 .47 .71 .20 .14 .09 .07 .16 .13 5 1.72 1.82 .46 .80 .22 .14 .08 .07 .06 .13 6 14.6 1.97 2.12 .69 .20 .12 .09 .05 .05 .13 7 r 11.7 .96 .62 .17 .11 .10 .04 .09 .12 8 9.87 8.62 .65 .55 .17 .11 .13 .04 .13 .13 9 3.34 3.62 .58 .97 .17 .11 .11 .04 .19 .15
10 2.41 2.80 .82 1.20 .17 .11 .09 .04 .12 .4711 2.05 2.23 r .96 .17 .10 .09 .03 .11 .9612 2.10 1.93 7.56 .76 .18 .10 .09 .04 .17 1.3413 1.75 1.73 4.19 .95 .18 .11 .09 .13 1.0014 1.55 1.50 2.97 1.40 .17 .11 .07 .27 2.8615 1.25 1.37 2.59 .84 .16 .10 .06 .18 1.5116 1.20 1.49 2.30 .73 .15 .10 .07 .14 9.5317 1.12 1.18 2.17 .63 .20 .16 .11 .06 .14 1.4418 1.28 1.20 2.03 .53 .16 .14 .08 .05 .16 .8019 1.29 1.95 5.19 .49 .21 .11 .08 .07 .16 .5120 1.57 1.24 3.22 .49 .48 .11 .06 .08 .15 .2921 1.60 1.21 2.42 .44 .20 .11 .06 r .06 .14 .4722 2.50 1.10 2.17 .41 .19 .10 .07 r .04 .11 .3723 1.83 7.05 1.93 .35 .17 .10 .07 r .04 .07 .3524 2.10 2.04 1.77 .35 .15 .10 .07 r .04 .07 .2725 22.9 1.50 1.57 .35 .16 .10 .07 .03 .03 .05 .2126 5.35 1.23 1.39 .57 .16 .10 .07 .02 .03 .05 .5027 4.29 1.06 1.25 .55 .24 .11 .05 r .07 .06 5.4928 3.31 .86 1.15 .37 .50 .39 .05 r .03 .08 1.6729 2.59 — 1.08 .35 .34 .42 .05 r .03 .10 1.4130 2.32 — 1.00 .32 .20 .12 .06 r .06 .03 .10 18.531 2.75 — .92 — .16 — .05 r — .03 — 12.5
TOTAL 103.11 70.83 56.70 19.77 6.59 4.05 2.47 0.61 0.11 0.71 3.46 63.56MEAN 3.44 2.53 1.89 .66 .21 .14 .080 .051 .037 .044 .12 2.05MAX 22.9 11.7 7.56 1.40 .50 .42 .13 .07 .06 .08 .27 18.5MIN .61 .86 .46 .32 .15 .10 .05 .03 .02 .02 .04 .10AC-FT 205 140 112 39 13 8.0 4.9 1.2 .2 1.4 6.9 126YEAR 2002* TOTAL=331.97 MEAN=1.10 MAX=22.9 MIN=0.02 AC-FT=658*Incomplete record; r = Mean flow & stage exceed rating curve
1/1
/02
2/1
/02
3/1
/02
4/1
/02
5/1
/02
6/1
/02
7/1
/02
8/1
/02
9/1
/02
10/1
/02
11/1
/02
12/1
/02
1/1
/03
0.01
0.1
1
10
100
Dai
ly M
ean
Dis
char
ge
(cfs
)
BCSR — 14206419 — Bronson Creek at Saltzman Road near Oregon, Oregon [RM 5.1]

APPENDIX E—Stream Gauge Records2002 Tualatin River Flow Management Report E-25
BCBR – 14206423 – BRONSON CREEK AT BRONSON ROAD [RM 2.1]Latitude: 45 32 18 Longitude: 122 51 15 Source Agency: District 18 Watermaster
Day2002 Daily Mean Discharge in Cubic Feet per Second
JAN* FEB* MAR* APR MAY JUN JUL AUG SEP OCT NOV DEC* 1 8.12 9.97 2.73 1.78 1.08 1.24 .38 .26 1.61 .64 .42 2 10.2 7.08 2.52 1.68 .94 .97 .37 .27 .70 .62 .45 3 6.76 6.89 2.38 1.46 .85 .87 .39 .25 2.02 .54 .50 4 5.34 5.59 2.36 1.31 1.06 .76 .45 .21 1.95 .68 .85 5 8.09 6.10 3.18 1.55 1.08 .67 .47 .19 1.03 .85 .91 6 r 6.52 3.23 1.49 .85 .67 .42 .20 .79 .95 .69 7 r r 2.39 1.24 .80 .68 .35 .20 .56 1.57 .53 8 r r 2.14 1.11 .84 1.96 .35 .18 .48 3.14 .48 9 r 14.9 4.38 1.07 .96 1.08 .31 .20 .50 4.95 .59
10 12.0 10.0 7.33 1.02 .94 .83 .28 .21 .40 3.46 6.9311 8.92 8.62 4.11 1.01 .87 .77 .28 .22 .36 1.90 12.412 9.17 6.61 3.37 1.07 .83 .69 .28 .22 .39 3.30 r13 7.76 5.35 3.51 1.20 .84 .58 .28 .22 .49 3.04 r14 6.22 4.62 8.91 1.31 .56 .49 .23 .21 .46 5.86 r15 5.08 4.19 3.75 1.02 .55 .46 .22 .24 .47 1.92 r16 4.64 5.58 3.26 .95 .52 .47 .30 .37 .51 1.66 r17 4.95 4.03 5.92 2.55 .99 .51 .24 1.12 .50 1.66 12.018 5.46 3.87 3.86 1.35 2.59 .53 .21 .64 .54 1.32 7.1819 6.65 2.72 1.30 1.26 .51 .26 .42 .63 1.86 5.5820 8.54 2.50 3.10 .91 .47 .24 .33 .76 1.32 3.3721 8.89 8.32 2.34 1.92 .80 .48 .24 .26 .88 1.07 4.0022 14.6 6.73 2.16 1.47 .70 .45 .26 .38 .91 .86 3.9123 9.01 5.66 1.97 1.36 .67 .45 .28 .23 .94 .74 4.4824 8.35 4.96 1.87 1.13 .63 .45 .24 .31 .87 .64 2.9525 r 4.33 1.84 1.11 .64 .43 .28 .26 .69 .53 2.6426 r 3.87 2.41 1.09 .62 .51 .39 .24 .63 .46 4.1127 22.6 3.54 5.93 1.23 .60 .44 .35 .25 .64 .40 r28 14.9 3.25 2.27 3.14 2.34 .45 .34 .24 .85 .46 9.4429 9.76 — 3.05 1.94 4.09 9.25 .54 .33 .60 .98 .50 8.5930 8.28 — 2.97 1.82 1.82 2.04 .53 .28 1.85 .88 .47 r31 8.89 — 2.76 — 1.31 — .42 .26 — .68 — r
TOTAL 223.18 109.92 49.44 99.10 48.24 37.61 20.36 9.56 10.78 24.10 47.37 93.00MEAN 8.93 6.87 4.49 3.30 1.56 1.25 .66 .31 .36 .78 1.58 4.04MAX 22.6 14.9 8.32 8.91 4.09 9.25 1.96 .47 1.85 2.02 5.86 12.4MIN 4.64 3.87 2.76 1.82 .95 .52 .42 .21 .18 .36 .40 .42AC-FT 443 218 98 197 96 75 40 19 21 48 94 184YEAR 2002* TOTAL=772.66 MEAN=2.42 MAX=22.6 MIN=0.18 AC-FT=1,530*Incomplete record; r = Mean flow & stage exceed rating curve
1/1
/02
2/1
/02
3/1
/02
4/1
/02
5/1
/02
6/1
/02
7/1
/02
8/1
/02
9/1
/02
10/1
/02
11/1
/02
12/1
/02
1/1
/03
0.1
1
10
100
Dai
ly M
ean
Dis
char
ge
(cfs
)
BCBR — 14206423 — Bronson Creek at Bronson Road near Orenco, Oregon [RM 2.1]

APPENDIX E—Stream Gauge RecordsE-26 2002 Tualatin River Flow Management Report
BVTS – 14206435 – BEAVERTON CREEK AT SW 216TH AVE NEAR ORENCO, OREGON [RM 1.2]Latitude: 45 31 15 Longitude: 122 53 59 Source Agency: District 18 Watermaster
Day2002 Daily Mean Discharge in Cubic Feet per Second
JAN* FEB* MAR* APR MAY JUN JUL AUG SEP OCT NOV DEC* 1 82.6 87.5 36.3 24.3 15.5 11.9 14.3 4.37 5.23 34.1 12.6 7.68 2 133 61.6 33.5 23.0 13.8 10.7 10.6 4.55 4.65 10.8 12.9 7.52 3 80.6 60.2 31.0 21.7 12.4 9.96 8.88 4.27 4.82 25.5 13.3 7.58 4 56.1 53.0 29.6 21.9 11.5 10.9 8.16 4.11 4.54 35.7 14.0 11.3 5 74.2 54.6 29.4 28.0 12.8 10.5 7.75 4.21 4.54 12.2 15.2 13.9 6 r 63.5 r 44.4 14.3 8.96 7.71 4.20 4.72 8.28 15.8 9.46 7 r r r 24.1 12.2 8.15 7.40 4.49 4.29 6.41 21.9 8.00 8 r r 60.3 20.4 11.1 8.57 24.3 4.82 4.55 5.98 63.2 7.02 9 r r 43.9 43.5 11.1 9.51 14.9 4.54 6.21 5.72 65.8 7.04
10 132 90.3 70.1 104 11.3 8.57 8.99 4.16 5.24 6.67 73.4 79.211 96.6 83.4 r 63.9 10.7 8.33 7.67 4.33 3.65 5.85 31.4 r12 85.4 62.1 r 41.0 10.4 7.73 7.20 4.32 3.92 6.18 46.1 r13 70.8 53.1 r 31.7 11.8 7.88 7.05 4.19 4.47 5.17 56.2 r14 52.0 47.2 112 98.1 15.0 7.69 6.43 4.14 4.56 5.01 72.8 r15 44.1 42.9 79.9 49.6 11.3 7.07 5.97 3.76 4.92 5.54 32.2 r16 39.9 62.7 76.2 32.1 9.80 7.53 5.65 3.79 4.95 8.31 20.9 r17 43.0 50.2 67.7 43.4 36.6 11.4 5.44 3.99 25.6 5.04 34.6 r18 46.1 41.1 61.8 48.9 21.0 41.6 5.66 3.78 15.3 6.34 18.4 91.419 77.6 107 r 27.6 15.1 17.9 6.01 4.01 7.15 9.48 30.1 74.520 86.7 83.5 116 23.3 28.6 10.8 5.06 6.41 5.41 7.83 17.4 45.721 100 57.5 66.2 21.1 34.8 9.15 4.86 7.95 4.50 8.30 13.4 55.622 129 49.6 52.9 21.1 18.2 8.03 5.05 4.58 3.39 9.83 12.0 54.323 88.1 r 48.6 17.9 19.1 7.53 5.12 4.37 2.67 10.2 9.88 61.924 69.1 r 43.5 16.0 12.5 7.57 4.70 4.61 3.59 10.0 8.74 40.025 r 64.8 39.1 16.0 11.4 7.56 4.63 4.48 4.34 10.0 8.23 35.326 r 49.6 35.3 17.7 12.5 6.79 4.85 4.24 3.84 10.0 7.55 51.927 r 43.6 31.9 56.0 12.6 6.72 4.70 6.01 3.71 10.0 7.57 r28 r 40.1 29.9 27.2 50.4 17.4 4.59 3.93 3.76 10.3 7.73 r29 98.7 — 27.7 18.5 66.2 103 4.23 4.02 12.1 12.8 7.10 11930 74.6 — 26.1 16.0 26.2 35.3 4.35 4.07 35.1 11.8 7.35 r31 71.1 — 25.6 — 15.2 — 3.97 4.16 — 10.3 — r
TOTAL 1,831.3 1,409.1 1,274.5 1,042.4 575.40 434.70 226.18 138.86 205.72 329.64 757.75 788.30MEAN 79.6 61.3 51.0 34.7 18.6 14.5 7.30 4.48 6.86 10.6 25.3 39.4MAX 133 107 116 104 66.2 103 24.3 7.95 35.1 35.7 73.4 119MIN 39.9 40.1 25.6 16.0 9.80 6.72 3.97 3.76 2.67 5.01 7.10 7.02AC-FT 3,630 2,790 2,530 2,070 1,140 862 449 275 408 654 1,500 1,560YEAR 2002* TOTAL=9,013.85 MEAN=26.9 MAX=133 MIN=2.67 AC-FT=17,880*Incomplete record; r = Mean flow & stage exceed rating curve
1/1
/02
2/1
/02
3/1
/02
4/1
/02
5/1
/02
6/1
/02
7/1
/02
8/1
/02
9/1
/02
10/1
/02
11/1
/02
12/1
/02
1/1
/03
1
10
100
1000
Dai
ly M
ean
Dis
char
ge
(cfs
)
BVTS — 14206435 — Beaverton Creek at 216th near Orenco, Oregon [RM 1.2]

APPENDIX E—Stream Gauge Records2002 Tualatin River Flow Management Report E-27
DCBR – 14206443 – DAWSON CREEK AT BROOKWOOD ROAD [RM 0.7]Latitude: 45 31 27 Longitude:122 56 01 Source Agency: District 18 Watermaster
Day2002 Daily Mean Discharge in Cubic Feet per Second
JAN* FEB* MAR* APR MAY JUN JUL AUG SEP OCT NOV DEC* 1 12.9 6.36 3.20 1.95 1.22 1.06 1.13 .36 .43 2.13 1.02 .48 2 10.8 5.25 2.70 1.85 1.04 .86 .91 .34 .97 .74 1.15 .48 3 8.48 5.83 2.49 1.99 1.24 .81 .79 .37 .60 3.37 1.21 .48 4 6.84 4.84 2.45 1.56 1.04 .93 .69 .37 .46 2.34 1.26 1.87 5 11.4 5.46 2.57 2.84 1.02 .87 .68 .43 .42 .90 1.31 1.11 6 r 5.83 10.6 2.71 1.06 .82 .63 .65 .41 .72 1.54 .73 7 r r 5.05 1.76 1.05 .80 .68 .44 .42 .60 2.89 .61 8 r r 3.64 1.55 .96 2.00 2.39 .38 .39 .56 3.83 .56 9 9.94 8.23 3.27 2.72 .86 1.18 1.18 .33 .41 .50 9.31 .86
10 8.10 7.11 5.16 6.30 .87 .82 .79 .34 .40 .44 5.02 9.1711 7.08 6.39 4.20 .84 .72 .59 .33 .44 .43 2.24 16.012 7.50 5.46 17.2 3.24 .87 .65 .50 .35 .30 .42 3.67 12.313 6.24 5.01 10.0 3.48 1.03 .56 .48 .62 .36 .44 3.80 13.514 5.55 4.60 7.66 7.16 1.02 .57 .42 .32 .36 .45 7.1715 5.00 4.32 6.61 3.05 .89 .58 .38 .28 .36 .43 1.98 13.316 4.86 6.51 5.96 2.43 .81 .72 .37 .30 .43 .40 1.9017 5.07 4.67 4.97 2.97 4.08 .95 .37 .31 1.53 .38 1.62 9.8318 5.41 4.62 5.05 2.56 1.60 1.20 .58 .31 .89 .38 1.10 8.1519 6.26 8.13 13.1 1.87 1.60 .82 .57 .33 .57 .40 1.14 6.2020 9.83 4.92 6.70 1.72 4.85 .69 .42 .58 .44 .43 .87 3.9421 10.1 5.70 5.15 1.60 2.08 .65 .37 .42 .41 .43 .70 4.4922 11.5 4.61 4.46 1.54 1.62 .60 .38 .45 .38 .46 .67 4.7523 7.48 15.4 4.03 1.46 1.40 .58 .38 .50 .36 .55 .66 4.9424 8.39 6.24 3.61 1.34 1.35 .56 .37 .39 .38 .66 .60 3.7125 r 4.93 3.24 1.28 1.11 .58 .39 .38 .37 .80 .56 3.0026 14.0 4.32 3.08 2.48 .97 .65 .37 .38 .43 .69 .52 5.5227 13.1 3.88 2.94 3.50 1.43 .59 .40 .60 .26 .73 .50 17.528 8.32 3.73 2.69 1.74 3.71 3.42 .38 1.40 .32 .74 .47 8.8629 6.68 — 2.51 1.39 3.31 6.56 .37 .54 .85 .82 .49 7.6730 6.25 — 2.24 1.29 1.57 1.86 .36 .42 2.89 .91 .47 r31 6.55 — 2.01 — 1.17 — .36 .44 — .97 — r
TOTAL 223.63 152.35 154.34 75.53 47.67 33.66 18.68 13.66 17.24 24.22 59.67 160.01MEAN 8.28 5.86 5.14 2.52 1.54 1.12 .60 .44 .57 .78 1.99 5.93MAX 14.0 15.4 17.2 7.16 4.85 6.56 2.39 1.40 2.89 3.37 9.31 17.5MIN 4.86 3.73 2.01 1.28 .81 .56 .36 .28 .26 .38 .47 .48AC-FT 444 302 306 150 95 67 37 27 34 48 118 317YEAR 2002* TOTAL=980.66 MEAN=2.77 MAX=17.5 MIN=0.26 AC-FT=1,950*Incomplete record; r = Mean flow & stage exceed rating curve
1/1
/02
2/1
/02
3/1
/02
4/1
/02
5/1
/02
6/1
/02
7/1
/02
8/1
/02
9/1
/02
10/1
/02
11/1
/02
12/1
/02
1/1
/03
0.1
1
10
100
Dai
ly M
ean
Dis
char
ge
(cfs
)
DCBR — 14206443 — Dawson Creek at Brookwood Road near Hillsboro, Oregon [RM 0.7]
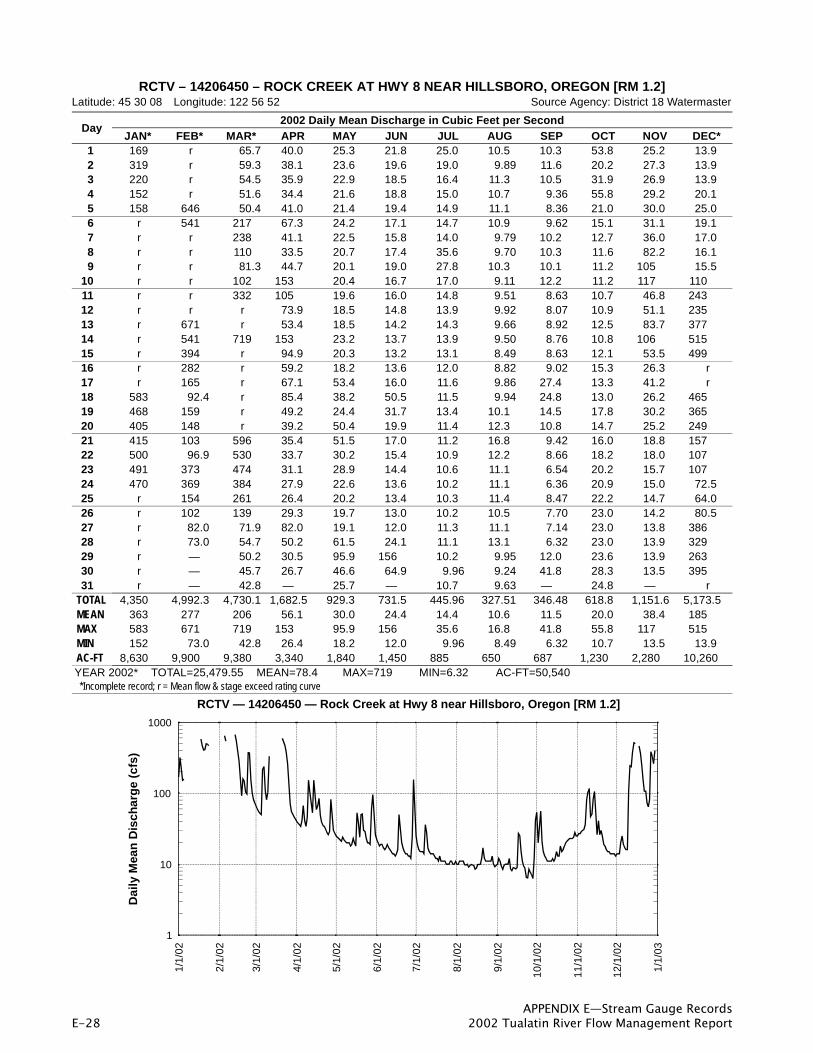
APPENDIX E—Stream Gauge RecordsE-28 2002 Tualatin River Flow Management Report
RCTV – 14206450 – ROCK CREEK AT HWY 8 NEAR HILLSBORO, OREGON [RM 1.2]
Latitude: 45 30 08 Longitude: 122 56 52 Source Agency: District 18 Watermaster
Day2002 Daily Mean Discharge in Cubic Feet per Second
JAN* FEB* MAR* APR MAY JUN JUL AUG SEP OCT NOV DEC* 1 169 r 65.7 40.0 25.3 21.8 25.0 10.5 10.3 53.8 25.2 13.9 2 319 r 59.3 38.1 23.6 19.6 19.0 9.89 11.6 20.2 27.3 13.9 3 220 r 54.5 35.9 22.9 18.5 16.4 11.3 10.5 31.9 26.9 13.9 4 152 r 51.6 34.4 21.6 18.8 15.0 10.7 9.36 55.8 29.2 20.1 5 158 646 50.4 41.0 21.4 19.4 14.9 11.1 8.36 21.0 30.0 25.0 6 r 541 217 67.3 24.2 17.1 14.7 10.9 9.62 15.1 31.1 19.1 7 r r 238 41.1 22.5 15.8 14.0 9.79 10.2 12.7 36.0 17.0 8 r r 110 33.5 20.7 17.4 35.6 9.70 10.3 11.6 82.2 16.1 9 r r 81.3 44.7 20.1 19.0 27.8 10.3 10.1 11.2 105 15.5
10 r r 102 153 20.4 16.7 17.0 9.11 12.2 11.2 117 11011 r r 332 105 19.6 16.0 14.8 9.51 8.63 10.7 46.8 24312 r r r 73.9 18.5 14.8 13.9 9.92 8.07 10.9 51.1 23513 r 671 r 53.4 18.5 14.2 14.3 9.66 8.92 12.5 83.7 37714 r 541 719 153 23.2 13.7 13.9 9.50 8.76 10.8 106 51515 r 394 r 94.9 20.3 13.2 13.1 8.49 8.63 12.1 53.5 49916 r 282 r 59.2 18.2 13.6 12.0 8.82 9.02 15.3 26.3 r17 r 165 r 67.1 53.4 16.0 11.6 9.86 27.4 13.3 41.2 r18 583 92.4 r 85.4 38.2 50.5 11.5 9.94 24.8 13.0 26.2 46519 468 159 r 49.2 24.4 31.7 13.4 10.1 14.5 17.8 30.2 36520 405 148 r 39.2 50.4 19.9 11.4 12.3 10.8 14.7 25.2 24921 415 103 596 35.4 51.5 17.0 11.2 16.8 9.42 16.0 18.8 15722 500 96.9 530 33.7 30.2 15.4 10.9 12.2 8.66 18.2 18.0 10723 491 373 474 31.1 28.9 14.4 10.6 11.1 6.54 20.2 15.7 10724 470 369 384 27.9 22.6 13.6 10.2 11.1 6.36 20.9 15.0 72.525 r 154 261 26.4 20.2 13.4 10.3 11.4 8.47 22.2 14.7 64.026 r 102 139 29.3 19.7 13.0 10.2 10.5 7.70 23.0 14.2 80.527 r 82.0 71.9 82.0 19.1 12.0 11.3 11.1 7.14 23.0 13.8 38628 r 73.0 54.7 50.2 61.5 24.1 11.1 13.1 6.32 23.0 13.9 32929 r — 50.2 30.5 95.9 156 10.2 9.95 12.0 23.6 13.9 26330 r — 45.7 26.7 46.6 64.9 9.96 9.24 41.8 28.3 13.5 39531 r — 42.8 — 25.7 — 10.7 9.63 — 24.8 — r
TOTAL 4,350 4,992.3 4,730.1 1,682.5 929.3 731.5 445.96 327.51 346.48 618.8 1,151.6 5,173.5MEAN 363 277 206 56.1 30.0 24.4 14.4 10.6 11.5 20.0 38.4 185MAX 583 671 719 153 95.9 156 35.6 16.8 41.8 55.8 117 515MIN 152 73.0 42.8 26.4 18.2 12.0 9.96 8.49 6.32 10.7 13.5 13.9AC-FT 8,630 9,900 9,380 3,340 1,840 1,450 885 650 687 1,230 2,280 10,260YEAR 2002* TOTAL=25,479.55 MEAN=78.4 MAX=719 MIN=6.32 AC-FT=50,540*Incomplete record; r = Mean flow & stage exceed rating curve
1/1
/02
2/1
/02
3/1
/02
4/1
/02
5/1
/02
6/1
/02
7/1
/02
8/1
/02
9/1
/02
10/1
/02
11/1
/02
12/1
/02
1/1
/03
1
10
100
1000
Dai
ly M
ean
Dis
char
ge
(cfs
)
RCTV — 14206450 — Rock Creek at Hwy 8 near Hillsboro, Oregon [RM 1.2]

APPENDIX E—Stream Gauge Records2002 Tualatin River Flow Management Report E-29
FRMO – 14206500 – TUALATIN RIVER AT FARMINGTON, OREGON [RM 33.3]Latitude: 45 26 58 Longitude: 122 57 02 Source Agency: District 18 Watermaster
Day2002 Daily Mean Discharge in Cubic Feet per Second
JAN FEB MAR APR MAY JUN JUL AUG SEP OCT NOV DEC 1 1,950 4,660 1,280 1,030 494 226 322 130 159 234 152 121 2 2,010 4,160 1,150 957 469 186 250 124 171 171 151 121 3 2,090 3,790 1,050 878 441 173 193 120 172 161 146 119 4 2,010 3,540 968 801 430 168 169 121 165 209 146 119 5 1,910 3,310 902 751 417 190 177 141 152 201 151 126 6 2,210 3,120 1,010 779 412 194 170 139 147 196 147 129 7 3,390 2,990 1,290 823 404 182 158 132 157 187 153 125 8 4,550 3,320 1,140 791 376 174 191 127 177 176 206 120 9 5,890 3,500 981 735 355 192 217 121 189 168 278 119
10 7,250 3,500 941 821 324 210 170 119 180 168 345 15911 7,320 3,520 1,340 979 307 190 145 121 171 168 314 33212 6,780 3,470 2,640 985 281 170 147 133 169 166 266 76413 5,990 3,340 3,170 957 279 178 146 126 168 175 281 1,19014 5,210 3,130 3,260 1,100 279 201 143 104 159 176 307 1,43015 4,440 2,880 3,370 1,360 296 205 150 111 163 170 309 1,96016 3,850 2,600 3,480 1,380 286 215 141 122 177 167 242 2,51017 3,490 2,290 3,490 1,300 302 230 128 121 204 162 190 2,88018 3,190 1,950 3,400 1,250 301 256 131 127 220 162 178 2,79019 2,940 1,780 3,310 1,130 266 260 139 138 204 170 183 2,67020 2,760 1,800 3,270 1,020 292 213 145 135 179 173 192 2,50021 2,720 1,740 3,170 952 319 187 148 138 169 179 227 2,23022 2,780 1,780 3,070 891 302 168 144 140 164 174 185 1,84023 2,870 2,060 2,980 825 283 161 130 132 163 178 156 1,47024 2,910 2,280 2,840 750 266 170 132 130 156 171 141 1,24025 3,390 2,090 2,600 646 241 162 137 122 151 171 130 1,09026 4,060 1,830 2,260 584 219 163 134 134 153 171 122 99327 5,090 1,600 1,870 613 214 160 130 140 163 168 118 1,24028 5,990 1,420 1,550 603 240 175 136 140 167 166 123 1,72029 6,080 — 1,350 554 327 352 145 135 167 162 122 1,85030 5,710 — 1,210 535 342 409 134 144 201 162 121 1,91031 5,180 — 1,100 — 282 — 130 150 — 162 — 2,860
TOTAL 126,010 77,450 65,442 26,780 10,046 6,120 4,932 4,017 5,137 5,424 5,782 38,727MEAN 4,065 2,766 2,111 893 324 204 159 130 171 175 193 1,249MAX 7,320 4,660 3,490 1,380 494 409 322 150 220 234 345 2,880MIN 1,910 1,420 902 535 214 160 128 104 147 161 118 119AC-FT 249,900 153,600 129,800 53,120 19,930 12,140 9,780 7,970 10,190 10,760 11,470 76,820YEAR 2002 TOTAL=375,867 MEAN=1,030 MAX=7,320 MIN=104 AC-FT=745,500
1/1
/02
2/1
/02
3/1
/02
4/1
/02
5/1
/02
6/1
/02
7/1
/02
8/1
/02
9/1
/02
10/1
/02
11/1
/02
12/1
/02
1/1
/03
100
1000
10000
Dai
ly M
ean
Dis
char
ge
(cfs
)
FRMO — 14206500 — Tualatin River at Farmington, Oregon [RM 33.3]

APPENDIX E—Stream Gauge RecordsE-30 2002 Tualatin River Flow Management Report
CCER – 14206748 – CEDAR CREEK AT EDY ROAD NEAR SHERWOOD, OREGON [RM 0.62]Latitude: 45 22 05 Longitude: 122 51 22 Source Agency: District 18 Watermaster
Day2002 Daily Mean Discharge in Cubic Feet per Second
JAN* FEB* MAR* APR* MAY JUN JUL* AUG SEP OCT NOV* DEC* 1 17.1 6.83 5.15 3.79 1.75 2.03 1.87 1.35 1.30 1.13 2 13.9 6.88 4.78 3.89 1.60 2.10 1.88 .89 1.31 1.09 3 12.0 6.73 4.58 3.49 1.80 2.28 1.89 3.46 1.60 1.10 4 10.6 6.73 4.17 3.40 2.04 2.65 1.87 1.98 1.62 1.35 5 10.5 8.58 3.41 3.53 2.14 2.67 2.03 .94 1.53 1.36 6 r 7.28 4.59 3.52 2.57 2.48 2.02 .85 1.55 1.26 7 r 6.12 4.44 3.64 2.75 2.51 2.05 .80 3.72 1.24 8 r 6.07 5.12 3.51 2.73 2.61 2.09 .73 6.74 1.17 9 r 10.2 5.86 3.51 2.64 3.07 2.01 .71 r 1.28
10 r r 5.64 3.51 2.85 3.02 1.94 .67 3.37 r11 r 14.0 5.54 3.53 2.70 3.08 1.91 .65 2.72 r12 r 10.6 5.75 3.79 2.49 2.92 1.89 .67 r r13 r r 5.45 3.61 2.80 2.81 1.76 .64 10.3 r14 r r 5.69 3.61 3.05 2.81 1.60 .66 6.65 r15 r 16.8 5.66 3.56 2.86 2.76 1.33 .65 2.51 r16 r 21.5 5.69 3.48 3.03 2.73 1.97 .62 3.64 r17 r 17.4 6.11 4.12 r 2.68 5.52 .68 2.42 r18 r 14.3 5.64 3.11 r 2.61 1.93 .72 2.93 r19 r 12.0 5.58 2.55 1.22 2.61 1.58 .73 3.47 r20 r 11.1 6.09 2.19 1.64 2.81 1.66 .83 2.14 r21 23.8 r 10.1 5.70 2.83 2.07 2.71 1.77 .85 1.8122 19.6 r 9.08 5.27 2.78 2.23 2.56 .69 .85 1.61 23.523 r r 7.92 5.07 2.75 2.33 2.40 .55 .86 1.53 17.324 r r 7.01 4.82 2.67 2.38 2.39 .58 .96 1.56 14.225 r 21.9 6.86 4.55 2.87 2.35 2.29 .65 1.10 1.40 10.726 r 16.6 6.89 4.30 3.09 2.47 2.16 .58 1.01 1.24 r27 28.7 13.3 7.30 4.65 2.90 2.45 2.13 .58 1.03 1.18 r28 21.6 11.0 6.23 6.43 3.83 2.64 2.10 .66 1.10 1.17 r29 — 9.42 5.91 5.23 4.36 1.54 1.99 2.38 1.21 1.15 r30 — 8.33 5.42 4.02 1.83 .95 2.00 1.97 1.14 1.14 r31 — 7.38 — 3.69 — 1.77 1.97 — 1.17 — r
TOTAL 93.7 152.03 255.84 158.67 99.25 65.84 77.94 51.21 30.51 73.31 76.68MEAN 23.4 12.7 9.48 5.12 3.31 2.27 2.51 1.71 .98 2.62 5.90MAX 28.7 21.9 21.5 6.43 4.36 3.05 3.08 5.52 3.46 10.3 23.5MIN 19.6 7.38 5.42 3.41 1.83 .95 1.97 .55 .62 1.14 1.09AC-FT 186 302 507 315 197 131 155 102 61 145 152YEAR 2002* TOTAL=1,134.98 MEAN=4.27 MAX=28.7 MIN=0.55 AC-FT=2,250
*Incomplete record; r = Mean flow & stage exceed rating curve
1/1
/02
2/1
/02
3/1
/02
4/1
/02
5/1
/02
6/1
/02
7/1
/02
8/1
/02
9/1
/02
10/1
/02
11/1
/02
12/1
/02
1/1
/03
0.1
1
10
100
Dai
ly M
ean
Dis
char
ge
(cfs
)
CCER — 14206748 — Cedar Creek at Edy Road near Sherwood, Oregon [RM 0.62]

APPENDIX E—Stream Gauge Records2002 Tualatin River Flow Management Report E-31
CCSR – 14206750 – CHICKEN CREEK AT SCHOLLS-SHERWOOD RD NEAR SHERWOOD, OREGON [RM 2.3]Latitude: 45 22 31 Longitude: 122 51 24 Source Agency: District 18 Watermaster
Day2002 Daily Mean Discharge in Cubic Feet per Second
JAN FEB MAR* APR* MAY JUN JUL AUG SEP OCT NOV DEC 1 34.9 76.4 31.5 13.6 6.66 5.09 1.48 1.50 3.38 5.88 4.65 2 38.2 68.5 28.6 13.1 6.34 3.81 1.39 1.44 2.40 6.85 4.65 3 41.8 62.5 26.3 12.7 5.98 3.51 1.40 1.51 5.61 8.47 4.53 4 40.6 51.4 24.9 11.6 5.55 3.62 2.13 1.40 4.53 8.49 5.56 5 45.2 48.8 24.8 10.1 5.31 3.48 2.58 1.49 2.68 8.16 5.15 6 89.8 50.3 73.4 10.7 5.14 3.14 1.72 1.57 2.20 6.07 3.67 7 331 93.2 49.4 10.4 5.02 3.24 1.62 1.58 2.14 6.97 3.64 8 333 168 44.4 9.96 5.52 3.88 2.07 1.66 2.05 13.8 3.48 9 226 112 40.5 9.77 5.15 3.01 1.86 1.69 1.92 18.5 3.61
10 138 80.8 43.8 9.80 4.79 3.06 1.59 1.63 1.85 9.28 22.111 91.3 60.8 148 9.03 5.24 2.73 1.70 1.62 1.85 7.36 34.212 74.2 50.9 243 8.24 3.87 2.34 1.58 1.57 1.81 20.6 31.513 55.7 45.8 163 8.60 2.99 2.31 1.50 1.53 2.00 15.7 37.814 48.4 40.2 103 8.51 2.92 2.51 1.53 1.71 2.10 12.3 45.415 43.0 36.7 77.7 8.17 2.87 2.16 1.56 1.69 2.09 6.48 31.016 38.9 35.8 64.5 8.04 3.30 2.00 1.61 2.22 2.10 8.42 11617 35.8 32.6 54.5 10.2 5.64 2.17 1.69 6.64 2.28 8.01 44.418 33.8 30.7 51.8 8.69 6.75 1.76 1.68 2.38 2.52 7.45 40.619 34.5 48.1 103 9.00 5.03 1.78 1.83 1.89 2.70 10.1 37.620 48.6 36.8 84.2 11.3 4.25 1.71 2.49 1.76 2.95 6.64 32.121 54.9 35.9 66.3 12.0 3.78 2.22 2.44 1.73 3.10 5.78 30.522 71.5 34.0 55.3 9.77 3.58 2.01 2.32 2.23 3.28 5.17 25.623 65.4 87.1 48.5 19.1 8.06 3.69 1.80 2.40 1.92 3.16 5.09 23.224 62.6 54.8 42.5 17.7 7.47 3.51 1.82 2.30 2.20 3.34 5.07 21.625 285 47.9 37.5 16.8 6.99 2.97 1.76 2.42 2.18 3.83 4.76 19.126 255 42.8 34.1 16.9 6.77 3.01 1.85 2.81 2.26 3.88 4.69 22.127 221 38.3 31.1 17.8 7.72 3.25 1.87 3.13 2.21 4.09 4.63 46.428 142 35.0 28.4 15.8 14.7 8.53 1.80 3.18 2.32 4.19 4.58 44.929 94.9 — 27.0 14.8 15.4 18.4 1.82 2.65 5.47 4.51 4.57 48.630 71.0 — 24.7 14.1 8.94 6.67 1.64 1.44 5.02 4.29 4.60 96.731 72.4 — — 7.23 — 1.37 1.55 — 4.95 — 253
TOTAL 3,218.4 1,606.1 1,875.7 133.0 306.56 155.71 77.27 61.65 66.02 93.78 244.47 1,143.34MEAN 104 57.4 62.5 16.6 9.89 5.19 2.49 1.99 2.20 3.03 8.15 36.9MAX 333 168 243 19.1 15.4 18.4 5.09 3.18 6.64 5.61 20.6 253MIN 33.8 30.7 24.7 14.1 6.77 2.87 1.37 1.39 1.40 1.81 4.57 3.48AC-FT 6,380 3,190 3,720 264 608 309 153 122 131 186 485 2,270YEAR 2002* TOTAL=8,982.00 MEAN=26.3 MAX=333 MIN=1.37 AC-FT=17,820
*Incomplete record; r = Mean flow & stage exceed rating curve
1/1
/02
2/1
/02
3/1
/02
4/1
/02
5/1
/02
6/1
/02
7/1
/02
8/1
/02
9/1
/02
10/1
/02
11/1
/02
12/1
/02
1/1
/03
1
10
100
1000
Dai
ly M
ean
Dis
char
ge
(cfs
)
CCSR — 14206750 — Chicken Creek at Scholls-Sherwood Road near Sherwood, Oregon [RM 2.3]

APPENDIX E—Stream Gauge RecordsE-32 2002 Tualatin River Flow Management Report
UNITED STATES DEPARTMENT OF THE INTERIOR – GEOLOGICAL SURVEY – OREGON DISTRICTSTATION NUMBER 14206900 FANNO CREEK AT 56TH AVENUE
LATITUDE: 452917 LONGITUDE: 1224401 DRAINAGE AREA: 2.37
Discharge, Cubic Feet per Second, Calendar Year January to December 2002 Daily Mean ValuesDay JAN FEB MAR APR MAY JUN JUL AUG SEP OCT† NOV† DEC†
1 9.2 4.2 1.9 1.3 0.72 0.57 0.47 0.14 0.13 0.36 0.17 0.362 3.5 3.5 1.7 1.2 0.71 0.53 0.43 0.14 0.13 0.24 0.19 0.403 3.1 4.0 1.5 1.2 0.65 0.51 0.46 0.15 0.14 1.7 0.19 0.404 2.0 3.0 1.5 1.2 0.63 0.48 0.42 0.20 0.15 0.38 0.20 0.745 7.3 4.3 1.7 2.8 0.86 0.46 0.37 0.41 0.15 0.23 0.23 0.496 28 8.9 19 1.2 0.65 0.43 0.37 0.23 0.15 0.21 0.27 0.577 56 31 3.4 1.0 0.60 0.45 0.67 0.16 0.15 0.21 2.5 0.608 16 13 2.5 0.96 0.58 0.57 3.2 0.15 0.14 0.21 0.89 0.679 6.0 4.8 2.5 2.8 0.62 0.46 0.33 0.17 0.15 0.21 3.5 1.5
10 4.4 4.5 7.8 3.8 0.62 0.45 0.25 0.15 0.14 0.21 0.75 4.7 11 3.6 3.3 29 2.1 0.59 0.46 0.26 0.14 0.14 0.18 0.68 7.0 12 4.7 2.9 12 1.2 0.63 0.43 0.36 0.13 0.15 0.17 3.6 1113 3.2 2.6 7.1 5.1 0.67 0.41 0.29 0.13 0.18 0.17 2.4 4.0 14 2.9 2.4 4.4 2.8 0.59 0.44 0.23 0.13 0.14 0.17 1.5 1115 2.5 2.1 4.7 1.4 0.54 0.40 0.19 0.14 0.16 0.17 0.33 6.7 16 2.8 3.7 3.7 3.6 0.57 0.39 0.19 0.14 2.9 0.20 1.5 1917 2.3 2.2 3.6 2.1 1.6 3.5 0.20 0.12 1.3 0.18 0.49 3.8 18 4.1 2.7 4.2 1.3 0.52 1.1 0.20 0.13 0.21 0.23 1.5 2.9 19 4.7 15 14 e1.2 0.94 0.56 0.20 0.15 0.20 0.22 0.69 1.4 20 6.9 3.1 4.4 1.2 3.2 0.47 0.19 0.16 0.22 0.21 0.41 1.5 21 6.9 3.1 3.4 1.1 1.4 0.42 0.16 0.14 0.19 0.27 0.42 3.3 22 6.1 2.5 3.0 0.93 1.8 0.38 0.14 0.14 0.20 0.28 0.39 1.8 23 3.4 36 2.8 0.87 0.71 0.55 0.13 0.14 0.22 0.24 0.38 1.0 24 6.8 3.8 2.4 0.84 0.59 0.33 0.13 0.15 0.23 0.23 0.35 1.8 25 32 3.0 2.1 0.77 0.59 0.32 0.17 0.14 0.24 0.27 0.34 0.8826 9.8 2.6 2.0 2.7 0.54 0.31 0.19 0.14 0.24 0.31 0.35 7.4 27 12 2.4 1.8 2.0 1.8 0.31 0.16 0.13 0.22 0.21 0.39 1528 7.6 2.1 1.7 1.4 4.6 7.2 0.16 0.13 0.22 0.25 0.39 8.5 29 4.7 --- 1.6 0.81 1.4 3.3 0.17 0.13 0.87 0.24 0.38 6.0 30 4.3 --- 1.5 0.77 0.87 0.64 0.18 0.12 2.1 0.19 0.40 3731 6.0 --- 1.4 --- 0.61 --- 0.19 0.13 --- 0.18 --- 18
TOTAL 272.8 176.7 154.3 51.65 31.40 26.83 11.06 4.76 11.76 8.53 25.78 179.41MEAN 8.80 6.31 4.98 1.72 1.01 0.89 0.36 0.15 0.39 0.28 0.86 5.79MAX 56 36 29 5.1 4.6 7.2 3.2 0.41 2.9 1.7 3.6 37MIN 2.0 2.1 1.4 0.77 0.52 0.31 0.13 0.12 0.13 0.17 0.17 0.36AC-FT 541 350 306 102 62 53 22 9.4 23 17 51 356YEAR 2002 TOTAL=954.98 MEAN=2.62 MAX=56 MIN=0.12 AC-FT=1890
†Provisional data–subject to revision; e=estimated
1/1
/02
2/1
/02
3/1
/02
4/1
/02
5/1
/02
6/1
/02
7/1
/02
8/1
/02
9/1
/02
10/1
/02
11/1
/02
12/1
/02
1/1
/03
0.1
1
10
100
Dai
ly M
ean
Dis
char
ge
(cfs
)
6900 — 14206900 — Fanno Creek at 56th Avenue [RM 11.9]

APPENDIX E—Stream Gauge Records2002 Tualatin River Flow Management Report E-33
SCRL – 14206905 – SYLVAN CREEK AT RAIEIGHWOOD LN NEAR WEST SLOPE, OREGON [RM 1.0]Latitude: 45 29 35 Longitude: 122 44 48 Source Agency: District 18 Watermaster
Day2002 Daily Mean Discharge in Cubic Feet per Second
JAN* FEB* MAR APR MAY JUN JUL AUG SEP OCT NOV DEC* 1 1.83 1.59 1.11 .70 .56 .58 .29 .22 .24 .27 .28 2 1.60 1.51 1.07 .67 .55 .55 .29 .22 .20 .27 .28 3 1.65 1.46 1.07 .66 .54 .53 .30 .22 .74 .28 .28 4 1.40 1.44 1.20 .64 .54 .48 .31 .19 .26 .36 .36 5 1.59 1.47 1.86 .65 .53 .37 .31 .19 .22 .31 .32 6 2.30 4.22 1.28 .63 .52 .34 .30 .20 .21 .29 .29 7 6.23 1.85 1.08 .62 .52 .41 .30 .20 .21 .93 .29 8 3.80 1.60 1.06 .61 .52 .56 .29 .19 .23 .48 .29 9 2.10 1.54 1.67 .61 .51 .34 .30 .19 .29 1.57 .52
10 2.41 1.89 2.10 2.00 .61 .50 .32 .31 .18 .31 .52 1.9011 2.14 1.60 7.75 1.54 .59 .50 .31 .30 .18 .29 .44 3.0012 2.26 1.49 3.99 1.23 .59 .51 .31 .31 .19 .28 1.25 4.3413 1.90 1.38 2.78 2.02 .61 .51 .31 .32 .18 .28 .99 1.9214 1.78 1.29 2.29 1.77 .59 .51 .30 .35 .19 .28 .79 5.6915 1.66 1.27 2.18 1.31 .58 .52 .30 .31 .19 .27 .39 3.6316 1.71 1.48 2.05 1.57 .57 .53 .30 .31 .78 .28 .67 r17 1.57 1.22 2.06 1.31 1.03 1.72 .30 .31 .43 .28 .42 1.9118 2.10 1.28 1.98 1.19 .60 .82 .30 .33 .20 .28 .66 1.5319 2.10 3.32 3.92 1.12 .75 .63 .27 .36 .19 .30 .44 1.1120 2.31 1.47 2.17 1.09 1.38 .61 .26 .36 .19 .28 .36 1.0321 2.29 1.49 1.86 1.07 .67 .61 .25 .32 .18 .29 .34 1.4622 2.64 1.63 1.72 1.01 .71 .59 .26 .32 .18 .27 .33 1.1223 1.95 r 1.72 .90 .60 .55 .26 .30 .18 .29 .32 .8824 2.64 2.72 1.49 .88 .58 .52 .26 .30 .18 .27 .31 .9325 7.18 2.58 1.42 .88 .58 .50 .27 .28 .17 .27 .30 .7726 2.93 2.24 1.35 1.49 .56 .49 .27 .23 .17 .27 .29 2.0627 2.83 1.81 1.29 1.06 1.19 .50 .26 .23 .18 .27 .29 4.2528 2.43 1.71 1.25 .77 1.77 2.63 .27 .22 .17 .29 .29 2.7429 1.97 — 1.21 .75 .78 1.69 .28 .21 .46 .28 .29 2.0430 1.84 — 1.17 .73 .61 .64 .28 .20 .61 .27 .29 r31 2.16 — 1.13 — .57 — .29 .20 — .28 — 6.67
TOTAL 52.80 54.37 65.56 37.09 22.31 20.87 10.39 9.07 7.20 8.78 14.74 51.89MEAN 2.40 2.01 2.11 1.24 .72 .70 .34 .29 .24 .28 .49 1.79MAX 7.18 6.23 7.75 2.02 1.77 2.63 .58 .36 .78 .74 1.57 6.67MIN 1.57 1.22 1.13 .73 .56 .49 .25 .20 .17 .20 .27 .28AC-FT 105 108 130 74 44 41 21 18 14 17 29 103YEAR 2002* TOTAL=355.07 MEAN=1.01 MAX=7.75 MIN=0.17 AC-FT=704*Incomplete record; r = Mean flow & stage exceed rating curve
1/1
/02
2/1
/02
3/1
/02
4/1
/02
5/1
/02
6/1
/02
7/1
/02
8/1
/02
9/1
/02
10/1
/02
11/1
/02
12/1
/02
1/1
/03
0.1
1
10
Dai
ly M
ean
Dis
char
ge
(cfs
)
SCRL — 14206905 — Sylvan Creek at Raleighwood Lane near West Slope, Oregon [RM 1.0]

APPENDIX E—Stream Gauge RecordsE-34 2002 Tualatin River Flow Management Report
ASMP – 14206933 – ASH CREEK AT METZGER PARK AT METZGER, OREGON [RM 1.25]Latitude: 45 27 00 Longitude: 122 45 45 Source Agency: District 18 Watermaster
Day2002 Daily Mean Discharge in Cubic Feet per Second
JAN* FEB* MAR APR MAY JUN JUL AUG SEP OCT NOV DEC 1 9.88 4.30 2.46 1.27 .89 .59 .45 .11 .03 .35 .49 .28 2 5.39 3.32 2.20 1.22 .88 .53 .43 .11 .04 .22 .57 .28 3 4.72 3.53 2.12 1.20 .82 .49 .40 .11 .03 2.03 .62 .29 4 3.31 2.67 2.04 1.16 .76 .45 .39 .31 .03 .48 .65 .37 5 8.90 3.50 2.03 2.78 .76 .43 .35 .14 .04 .24 .62 .31 6 r 7.07 24.8 2.11 .79 .40 .33 .10 .04 .19 .66 .29 7 r 31.0 5.64 1.99 .74 .40 .60 .06 .05 .13 1.69 .27 8 25.7 12.4 3.72 1.93 .69 .47 2.94 .08 .06 .10 .83 .27 9 8.22 5.63 3.36 3.20 .69 .43 .48 .07 .04 .09 2.33 .49
10 5.24 4.99 8.96 4.17 .68 .41 .39 .09 .03 .09 .75 4.0811 4.23 3.83 37.0 2.41 .65 .46 .37 .09 .04 .09 .65 5.7312 4.89 3.35 17.9 1.66 .66 .36 .34 .09 .03 .09 3.37 11.113 3.32 2.89 9.49 5.05 .67 .30 .34 .09 .04 .11 1.53 4.5914 2.90 2.50 6.26 4.54 .63 .31 .33 .07 .05 .12 1.44 13.315 2.49 2.33 5.78 2.26 .61 .31 .32 .04 .05 .12 .31 6.9716 2.42 3.35 4.80 3.72 .60 .30 .33 .05 1.84 .13 1.19 30.317 2.20 2.25 4.55 2.76 1.67 1.79 .33 .06 1.62 .14 .36 4.7818 3.60 2.61 5.01 1.97 .73 .86 .31 .06 .18 .14 1.65 3.4319 3.62 15.1 13.8 1.68 1.05 .42 .30 .04 .13 .14 .75 2.0720 7.15 4.01 5.47 1.53 5.07 .37 .26 .57 .10 .16 .34 1.6121 6.44 3.70 4.03 1.37 1.57 .34 .24 .08 .10 .19 .31 2.4922 5.71 2.93 3.40 1.19 1.42 .33 .18 .06 .09 .19 .29 1.8523 3.70 r 2.85 1.06 .83 .31 .18 .03 .09 .21 .28 1.2624 5.92 5.68 2.36 1.01 .72 .29 .18 .03 .09 .25 .26 1.3525 32.4 4.12 2.10 .99 .68 .28 .18 .09 .09 .23 .26 .7726 10.9 3.46 1.92 2.30 .61 .29 .18 .09 .09 .24 .28 4.4027 12.9 3.07 1.61 3.07 1.31 .29 .13 .07 .12 .24 .29 14.828 7.90 2.82 1.45 1.29 4.11 3.90 .12 .03 .12 .25 .29 8.5229 5.12 — 1.33 1.09 1.90 2.98 .12 .03 1.72 .28 .28 5.1030 4.44 — 1.32 .98 .85 .55 .13 .05 1.66 .34 .27 42.631 5.12 — 1.29 — .65 — .12 .04 — .42 — 26.6
TOTAL 208.73 146.41 191.05 62.96 34.69 19.64 11.75 2.94 8.64 8.00 23.61 200.55MEAN 7.20 5.42 6.16 2.10 1.12 .65 .38 .095 .29 .26 .79 6.47MAX 32.4 31.0 37.0 5.05 5.07 3.90 2.94 .57 1.84 2.03 3.37 42.6MIN 2.20 2.25 1.29 .98 .60 .28 .12 .03 .03 .09 .26 .27AC-FT 414 290 379 125 69 39 23 5.8 17 16 47 398YEAR 2002* TOTAL=918.97 MEAN=2.54 MAX=42.6 MIN=0.03 AC-FT=1,820*Incomplete record; r = Mean flow & stage exceed rating curve
1/1
/02
2/1
/02
3/1
/02
4/1
/02
5/1
/02
6/1
/02
7/1
/02
8/1
/02
9/1
/02
10/1
/02
11/1
/02
12/1
/02
1/1
/03
0.01
0.1
1
10
100
Dai
ly M
ean
Dis
char
ge
(cfs
)
ASMP — 14206933 — Ash Creek at Metzger Park at Metzger, Oregon [RM 1.25]

APPENDIX E—Stream Gauge Records2002 Tualatin River Flow Management Report E-35
SLAB – SUMMER CREEK ABOVE SUMMER LAKE NEAR TIGARD, OREGON [RM 1.52]Latitude: 45 26 20 Longitude: 122 48 38 Source Agency: District 18 Watermaster
Day2002 Daily Mean Discharge in Cubic Feet per Second
JAN* FEB* MAR* APR* MAY* JUN* JUL AUG SEP OCT NOV DEC* 1 1.46 1.22 .79 .99 1.38 .97 .79 2 1.47 1.33 1.18 .85 1.34 1.34 .66 3 1.46 1.41 1.18 .89 3.77 .95 .94 4 1.50 1.38 .96 .85 1.45 .80 1.26 5 1.25 1.20 1.04 1.18 1.54 .64 1.10 6 1.13 1.17 1.18 1.18 1.72 .75 .80 7 1.05 1.36 1.08 1.24 1.19 2.78 .78 8 1.00 2.01 1.08 1.25 1.28 2.85 .57 9 .77 1.20 1.15 1.02 1.05 5.66 .61
10 .63 1.36 1.05 1.07 .77 2.02 7.3411 .77 1.41 .81 1.33 .69 1.77 20.512 1.05 1.36 .78 1.36 .75 5.76 r13 1.05 1.19 .94 1.08 .62 2.71 r14 1.05 1.23 1.29 .93 .60 2.42 r15 .94 1.38 1.02 1.05 .51 1.04 r16 .75 1.58 1.24 2.36 .87 2.30 r17 2.92 1.65 1.07 5.06 1.14 1.22 13.418 2.17 1.56 1.39 1.48 1.19 .98 8.9119 1.62 1.55 1.26 1.12 1.25 1.12 7.1020 1.61 1.12 1.77 1.43 1.50 1.11 4.5221 1.42 .73 1.28 1.26 1.01 1.08 6.9122 1.39 .71 1.02 .74 .81 .96 5.4723 1.30 1.00 .85 .71 .84 1.05 4.2624 1.19 1.06 .84 .86 .93 .96 3.9425 1.47 1.04 .80 .99 1.80 .80 2.8426 1.36 1.06 .96 1.26 2.19 1.12 6.8627 1.36 .76 1.03 .94 1.53 1.24 r28 9.47 .76 1.28 .84 1.24 .93 18.929 — 5.01 r .91 1.31 5.62 1.54 .65 12.330 — 2.20 1.38 1.14 .92 2.10 .95 .92 r31 — — 1.77 — 1.08 .90 — 1.24 — r
TOTAL 8.98 45.99 37.92 33.45 43.04 38.69 48.90 130.76MEAN 2.99 1.59 1.22 1.08 1.43 1.25 1.63 5.69MAX 5.01 9.47 2.01 1.77 5.62 3.77 5.76 20.5MIN 1.77 .63 .71 .78 .71 .51 .64 .57AC-FT 18 91 75 66 85 77 97 259YEAR 2002* TOTAL=387.73 MEAN=1.86 MAX=20.5 MIN=0.51 AC-FT=769*Incomplete record; r = Mean flow & stage exceed rating curve
1/1
/02
2/1
/02
3/1
/02
4/1
/02
5/1
/02
6/1
/02
7/1
/02
8/1
/02
9/1
/02
10/1
/02
11/1
/02
12/1
/02
1/1
/03
0.1
1
10
100
Dai
ly M
ean
Dis
char
ge
(cfs
)
SLAB — Summer Creek above Summer Lake near Tigard, Oregon [RM 1.52]

APPENDIX E—Stream Gauge RecordsE-36 2002 Tualatin River Flow Management Report
SC121 – 14206938 – SUMMER CREEK AT SW 121ST AVE NEAR TIGARD, OREGON [RM 1.0]Latitude: 45 26 06 Longitude: 122 47 55 Source Agency: District 18 Watermaster
Day2002 Daily Mean Discharge in Cubic Feet per Second
JAN* FEB* MAR* APR* MAY* JUN* JUL AUG SEP OCT NOV DEC* 1 r 2.32 2.55 .29 .68 2.48 .86 .91 2 10.1 2.16 1.72 .31 .71 3.65 .84 .69 3 10.4 2.00 2.12 1.14 .66 5.94 .90 .86 4 7.74 2.18 1.84 .44 .51 2.72 .57 1.62 5 9.85 1.77 1.41 .67 .72 1.74 .50 1.60 6 r 1.46 .70 1.30 2.68 1.75 .55 1.37 7 r 1.08 .97 1.21 .79 1.53 4.71 1.24 8 r .94 3.50 .90 1.14 1.22 6.51 1.08 9 r .66 1.82 .70 1.40 1.00 8.96 .98
10 r .53 .84 .62 1.36 .70 4.52 12.611 11.9 .82 .83 .99 .55 1.63 .54 4.28 29.512 10.0 .64 1.38 .91 .55 1.63 .57 9.68 r13 9.08 .86 1.49 .83 1.30 1.16 .45 6.10 r14 7.92 1.57 1.17 .62 2.94 .97 .44 5.17 r15 7.22 1.66 1.04 .61 1.71 1.05 .45 2.08 r16 8.29 10.1 1.72 .71 .84 4.32 .58 4.26 r17 7.65 6.77 7.16 4.83 .95 1.04 10.5 1.19 3.05 14.418 9.01 6.63 2.12 5.80 .95 1.08 2.84 2.12 1.94 9.6519 10.4 r 2.20 1.93 1.07 1.14 1.53 1.03 2.19 8.5920 r 6.58 2.09 1.16 2.03 1.45 .81 1.69 5.6721 r 2.34 1.50 .46 1.81 1.73 .87 1.34 8.0022 r 2.28 1.12 .40 1.46 .60 .63 1.16 6.2323 11.2 2.03 1.04 1.05 1.04 .55 .55 .99 5.9424 r .97 .69 1.33 1.32 .59 .46 .92 4.4125 r .79 .99 .29 .91 .65 .66 .34 4.0126 r .77 1.04 .35 .74 1.23 1.18 .83 6.0427 r r 1.05 .25 .61 1.47 .88 1.01 41.328 r r r .22 1.09 1.20 .60 1.18 17.729 r — r r .18 1.40 8.41 .90 .75 13.230 12.8 — 3.38 3.89 .87 .97 4.70 .75 .83 r31 r — — 2.72 — r .69 — .78 — r
TOTAL 59.35 107.71 40.61 47.69 31.80 31.96 58.86 39.17 78.71 197.59MEAN 9.89 8.98 2.26 1.70 1.06 1.07 1.96 1.26 2.62 8.23MAX 12.8 11.9 7.16 5.80 3.50 2.94 10.5 5.94 9.68 41.3MIN 7.65 6.63 .64 .53 .18 .29 .51 .44 .34 .69AC-FT 118 214 81 95 63 63 117 78 156 392YEAR 2002* TOTAL=693.45 MEAN=2.90 MAX=41.3 MIN=0.18 AC-FT=1,380*Incomplete record; r = Mean flow & stage exceed rating curve
1/1
/02
2/1
/02
3/1
/02
4/1
/02
5/1
/02
6/1
/02
7/1
/02
8/1
/02
9/1
/02
10/1
/02
11/1
/02
12/1
/02
1/1
/03
0.1
1
10
100
Dai
ly M
ean
Dis
char
ge
(cfs
)
SC121 — 14206938 — Summer Creek at 121st Avenue near Tigard, Oregon [RM 1.0]

APPENDIX E—Stream Gauge Records2002 Tualatin River Flow Management Report E-37
FANO – 14206950 – FANNO CREEK AT DURHAM ROAD [RM 1.2]Latitude: 45 24 12 Longitude: 122 45 18 Source Agency: District 18 Watermaster
Day2002 Daily Mean Discharge in Cubic Feet per Second
JAN* FEB MAR APR MAY JUN JUL* AUG* SEP OCT NOV DEC 1 117 75.2 28.6 18.6 14.9 13.4 12.7 3.64 20.6 4.12 6.05 2 107 47.1 26.3 16.1 13.8 11.8 10.0 3.75 10.9 3.81 6.18 3 67.7 52.8 23.7 17.1 13.3 10.8 9.62 3.88 36.8 4.10 5.88 4 42.9 39.2 21.3 16.6 12.1 10.6 9.32 4.25 21.6 3.82 10.4 5 82.8 49.7 22.1 34.7 11.6 10.9 8.62 4.22 9.80 5.97 11.3 6 268 72.8 310 32.7 12.2 9.18 7.59 5.84 7.98 4.52 8.98 7 r 235 107 19.8 11.8 8.19 9.61 6.02 7.21 18.1 7.18 8 r 369 51.0 18.1 11.4 9.37 46.6 3.95 6.06 46.6 6.49 9 178 106 39.8 40.1 11.0 8.51 13.4 4.68 5.53 50.7 7.79
10 90.6 71.7 83.8 84.4 11.5 7.87 9.32 4.85 4.61 35.2 92.011 66.5 62.8 303 43.5 10.7 7.59 6.43 4.03 27.0 13012 79.0 45.5 416 28.1 10.2 8.56 4.72 3.78 85.7 12513 49.5 39.3 165 42.4 10.2 8.47 4.31 3.74 47.7 20314 41.5 34.3 99.8 117 11.1 7.70 3.96 4.00 43.5 26515 34.9 31.2 74.6 31.4 11.0 8.49 3.72 3.19 15.5 12316 31.8 47.5 69.9 39.6 10.0 7.29 5.27 23.1 3.32 24.9 44917 32.1 32.0 59.3 53.1 35.2 27.1 4.11 66.8 3.77 23.3 13818 40.1 31.1 59.3 37.3 14.4 38.7 3.58 13.6 5.33 16.6 77.419 63.6 201 221 23.5 15.8 13.2 3.97 7.28 5.01 26.0 60.520 102 65.7 83.6 21.7 52.5 10.5 12.1 5.71 4.03 13.5 38.021 89.6 54.9 54.0 19.8 34.6 10.1 6.90 5.31 4.37 10.4 62.822 104 42.7 43.6 18.9 18.3 9.23 5.03 4.29 4.20 8.63 44.823 56.5 369 38.6 16.5 19.9 8.74 4.30 3.29 3.57 8.74 46.124 59.7 109 33.9 15.6 12.8 7.97 4.26 3.39 3.50 7.41 34.225 433 54.9 30.1 16.4 12.8 8.17 3.99 3.38 3.64 6.64 25.726 226 43.4 27.4 19.2 16.9 7.54 3.60 3.54 3.81 5.63 50.527 216 36.7 24.9 47.0 14.2 7.82 3.33 4.15 4.72 6.56 23828 135 32.5 22.8 19.8 56.3 47.2 3.01 4.83 4.26 6.82 14129 79.6 — 21.3 16.4 71.6 126 4.28 40.1 4.11 6.60 12630 61.3 — 20.2 15.2 19.8 19.2 4.18 35.3 4.77 6.05 27331 72.1 — 19.5 — 15.8 — 3.72 — 4.22 — 575
TOTAL 3,027.8 2,452.0 2,601.4 940.6 597.7 490.19 136.78 75.63 292.29 216.46 574.12 3,388.25MEAN 104 87.6 83.9 31.4 19.3 16.3 13.7 4.73 9.74 6.98 19.1 109MAX 433 369 416 117 71.6 126 46.6 12.1 66.8 36.8 85.7 575MIN 31.8 31.1 19.5 15.2 10.0 7.29 7.59 3.01 3.29 3.19 3.81 5.88AC-FT 6,010 4,860 5,160 1,870 1,190 972 271 150 580 429 1,140 6,720YEAR 2002* TOTAL=14,793.22 MEAN=45.2 MAX=575 MIN=3.01 AC-FT=29,340*Incomplete record; r = Mean flow & stage exceed rating curve
1/1
/02
2/1
/02
3/1
/02
4/1
/02
5/1
/02
6/1
/02
7/1
/02
8/1
/02
9/1
/02
10/1
/02
11/1
/02
12/1
/02
1/1
/03
1
10
100
1000
Dai
ly M
ean
Dis
char
ge
(cfs
)
FANO — 14206950 — Fanno Creek at Durham Road near Tigard, Oregon [RM 1.2]

APPENDIX E—Stream Gauge RecordsE-38 2002 Tualatin River Flow Management Report
HCWL – 14206957 – HEDGES CREEK WETLAND NEAR TUALATIN [RM 1.2]Latitude: 45 22 53 Longitude:122 46 35 Source Agency: District 18 Watermaster
DayDaily Mean Stage in Feet above Gage Datum for 2002
JAN FEB MAR APR MAY JUN JUL AUG SEP* OCT NOV DEC 1 1.73 1.71 1.57 1.79 1.69 1.58 1.51 1.33 1.54 1.60 1.23 1.54 2 1.75 1.67 1.57 1.79 1.69 1.55 1.52 1.31 1.54 1.58 1.22 1.54 3 1.73 1.66 1.56 1.82 1.69 1.62 1.51 1.29 1.55 1.60 1.19 1.54 4 1.71 1.62 1.61 1.84 1.69 1.61 1.51 1.28 1.55 1.65 1.18 1.55 5 1.73 1.61 1.64 1.85 1.69 1.57 1.49 1.28 1.55 1.62 1.24 1.57 6 1.86 1.65 1.88 1.86 1.67 1.55 1.49 1.30 1.55 1.59 1.28 1.57 7 2.10 1.81 1.80 1.83 1.67 1.53 1.47 1.32 1.54 1.57 1.34 1.57 8 2.09 1.86 1.71 1.83 1.65 1.54 1.54 1.32 1.54 1.54 1.60 1.56 9 1.91 1.73 1.69 1.86 1.63 1.54 1.54 1.31 1.54 1.50 1.66 1.55
10 1.82 1.68 1.72 1.94 1.63 1.52 1.52 1.29 1.54 1.45 1.65 1.7111 1.78 1.65 1.93 1.87 1.62 1.54 1.50 1.27 1.56 1.43 1.61 1.8012 1.77 1.62 2.00 1.83 1.60 1.53 1.48 1.24 1.55 1.41 1.70 1.8113 1.74 1.60 1.88 1.83 1.61 1.53 1.48 1.22 1.54 1.39 1.73 1.8414 1.70 1.58 1.80 1.91 1.61 1.54 1.45 1.22 1.54 1.37 1.69 1.8715 1.67 1.55 1.76 1.81 1.62 1.56 1.46 1.21 1.53 1.34 1.64 1.8116 1.65 1.58 1.74 1.80 1.61 1.58 1.45 1.19 1.32 1.64 1.9517 1.66 1.55 1.73 1.82 1.70 1.61 1.45 1.17 1.30 1.66 1.8418 1.66 1.55 1.71 1.81 1.69 1.66 1.46 1.15 1.29 1.63 1.7919 1.69 1.69 1.79 1.77 1.65 1.61 1.45 1.14 1.27 1.65 1.7620 1.77 1.61 1.72 1.77 1.67 1.57 1.43 1.18 1.23 1.62 1.7221 1.77 1.60 1.69 1.76 1.72 1.55 1.42 1.28 1.24 1.60 1.7522 1.78 1.57 1.68 1.75 1.69 1.54 1.41 1.32 1.24 1.59 1.7223 1.72 1.81 1.70 1.75 1.66 1.54 1.41 1.33 1.22 1.58 1.7324 1.71 1.66 1.71 1.74 1.61 1.53 1.41 1.35 1.48 1.21 1.56 1.7125 2.02 1.59 1.72 1.74 1.59 1.52 1.41 1.34 1.45 1.20 1.52 1.6926 1.93 1.56 1.75 1.73 1.57 1.51 1.40 1.35 1.43 1.18 1.52 1.7227 1.89 1.55 1.77 1.76 1.57 1.49 1.38 1.35 1.40 1.17 1.54 1.8228 1.82 1.54 1.78 1.71 1.65 1.53 1.35 1.35 1.37 1.17 1.54 1.8129 1.75 — 1.78 1.70 1.76 1.73 1.34 1.39 1.44 1.19 1.54 1.8030 1.71 — 1.77 1.70 1.68 1.57 1.34 1.42 1.56 1.21 1.54 1.8731 1.72 — 1.79 — 1.63 — 1.33 1.50 — 1.23 — 2.00*Incomplete record
1/1
/02
2/1
/02
3/1
/02
4/1
/02
5/1
/02
6/1
/02
7/1
/02
8/1
/02
9/1
/02
10/1
/02
11/1
/02
12/1
/02
1/1
/03
1.0
1.5
2.0
2.5
Sta
ge
(fee
t ab
ove
sea
l lev
el)
Hedges Creek Wetland near Tualatin, Oregon

APPENDIX E—Stream Gauge Records2002 Tualatin River Flow Management Report E-39
HCTP – 14206958 – HEDGES CREEK AT TUALATIN PARK [RM 0.3]Latitude: 45 22 53 Longitude:122 46 35 Source Agency: District 18 Watermaster
Day2002 Daily Mean Discharge in Cubic Feet per Second
JAN FEB MAR APR MAY JUN JUL AUG SEP OCT NOV DEC 1 10.1 12.6 4.17 2.46 1.66 1.51 2.65 .26 0 1.24 0 .31 2 13.3 8.31 3.74 2.38 1.60 1.26 1.87 .15 0 .79 0 .26 3 10.2 7.95 3.35 2.54 1.52 1.09 1.66 .09 0 1.71 0 .24 4 8.41 6.51 2.93 2.58 1.49 1.65 1.33 .02 0 2.38 0 .24 5 9.04 6.04 3.09 2.96 1.47 1.56 1.18 0 .17 1.25 0 .44 6 26.4 9.50 36.8 3.72 1.49 1.16 1.06 0 .21 .78 0 .34 7 79.3 28.2 21.2 2.46 1.37 1.09 1.19 0 .15 .53 .09 .30 8 75.1 36.9 9.48 2.00 1.31 1.23 2.98 0 .15 .39 1.32 .27 9 30.3 16.1 6.57 3.11 1.20 1.40 2.10 0 .13 .38 5.84 .27
10 17.0 10.7 8.56 14.5 1.17 1.01 1.64 0 .13 .30 5.53 8.2511 12.5 8.90 45.4 8.35 1.10 .81 1.25 0 .14 .25 2.84 19.912 13.5 6.88 53.0 4.24 .88 .82 1.03 0 .16 .24 11.9 19.913 9.55 6.04 28.2 4.03 .94 .75 .96 0 .15 .25 12.1 23.014 7.13 5.42 15.7 15.6 .94 .61 .93 0 .14 .19 5.70 28.415 5.52 4.57 11.4 5.82 .95 .81 .79 0 .15 .13 2.16 17.216 4.54 5.63 10.1 4.48 .79 .94 .75 0 .30 .07 2.52 50.417 4.66 4.88 9.08 5.56 3.20 1.35 .80 0 3.14 .01 3.00 22.018 5.04 4.19 8.62 5.55 2.25 2.93 .82 0 2.22 0 1.70 13.519 6.84 13.9 15.4 3.46 1.75 2.03 .67 0 .88 0 2.11 10.220 15.5 8.23 10.5 2.97 2.75 1.48 .57 .01 .45 .01 1.50 6.5721 15.0 6.48 7.23 2.64 4.08 1.10 .50 0 .42 0 .90 8.0722 15.7 5.32 6.14 2.47 3.08 .95 .33 0 .65 0 .76 6.0723 9.92 34.3 5.27 2.50 2.47 .87 .35 0 .72 0 .74 5.5324 8.49 12.5 4.57 2.28 1.50 .77 .48 0 .69 0 .59 4.3425 64.6 6.75 4.04 2.21 1.04 .52 .60 0 .57 0 .45 3.3526 38.6 5.25 3.51 2.20 .90 .45 .72 0 .41 0 .36 4.5527 34.7 4.78 3.58 3.41 .89 .49 .68 0 .46 0 .38 18.828 24.0 4.50 3.47 2.53 2.48 2.51 .56 0 .30 0 .43 15.729 15.0 — 3.27 1.94 7.18 17.9 .48 0 .41 0 .38 14.930 10.9 — 2.89 1.82 3.35 5.35 .37 0 1.29 0 .33 31.631 11.5 — 2.58 — 2.05 — .30 0 — 0 — 65.4
TOTALMEANMAXMINAC-FTYEAR 2002 TOTAL=2,017.08 MEAN=5.53 MAX=79.3 MIN=0 AC-FT=4,000
1/1
/02
2/1
/02
3/1
/02
4/1
/02
5/1
/02
6/1
/02
7/1
/02
8/1
/02
9/1
/02
10/1
/02
11/1
/02
12/1
/02
1/1
/03
0.01
0.1
1
10
100
Dai
ly M
ean
Dis
char
ge
(cfs
)
HCTP — 14206958 — Hedges Creek at Tualatin Community Park at Tualatin, Oregon [RM 0.3]

APPENDIX E—Stream Gauge RecordsE-40 2002 Tualatin River Flow Management Report
TRT – 14206960 – TUALATIN RIVER AT TUALATIN, OREGON [RM 8.9]Latitude: 45 23 14 Longitude: 122 45 46 Source Agency: District 18 Watermaster
DayDaily Elevation in Feet above Mean Sea Level for 2002
JAN FEB MAR APR MAY JUN JUL AUG SEP OCT NOV DEC 1 106 109 104 104 103 102 103 102 102 102 102 101 2 106 109 104 103 102 102 102 102 102 102 102 101 3 106 109 104 103 102 102 102 102 102 102 102 101 4 105 108 104 103 102 102 102 102 102 102 102 101 5 105 108 103 103 102 102 102 102 102 102 102 102 6 106 107 104 103 102 102 102 102 102 102 102 102 7 108 107 104 103 102 102 102 102 102 102 102 102 8 110 108 104 103 102 102 102 102 102 102 102 102 9 110 108 104 103 102 102 102 102 102 102 102 101
10 110 108 104 103 102 102 102 102 102 102 102 10211 111 108 105 103 102 102 102 102 102 102 102 10212 111 108 107 103 102 102 102 102 102 102 102 10313 110 108 108 103 102 102 102 102 102 102 102 10414 110 107 108 104 102 102 102 102 102 102 102 10415 109 107 108 104 102 102 102 102 102 102 102 10516 109 107 108 104 102 102 102 102 102 102 102 10617 108 106 108 104 102 102 102 102 102 102 102 10718 108 106 108 104 102 102 102 102 102 102 102 10719 107 105 108 104 102 102 102 102 102 102 102 10620 107 105 108 104 102 102 102 102 102 102 102 10621 107 105 108 103 102 102 102 102 102 102 102 10622 107 105 107 103 102 102 102 102 102 102 102 10523 107 106 107 103 102 102 102 102 102 102 102 10524 107 106 107 103 102 102 102 102 102 102 102 10425 108 106 107 103 102 102 102 102 102 102 102 10426 109 105 106 103 102 102 102 102 102 102 102 10427 109 105 105 103 102 102 102 102 102 102 101 10428 110 105 105 103 102 102 102 102 102 102 101 10529 110 — 104 103 102 102 102 102 102 102 101 10530 110 — 104 103 102 103 102 102 102 102 101 10631 110 — 104 — 102 — 102 102 — 102 — 107
1/1
/02
2/1
/02
3/1
/02
4/1
/02
5/1
/02
6/1
/02
7/1
/02
8/1
/02
9/1
/02
10/1
/02
11/1
/02
12/1
/02
1/1
/03
101
103
105
107
109
111
Sta
ge
(fee
t ab
ove
sea
leve
l)
TRT — 14206960 — Tualatin River at Tualatin, Oregon [RM 8.9]

APPENDIX E—Stream Gauge Records2002 Tualatin River Flow Management Report E-41
LOCS – 14206990 TUALATIN RIVER AT OSWEGO CANAL NEAR LAKE OSWEGO, OREGON [RM 6.7]Latitude: 45 22 57 Longitude: 122 43 17 Source Agency: District 18 Watermaster
DayDaily Elevation in Feet above Mean Sea Level for 2002
JAN FEB MAR APR MAY JUN JUL AUG SEP OCT NOV DEC 1 105 107 104 103 102 102 102 97.7 102 102 102 2 104 107 103 103 102 102 102 102 97.9 102 102 102 3 104 107 103 103 102 102 102 102 97.6 102 102 102 4 104 106 103 103 102 102 102 102 97.5 102 102 102 5 104 106 103 103 102 102 102 102 97.7 102 102 102 6 105 106 103 103 102 102 102 102 97.4 102 102 102 7 107 106 104 103 102 102 102 102 97.4 102 102 102 8 108 106 103 103 102 102 102 102 97.4 102 102 102 9 108 106 103 103 102 102 102 102 97.4 102 102 102
10 108 106 103 103 102 102 102 102 97.4 102 102 10211 108 106 104 103 102 102 102 102 97.4 102 102 10212 108 106 105 103 102 102 102 102 97.4 102 102 10313 108 106 106 103 102 102 102 102 97.4 102 102 10314 108 106 106 103 102 102 102 102 97.7 102 102 10415 107 105 106 103 102 102 102 102 97.7 102 102 10416 107 105 106 104 102 102 102 102 97.6 102 102 10517 106 105 106 104 102 102 102 102 97.5 102 102 10518 106 104 106 103 102 102 102 102 97.9 102 102 10519 106 104 106 103 102 102 102 102 101 102 102 10520 105 104 106 103 102 102 102 99.8 102 102 102 10521 105 104 106 103 102 102 102 97.5 102 102 102 10522 105 104 106 103 102 102 102 97.5 102 102 102 10423 105 105 106 103 102 102 102 97.5 102 102 102 10424 105 105 105 103 102 102 102 100 102 102 102 10325 106 105 105 103 102 102 102 101 102 102 102 10326 107 104 105 103 102 102 102 98.6 102 102 102 10327 107 104 104 103 102 102 102 97.4 102 102 102 10328 108 104 104 103 102 102 102 97.6 102 102 102 10429 108 — 104 102 102 102 102 97.6 102 102 102 10430 108 — 103 102 102 103 102 97.6 102 102 102 10531 108 — 103 — 102 — 102 97.5 — 102 — 106
1/1
/02
2/1
/02
3/1
/02
4/1
/02
5/1
/02
6/1
/02
7/1
/02
8/1
/02
9/1
/02
10/1
/02
11/1
/02
12/1
/02
1/1
/03
97
99
101
103
105
107
109
111
Sta
ge
(fee
t ab
ove
sea
leve
l)
LOCS — 14206990 — Tualatin River at Oswego Canal near Lake Oswego, Oregon [RM 6.7]

APPENDIX E—Stream Gauge RecordsE-42 2002 Tualatin River Flow Management Report
UNITED STATES DEPARTMENT OF THE INTERIOR - GEOLOGICAL SURVEY - OREGON DISTRICT STATION NUMBER: 14207500 TUALATIN RIVER AT WEST LINN,OREG.
LATITUDE: 452103 LONGITUDE: 1224030 DRAINAGE AREA: 706.00 DATUM: 85.61
Discharge, Cubic Feet per Second, Calendar Year January to December 2002 Daily Mean ValuesDay JAN FEB MAR APR MAY JUN JUL AUG SEP OCT† NOV† DEC†
1 2590 5690 1670 1330 758 444 564 182 183 311 198 1572 2490 5270 1520 1250 713 374 472 183 188 301 198 1533 2540 4890 1390 1170 680 328 389 158 204 267 195 1474 2500 4500 1280 1080 653 304 326 144 210 289 189 1505 2410 4170 1200 1020 634 291 293 153 201 297 190 1606 2780 3940 1600 1020 622 297 290 166 184 285 220 1657 4770 3990 1790 1030 618 295 274 167 183 275 212 1668 6180 4500 1660 1040 602 286 308 162 192 259 318 1599 5960 4430 1430 1020 566 298 334 173 217 236 422 155
10 6370 4370 1350 1110 537 316 331 166 231 219 532 28111 6860 4320 1860 1210 503 311 278 156 226 216 506 53412 7050 4250 3490 1250 475 281 245 162 214 216 537 88213 6720 4100 4140 1240 452 256 241 172 208 215 535 150014 6160 3870 4160 1430 446 254 234 167 204 228 486 188015 5550 3560 4150 1550 452 278 235 158 201 225 475 220016 4960 3260 4240 1700 462 291 238 148 217 216 444 335017 4450 2940 4260 1690 498 321 224 152 309 209 379 368018 4020 2510 4180 1610 497 395 203 148 316 207 292 361019 3700 2410 4300 1490 474 394 204 141 308 211 284 341020 3510 2270 4150 1350 489 371 214 151 280 221 267 317021 3430 2170 3980 1250 544 324 226 158 242 233 288 293022 3480 2120 3800 1190 527 295 228 160 e200 238 307 250023 3510 2720 3650 1130 511 270 214 163 e200 234 260 202024 3550 2850 3480 1060 469 262 201 159 191 235 219 165025 4630 2670 3220 972 434 267 202 148 178 229 197 142026 5160 2380 2870 884 403 254 206 144 175 224 172 130027 5540 2090 2440 881 374 250 201 147 184 225 160 161028 5950 1860 2030 875 424 272 199 153 201 225 154 208029 6200 --- 1750 831 569 523 210 158 239 218 156 245030 6210 --- 1560 801 556 584 198 189 281 210 155 274031 6000 --- 1430 --- 522 --- 181 205 --- 202 --- 4240
TOTAL 145230 98100 84030 35464 16464 9686 8163 4993 6567 7376 8947 50849 MEAN 4685 3504 2711 1182 531 323 263 161 219 238 298 1640 MAX 7050 5690 4300 1700 758 584 564 205 316 311 537 4240 MIN 2410 1860 1200 801 374 250 181 141 175 202 154 147 AC-FT 288100 194600 166700 70340 32660 19210 16190 9900 13030 14630 17750 100900YEAR 2002 TOTAL=475,869 MEAN=1304 MAX=7050 MIN=141 AC-FT=943,900
†Provisional data–subject to revision; e=estimated
1/1
/02
2/1
/02
3/1
/02
4/1
/02
5/1
/02
6/1
/02
7/1
/02
8/1
/02
9/1
/02
10/1
/02
11/1
/02
12/1
/02
1/1
/03
100
1000
10000
Dai
ly M
ean
Dis
char
ge
(cfs
)
WSLO — 14207500 —Tualatin River at West Linn, Oregon [RM 1.75]

APPENDIX E—Stream Gauge Records2002 Tualatin River Flow Management Report E-43
SPBR – 14211116 – SPRINGBROOK CR AT IRON MOUNTAIN RD NEAR LAKE OSWEGO, OREGON [RM 0.18]Latitude: 45 24 46 Longitude: 122 42 13 Source Agency: District 18 Watermaster
Day2002 Daily Mean Discharge in Cubic Feet per Second
JAN FEB MAR APR MAY JUN JUL AUG SEP OCT NOV DEC 1 6.70 5.23 2.37 2.62 1.31 .71 .81 .68 .64 .61 .74 .55 2 4.80 4.50 2.30 2.51 1.28 .69 .75 .68 .61 .54 .78 .55 3 5.00 4.64 2.16 2.40 1.28 .68 .73 .68 .54 1.44 .72 .52 4 3.68 3.85 2.09 2.09 1.22 .82 .71 .99 .51 .74 .73 .62 5 6.54 4.36 2.29 2.32 1.18 1.03 .70 .81 .49 .62 .73 .54 6 14.5 7.25 15.9 1.88 1.16 1.04 .69 .76 .46 .59 .73 .52 7 26.5 14.0 5.94 1.88 1.12 .99 .75 .73 .46 .56 1.59 .56 8 15.2 9.45 4.55 1.90 1.09 1.02 1.58 .73 .45 .54 .95 .55 9 7.70 5.98 4.13 3.19 1.03 1.00 .76 .73 .41 .52 1.76 .76
10 6.26 5.50 5.85 5.24 1.01 .90 .71 .76 .41 .52 1.02 3.0011 5.40 4.48 16.5 2.77 .96 .91 .68 .71 .43 .53 .93 3.1812 5.52 3.99 12.0 2.28 .94 .90 .65 .68 .41 .54 4.25 4.5313 4.46 3.60 8.96 4.09 .96 .82 .70 .65 .39 .56 1.21 3.1814 4.07 3.21 7.10 3.98 .89 .80 .81 .70 .38 .55 .96 6.4015 4.10 2.93 6.58 2.46 .82 .77 .68 .68 .37 .55 .60 3.8916 3.86 3.50 5.85 2.56 .74 .82 .66 .68 1.22 .56 1.09 11.217 3.55 2.72 5.34 2.01 .99 1.85 .64 .67 1.26 .56 .72 3.4018 4.29 2.89 6.21 1.77 .69 1.04 .68 .67 .44 .52 1.07 2.6119 4.44 6.93 12.1 1.65 .97 .79 .70 .67 .39 .52 .77 1.7420 6.36 3.44 6.75 1.57 7.45 .74 .69 1.13 .36 .53 .56 1.7521 5.74 3.26 5.54 1.44 1.65 .72 .70 1.18 .36 .54 .55 2.3522 5.89 2.87 4.89 1.38 1.34 .71 .68 1.16 .40 .54 .52 1.8223 4.64 13.4 4.52 1.36 1.70 .75 .67 1.09 .41 .58 .55 1.3924 5.74 4.31 4.22 1.28 1.00 .71 .67 1.03 .41 .62 .52 1.4825 17.8 3.47 3.88 1.33 1.01 .69 .66 .93 .40 .64 .52 1.1426 8.82 3.01 3.58 1.87 .88 .68 .66 .92 .40 .64 .52 3.2327 9.97 2.73 3.41 2.04 1.06 .69 .63 .85 .42 .66 .51 6.4828 8.19 2.59 3.26 1.46 1.77 2.88 .63 .78 .42 .75 .52 4.7129 6.49 — 3.09 1.37 1.23 2.35 .63 .72 1.72 .71 .52 3.5630 5.94 — 2.92 1.42 .83 .96 .63 .74 1.14 .68 .55 15.131 6.30 — 2.76 — .74 — .64 .64 — .67 — 11.2
TOTAL 228.45 138.09 177.04 66.12 40.30 29.46 22.28 24.83 16.71 19.13 27.19 102.51MEAN 7.37 4.93 5.71 2.20 1.30 .98 .72 .80 .56 .62 .91 3.31MAX 26.5 14.0 16.5 5.24 7.45 2.88 1.58 1.18 1.72 1.44 4.25 15.1MIN 3.55 2.59 2.09 1.28 .69 .68 .63 .64 .36 .52 .51 .52AC-FT 453 274 351 131 80 58 44 49 33 38 54 203YEAR 2002 TOTAL=892.11 MEAN=2.44 MAX=26.5 MIN=0.36 AC-FT=1,770
1/1
/02
2/1
/02
3/1
/02
4/1
/02
5/1
/02
6/1
/02
7/1
/02
8/1
/02
9/1
/02
10/1
/02
11/1
/02
12/1
/02
1/1
/03
0.1
1
10
100
Dai
ly M
ean
Dis
char
ge
(cfs
)
SPBR — 14211116 — Springbrook Creek at Iron Mountain Rd near Lake Oswego, Oregon [RM 0.18]

Appendix FAppendix FAppendix FAppendix F
Stream Temperature RecordsStream Temperature RecordsStream Temperature RecordsStream Temperature Records

STREAM TEMPERATURE SITES — LOCATIONS
Sampling and Flow Sites
Withdrawal Points
Wastewater Treatment Plants
North
SCHEMATIC MAPSCHEMATIC MAPSCHEMATIC MAPSCHEMATIC MAPNot to Scale
SCBR
TRLF
Fanno
Creek
Cr
Cr
Cr
S. Rock
McF
ee C
r
Christensen
Creek
Creek
Cr
Ro
McKay
East
West
Gales
Creek
SCHO SCLO
SCOO
DLLO
Scog
Barney Reservoir
Scoggins Reservoir
DAIRY
ROODRCTV
FRMO
Lake Oswego
WI L L A M
E T T E RI V
ER
TU
AL
R
GALES
Dairy
Creek
Burris Cr
He Cr
Baker Cr
Chicken
Cedar Cr
Canal
(Hagg Lake)
Ash
Hedges
Sain Cr
Ta
gins
Car
pe
Dawson Cr
Brons
Beav
nner Cr
nter
Cr
Fork
Fork
onat
Lake Oswego
AT
IN
VE
RI
CedarMill Cr
S. on Cr
Springbrook Cr
Saum Cr
Butternut Cr
DCBR
on Cr
BCBR
BCSR
CMMB
SPBR
TRTFANO
JCDV
MCSCWCJS
WC143
WCHP
BCCH
WSLO
LOCS
HCTP ASMP
SLABSLBE
SC121
SCRL
Sylvan Cr
Cr
Cr Sum
mer
Ck
Johns
Ericks
on
CkECMR
BVTS
Wil
wCr
lo
CCERELSN
MCMRBCHH
RCQR
ck
eek
RCWU RCRRCre
ek
erto
n
CCSR
MCKH
MCKN
TRGC
EFDREFDD
WFDE
WFDM
GCCH
4550
GASO
TRTR
2460
2480

APPENDIX F—Stream Temperature Records2002 Tualatin River Flow Management Report F-3
STREAM TEMPERATURE SITES — ALPHABETICAL LISTING BY SITE CODESITE CODE SITE NAME RIVER MILE STATION ID PAGE
2460 Tualatin River below Barney Reservoir Outfall 77.8 14202460 F-62480 Tualatin River above Barney Reservoir Outfall 78.1 14202480 F-44550 Gales Creek above Glenwood, Oregon 19.9 14204550 F-12ASMP Ash Creek at Metzger Park at Metzger, Oregon 1.25 14206933 F-47BCBR Bronson Creek at Bronson Road near Orenco, Oregon 2.1 14206423 F-36BCCH Beaverton Creek at Cedar Hills Blvd at Beaverton, Oregon 7.45 14206360 F-29BCHH Burris Creek at Hwy 219 0.38 — F-41BCSR Bronson Creek at Saltzman Road near Orenco, Oregon 5.1 14206419 F-35BVTS Beaverton Creek at 216th near Orenco, Oregon 1.2 14206435 F-37CCER Cedar Creek at Edy Road near Sherwood, Oregon 0.62 14206748 F-44CCSR Chicken Creek at Scholls-Sherwood Road 2.3 14206750 F-45CMMB Cedar Mill Creek at Murray Boulevard near Beaverton, Oregon 1.64 14206395 F-32DAIRY Dairy Creek at Hwy 8 near Hillsboro, Oregon 2.06 14206200 F-24DCBR Dawson Creek at Brookwood Road near Hillsboro, Oregon 0.07 14206443 F-38DLLO Tualatin River at Dilley, Oregon 58.8 14203500 F-11ECMR Erickson Creek at Menlo Drive at Beaverton, Oregon 0.76 14206365 F-30EFDD East Fork Dairy Creek near Dairy Creek Rd near Mountaindale, OR 12.33 14205480 F-18EFDR East Fork Dairy Creek at Roy Road 1.24 — F-19ELSN Tualatin River at Elsner Road near Sherwood, Oregon 16.2 14206600 F-43FANO Fanno Creek at Durham Road near Tigard, Oregon 1.2 14206950 F-51FRMO Tualatin River at Farmington, Oregon 33.3 14206500 F-40GALES Gales Creek at Old Hwy 47 near Forest Grove, Oregon 2.36 14204530 F-14GASO Tualatin River at Gaston, Oregon 62.3 14202510 F-8GCCH Gales Creek at Clapshaw Hill Road near Gales Creek, Oregon 12.36 14204540 F-13HCTP Hedges Creek at Tualatin Community Park at Tualatin, Oregon 0.3 14206958 F-52JCDV Johnson Creek at Davis Road near Beaverton, Oregon 1.3 14206372 F-31LOCS Tualatin River at Oswego Canal near Lake Oswego, Oregon 6.7 14206990 F-55MCKH McKay Creek at Hornecker Rd near Hillsboro, Oregon 2.2 14206180 F-23MCKN McKay Creek at Northrup Road near North Plains, Oregon 15.5 14205980 F-20MCMR McFee Creek at Midway Road 2.04 — F-42MCSC McKay Creek at Scotch Church Road near Hillsboro, Oregon 6.3 14206070 F-21RCQR Rock Creek at Quatama near Orenco, Oregon 4.9 14206347 F-28RCRR Rock Creek at Rock Creek Road near Bowers Junction, Oregon 15.8 14206305 F-26RCTV Rock Creek at Hwy 8 near Hillsboro, Oregon 1.2 14206450 F-39RCWU Rock Creek at West Union Road near Bethany, Oregon 9.0 14206338 F-27ROOD Tualatin River at Rood Bridge Road near Hillsboro, Oregon 38.4 14206295 F-25SC121 Summer Creek at 121st Avenue near Tigard, Oregon 1.0 14206938 F-50SCBR Saum Creek at Borland Road 0.6 — F-54SCLO Scoggins Creek above Henry Hagg Lake near Gaston, Oregon 8.0 14202850 F-9SCOO Scoggins Creek below Henry Hagg Lake near Gaston, Oregon 4.80 14202980 F-10SCRL Sylvan Creek at Raleighwood Lane near West Slope, Oregon 1.0 14206905 F-46SLAB Summer Creek above Summer Lake near Tigard, Oregon 1.52 — F-48SLBE Summer Creek below Summer Lake near Tigard, Oregon 1.32 — F-49SPBR Springbrook Creek at Iron Mountain Rd near Lake Oswego, Oregon 0.18 14211116 F-56TRGC Tualatin River at Golf Course Road near Cornelius, Oregon 51.5 14204800 F-15TRLF Tualatin River below Lee Falls 70.5 14202450 F-7TRT Tualatin River at Tualatin, Oregon 8.9 14206960 F-53TRTR Barney Reservoir Outfall to Tualatin River 78.0 14202470 F-5WC143 Willow Creek at 143rd Avenue near Beaverton, Oregon 3.5 14206410 F-33WCHP Willow Creek at Heritage Parkway near Beaverton, Oregon 0.75 14206413 F-34WCJS Waible Creek at Jackson School Road near Hillsboro, Oregon 1.0 14206100 F-22WFDE West Fork Dairy Creek at Evers Road 1.96 14205160 F-17WFDM West Fork Dairy Creek at Manning, Oregon 12.9 — F-16WSLO Tualatin River at West Linn 1.75 14207500 no data

APPENDIX F—Stream Temperature RecordsF-4 2002 Tualatin River Flow Management Report
14202480 – TUALATIN RIVER ABOVE BARNEY RESERVOIR OUTFALL [RM 78.1]Longtitude: 45 27 54 Longitude: 123 23 75 Source Agency: District 18 Watermaster
Day2002 Mean Daily Water Temperature in Degrees Celsius
JAN FEB MAR APR MAY JUN JUL AUG SEP OCT NOV DEC 1 5.60 4.78 4.43 6.44 8.11 9.96 10.7 11.5 12.2 8.55 4.27 2 6.11 4.91 4.54 6.37 7.42 9.55 10.7 11.1 12.2 8.14 3.93 3 6.04 4.87 5.01 6.73 6.94 9.53 10.6 11.1 11.7 9.53 4.34 4 5.78 4.68 5.43 7.19 6.82 10.3 10.3 11.1 10.6 10.1 5.10 5 5.88 4.78 5.65 6.85 6.57 10.4 10.3 10.5 10.2 10.0 6.07 6 6.76 4.91 5.25 7.10 6.07 9.42 11.3 10.6 10.1 10.4 6.55 7 7.48 4.07 3.70 6.90 5.96 8.63 11.7 10.6 10.3 10.0 7.02 8 7.30 3.88 3.50 6.72 6.27 8.47 11.5 10.8 9.87 9.84 7.33 9 7.09 4.65 3.80 7.20 6.44 9.07 11.8 11.7 10.3 9.96 7.26
10 6.93 4.83 4.30 7.13 6.21 9.68 12.9 12.5 11.0 8.87 7.3711 6.88 4.64 5.32 7.23 7.34 10.4 13.3 11.6 11.4 7.83 7.5012 6.77 4.60 4.66 7.40 8.59 11.3 13.2 12.6 11.9 7.54 7.9513 6.42 4.52 4.15 7.80 7.85 12.2 13.5 13.4 12.0 7.62 8.0314 6.15 4.64 4.60 6.51 7.93 11.6 12.7 13.5 12.2 7.88 7.7915 5.73 4.85 4.48 5.50 7.45 11.2 12.1 12.6 11.6 8.63 7.1616 5.19 4.96 3.60 5.36 7.90 10.4 12.5 12.4 11.5 9.48 7.1317 5.17 5.05 3.73 5.45 8.50 9.86 12.8 12.1 11.3 9.04 7.6718 5.40 5.28 3.55 5.65 8.38 9.69 12.7 11.9 10.5 8.88 7.1519 4.90 5.41 4.01 6.05 8.08 9.73 12.6 11.8 10.9 9.56 8.1820 4.91 5.31 4.83 6.25 8.05 10.3 12.5 12.0 10.9 9.98 8.2021 5.65 6.19 4.67 6.28 7.71 11.4 12.8 11.3 9.83 9.66 8.2422 5.17 6.50 4.90 6.48 8.07 11.5 13.5 11.3 10.3 9.41 8.2723 5.38 6.23 5.33 6.07 8.10 10.9 13.4 12.0 10.8 8.82 8.0924 5.13 5.16 5.59 6.44 8.70 11.3 13.4 12.1 11.2 7.46 7.4325 4.88 4.55 5.50 6.94 9.49 12.0 13.3 12.1 11.1 6.80 5.6626 4.45 4.58 5.41 6.43 9.73 12.7 13.4 12.1 10.5 6.68 5.1927 4.07 4.80 5.30 6.42 9.78 12.5 12.5 12.0 10.9 6.6828 4.37 4.88 5.75 6.99 9.61 11.4 12.6 12.9 10.4 7.6729 4.06 — 5.61 7.63 9.67 11.2 13.2 13.0 10.3 6.9430 4.49 — 5.97 7.63 9.73 10.8 13.1 11.8 9.72 4.9531 4.49 — 6.32 — 9.54 — 11.6 11.9 — 4.08 —
MEAN 5.63 4.95 4.80 6.64 7.97 10.6 12.3 11.9 10.9 8.42 6.88MAX 7.48 6.50 6.32 7.80 9.78 12.7 13.5 13.5 12.2 10.4 8.27MIN 4.06 3.88 3.50 5.36 5.96 8.47 10.3 10.5 9.72 4.08 3.93
1/1
/02
2/1
/02
3/1
/02
4/1
/02
5/1
/02
6/1
/02
7/1
/02
8/1
/02
9/1
/02
10/1
/02
11/1
/02
12/1
/02
1/1
/03
0
5
10
15
20
25
Mea
n D
aily
Tem
per
atu
re (
°C)
32
41
50
59
68
77
(°F
)
State of OregonTemperature Standard
14202480 – Tualatin River above Barney reservoir Outfall [RM 78.1]

APPENDIX F—Stream Temperature Records2002 Tualatin River Flow Management Report F-5
TRTR – 14202470 – BARNEY RESERVOIR OUTFALL TO TUALATIN RIVER [RM 78.0]Latitude: 45 27 47 Longitude: 123 23 73 Source Agency: District 18 Watermaster
Day2002 Mean Daily Water Temperature in Degrees Celsius
JAN FEB MAR APR MAY JUN JUL AUG SEP OCT NOV DEC 1 5.78 4.60 4.67 5.96 6.96 8.21 7.00 7.49 9.84 13.9 11.5 2 6.30 4.76 4.62 5.66 6.97 8.00 7.00 7.55 10.0 13.8 11.1 3 6.20 4.69 4.87 5.75 6.50 7.97 7.00 7.57 10.2 13.8 10.8 4 5.99 4.69 4.96 5.93 6.35 7.39 7.00 7.62 10.3 13.8 10.6 5 6.01 4.55 5.59 6.27 6.65 6.70 7.01 7.65 10.6 13.8 10.4 6 6.55 4.68 5.22 6.39 6.21 6.70 7.02 7.68 10.8 13.8 10.3 7 7.54 4.54 4.53 6.33 6.05 6.70 7.03 7.72 11.1 13.8 10.2 8 7.12 3.60 4.48 5.85 6.02 6.70 7.05 7.78 11.3 13.9 10.1 9 6.62 4.25 4.59 6.55 6.40 6.71 7.05 7.80 11.5 13.9 10.1
10 6.42 4.23 4.03 6.95 6.26 6.73 7.06 7.85 11.7 13.8 9.9011 6.50 4.23 5.03 6.71 6.63 6.73 7.08 7.90 12.0 13.7 9.8212 6.40 4.18 4.48 6.75 6.98 6.77 7.10 7.96 12.1 13.6 9.8013 5.94 3.95 3.98 7.37 7.17 6.78 7.11 8.02 12.3 13.5 9.5814 5.72 4.25 4.53 7.07 7.09 6.78 7.14 8.07 12.6 13.5 8.5515 5.30 4.62 4.53 6.19 6.69 6.80 7.15 8.12 12.7 13.5 7.5416 5.46 4.79 3.85 6.14 6.75 6.80 7.22 8.23 12.9 13.5 7.5117 5.66 4.92 3.92 6.18 7.13 6.80 7.23 8.28 13.2 13.5 8.1218 5.86 5.05 3.60 6.26 7.21 6.80 7.25 8.36 13.3 13.4 7.5019 5.18 5.03 3.61 6.53 7.30 6.80 7.27 8.40 13.3 13.5 8.5520 4.53 5.03 4.68 6.38 7.30 6.80 7.28 8.55 13.5 13.6 8.1421 4.39 5.60 4.40 6.49 6.88 6.82 7.30 8.61 13.7 13.7 7.9422 3.54 5.89 4.70 6.57 7.24 6.83 7.30 8.69 13.8 13.9 8.0823 4.50 6.05 5.10 6.05 7.18 6.83 7.33 8.81 13.8 14.1 7.8924 4.63 5.52 5.37 5.98 7.13 6.90 7.35 8.89 13.9 14.2 7.0625 4.66 4.94 5.22 6.35 7.66 6.91 7.35 9.00 13.9 14.2 4.6326 4.51 4.96 5.26 6.44 7.92 6.93 7.37 9.13 13.9 13.9 4.2027 4.39 4.88 5.43 6.42 8.06 6.96 7.40 9.23 14.0 13.728 4.46 5.03 5.65 6.29 8.27 6.96 7.42 9.35 14.0 13.429 4.11 — 5.62 6.43 8.19 7.00 7.44 9.47 14.0 13.230 4.57 — 5.67 6.82 8.21 6.99 7.46 9.61 13.9 12.631 4.52 — 5.83 — 7.91 — 7.47 9.78 — 12.1 —
MEAN 5.46 4.77 4.77 6.37 7.07 6.96 7.20 8.36 12.5 13.6 8.84MAX 7.54 6.05 5.83 7.37 8.27 8.21 7.47 9.78 14.0 14.2 11.5MIN 3.54 3.60 3.60 5.66 6.02 6.70 7.00 7.49 9.84 12.1 4.20
1/1
/02
2/1
/02
3/1
/02
4/1
/02
5/1
/02
6/1
/02
7/1
/02
8/1
/02
9/1
/02
10/1
/02
11/1
/02
12/1
/02
1/1
/03
0
5
10
15
20
25
Mea
n D
aily
Tem
per
atu
re (
°C)
32
41
50
59
68
77(°
F)
State of OregonTemperature Standard
TRTR – 14202470 – Barney Reservoir Outfall to Tualatin River [RM 78.0]

APPENDIX F—Stream Temperature RecordsF-6 2002 Tualatin River Flow Management Report
14202460 – TUALATIN RIVER BELOW BARNEY RESERVOIR OUTFALL [RM 77.8]Latitude: 45 27 46 Longitude: 123 23 63 Source Agency: District 18 Watermaster
Day2002 Mean Daily Water Temperature in Degrees Celsius
JAN FEB MAR APR MAY JUN JUL AUG SEP OCT NOV DEC 1 5.81 4.95 4.70 6.62 8.07 10.1 7.18 7.63 9.87 13.8 11.2 2 6.14 5.11 4.71 6.49 7.97 9.68 7.18 7.63 10.0 13.7 10.8 3 6.23 5.10 5.02 6.66 7.23 9.63 7.18 7.64 10.2 13.7 10.5 4 6.04 4.88 5.38 7.01 7.11 8.43 7.15 7.69 10.3 13.7 10.3 5 5.99 4.89 5.84 7.13 7.12 7.11 7.18 7.72 10.6 13.7 10.2 6 6.51 5.03 5.64 7.09 6.53 6.97 7.25 7.77 10.8 13.7 10.1 7 7.49 4.53 4.49 7.08 6.25 6.85 7.24 7.77 11.0 13.8 9.93 8 7.28 3.79 3.91 6.75 6.43 6.87 7.28 7.86 11.2 13.8 9.67 9 6.78 4.68 4.18 7.34 6.95 6.97 7.28 7.92 11.5 13.8 9.61
10 6.58 4.92 4.42 7.25 6.53 7.03 7.33 7.95 11.7 13.8 9.6811 6.70 4.88 5.25 7.25 7.24 7.13 7.32 8.00 12.0 13.6 9.5712 6.64 4.76 4.98 7.43 8.39 7.12 7.30 8.06 12.1 13.5 9.5213 6.01 4.68 4.40 7.65 8.55 7.13 7.33 8.13 12.3 13.4 9.0314 5.71 4.72 4.61 7.07 8.31 7.09 7.31 8.21 12.6 13.4 7.9115 5.15 4.91 4.79 5.86 7.75 7.07 7.32 8.23 12.8 13.4 7.4516 5.31 5.06 4.12 5.70 8.07 7.01 7.33 8.32 12.9 13.4 7.3317 5.47 5.13 4.03 5.75 8.66 7.01 7.37 8.36 13.1 13.4 7.6318 5.61 5.38 4.10 5.79 8.52 7.01 7.37 8.45 13.2 13.4 7.4119 5.37 5.53 3.99 6.23 8.22 7.03 7.35 8.52 13.3 13.5 7.8520 4.65 5.32 4.81 6.41 8.19 7.04 7.38 8.62 13.5 13.5 7.9021 4.76 6.02 4.89 6.55 7.79 7.13 7.40 8.65 13.6 13.6 7.8822 4.30 6.51 5.03 6.72 8.22 7.12 7.45 8.72 13.7 13.9 7.9323 4.73 6.42 5.45 6.38 8.28 7.06 7.44 8.88 13.8 14.0 7.8424 4.95 5.52 5.73 6.51 8.81 7.16 7.47 8.94 13.9 14.0 7.6225 5.11 4.85 5.65 7.05 9.63 7.19 7.50 9.02 13.9 13.9 6.7326 4.75 4.71 5.60 6.92 9.82 7.23 7.49 9.16 13.9 13.8 6.2927 4.35 4.87 5.58 6.70 9.88 7.20 7.50 9.28 14.0 13.528 4.65 5.13 5.84 6.90 9.65 7.23 7.53 9.40 14.0 13.329 4.38 — 5.88 7.57 9.70 7.38 7.59 9.52 13.9 13.030 4.75 — 6.02 7.90 9.89 7.20 7.60 9.63 13.9 12.331 4.77 — 6.37 — 9.67 — 7.56 9.75 — 11.7 —
MEAN 5.58 5.08 5.01 6.79 8.18 7.41 7.36 8.43 12.5 13.5 8.76MAX 7.49 6.51 6.37 7.90 9.89 10.1 7.60 9.75 14.0 14.0 11.2MIN 4.30 3.79 3.91 5.70 6.25 6.85 7.15 7.63 9.87 11.7 6.29
1/1
/02
2/1
/02
3/1
/02
4/1
/02
5/1
/02
6/1
/02
7/1
/02
8/1
/02
9/1
/02
10/1
/02
11/1
/02
12/1
/02
1/1
/03
0
5
10
15
20
25
Mea
n D
aily
Tem
per
atu
re (
°C)
32
41
50
59
68
77
(°F
)
State of OregonTemperature Standard
14202460 – Tualatin River below Barney reservoir Outfall [RM 77.8]

APPENDIX F—Stream Temperature Records2002 Tualatin River Flow Management Report F-7
TRLF – 14202450 – TUALATIN RIVER BELOW LEE FALLS [RM 70.5]
Latitude: 45 30 21 Longitude: 123 13 06 Source Agency: District 18 Watermaster
Day2002 Mean Daily Water Temperature in Degrees Celsius
JAN FEB MAR APR MAY JUN JUL AUG SEP OCT NOV DEC 1 5.67 5.15 4.11 7.13 9.40 11.9 11.2 11.3 12.2 11.5 5.58 2 6.49 5.38 4.10 7.02 9.12 11.7 11.4 10.8 12.2 11.7 5.41 3 6.21 5.44 4.39 7.28 8.15 11.6 11.3 10.7 12.0 12.5 5.89 4 5.92 4.82 5.14 7.85 7.68 12.1 10.6 10.6 11.2 13.2 6.64 5 6.08 4.99 6.20 7.74 7.89 12.4 11.0 10.2 11.2 13.2 8.02 6 7.13 5.50 5.94 8.10 7.43 10.4 12.0 10.1 11.1 13.5 8.58 7 8.13 5.01 3.94 8.07 6.61 9.54 12.1 10.4 11.2 12.9 8.85 8 7.76 4.80 3.38 7.37 7.09 9.03 11.8 10.8 11.3 12.8 8.66 9 7.18 5.32 3.93 8.33 7.49 10.1 12.3 11.4 12.0 13.0 8.53
10 6.99 5.45 4.94 8.30 7.21 10.8 13.4 11.8 12.6 11.9 8.6211 7.12 5.02 6.05 8.29 8.37 11.7 13.3 11.1 13.0 10.8 8.8112 7.00 4.87 5.63 8.50 9.86 12.5 12.7 11.8 13.3 10.5 9.1713 6.02 4.55 5.32 8.66 9.75 12.8 13.0 12.4 13.5 10.6 8.9914 5.59 4.73 5.43 7.61 9.21 12.7 12.0 12.5 13.7 10.8 8.2015 4.64 4.80 5.38 6.50 8.72 11.7 11.6 11.7 13.4 11.1 7.2416 5.10 5.48 4.32 6.26 9.14 11.0 12.1 11.5 13.5 11.6 6.8917 5.36 5.47 4.35 6.16 9.91 10.2 12.1 11.5 13.3 11.6 7.5318 5.56 6.10 4.20 6.23 10.0 10.4 11.8 11.2 12.8 11.6 7.1119 5.64 6.24 4.93 6.71 9.68 10.4 11.4 11.4 13.2 12.7 8.1520 4.89 5.75 5.90 6.88 9.70 11.2 11.8 11.3 13.0 13.2 8.4321 5.16 6.73 5.54 7.15 9.01 12.3 12.1 10.7 12.4 12.5 8.4022 4.66 7.25 5.60 7.59 9.82 12.2 12.7 11.1 12.8 12.0 8.3923 5.07 7.00 6.38 6.79 9.65 11.4 12.4 11.7 13.4 11.6 8.6524 5.57 5.73 6.69 6.95 10.3 12.0 12.7 11.9 13.7 10.4 7.9325 5.88 4.50 6.08 7.93 11.4 12.7 12.4 11.7 13.7 9.93 5.2626 5.08 4.34 6.10 7.48 12.0 13.6 12.6 11.7 13.3 9.48 3.9027 4.53 4.53 6.05 7.36 11.9 12.6 11.5 11.9 13.6 9.3028 4.80 4.72 6.69 7.64 11.5 11.3 12.0 12.6 13.4 10.129 4.18 — 6.26 8.64 11.5 11.7 12.3 12.6 13.3 9.3630 4.85 — 6.42 9.18 11.6 11.0 12.0 11.6 12.3 6.8331 4.93 — 6.87 — 11.4 — 10.9 12.0 — 5.56 —
MEAN 5.78 5.35 5.36 7.52 9.44 11.5 12.0 11.4 12.7 11.2 7.61MAX 8.13 7.25 6.87 9.18 12.0 13.6 13.4 12.6 13.7 13.5 9.17MIN 4.18 4.34 3.38 6.16 6.61 9.03 10.6 10.1 11.1 5.56 3.90
1/1
/02
2/1
/02
3/1
/02
4/1
/02
5/1
/02
6/1
/02
7/1
/02
8/1
/02
9/1
/02
10/1
/02
11/1
/02
12/1
/02
1/1
/03
0
5
10
15
20
25
Mea
n D
aily
Tem
per
atu
re (
°C)
32
41
50
59
68
77(°
F)
State of OregonTemperature Standard
TRLF – 14202450 – Tualatin River below Lee Falls [RM 70.5]

APPENDIX F—Stream Temperature RecordsF-8 2002 Tualatin River Flow Management Report
GASO – 14202510 – TUALATIN RIVER AT GASTON, OREGON [RM 62.3]Latitude: 45 26 21 Longitude: 123 07 85 Source Agency: District 18 Watermaster
Day2002 Mean Daily Water Temperature in Degrees Celsius
JAN FEB MAR APR MAY JUN JUL AUG SEP OCT NOV DEC 1 4.31 3.94 2.96 6.23 9.50 13.4 12.4 13.1 13.2 9.79 2.20 1.59 2 5.11 4.22 3.00 6.46 9.38 13.4 13.4 12.9 13.2 9.58 1.77 2.54 3 4.96 4.51 3.26 6.81 8.41 13.2 13.2 12.0 13.3 10.4 2.06 2.18 4 4.88 3.56 3.71 7.42 7.72 13.8 11.9 11.7 11.6 2.83 2.78 5 4.82 3.51 4.93 7.02 8.14 14.3 12.4 11.7 11.1 12.0 4.42 3.54 6 5.69 4.21 5.03 7.34 7.29 12.5 14.0 11.2 10.5 12.6 5.63 2.90 7 6.88 4.05 3.48 8.05 6.87 10.4 14.2 11.2 10.3 11.9 6.58 1.69 8 6.55 3.48 2.51 7.32 7.32 9.81 13.6 12.2 10.3 11.5 7.33 1.07 9 5.87 3.98 2.66 7.89 7.49 10.5 14.3 13.3 11.3 11.9 7.16 1.54
10 5.68 4.20 3.79 7.85 7.47 12.3 16.4 14.1 12.4 10.8 7.14 2.97 11 5.82 3.89 4.94 7.72 8.73 13.5 17.1 13.4 13.1 8.87 7.60 4.38 12 5.79 3.53 4.48 7.95 10.4 14.9 16.1 13.9 13.4 8.28 7.83 6.21 13 4.74 3.44 4.22 8.13 10.5 15.6 16.2 14.9 13.6 8.36 7.74 6.02 14 4.38 3.62 4.30 7.06 9.55 15.4 15.1 15.2 13.6 8.44 7.53 6.60 15 3.31 3.73 4.33 5.49 9.62 14.1 14.0 14.2 13.3 9.08 6.05 6.39 16 3.60 4.23 3.64 5.32 9.75 12.6 14.6 13.4 12.9 9.71 5.88 6.17 17 4.15 4.17 3.32 5.36 10.9 11.0 14.5 13.2 12.8 9.83 5.79 5.49 18 4.23 5.01 3.18 5.39 11.4 10.6 14.4 12.8 12.2 9.61 5.90 4.94 19 4.49 5.24 3.81 5.99 10.6 11.2 13.9 12.7 12.3 10.7 6.72 4.86 20 3.72 4.50 4.74 6.27 9.93 12.9 13.4 12.6 12.5 11.8 7.05 4.72 21 3.93 5.59 4.54 6.57 9.62 14.5 14.9 11.5 11.5 11.4 6.93 5.09 22 3.35 6.06 4.47 6.63 9.83 14.5 15.6 11.8 11.7 10.3 7.11 5.09 23 3.84 6.09 5.51 6.49 10.7 13.8 15.5 13.0 12.3 9.77 7.67 5.03 24 4.38 4.77 5.82 6.67 11.2 13.9 15.3 13.5 12.8 8.37 7.19 3.91 25 4.55 3.44 5.33 7.51 12.6 15.3 15.2 13.1 13.0 7.04 4.51 4.24 26 3.72 3.18 5.19 7.01 13.4 16.4 15.2 12.5 12.4 6.82 2.39 4.70 27 3.32 3.18 5.06 6.97 13.7 15.7 14.3 12.9 12.6 6.30 1.88 4.73 28 3.63 3.62 6.07 7.50 12.5 12.9 14.1 14.1 12.3 7.05 2.06 5.14 29 2.95 — 5.41 8.67 12.0 12.5 15.1 14.2 12.5 7.13 1.82 4.73 30 3.61 — 5.92 9.21 12.4 12.2 14.7 12.7 11.2 4.93 1.64 4.95 31 3.86 — 6.30 — 13.0 — 13.0 12.6 — 2.73 — 5.44
MEAN 4.52 4.18 4.38 7.01 10.1 13.2 14.5 13.0 12.3 9.31 5.28 4.25MAX 6.88 6.09 6.30 9.21 13.7 16.4 17.1 15.2 13.6 12.6 7.83 6.60MIN 2.95 3.18 2.51 5.32 6.87 9.81 12.4 11.2 10.3 2.73 1.64 1.07
1/1
/02
2/1
/02
3/1
/02
4/1
/02
5/1
/02
6/1
/02
7/1
/02
8/1
/02
9/1
/02
10/1
/02
11/1
/02
12/1
/02
1/1
/03
0
5
10
15
20
25
Mea
n D
aily
Tem
per
atu
re (
°C)
32
41
50
59
68
77
(°F
)
State of OregonTemperature Standard
GASO – 14202510 – Tualatin River at Gaston, Oregon [RM 62.3]

APPENDIX F—Stream Temperature Records2002 Tualatin River Flow Management Report F-9
SCLO – 14202850 — SCOGGINS CREEK ABOVE HENRY HAGG LAKE NEAR GASTON, OREGON [RM 8.0]Latitude: 45 30 06 Longitude: 123 15 06 Source Agency: District 18 Watermaster
Day2002 Mean Daily Water Temperature in Degrees Celsius
JAN FEB MAR APR MAY JUN JUL AUG SEP OCT NOV DEC 1 5.93 5.33 4.45 7.33 9.93 11.9 12.8 14.5 15.0 9.14 2.12 4.22 2 6.82 5.58 4.49 7.34 9.37 11.3 13.1 13.7 15.0 9.03 1.82 5.49 3 6.50 5.73 4.71 7.70 8.54 11.4 12.8 13.6 14.6 10.1 2.22 4.54 4 6.38 5.15 5.43 8.31 7.90 12.3 12.1 13.3 12.9 11.1 2.98 5.21 5 6.43 5.25 6.46 8.00 8.34 13.0 12.6 12.8 12.4 11.6 4.67 5.65 6 7.45 5.86 6.23 8.61 7.61 11.3 14.0 12.3 11.9 12.3 5.69 7 8.47 5.47 4.09 8.45 6.93 10.0 14.6 12.7 11.3 11.5 6.64 8 8.08 5.48 3.70 7.82 7.35 9.52 14.2 13.3 11.2 11.1 7.58 9 7.48 5.73 4.29 8.68 7.65 10.4 15.0 14.7 12.2 11.5 7.70
10 7.33 5.88 5.47 8.86 7.53 11.6 16.4 15.6 13.4 10.1 7.9011 7.42 5.36 6.54 8.85 8.58 12.6 16.9 14.4 14.3 8.20 8.2312 7.24 5.23 6.06 9.02 10.1 14.2 16.7 15.8 14.6 7.92 8.6013 6.28 4.95 5.79 9.16 9.97 15.1 17.8 17.5 14.9 7.65 8.5514 5.85 5.32 5.78 7.93 9.35 14.9 15.9 17.4 14.8 8.07 8.2815 5.03 5.28 5.67 6.92 8.80 14.0 14.8 15.9 14.5 8.49 7.3116 5.29 5.95 4.65 6.68 9.35 13.3 15.6 15.3 14.3 9.17 7.0617 5.63 5.84 4.90 6.68 10.1 12.1 15.8 15.2 13.7 9.15 7.5818 5.85 6.53 4.44 6.80 10.2 12.1 15.9 14.4 12.6 9.08 7.1519 5.98 6.72 5.41 7.25 10.2 11.6 15.8 14.4 12.8 10.3 8.3520 4.88 6.10 6.43 7.31 10.0 12.9 15.6 14.7 12.5 11.2 8.4321 5.34 7.20 5.87 7.51 9.22 14.4 16.5 13.5 12.1 11.0 8.5022 4.90 7.77 5.97 7.62 9.72 14.4 17.6 13.6 12.1 9.98 8.4823 5.34 7.55 6.82 7.06 9.46 13.9 17.4 14.9 12.8 9.45 8.8224 5.94 6.18 6.96 7.35 10.2 14.1 17.5 15.2 13.1 7.67 7.9025 6.26 4.80 6.52 8.33 11.6 15.1 17.2 15.2 13.6 6.47 5.2126 5.42 4.64 6.51 7.57 12.3 16.3 17.2 15.3 12.9 6.46 4.0327 4.70 4.92 6.21 7.55 12.2 15.6 15.3 15.1 13.0 6.36 4.2828 5.12 5.00 6.79 7.95 11.8 14.1 15.7 16.6 12.6 7.05 4.4329 4.54 — 6.46 9.04 11.7 13.6 16.4 16.4 12.3 6.64 4.2530 5.06 — 6.74 9.64 11.6 13.0 16.1 14.2 10.7 4.15 4.2531 5.22 — 7.23 — 11.2 — 14.1 14.6 — 2.42 —
MEAN 6.07 5.74 5.71 7.91 9.64 13.0 15.5 14.7 13.1 8.85 6.30 5.02MAX 8.47 7.77 7.23 9.64 12.3 16.3 17.8 17.5 15.0 12.3 8.82 5.65MIN 4.54 4.64 3.70 6.68 6.93 9.52 12.1 12.3 10.7 2.42 1.82 4.22
1/1
/02
2/1
/02
3/1
/02
4/1
/02
5/1
/02
6/1
/02
7/1
/02
8/1
/02
9/1
/02
10/1
/02
11/1
/02
12/1
/02
1/1
/03
0
5
10
15
20
25
Mea
n D
aily
Tem
per
atu
re (
°C)
32
41
50
59
68
77(°
F)
State of OregonTemperature Standard
SCLO – 14202850 – Scoggins Creek above Henry Hagg Lake near Gaston, Oregon [RM 8.0]

APPENDIX F—Stream Temperature RecordsF-10 2002 Tualatin River Flow Management Report
SCOO – 14202980 – SCOGGINS CREEK BELOW HENRY HAGG LAKE NEAR GASTON, OREGON [RM 4.80]Latitude: 45 28 10 Longitude: 123 11 56 Source Agency: District 18 Watermaster
Day2002 Mean Daily Water Temperature in Degrees Celsius
JAN FEB MAR APR MAY JUN JUL AUG SEP OCT NOV DEC 1 6.29 5.81 5.93 6.50 6.87 7.30 7.51 8.50 11.3 17.4 12.3 8.98 2 6.38 5.89 5.92 6.62 6.97 7.39 7.59 8.42 11.4 17.6 11.8 8.85 3 6.29 5.88 6.25 6.67 6.86 7.22 7.53 8.61 11.6 17.4 11.4 8.63 4 6.31 5.87 6.07 6.65 6.86 7.21 7.60 8.54 11.8 17.5 11.3 8.60 5 6.38 5.70 6.14 6.58 6.95 7.25 7.62 8.60 12.1 17.4 11.2 8.54 6 6.48 5.82 6.15 6.65 6.87 7.23 7.64 8.58 12.1 17.6 11.1 7 7.14 5.74 6.16 6.67 6.94 7.26 7.60 8.72 12.4 17.2 11.1 8 6.92 5.70 5.92 6.72 6.99 7.21 7.67 8.75 12.6 17.4 10.9 9 6.78 5.70 5.92 6.65 6.97 7.31 7.68 8.86 12.8 17.4 10.8
10 6.47 5.72 6.17 6.75 7.07 7.29 7.72 8.88 13.1 17.3 10.711 6.46 5.72 6.31 6.70 7.13 7.30 7.75 8.96 13.3 16.8 10.612 6.69 5.65 6.51 6.70 7.11 7.37 7.79 9.13 13.7 16.7 10.613 6.65 5.68 6.21 6.72 7.06 7.33 7.77 9.03 13.7 16.4 10.614 6.80 5.83 6.58 6.71 7.03 7.29 7.85 9.34 14.2 16.2 10.515 6.77 5.83 6.36 6.73 7.00 7.36 7.83 9.29 14.4 16.2 10.516 6.66 5.89 6.34 6.72 7.04 7.33 7.95 9.36 14.6 16.1 10.417 6.50 5.81 6.41 6.72 7.18 7.30 7.92 9.50 14.9 15.9 10.318 6.50 5.80 6.46 6.72 7.18 7.38 7.93 9.67 14.9 15.8 10.319 6.55 5.76 6.37 6.76 7.03 7.30 7.91 9.67 15.4 15.8 10.220 6.46 5.98 6.50 6.74 7.15 7.41 8.03 9.81 15.5 15.8 10.221 6.40 5.94 6.50 6.73 7.14 7.43 8.11 9.93 15.9 15.7 10.222 6.28 5.80 6.67 6.76 7.08 7.38 8.10 9.90 16.2 15.6 10.223 6.23 5.88 6.45 6.81 7.20 7.46 8.12 10.1 16.4 15.4 10.224 6.20 5.96 6.43 6.95 7.20 7.45 8.23 10.1 16.6 15.2 10.225 6.28 6.03 6.51 6.93 7.29 7.48 8.06 10.2 16.8 14.9 9.9226 5.91 6.12 6.51 6.83 7.38 7.48 8.27 10.4 16.8 14.7 9.8427 5.79 5.86 6.49 6.89 7.43 7.47 8.24 10.5 17.1 14.5 9.6728 5.91 6.02 6.55 6.82 7.20 7.45 8.28 10.6 17.2 14.3 9.5129 5.90 — 6.55 6.93 7.17 7.54 8.41 10.8 17.5 14.0 9.3030 5.89 — 6.60 6.88 7.25 7.49 8.30 10.8 17.6 13.5 9.1431 5.89 — 6.58 — 7.38 — 8.40 11.1 — 12.9 —
MEAN 6.39 5.84 6.34 6.74 7.10 7.36 7.92 9.50 14.5 16.0 10.5 8.72MAX 7.14 6.12 6.67 6.95 7.43 7.54 8.41 11.1 17.6 17.6 12.3 8.98MIN 5.79 5.65 5.92 6.50 6.86 7.21 7.51 8.42 11.3 12.9 9.14 8.54
1/1
/02
2/1
/02
3/1
/02
4/1
/02
5/1
/02
6/1
/02
7/1
/02
8/1
/02
9/1
/02
10/1
/02
11/1
/02
12/1
/02
1/1
/03
0
5
10
15
20
25
Mea
n D
aily
Tem
per
atu
re (
°C)
32
41
50
59
68
77
(°F
)
State of OregonTemperature Standard
SCOO – 14202980 – Scoggins Creek below Henry Hagg Lake near Gaston, Oregon [RM 4.80]

APPENDIX F—Stream Temperature Records2002 Tualatin River Flow Management Report F-11
DLLO – 14203500 – TUALATIN RIVER AT DILLEY, OREGON [RM 58.8]Latitude: 45 28 30 Longitude: 123 07 23 Source Agency: District 18 Watermaster
Day2002 Mean Daily Water Temperature in Degrees Celsius
JAN FEB MAR APR MAY JUN JUL AUG SEP OCT NOV DEC 1 6.00 5.73 5.29 8.13 10.5 13.9 10.3 10.8 12.4 13.7 9.40 2 6.59 5.95 5.18 8.20 10.6 13.5 10.7 10.8 12.6 13.6 8.68 3 6.69 6.30 5.41 8.75 9.78 13.3 10.7 10.7 12.7 14.6 8.51 4 6.67 5.95 5.77 9.29 9.14 10.9 10.1 10.6 12.4 15.4 8.64 5 6.51 5.58 6.88 9.05 9.40 12.0 10.2 10.6 12.3 15.8 9.33 6 7.04 5.93 7.03 8.06 8.86 11.4 10.6 10.4 12.2 16.1 9.72 7 9.24 6.13 5.83 8.55 8.41 10.7 10.4 10.4 12.2 15.9 10.0 8 9.30 5.39 4.89 8.52 8.75 10.2 10.4 10.8 12.4 15.5 9.95 9 8.43 5.78 4.86 9.64 9.33 10.6 10.8 11.0 12.9 15.7 9.32
10 7.81 6.13 5.61 9.73 9.04 11.7 11.0 11.3 13.6 15.2 9.1011 7.54 6.08 6.97 9.55 10.4 12.3 11.2 11.1 13.9 14.4 9.5812 7.47 5.47 6.80 9.00 11.7 11.1 11.4 11.3 14.2 14.2 9.9313 6.79 5.35 6.69 9.10 11.8 10.8 11.6 11.8 14.4 14.2 9.7014 6.60 5.70 6.57 8.87 10.0 10.8 11.4 11.5 14.5 14.1 9.6815 6.07 5.92 6.67 7.91 10.1 10.4 11.0 11.4 14.5 14.3 8.5816 6.04 6.26 6.23 7.62 10.4 9.87 11.2 11.3 14.7 14.5 8.3317 6.28 6.15 5.96 7.53 11.5 9.43 11.0 11.3 14.8 14.4 8.2718 6.32 6.75 5.78 7.64 12.1 9.83 10.8 11.2 14.7 14.3 8.2519 6.46 7.15 6.21 7.99 11.6 10.2 10.6 11.4 14.9 14.7 8.6920 5.98 6.51 6.88 8.15 10.7 10.8 10.7 11.5 15.1 15.1 8.9721 5.72 7.04 6.87 8.39 10.6 11.2 11.5 11.1 14.9 14.8 9.0522 5.25 7.84 6.90 8.16 10.6 11.1 11.5 11.4 15.1 14.4 9.1823 5.65 8.23 7.81 8.19 10.9 10.8 11.0 11.8 15.6 14.0 9.6924 6.20 7.27 8.06 8.76 11.5 10.9 10.9 12.0 15.8 13.4 9.3525 6.53 6.05 7.76 9.71 13.1 10.6 10.8 11.9 16.1 12.7 7.3926 5.60 5.57 7.66 9.30 13.4 10.7 11.1 11.9 16.0 12.7 6.3327 4.69 5.43 7.30 8.98 14.6 10.3 10.9 11.9 16.2 12.5 6.7528 5.15 5.76 8.03 9.34 12.9 9.64 10.9 12.4 16.1 12.8 6.9029 5.01 — 7.75 9.75 12.5 10.5 11.3 12.6 16.3 12.530 5.34 — 7.84 10.5 12.4 10.3 11.2 12.1 15.4 11.231 5.67 — 8.20 — 12.9 — 10.6 12.2 — 10.1 —
MEAN 6.47 6.19 6.64 8.75 11.0 11.0 10.9 11.4 14.3 14.1 8.83MAX 9.30 8.23 8.20 10.5 14.6 13.9 11.6 12.6 16.3 16.1 10.0MIN 4.69 5.35 4.86 7.53 8.41 9.43 10.1 10.4 12.2 10.1 6.33
1/1
/02
2/1
/02
3/1
/02
4/1
/02
5/1
/02
6/1
/02
7/1
/02
8/1
/02
9/1
/02
10/1
/02
11/1
/02
12/1
/02
1/1
/03
0
5
10
15
20
25
Mea
n D
aily
Tem
per
atu
re (
°C)
32
41
50
59
68
77(°
F)
State of OregonTemperature Standard
DLLO – 14203500 – Tualatin River at Dilley, Oregon [RM 58.8]

APPENDIX F—Stream Temperature RecordsF-12 2002 Tualatin River Flow Management Report
14204550 – GALES CREEK ABOVE GLENWOOD, OREGON [RM 19.9]Latitude: 45 31 12 Longitude: 123 00 38 Source Agency: District 18 Watermaster
Day2002 Mean Daily Water Temperature in Degrees Celsius
JAN FEB MAR APR MAY JUN JUL AUG SEP OCT NOV DEC 1 6.16 5.57 5.00 7.43 9.12 11.1 11.9 13.6 14.6 9.24 3.25 2 6.78 5.72 5.00 7.14 8.90 10.7 12.0 13.2 14.3 9.16 3.09 3 6.57 5.70 5.20 7.40 8.20 10.7 11.8 12.8 13.8 10.5 3.46 4 6.40 5.47 5.76 7.93 7.59 11.5 11.5 12.8 12.5 11.2 4.16 5 6.44 5.54 6.43 7.69 7.87 12.0 11.8 12.3 11.9 11.5 5.59 6 7.21 5.79 6.11 8.16 7.23 10.5 12.9 12.1 11.5 11.8 6.30 7 8.06 5.49 4.49 7.97 7.00 9.55 13.1 12.3 11.1 11.6 7.08 8 7.77 5.63 4.38 7.57 7.33 9.28 13.0 12.8 11.0 11.0 7.68 9 7.36 5.87 4.72 8.21 7.38 10.3 13.6 14.0 12.1 10.9 7.83
10 7.24 6.03 5.54 8.37 7.61 10.8 14.7 14.6 12.9 9.98 8.0011 7.32 5.69 6.33 8.40 8.37 11.5 15.2 13.7 13.4 8.50 8.3312 7.23 5.46 5.89 8.52 9.50 12.6 14.9 15.0 13.8 7.86 8.7213 6.49 5.50 5.57 8.85 8.97 13.3 15.6 15.8 13.9 7.80 8.6914 6.13 5.72 5.89 7.58 8.63 13.2 14.3 16.2 14.2 7.98 8.1815 5.53 5.58 5.78 6.75 8.46 12.4 13.7 15.2 13.8 8.11 7.6516 5.78 6.09 4.95 6.69 8.77 11.8 14.3 14.8 13.7 8.70 7.4517 5.93 6.11 5.20 6.63 9.40 11.1 14.7 14.4 13.0 8.81 7.8018 6.17 6.55 4.95 6.77 9.45 11.1 14.6 14.0 12.2 8.94 7.4519 6.18 6.66 5.65 7.17 9.18 10.9 14.3 14.0 12.2 10.0 8.5020 5.83 6.15 6.32 7.20 9.04 12.0 14.3 14.1 12.1 10.7 8.5721 5.43 7.06 5.93 7.29 8.84 13.2 15.2 13.3 11.4 10.7 8.6022 5.12 7.51 6.11 7.52 8.98 13.3 15.9 13.3 11.3 10.2 8.5023 5.50 7.27 6.66 7.20 8.95 12.4 15.9 14.3 11.9 9.23 8.6724 5.87 6.17 6.90 7.28 9.58 12.7 15.8 14.6 12.5 7.78 7.8025 6.19 5.21 6.50 7.86 10.5 13.6 15.6 14.4 12.8 6.92 5.4826 5.76 5.15 6.45 7.38 10.7 14.5 15.8 14.4 12.1 7.04 4.8327 5.14 5.32 6.28 7.47 10.6 13.8 14.5 14.4 12.2 6.85 5.1828 5.48 5.50 6.77 7.87 10.4 12.5 14.7 15.5 11.9 7.75 5.3229 5.08 — 6.59 8.57 10.6 12.5 15.2 15.5 11.9 7.4730 5.46 — 6.88 8.88 10.7 12.0 14.9 14.2 10.5 5.4131 5.49 — 7.18 — 10.4 — 13.4 14.4 — 3.60 —
MEAN 6.23 5.91 5.85 7.66 8.98 11.9 14.2 14.1 12.6 8.94 6.86MAX 8.06 7.51 7.18 8.88 10.7 14.5 15.9 16.2 14.6 11.8 8.72MIN 5.08 5.15 4.38 6.63 7.00 9.28 11.5 12.1 10.5 3.60 3.09
1/1
/02
2/1
/02
3/1
/02
4/1
/02
5/1
/02
6/1
/02
7/1
/02
8/1
/02
9/1
/02
10/1
/02
11/1
/02
12/1
/02
1/1
/03
0
5
10
15
20
25
Mea
n D
aily
Tem
per
atu
re (
°C)
32
41
50
59
68
77
(°F
)
State of OregonTemperature Standard
14204550 – Gales Creek above Glenwood, Oregon [RM 19.9]

APPENDIX F—Stream Temperature Records2002 Tualatin River Flow Management Report F-13
GCCH – 14204540 – GALES CREEK AT CLAPSHAW HILL ROAD NEAR GALES CREEK, OREGON [RM 12.36]Latitude: 45 35 39 Longitude: 123 12 38 Source Agency: District 18 Watermaster
Day2002 Mean Daily Water Temperature in Degrees Celsius
JAN FEB MAR APR MAY JUN JUL AUG SEP OCT NOV DEC 1 10.5 13.9 14.9 17.8 18.4 10.8 3.15 2 10.7 13.4 15.4 17.1 18.2 10.6 2.88 3 9.72 13.1 14.7 17.0 17.5 11.9 3.19 4 8.98 13.7 13.8 16.4 15.7 12.7 3.63 5 9.31 15.0 14.7 16.1 15.1 13.2 5.33 6 8.69 13.1 16.6 15.5 14.2 14.0 6.02 7 7.90 11.7 16.5 15.8 13.3 13.5 6.96 8 8.52 11.2 16.0 17.0 13.0 13.0 7.97 9 8.36 12.3 17.4 18.2 14.3 13.4 8.07
10 8.66 13.7 19.3 19.3 16.0 11.9 8.2411 9.93 14.9 20.1 18.2 17.0 9.80 8.7412 11.6 16.4 19.9 19.4 17.2 9.45 9.2213 10.8 17.2 20.5 20.8 17.5 9.07 9.0414 10.2 17.3 18.8 20.9 17.6 9.65 8.8515 10.2 16.0 17.9 19.6 17.0 9.75 7.5916 10.5 14.7 18.6 19.0 16.4 10.2 7.5817 11.6 13.2 18.6 18.7 15.7 10.3 8.0018 11.8 13.2 18.6 17.9 14.8 10.2 7.6919 10.8 13.3 17.9 17.8 15.0 11.6 8.6720 10.8 15.2 17.9 17.7 14.8 12.4 9.0621 8.05 10.4 17.1 19.3 16.2 14.2 12.0 8.7322 8.27 10.9 16.8 20.6 16.5 14.1 11.0 9.1023 8.16 10.8 16.2 20.5 17.9 15.3 10.5 9.4424 8.35 11.6 16.5 20.4 18.6 15.5 8.82 8.3825 9.09 12.8 17.7 19.7 18.4 16.1 7.63 5.8626 8.13 13.5 19.2 20.0 17.9 15.2 7.54 4.5927 8.45 13.0 17.8 18.5 17.9 14.9 7.06 4.6028 8.87 12.4 15.2 18.9 19.8 14.6 7.92 4.7029 — 9.98 12.4 14.7 19.5 19.7 14.4 7.9430 — 10.5 13.0 14.4 19.4 17.6 12.5 5.8331 — — 12.9 — 17.5 17.7 — 3.71 —
MEAN 8.79 10.8 14.9 18.1 18.0 15.5 10.2 6.97MAX 10.5 13.5 19.2 20.6 20.9 18.4 14.0 9.44MIN 8.05 7.90 11.2 13.8 15.5 12.5 3.71 2.88
1/1
/02
2/1
/02
3/1
/02
4/1
/02
5/1
/02
6/1
/02
7/1
/02
8/1
/02
9/1
/02
10/1
/02
11/1
/02
12/1
/02
1/1
/03
0
5
10
15
20
25
Mea
n D
aily
Tem
per
atu
re (
°C)
32
41
50
59
68
77(°
F)
State of OregonTemperature Standard
GCCH – 14204540 – Gales Creek at Clapshaw Hill Road near Gales Creek, Oregon [RM 12.36]

APPENDIX F—Stream Temperature RecordsF-14 2002 Tualatin River Flow Management Report
GALES – 14204530 – GALES CREEK AT OLD HWY 47 NEAR FOREST GROVE, OREGON [RM 2.36]Latitude: 45 30 39 Longitude: 123 06 56 Source Agency: District 18 Watermaster
Day2002 Mean Daily Water Temperature in Degrees Celsius
JAN FEB MAR APR MAY JUN JUL AUG SEP OCT NOV DEC 1 6.50 6.50 6.24 8.70 11.5 15.7 16.6 19.8 19.3 12.4 3.53 2 6.93 6.70 6.07 8.66 11.4 15.9 17.7 19.2 19.3 11.7 2.61 3 7.19 6.82 6.08 8.78 11.2 15.8 17.8 18.8 19.0 12.1 2.45 4 7.26 6.77 6.29 9.24 10.7 15.9 16.5 18.5 17.3 12.8 2.86 5 7.08 6.54 6.84 9.72 10.6 17.0 16.5 18.1 16.4 13.7 4.04 6 7.36 6.63 7.09 9.18 10.2 16.2 18.4 17.5 15.8 14.4 5.11 7 8.20 6.80 6.80 9.72 9.79 13.8 19.5 17.6 14.8 14.5 6.15 8 8.58 6.61 5.99 9.80 9.47 13.2 18.4 18.3 14.3 14.1 7.64 9 8.60 6.70 5.60 10.1 10.1 13.6 19.1 19.5 15.0 14.4 8.24
10 8.53 6.77 5.98 10.0 9.46 15.6 21.5 20.8 16.3 13.3 8.4311 8.40 6.80 6.98 10.2 10.2 17.0 22.6 20.3 17.6 11.5 8.9012 8.35 6.56 7.11 10.3 11.3 18.9 22.6 20.9 18.3 10.5 9.3813 8.08 6.36 6.95 10.5 12.3 20.2 23.3 22.3 18.6 9.93 9.2514 7.63 6.46 6.93 10.5 11.7 20.4 21.9 22.7 18.7 9.73 9.2015 7.15 6.47 7.00 9.40 11.4 19.2 20.6 21.6 18.2 10.1 8.2316 6.88 6.58 6.92 8.85 12.0 17.6 21.1 21.0 17.7 10.7 7.6617 6.83 6.71 6.65 8.56 13.1 15.5 21.5 20.8 16.9 10.8 7.8318 7.00 7.02 6.63 8.41 14.0 14.6 21.5 19.7 16.1 10.8 8.0019 7.05 7.42 6.48 8.52 13.3 14.9 20.8 19.3 16.1 11.5 8.6420 6.90 7.33 6.80 8.77 12.0 16.9 20.2 19.0 16.0 12.4 9.0321 6.76 7.47 7.18 9.20 12.0 19.2 21.1 17.5 15.6 12.6 9.1022 6.37 7.93 7.13 8.94 12.1 19.7 22.8 17.5 15.2 12.1 8.9723 6.26 8.28 7.29 8.86 12.2 18.8 23.1 18.6 15.9 11.4 9.4824 6.68 8.09 7.70 9.20 13.1 18.9 23.1 19.6 16.3 10.1 9.1325 7.00 7.38 7.74 9.73 14.8 20.2 22.7 19.6 16.7 8.51 6.7126 6.96 6.69 7.75 9.74 15.6 21.7 22.4 19.6 16.3 7.81 4.6527 6.55 6.37 7.45 9.24 15.8 21.3 21.0 19.1 16.2 7.32 3.9828 6.42 6.44 7.69 9.56 14.7 18.5 21.0 20.8 15.7 7.65 4.0329 6.38 — 7.85 10.3 14.1 16.5 21.5 21.0 15.6 7.7930 6.41 — 7.79 11.1 14.4 17.0 21.6 19.0 14.0 6.3331 6.50 — 8.45 — 15.3 — 19.7 18.7 — 4.27 —
MEAN 7.19 6.90 6.95 9.46 12.3 17.3 20.6 19.6 16.6 10.9 6.90MAX 8.60 8.28 8.45 11.1 15.8 21.7 23.3 22.7 19.3 14.5 9.48MIN 6.26 6.36 5.60 8.41 9.46 13.2 16.5 17.5 14.0 4.27 2.45
1/1
/02
2/1
/02
3/1
/02
4/1
/02
5/1
/02
6/1
/02
7/1
/02
8/1
/02
9/1
/02
10/1
/02
11/1
/02
12/1
/02
1/1
/03
0
5
10
15
20
25
Mea
n D
aily
Tem
per
atu
re (
°C)
32
41
50
59
68
77
(°F
)
State of OregonTemperature Standard
GALES – 14204530 – Gales Creek at Old Hwy 47 near Forest Grove, Oregon [RM 2.36]

APPENDIX F—Stream Temperature Records2002 Tualatin River Flow Management Report F-15
TRGC – 14204800 — TUALATIN RIVER AT GOLF COURSE ROAD NEAR CORNELIUS, OREGON [RM 51.5]Latitude: 45 30 08 Longitude: 123 03 22 Source Agency: District 18 Watermaster
Day2002 Mean Daily Water Temperature in Degrees Celsius
JAN FEB MAR APR MAY JUN JUL AUG SEP OCT NOV DEC 1 6.25 5.78 6.03 8.90 11.5 2 6.67 6.10 5.70 8.86 11.5 3 6.98 6.57 5.89 9.23 11.2 4 7.05 6.25 6.25 9.69 10.4 5 6.80 5.99 7.05 9.99 10.3 6 7.21 6.13 7.33 9.03 9.99 7 8.93 6.53 6.55 9.30 9.47 8 9.56 5.77 5.40 9.35 9.38 9 8.82 6.08 5.27 10.2 10.1
10 8.13 6.26 5.84 10.3 9.6211 7.75 6.33 7.16 10.4 10.912 7.65 5.78 7.20 10.1 12.513 7.14 5.65 7.03 10.2 13.014 6.62 6.03 6.82 10.0 11.915 5.87 6.17 6.93 8.53 11.516 5.82 6.50 6.51 8.3217 6.02 6.54 6.22 8.0618 6.33 7.03 6.00 8.1319 6.50 7.53 6.25 8.4920 6.27 7.10 7.18 8.8021 6.01 7.42 7.25 9.2622 5.34 8.15 7.04 8.8323 5.50 8.76 7.99 8.7924 6.24 8.00 8.70 9.3325 6.73 6.64 8.32 9.9526 6.16 6.03 8.27 10.027 5.08 5.98 7.65 9.5428 5.08 6.18 8.08 9.8629 4.99 — 8.48 10.330 5.11 — 8.18 11.031 5.61 — 8.76 — — — —
MEAN 6.59 6.55 7.01 9.42 10.9MAX 9.56 8.76 8.76 11.0 13.0MIN 4.99 5.65 5.27 8.06 9.38
1/1
/02
2/1
/02
3/1
/02
4/1
/02
5/1
/02
6/1
/02
7/1
/02
8/1
/02
9/1
/02
10/1
/02
11/1
/02
12/1
/02
1/1
/03
0
5
10
15
20
25
Mea
n D
aily
Tem
per
atu
re (
°C)
32
41
50
59
68
77(°
F)
State of OregonTemperature Standard
TRGC – 14204800 – Tualatin River at Golf Course Road near Cornelius, Oregon [RM 51.5]

APPENDIX F—Stream Temperature RecordsF-16 2002 Tualatin River Flow Management Report
WFDM – WEST FORK DAIRY CREEK AT MANNING, OREGON [RM 12.9]Latitude: 45 39 36 Longitude 123 09 18 Source Agency: District 18 Watermaster
Day2002 Mean Daily Water Temperature in Degrees Celsius
JAN FEB MAR APR MAY JUN JUL AUG SEP OCT NOV DEC 1 6.73 6.63 6.72 8.13 10.3 14.0 15.4 16.8 16.8 10.3 2 6.89 6.70 6.28 8.37 10.5 13.8 15.7 15.8 16.5 8.80 3 7.28 6.80 6.10 8.40 10.4 13.6 15.5 16.0 13.8 11.1 4 7.38 6.89 6.18 8.65 10.1 14.0 14.8 15.8 12.4 12.3 5 7.33 6.80 6.70 9.05 9.74 15.0 14.7 15.3 12.1 12.6 2.58 6 7.43 6.80 7.00 9.00 9.63 14.3 16.0 15.4 12.1 13.2 4.68 7 8.25 6.98 6.40 9.21 9.19 12.7 16.8 15.4 11.0 12.2 5.23 8 8.63 7.00 5.65 9.27 8.75 11.6 16.5 16.2 11.4 12.2 6.43 9 8.45 7.00 5.56 9.28 8.98 11.9 17.1 16.9 13.1 11.9 7.48
10 8.30 7.00 5.97 9.50 8.90 13.2 18.8 17.0 16.4 8.96 8.0111 8.26 7.03 6.77 9.57 9.23 14.5 19.6 16.3 16.9 6.13 8.5012 8.14 6.93 7.09 9.77 9.94 16.1 19.6 18.9 17.4 7.15 8.9113 7.99 6.77 7.10 9.92 11.0 17.3 20.1 21.3 16.7 6.61 9.1314 7.63 6.70 7.10 10.2 10.8 17.5 18.9 19.5 15.4 8.39 9.2015 7.22 6.77 7.10 9.89 10.7 16.6 18.1 16.9 15.1 8.24 8.3016 6.85 6.76 7.08 9.30 10.9 15.5 18.5 16.1 15.1 9.15 7.7017 6.80 6.80 6.88 8.85 11.6 14.1 18.8 16.6 13.7 8.08 7.7118 6.82 6.99 6.80 8.56 12.2 13.6 18.7 15.2 12.8 9.13 7.7719 7.00 7.29 6.80 8.48 11.8 13.6 18.6 15.1 13.6 11.4 8.3220 6.94 7.42 6.95 8.68 11.5 14.9 18.1 15.4 12.6 12.6 8.5521 7.00 7.38 7.26 8.94 11.5 16.7 19.1 13.8 12.3 11.6 8.5722 7.00 7.69 7.30 8.98 11.7 17.1 20.3 15.6 13.0 8.61 8.8523 6.89 8.00 7.33 8.95 11.4 16.8 20.0 17.4 15.8 8.31 9.3124 6.80 8.07 7.57 8.97 11.8 16.9 19.9 17.4 15.7 5.48 8.7425 7.07 7.74 7.74 9.28 13.0 17.7 19.5 16.0 15.2 4.52 6.2526 7.00 7.25 7.78 9.47 13.8 18.9 19.2 16.5 13.8 5.27 4.7927 6.58 6.90 7.67 9.10 14.1 18.6 18.1 17.6 13.4 5.23 4.1628 6.44 6.80 7.50 9.02 13.6 16.9 18.3 20.7 12.7 6.89 3.7229 6.47 — 7.68 9.48 13.4 15.7 18.7 17.3 11.8 5.9630 6.40 — 7.74 10.0 13.5 15.4 18.3 14.8 10.031 6.46 — 7.99 — 13.6 — 16.4 16.5 — —
MEAN 7.24 7.07 6.96 9.14 11.2 15.3 18.0 16.6 14.0 9.05 7.20MAX 8.63 8.07 7.99 10.2 14.1 18.9 20.3 21.3 17.4 13.2 9.31MIN 6.40 6.63 5.56 8.13 8.75 11.6 14.7 13.8 10.0 4.52 2.58
1/1
/02
2/1
/02
3/1
/02
4/1
/02
5/1
/02
6/1
/02
7/1
/02
8/1
/02
9/1
/02
10/1
/02
11/1
/02
12/1
/02
1/1
/03
0
5
10
15
20
25
Mea
n D
aily
Tem
per
atu
re (
°C)
32
41
50
59
68
77
(°F
)
State of OregonTemperature Standard
WFDM – West Fork Dairy Creek at Manning, Oregon [RM 12.9]

APPENDIX F—Stream Temperature Records2002 Tualatin River Flow Management Report F-17
WFDE – 14205160 – WEST FORK DAIRY CREEK AT EVERS ROAD BRIDGE [RM 1.96]Latitude: 45 34 34 Longitude: 123 05 34 Source Agency: District 18 Watermaster
Day2002 Mean Daily Water Temperature in Degrees Celsius
JAN FEB MAR APR MAY JUN JUL AUG SEP OCT NOV DEC 1 6.13 5.74 6.57 9.90 13.1 15.7 18.3 18.0 12.3 4.67 4.35 2 6.57 6.08 6.17 10.1 12.8 15.5 17.3 18.0 11.6 3.83 4.45 3 6.92 6.69 6.26 10.4 12.2 15.4 17.3 16.7 12.0 3.37 4.32 4 7.19 6.43 6.56 11.1 11.5 15.9 17.0 15.6 12.3 3.43 4.42 5 7.14 6.14 7.21 11.3 11.3 16.7 16.7 15.0 13.0 3.80 6 7.49 6.45 7.41 10.6 10.7 15.6 16.3 14.2 13.6 4.56 7 9.13 6.83 6.45 11.4 9.83 14.4 16.6 13.6 13.9 6.22 8 9.49 6.26 5.49 11.3 9.94 13.5 17.0 13.3 13.7 6.68 9 8.79 6.51 5.46 11.6 10.3 13.6 18.0 13.7 14.1 7.20
10 8.22 6.56 6.22 11.5 10.2 14.7 19.0 15.3 13.2 7.7311 8.09 6.48 7.68 11.9 11.1 15.9 19.0 16.2 11.9 8.6112 7.98 5.99 7.72 12.0 12.8 19.7 16.9 10.7 9.2013 7.49 5.90 7.52 12.5 13.5 20.5 17.1 10.2 9.1714 6.98 6.27 7.27 12.3 12.6 20.6 17.2 10.3 9.3415 6.20 6.48 7.41 10.4 12.5 19.7 16.8 10.3 8.7816 5.81 6.75 6.98 9.50 12.8 18.6 16.8 10.4 8.3217 5.90 6.78 6.83 9.32 13.3 18.0 16.1 11.2 8.3718 6.16 7.20 6.55 9.27 14.1 17.2 15.5 10.7 8.3319 6.45 7.88 6.66 9.52 14.0 17.1 15.6 11.0 8.6220 6.40 7.72 7.66 9.89 13.3 17.0 15.6 11.7 8.8321 6.38 8.13 7.94 10.5 13.1 16.4 15.4 12.1 8.9122 5.71 9.08 7.70 10.1 13.3 16.2 15.3 11.7 9.0223 5.72 9.44 8.51 10.1 13.2 16.9 16.1 11.5 9.3224 6.35 8.67 9.44 10.6 13.5 17.3 16.2 10.4 9.2525 6.97 7.20 9.39 11.3 14.7 17.4 16.0 9.29 8.2826 6.37 6.45 9.28 10.9 15.6 20.5 18.0 14.9 8.65 6.9827 5.25 6.35 8.57 10.4 16.3 19.2 18.7 15.2 7.96 6.1228 5.25 6.68 8.71 10.8 15.7 19.1 19.9 14.8 7.87 5.6529 4.98 — 9.06 11.9 15.3 19.6 19.3 14.5 7.75 5.2530 5.08 — 9.08 12.8 15.2 19.8 17.0 13.1 7.00 4.6531 5.50 — 9.80 — 15.3 — 18.2 17.4 — 5.76 —
MEAN 6.71 6.90 7.53 10.8 13.0 15.2 19.4 17.9 15.6 10.9 7.08 4.39MAX 9.49 9.44 9.80 12.8 16.3 16.7 20.5 20.6 18.0 14.1 9.34 4.45MIN 4.98 5.74 5.46 9.27 9.83 13.5 18.2 16.2 13.1 5.76 3.37 4.32
1/1
/02
2/1
/02
3/1
/02
4/1
/02
5/1
/02
6/1
/02
7/1
/02
8/1
/02
9/1
/02
10/1
/02
11/1
/02
12/1
/02
1/1
/03
0
5
10
15
20
25
Mea
n D
aily
Tem
per
atu
re (
°C)
32
41
50
59
68
77(°
F)
State of OregonTemperature Standard
WFDE – 14205160 – West Fork Dairy Creek at Evers Road Bridge [RM 1.96]

APPENDIX F—Stream Temperature RecordsF-18 2002 Tualatin River Flow Management Report
EFDD – 14205480 – EAST FORK DAIRY CREEK AT DAIRY CREEK RD NEAR MOUNTAINDALE, OR [RM 12.33]Latitude: 45 40 32 Longitude: 123 03 54 Source Agency: District 18 Watermaster
Day2002 Mean Daily Water Temperature in Degrees Celsius
JAN FEB MAR APR MAY JUN JUL AUG SEP OCT NOV DEC 1 6.43 6.02 15.8 16.5 9.94 2.92 4.22 2 7.27 6.24 15.0 16.3 9.76 2.98 5.14 3 6.99 6.52 15.1 15.8 10.6 3.14 4.73 4 7.23 5.90 14.7 14.4 11.4 3.90 5.11 5 7.04 5.99 14.1 13.7 11.8 5.26 5.74 6 8.00 6.70 13.7 13.2 12.6 6.12 7 9.09 6.51 14.3 12.5 12.4 6.75 8 8.65 6.21 15.2 12.3 12.4 7.69 9 8.01 6.50 16.1 13.3 12.9 7.95
10 7.82 6.70 17.1 14.6 11.2 8.0511 7.86 6.24 16.4 15.5 9.36 8.5712 7.71 6.04 17.2 15.9 8.75 8.9013 6.79 5.88 18.7 16.1 8.73 9.1014 6.48 6.40 18.9 15.9 8.98 9.1015 5.69 6.39 17.5 15.3 9.47 7.7816 5.82 6.72 16.9 14.8 10.1 6.8517 5.98 6.72 16.8 14.2 10.3 7.3118 6.34 7.49 16.0 13.5 9.98 7.4019 6.62 7.67 16.0 13.7 10.7 8.2820 6.24 6.84 15.8 13.6 11.7 8.5821 5.80 8.25 14.9 13.0 11.3 8.6522 5.21 8.75 15.0 13.1 10.5 8.6123 5.71 8.48 16.1 14.1 10.1 9.1724 6.53 7.07 16.6 14.5 8.81 8.6125 6.95 5.79 17.7 16.1 14.7 7.65 6.3026 6.19 17.9 16.2 14.0 7.41 4.7927 5.27 16.6 16.1 14.1 7.11 4.6428 5.85 16.3 17.7 13.7 7.58 4.7929 5.16 — 17.0 17.9 13.4 7.76 4.5330 5.67 — 17.2 15.9 11.4 5.70 4.4031 5.87 — — — 15.4 15.8 — 3.46 —
MEAN 6.65 6.72 16.9 16.1 14.2 9.69 6.70 4.99MAX 9.09 8.75 17.9 18.9 16.5 12.9 9.17 5.74MIN 5.16 5.79 15.4 13.7 11.4 3.46 2.92 4.22
1/1
/02
2/1
/02
3/1
/02
4/1
/02
5/1
/02
6/1
/02
7/1
/02
8/1
/02
9/1
/02
10/1
/02
11/1
/02
12/1
/02
1/1
/03
0
5
10
15
20
25
Mea
n D
aily
Tem
per
atu
re (
°C)
32
41
50
59
68
77
(°F
)
State of OregonTemperature Standard
EFDD – 14205480 – East Fork Dairy Creek at Dairy Creek Road near Mountaindale, Oregon [RM 12.33]

APPENDIX F—Stream Temperature Records2002 Tualatin River Flow Management Report F-19
EFDR – EAST FORK DAIRY CREEK AT ROY ROAD [RM 1.24]Latitude: 45 34 43 Longitude: 123 04 14 Source Agency: District 18 Watermaster
Day2002 Mean Daily Water Temperature in Degrees Celsius
JAN FEB MAR APR MAY JUN JUL AUG SEP OCT NOV DEC 1 6.46 5.96 6.32 9.10 11.5 14.2 17.0 17.5 11.4 3.29 3.16 2 6.91 6.17 6.03 9.31 11.3 14.0 16.3 17.5 10.7 2.64 3.91 3 7.08 6.85 6.21 9.57 10.5 13.9 16.2 16.9 11.0 2.25 3.50 4 7.28 6.37 6.60 10.1 9.91 14.2 15.9 15.4 11.6 2.52 4.04 5 7.30 6.10 7.23 10.4 9.94 14.9 15.6 14.6 12.3 3.57 6 7.50 6.38 7.36 9.74 9.64 14.2 15.3 14.1 12.8 4.52 7 8.95 6.86 6.30 10.4 8.69 12.9 15.5 13.3 13.2 5.64 8 9.56 6.24 5.42 10.0 8.78 11.9 15.9 13.0 13.0 6.99 9 8.78 6.41 5.56 10.5 9.54 12.0 16.9 13.6 13.2 7.72
10 8.09 6.64 6.31 10.4 9.20 18.0 14.9 12.1 8.1911 7.92 6.60 7.44 10.8 9.84 17.7 15.9 10.4 8.5512 7.88 6.09 7.55 10.8 11.2 18.7 16.5 9.78 9.0313 7.24 5.95 7.40 11.3 12.3 20.0 16.8 9.10 9.2214 6.75 6.33 7.20 11.1 11.2 20.5 16.8 9.18 9.4115 5.88 6.59 7.27 9.47 11.0 19.2 16.5 9.73 8.6316 5.78 6.89 6.64 8.65 11.3 18.4 16.3 10.4 7.9017 5.96 6.86 6.45 8.21 12.0 18.2 15.6 10.3 7.8418 6.26 7.34 6.25 8.39 12.7 17.2 14.8 10.2 7.5819 6.60 7.78 6.42 8.67 12.6 17.1 14.6 10.9 8.0820 6.59 7.65 7.48 8.93 12.0 17.0 14.6 11.9 8.3221 6.51 7.82 7.75 9.49 12.0 15.9 14.1 12.1 8.4422 5.62 8.70 7.34 9.10 12.0 15.9 14.0 11.1 8.7423 5.70 9.17 8.23 9.08 11.7 16.9 14.5 10.6 9.3224 6.44 8.45 9.09 9.44 11.9 17.4 15.0 9.58 8.9425 6.95 7.02 8.68 10.2 13.2 17.5 15.3 8.32 6.9726 6.50 6.36 8.61 9.86 14.1 19.8 17.5 14.9 7.66 5.1927 5.28 6.30 7.99 9.22 14.8 18.4 17.6 14.7 6.97 4.3828 5.11 6.68 8.15 9.65 14.4 18.1 18.8 14.4 7.10 4.0029 4.94 — 8.58 10.7 13.9 18.3 19.0 14.2 7.37 3.5930 5.04 — 8.47 11.5 13.7 18.5 17.1 12.6 6.06 3.3931 5.63 — 9.10 — 13.9 — 16.9 17.0 — 4.22 —
MEAN 6.73 6.88 7.27 9.80 11.6 13.6 18.3 17.3 15.1 10.1 6.50 3.65MAX 9.56 9.17 9.10 11.5 14.8 14.9 19.8 20.5 17.5 13.2 9.41 4.04MIN 4.94 5.95 5.42 8.21 8.69 11.9 16.9 15.3 12.6 4.22 2.25 3.16
1/1
/02
2/1
/02
3/1
/02
4/1
/02
5/1
/02
6/1
/02
7/1
/02
8/1
/02
9/1
/02
10/1
/02
11/1
/02
12/1
/02
1/1
/03
0
5
10
15
20
25
Mea
n D
aily
Tem
per
atu
re (
°C)
32
41
50
59
68
77(°
F)
State of OregonTemperature Standard
EFDR – East Fork Dairy Creek at Roy Road [RM 1.24]

APPENDIX F—Stream Temperature RecordsF-20 2002 Tualatin River Flow Management Report
MCKN – 14205980 – MCKAY CREEK AT NORTHRUP ROAD NEAR NORTH PLAINS, OREGON [RM 15.5]Latitude: 45 38 36 Longitude: 122 59 32 Source Agency: District 18 Watermaster
Day2002 Mean Daily Water Temperature in Degrees Celsius
JAN FEB MAR APR MAY JUN JUL AUG SEP OCT NOV DEC 1 5.65 5.67 4.92 8.50 11.1 13.8 15.0 16.3 16.7 10.8 3.23 3.65 2 6.67 5.83 4.80 8.45 10.4 13.0 15.2 15.8 16.5 10.4 3.22 4.85 3 6.05 6.46 5.28 8.80 9.34 13.0 14.9 15.7 16.2 11.6 3.23 4.12 4 6.47 5.50 5.54 9.55 8.83 13.9 14.4 15.5 14.7 12.2 3.88 4.78 5 6.55 5.60 6.65 9.07 9.30 14.8 14.7 15.3 14.1 12.5 5.25 5.63 6 7.59 6.36 6.46 9.64 8.06 13.1 16.1 14.6 13.5 13.0 6.17 7 8.83 6.45 4.55 9.78 7.52 12.2 16.2 14.8 12.9 12.6 7.02 8 8.63 6.32 4.09 8.91 8.23 11.0 16.0 15.7 12.7 12.3 7.85 9 7.94 6.48 4.61 9.90 8.47 11.9 16.8 16.8 13.7 13.0 8.03
10 7.75 6.65 6.08 10.2 8.45 13.6 18.7 17.8 14.8 11.6 8.1211 7.68 5.88 7.16 10.3 9.89 14.4 19.3 17.4 15.6 9.70 8.6812 7.54 5.63 6.83 10.8 11.6 16.1 19.1 18.0 15.9 8.77 9.2113 6.41 5.29 6.67 11.2 11.3 17.4 19.8 19.2 16.1 8.73 9.1414 6.00 5.62 6.60 10.3 10.2 17.4 18.5 19.7 16.1 8.85 9.3415 4.92 6.00 6.28 8.23 10.3 15.8 17.2 18.4 15.6 9.45 7.6116 5.02 6.35 5.70 7.60 10.6 14.7 17.9 17.6 15.3 10.3 6.6817 5.24 6.22 5.55 7.38 11.6 13.2 18.0 17.4 14.8 10.3 7.4618 5.71 7.31 5.03 7.80 11.7 12.9 17.9 16.8 13.7 9.93 7.4819 6.03 7.68 6.15 8.01 11.5 12.7 17.8 16.7 13.8 11.0 8.5020 5.73 6.56 7.32 8.27 11.7 14.5 17.4 16.5 13.7 12.0 8.5521 5.33 8.07 6.83 8.39 11.5 16.5 18.4 15.4 12.8 11.7 8.5222 4.84 8.93 6.68 8.50 11.3 16.2 19.6 15.2 13.0 10.5 8.6123 5.49 8.79 7.89 8.24 10.7 16.0 19.6 16.3 13.7 9.96 9.4324 6.29 7.02 8.32 8.67 11.4 16.1 19.8 17.2 14.3 8.68 8.5525 6.89 5.35 8.02 9.52 12.7 17.2 19.1 17.0 14.6 7.42 5.8026 6.34 5.04 7.25 8.35 14.0 18.2 19.1 16.8 14.0 7.06 4.2627 5.33 5.26 6.95 8.53 14.0 17.4 17.7 16.8 14.3 6.81 4.1128 5.62 5.77 7.85 9.01 13.5 15.5 17.3 18.1 13.9 7.55 4.2929 4.80 — 7.63 10.0 13.5 15.2 17.8 18.4 13.8 7.68 4.0830 5.14 — 7.74 10.8 13.4 15.0 18.0 16.5 11.9 5.76 3.8731 5.40 — 8.11 — 13.2 — 16.5 16.2 — 3.78 —
MEAN 6.25 6.36 6.44 9.09 10.9 14.8 17.5 16.8 14.4 9.87 6.67 4.61MAX 8.83 8.93 8.32 11.2 14.0 18.2 19.8 19.7 16.7 13.0 9.43 5.63MIN 4.80 5.04 4.09 7.38 7.52 11.0 14.4 14.6 11.9 3.78 3.22 3.65
1/1
/02
2/1
/02
3/1
/02
4/1
/02
5/1
/02
6/1
/02
7/1
/02
8/1
/02
9/1
/02
10/1
/02
11/1
/02
12/1
/02
1/1
/03
0
5
10
15
20
25
Mea
n D
aily
Tem
per
atu
re (
°C)
32
41
50
59
68
77
(°F
)
State of OregonTemperature Standard
MCKN – 14205980 – McKay Creek at Northrup Road near North Plains, Oregon [RM 15.5]

APPENDIX F—Stream Temperature Records2002 Tualatin River Flow Management Report F-21
MCSC – 14206070 – MCKAY CREEK AT SCOTCH CHURCH ROAD NEAR HILLSBORO, OREGON [RM 6.3]Latitude: 45 57 21 Longitude: 122 99 18 Source Agency: District 18 Watermaster
Day2002 Mean Daily Water Temperature in Degrees Celsius
JAN FEB MAR APR MAY JUN JUL AUG SEP OCT NOV DEC 1 5.66 5.33 5.17 8.70 11.7 14.7 15.9 16.6 16.9 10.9 2.70 2.36 2 6.18 5.36 4.72 8.64 11.7 14.3 16.0 15.9 16.9 10.2 2.10 3.10 3 6.14 6.06 5.14 9.11 10.7 14.2 15.6 15.8 16.4 10.8 1.84 2.54 4 6.13 5.38 5.52 9.66 9.91 14.7 15.1 15.8 14.7 11.1 2.21 3.06 5 6.24 5.02 6.16 9.97 10.0 15.7 15.3 15.4 14.0 11.7 3.33 3.63 6 6.90 5.50 6.45 9.67 9.48 14.4 16.5 14.9 13.4 12.3 4.13 3.06 7 8.53 6.03 5.26 10.3 8.43 13.1 16.9 15.0 12.8 12.4 5.04 2.49 8 8.57 5.33 4.33 9.92 8.66 12.1 16.7 15.7 12.5 12.4 6.08 2.07 9 7.53 5.55 4.45 10.4 9.16 12.5 17.3 16.8 13.4 12.8 6.74 2.36
10 7.05 5.86 5.44 10.7 9.22 13.7 18.9 18.0 14.3 11.5 7.36 3.4511 7.18 5.71 6.96 10.8 10.0 14.5 19.5 17.5 15.2 9.80 7.95 4.2012 7.20 5.15 6.81 11.0 11.6 16.2 19.5 18.4 15.6 8.97 8.56 5.8413 6.45 5.04 6.64 11.6 12.3 17.7 20.4 19.6 15.9 8.66 8.67 6.7714 5.94 5.17 6.25 11.3 11.4 18.0 18.9 20.1 15.8 8.56 8.97 7.6115 4.97 5.63 6.20 9.23 11.1 16.9 17.7 18.7 15.5 8.94 8.06 7.9116 4.77 6.05 5.54 8.09 11.5 16.1 18.2 17.7 15.5 9.61 7.45 7.4617 5.04 5.91 5.40 7.57 12.2 14.8 18.5 17.7 14.9 9.42 7.55 7.0718 5.44 6.64 5.19 7.82 12.8 14.3 18.6 16.7 14.0 9.14 7.30 6.6019 5.80 7.36 5.54 8.21 12.8 13.7 18.6 16.4 14.1 10.3 7.91 6.1420 5.71 6.97 6.66 8.46 12.6 14.6 18.2 16.4 13.9 11.3 7.89 5.8621 5.48 7.38 6.82 9.07 12.3 16.2 18.7 15.3 13.0 11.3 7.76 6.1322 4.59 8.41 6.32 8.68 12.4 16.6 19.9 15.3 13.1 10.4 8.15 6.3523 4.92 8.85 7.43 8.64 12.2 16.5 20.1 16.3 13.5 9.77 8.63 6.0624 5.80 7.65 8.51 9.06 12.1 16.9 20.1 17.0 14.2 8.55 8.11 5.3025 6.14 5.76 8.13 9.79 13.0 17.6 19.5 17.0 14.3 7.26 5.92 5.4326 5.34 5.00 7.80 9.50 14.4 18.8 19.7 17.2 13.8 6.66 4.42 5.8227 4.56 4.99 7.19 9.01 15.0 18.6 18.2 17.1 14.0 6.22 3.99 6.2128 4.72 5.51 7.54 9.45 15.0 17.0 17.9 18.3 13.6 6.85 3.74 6.5529 4.40 — 8.14 10.4 14.9 16.5 18.3 18.8 13.5 6.92 3.16 6.1930 4.60 — 8.11 11.2 14.5 16.0 18.4 16.3 11.8 5.12 2.84 5.9931 5.17 — 8.54 — 14.4 — 16.5 16.2 — 3.27 — 6.45
MEAN 5.91 6.02 6.40 9.53 11.9 15.6 18.1 16.9 14.4 9.46 5.95 5.16MAX 8.57 8.85 8.54 11.6 15.0 18.8 20.4 20.1 16.9 12.8 8.97 7.91MIN 4.40 4.99 4.33 7.57 8.43 12.1 15.1 14.9 11.8 3.27 1.84 2.07
1/1
/02
2/1
/02
3/1
/02
4/1
/02
5/1
/02
6/1
/02
7/1
/02
8/1
/02
9/1
/02
10/1
/02
11/1
/02
12/1
/02
1/1
/03
0
5
10
15
20
25
Mea
n D
aily
Tem
per
atu
re (
°C)
32
41
50
59
68
77(°
F)
State of OregonTemperature Standard
MCSC – 14206070 – McKay Creek at Scotch Church Road near Hillsboro, Oregon [RM 6.3]

APPENDIX F—Stream Temperature RecordsF-22 2002 Tualatin River Flow Management Report
WCJS – 14206100 – WAIBLE CREEK AT JACKSON SCHOOL ROAD NEAR HILLSBORO, OREGON [RM 1.0]Latitude: 45 33 55 Longitude: 122 58 12 Source Agency: District 18 Watermaster
Day2002 Mean Daily Water Temperature in Degrees Celsius
JAN FEB MAR APR MAY JUN JUL AUG SEP OCT NOV DEC 1 5.99 6.43 6.32 11.1 11.6 17.6 18.3 13.6 13.4 9.77 4.28 4.32 2 6.91 6.40 6.10 11.1 11.7 16.8 17.9 13.2 13.5 8.97 4.01 4.42 3 6.55 7.10 6.54 12.0 13.0 16.8 17.5 13.0 13.5 9.21 4.06 4.32 4 6.66 5.79 6.94 13.0 14.2 16.9 16.5 13.1 12.7 9.77 4.11 4.35 5 6.81 5.59 7.62 11.9 14.8 17.0 15.6 13.0 11.9 10.2 4.47 4.77 6 7.43 6.24 7.06 11.2 14.0 15.9 15.4 12.7 11.3 10.6 4.84 4.54 7 9.61 6.14 5.65 12.5 13.3 14.1 15.6 12.4 11.0 10.8 5.19 4.19 8 9.06 5.64 13.0 12.9 12.9 15.7 12.4 10.6 10.7 6.25 4.05 9 7.84 6.10 13.1 13.6 12.3 16.2 12.7 10.8 10.8 7.24 3.93
10 7.72 6.43 12.6 12.9 12.7 16.8 13.0 11.1 10.5 8.03 4.3111 7.73 6.16 12.9 13.7 13.0 17.2 13.3 11.4 9.27 8.45 5.3812 7.66 5.55 13.4 14.7 13.5 17.5 13.4 11.6 8.10 9.04 7.4313 6.73 5.37 14.0 14.7 14.0 17.5 13.7 11.8 7.53 9.32 7.6314 6.59 5.98 12.9 14.7 14.4 17.2 13.9 12.0 7.19 9.47 8.5215 5.22 6.23 11.0 14.7 14.6 16.1 14.0 12.1 7.07 8.45 8.1516 5.54 6.81 9.94 15.1 14.5 15.7 13.8 12.3 9.29 7.77 7.7217 6.04 6.45 10.1 16.9 14.0 15.7 13.6 12.5 10.8 7.73 7.5918 6.42 7.57 10.9 17.4 13.6 15.8 13.4 12.1 11.0 7.46 7.2019 6.62 7.98 11.5 17.5 12.8 15.8 13.1 11.6 11.3 8.04 6.6420 6.22 7.53 12.8 17.1 12.8 15.8 13.2 11.5 11.4 8.33 6.1621 6.21 8.96 13.0 16.6 13.3 15.6 13.1 10.9 11.8 7.99 6.6922 5.65 9.58 12.1 16.4 13.7 15.5 12.7 10.4 12.1 8.03 6.8823 6.12 9.14 11.5 15.9 14.1 15.6 12.7 10.4 11.1 8.39 6.2424 6.73 7.76 10.8 15.6 14.5 15.8 12.9 10.6 9.19 8.37 5.4325 6.46 6.08 10.9 15.7 14.8 15.8 13.1 10.9 7.65 6.19 6.0326 5.70 5.87 9.27 10.4 16.2 15.0 15.8 13.3 10.8 6.87 4.37 6.3927 5.11 6.35 8.59 9.99 16.6 15.3 15.7 13.4 11.0 6.37 4.08 6.9128 5.91 6.99 9.36 10.1 17.5 15.3 15.2 13.5 10.9 6.71 4.09 7.4329 5.03 — 10.0 10.6 19.1 17.4 15.0 13.6 11.2 7.14 4.19 6.8130 5.62 — 10.7 11.2 17.6 19.2 15.0 13.6 10.5 6.04 4.38 6.9631 5.98 — 11.2 — 17.5 — 14.1 13.3 — 4.71 — 7.00
MEAN 6.58 6.72 8.10 11.7 15.3 14.8 16.1 13.2 11.5 9.16 6.55 6.08MAX 9.61 9.58 11.2 14.0 19.1 19.2 18.3 14.0 13.5 12.1 9.47 8.52MIN 5.03 5.37 5.65 9.94 11.6 12.3 14.1 12.4 10.4 4.71 4.01 3.93
1/1
/02
2/1
/02
3/1
/02
4/1
/02
5/1
/02
6/1
/02
7/1
/02
8/1
/02
9/1
/02
10/1
/02
11/1
/02
12/1
/02
1/1
/03
0
5
10
15
20
25
Mea
n D
aily
Tem
per
atu
re (
°C)
32
41
50
59
68
77
(°F
)
State of OregonTemperature Standard
WCJS – 14206100 – Waible Creek at Jackson School Road near Hillsboro, Oregon [RM 1.0]

APPENDIX F—Stream Temperature Records2002 Tualatin River Flow Management Report F-23
MCKH – 14206180 – MCKAY CREEK AT HORNECKER ROAD NEAR HILLSBORO, OREGON [RM 2.2]Latitiude: 45 32 33 Longitude: 123 00 14 Source Agency: District 18 Watermaster
Day2002 Mean Daily Water Temperature in Degrees Celsius
JAN FEB MAR APR MAY JUN JUL AUG SEP OCT NOV DEC 1 6.15 6.02 5.93 9.74 12.5 15.7 16.9 18.1 17.9 11.4 3.28 2.96 2 6.73 6.05 5.40 9.53 12.4 15.3 16.9 17.4 17.9 10.8 2.68 3.62 3 6.89 6.54 5.59 9.90 11.8 15.2 16.8 17.3 17.6 11.4 2.42 3.31 4 6.63 6.26 6.06 10.6 11.0 15.5 16.3 17.1 16.1 11.8 2.65 3.53 5 6.82 5.59 6.82 10.8 11.1 16.6 16.4 16.8 15.3 12.3 3.56 4.21 6 7.44 5.90 7.07 10.7 10.2 15.6 17.7 16.3 14.6 12.7 4.45 7 9.35 6.57 6.20 10.9 9.42 14.1 18.0 16.3 13.9 12.8 5.34 8 9.55 5.96 5.16 10.8 9.63 13.1 17.8 17.0 13.6 12.8 6.45 9 8.60 6.29 5.10 11.3 10.0 13.7 18.4 18.0 14.1 13.2 7.26
10 7.80 6.48 5.93 11.6 10.0 14.9 19.8 19.0 15.0 12.3 7.5511 7.78 6.50 7.45 11.7 11.0 15.8 20.8 18.5 15.9 10.8 7.9612 7.79 5.83 7.74 12.0 12.3 17.3 20.8 19.5 16.5 9.73 8.6513 7.30 5.59 7.63 12.5 12.9 18.6 21.5 20.5 16.8 9.18 8.9214 6.56 5.63 7.16 12.4 12.3 19.1 20.1 21.2 16.8 8.96 9.2315 5.75 6.06 7.12 10.7 12.3 18.1 19.1 20.0 16.6 9.10 8.6216 5.18 6.55 6.41 9.15 12.4 17.1 19.5 19.1 16.4 9.58 7.9917 5.55 6.52 6.23 8.50 13.0 15.7 19.8 18.9 15.7 9.72 8.0018 5.90 7.00 5.99 8.64 13.5 15.1 19.8 17.9 14.8 9.66 7.7719 6.31 7.93 6.17 8.88 13.5 14.7 19.7 17.8 14.6 10.4 8.4120 6.40 7.70 7.36 9.31 13.4 15.8 19.4 17.6 14.7 11.4 8.4921 6.23 7.97 7.68 9.83 13.3 17.4 20.1 16.4 14.0 11.7 8.4222 5.49 9.00 7.17 9.78 13.3 17.8 21.2 16.3 13.7 11.2 8.6023 5.55 9.59 7.90 9.45 13.0 17.8 21.4 17.3 14.0 10.6 9.0524 6.37 8.66 9.14 9.90 13.3 18.1 21.4 18.0 14.6 9.49 8.6525 6.98 6.76 9.05 10.5 14.0 18.9 20.8 18.1 14.8 8.12 6.7726 6.30 5.73 8.73 10.3 15.1 20.0 20.8 18.1 14.5 7.39 4.9927 5.39 5.62 8.02 10.1 15.8 19.7 19.5 18.0 14.6 6.96 4.3428 5.35 6.04 8.22 10.2 15.6 17.9 19.2 19.1 14.2 7.30 3.9629 5.26 — 8.79 11.5 15.8 17.3 19.6 19.7 14.1 7.33 3.5330 5.08 — 9.13 12.1 15.7 17.0 19.7 17.8 12.8 6.12 3.2631 5.73 — 9.38 — 15.5 — 18.3 17.4 — 4.31 —
MEAN 6.59 6.66 7.15 10.4 12.7 16.6 19.3 18.1 15.2 10.0 6.38 3.53MAX 9.55 9.59 9.38 12.5 15.8 20.0 21.5 21.2 17.9 13.2 9.23 4.21MIN 5.08 5.59 5.10 8.50 9.42 13.1 16.3 16.3 12.8 4.31 2.42 2.96
1/1
/02
2/1
/02
3/1
/02
4/1
/02
5/1
/02
6/1
/02
7/1
/02
8/1
/02
9/1
/02
10/1
/02
11/1
/02
12/1
/02
1/1
/03
0
5
10
15
20
25
Mea
n D
aily
Tem
per
atu
re (
°C)
32
41
50
59
68
77(°
F)
State of OregonTemperature Standard
MCKH – 14206180 – McKay Creek at Hornecker Road near Hillsboro, Oregon [RM 2.2]

APPENDIX F—Stream Temperature RecordsF-24 2002 Tualatin River Flow Management Report
DAIRY – 14206200 – DAIRY CREEK AT HWY 8 NEAR HILLSBORO, OREGON [RM 2.06]Latitude: 45 30 38 Longitude: 123 06 56 Source Agency: District 18 Watermaster
Day2002 Mean Daily Water Temperature in Degrees Celsius
JAN FEB MAR APR MAY JUN JUL AUG SEP OCT NOV DEC 1 5.36 4.82 5.79 9.38 12.2 15.0 16.4 18.0 18.0 11.5 3.10 2.48 2 5.76 5.11 5.35 9.28 12.1 14.8 16.6 17.1 17.9 10.7 2.38 3.10 3 6.13 5.69 5.43 9.64 11.4 14.8 16.3 17.0 17.4 11.2 2.05 2.68 4 6.15 5.75 5.77 10.2 10.6 15.1 15.8 16.9 15.9 11.7 2.19 3.21 5 6.31 5.23 6.37 10.5 10.6 15.8 15.8 16.4 15.3 12.1 3.12 3.72 6 6.66 5.28 6.69 10.2 9.92 15.2 16.9 15.8 14.6 12.6 3.77 3.28 7 8.36 5.86 5.93 10.3 9.15 13.9 17.4 16.0 13.7 12.8 4.74 2.74 8 9.07 5.45 4.90 10.5 9.03 12.9 17.3 16.7 13.2 12.8 6.28 2.15 9 8.51 5.48 4.66 10.8 9.45 13.0 18.0 17.6 13.8 13.2 6.90 2.25
10 7.77 5.63 5.33 11.0 9.52 13.9 19.4 18.6 14.7 12.2 7.26 3.58 11 7.37 5.71 6.70 11.1 10.2 14.9 20.3 18.3 15.7 10.6 7.61 4.65 12 7.22 5.30 7.24 11.3 11.6 16.5 20.5 19.2 16.4 9.70 8.38 5.65 13 6.83 5.01 6.99 11.7 12.4 18.0 21.1 20.2 16.7 9.15 8.62 6.67 14 6.25 5.28 6.67 11.8 12.0 18.6 19.8 21.0 16.8 8.95 8.79 7.54 15 5.49 5.74 6.64 10.4 11.6 17.8 18.9 19.8 16.6 9.28 8.16 7.99 16 4.95 6.01 6.24 8.89 11.8 16.8 19.1 19.3 16.3 9.77 7.64 7.76 17 4.97 6.06 5.94 8.30 12.4 15.4 19.4 19.0 15.6 9.78 7.59 7.30 18 5.23 6.37 5.78 8.48 12.9 14.6 19.4 17.8 14.9 9.54 7.53 6.94 19 5.54 7.19 5.67 8.57 13.2 14.1 19.2 17.7 14.8 10.4 7.96 6.41 20 5.71 7.26 6.68 8.98 12.8 15.0 18.9 17.4 14.7 11.3 8.05 5.98 21 5.57 7.33 7.24 9.56 12.4 16.7 19.6 16.2 14.1 11.5 7.95 5.94 22 5.03 8.28 6.93 9.43 12.5 17.4 20.7 16.1 13.9 11.1 8.13 6.19 23 4.74 8.95 7.48 9.18 12.4 17.4 21.0 17.2 14.3 10.5 8.57 6.17 24 5.36 8.31 8.73 9.59 12.6 17.6 21.1 17.9 14.9 9.25 8.31 5.70 25 6.10 6.73 8.77 10.3 13.4 18.4 20.7 17.9 15.1 7.97 6.52 5.48 26 5.66 5.59 8.72 10.2 14.6 19.4 20.6 17.9 14.6 7.33 5.01 5.69 27 4.75 5.44 7.99 9.79 15.2 19.3 19.2 17.8 14.7 6.71 4.16 6.04 28 4.36 5.66 7.93 9.90 15.2 17.7 19.1 19.0 14.3 7.01 3.74 6.43 29 4.07 — 8.40 10.8 15.0 17.0 19.3 19.5 14.2 7.05 3.24 6.30 30 3.96 — 8.63 11.8 14.7 16.5 19.4 17.3 12.6 5.62 2.89 6.13 31 4.37 — 9.01 — 14.7 — 17.9 17.3 — 3.91 — 6.54
MEAN 5.92 6.09 6.79 10.1 12.2 16.1 18.9 17.9 15.2 9.91 6.02 5.25MAX 9.07 8.95 9.01 11.8 15.2 19.4 21.1 21.0 18.0 13.2 8.79 7.99MIN 3.96 4.82 4.66 8.30 9.03 12.9 15.8 15.8 12.6 3.91 2.05 2.15
1/1
/02
2/1
/02
3/1
/02
4/1
/02
5/1
/02
6/1
/02
7/1
/02
8/1
/02
9/1
/02
10/1
/02
11/1
/02
12/1
/02
1/1
/03
0
5
10
15
20
25
Mea
n D
aily
Tem
per
atu
re (
°C)
32
41
50
59
68
77
(°F
)
State of OregonTemperature Standard
DAIRY – 14206200 – Dairy Creek at Hwy 8 near Hillsboro, Oregon [RM 2.06]

APPENDIX F—Stream Temperature Records2002 Tualatin River Flow Management Report F-25
ROOD – 14206295 – TUALATIN RIVER AT ROOD BRIDGE ROAD NEAR HILLSBORO, OREGON [RM 38.4]Latitude: 45 29 24 Longitude: 122 57 06 Source Agency: District 18 Watermaster
Day2002 Mean Daily Water Temperature in Degrees Celsius
JAN FEB MAR APR MAY JUN JUL AUG SEP OCT NOV DEC 1 5.94 5.32 6.38 9.71 12.5 16.0 15.2 16.9 15.3 14.1 6.72 3.75 2 6.24 5.72 6.05 9.59 12.6 16.3 15.3 16.5 15.3 13.3 5.78 3.99 3 6.67 6.20 6.04 9.83 12.2 16.3 15.8 16.5 15.2 12.7 5.26 3.90 4 6.80 6.45 6.30 10.4 11.6 16.4 15.7 16.2 14.8 13.0 5.14 4.15 5 6.97 6.08 6.82 10.7 11.1 17.0 15.4 15.5 14.3 13.9 5.70 6 7.06 5.92 7.30 10.6 10.7 16.2 15.7 15.1 14.0 14.6 6.41 7 8.30 6.31 6.99 10.1 10.0 15.1 16.6 15.4 13.4 14.9 7.34 8 9.58 6.26 6.01 10.3 9.99 14.1 16.2 16.1 12.9 14.9 8.18 9 9.31 5.96 5.41 10.6 10.1 13.8 16.1 16.7 13.2 15.1 8.96
10 8.66 6.15 5.81 11.2 10.3 14.6 17.7 17.8 14.1 14.4 8.7011 8.15 6.27 6.86 11.3 11.0 15.7 19.3 17.8 15.0 13.4 8.7012 7.86 6.03 7.74 11.3 12.2 17.2 19.4 17.4 15.6 12.4 9.0813 7.48 5.69 7.46 11.1 13.1 18.5 19.2 17.8 16.0 11.9 9.4614 7.04 5.86 7.31 11.3 13.0 17.9 18.9 19.0 16.1 11.9 9.6215 6.33 6.30 7.20 10.3 12.7 16.9 18.0 19.3 16.0 12.2 9.2916 5.81 6.56 6.95 9.02 12.6 15.6 17.9 18.0 15.7 12.5 8.7317 5.69 6.66 6.65 8.64 13.1 14.2 18.5 17.1 15.4 12.7 8.4518 5.93 6.86 6.40 8.70 13.7 13.3 18.6 16.5 15.1 12.6 8.2519 6.18 7.55 6.28 8.82 13.9 13.2 17.7 15.8 15.1 12.8 8.5620 6.32 7.76 7.00 9.30 13.8 14.3 17.1 15.5 15.3 13.7 8.7721 6.11 7.60 7.52 9.71 13.3 16.3 17.3 14.8 15.1 14.1 8.8222 5.72 8.24 7.41 9.75 13.1 17.2 18.2 14.4 15.0 13.9 8.9323 5.31 8.97 7.84 9.43 13.1 17.4 19.0 15.1 15.1 13.2 9.2024 5.78 8.89 8.93 9.76 13.4 17.2 18.9 16.1 15.6 12.2 9.1825 6.48 7.59 9.31 10.5 14.1 17.8 18.0 16.6 16.0 11.0 7.9626 6.30 6.42 9.29 10.6 15.1 18.7 17.8 16.4 15.8 10.3 6.4827 5.33 6.08 8.61 10.4 16.1 18.0 17.6 15.9 16.0 9.83 5.4428 5.08 6.20 8.29 10.5 16.1 16.5 17.3 16.5 15.7 9.92 4.8529 4.75 — 8.86 11.1 16.1 14.7 17.1 17.1 15.7 10.1 4.3730 4.65 — 8.98 11.9 15.5 14.9 17.5 16.6 15.0 9.20 4.0631 4.83 — 9.20 — 15.6 — 17.5 15.6 — 7.79 —
MEAN 6.54 6.64 7.33 10.2 13.0 16.0 17.4 16.5 15.1 12.5 7.55 3.95MAX 9.58 8.97 9.31 11.9 16.1 18.7 19.4 19.3 16.1 15.1 9.62 4.15MIN 4.65 5.32 5.41 8.64 9.99 13.2 15.2 14.4 12.9 7.79 4.06 3.75
1/1
/02
2/1
/02
3/1
/02
4/1
/02
5/1
/02
6/1
/02
7/1
/02
8/1
/02
9/1
/02
10/1
/02
11/1
/02
12/1
/02
1/1
/03
0
5
10
15
20
25
Mea
n D
aily
Tem
per
atu
re (
°C)
32
41
50
59
68
77(°
F)
State of OregonTemperature Standard
ROOD – 14206295 – Tualatin River at Rood Bridge Road near Hillsboro, Oregon [RM 38.4]

APPENDIX F—Stream Temperature RecordsF-26 2002 Tualatin River Flow Management Report
RCRR – 14206305 – ROCK CREEK AT ROCK CREEK ROAD NEAR BOWERS JUNCTION, OREGON [RM 15.8]Latitude: 45 37 04 Longitude: 122 53 13 Source Agency: District 18 Watermaster
Day2002 Mean Daily Water Temperature in Degrees Celsius
JAN FEB MAR APR MAY JUN JUL AUG SEP OCT NOV DEC 1 11.0 12.8 14.0 14.2 14.4 8.86 3.35 1.96 2 10.4 11.3 13.6 13.1 14.6 8.37 2.54 3.60 3 9.02 11.8 13.3 13.2 14.4 9.84 2.00 2.38 4 8.43 13.2 13.0 13.6 12.5 11.1 2.64 3.24 5 9.13 14.3 13.5 13.5 11.9 11.5 4.17 3.97 6 7.86 11.7 14.7 12.8 11.7 11.8 5.05 2.53 7 7.09 9.99 15.3 12.7 11.3 11.1 6.43 1.66 8 7.70 9.33 14.9 13.4 11.1 11.2 7.36 1.19 9 7.89 10.5 16.0 14.4 12.3 11.9 7.52 2.08
10 8.22 12.2 18.1 15.4 13.6 9.76 7.54 4.1811 9.11 13.2 17.9 14.7 14.3 7.60 8.21 4.6512 11.5 15.4 17.4 15.9 14.4 7.55 8.82 5.8313 10.9 16.6 18.3 17.3 14.4 7.86 8.33 5.8714 9.58 16.1 16.0 17.4 14.4 8.01 8.49 6.5015 8.97 14.3 15.0 16.2 14.4 9.19 6.21 6.5616 9.91 13.8 15.9 15.5 14.2 10.4 5.50 6.6817 11.0 12.5 16.4 15.3 13.3 9.71 6.59 6.4918 11.1 12.6 16.6 14.3 12.0 9.04 6.27 6.1219 11.2 11.7 16.7 14.2 12.2 10.4 7.95 5.5820 11.3 13.9 15.9 14.5 11.9 11.6 7.78 5.2621 11.1 15.6 16.7 13.2 11.2 11.1 7.59 5.5122 10.8 15.0 17.8 13.2 11.8 9.72 8.17 5.5923 10.1 14.9 18.4 14.3 12.5 9.57 8.70 4.5424 10.8 14.8 18.4 14.9 12.9 7.57 7.13 4.2825 12.2 16.0 17.4 15.1 13.1 5.88 4.01 4.8826 8.02 13.6 17.1 17.6 15.4 12.8 5.78 2.61 5.0927 9.05 13.7 16.5 15.5 14.8 13.2 5.43 2.69 5.6128 9.36 13.7 14.8 15.4 16.3 12.9 6.86 2.71 5.7929 — 10.7 14.1 15.4 16.0 16.4 12.4 6.45 2.42 5.1830 — 11.0 13.1 14.8 16.2 14.1 10.3 4.25 2.43 5.7431 — — 12.1 — 13.8 13.9 — 2.95 — 6.26
MEAN 9.63 10.5 13.7 16.0 14.6 12.9 8.79 5.71 4.67MAX 11.0 14.1 17.1 18.4 17.4 14.6 11.9 8.82 6.68MIN 8.02 7.09 9.33 13.0 12.7 10.3 2.95 2.00 1.19
1/1
/02
2/1
/02
3/1
/02
4/1
/02
5/1
/02
6/1
/02
7/1
/02
8/1
/02
9/1
/02
10/1
/02
11/1
/02
12/1
/02
1/1
/03
0
5
10
15
20
25
Mea
n D
aily
Tem
per
atu
re (
°C)
32
41
50
59
68
77
(°F
)
State of OregonTemperature Standard
RCRR – 14206305 – Rock Creek at Rock Creek Road near Bowers Junction, Oregon [RM 15.8]

APPENDIX F—Stream Temperature Records2002 Tualatin River Flow Management Report F-27
RCWU – 14206338 – ROCK CREEK AT WEST UNION ROAD NEAR BETHANY, OREGON [RM 9.0]Latitude: 45 33 34 Longitude: 122 52 30 Source Agency: District 18 Watermaster
Day2002 Mean Daily Water Temperature in Degrees Celsius
JAN FEB MAR APR MAY JUN JUL AUG SEP OCT NOV DEC 1 5.48 5.73 5.85 10.6 12.7 14.8 15.8 16.4 3.33 4.30 2 6.09 5.72 5.63 10.7 12.4 14.5 15.6 15.3 2.53 4.40 3 5.69 6.56 6.09 11.0 11.7 14.2 15.4 15.3 2.14 4.61 4 5.61 5.68 6.29 11.5 11.0 14.7 15.1 15.3 2.44 4.54 5 5.95 5.25 6.99 11.4 11.3 15.5 15.1 15.0 3.80 5.21 6 6.94 5.70 6.77 11.2 10.4 14.8 15.5 14.7 4.56 4.37 7 9.03 6.15 5.46 11.4 9.63 13.4 16.0 15.0 6.36 3.88 8 9.15 5.72 4.98 11.2 9.84 12.5 16.2 15.6 8.03 3.80 9 8.02 5.97 5.12 11.9 9.93 12.4 16.8 16.5 8.43 4.23
10 7.51 6.27 6.12 12.1 9.95 13.5 17.9 17.0 8.46 5.3111 7.41 6.03 7.53 12.4 10.6 14.4 18.4 16.8 8.64 5.0412 7.32 5.35 7.28 12.7 12.2 15.7 18.5 9.08 6.2613 6.37 4.95 7.20 13.2 12.8 16.9 18.9 9.19 7.0814 5.91 5.34 7.10 12.9 12.0 17.4 18.1 9.37 7.8215 4.61 5.86 6.82 10.9 11.8 16.7 17.3 8.45 7.9716 4.49 6.51 6.12 9.68 11.9 16.1 17.2 7.59 7.6717 4.92 6.30 5.98 9.21 12.6 15.1 17.4 7.52 7.3518 5.38 7.16 5.52 9.58 12.9 14.7 17.5 7.34 6.9519 5.82 8.03 6.22 9.56 13.1 14.3 17.6 7.92 6.4320 5.82 7.77 7.49 9.90 13.0 14.6 17.2 8.06 5.7921 5.72 8.71 6.85 10.4 12.9 15.5 17.4 7.95 5.9322 5.15 9.63 6.75 10.3 13.1 16.0 18.6 8.22 6.1023 5.26 9.70 8.37 10.0 12.8 15.8 19.1 8.78 5.6724 6.01 8.32 9.64 10.5 12.7 15.8 19.1 8.40 5.1525 6.51 6.40 9.57 11.3 13.5 16.1 18.5 6.51 5.4026 5.75 5.64 9.03 10.4 14.4 17.1 18.7 4.98 5.7027 4.82 5.83 8.59 10.5 15.0 17.4 17.1 4.45 6.3228 5.05 6.20 8.86 10.8 15.0 16.5 17.4 4.35 6.7329 4.34 — 9.43 11.7 15.4 16.2 18.0 4.18 6.3330 4.66 — 9.82 12.2 15.2 16.1 17.4 4.35 6.4431 5.29 — 10.1 — 14.9 — 15.9 — 2.92 — 6.73
MEAN 6.00 6.52 7.21 11.0 12.5 15.3 17.2 15.7 2.92 6.51 5.79MAX 9.15 9.70 10.1 13.2 15.4 17.4 19.1 17.0 2.92 9.37 7.97MIN 4.34 4.95 4.98 9.21 9.63 12.4 15.1 14.7 2.92 2.14 3.80
1/1
/02
2/1
/02
3/1
/02
4/1
/02
5/1
/02
6/1
/02
7/1
/02
8/1
/02
9/1
/02
10/1
/02
11/1
/02
12/1
/02
1/1
/03
0
5
10
15
20
25
Mea
n D
aily
Tem
per
atu
re (
°C)
32
41
50
59
68
77(°
F)
State of OregonTemperature Standard
RCWU – 14206338 – Rock Creek at West Union Road near Bethany, Oregon [RM 9.0]

APPENDIX F—Stream Temperature RecordsF-28 2002 Tualatin River Flow Management Report
RCQR – 14206347 – ROCK CREEK AT QUATAMA ROAD NEAR ORENCO, OREGON [RM 4.9]Latitude: 45 31 25 Longitude: 122 54 34 Source Agency: District 18 Watermaster
Day2002 Mean Daily Water Temperature in Degrees Celsius
JAN FEB MAR APR MAY JUN JUL AUG SEP OCT NOV DEC 1 5.77 6.05 10.8 13.7 16.5 17.6 18.0 18.1 12.3 4.09 3.60 2 5.86 5.86 10.9 13.4 16.1 17.6 17.3 17.8 12.1 3.36 4.36 3 6.60 6.25 11.3 12.4 16.0 17.4 17.2 17.4 12.7 3.10 3.80 4 6.06 6.64 12.0 11.8 16.6 17.0 17.1 15.9 13.8 3.59 4.34 5 5.55 7.31 12.2 12.0 17.6 16.8 16.9 15.5 14.2 4.65 5.13 6 5.91 7.26 12.0 11.3 16.5 17.7 16.4 15.2 14.2 5.49 4.53 7 6.32 6.13 11.7 10.4 14.8 18.2 16.5 14.6 13.7 6.73 3.65 8 5.64 5.41 11.5 10.9 13.7 17.9 17.1 14.4 13.5 9.29 3.08 9 6.02 5.43 12.4 11.2 14.0 18.6 17.7 14.9 14.1 9.40 3.54
10 6.30 6.48 12.7 11.0 15.4 20.0 18.8 15.7 12.8 9.31 5.7811 6.25 8.07 12.8 11.9 16.6 20.8 18.6 16.4 11.1 9.58 6.8112 5.60 7.59 13.0 13.6 18.1 20.9 19.1 16.5 10.0 10.2 7.9413 5.19 7.45 13.5 14.1 19.4 21.5 19.9 16.8 9.67 10.3 8.5014 5.43 7.31 13.3 13.0 19.5 20.2 20.3 16.8 9.57 10.5 9.1815 6.02 7.21 11.7 12.8 18.4 19.4 19.2 16.7 9.94 9.44 8.8616 6.60 6.51 10.4 13.4 17.3 19.4 18.9 16.5 10.5 8.61 8.2417 6.55 6.28 10.1 14.2 16.0 19.6 18.9 16.0 10.4 8.67 7.7718 5.59 7.25 5.97 10.3 14.8 15.7 19.9 17.9 14.9 10.3 8.29 7.4919 5.99 8.18 6.37 10.3 14.6 15.8 19.7 17.6 14.9 11.3 9.29 6.9720 6.01 8.01 7.49 10.7 14.2 16.9 19.2 17.7 14.9 12.4 9.37 6.4121 5.91 9.04 7.32 11.3 14.4 18.5 19.8 16.8 14.1 12.6 9.15 6.6722 5.32 9.77 6.94 11.0 14.3 18.6 20.6 16.7 14.3 12.1 9.32 6.7923 5.29 10.0 8.25 10.7 14.1 18.1 21.1 17.6 14.5 11.3 9.88 6.5124 6.00 8.86 9.52 11.3 14.4 18.3 21.3 18.1 14.7 9.88 9.20 5.8625 6.61 7.03 9.67 12.2 15.5 19.1 20.8 18.1 14.9 8.61 6.86 6.1226 5.79 5.99 9.50 11.5 16.5 20.3 20.9 18.2 14.3 7.79 5.01 6.5527 4.89 5.93 9.01 11.9 16.9 20.1 19.5 17.9 14.8 7.39 4.46 6.7328 5.05 6.44 9.07 12.0 16.9 18.3 19.5 19.1 14.2 7.95 4.38 7.1529 4.54 — 9.47 12.8 17.3 18.5 19.5 19.3 14.5 8.01 4.04 6.8630 4.66 — 10.2 13.4 16.8 18.4 19.6 17.3 13.1 6.33 3.86 6.9531 5.31 — 10.6 — 16.4 — 18.0 17.7 — 4.63 — 6.91
MEAN 5.50 6.72 7.50 11.7 13.8 17.3 19.4 18.0 15.4 10.8 7.31 6.23MAX 6.61 10.0 10.6 13.5 17.3 20.3 21.5 20.3 18.1 14.2 10.5 9.18MIN 4.54 5.19 5.41 10.1 10.4 13.7 16.8 16.4 13.1 4.63 3.10 3.08
1/1
/02
2/1
/02
3/1
/02
4/1
/02
5/1
/02
6/1
/02
7/1
/02
8/1
/02
9/1
/02
10/1
/02
11/1
/02
12/1
/02
1/1
/03
0
5
10
15
20
25
Mea
n D
aily
Tem
per
atu
re (
°C)
32
41
50
59
68
77
(°F
)
State of OregonTemperature Standard
RCQR – 14206347 – Rock Creek at Quatama Road near Orenco, Oregon [RM 4.9]

APPENDIX F—Stream Temperature Records2002 Tualatin River Flow Management Report F-29
BCCH – 14206360 – BEAVERTON CREEK AT CEDAR HILLS BLVD AT BEAVERTON, OREGON [RM 7.45]Latitude: 45 49 31 Longitude: 122 81 05 Source Agency: District 18 Watermaster
Day2002 Mean Daily Water Temperature in Degrees Celsius
JAN FEB MAR APR MAY JUN JUL AUG SEP OCT NOV DEC 1 7.61 11.8 13.8 15.8 18.0 19.1 19.2 13.7 5.58 6.10 2 7.71 7.59 11.8 12.9 15.3 18.2 18.1 19.5 12.6 5.67 7.38 3 8.27 8.25 12.2 12.0 15.3 17.1 18.2 18.8 13.7 6.09 6.04 4 7.35 8.54 13.0 11.8 16.4 16.6 17.9 17.4 14.9 6.67 6.91 5 7.17 9.02 11.9 12.1 17.4 17.8 17.7 16.9 14.7 8.16 7.33 6 7.91 7.86 12.2 11.2 14.8 19.2 17.6 16.3 14.4 8.85 6.47 7 7.27 7.36 12.1 11.0 13.7 18.3 18.3 15.8 14.1 10.0 5.64 8 7.20 7.36 12.2 12.1 14.0 18.5 19.1 15.5 14.5 10.9 5.48 9 7.68 7.52 12.9 11.6 15.1 20.0 20.3 17.0 14.8 10.6 6.29
10 8.13 8.53 12.7 12.1 16.4 21.6 21.0 18.2 12.8 10.4 8.0111 7.89 9.55 12.9 13.7 17.3 21.6 20.1 18.8 11.4 11.0 8.5212 7.14 8.63 13.1 15.1 18.9 21.3 21.0 19.1 11.1 11.5 9.9713 7.03 8.87 13.4 13.6 20.0 21.5 22.1 19.0 11.2 11.6 9.5714 7.75 8.93 12.9 13.2 19.4 19.8 22.1 18.8 12.1 11.4 10.215 7.74 8.60 11.0 13.4 17.6 19.6 21.2 17.5 12.7 10.1 9.6216 8.04 8.27 10.3 14.2 16.4 20.4 20.8 16.9 13.3 9.53 8.9417 8.10 7.82 10.6 14.7 15.4 20.1 20.5 17.0 13.0 10.2 8.7418 9.09 7.35 11.0 14.3 16.0 19.9 19.3 16.0 12.4 9.89 8.3719 9.12 7.67 11.1 13.9 16.0 19.3 19.2 16.7 13.7 11.1 7.9620 9.03 9.32 12.2 14.3 17.9 19.7 18.4 16.4 14.7 11.0 7.8821 10.4 7.70 12.2 14.2 19.4 20.9 16.8 15.7 13.9 10.5 8.3422 10.9 8.18 11.6 14.1 17.8 21.9 18.2 16.1 13.6 10.9 8.6523 10.4 10.0 11.5 14.2 18.0 21.7 19.6 16.8 12.8 11.1 7.8024 9.34 10.6 12.5 14.6 18.9 22.1 20.2 17.2 11.6 9.45 7.3525 7.69 10.5 13.0 15.8 20.2 21.3 19.0 17.2 10.2 6.97 7.8826 7.39 9.92 11.1 16.9 21.0 20.7 18.5 16.4 9.74 5.99 8.2227 7.75 9.77 11.8 16.9 19.4 19.2 19.1 16.6 9.37 6.66 8.0228 8.36 10.1 12.7 16.5 17.3 19.9 20.9 16.3 10.6 6.94 8.6029 — 11.0 13.8 16.8 18.0 20.6 20.7 15.9 9.60 6.51 8.2530 — 11.8 13.5 16.6 17.6 20.0 18.2 13.9 6.28 7.03 7.7931 — 11.5 — 15.7 — 18.4 18.8 — 5.87 — 8.15
MEAN 8.22 8.89 12.2 14.0 17.2 19.8 19.4 17.1 12.2 9.08 7.89MAX 10.9 11.8 13.8 16.9 21.0 22.1 22.1 19.5 14.9 11.6 10.2MIN 7.03 7.35 10.3 11.0 13.7 16.6 16.8 13.9 5.87 5.58 5.48
1/1
/02
2/1
/02
3/1
/02
4/1
/02
5/1
/02
6/1
/02
7/1
/02
8/1
/02
9/1
/02
10/1
/02
11/1
/02
12/1
/02
1/1
/03
0
5
10
15
20
25
Mea
n D
aily
Tem
per
atu
re (
°C)
32
41
50
59
68
77(°
F)
State of OregonTemperature Standard
BCCH – 14206360 – Beaverton Creek at Cedar Hills Blvd at Beaverton, Oregon [RM 7.45]

APPENDIX F—Stream Temperature RecordsF-30 2002 Tualatin River Flow Management Report
ECMR – 14206365 – ERICKSON CREEK AT MENLO DRIVE AT BEAVERTON, OREGON [RM 0.76]Latitude: 45 29 14 Longitude: 122 58 54 Source Agency: District 18 Watermaster
Day2002 Mean Daily Water Temperature in Degrees Celsius
JAN FEB MAR APR MAY JUN JUL AUG SEP OCT NOV DEC 1 8.24 7.70 11.5 13.8 15.9 16.9 16.5 16.8 13.4 4.28 6.02 2 8.12 7.69 11.2 13.1 15.2 16.6 16.2 16.5 11.9 3.84 6.92 3 8.56 8.24 11.7 12.1 15.4 16.2 15.4 16.3 13.6 3.78 5.72 4 7.58 8.51 12.4 11.5 16.2 15.8 15.8 14.6 14.6 5.65 6.69 5 7.28 9.01 12.1 12.2 16.8 15.9 15.5 14.2 14.6 7.97 7.21 6 8.05 7.94 12.2 11.1 14.9 16.8 15.5 14.5 14.1 8.10 6.64 7 7.27 8.09 11.8 10.7 13.7 17.9 15.3 15.6 13.6 9.78 5.57 8 7.87 8.04 11.7 11.6 13.0 18.1 15.8 14.3 13.8 11.0 5.45 9 8.30 8.02 13.3 11.4 14.2 18.3 16.9 14.6 14.1 10.7 6.31
10 8.59 8.79 12.9 11.5 15.1 19.4 17.6 15.2 12.1 10.6 8.1211 8.14 9.74 13.1 12.5 15.8 19.7 16.8 15.8 10.2 10.9 8.7212 7.43 9.14 13.2 14.1 17.2 19.3 17.8 16.2 9.45 11.7 10.013 7.37 9.25 13.5 13.9 18.1 19.8 18.5 15.9 9.41 11.8 9.8014 8.16 9.39 13.0 12.9 17.9 18.4 18.8 16.2 9.72 11.4 10.415 8.01 8.96 11.3 12.8 16.6 17.1 17.6 16.1 10.3 10.1 9.7716 8.26 8.67 10.7 13.6 15.8 18.0 17.8 16.7 10.5 9.92 9.3117 8.28 8.27 10.9 14.5 16.0 18.3 17.3 16.6 10.1 10.4 9.0118 9.24 7.61 11.4 14.3 16.1 18.5 16.1 15.0 10.3 10.2 8.5219 9.22 8.05 11.3 14.2 15.2 18.5 16.5 14.8 11.7 11.3 8.3120 9.45 9.71 12.0 14.4 16.3 18.0 17.7 14.5 13.0 11.0 8.4321 10.7 8.14 12.2 14.2 17.4 18.8 16.7 13.7 12.6 10.8 8.7922 10.9 8.70 11.9 14.4 17.1 19.4 16.4 13.8 12.1 11.0 9.0523 10.4 10.6 11.4 14.2 17.1 19.7 16.9 13.7 10.8 11.2 8.1124 9.49 10.8 12.1 14.1 17.1 19.8 17.3 14.3 9.36 9.93 7.9125 7.93 8.02 10.6 13.1 15.5 17.9 19.3 17.4 14.4 7.84 7.32 8.5426 7.23 7.94 10.0 11.7 16.4 18.8 19.7 17.7 13.6 7.72 5.99 8.4127 6.43 8.20 9.61 12.3 16.8 18.3 17.8 17.1 14.1 7.65 6.46 8.5728 7.74 8.59 9.90 12.8 16.9 17.5 17.9 18.1 13.2 8.96 6.86 8.9729 7.27 — 10.6 13.9 17.0 17.6 18.5 18.1 15.4 8.48 6.46 8.7930 7.48 — 11.4 13.6 16.4 17.4 18.2 16.1 14.3 5.76 6.61 8.0231 7.64 — 11.2 — 15.9 — 16.4 16.2 — 4.14 — 9.15
MEAN 7.39 8.49 9.11 12.2 13.8 16.4 18.2 16.9 15.0 10.8 8.90 8.10MAX 7.93 10.9 11.4 13.9 17.0 18.8 19.8 18.8 16.8 14.6 11.8 10.4MIN 6.43 7.27 7.61 10.7 10.7 13.0 15.8 15.3 13.2 4.14 3.78 5.45
1/1
/02
2/1
/02
3/1
/02
4/1
/02
5/1
/02
6/1
/02
7/1
/02
8/1
/02
9/1
/02
10/1
/02
11/1
/02
12/1
/02
1/1
/03
0
5
10
15
20
25
Mea
n D
aily
Tem
per
atu
re (
°C)
32
41
50
59
68
77
(°F
)
State of OregonTemperature Standard
ECMR – 14206365 – Erickson Creek at Menlo Drive at Beaverton, Oregon [RM 0.76]

APPENDIX F—Stream Temperature Records2002 Tualatin River Flow Management Report F-31
JCDV – 14206372 – JOHNSON CREEK AT DAVIS ROAD NEAR BEAVERTON, OREGON [RM 1.3]Latitude: 45 28 30 Longitude: 122 49 52 Source Agency: District 18 Watermaster
Day2002 Mean Daily Water Temperature in Degrees Celsius
JAN FEB MAR APR MAY JUN JUL AUG SEP OCT NOV DEC 1 6.81 7.76 7.29 12.2 15.1 19.5 19.9 22.2 22.2 13.5 5.97 5.01 2 7.96 7.67 6.95 11.9 14.9 19.3 20.4 21.5 22.5 13.7 5.61 5.41 3 7.85 8.30 7.66 12.5 14.1 19.6 20.0 21.6 21.5 13.5 5.88 4.75 4 7.76 7.17 8.04 13.6 13.7 19.8 19.2 21.0 20.6 14.2 6.19 4.80 5 7.93 6.81 8.29 12.6 13.4 20.5 20.2 20.8 19.8 14.9 7.38 5.39 6 8.96 7.53 7.76 12.4 12.6 18.7 22.5 20.5 18.9 14.9 7.41 5.57 7 10.9 7.41 7.26 12.4 12.1 17.3 21.8 20.9 17.8 14.9 8.24 5.23 8 10.5 7.61 6.96 12.8 13.0 16.8 20.2 21.5 17.7 15.3 9.89 4.85 9 9.68 7.84 7.10 13.2 12.8 18.7 21.8 22.7 18.8 16.0 9.99 4.99
10 9.30 8.23 8.20 13.0 12.9 20.4 24.8 23.5 20.2 15.0 9.91 6.7511 9.22 7.73 9.38 13.3 14.7 21.0 24.9 23.0 21.1 13.9 10.3 7.9612 9.16 6.93 8.86 13.6 17.7 23.1 25.2 23.3 21.4 13.0 10.9 9.5313 8.04 6.83 8.69 13.9 16.4 24.6 25.6 24.3 21.4 13.1 11.0 9.6414 7.86 7.57 8.78 13.1 15.3 24.4 24.0 25.2 21.8 12.6 11.3 10.315 6.22 7.88 8.40 11.3 16.1 22.4 23.4 24.8 20.3 12.9 10.3 9.9516 6.12 8.00 7.91 10.5 17.3 20.5 24.5 24.1 19.1 13.3 9.33 9.3717 6.66 7.80 7.45 10.4 15.4 18.3 24.7 23.7 17.2 13.8 9.70 8.9118 7.03 8.79 6.95 10.9 16.8 17.0 24.2 22.6 17.9 13.0 9.28 8.2419 7.52 9.37 7.91 11.3 15.6 17.7 23.0 22.3 17.7 13.8 10.1 8.0720 7.09 9.22 9.65 12.1 14.6 20.0 22.4 21.2 17.5 14.9 10.5 7.9821 7.06 10.6 8.74 12.5 15.4 22.4 23.8 19.1 17.2 14.3 10.3 8.3522 6.43 11.2 8.44 12.1 15.9 22.0 26.1 20.2 17.4 14.5 10.2 8.5123 6.87 10.7 10.1 12.4 15.9 21.5 26.1 22.0 18.1 13.7 10.6 7.7124 7.69 9.46 11.1 12.7 17.5 22.3 26.1 22.8 18.6 12.8 10.1 7.0925 7.91 7.77 11.1 13.9 18.0 24.1 25.2 21.8 18.6 11.5 8.24 7.6026 7.09 7.30 10.4 12.7 19.4 25.3 24.5 21.1 18.3 11.0 6.67 8.1027 6.32 7.25 10.0 12.5 19.6 23.6 23.6 21.3 18.1 9.92 6.08 8.3028 7.08 8.08 9.94 13.7 17.4 20.1 23.6 23.5 18.7 10.4 6.16 8.8829 6.25 — 10.6 14.5 17.7 18.8 24.2 23.3 17.2 9.86 5.67 8.3230 6.61 — 11.6 15.6 18.6 19.2 23.5 21.8 14.5 7.80 5.68 8.1831 7.17 — 12.0 — 18.7 — 21.9 22.0 — 6.41 — 8.97
MEAN 7.71 8.17 8.82 12.7 15.8 20.6 23.3 22.2 19.1 13.0 8.63 7.51MAX 10.9 11.2 12.0 15.6 19.6 25.3 26.1 25.2 22.5 16.0 11.3 10.3MIN 6.12 6.81 6.95 10.4 12.1 16.8 19.2 19.1 14.5 6.41 5.61 4.75
1/1
/02
2/1
/02
3/1
/02
4/1
/02
5/1
/02
6/1
/02
7/1
/02
8/1
/02
9/1
/02
10/1
/02
11/1
/02
12/1
/02
1/1
/03
0
5
10
15
20
25
Mea
n D
aily
Tem
per
atu
re (
°C)
32
41
50
59
68
77(°
F)
State of OregonTemperature Standard
JCDV – 14206372 – Johnson Creek at Davis Road near Beaverton, Oregon [RM 1.3]

APPENDIX F—Stream Temperature RecordsF-32 2002 Tualatin River Flow Management Report
CMMB – 14206395 – CEDAR MILL CREEK AT MURRAY BOULEVARD NEAR BEAVERTON, OREGON [RM 1.64]Latitude: 45 30 37 Longitude: 122 49 18 Source Agency: District 18 Watermaster
Day2002 Mean Daily Water Temperature in Degrees Celsius
JAN FEB MAR APR MAY JUN JUL AUG SEP OCT NOV DEC 1 5.87 6.60 6.52 11.5 13.7 16.6 17.2 18.5 12.8 4.19 4.66 2 6.59 6.47 6.53 11.3 12.9 16.0 17.2 18.3 12.1 3.85 5.59 3 6.50 7.43 7.18 11.8 11.2 16.1 16.8 16.7 12.8 3.86 4.46 4 6.48 6.30 7.53 12.5 10.6 16.7 16.4 16.6 13.5 4.56 5.07 5 6.93 6.28 8.26 12.0 11.0 17.6 16.8 16.4 13.7 6.17 5.60 6 8.16 7.08 7.17 12.0 10.2 15.6 18.2 16.7 15.2 13.7 6.83 5.21 7 10.0 6.63 6.37 11.9 9.64 14.2 18.3 17.3 14.9 13.4 8.03 4.33 8 9.72 6.48 6.05 11.8 10.8 13.7 17.9 18.0 14.6 13.6 9.08 3.95 9 8.73 6.69 6.25 12.4 11.1 14.9 19.2 18.8 15.7 14.2 9.20 4.88
10 8.34 7.04 7.45 12.2 11.3 16.3 20.9 19.5 16.8 12.6 9.01 6.5411 8.21 6.69 8.53 12.4 12.6 17.2 21.2 19.1 17.8 10.8 9.46 7.1512 8.24 6.02 7.82 12.7 14.5 18.8 20.9 19.9 18.4 10.4 10.3 8.5513 7.09 5.69 7.78 13.1 13.8 20.2 21.4 21.2 18.1 10.8 10.3 8.6614 6.94 6.50 7.68 12.2 12.9 19.7 19.7 21.3 18.1 11.3 10.4 9.5115 5.41 6.80 7.31 10.4 13.3 18.1 18.9 20.0 17.2 12.0 9.07 8.9216 5.70 7.24 6.90 9.64 14.0 17.1 19.8 19.5 16.5 12.4 8.21 8.3917 6.05 7.03 6.63 9.55 14.3 15.6 20.0 19.3 15.9 12.3 8.55 7.8618 6.44 8.28 6.16 10.1 14.4 15.6 19.9 18.3 15.1 12.4 8.37 7.4119 6.76 8.73 6.79 10.3 14.0 15.4 19.6 18.3 15.6 13.0 9.58 6.7020 6.60 8.50 8.37 11.2 13.4 17.0 19.0 18.2 15.6 13.8 9.55 6.1421 6.22 9.96 6.88 11.5 13.8 18.8 19.8 16.6 14.9 13.2 9.47 6.7022 5.78 10.5 7.12 11.2 14.0 18.3 21.5 17.0 15.4 12.9 9.68 6.9723 6.00 9.93 8.95 11.2 14.0 17.9 21.5 15.8 12.0 10.1 6.3324 6.74 8.74 9.79 11.9 14.6 18.1 21.5 16.3 11.1 8.92 5.6325 6.90 6.71 9.56 12.8 15.7 19.5 21.0 16.5 9.50 6.42 6.3126 6.09 6.17 9.28 11.1 16.8 20.8 21.0 15.8 8.97 4.99 6.8727 5.27 6.49 9.15 11.4 17.0 19.8 19.2 15.8 8.40 5.37 7.2628 5.70 7.14 9.33 12.2 16.2 17.7 19.3 15.3 9.33 5.68 7.6829 5.07 — 10.2 13.3 16.2 17.0 19.8 14.9 8.66 5.14 7.0530 5.55 — 10.8 13.4 16.2 17.1 19.7 13.1 6.00 5.48 7.0931 6.08 — 10.9 — 16.4 — 17.8 — 4.49 — 7.41
MEAN 6.78 7.29 7.91 11.7 13.6 17.2 19.4 18.4 16.0 11.5 7.66 6.61MAX 10.0 10.5 10.9 13.4 17.0 20.8 21.5 21.3 18.4 14.2 10.4 9.51MIN 5.07 5.69 6.05 9.55 9.64 13.7 16.4 16.4 13.1 4.49 3.85 3.95
1/1
/02
2/1
/02
3/1
/02
4/1
/02
5/1
/02
6/1
/02
7/1
/02
8/1
/02
9/1
/02
10/1
/02
11/1
/02
12/1
/02
1/1
/03
0
5
10
15
20
25
Mea
n D
aily
Tem
per
atu
re (
°C)
32
41
50
59
68
77
(°F
)
State of OregonTemperature Standard
CMMB – 14206395 – Cedar Mill Creek at Murray Boulevard near Beaverton, Oregon [RM 1.64]

APPENDIX F—Stream Temperature Records2002 Tualatin River Flow Management Report F-33
WC143 – 14206410 – WILLOW CREEK AT 143RD AVENUE NEAR BEAVERTON, OREGON [RM 3.5]Latitude: 45 32 12 Longitude: 122 49 24 Source Agency: District 18 Watermaster
Day2002 Mean Daily Water Temperature in Degrees Celsius
JAN FEB MAR APR MAY JUN JUL AUG SEP OCT NOV DEC 1 4.86 5.59 7.16 12.5 15.4 18.9 19.6 20.7 20.2 15.3 3.99 4.89 2 5.61 5.80 7.09 12.6 14.7 18.4 19.8 20.1 20.5 13.4 4.13 5.57 3 5.56 6.73 7.49 12.9 13.6 18.6 19.5 19.8 19.5 14.4 4.62 4.65 4 5.67 6.05 7.94 13.6 13.2 19.4 18.9 19.5 18.1 15.1 5.10 4.99 5 5.97 6.09 8.45 13.7 13.6 20.1 19.4 19.0 17.6 15.2 6.40 5.52 6 7.19 6.32 7.90 13.3 12.8 18.2 21.0 19.0 17.2 15.5 6.91 5.31 7 9.66 6.41 6.94 13.1 12.1 16.8 21.0 19.4 16.7 15.2 7.97 4.54 8 10.2 6.31 6.54 12.8 12.6 16.3 21.4 20.0 16.5 15.4 8.42 4.28 9 9.37 6.41 6.44 14.1 13.2 17.2 21.8 20.7 17.6 15.8 8.65 4.91
10 8.67 6.53 7.08 13.9 13.0 18.8 23.5 21.0 19.0 14.3 8.68 5.5911 8.30 6.59 8.03 13.9 14.3 19.5 23.9 20.7 19.7 12.7 9.38 6.4512 8.10 5.85 8.19 13.8 15.9 20.4 23.7 21.6 20.0 11.9 10.1 7.9113 7.30 5.41 7.75 14.1 16.3 21.2 23.9 22.7 20.0 11.8 10.2 8.5914 6.96 5.96 7.91 13.8 15.4 21.7 22.4 23.0 20.0 12.1 10.5 9.3515 5.69 6.33 7.73 12.2 15.3 20.3 21.8 22.2 19.1 12.6 9.30 8.9116 5.76 6.81 7.48 11.2 15.6 19.3 22.6 21.9 18.4 13.3 8.64 8.6417 5.68 6.56 7.31 11.0 17.0 17.9 22.9 21.4 18.9 13.1 9.12 8.2418 5.78 7.65 6.76 11.4 17.4 18.8 22.8 20.5 17.8 12.8 8.86 7.7019 6.07 8.38 6.95 11.7 16.8 18.0 22.2 20.5 18.0 13.8 9.71 6.6620 6.00 8.43 7.96 12.5 16.9 19.4 21.9 20.2 17.5 14.5 9.99 5.9121 5.86 9.97 7.00 13.2 16.8 20.7 22.7 18.6 16.4 13.9 9.79 6.3522 5.71 10.6 7.03 12.7 16.6 20.3 24.2 19.1 16.6 13.9 9.96 6.6523 5.59 10.5 8.89 12.3 16.3 20.3 24.4 20.5 17.2 13.1 10.2 6.0824 5.96 9.35 10.4 13.2 16.5 20.7 24.6 21.1 17.9 12.0 9.29 5.3825 6.67 7.44 10.4 14.0 17.8 21.8 24.0 20.6 18.0 10.6 7.23 5.9926 6.27 6.63 10.4 13.1 18.7 22.9 23.4 20.4 17.3 10.1 5.80 6.2627 5.41 6.94 10.0 13.7 19.2 22.1 22.1 20.3 17.4 9.28 5.67 6.9828 5.37 7.52 10.2 14.0 19.2 20.3 22.1 21.9 17.1 9.92 5.78 7.4229 4.82 — 10.5 15.0 19.2 21.1 22.5 21.6 17.0 9.28 5.34 7.0730 4.72 — 11.2 15.3 18.9 20.0 22.4 19.8 15.8 6.44 5.57 7.2231 4.99 — 11.8 — 18.8 — 20.6 20.0 — 4.60 — 7.50
MEAN 6.44 7.11 8.29 13.2 15.9 19.6 22.2 20.6 18.1 12.6 7.84 6.50MAX 10.2 10.6 11.8 15.3 19.2 22.9 24.6 23.0 20.5 15.8 10.5 9.35MIN 4.72 5.41 6.44 11.0 12.1 16.3 18.9 18.6 15.8 4.60 3.99 4.28
1/1
/02
2/1
/02
3/1
/02
4/1
/02
5/1
/02
6/1
/02
7/1
/02
8/1
/02
9/1
/02
10/1
/02
11/1
/02
12/1
/02
1/1
/03
0
5
10
15
20
25
Mea
n D
aily
Tem
per
atu
re (
°C)
32
41
50
59
68
77(°
F)
State of OregonTemperature Standard
WC143 – 14206410 – Willow Creek at 143rd Avenue near Beaverton, Oregon [RM 3.5]

APPENDIX F—Stream Temperature RecordsF-34 2002 Tualatin River Flow Management Report
WCHP – 14206413 – WILLOW CREEK AT HERITAGE PARKWAY NEAR BEAVERTON, OREGON [RM 0.75]Latitude: 45 31 12 Longitude: 122 51 35 Source Agency: District 18 Watermaster
Day2002 Mean Daily Water Temperature in Degrees Celsius
JAN FEB MAR APR MAY JUN JUL AUG SEP OCT NOV DEC 1 6.96 12.2 14.6 17.4 18.4 18.7 19.5 13.7 4.36 4.50 2 6.93 6.88 11.9 13.9 16.8 18.1 18.3 18.9 12.7 3.99 5.55 3 7.73 7.47 12.4 13.0 16.7 17.5 17.9 18.2 13.4 4.01 4.65 4 6.74 7.75 13.0 12.4 17.5 17.0 17.8 16.4 14.5 4.62 5.38 5 6.58 8.59 12.5 13.0 18.5 17.7 17.6 15.9 14.6 6.06 6.28 6 7.25 7.61 12.7 12.0 16.1 19.2 17.4 15.8 14.7 6.53 5.40 7 6.91 6.91 12.6 11.4 15.0 18.8 17.7 15.4 13.9 8.22 4.60 8 6.67 6.78 12.2 12.2 14.3 19.4 18.4 14.9 14.2 9.73 4.24 9 7.03 6.96 13.1 11.8 15.9 20.4 19.4 16.1 15.0 9.84 4.80
10 7.38 7.88 13.2 12.2 17.6 21.7 20.4 16.8 13.2 9.66 6.6611 7.08 9.12 13.5 13.6 18.4 22.0 20.0 17.4 11.3 10.2 7.4112 6.57 8.05 13.7 15.5 20.1 21.6 20.8 17.8 10.4 10.8 8.8913 6.22 8.19 13.9 14.7 21.1 22.1 21.8 18.0 10.4 10.8 9.1014 6.81 8.48 13.4 14.3 20.8 20.7 21.7 17.7 10.7 10.8 9.9515 7.26 8.16 11.8 14.3 18.9 19.9 20.6 17.2 11.0 9.81 9.4616 7.46 7.75 10.9 14.5 17.7 20.7 20.2 17.1 11.8 9.10 8.7717 7.43 7.52 10.8 15.5 16.6 20.9 19.6 17.3 11.4 9.31 8.5018 8.53 6.97 11.3 15.2 16.9 20.7 18.7 16.0 11.2 9.04 8.1719 8.96 7.41 11.5 14.8 16.7 20.2 18.6 16.0 12.7 10.1 7.5120 8.91 8.93 12.1 15.1 18.1 20.2 18.5 15.7 13.8 10.1 7.2621 10.4 7.84 12.5 15.2 19.8 21.1 17.3 14.8 13.2 9.68 7.5422 11.1 7.99 12.0 15.2 19.0 22.3 17.9 15.2 12.9 10.1 7.8223 10.6 9.89 11.8 15.2 19.0 22.7 18.8 15.6 11.9 10.6 7.0424 9.31 10.8 12.5 15.3 19.5 22.5 19.3 16.0 10.4 9.54 6.8325 7.46 10.6 13.2 16.3 20.6 21.9 18.7 16.1 8.85 6.93 7.3026 6.91 10.1 12.0 17.8 21.6 21.8 18.8 15.3 8.50 5.53 7.3827 7.10 10.1 12.7 17.6 20.3 20.2 18.9 15.8 7.86 5.54 7.5828 7.66 10.2 13.1 17.9 18.4 20.1 20.5 15.3 9.02 5.57 8.1829 — 10.7 14.0 17.8 18.7 20.8 20.2 15.6 8.76 5.22 7.7530 — 11.5 14.2 17.5 18.6 20.6 18.0 13.9 6.13 5.11 7.5431 — 11.6 — 16.9 — 18.6 18.0 — 4.69 — 7.97
MEAN 7.74 8.57 12.6 14.7 18.2 20.3 19.0 16.4 11.5 8.03 7.10MAX 11.1 11.6 14.2 17.9 21.6 22.7 21.8 19.5 15.0 10.8 9.95MIN 6.22 6.78 10.8 11.4 14.3 17.0 17.3 13.9 4.69 3.99 4.24
1/1
/02
2/1
/02
3/1
/02
4/1
/02
5/1
/02
6/1
/02
7/1
/02
8/1
/02
9/1
/02
10/1
/02
11/1
/02
12/1
/02
1/1
/03
0
5
10
15
20
25
Mea
n D
aily
Tem
per
atu
re (
°C)
32
41
50
59
68
77
(°F
)
State of OregonTemperature Standard
WCHP – 14206413 – Willow Creek at Heritage Parkway near Beaverton, Oregon [RM 0.75]

APPENDIX F—Stream Temperature Records2002 Tualatin River Flow Management Report F-35
BCSR – 14206419 – BRONSON CREEK AT SALTZMAN ROAD NEAR ORENCO, OREGON [RM 5.1]
Latitude: 45 33 19 Longitude: 122 48 25 Source Agency: District 18 Watermaster
Day2002 Mean Daily Water Temperature in Degrees Celsius
JAN FEB MAR APR MAY JUN JUL AUG SEP OCT NOV DEC 1 6.51 6.74 5.53 9.56 11.3 13.2 14.3 10.6 5.96 5.38 2 7.13 6.46 5.76 9.22 10.7 12.3 13.9 5.70 6.07 3 7.12 7.29 5.97 9.51 9.81 12.6 13.6 5.43 5.29 4 6.99 5.93 6.60 10.2 9.16 13.6 13.5 5.61 5.46 5 7.25 6.37 7.61 9.96 9.66 14.3 13.7 6.28 5.93 6 8.02 7.29 6.81 10.3 8.56 12.4 14.8 6.92 5.55 7 9.25 6.95 5.35 10.1 7.96 11.0 15.5 7.58 4.92 8 9.27 6.89 5.27 9.55 8.50 10.6 15.2 8.63 4.80 9 8.33 6.76 5.84 10.7 8.62 11.6 15.7 8.99 5.45
10 8.22 7.11 7.27 10.9 8.92 13.0 17.1 8.89 6.6211 8.12 6.20 8.12 11.2 9.72 13.6 17.4 9.36 7.3112 8.23 5.89 7.29 11.5 11.6 15.3 17.1 10.1 8.5113 6.86 5.53 7.29 12.0 11.3 16.4 17.8 9.94 8.4814 6.72 6.21 7.14 10.5 10.5 16.1 16.1 10.1 9.3715 5.38 6.54 6.73 8.88 9.93 14.8 14.9 8.36 8.6816 5.81 7.11 6.29 8.41 10.7 14.3 15.6 7.54 8.4517 6.16 6.90 5.87 8.13 11.3 13.3 16.4 10.9 8.32 7.6518 6.63 8.21 5.69 8.70 11.3 13.4 16.6 10.9 8.27 7.0819 6.93 8.34 7.06 8.75 11.4 12.6 16.7 11.5 9.39 6.5620 6.84 7.61 8.06 9.20 11.3 14.0 15.6 12.0 9.25 6.2721 6.35 9.45 6.37 9.46 11.2 15.2 16.6 12.5 12.3 9.38 6.6722 6.00 9.89 6.95 9.37 11.2 15.1 12.8 11.8 9.58 6.9023 6.29 9.34 8.37 8.81 11.1 14.9 13.3 11.5 10.0 5.9424 7.08 7.73 8.98 9.58 11.4 14.9 14.0 10.2 8.91 5.6125 7.14 5.97 8.18 10.4 12.5 15.6 14.4 8.50 6.61 6.5626 6.07 5.73 8.13 8.84 13.5 16.6 14.2 8.36 5.40 6.7627 5.59 6.09 7.87 9.39 13.7 16.5 14.1 8.12 5.45 7.6928 5.60 6.31 8.41 9.69 13.5 15.2 13.6 8.92 5.87 7.6229 5.02 — 8.69 10.9 13.7 14.9 13.4 8.83 5.48 6.6930 5.66 — 8.77 11.1 13.4 14.7 11.6 6.86 5.86 7.4431 6.34 — 8.91 — 12.7 — — 6.09 — 7.70
MEAN 6.87 7.03 7.13 9.83 11.0 14.1 15.6 13.4 9.84 7.77 6.76MAX 9.27 9.89 8.98 12.0 13.7 16.6 17.8 14.4 12.3 10.1 9.37MIN 5.02 5.53 5.27 8.13 7.96 10.6 13.5 11.6 6.09 5.40 4.80
1/1
/02
2/1
/02
3/1
/02
4/1
/02
5/1
/02
6/1
/02
7/1
/02
8/1
/02
9/1
/02
10/1
/02
11/1
/02
12/1
/02
1/1
/03
0
5
10
15
20
25
Mea
n D
aily
Tem
per
atu
re (
°C)
32
41
50
59
68
77(°
F)
State of OregonTemperature Standard
BCSR – 14206419 – Bronson Creek at Saltzman Road near Orenco, Oregon [RM 5.1]

APPENDIX F—Stream Temperature RecordsF-36 2002 Tualatin River Flow Management Report
BCBR – 14206423 – BRONSON CREEK AT BRONSON ROAD NEAR ORENCO, OREGON [RM 2.1]Latitude: 45 32 18 Longitude: 122 51 15 Source Agency: District 18 Watermaster
Day2002 Mean Daily Water Temperature in Degrees Celsius
JAN FEB MAR APR MAY JUN JUL AUG SEP OCT NOV DEC 1 5.51 5.95 10.7 13.2 15.8 16.4 16.9 16.2 11.7 4.51 4.41 2 6.17 5.68 12.6 15.1 16.3 16.5 16.4 10.9 4.10 4.97 3 5.55 6.74 11.7 15.2 16.3 16.1 16.5 11.8 3.51 4.67 4 5.48 5.41 11.7 11.1 15.9 15.8 16.2 15.1 12.5 3.63 4.78 5 6.16 5.26 11.5 11.7 17.0 15.8 15.8 14.2 13.0 4.75 5.53 6 7.58 6.13 11.0 10.6 15.1 16.9 15.4 13.7 13.2 5.81 5.01 7 9.92 6.39 11.2 9.66 13.5 17.5 15.4 13.3 12.7 7.09 4.31 8 9.52 5.94 10.6 10.4 12.8 17.4 15.8 13.0 12.7 8.70 3.70 9 7.98 5.96 12.0 10.7 13.5 17.8 16.5 13.6 13.4 8.91 4.24
10 7.57 6.26 11.8 10.3 15.3 19.3 17.4 14.3 12.3 8.82 5.8211 7.42 5.92 12.2 11.5 16.1 19.9 17.3 14.9 10.6 9.20 6.6412 7.45 5.16 12.6 13.7 17.7 19.6 18.0 15.4 9.74 9.90 7.8613 6.20 4.61 13.0 14.0 18.6 20.3 19.1 15.5 9.60 9.81 8.4014 5.92 5.25 12.1 12.2 18.9 19.1 19.4 15.5 9.56 9.89 9.1415 4.13 5.96 10.3 12.4 17.6 18.1 18.5 15.4 9.93 8.96 8.9616 4.33 6.52 9.45 12.9 16.7 18.3 17.9 15.4 10.5 8.31 8.2317 4.96 6.12 8.33 13.7 15.2 18.8 17.7 15.3 10.4 8.35 7.7918 5.61 7.49 9.13 13.8 14.9 18.9 16.8 14.1 10.1 8.15 7.4019 6.02 9.52 13.6 14.5 19.1 16.6 13.8 11.1 9.00 6.7420 6.00 10.3 13.0 15.8 18.3 16.7 13.8 12.4 8.99 6.2021 5.75 10.9 13.1 17.5 18.6 15.8 13.2 12.3 8.87 6.7222 5.18 10.4 13.5 17.7 19.6 15.7 13.5 11.8 9.05 6.8923 5.26 8.71 10.1 13.4 17.3 20.3 16.3 13.8 11.1 9.64 6.0024 6.21 9.74 10.9 13.6 17.3 20.4 16.9 14.0 9.79 8.98 5.6225 6.77 9.09 11.8 14.8 18.1 20.1 17.1 14.3 8.31 6.97 6.2226 5.54 8.46 10.6 15.8 19.3 20.1 17.3 13.9 7.51 5.25 6.6827 4.59 8.36 10.2 16.1 19.1 18.9 16.9 14.2 7.22 4.86 6.9428 4.88 8.82 10.9 15.7 17.5 18.3 17.8 13.7 8.06 5.05 7.3329 3.97 — 9.25 12.1 15.5 16.3 18.6 18.0 13.8 8.25 4.71 6.6530 4.46 — 9.93 12.7 15.5 16.6 18.8 16.5 12.5 6.54 4.72 6.8931 5.29 — 10.0 — 15.6 — 17.2 16.0 — 4.90 — 7.09
MEAN 6.04 5.93 9.15 11.0 13.1 16.4 18.4 16.9 14.4 10.4 7.28 6.38MAX 9.92 7.49 10.0 13.0 16.1 19.3 20.4 19.4 16.5 13.4 9.90 9.14MIN 3.97 4.61 8.36 8.33 9.66 12.8 15.8 15.4 12.5 4.90 3.51 3.70
1/1
/02
2/1
/02
3/1
/02
4/1
/02
5/1
/02
6/1
/02
7/1
/02
8/1
/02
9/1
/02
10/1
/02
11/1
/02
12/1
/02
1/1
/03
0
5
10
15
20
25
Mea
n D
aily
Tem
per
atu
re (
°C)
32
41
50
59
68
77
(°F
)
State of OregonTemperature Standard
BCBR – 14206423 – Bronson Creek at Bronson Road near Orenco, Oregon [RM 2.1]

APPENDIX F—Stream Temperature Records2002 Tualatin River Flow Management Report F-37
BVTS – 14206435 – BEAVERTON CREEK AT 216TH NEAR ORENCO, OREGON [RM 1.2]Latitude: 45 31 15 Longitude: 122 53 59 Source Agency: District 18 Watermaster
Day2002 Mean Daily Water Temperature in Degrees Celsius
JAN FEB MAR APR MAY JUN JUL AUG SEP OCT NOV DEC 1 5.89 5.92 6.68 11.1 13.9 17.3 17.8 18.7 18.3 12.9 4.74 4.00 2 6.08 6.22 6.38 11.1 13.6 16.9 18.1 18.1 18.3 12.0 4.14 4.49 3 6.25 6.73 6.62 11.4 12.9 16.8 18.1 17.8 18.3 12.8 3.60 4.14 4 6.30 6.55 7.02 12.1 12.2 17.2 17.3 17.5 16.9 13.3 3.67 4.18 5 6.44 6.03 7.64 12.4 12.2 18.0 17.1 17.0 16.1 13.7 4.52 4.89 6 6.92 6.26 7.32 11.7 11.7 16.7 18.4 16.9 15.5 14.0 5.35 4.69 7 8.89 6.57 6.39 11.8 10.8 15.1 19.1 17.0 14.9 13.6 6.38 4.03 8 9.44 5.63 6.17 11.6 11.1 14.0 18.4 17.7 14.4 13.5 8.29 3.41 9 8.80 6.07 6.16 12.4 11.7 14.5 18.8 18.7 15.2 14.1 8.96 3.64
10 8.21 6.41 6.62 12.2 11.3 16.5 20.7 19.8 16.2 13.2 8.96 5.0811 8.02 6.54 7.77 12.4 12.2 17.7 21.6 19.5 16.9 11.6 9.17 6.3912 7.89 6.11 7.87 12.6 14.1 19.3 21.6 20.1 17.4 10.5 9.67 7.5213 7.34 5.67 7.54 12.9 15.0 20.7 22.1 21.1 17.8 10.3 10.0 8.1314 6.90 5.88 7.73 12.9 13.6 20.8 21.0 21.6 17.8 10.2 10.1 8.5115 5.97 6.37 7.62 11.9 13.6 19.3 20.2 20.7 17.4 10.3 9.69 8.7416 5.44 6.69 7.14 10.6 14.1 18.0 20.4 20.0 16.8 11.0 8.75 7.9817 5.68 6.73 6.92 10.2 14.4 16.4 20.7 19.8 16.4 11.1 8.72 7.7218 5.94 7.22 6.57 10.3 14.9 15.7 20.6 18.8 15.7 10.9 8.54 7.4219 6.31 7.96 6.37 10.5 14.8 15.7 20.4 18.5 15.6 11.6 9.05 7.0620 6.25 8.05 7.33 10.9 14.1 17.0 19.7 18.4 15.6 12.7 9.33 6.5421 6.17 8.85 7.74 11.7 14.2 19.0 20.6 17.3 14.7 12.8 9.22 6.6622 5.54 9.75 7.11 11.6 14.3 19.4 21.7 17.1 14.7 12.5 9.31 6.9223 5.50 9.77 8.10 11.2 14.4 18.7 22.3 18.1 15.0 11.8 9.65 6.8024 6.08 9.08 9.53 11.6 14.7 18.7 22.3 18.8 15.5 10.8 9.18 6.0925 6.35 7.81 9.59 12.7 15.9 19.7 21.9 18.8 15.7 9.32 7.40 6.1726 6.08 6.67 9.65 12.3 17.0 20.9 21.5 18.5 15.3 8.58 5.68 6.5827 5.15 6.46 9.38 11.5 17.7 20.8 20.1 18.4 15.6 7.94 4.89 6.5728 5.09 6.82 9.36 11.8 17.0 18.9 19.8 19.7 15.1 8.33 4.72 7.0829 4.99 — 9.49 13.0 16.7 17.4 20.2 20.2 15.1 8.37 4.39 7.0930 5.05 — 10.2 13.8 16.9 18.0 20.4 18.4 13.7 7.00 4.22 6.7431 5.45 — 10.9 — 16.9 — 18.7 17.9 — 5.47 — 6.78
MEAN 6.46 6.96 7.77 11.8 14.1 17.8 20.1 18.7 16.1 11.2 7.34 6.19MAX 9.44 9.77 10.9 13.8 17.7 20.9 22.3 21.6 18.3 14.1 10.1 8.74MIN 4.99 5.63 6.16 10.2 10.8 14.0 17.1 16.9 13.7 5.47 3.60 3.41
1/1
/02
2/1
/02
3/1
/02
4/1
/02
5/1
/02
6/1
/02
7/1
/02
8/1
/02
9/1
/02
10/1
/02
11/1
/02
12/1
/02
1/1
/03
0
5
10
15
20
25
Mea
n D
aily
Tem
per
atu
re (
°C)
32
41
50
59
68
77(°
F)
State of OregonTemperature Standard
BVTS – 14206435 – Beaverton Creek at 216th near Orenco, Oregon [RM 1.2]

APPENDIX F—Stream Temperature RecordsF-38 2002 Tualatin River Flow Management Report
DCBR – 14206443 – DAWSON CREEK AT BROOKWOOD ROAD NEAR HILLSBORO, OREGON [RM 0.7]Latitude: 45 31 27 Longitude:122 56 01 Source Agency: District 18 Watermaster
Day2002 Mean Daily Water Temperature in Degrees Celsius
JAN FEB MAR APR MAY JUN JUL AUG SEP OCT NOV DEC 1 5.62 6.07 6.31 10.8 13.6 17.0 17.5 17.9 17.2 11.3 3.86 3.12 2 6.25 6.40 6.26 10.5 13.3 16.4 17.8 17.3 17.3 11.0 3.09 3.88 3 6.03 7.01 6.83 11.0 12.3 16.2 17.4 17.1 17.6 11.8 3.04 3.30 4 6.18 5.92 7.19 11.8 11.8 16.6 16.7 17.0 15.8 12.8 3.47 4.26 5 6.39 5.71 7.92 11.4 12.0 17.7 16.9 16.7 15.0 13.2 4.69 5.01 6 7.20 6.32 6.75 11.4 11.2 16.2 18.4 16.4 14.4 13.4 5.27 4.23 7 9.75 5.93 5.66 11.8 10.1 14.3 18.5 16.2 13.6 13.1 6.69 3.26 8 9.24 5.21 5.61 11.4 10.9 12.9 17.5 16.8 13.3 12.8 8.98 2.79 9 7.98 5.92 5.91 12.2 11.3 13.7 18.4 17.8 13.8 13.3 8.63 3.10
10 7.77 6.39 7.03 12.0 11.0 16.4 20.7 18.7 14.6 12.2 8.40 5.22 11 7.77 6.00 8.02 12.7 12.4 17.4 21.3 18.3 15.3 10.6 8.75 6.01 12 7.58 5.61 7.54 13.0 14.3 18.9 21.2 18.9 15.7 9.45 9.63 7.72 13 6.46 5.38 7.58 13.3 14.2 20.1 21.8 19.7 15.7 8.96 9.32 7.68 14 6.31 6.02 7.61 12.5 12.9 19.9 20.2 20.0 15.8 8.75 9.34 8.52 15 5.04 6.58 7.31 10.7 13.4 18.2 19.3 19.0 15.6 8.99 8.17 8.04 16 5.35 6.66 6.83 9.86 13.8 16.6 19.8 18.6 15.5 9.56 7.60 7.31 17 5.72 6.58 6.92 9.95 13.5 14.9 19.9 18.4 15.3 9.47 7.82 6.94 18 6.21 7.76 6.31 10.3 14.2 14.7 19.9 17.5 14.6 9.53 7.60 6.43 19 6.26 7.99 6.74 10.5 14.0 15.1 19.5 17.3 14.3 10.8 8.53 6.07 20 5.80 7.87 8.33 11.3 13.6 16.9 18.9 17.5 14.1 11.8 8.81 5.89 21 5.49 9.41 7.44 11.7 13.7 18.9 19.7 16.4 13.2 11.7 8.46 6.46 22 4.71 10.2 7.51 10.9 14.1 18.6 20.9 16.0 13.2 11.2 8.57 6.51 23 5.27 9.59 9.41 10.9 13.8 17.9 21.3 17.1 13.2 10.3 9.09 5.71 24 6.36 8.33 10.2 11.8 14.4 18.4 21.3 17.5 13.7 9.09 8.53 5.23 25 6.15 6.61 9.71 12.4 15.6 19.7 20.7 17.6 13.7 7.86 6.17 5.79 26 5.04 6.27 9.33 11.2 16.6 20.9 20.5 17.8 13.5 7.26 4.39 6.19 27 4.18 6.33 9.11 11.1 17.0 20.0 19.3 17.4 13.9 6.81 3.73 6.08 28 5.07 7.02 9.40 11.7 15.9 17.2 19.2 18.8 13.3 7.43 3.64 6.69 29 4.53 — 9.67 13.1 16.5 16.7 19.5 19.7 13.7 7.16 3.53 5.96 30 5.06 — 10.5 13.4 16.3 17.2 19.6 17.5 12.3 5.27 3.40 6.24 31 5.76 — 11.0 — 16.8 — 18.0 17.0 — 4.07 — 6.49
MEAN 6.21 6.82 7.80 11.6 13.7 17.2 19.4 17.7 14.6 10.0 6.71 5.68MAX 9.75 10.2 11.0 13.4 17.0 20.9 21.8 20.0 17.6 13.4 9.63 8.52MIN 4.18 5.21 5.61 9.86 10.1 12.9 16.7 16.0 12.3 4.07 3.04 2.79
1/1
/02
2/1
/02
3/1
/02
4/1
/02
5/1
/02
6/1
/02
7/1
/02
8/1
/02
9/1
/02
10/1
/02
11/1
/02
12/1
/02
1/1
/03
0
5
10
15
20
25
Mea
n D
aily
Tem
per
atu
re (
°C)
32
41
50
59
68
77
(°F
)
State of OregonTemperature Standard
DCBR – 14206443 – Dawson Creek at Brookwood Road near Hillsboro, Oregon [RM 0.7]

APPENDIX F—Stream Temperature Records2002 Tualatin River Flow Management Report F-39
RCTV – 14206450 – ROCK CREEK AT HWY 8 NEAR HILLSBORO, OREGON [RM 1.2]Latitude: 45 30 08 Longitude: 122 56 52 Source Agency: District 18 Watermaster
Day2002 Mean Daily Water Temperature in Degrees Celsius
JAN FEB MAR APR MAY JUN JUL AUG SEP OCT NOV DEC 1 6.25 5.98 6.53 11.3 14.3 17.0 18.0 18.4 18.2 12.9 4.44 3.55 2 6.61 6.34 6.27 11.2 13.9 16.6 17.9 17.9 18.3 12.1 3.73 4.28 3 6.54 6.77 6.56 11.7 13.1 16.5 18.0 17.7 18.1 12.5 3.33 4.01 4 6.45 6.75 7.02 12.4 12.3 17.0 17.3 17.5 16.8 13.5 3.48 4.28 5 6.65 6.08 7.85 12.6 12.4 17.8 17.1 16.9 15.9 13.9 4.41 6 7.55 6.34 7.70 12.2 11.7 16.7 18.3 16.7 15.2 14.1 5.39 7 9.98 6.93 6.64 12.4 10.7 15.2 19.1 16.7 14.5 13.8 6.61 8 10.3 6.07 6.11 11.9 11.0 14.0 18.4 17.4 14.1 13.6 8.67 9 9.43 6.27 6.06 12.8 11.6 14.2 18.9 18.4 14.7 14.0 9.60
10 8.74 6.60 6.87 13.0 11.2 15.8 20.6 19.6 15.8 13.2 9.5511 8.28 6.74 8.54 13.2 12.3 17.0 21.7 19.6 16.7 11.6 9.6112 8.01 6.12 8.58 13.4 14.0 18.5 21.7 19.9 17.2 10.3 10.213 7.60 5.65 8.00 13.7 14.9 20.0 22.4 20.7 17.6 9.86 10.414 7.00 5.75 7.95 13.6 13.7 20.5 21.1 21.4 17.6 9.72 10.615 6.10 6.35 7.78 12.2 13.5 19.2 19.8 20.7 17.3 9.98 9.9416 5.25 6.97 7.25 10.8 13.9 17.9 20.1 20.0 16.8 10.5 9.0117 5.41 7.02 6.96 10.2 14.4 16.6 20.5 19.8 16.3 10.8 8.7018 5.92 7.53 6.58 10.7 14.9 15.9 20.4 18.8 15.7 10.7 8.6719 6.53 8.57 6.75 10.7 14.9 15.8 20.3 18.5 15.4 11.3 9.2420 6.48 8.53 7.73 11.2 14.2 16.8 19.7 18.1 15.6 12.6 9.5521 6.42 9.39 8.09 11.9 14.3 18.6 20.4 17.0 14.6 12.9 9.3822 5.68 10.4 7.30 11.7 14.4 19.2 21.5 16.9 14.4 12.5 9.4923 5.60 10.6 8.35 11.3 14.3 18.5 22.1 17.8 14.6 11.7 9.9624 6.22 9.62 9.93 11.9 14.6 18.6 22.0 18.6 15.2 10.4 9.5625 7.05 7.78 10.1 12.8 15.6 19.6 21.7 18.8 15.4 9.03 7.3326 6.43 6.59 9.95 12.2 16.7 20.9 21.3 18.5 15.0 8.15 5.2927 5.39 6.31 9.63 11.8 17.5 20.8 20.0 18.4 15.3 7.60 4.5828 5.14 6.82 9.66 12.2 17.2 18.8 19.7 19.4 14.9 7.93 4.4329 4.97 — 9.80 13.4 17.1 17.6 20.0 20.0 14.8 8.21 4.1030 4.83 — 10.5 14.2 17.1 18.3 20.3 18.5 13.7 6.87 3.9031 5.17 — 11.3 — 16.9 — 18.7 17.8 — 5.08 —
MEAN 6.71 7.17 8.01 12.2 14.1 17.7 20.0 18.6 15.9 11.0 7.44 4.03MAX 10.3 10.6 11.3 14.2 17.5 20.9 22.4 21.4 18.3 14.1 10.6 4.28MIN 4.83 5.65 6.06 10.2 10.7 14.0 17.1 16.7 13.7 5.08 3.33 3.55
1/1
/02
2/1
/02
3/1
/02
4/1
/02
5/1
/02
6/1
/02
7/1
/02
8/1
/02
9/1
/02
10/1
/02
11/1
/02
12/1
/02
1/1
/03
0
5
10
15
20
25
Mea
n D
aily
Tem
per
atu
re (
°C)
32
41
50
59
68
77(°
F)
State of OregonTemperature Standard
RCTV – 14206450 – Rock Creek at Hwy 8 near Hillsboro, Oregon [RM 1.2]

APPENDIX F—Stream Temperature RecordsF-40 2002 Tualatin River Flow Management Report
FRMO – 14206500 – TUALATIN RIVER AT FARMINGTON, OREGON [RM 33.3]Latitude: 45 26 58 Longitude: 122 57 02 Source Agency: District 18 Watermaster
Day2002 Mean Daily Water Temperature in Degrees Celsius
JAN FEB MAR APR MAY JUN JUL AUG SEP OCT NOV DEC 1 6.18 5.41 6.68 10.1 13.1 16.9 16.6 19.3 17.7 15.0 9.34 7.57 2 6.58 5.83 6.62 10.1 13.3 17.1 16.8 18.8 17.3 14.5 8.60 7.88 3 6.86 6.31 6.50 10.3 13.0 17.3 17.1 18.7 17.2 14.6 8.27 7.58 4 7.03 6.62 6.75 10.8 12.6 17.5 17.3 18.7 16.8 14.5 8.44 7.82 5 7.18 6.38 7.22 11.2 12.1 17.9 17.2 17.9 16.6 14.8 8.69 6 7.38 6.18 7.63 11.2 11.7 17.6 17.5 17.4 16.2 15.5 9.07 7 8.77 6.46 7.38 10.7 11.0 16.5 18.0 17.6 15.7 15.8 9.65 8 9.94 6.58 6.75 10.8 11.0 15.7 18.0 18.3 15.0 15.9 10.1 9 9.57 6.14 6.11 11.2 11.1 15.4 17.8 19.0 14.9 16.3 10.2
10 8.93 6.32 6.33 11.9 11.2 16.0 18.8 19.7 15.6 15.8 10.211 8.43 6.46 7.32 11.9 12.0 16.7 20.3 20.0 16.5 14.7 10.112 8.07 6.34 8.23 11.9 13.0 18.0 21.0 20.0 17.1 13.9 10.613 7.74 5.94 7.82 11.7 13.9 19.4 21.2 19.9 17.6 13.4 10.814 7.36 6.02 7.61 12.0 13.9 19.7 20.5 20.7 17.7 13.2 11.015 6.65 6.40 7.43 11.1 13.9 18.4 20.0 21.0 17.6 13.4 10.616 6.06 6.75 7.24 9.61 13.6 17.2 19.8 20.8 17.2 13.7 10.217 5.86 6.93 6.95 9.27 14.1 16.0 20.1 19.9 16.9 13.8 10.518 6.02 7.11 6.65 9.20 14.6 15.1 20.3 19.1 16.5 13.8 10.419 6.31 7.75 6.53 9.37 14.7 14.9 20.1 18.5 16.4 14.0 10.520 6.54 8.09 7.08 9.80 14.7 15.6 19.3 18.0 16.6 14.6 10.821 6.44 8.05 7.67 10.2 14.4 17.3 19.4 17.4 16.4 14.9 10.322 6.09 8.46 7.63 10.4 14.2 18.2 20.0 17.1 16.4 15.0 10.623 5.57 9.26 7.89 10.0 14.2 18.5 20.7 17.5 16.5 14.5 11.324 5.90 9.38 8.93 10.4 14.5 18.8 21.1 18.2 16.8 13.7 11.425 6.70 8.21 9.45 11.0 15.0 19.1 20.8 18.7 17.2 12.8 10.726 6.68 6.97 9.59 11.2 15.9 20.0 20.2 18.7 17.1 12.1 9.6327 5.67 6.45 9.12 11.3 16.8 20.0 19.7 18.3 17.2 11.4 8.9528 5.27 6.60 8.65 11.3 16.9 18.4 19.7 18.6 16.9 11.7 8.6429 4.97 — 9.05 11.8 17.0 17.1 19.5 19.2 16.9 11.8 8.1430 4.86 — 9.53 12.5 16.7 16.5 19.5 18.7 16.1 11.0 7.7731 4.98 — 9.63 — 16.6 — 19.3 18.1 — 9.95 —
MEAN 6.79 6.91 7.68 10.8 13.9 17.4 19.3 18.8 16.7 13.9 9.85 7.71MAX 9.94 9.38 9.63 12.5 17.0 20.0 21.2 21.0 17.7 16.3 11.4 7.88MIN 4.86 5.41 6.11 9.20 11.0 14.9 16.6 17.1 14.9 9.95 7.77 7.57
1/1
/02
2/1
/02
3/1
/02
4/1
/02
5/1
/02
6/1
/02
7/1
/02
8/1
/02
9/1
/02
10/1
/02
11/1
/02
12/1
/02
1/1
/03
0
5
10
15
20
25
Mea
n D
aily
Tem
per
atu
re (
°C)
32
41
50
59
68
77
(°F
)
State of OregonTemperature Standard
FRMO – 14206500 – Tualatin River at Farmington, Oregon [RM 33.3]

APPENDIX F—Stream Temperature Records2002 Tualatin River Flow Management Report F-41
BCHH – BURRIS CREEK AT HWY 219 [RM 0.38]Latitude: 45 25 34 Longitude: 122 57 40 Source Agency: District 18 Watermaster
Day2002 Mean Daily Water Temperature in Degrees Celsius
JAN FEB MAR APR MAY JUN JUL AUG SEP OCT NOV DEC 1 6.40 7.23 6.06 9.80 12.2 15.1 15.8 15.8 15.2 11.1 4.69 4.37 2 7.15 7.15 5.75 9.61 12.0 14.5 15.6 15.3 15.2 10.2 4.10 4.70 3 7.08 7.64 5.98 9.73 11.6 14.4 15.4 16.0 15.3 10.4 3.95 4.70 4 7.27 6.80 6.37 10.2 10.9 15.2 15.0 15.3 14.5 11.4 3.86 4.63 5 7.33 6.49 7.48 10.4 11.0 16.0 14.8 15.1 13.7 12.0 4.32 5.31 6 8.18 7.21 7.44 10.3 10.7 14.5 15.5 14.8 12.8 12.4 5.15 4.98 7 10.5 7.26 6.35 10.7 9.79 13.5 16.0 14.5 12.4 12.1 7.00 4.48 8 10.1 6.85 5.95 10.2 9.81 12.6 16.4 14.6 12.0 12.0 7.93 3.94 9 8.98 7.29 6.04 11.0 9.96 12.9 16.5 15.0 12.2 12.3 8.37
10 8.61 7.44 7.16 11.5 10.2 13.7 17.4 15.7 12.5 11.9 8.7211 8.57 7.10 8.44 11.9 10.7 14.4 18.2 15.9 13.1 10.6 8.9212 8.44 6.57 8.26 11.9 11.7 15.6 18.2 16.2 13.5 9.38 9.3113 7.54 6.22 8.04 12.3 12.2 16.6 18.6 16.6 13.9 8.72 9.5714 7.24 6.48 7.95 12.1 11.9 17.0 18.3 17.1 14.0 8.48 9.6015 6.11 6.54 7.79 10.6 11.6 16.5 17.1 16.8 14.0 8.48 9.0016 6.15 7.11 7.35 9.88 11.7 16.0 17.1 16.4 14.2 8.79 8.4317 6.53 6.80 7.02 9.48 12.4 14.9 17.4 16.2 14.3 8.94 8.3918 6.79 7.67 6.62 9.35 12.8 14.5 17.6 15.5 13.6 8.84 8.2619 7.00 8.40 7.51 9.77 12.8 13.9 18.0 15.4 13.1 9.50 8.6120 6.64 8.01 8.75 9.96 12.6 14.5 17.7 15.3 13.0 10.4 9.0521 6.76 9.25 8.36 10.4 12.3 15.7 17.7 14.8 12.5 10.9 8.7022 6.26 9.93 7.95 10.2 12.6 16.1 18.3 14.6 12.3 11.1 8.7923 6.63 10.0 8.86 9.80 12.5 16.2 18.6 14.8 12.2 10.7 9.2924 7.54 8.83 9.53 10.1 12.6 16.4 18.7 15.1 12.5 9.80 9.1325 7.55 7.05 9.04 10.5 13.5 16.7 18.6 15.3 12.5 8.53 7.7126 6.84 6.58 8.93 10.2 14.6 17.4 18.6 15.8 12.3 7.64 6.0827 6.00 6.38 8.80 10.2 15.0 17.7 17.7 15.8 12.7 7.06 5.3528 6.60 6.69 8.98 10.3 14.9 16.8 17.2 16.0 12.5 7.23 5.1529 6.03 — 9.22 11.0 15.0 16.2 17.3 16.3 12.5 7.55 4.8330 6.28 — 9.60 11.7 14.8 15.8 17.4 15.6 12.1 6.74 4.6431 6.80 — 9.70 — 14.8 — 16.5 15.2 — 5.50 —
MEAN 7.29 7.39 7.78 10.5 12.3 15.4 17.2 15.6 13.2 9.70 7.23 4.64MAX 10.5 10.0 9.70 12.3 15.0 17.7 18.7 17.1 15.3 12.4 9.60 5.31MIN 6.00 6.22 5.75 9.35 9.79 12.6 14.8 14.5 12.0 5.50 3.86 3.94
1/1
/02
2/1
/02
3/1
/02
4/1
/02
5/1
/02
6/1
/02
7/1
/02
8/1
/02
9/1
/02
10/1
/02
11/1
/02
12/1
/02
1/1
/03
0
5
10
15
20
25
Mea
n D
aily
Tem
per
atu
re (
°C)
32
41
50
59
68
77(°
F)
State of OregonTemperature Standard
BCHH – Burris Creek at Hwy 219 [RM 0.38]

APPENDIX F—Stream Temperature RecordsF-42 2002 Tualatin River Flow Management Report
MCMR – MCFEE CREEK AT MIDWAY ROAD [RM 2.04]Latitude: 45 24 19 Longitude: 122 57 37 Source Agency: District 18 Watermaster
Day2002 Mean Daily Water Temperature in Degrees Celsius
JAN FEB MAR APR MAY JUN JUL AUG SEP OCT NOV DEC 1 6.43 7.18 5.68 9.09 12.0 15.2 16.0 17.0 16.6 11.3 3.98 3.60 2 6.94 6.86 5.50 9.00 11.6 14.6 16.2 16.5 16.7 10.5 2.89 4.13 3 7.13 7.64 5.71 9.34 10.7 14.6 16.1 16.4 16.7 11.2 2.53 3.85 4 7.22 6.39 6.13 9.90 9.94 15.2 15.5 16.0 15.1 12.1 2.90 3.95 5 7.24 6.31 7.37 9.90 10.3 16.4 15.2 15.5 14.2 12.8 3.85 4.55 6 7.65 7.13 7.22 10.0 9.75 15.1 16.5 15.3 13.7 13.2 5.23 7 9.65 7.32 5.95 10.4 8.78 13.5 17.3 15.5 13.3 12.9 6.35 8 9.53 7.34 5.50 9.80 9.10 12.3 17.2 16.0 13.0 12.8 7.81 9 8.78 7.26 5.72 10.9 9.62 12.9 17.3 16.9 13.7 13.3 8.38
10 8.59 7.36 7.06 11.0 9.45 14.3 18.9 17.9 14.4 12.3 8.5011 8.50 6.89 8.28 11.3 10.8 15.3 19.8 17.7 15.3 10.7 9.0312 8.42 6.18 7.90 11.4 12.2 16.6 20.0 18.1 15.8 9.55 9.4713 7.18 6.04 7.68 12.0 12.6 17.9 20.6 18.7 16.0 9.03 9.5414 7.08 6.49 7.54 11.6 11.5 18.1 19.5 19.3 16.0 8.90 9.4515 5.82 6.34 7.33 9.49 11.5 17.2 18.0 18.4 15.7 9.14 8.8716 6.03 6.84 6.85 8.90 11.8 16.3 18.4 17.7 15.5 9.66 8.0517 6.43 6.58 6.41 8.26 12.5 14.9 18.8 17.5 15.0 9.88 7.8218 6.67 7.76 6.02 8.51 12.8 14.3 18.9 16.7 14.3 9.85 7.6319 6.92 8.43 7.37 8.99 12.6 14.0 18.8 16.4 14.1 10.5 8.4620 6.54 7.65 8.43 9.21 12.1 15.0 18.2 16.6 14.2 11.5 8.9121 6.60 9.08 7.70 9.56 11.7 16.7 19.2 15.5 13.3 12.0 8.6922 6.11 9.58 7.50 9.38 12.4 17.0 20.0 15.7 13.2 11.8 8.6823 6.57 9.70 8.65 9.10 12.1 16.7 20.5 16.5 13.4 11.0 9.1024 7.43 8.20 9.22 9.44 12.6 17.0 20.5 17.0 13.9 9.50 8.8025 7.65 6.44 8.52 10.2 13.8 17.7 20.1 17.1 14.1 8.24 7.0426 7.04 6.14 8.10 9.53 14.8 18.9 19.7 17.4 13.7 7.53 5.2027 6.46 5.90 8.05 9.44 15.4 18.9 18.4 17.0 14.0 7.05 4.4028 6.80 6.50 8.52 9.93 14.7 17.3 18.4 17.7 13.7 7.27 4.2529 5.97 — 8.63 11.1 14.7 16.1 18.6 18.3 13.7 7.41 4.0730 6.36 — 9.20 11.7 14.8 16.2 18.8 16.6 12.7 6.17 3.8931 6.72 — 9.23 — 14.9 — 17.1 16.1 — 4.73 —
MEAN 7.18 7.20 7.39 9.95 12.0 15.9 18.3 16.9 14.5 10.1 6.79 4.02MAX 9.65 9.70 9.23 12.0 15.4 18.9 20.6 19.3 16.7 13.3 9.54 4.55MIN 5.82 5.90 5.50 8.26 8.78 12.3 15.2 15.3 12.7 4.73 2.53 3.60
1/1
/02
2/1
/02
3/1
/02
4/1
/02
5/1
/02
6/1
/02
7/1
/02
8/1
/02
9/1
/02
10/1
/02
11/1
/02
12/1
/02
1/1
/03
0
5
10
15
20
25
Mea
n D
aily
Tem
per
atu
re (
°C)
32
41
50
59
68
77
(°F
)
State of OregonTemperature Standard
MCMR – McFee Creek at Midway Road [RM 2.04]

APPENDIX F—Stream Temperature Records2002 Tualatin River Flow Management Report F-43
ELSN – 14206600 – TUALATIN RIVER AT ELSNER ROAD NEAR SHERWOOD, OREGON [RM 16.2]Latitude: 45 23 17 Longitude: 122 51 03 Source Agency: District 18 Watermaster
Day2002 Mean Daily Water Temperature in Degrees Celsius
JAN FEB MAR APR MAY JUN JUL AUG SEP OCT NOV DEC 1 5.70 5.10 6.54 10.0 12.9 18.0 18.4 21.6 20.1 15.9 8.68 7.25 2 6.22 5.57 6.57 10.3 13.2 17.9 18.0 21.3 20.0 15.3 8.27 7.07 3 6.52 6.07 6.65 10.5 13.4 17.9 18.0 21.0 19.8 15.0 7.84 6.72 4 6.83 6.35 6.58 10.7 13.3 18.1 18.0 20.6 19.3 14.7 7.56 6.50 5 6.94 6.46 6.88 11.0 13.1 18.4 18.2 20.2 18.8 14.5 7.48 6 7.22 6.32 7.13 11.2 12.7 18.3 18.6 20.0 18.1 14.6 7.52 7 8.25 6.22 7.30 11.4 12.0 18.0 19.0 19.9 17.5 14.7 7.74 8 9.53 6.53 7.20 11.3 11.9 17.7 19.1 19.8 17.0 14.7 8.03 9 9.76 6.44 6.80 11.3 11.7 17.4 19.5 19.9 16.8 14.9 8.51
10 9.17 6.27 6.38 11.5 11.5 17.4 20.0 20.3 16.7 15.0 9.1311 8.63 6.35 6.86 12.0 11.9 17.5 20.6 20.5 16.8 14.6 9.9012 8.26 6.31 7.74 12.3 12.7 18.1 21.1 20.7 16.8 14.3 10.113 7.82 6.12 8.11 12.2 13.4 18.8 21.5 20.9 17.1 13.9 10.214 7.47 5.93 7.75 12.1 13.7 19.5 21.9 21.5 17.4 13.5 10.215 6.90 6.10 7.51 11.9 14.0 19.9 22.0 21.8 17.6 13.1 10.216 6.30 6.55 7.34 11.0 14.4 19.9 22.4 22.0 17.7 12.8 10.217 5.88 6.73 7.08 9.75 14.9 19.5 22.6 22.0 17.6 12.8 10.118 5.85 6.99 6.77 9.45 15.1 18.3 22.5 21.8 17.4 12.6 9.9219 6.08 7.35 6.59 9.55 14.9 17.2 22.2 21.6 17.3 12.8 9.9020 6.32 7.85 6.86 9.80 14.9 16.8 22.0 21.3 17.1 13.2 9.9021 6.45 8.32 7.41 10.2 15.0 17.2 21.9 20.8 16.8 13.5 10.122 6.20 8.32 7.72 10.4 15.0 17.7 22.2 20.4 16.6 13.8 10.223 5.87 8.81 7.85 10.5 15.1 17.9 22.5 20.1 16.6 13.8 10.324 5.69 9.36 8.32 10.7 15.2 18.7 22.7 20.0 16.6 13.5 10.325 6.22 8.93 9.14 10.9 15.5 19.6 22.7 19.8 16.7 13.0 9.7026 6.74 7.80 9.50 11.1 16.0 20.5 22.7 19.5 16.7 12.5 8.9827 6.13 6.85 9.49 11.3 16.5 20.9 22.4 19.4 16.8 11.8 8.6528 5.37 6.53 9.18 11.6 16.7 20.6 22.4 19.7 16.7 11.4 8.4029 5.05 — 8.94 12.2 16.9 20.2 22.6 20.1 16.8 11.0 8.0530 4.90 — 9.39 12.4 17.4 19.6 22.5 20.1 16.5 10.2 7.6931 4.90 — 9.93 — 17.7 — 21.9 20.0 — 9.40 —
MEAN 6.75 6.88 7.66 11.0 14.3 18.6 21.0 20.6 17.5 13.4 9.13 6.89MAX 9.76 9.36 9.93 12.4 17.7 20.9 22.7 22.0 20.1 15.9 10.3 7.25MIN 4.90 5.10 6.38 9.45 11.5 16.8 18.0 19.4 16.5 9.40 7.48 6.50
1/1
/02
2/1
/02
3/1
/02
4/1
/02
5/1
/02
6/1
/02
7/1
/02
8/1
/02
9/1
/02
10/1
/02
11/1
/02
12/1
/02
1/1
/03
0
5
10
15
20
25
Mea
n D
aily
Tem
per
atu
re (
°C)
32
41
50
59
68
77(°
F)
State of OregonTemperature Standard
ELSN – 14206600 – Tualatin River at Elsner Road near Sherwood, Oregon [RM 16.2]

APPENDIX F—Stream Temperature RecordsF-44 2002 Tualatin River Flow Management Report
CCER – 14206748 – CEDAR CREEK AT EDY ROAD NEAR SHERWOOD, OREGON [RM 0.62]Latitude: 45 22 05 Longitude: 122 51 22 Source Agency: District 18 Watermaster
Day2002 Mean Daily Water Temperature in Degrees Celsius
JAN FEB MAR APR MAY JUN JUL AUG SEP OCT NOV DEC 1 6.43 10.5 13.0 16.5 17.1 16.8 16.2 12.1 5.25 4.79 2 6.13 10.3 12.8 16.0 17.1 16.4 16.2 11.3 4.64 5.20 3 6.43 10.6 12.1 15.9 17.0 16.2 16.2 11.9 4.40 4.80 4 6.68 11.2 11.5 16.2 16.3 16.2 15.3 12.5 4.53 4.88 5 7.49 11.3 11.7 16.7 15.9 16.0 14.7 12.8 5.39 5.32 6 7.00 10.9 11.3 16.0 16.6 15.8 14.2 12.9 6.05 5.14 7 6.52 11.0 10.7 14.8 17.2 15.7 14.1 12.5 7.22 4.61 8 6.45 10.9 10.9 13.8 17.3 16.0 13.6 12.6 8.67 4.32 9 6.52 12.0 11.3 13.8 17.4 16.4 13.7 12.9 9.25 4.62
10 7.66 12.0 10.8 14.7 18.4 17.1 13.9 12.3 9.31 6.0111 8.93 12.3 11.9 15.7 19.1 17.1 14.5 11.1 9.70 6.9712 8.09 12.7 13.4 16.7 19.1 17.3 14.7 10.3 10.5 8.4613 8.03 12.9 13.9 17.7 19.5 17.8 15.0 9.78 10.6 8.4514 8.08 12.7 13.2 18.1 19.0 18.0 15.1 9.54 10.1 9.1715 7.88 10.6 13.4 17.6 18.1 17.6 15.2 9.67 9.23 8.7516 7.45 9.53 13.7 16.8 18.1 17.2 15.2 9.94 8.42 8.2917 6.95 9.26 14.1 15.7 18.4 17.0 15.1 9.86 8.39 7.9118 6.60 9.39 14.2 15.2 18.4 16.5 14.3 10.2 8.46 7.4719 7.27 10.1 13.9 14.7 18.5 16.4 14.0 10.8 9.24 7.3220 8.77 10.6 13.6 15.5 18.0 16.6 14.0 11.6 9.50 7.0721 9.46 8.22 10.9 13.4 16.8 18.3 16.0 13.5 12.0 9.39 7.5122 10.0 7.97 10.7 13.8 17.3 18.7 15.8 13.5 11.9 9.48 7.5623 9.78 9.38 10.3 13.7 17.0 19.1 15.9 13.4 11.0 9.72 7.1124 8.82 9.92 10.9 13.8 17.2 19.1 16.3 13.5 10.0 9.28 6.0725 7.16 9.20 11.7 14.7 17.6 19.0 16.6 13.6 9.01 7.64 6.5726 6.88 8.83 11.0 15.6 18.5 19.0 16.9 13.4 8.35 6.24 7.0327 6.63 8.96 10.6 16.4 18.5 18.1 16.5 13.7 7.97 5.76 7.5328 7.26 9.04 11.1 16.0 17.5 17.7 16.8 13.3 8.39 5.55 7.7729 — 9.41 12.4 16.4 17.1 18.0 17.2 13.7 8.18 5.24 7.3330 — 10.2 13.0 16.3 17.4 18.0 16.3 13.2 6.80 4.97 7.2031 — 10.4 — 16.4 — 17.0 16.0 — 5.75 — 7.93
MEAN 8.25 7.96 11.1 13.5 16.4 18.0 16.6 14.3 10.5 7.74 6.75MAX 10.0 10.4 13.0 16.4 18.5 19.5 18.0 16.2 12.9 10.6 9.17MIN 6.63 6.13 9.26 10.7 13.8 15.9 15.7 13.2 5.75 4.40 4.32
1/1
/02
2/1
/02
3/1
/02
4/1
/02
5/1
/02
6/1
/02
7/1
/02
8/1
/02
9/1
/02
10/1
/02
11/1
/02
12/1
/02
1/1
/03
0
5
10
15
20
25
Mea
n D
aily
Tem
per
atu
re (
°C)
32
41
50
59
68
77
(°F
)
State of OregonTemperature Standard
CCER – 14206748 – Cedar Creek at Edy Road near Sherwood, Oregon [RM 0.62]

APPENDIX F—Stream Temperature Records2002 Tualatin River Flow Management Report F-45
CCSR – 14206750 – CHICKEN CREEK AT SCHOLLS-SHERWOOD ROAD [RM 2.3] Latitude: 45 22 31 Longitude: 122 51 24 Source Agency: District 18 Watermaster
Day2002 Mean Daily Water Temperature in Degrees Celsius
JAN FEB MAR APR MAY JUN JUL AUG SEP OCT NOV DEC 1 6.35 7.55 6.39 10.3 12.9 2 7.18 7.31 6.12 10.2 12.6 3 6.88 8.04 6.44 10.5 11.9 4 6.97 6.90 6.65 11.1 11.3 5 7.25 6.56 7.47 11.0 11.3 6 8.26 7.41 7.26 10.7 10.8 7 10.2 7.34 6.55 10.8 10.2 8 9.99 7.28 6.41 10.7 10.6 9 9.02 7.47 6.48 11.7 10.9
10 8.68 7.53 7.60 11.8 10.711 8.61 7.19 8.77 12.1 11.812 8.64 6.59 8.28 12.6 13.313 7.48 6.40 8.13 12.7 13.614 7.38 6.92 8.18 12.7 13.015 6.04 6.95 7.90 10.6 13.016 6.13 7.32 7.53 9.59 13.317 6.64 7.01 7.07 9.3218 6.88 8.00 6.72 9.3719 7.13 8.80 7.48 10.020 6.72 8.20 8.90 10.521 6.81 9.48 8.28 10.822 6.40 10.0 8.04 10.623 6.86 9.96 9.42 10.324 7.52 8.91 9.93 10.825 7.52 7.21 9.21 11.626 6.82 6.84 8.76 10.827 5.98 6.65 8.90 10.628 6.64 7.21 8.99 11.229 6.10 — 9.34 12.330 6.60 — 10.1 12.831 7.01 — 10.2 — — — —
MEAN 7.31 7.61 7.98 11.0 12.0MAX 10.2 10.0 10.2 12.8 13.6MIN 5.98 6.40 6.12 9.32 10.2
1/1
/02
2/1
/02
3/1
/02
4/1
/02
5/1
/02
6/1
/02
7/1
/02
8/1
/02
9/1
/02
10/1
/02
11/1
/02
12/1
/02
1/1
/03
0
5
10
15
20
25
Mea
n D
aily
Tem
per
atu
re (
°C)
32
41
50
59
68
77(°
F)
State of OregonTemperature Standard
CCSR – 14206750 – Chicken Creek at Scholls-Sherwood Road near Sherwood, Oregon [RM 2.3]

APPENDIX F—Stream Temperature RecordsF-46 2002 Tualatin River Flow Management Report
SCRL – 14206905 – SYLVAN CREEK AT RALEIGHWOOD LANE NEAR WEST SLOPE, OREGON [RM 1.0]Latitude: 45 29 35 Longitude: 122 44 48 Source Agency: District 18 Watermaster
Day2002 Mean Daily Water Temperature in Degrees Celsius
JAN FEB MAR APR MAY JUN JUL AUG SEP OCT NOV DEC 1 6.98 6.20 9.52 11.5 13.8 14.9 15.9 16.6 11.4 4.28 5.50 2 6.87 6.43 9.49 10.8 13.1 14.8 15.2 16.6 10.9 4.77 6.57 3 7.57 6.94 9.98 9.95 13.3 14.1 15.0 16.0 11.9 5.44 5.19 4 6.52 7.37 10.6 9.43 14.2 14.1 15.1 14.3 12.8 5.68 5.38 5 6.49 7.95 9.56 9.66 14.8 14.7 14.6 13.8 12.9 7.24 5.69 6 7.27 6.59 10.0 8.64 12.8 16.0 14.5 13.7 13.0 7.74 5.38 7 6.57 5.81 10.2 8.26 11.5 16.1 14.7 13.6 12.6 9.02 5.01 8 6.88 5.80 9.97 9.27 11.2 15.7 15.4 13.3 12.9 9.54 5.00 9 7.16 6.29 10.8 9.03 12.4 16.8 16.4 14.5 13.3 9.37 5.54
10 8.71 7.56 7.45 10.8 9.48 13.9 18.6 17.4 15.5 11.6 9.12 7.0111 8.61 6.80 8.26 11.2 10.6 14.7 18.6 16.7 16.2 9.91 9.81 7.4612 8.53 6.30 7.39 11.5 12.6 16.3 18.2 17.7 16.5 9.57 10.6 8.7913 7.26 6.22 7.49 12.0 11.6 17.5 18.6 19.0 16.4 10.4 10.5 8.8614 7.07 6.99 7.34 10.4 10.9 17.2 16.9 19.4 16.5 10.6 10.5 9.4015 5.69 7.10 6.92 8.78 10.7 15.5 16.3 18.1 15.7 11.8 8.70 9.0316 6.00 7.36 6.45 8.11 11.3 14.5 17.1 17.5 15.3 12.7 8.37 8.7417 6.32 7.33 6.10 8.46 11.9 13.6 17.5 17.1 14.6 12.3 9.36 8.4718 6.51 8.50 5.87 8.86 12.0 13.6 17.5 16.2 13.7 11.6 9.00 8.0619 6.87 8.20 6.87 8.92 11.7 13.4 17.1 16.1 14.4 12.5 10.2 7.8020 6.63 8.02 8.24 9.72 11.7 14.9 16.8 16.0 14.2 13.4 10.1 7.4921 6.22 9.58 6.69 9.50 11.5 16.4 17.9 14.7 13.6 12.9 10.2 7.5922 5.85 9.46 7.28 9.58 11.5 15.6 19.1 15.5 14.3 12.5 10.2 7.8923 6.40 8.88 8.70 8.96 11.6 15.3 19.1 16.5 14.8 11.9 10.4 7.2324 6.99 7.68 9.26 9.88 12.1 15.9 19.1 17.2 15.2 10.5 8.90 6.6725 6.95 6.16 8.75 10.6 13.2 16.8 18.6 16.8 15.4 8.73 6.29 7.3026 6.11 6.21 8.43 9.00 14.2 17.8 18.3 16.6 14.7 8.54 5.55 7.3927 5.55 6.57 8.12 9.68 14.3 17.0 16.6 16.4 14.9 8.08 6.01 7.6728 5.96 7.01 8.44 10.2 14.2 15.5 16.8 18.2 14.3 9.45 6.29 7.9529 5.50 — 8.92 11.3 14.3 15.5 17.4 18.1 13.9 8.44 6.05 7.5230 6.00 — 9.43 11.3 14.1 15.0 17.5 15.7 12.0 5.38 6.21 7.4731 6.42 — 9.16 — 13.5 — 15.4 16.2 — 4.20 — 7.91
MEAN 6.64 7.29 7.45 9.96 11.5 14.8 17.0 16.4 14.8 10.9 8.18 7.19MAX 8.71 9.58 9.43 12.0 14.3 17.8 19.1 19.4 16.6 13.4 10.6 9.40MIN 5.50 6.16 5.80 8.11 8.26 11.2 14.1 14.5 12.0 4.20 4.28 5.00
1/1
/02
2/1
/02
3/1
/02
4/1
/02
5/1
/02
6/1
/02
7/1
/02
8/1
/02
9/1
/02
10/1
/02
11/1
/02
12/1
/02
1/1
/03
0
5
10
15
20
25
Mea
n D
aily
Tem
per
atu
re (
°C)
32
41
50
59
68
77
(°F
)
State of OregonTemperature Standard
SCRL – 14206905 – Sylvan Creek at Raleighwood Lane near West Slope, Oregon [RM 1.0]

APPENDIX F—Stream Temperature Records2002 Tualatin River Flow Management Report F-47
ASMP – 14206933 – ASH CREEK AT METZGER PARK AT METZGER, OREGON [RM 1.25]Latitude: 45 27 00 Longitude: 122 45 45 Source Agency: District 18 Watermaster
Day2002 Mean Daily Water Temperature in Degrees Celsius
JAN FEB MAR APR MAY JUN JUL AUG SEP OCT NOV DEC 1 6.21 7.27 6.13 10.1 12.1 14.4 15.4 15.6 16.1 11.9 4.66 5.33 2 7.29 6.90 6.08 9.69 11.5 13.7 15.3 15.2 16.2 10.7 4.69 6.37 3 7.01 7.74 6.86 10.1 10.6 13.8 14.8 15.0 16.0 12.1 4.77 5.08 4 6.87 6.26 7.03 10.9 10.0 14.6 14.5 15.3 14.1 13.1 5.20 5.46 5 7.19 6.30 7.87 11.1 10.3 15.3 14.7 15.2 13.5 13.3 6.81 5.81 6 8.37 7.27 7.19 11.8 9.50 13.4 16.0 14.9 13.4 13.2 7.59 5.46 7 10.0 6.96 6.83 11.6 8.76 12.1 16.5 14.6 13.3 12.6 9.04 5.06 8 9.81 7.25 6.68 11.5 9.76 11.8 16.7 15.3 12.9 13.0 10.1 5.11 9 9.19 7.28 6.81 12.3 9.74 12.7 16.9 16.2 13.8 13.5 9.85 5.64
10 8.81 7.53 7.78 11.8 9.81 14.1 18.3 17.2 14.8 11.7 9.39 7.4011 8.66 6.95 8.76 11.9 11.0 14.7 18.8 16.6 15.5 9.89 10.0 8.0712 8.57 6.26 7.83 12.2 12.7 16.2 18.4 17.3 15.8 9.32 10.9 9.3613 7.48 6.12 8.02 12.6 12.4 17.3 18.8 18.4 15.9 10.1 10.9 9.1514 7.37 6.79 7.99 11.6 11.6 17.3 17.4 18.9 16.0 10.1 10.6 9.8015 5.71 6.94 7.53 9.94 11.5 15.8 16.5 17.9 15.6 11.3 8.94 9.1116 6.15 7.31 7.19 9.15 11.8 14.8 17.0 17.2 15.6 12.3 8.33 8.7117 6.54 7.15 6.89 9.29 12.8 14.2 17.5 16.9 15.2 11.9 9.21 8.0118 6.83 8.31 6.46 9.64 12.4 14.3 17.4 15.9 13.7 11.4 8.85 7.6119 7.18 8.59 7.27 9.64 12.2 13.6 17.4 15.9 13.9 12.2 10.4 7.2020 6.85 8.34 8.63 10.5 12.4 14.9 16.7 16.6 14.1 13.3 10.1 6.9621 6.79 9.73 7.08 10.4 12.3 16.5 17.5 15.0 13.2 13.1 9.89 7.5122 6.45 10.2 7.40 10.4 12.2 16.1 18.8 15.2 13.8 12.7 10.2 7.8123 6.84 9.68 9.00 9.69 12.1 15.7 19.0 16.1 14.1 11.6 10.6 6.6524 7.27 8.70 9.61 10.4 12.3 16.1 18.9 16.8 14.6 10.6 9.13 6.4225 7.33 7.07 9.06 11.1 13.5 16.8 18.6 16.7 14.8 8.78 6.51 7.1126 6.41 6.68 8.62 9.85 14.7 17.9 18.5 16.6 14.1 8.10 5.21 7.4927 5.69 6.76 8.63 10.2 14.8 17.3 16.8 16.1 14.4 7.87 5.83 8.0428 6.43 7.21 8.97 10.6 15.0 16.1 16.8 17.5 13.7 9.07 6.23 8.1529 5.87 — 9.41 11.6 15.2 16.2 17.4 17.8 14.2 8.63 6.07 7.6930 6.32 — 10.0 11.8 14.7 15.6 17.4 15.6 12.6 5.97 6.26 7.6831 6.81 — 9.64 — 14.3 — 15.4 15.4 — 4.73 — 8.18
MEAN 7.24 7.48 7.85 10.8 12.1 15.1 17.1 16.3 14.5 10.9 8.21 7.21MAX 10.0 10.2 10.0 12.6 15.2 17.9 19.0 18.9 16.2 13.5 10.9 9.80MIN 5.69 6.12 6.08 9.15 8.76 11.8 14.5 14.6 12.6 4.73 4.66 5.06
1/1
/02
2/1
/02
3/1
/02
4/1
/02
5/1
/02
6/1
/02
7/1
/02
8/1
/02
9/1
/02
10/1
/02
11/1
/02
12/1
/02
1/1
/03
0
5
10
15
20
25
Mea
n D
aily
Tem
per
atu
re (
°C)
32
41
50
59
68
77(°
F)
State of OregonTemperature Standard
ASMP – 14206933 – Ash Creek at Metzger Park at Metzger, Oregon [RM 1.25]

APPENDIX F—Stream Temperature RecordsF-48 2002 Tualatin River Flow Management Report
SLAB – SUMMER CREEK ABOVE SUMMER LAKE NEAR TIGARD, OREGON [RM 1.52]Latitude: 45 26 20 Longitude: 122 48 38 Source Agency: District 18 Watermaster
Day2002 Mean Daily Water Temperature in Degrees Celsius
JAN FEB MAR APR MAY JUN JUL AUG SEP OCT NOV DEC 1 19.1 19.6 20.2 19.9 13.2 3.56 4.57 2 18.2 20.1 19.5 20.1 12.4 3.60 5.15 3 18.4 19.2 19.2 19.6 13.6 3.82 4.47 4 19.0 18.5 19.1 18.1 14.4 4.17 4.81 5 20.2 19.5 18.7 17.3 14.8 5.40 5.64 6 17.5 21.4 18.4 16.6 14.8 6.32 5.21 7 16.1 21.2 18.6 16.4 13.9 8.05 4.61 8 15.7 20.4 19.6 15.8 14.4 9.54 4.35 9 17.4 21.5 20.8 16.7 15.0 9.52 4.80
10 19.2 23.7 21.9 17.8 13.6 9.34 6.7211 20.6 24.1 21.3 18.6 11.7 9.81 7.4612 21.9 23.6 21.7 18.9 10.5 10.7 8.9513 23.0 24.1 22.8 19.2 10.5 10.6 9.2214 23.0 22.2 23.2 19.0 10.3 10.4 9.9715 20.7 21.5 22.1 18.3 10.8 9.09 9.5316 19.2 22.2 21.6 17.7 11.6 8.59 8.9717 17.5 22.4 21.2 17.0 11.9 8.95 8.3418 16.9 22.2 20.0 16.0 11.7 8.59 7.8519 17.4 21.6 19.8 16.5 12.7 9.89 7.4620 19.7 21.0 19.6 16.7 14.2 9.81 7.2721 21.8 22.3 17.8 15.5 13.8 9.54 7.7522 20.9 23.7 18.5 16.0 13.4 9.91 7.8923 20.5 23.9 20.1 16.4 12.5 10.5 6.7024 21.3 23.9 20.7 16.7 11.1 9.64 6.4025 22.4 23.3 20.4 16.9 9.10 7.10 7.0726 23.7 23.0 19.9 16.1 8.33 4.69 7.4327 22.3 21.2 19.8 16.4 8.16 4.88 7.9028 19.2 21.5 21.2 16.0 8.75 5.47 8.1829 — 18.0 18.9 22.1 21.5 15.9 8.69 5.12 7.5630 — 18.8 19.2 21.8 19.2 14.1 6.48 5.03 7.8931 — — 18.9 — 19.8 19.1 — 4.07 — 8.32
MEAN 18.6 19.7 21.8 20.2 17.2 11.6 7.72 7.05MAX 18.9 23.7 24.1 23.2 20.1 15.0 10.7 9.97MIN 18.0 15.7 18.5 17.8 14.1 4.07 3.56 4.35
1/1
/02
2/1
/02
3/1
/02
4/1
/02
5/1
/02
6/1
/02
7/1
/02
8/1
/02
9/1
/02
10/1
/02
11/1
/02
12/1
/02
1/1
/03
0
5
10
15
20
25
Mea
n D
aily
Tem
per
atu
re (
°C)
32
41
50
59
68
77
(°F
)
State of OregonTemperature Standard
SLAB – Summer Creek above Summer Lake near Tigard, Oregon [RM 1.52]

APPENDIX F—Stream Temperature Records2002 Tualatin River Flow Management Report F-49
SLBE – SUMMER CREEK BELOW SUMMER LAKE NEAR TIGARD, OREGON [RM 1.32]Latitude: 45 26 14 Longitude: 122 48 19 Source Agency: District 18 Watermaster
Day2002 Mean Daily Water Temperature in Degrees Celsius
JAN FEB MAR APR MAY JUN JUL AUG SEP OCT NOV DEC 1 19.9 20.7 21.2 15.9 8.47 6.85 2 19.7 21.5 21.3 15.4 7.87 6.72 3 19.7 21.4 21.4 15.0 7.48 6.48 4 19.8 21.1 20.5 14.7 7.43 6.15 5 20.3 21.6 20.1 15.0 7.53 6.03 6 19.8 22.9 19.9 15.1 7.74 5.95 7 18.8 23.2 19.6 15.0 7.90 5.81 8 18.3 22.6 19.1 15.1 8.43 5.66 9 18.7 23.2 18.7 15.5 8.98 5.61
10 19.8 24.9 18.9 15.3 9.24 5.8011 20.7 19.5 14.5 9.39 6.7612 21.6 20.1 13.8 9.81 8.0013 22.4 20.3 13.4 10.2 8.8014 23.0 20.7 13.2 10.4 9.3815 22.4 20.4 13.2 10.3 9.2616 21.4 19.8 13.5 9.88 8.5717 20.0 23.8 18.9 13.8 9.64 7.9418 18.7 23.1 18.2 13.9 9.47 7.3119 18.9 22.6 18.0 13.9 9.40 7.0120 20.7 22.6 18.3 14.3 9.68 6.5421 22.5 21.6 18.1 14.2 9.85 6.9022 22.0 20.8 17.5 14.2 9.83 7.2023 22.2 21.0 17.5 14.1 10.0 6.9324 23.2 21.6 17.9 13.6 10.1 6.0725 24.4 22.1 18.1 12.8 9.46 5.9226 25.1 21.4 18.3 12.3 8.68 6.5027 24.6 20.9 18.3 11.9 8.27 7.2128 22.7 21.5 18.0 11.6 7.87 7.7129 — 19.3 22.4 17.9 11.5 7.54 7.4030 — 19.2 20.2 21.6 16.8 10.7 7.24 7.2931 — — 19.7 — 20.9 — 9.46 — 7.77
MEAN 19.5 21.0 22.3 21.9 19.1 13.7 8.94 7.02MAX 19.7 25.1 24.9 23.8 21.4 15.9 10.4 9.38MIN 19.2 18.3 20.7 20.8 16.8 9.46 7.24 5.61
1/1
/02
2/1
/02
3/1
/02
4/1
/02
5/1
/02
6/1
/02
7/1
/02
8/1
/02
9/1
/02
10/1
/02
11/1
/02
12/1
/02
1/1
/03
0
5
10
15
20
25
Mea
n D
aily
Tem
per
atu
re (
°C)
32
41
50
59
68
77(°
F)
State of OregonTemperature Standard
SLBE – Summer Creek below Summer Lake near Tigard, Oregon [RM 1.32]

APPENDIX F—Stream Temperature RecordsF-50 2002 Tualatin River Flow Management Report
SC121 – 14206938 – SUMMER CREEK AT 121ST AVENUE NEAR TIGARD, OREGON [RM 1.0]Latitude: 45 26 06 Longitude: 122 47 55 Source Agency: District 18 Watermaster
Day2002 Mean Daily Water Temperature in Degrees Celsius
JAN FEB MAR APR MAY JUN JUL AUG SEP OCT NOV DEC 1 20.7 22.4 22.2 23.6 15.5 4.15 4.11 2 20.7 22.9 19.8 24.1 14.8 4.33 4.58 3 20.8 22.1 21.8 23.3 14.3 4.49 3.94 4 20.7 21.7 18.8 22.0 14.8 5.08 3.88 5 21.9 22.8 21.2 21.3 15.3 6.26 4.53 6 18.8 24.0 21.9 20.4 15.6 6.59 4.24 7 16.7 23.4 22.2 19.7 15.1 7.35 3.77 8 16.8 24.0 22.7 19.2 15.5 8.03 3.62 9 19.0 25.4 23.8 20.6 16.4 8.48 3.82
10 19.2 26.4 24.4 21.8 15.5 8.54 4.9711 16.4 21.5 27.3 22.5 22.8 14.0 9.06 6.1512 19.4 24.7 27.2 22.8 23.1 13.0 9.69 7.7613 16.1 26.0 27.6 24.6 23.3 13.2 9.87 8.4414 17.1 24.1 23.7 27.4 22.9 12.9 10.0 9.0715 17.8 22.1 22.0 26.5 21.5 13.1 9.02 8.8116 18.8 18.7 24.5 20.1 13.8 8.16 8.1917 18.9 17.3 25.2 25.8 19.3 14.3 8.75 7.5218 18.6 19.2 25.1 24.4 19.1 13.6 8.22 6.9319 16.7 20.0 24.7 23.8 19.7 14.3 9.17 6.5620 17.5 22.8 24.7 23.0 19.8 15.3 9.62 6.2821 17.2 24.8 23.4 21.0 18.4 14.8 9.25 6.5922 17.3 21.7 25.6 21.6 18.7 15.0 9.51 6.8823 18.2 22.1 26.0 23.4 19.8 14.3 10.1 6.3924 19.3 21.6 28.5 24.5 20.3 13.4 9.35 5.9025 20.1 23.7 24.7 23.7 20.3 12.1 7.00 5.8426 22.1 25.9 25.2 22.8 19.4 10.8 5.44 6.2527 20.6 24.3 22.4 23.4 19.3 9.51 5.03 6.7328 19.5 20.7 22.2 25.2 19.2 9.88 5.27 7.2529 — 19.4 20.6 22.7 25.4 18.2 9.57 4.90 7.0030 — 20.9 21.0 24.3 23.0 16.1 7.55 4.75 6.9031 — — 20.6 — 19.5 23.2 — 5.61 — 7.38
MEAN 18.7 21.3 24.2 23.2 20.6 13.3 7.52 6.14MAX 22.1 26.0 28.5 27.4 24.1 16.4 10.1 9.07MIN 16.1 16.7 19.5 18.8 16.1 5.61 4.15 3.62
1/1
/02
2/1
/02
3/1
/02
4/1
/02
5/1
/02
6/1
/02
7/1
/02
8/1
/02
9/1
/02
10/1
/02
11/1
/02
12/1
/02
1/1
/03
0
5
10
15
20
25
Mea
n D
aily
Tem
per
atu
re (
°C)
32
41
50
59
68
77
(°F
)
State of OregonTemperature Standard
SC121 – 14206938 – Summer Creek at 121st Avenue near Tigard, Oregon [RM 1.0]

APPENDIX F—Stream Temperature Records2002 Tualatin River Flow Management Report F-51
FANO – 14206950 – FANNO CREEK AT DURHAM ROAD NEAR TIGARD, OREGON [RM 1.2]Latitude: 45 24 12 Longitude: 122 45 18 Source Agency: District 18 Watermaster
Day2002 Mean Daily Water Temperature in Degrees Celsius
JAN FEB MAR APR MAY JUN JUL AUG SEP OCT NOV DEC 1 5.63 6.10 5.90 10.7 13.3 16.6 17.2 16.4 12.4 5.34 5.31 2 6.01 6.09 5.68 10.5 12.9 16.1 17.4 16.5 11.8 4.95 5.49 3 6.07 6.81 6.18 11.0 12.0 15.9 17.0 16.7 11.8 4.65 5.11 4 6.11 6.19 6.59 11.7 11.3 16.3 16.5 15.6 12.4 4.77 4.96 5 6.31 5.68 7.30 11.5 11.3 17.1 16.9 14.9 12.7 5.21 5.22 6 7.06 6.10 6.52 11.2 10.7 16.0 18.0 14.5 12.8 5.86 5.06 7 9.33 6.49 5.83 11.3 10.1 14.5 18.3 14.3 12.5 6.69 4.90 8 9.63 5.55 5.73 11.1 10.7 13.7 17.6 13.8 12.5 8.14 4.72 9 8.86 6.16 5.93 11.9 11.0 14.2 18.3 14.2 12.9 8.48 4.81
10 8.22 6.42 6.78 11.8 11.0 15.4 20.1 14.5 12.4 8.43 5.6311 7.99 6.40 8.21 12.1 11.9 16.7 15.0 11.2 8.59 6.2412 7.83 5.60 7.40 12.5 13.6 18.1 15.2 10.5 9.22 7.1813 7.20 5.20 7.24 12.8 13.8 19.4 15.5 10.2 9.55 7.8114 6.85 5.84 7.47 12.6 13.4 19.7 16.1 9.94 9.54 8.1015 5.83 6.20 7.16 10.8 13.1 18.6 15.9 10.3 8.94 8.3116 5.47 6.53 6.63 9.65 13.5 16.7 17.8 15.6 10.8 8.25 7.7517 5.68 6.61 6.30 9.29 13.8 15.7 18.3 15.3 11.0 8.31 7.1118 5.97 7.40 5.88 9.79 14.3 15.4 17.5 14.8 10.8 8.1919 6.31 8.03 5.96 9.93 13.9 15.1 17.1 14.6 11.2 8.5420 6.11 7.81 7.64 10.6 13.3 16.4 16.4 14.6 11.8 8.8821 6.12 9.05 7.17 11.3 13.4 18.1 15.7 14.2 12.0 8.9022 5.48 9.67 6.59 11.2 13.5 18.1 15.5 14.1 12.0 8.9923 5.62 9.42 8.27 10.7 13.6 17.4 16.2 14.2 11.6 9.2724 6.14 8.47 9.59 11.3 13.9 18.2 16.9 14.5 10.8 8.9325 6.50 6.66 9.28 12.2 14.9 18.6 16.5 14.6 9.89 7.70 5.4626 5.94 5.75 9.25 11.4 15.3 19.9 16.3 14.4 9.02 6.55 5.9727 4.52 5.86 9.01 10.8 15.7 19.3 16.1 14.4 8.50 6.01 6.1428 5.05 6.46 9.00 11.8 16.4 17.7 17.1 14.1 8.72 5.84 6.7029 4.69 — 9.44 12.7 16.3 16.9 17.6 13.9 8.63 5.65 6.4230 4.91 — 10.3 13.1 16.5 17.3 16.8 13.4 7.39 5.63 6.1431 5.57 — 10.6 — 16.6 — 16.1 — 6.13 — 6.33
MEAN 6.42 6.73 7.45 11.3 13.4 17.0 17.7 16.7 14.9 10.9 7.47 6.12MAX 9.63 9.67 10.6 13.1 16.6 19.9 20.1 18.3 16.7 12.9 9.55 8.31MIN 4.52 5.20 5.68 9.29 10.1 13.7 16.5 15.5 13.4 6.13 4.65 4.72
1/1
/02
2/1
/02
3/1
/02
4/1
/02
5/1
/02
6/1
/02
7/1
/02
8/1
/02
9/1
/02
10/1
/02
11/1
/02
12/1
/02
1/1
/03
0
5
10
15
20
25
Mea
n D
aily
Tem
per
atu
re (
°C)
32
41
50
59
68
77(°
F)
State of OregonTemperature Standard
FANO – 14206950 – Fanno Creek at Durham Road near Tigard, Oregon [RM 1.2]

APPENDIX F—Stream Temperature RecordsF-52 2002 Tualatin River Flow Management Report
HCTP – 14206958 – HEDGES CREEK AT TUALATIN COMMUNITY PARK AT TUALATIN, OREGON [RM 0.3]Latitude: 45 23 08 Longitude: 122 45 37 Source Agency: District 18 Watermaster
Day2002 Mean Daily Water Temperature in Degrees Celsius
JAN FEB MAR APR MAY JUN JUL AUG SEP OCT NOV DEC 1 5.55 5.84 7.28 12.8 15.9 19.5 20.2 16.5 17.0 13.1 5.16 4.74 2 6.25 6.05 7.20 12.4 15.3 18.8 19.8 16.3 17.0 12.6 4.92 5.55 3 6.17 7.22 7.67 13.0 14.3 18.7 19.2 16.1 17.1 13.3 4.65 4.52 4 6.28 6.66 8.19 14.2 13.8 19.5 18.7 16.2 15.7 14.1 4.81 4.73 5 6.43 6.08 8.68 14.0 14.0 20.3 18.7 15.8 15.0 14.5 5.62 5.13 6 7.14 6.35 7.38 13.0 12.7 18.2 19.8 15.7 14.9 14.6 6.41 4.85 7 10.2 6.48 6.30 12.6 12.1 16.7 19.9 15.5 14.9 14.0 7.62 4.31 8 10.5 6.18 6.02 12.7 13.3 16.3 19.9 15.8 14.4 14.0 9.31 4.00 9 9.54 6.49 6.42 14.1 13.2 17.3 20.7 16.4 14.4 14.4 9.17 4.66
10 8.57 6.74 7.23 13.3 13.3 18.4 22.0 17.5 14.7 13.3 9.02 5.6911 8.13 6.81 8.78 13.7 14.7 19.3 22.2 17.6 15.2 11.7 9.41 6.6212 7.85 5.95 8.71 14.3 16.6 20.5 21.8 17.8 15.5 10.6 10.4 8.0213 6.93 5.53 8.10 14.6 16.0 21.4 22.2 18.3 15.6 10.0 10.8 8.2814 6.63 6.61 8.07 13.6 15.5 21.1 20.9 19.0 15.8 9.42 10.4 8.7915 5.17 7.03 7.75 12.0 15.5 19.9 20.0 18.7 15.9 10.1 9.59 8.4316 4.93 7.54 7.30 10.7 15.9 18.9 20.3 18.4 16.0 10.8 8.69 8.0817 4.95 7.43 6.85 10.7 16.7 17.5 20.8 18.2 16.2 11.3 8.96 7.2318 5.33 8.27 6.49 11.4 17.4 17.1 20.7 17.5 16.0 11.4 8.68 6.4919 5.88 9.04 6.59 11.6 16.8 17.1 20.4 17.3 15.8 11.8 9.54 6.1220 5.64 9.15 8.32 12.8 16.2 18.7 19.1 17.5 15.7 12.6 9.64 5.6821 5.47 10.5 7.48 13.8 16.1 20.3 19.1 16.7 14.8 13.1 9.49 6.1722 4.70 11.0 7.00 13.8 16.2 19.8 19.7 16.3 14.9 12.9 9.85 6.5823 4.84 10.2 9.61 12.9 16.3 19.5 20.2 16.7 14.7 11.9 10.2 6.1824 5.48 8.93 11.1 14.0 17.1 19.9 20.1 17.3 14.6 10.9 9.33 5.6825 6.44 7.14 10.6 14.8 18.2 20.4 20.0 17.7 14.6 9.51 7.23 5.7326 5.58 6.33 11.0 13.7 19.1 21.4 20.6 17.7 14.1 8.62 6.00 6.1227 4.01 6.75 10.8 13.8 19.4 20.7 18.9 17.1 14.3 8.15 5.99 6.8028 4.53 7.59 10.7 14.9 18.8 18.9 18.3 17.7 13.7 8.72 5.94 7.0929 4.10 — 11.1 16.1 18.9 19.0 18.4 18.4 14.2 8.72 5.52 6.5930 4.29 — 12.1 16.0 19.3 20.1 18.8 17.3 13.5 6.83 5.47 6.7031 5.01 — 12.5 — 19.5 — 16.8 16.7 — 5.76 — 7.07
MEAN 6.21 7.35 8.49 13.4 16.1 19.2 19.9 17.2 15.2 11.4 7.93 6.21MAX 10.5 11.0 12.5 16.1 19.5 21.4 22.2 19.0 17.1 14.6 10.8 8.79MIN 4.01 5.53 6.02 10.7 12.1 16.3 16.8 15.5 13.5 5.76 4.65 4.00
1/1
/02
2/1
/02
3/1
/02
4/1
/02
5/1
/02
6/1
/02
7/1
/02
8/1
/02
9/1
/02
10/1
/02
11/1
/02
12/1
/02
1/1
/03
0
5
10
15
20
25
Mea
n D
aily
Tem
per
atu
re (
°C)
32
41
50
59
68
77
(°F
)
State of OregonTemperature Standard
HCTP – 14206958 – Hedges Creek at Tualatin Community Park at Tualatin, Oregon [RM 0.3]

APPENDIX F—Stream Temperature Records2002 Tualatin River Flow Management Report F-53
TRT – 14206960 – TUALATIN RIVER AT TUALATIN, OREGON [RM 8.9]Latitude: 45 23 14 Longitude: 122 45 46 Source Agency: District 18 Watermaster
Day2002 Mean Daily Water Temperature in Degrees Celsius
JAN FEB MAR APR MAY JUN JUL AUG SEP OCT NOV DEC 1 3.95 3.22 4.81 8.23 11.1 16.4 18.4 20.6 18.7 14.1 7.74 6.71 2 4.32 3.61 4.80 8.45 11.3 16.5 17.8 20.3 18.8 14.0 7.39 6.83 3 4.69 4.13 4.97 8.82 11.4 16.6 17.2 20.0 18.8 13.7 7.11 6.33 4 4.91 4.43 4.94 9.11 11.7 16.7 17.0 19.6 18.4 13.6 7.01 6.21 5 5.15 4.56 5.03 9.17 11.5 17.0 17.1 19.1 18.0 13.7 7.08 6.07 6 5.41 4.54 5.28 9.28 11.2 16.7 17.7 18.9 17.6 13.6 7.06 5.75 7 6.36 4.43 5.30 9.47 10.8 16.3 17.9 18.8 17.1 13.3 7.15 5.59 8 7.47 4.56 5.47 9.67 10.7 16.0 17.7 18.9 16.7 13.3 7.49 5.43 9 7.77 4.71 5.22 9.66 10.5 16.2 18.2 19.3 16.5 13.5 7.15 5.41
10 7.25 4.38 4.99 9.77 10.3 16.5 19.1 19.6 16.4 13.3 6.90 5.61 11 6.73 4.50 5.14 9.97 10.6 16.9 19.9 19.5 16.4 12.9 7.46 5.28 12 6.35 4.43 5.78 10.6 11.3 17.4 20.3 19.8 16.5 12.6 8.41 5.12 13 5.90 4.29 6.26 10.5 11.6 18.1 20.5 20.1 16.6 12.5 8.76 6.03 14 5.56 4.10 5.96 10.5 11.8 18.3 20.3 20.5 16.6 12.3 8.92 6.26 15 5.03 4.22 5.72 10.1 12.3 18.1 20.3 20.6 16.3 12.3 8.52 6.75 16 4.48 4.63 5.44 9.61 12.9 17.8 20.7 20.4 16.0 12.3 8.35 7.01 17 4.07 4.89 5.21 8.49 13.2 17.3 20.9 20.3 15.6 12.2 8.64 6.73 18 3.99 5.20 4.92 7.82 13.7 16.7 20.9 20.1 15.6 11.8 8.65 6.23 19 4.22 5.58 4.76 7.79 13.8 16.9 20.7 19.9 15.9 11.9 8.87 5.87 20 4.45 5.91 5.00 8.16 13.5 17.0 20.7 19.7 16.0 11.9 8.90 5.44 21 4.60 6.54 5.37 8.39 13.4 17.2 21.1 19.0 15.7 11.9 8.79 5.19 22 4.42 6.72 5.79 8.66 13.5 16.9 21.5 19.1 15.6 12.1 8.79 5.09 23 4.17 6.89 6.08 8.75 13.5 16.9 21.6 19.4 15.7 12.0 9.05 5.11 24 3.91 7.27 6.35 9.22 13.9 17.4 21.7 19.7 15.7 11.8 9.01 5.17 25 4.35 7.14 7.07 9.47 14.3 18.0 21.6 19.4 15.7 11.5 8.57 5.27 26 4.73 6.29 7.59 9.40 14.7 18.9 21.6 19.2 15.6 11.1 8.11 5.27 27 4.36 5.42 7.69 9.52 15.0 19.0 21.1 19.1 15.6 10.7 7.93 5.20 28 3.62 4.94 7.60 10.0 15.1 18.3 21.1 19.3 15.5 10.8 7.75 5.31 29 3.21 — 7.32 10.5 15.2 17.6 21.3 19.3 15.1 10.4 7.24 5.46 30 2.98 — 7.51 11.0 15.5 18.4 21.1 18.7 14.5 9.42 7.04 5.52 31 3.01 — 8.06 — 16.0 — 20.5 18.6 — 8.44 — 5.54
MEAN 4.88 5.05 5.85 9.34 12.8 17.3 19.9 19.6 16.4 12.2 7.99 5.77MAX 7.77 7.27 8.06 11.0 16.0 19.0 21.7 20.6 18.8 14.1 9.05 7.01MIN 2.98 3.22 4.76 7.79 10.3 16.0 17.0 18.6 14.5 8.44 6.90 5.09
1/1
/02
2/1
/02
3/1
/02
4/1
/02
5/1
/02
6/1
/02
7/1
/02
8/1
/02
9/1
/02
10/1
/02
11/1
/02
12/1
/02
1/1
/03
0
5
10
15
20
25
Mea
n D
aily
Tem
per
atu
re (
°C)
32
41
50
59
68
77(°
F)
State of OregonTemperature Standard
TRT – 14206960 – Tualatin River at Tualatin, Oregon [RM 8.9]

APPENDIX F—Stream Temperature RecordsF-54 2002 Tualatin River Flow Management Report
SCBR – SAUM CREEK AT BORLAND ROAD [RM 0.6]Latitude: 45 22 32 Longitude: 122 43 22 Source Agency: District 18 Watermaster
Day2002 Mean Daily Water Temperature in Degrees Celsius
JAN FEB MAR APR MAY JUN JUL AUG SEP OCT NOV DEC 1 6.49 7.27 6.10 10.4 12.5 14.9 16.0 15.1 15.2 11.7 5.70 5.46 2 7.35 6.93 5.97 9.96 12.1 14.1 15.7 14.9 15.5 10.7 5.26 5.89 3 6.82 7.70 6.65 10.5 11.2 14.3 15.6 14.5 15.6 11.3 4.71 5.50 4 6.81 6.53 6.83 11.2 10.7 15.1 15.2 14.7 14.1 12.5 4.94 5.30 5 7.13 6.32 7.72 11.2 11.1 15.7 15.1 14.5 13.3 12.7 5.84 6 8.14 7.03 7.17 10.9 10.3 14.2 16.0 14.7 13.0 12.9 6.67 7 9.95 7.14 6.72 10.8 9.53 12.8 16.4 14.4 13.2 12.4 7.53 8 10.0 7.23 6.60 10.5 10.2 12.1 16.4 14.5 12.7 12.5 8.59 9 9.40 7.39 6.74 11.8 10.4 13.0 16.6 15.2 13.1 12.9 8.84
10 8.85 7.50 7.74 11.7 10.2 14.0 17.9 16.1 13.7 12.0 8.8511 8.59 7.11 8.74 12.1 11.6 15.0 18.3 16.0 14.2 10.5 9.1012 8.46 6.53 8.35 12.5 13.1 16.3 18.2 16.1 14.6 9.62 9.7913 7.33 6.21 8.20 12.9 13.3 17.3 18.7 16.7 14.8 9.65 10.114 7.30 6.78 8.15 12.2 12.2 17.2 17.6 17.3 15.0 9.48 9.9315 5.83 6.93 7.86 10.5 11.8 16.2 16.4 16.9 15.0 10.2 8.9016 5.98 7.46 7.46 9.69 12.1 15.3 16.7 16.3 14.7 10.9 8.1317 6.30 7.13 6.99 9.33 13.3 14.3 17.2 16.1 14.8 11.0 8.6818 6.62 8.20 6.76 9.79 13.1 14.4 17.3 15.5 13.5 10.7 8.5819 6.92 8.85 7.31 9.79 13.2 13.6 17.4 15.4 13.2 11.1 9.2220 6.63 8.20 8.57 10.4 12.6 14.7 16.5 15.8 13.4 11.9 9.5821 6.76 9.65 7.90 10.8 12.2 16.3 16.9 15.0 12.6 12.2 9.3922 6.39 10.2 7.83 11.1 12.5 16.5 17.8 14.7 13.1 12.2 9.6023 6.73 9.66 9.17 10.2 12.2 16.0 18.2 15.3 13.2 11.4 9.9024 7.23 8.69 9.87 10.8 12.6 16.5 18.1 15.9 13.4 10.4 9.2625 7.46 7.08 9.22 11.5 13.6 17.0 18.0 16.0 13.5 9.24 7.6626 7.00 6.64 8.98 10.7 14.6 17.9 18.0 16.1 13.2 8.57 6.5927 5.98 6.48 9.03 10.8 15.3 17.6 16.8 15.5 13.5 8.18 6.2128 6.43 7.03 9.28 11.2 15.2 16.4 16.4 16.2 13.1 8.76 6.2829 5.96 — 9.57 11.9 15.5 16.5 16.9 16.6 13.1 8.96 6.0030 6.36 — 10.2 12.4 15.2 16.2 17.0 15.4 12.5 7.03 5.7931 6.87 — 10.1 — 15.0 — 15.4 14.7 — 5.85 —
MEAN 7.23 7.50 7.99 11.0 12.5 15.4 16.9 15.6 13.8 10.6 7.85 5.54MAX 10.0 10.2 10.2 12.9 15.5 17.9 18.7 17.3 15.6 12.9 10.1 5.89MIN 5.83 6.21 5.97 9.33 9.53 12.1 15.1 14.4 12.5 5.85 4.71 5.30
1/1
/02
2/1
/02
3/1
/02
4/1
/02
5/1
/02
6/1
/02
7/1
/02
8/1
/02
9/1
/02
10/1
/02
11/1
/02
12/1
/02
1/1
/03
0
5
10
15
20
25
Mea
n D
aily
Tem
per
atu
re (
°C)
32
41
50
59
68
77
(°F
)
State of OregonTemperature Standard
SCBR – Saum Creek at Borland Road [RM 0.6]

APPENDIX F—Stream Temperature Records2002 Tualatin River Flow Management Report F-55
LOCS – 14206990 – TUALATIN RIVER AT OSWEGO CANAL NEAR LAKE OSWEGO, OREGON [RM 6.7]Latitude: 45 22 57 Longitude: 122 43 17 Source Agency: District 18 Watermaster
Day2002 Mean Daily Water Temperature in Degrees Celsius
JAN FEB MAR APR MAY JUN JUL AUG SEP OCT NOV DEC 1 5.84 5.13 6.81 10.2 12.9 18.4 20.3 21.9 20.5 16.0 9.60 8.45 2 6.18 5.49 6.80 10.3 13.0 18.3 20.0 21.7 20.6 15.8 9.16 8.51 3 6.55 6.03 7.01 10.7 13.0 18.5 19.5 21.5 20.7 15.8 8.88 8.20 4 6.73 6.35 7.05 11.0 13.2 18.7 18.9 21.3 20.2 15.5 8.81 7.90 5 7.03 6.45 7.08 11.0 13.3 18.9 18.9 20.8 19.9 15.6 8.92 6 7.26 6.46 7.26 11.1 13.1 18.7 19.4 20.6 19.4 15.6 9.01 7 8.41 6.42 7.22 11.3 12.7 18.1 20.0 20.4 19.2 15.3 9.10 8 9.48 6.46 7.35 11.5 12.8 17.9 19.4 20.5 18.6 15.2 9.42 9 9.80 6.68 7.26 11.7 12.7 17.9 19.9 20.6 18.5 15.4 9.30
10 9.31 6.33 7.13 11.7 12.4 18.3 20.7 21.1 18.3 15.1 9.1011 8.75 6.45 7.33 11.9 12.6 18.8 21.4 21.2 18.4 14.6 9.3412 8.34 6.36 7.79 12.2 13.1 19.2 21.8 21.2 18.4 14.3 10.113 7.88 6.22 8.16 12.4 13.4 19.8 22.2 21.5 18.5 14.1 10.814 7.52 6.07 7.96 12.4 13.5 20.2 22.0 21.9 18.6 14.0 10.815 7.04 6.13 7.74 12.1 13.8 20.1 21.8 22.0 18.4 14.1 10.516 6.49 6.53 7.43 11.6 14.2 19.6 22.0 22.0 18.0 14.2 10.217 6.01 6.75 7.28 10.8 15.0 19.1 22.4 21.9 17.6 14.1 10.418 5.92 7.09 6.98 10.1 15.6 18.5 22.4 21.6 17.4 13.8 10.519 6.14 7.53 6.77 9.95 15.8 18.7 22.3 21.5 17.6 13.8 10.720 6.32 7.75 7.00 10.2 15.5 19.0 21.9 21.4 17.9 14.0 10.821 6.48 8.41 7.26 10.4 15.2 19.2 22.3 20.8 17.6 13.9 10.722 6.34 8.66 7.63 10.6 15.5 19.2 22.9 20.5 17.5 13.9 10.723 6.11 8.91 8.01 10.7 15.6 18.8 23.1 20.9 17.5 13.8 10.824 5.85 9.11 8.23 11.1 15.9 19.1 23.1 21.3 17.6 13.6 10.825 6.28 9.07 8.92 11.5 16.4 19.5 23.2 21.4 17.6 13.3 10.326 6.66 8.32 9.45 11.4 16.8 20.4 23.2 21.0 17.5 12.9 9.8127 6.27 7.51 9.62 11.6 17.1 20.9 22.7 20.8 17.4 12.5 9.5828 5.58 7.01 9.57 11.9 17.1 20.2 22.6 21.0 17.3 12.5 9.4329 5.18 — 9.32 12.4 17.2 19.4 22.8 21.3 17.2 12.4 9.1730 4.93 — 9.52 12.7 17.5 20.2 22.9 20.8 16.5 11.4 8.7731 4.95 — 9.89 — 18.0 — 22.1 20.3 — 10.4 —
MEAN 6.83 6.99 7.83 11.3 14.6 19.1 21.6 21.2 18.3 14.1 9.85 8.27MAX 9.80 9.11 9.89 12.7 18.0 20.9 23.2 22.0 20.7 16.0 10.8 8.51MIN 4.93 5.13 6.77 9.95 12.4 17.9 18.9 20.3 16.5 10.4 8.77 7.90
1/1
/02
2/1
/02
3/1
/02
4/1
/02
5/1
/02
6/1
/02
7/1
/02
8/1
/02
9/1
/02
10/1
/02
11/1
/02
12/1
/02
1/1
/03
0
5
10
15
20
25
Mea
n D
aily
Tem
per
atu
re (
°C)
32
41
50
59
68
77(°
F)
State of OregonTemperature Standard
LOCS – 14206990 – Tualatin River at Oswego Canal near Lake Oswego, Oregon [RM 6.7]

APPENDIX F—Stream Temperature RecordsF-56 2002 Tualatin River Flow Management Report
SPBR – 14211116 – SPRINGBROOK CR AT IRON MOUNTAIN RD NEAR LAKE OSWEGO, OREGON [RM 0.18]Latitude: 45 24 46 Longitude: 122 42 13 Source Agency: District 18 Watermaster
Day2002 Mean Daily Water Temperature in Degrees Celsius
JAN FEB MAR APR MAY JUN JUL AUG SEP OCT NOV DEC 1 7.00 7.62 7.64 10.0 11.2 12.5 14.0 13.8 14.1 11.9 9.00 8.01 2 7.43 7.58 7.70 9.86 10.9 12.1 13.7 13.5 14.3 11.7 8.99 8.46 3 7.37 8.22 8.12 10.1 10.4 12.2 13.6 13.4 13.9 12.3 8.99 7.26 4 7.49 7.52 8.37 10.6 10.1 12.6 13.3 14.1 12.9 13.1 9.37 7.55 5 7.40 7.28 8.80 10.5 10.3 12.9 13.4 13.9 12.9 13.0 10.1 7.74 6 7.89 7.72 7.07 10.4 9.88 12.0 14.0 13.7 12.8 13.0 10.3 7.69 7 9.64 7.09 6.88 10.4 9.50 11.4 14.5 13.6 12.9 12.6 10.6 7.53 8 9.69 7.02 7.10 10.1 9.97 11.2 14.8 13.8 12.7 12.8 10.4 7.37 9 9.31 7.56 7.43 10.9 10.1 11.7 14.8 14.3 13.3 12.9 10.0 7.60
10 9.03 7.89 7.94 10.9 9.91 12.2 15.8 15.0 13.6 12.0 9.97 7.73 11 9.04 7.74 8.61 11.0 10.5 12.6 15.8 14.4 13.9 11.4 10.4 8.25 12 8.95 7.42 7.66 11.3 11.5 13.3 15.4 14.6 14.2 11.3 11.0 9.45 13 8.31 7.48 7.73 11.7 11.4 13.7 15.7 15.0 14.1 11.7 11.1 9.10 14 8.30 8.04 7.98 11.3 11.0 13.5 15.2 15.2 14.1 11.6 10.7 9.50 15 7.49 8.16 7.78 9.74 10.7 13.0 14.4 14.7 13.8 12.2 9.63 9.08 16 7.64 8.23 7.50 9.06 11.1 12.8 14.8 14.4 14.4 12.6 9.32 8.33 17 7.83 8.33 7.42 9.04 11.4 12.9 15.0 14.2 14.2 12.3 10.1 8.07 18 7.69 8.96 7.23 9.43 11.4 13.0 15.0 13.8 13.3 12.1 9.75 8.03 19 7.70 8.67 6.90 9.49 11.4 12.6 14.8 13.9 13.4 12.4 10.8 7.97 20 7.05 8.54 8.45 10.1 11.2 13.3 14.3 14.7 13.2 12.7 10.6 7.96 21 7.03 9.68 7.78 10.2 11.1 14.1 14.9 13.8 12.6 12.6 10.5 7.97 22 6.51 10.1 8.02 10.3 11.3 13.9 15.6 13.8 13.3 12.5 10.8 8.47 23 7.10 9.44 9.18 9.59 11.2 13.5 15.5 14.3 13.3 12.1 10.8 7.78 24 7.58 8.72 9.64 10.1 11.5 13.3 15.5 14.7 13.5 11.7 9.83 7.64 25 7.07 7.62 9.46 10.7 12.3 13.5 15.3 14.5 13.5 11.1 8.63 8.31 26 6.70 7.37 9.30 9.97 12.7 13.6 15.2 14.5 13.2 11.0 8.24 7.96 27 5.63 7.69 9.28 10.0 13.1 13.5 14.3 14.1 13.4 11.0 8.53 7.75 28 6.31 8.10 9.35 10.4 13.5 14.2 14.4 14.9 13.0 11.4 8.65 8.01 29 6.31 — 9.62 11.0 13.8 15.0 14.7 14.8 13.3 11.0 8.59 7.80 30 6.88 — 9.91 11.2 13.0 14.2 14.7 13.7 12.3 9.68 8.54 7.38 31 7.26 — 9.77 — 12.5 — 13.6 13.8 — 9.18 — 7.95
MEAN 7.63 8.06 8.25 10.3 11.3 13.0 14.7 14.2 13.4 11.9 9.81 8.05MAX 9.69 10.1 9.91 11.7 13.8 15.0 15.8 15.2 14.4 13.1 11.1 9.50MIN 5.63 7.02 6.88 9.04 9.50 11.2 13.3 13.4 12.3 9.18 8.24 7.26
1/1
/02
2/1
/02
3/1
/02
4/1
/02
5/1
/02
6/1
/02
7/1
/02
8/1
/02
9/1
/02
10/1
/02
11/1
/02
12/1
/02
1/1
/03
0
5
10
15
20
25
Mea
n D
aily
Tem
per
atu
re (
°C)
32
41
50
59
68
77
(°F
)
State of OregonTemperature Standard
SPBR – 14211116 – Springbrook Creek at Iron Mountain Rd near Lake Oswego, Oregon [RM 0.18]

Appendix GAppendix GAppendix GAppendix G
Hagg Lake MonitoringHagg Lake MonitoringHagg Lake MonitoringHagg Lake Monitoring2002 Data2002 Data2002 Data2002 Data

APPENDIX G—Hagg Lake Monitoring ProgramG-2 2002Tualatin River Flow Management Report
HAGG LAKE MONITORING PROGRAM 2002 — DATA LIST
DATA TABLE PAGE
Hagg Lake
Physical and chemical data, including field data G–3
Bacteriologial data G–7
Phytoplankton density and biovolume G–8
Zooplankton density G–12
Zooplankton length frequency G–15
Petroleum hydrocarbons G–7
Hagg Lake Tributaries
Physical and chemical data, including field data G–16
Bacteriological data G–19
Benthic Invertebrate Index of Biological Integrity (BIBI) G–20
Benthic community indicators of biological condition G–20
Benthic invertebrate density G–21
Weather Observations G–23

APPENDIX G—Hagg Lake Monitoring Program2002 Tualatin River Flow Management Report G-3
HA
GG
LA
KE
MO
NIT
OR
ING
200
2 —
PH
YS
ICA
L A
ND
CH
EM
ICA
L D
ATA
(S
HE
ET
1 O
F 4
)[A
bbre
viat
ions
: DO
=di
ssol
ved
oxyg
en; C
ond.
=co
nduc
tivity
; Tur
bid.
=tu
rbid
ity; T
rans
par=
tran
spar
ancy
; DU
P=
dupl
icat
e sa
mpl
es; T
otal
P=
tota
l pho
spho
rus;
SR
P=
solu
ble
reac
tive
phos
phor
us;
TK
N=
tota
l Kje
ldah
l nitr
ogen
; PP
=ph
ytop
lank
ton;
Bac
ti=ba
cter
ia; C
hlor
a=
chlo
roph
yll a
; * th
e tu
rbid
ity p
robe
had
inte
rmitt
ent p
robl
ems
in 2
002
& r
esul
ts s
houl
d be
eva
luat
ed a
ccor
ding
ly.
]
Dat
eT
ime
FIE
LD
DA
TAR
ES
ULT
S O
F C
HE
MIC
AL
AN
ALY
SE
S
Air
Tem
p(º
C)
An
alys
esD
epth
(m)
Wat
er T
emp
(ºC
)p
HD
O(m
g/L)
Co
nd
.(µ
S/c
m)
Turb
id.*
(NT
U)
Tran
spar
Dup
Tota
l P(m
g/L
as
P)
SR
P(m
g/L
as
P)
Am
mo
nia
(mg/
L as
N
)
TK
N(m
g/L
as
N)
Ch
loro
ph
yll a
(µg/
L)
01/1
5/02
10:5
61.
0PP
0.0
6.8
8.16
11.5
253
.17.
6*
01/1
5/02
10:5
61.
0Ba
cti
0.0
6.8
8.16
11.5
253
.17.
6*
01/1
5/02
10:5
21.
0Ba
cti
1.0
6.8
8.09
11.4
753
.27.
6*
01/1
5/02
10:5
21.
0C
hlor
a1.
06.
88.
0911
.47
53.2
7.6*
2.00
0
01/1
5/02
10:4
81.
0N
utrie
nts
1.0
6.8
8.09
11.3
953
.47.
6*0.
025
0.00
8<
0.01
0.12
0
01/1
5/02
10:3
81.
0N
utrie
nts
9.0
6.4
7.64
10.7
856
.57.
8*A
0.02
50.
007
<0.
010.
010
01/1
5/02
10:4
21.
0N
utrie
nts
9.0
6.4
7.64
10.7
656
.57.
6*B
0.02
60.
007
<0.
010.
130
01/1
5/02
10:3
41.
0N
utrie
nts
17.0
6.4
7.65
10.9
456
.97.
6*0.
020
0.00
8<
0.01
0.09
0
01/1
5/02
10:2
21.
0N
utrie
nts
24.0
6.2
7.60
10.3
856
.77.
6*36
”=0.
92 m
0.02
30.
008
<0.
010.
120
02/1
2/02
10:2
90.
0PP
0.0
5.6
6.48
12.6
854
.37.
2*
02/1
2/02
10:2
70.
0Ba
cti
0.0
5.6
6.49
12.6
754
.610
.6*
02/1
2/02
10:2
10.
0Ba
cti
1.0
5.6
6.67
12.5
054
.57.
1*
02/1
2/02
10:1
70.
0C
hlor
a1.
05.
66.
6512
.53
54.2
6.9*
2.20
0
02/1
2/02
10:1
90.
0N
utrie
nts
1.0
5.6
6.67
12.4
354
.37.
9*0.
023
0.00
9<
0.01
0.07
0
02/1
2/02
10:0
80.
0N
utrie
nts
7.5
5.6
6.74
12.3
554
.47.
3*A
0.02
10.
009
<0.
010.
080
02/1
2/02
10:1
00.
0N
utrie
nts
7.5
5.6
6.74
12.5
054
.47.
8*B
0.02
20.
009
<0.
010.
060
02/1
2/02
10:0
00.
0N
utrie
nts
14.0
5.6
6.27
12.3
554
.17.
7*0.
025
0.00
9<
0.01
0.08
0
02/1
2/02
9:55
0.0
Nut
rient
s20
.05.
66.
1412
.42
54.1
7.8*
70”=
1.77
m0.
028
0.01
0<
0.01
0.08
0
03/1
9/02
9:20
8.0
PP0.
06.
76.
9513
.25
53.5
6.7*
03/1
9/02
9:21
8.0
Bact
i0.
06.
76.
9513
.25
53.5
6.7*
03/1
9/02
9:18
8.0
Bact
i1.
06.
67.
0313
.17
53.4
3.0*
03/1
9/02
9:18
8.0
Chl
ora
1.0
6.6
7.03
13.1
753
.43.
0*5.
600
03/1
9/02
9:16
8.0
Nut
rient
s1.
06.
67.
0313
.17
53.4
3.0*
0.02
20.
005
<0.
010.
100
03/1
9/02
9:10
8.0
Nut
rient
s7.
06.
56.
9012
.98
53.3
3.3*
A0.
017
0.00
4<
0.01
0.10
0
03/1
9/02
9:12
8.0
Nut
rient
s7.
06.
56.
9012
.96
53.3
3.4*
B0.
019
0.00
4<
0.01
0.09
0
03/1
9/02
9:05
8.0
Nut
rient
s14
.06.
36.
7012
.57
53.0
4.0*
0.02
30.
005
<0.
010.
070
03/1
9/02
8:57
8.0
Nut
rient
s20
.06.
16.
5812
.29
53.5
4.3*
71”=
1.81
m0.
022
0.00
6<
0.01
0.06
0
04/2
3/02
10:4
012
.0PP
0.0
10.8
6.99
11.1
055
.51.
5*
04/2
3/02
10:3
812
.0Ba
cti
0.0
10.8
6.99
11.1
055
.51.
5*
04/2
3/02
10:3
312
.0Ba
cti
1.0
12.5
6.98
9.61
55.3
0.4*
04/2
3/02
10:3
012
.0C
hlor
a1.
012
.56.
989.
6155
.30.
4*3.
600
04/2
3/02
10:2
512
.0N
utrie
nts
1.0
12.5
6.93
9.64
55.5
4.6*
A0.
026
<0.
003
<0.
010.
120
04/2
3/02
10:2
812
.0N
utrie
nts
1.0
12.5
6.93
9.64
55.5
4.6*
B0.
021
<0.
003
<0.
010.
100
04/2
3/02
10:1
812
.0N
utrie
nts
9.0
7.9
6.33
9.32
55.3
0.0*
0.03
00.
003
<0.
010.
120
04/2
3/02
10:1
212
.0N
utrie
nts
17.0
6.7
6.19
9.10
54.3
1.3*
0.01
80.
003
<0.
010.
100
04/2
3/02
10:0
512
.0N
utrie
nts
25.0
6.4
6.08
8.40
24.4
1.0*
124”
=3.1
5 m
0.02
50.
003
<0.
010.
120

APPENDIX G—Hagg Lake Monitoring ProgramG-4 2002 Tualatin River Flow Management Report
05/2
0/02
11:1
716
.0PP
0.0
16.0
7.40
—43
.54.
6*
05/2
0/02
11:1
516
.0Ba
cti
0.0
16.0
7.40
—43
.54.
6*
05/2
0/02
11:0
516
.0Ba
cti
1.0
16.1
7.40
—57
.35.
7*
05/2
0/02
11:1
016
.0C
hlor
a1.
016
.17.
40—
57.3
5.7*
05/2
0/02
11:0
016
.0N
utrie
nts
1.0
16.1
7.40
—57
.35.
7*0.
014
0.00
4<
0.01
0.09
09.
400
05/2
0/02
10:5
016
.0N
utrie
nts
7.5
12.0
6.96
—57
.66.
6*A
0.01
40.
005
<0.
010.
160
05/2
0/02
10:5
516
.0N
utrie
nts
7.5
12.0
6.96
—57
.66.
6*B
0.01
80.
004
<0.
010.
130
05/2
0/02
10:4
516
.0N
utrie
nts
18.0
7.1
6.55
—54
.76.
3*0.
012
0.00
4<
0.01
0.08
0
05/2
0/02
10:4
016
.0N
utrie
nts
30.0
6.6
6.49
—55
.89.
1*71
”=1.
80 m
0.02
00.
005
<0.
010.
080
05/2
0/02
11:2
016
.0TP
H0.
0
05/2
0/02
11:2
216
.0TP
H0.
0
06/0
3/02
11:1
014
.0PP
1.0
19.3
7.21
—56
.92.
7*
06/0
3/02
11:1
514
.0Ba
cti
0.0
19.3
7.25
—56
.63.
3*
06/0
3/02
11:1
014
.0Ba
cti
1.0
19.3
7.21
—56
.92.
7*
06/0
3/02
11:1
014
.0C
hlor
a1.
019
.37.
21—
56.9
2.7*
2.10
0
06/0
3/02
11:0
514
.0N
utrie
nts
1.0
19.3
7.21
—56
.92.
7*0.
025
<0.
003
<0.
010.
100
06/0
3/02
11:0
014
.0N
utrie
nts
8.0
12.4
6.86
—58
.02.
3*0.
018
<0.
003
<0.
010.
100
06/0
3/02
10:5
414
.0N
utrie
nts
20.0
7.1
6.59
—54
.52.
3*A
0.02
5<
0.00
3<
0.01
0.06
0
06/0
3/02
10:5
714
.0N
utrie
nts
20.0
7.1
6.59
—54
.52.
3*B
0.02
0<
0.00
30.
020
0.05
0
06/0
3/02
10:4
914
.0N
utrie
nts
30.0
6.6
6.50
—56
.06.
5*13
0”=
3.32
m0.
030
<0.
003
0.01
00.
080
06/2
4/02
11:4
432
.0PP
0.0
21.9
6.99
8.46
58.6
1.4*
06/2
4/02
11:4
332
.0Ba
cti
0.0
21.9
6.99
8.46
58.6
1.4*
06/2
4/02
11:3
732
.0Ba
cti
1.0
21.7
7.03
8.34
57.7
1.1*
06/2
4/02
11:3
732
.0C
hlor
a1.
021
.77.
038.
3457
.71.
1*A
1.20
0
06/2
4/02
11:3
532
.0N
utrie
nts
1.0
21.6
7.01
8.40
57.8
2.8*
B0.
011
<0.
003
0.01
00.
120
06/2
4/02
11:3
332
.0N
utrie
nts
1.0
21.7
6.99
8.55
58.1
0.5*
0.01
8<
0.00
30.
010
0.10
0
06/2
4/02
11:2
732
.0N
utrie
nts
10.0
12.1
6.65
11.1
356
.40.
8*0.
019
<0.
003
<0.
010.
160
06/2
4/02
11:2
032
.0N
utrie
nts
21.0
7.2
6.32
7.64
53.7
2.8*
0.01
3<
0.00
3<
0.01
0.09
0
06/2
4/02
11:0
832
.0N
utrie
nts
30.0
6.8
6.24
5.52
55.3
4.8*
154”
=3.9
2 m
0.02
20.
003
<0.
010.
090
07/1
5/02
10:5
722
.0PP
0.0
24.2
7.13
7.88
60.2
07/1
5/02
10:5
722
.0Ba
cti
0.0
24.2
7.13
7.88
60.2
07/1
5/02
10:5
222
.0Ba
cti
1.0
24.2
7.14
7.92
60.2
1.5*
07/1
5/02
10:5
222
.0C
hlor
a1.
024
.27.
147.
9260
.21.
5*<
0.50
0
07/1
5/02
10:5
222
.0N
utrie
nts
1.0
24.2
7.14
7.92
60.2
1.5*
0.01
2<
0.00
30.
020
0.08
0
07/1
5/02
10:4
822
.0N
utrie
nts
7.0
18.5
6.94
10.1
662
.00.
0*0.
021
<0.
003
0.02
00.
100
07/1
5/02
10:4
222
.0N
utrie
nts
21.0
7.2
6.45
6.67
55.9
0.0*
A0.
016
<0.
003
0.02
00.
070
07/1
5/02
10:4
422
.0N
utrie
nts
21.0
7.3
6.46
6.63
55.6
0.0*
B0.
017
<.0
030.
020
0.06
0
07/1
5/02
10:3
622
.0N
utrie
nts
27.5
7.0
6.43
4.77
58.3
0.0*
91”=
2.31
m0.
029
0.00
40.
030
0.08
0
HA
GG
LA
KE
MO
NIT
OR
ING
200
2 —
PH
YS
ICA
L A
ND
CH
EM
ICA
L D
ATA
(C
ON
TIN
UE
D)
(SH
EE
T 2
OF
4)
[Abb
revi
atio
ns: D
O=
diss
olve
d ox
ygen
; Con
d.=
cond
uctiv
ity; T
urbi
d.=
turb
idity
; Tra
nspa
r=tr
ansp
aran
cy; D
UP
=du
plic
ate
sam
ples
; Tot
al P
=to
tal p
hosp
horu
s; S
RP
=so
lubl
e re
activ
e ph
osph
orus
; T
KN
=to
tal K
jeld
ahl n
itrog
en; P
P=
phyt
opla
nkto
n; B
acti=
bact
eria
; Chl
or a
=ch
loro
phyl
l a; *
the
turb
idity
pro
be h
ad in
term
itten
t pro
blem
s in
200
2 &
res
ults
sho
uld
be e
valu
ated
acc
ordi
ngly
. ]
Dat
eT
ime
FIE
LD
DA
TAR
ES
ULT
S O
F C
HE
MIC
AL
AN
ALY
SE
S
Air
Tem
p(º
C)
An
alys
esD
epth
(m)
Wat
er T
emp
(ºC
)p
HD
O(m
g/L)
Co
nd
.(µ
S/c
m)
Turb
id.*
(NT
U)
Tran
spar
Dup
Tota
l P(m
g/L
as
P)
SR
P(m
g/L
as
P)
Am
mo
nia
(mg/
L as
N
)
TK
N(m
g/L
as
N)
Ch
loro
ph
yll a
(µg/
L)

APPENDIX G—Hagg Lake Monitoring Program2002 Tualatin River Flow Management Report G-5
07/3
0/02
10:1
726
.0PP
0.0
24.4
6.42
8.18
63.5
2.0*
07/3
0/02
10:1
626
.0Ba
cti
0.0
23.5
7.09
8.64
63.9
1.3*
07/3
0/02
10:1
226
.0Ba
cti
1.0
25.0
7.09
7.86
62.2
17.9
*
07/3
0/02
10:1
526
.0C
hlor
a1.
025
.07.
087.
9462
.118
.7*
1.80
0
07/3
0/02
10:1
026
.0N
utrie
nts
1.0
25.0
7.02
7.98
62.2
18.3
*0.
048
<0.
003
<0.
010.
160
07/3
0/02
10:0
026
.0N
utrie
nts
8.5
17.0
6.72
9.75
62.5
14.8
*A
0.01
8<
0.00
3<
0.01
0.14
0
07/3
0/02
10:0
526
.0N
utrie
nts
8.5
17.0
6.77
9.99
62.5
14.6
*B
0.02
00.
003
<0.
010.
140
07/3
0/02
9:50
26.0
Nut
rient
s16
.08.
76.
437.
0756
.413
.6*
<0.
010.
003
<0.
010.
090
07/3
0/02
9:45
26.0
Nut
rient
s27
.07.
36.
364.
5058
.917
.6*
43”=
1.37
m0.
034
0.00
4<
0.01
0.08
0
08/2
0/02
10:5
614
.0PP
0.0
23.1
7.08
8.33
64.7
00.
0*
08/2
0/02
10:5
414
.0Ba
cti
0.0
23.0
7.05
8.29
64.8
00.
0*
08/2
0/02
10:4
814
.0Ba
cti
1.0
23.2
7.11
8.19
64.8
02.
5*
08/2
0/02
10:4
614
.0C
hlor
a1.
023
.27.
058.
2664
.00
0.0*
4.20
0
08/2
0/02
10:4
414
.0N
utrie
nts
1.0
23.2
7.05
8.34
64.1
01.
7*0.
023
<0.
003
<0.
010.
150
08/2
0/02
10:3
914
.0N
utrie
nts
14.0
11.6
6.24
7.29
59.6
00.
0*0.
011
<0.
003
<0.
010.
070
08/2
0/02
10:3
114
.0N
utrie
nts
18.0
8.1
6.15
4.16
59.6
00.
0*0.
016
<0.
003
<0.
010.
080
08/2
0/02
10:2
114
.0N
utrie
nts
26.0
7.7
6.12
3.33
60.1
01.
8*90
”=2.
29 m
A0.
021
<0.
003
0.01
00.
100
08/2
0/02
10:2
414
.0N
utrie
nts
26.0
7.7
6.11
3.29
60.3
02.
1*B
0.01
6<
0.00
30.
020
0.10
0
08/2
6/02
10:3
522
.0PP
08/2
6/02
22.0
Bact
i
08/2
6/02
22.0
Bact
i
08/2
6/02
10:3
022
.0C
hlor
a0.
522
.66.
298.
3266
.1—
7.40
0
08/2
6/02
10:2
522
.0N
utrie
nts
1.0
22.6
6.26
8.31
64.1
—0.
016
0.00
40.
050.
14
08/2
6/02
10:2
022
.0N
utrie
nts
8.0
20.9
5.89
7.37
64.6
—0.
021
0.00
3<
0.01
0.11
08/2
6/02
10:1
022
.0N
utrie
nts
12.0
13.9
5.64
7.38
60.4
—A
0.02
30.
004
<0.
010.
11
08/2
6/02
10:1
322
.0N
utrie
nts
12.0
14.0
5.60
7.21
61.0
—B
0.02
20.
004
<0.
010.
08
08/2
6/02
9:58
22.0
Nut
rient
s16
.010
.35.
675.
8359
.1—
0.02
70.
004
<0.
010.
08
09/1
6/02
11:3
020
.0PP
0.0
20.9
6.03
8.24
64.9
—09
/16/
0211
:30
20.0
Bact
i0.
020
.96.
038.
2464
.9—
09/1
6/02
11:2
520
.0Ba
cti
1.0
20.9
6.21
8.15
64.9
—09
/16/
0211
:30
20.0
Chl
ora
1.0
20.9
6.21
8.15
64.9
—3.
700
09/1
6/02
11:2
520
.0N
utrie
nts
1.0
20.9
6.22
8.17
64.9
—0.
013
<0.
003
<0.
010.
170
09/1
6/02
11:1
520
.0N
utrie
nts
13.0
14.8
5.55
5.11
62.2
—<
0.01
<0.
003
0.01
00.
100
09/1
6/02
11:0
520
.0N
utrie
nts
16.0
10.0
5.61
3.60
60.8
—A
<0.
010.
007
<0.
010.
100
09/1
6/02
11:0
820
.0N
utrie
nts
16.0
9.9
5.49
3.55
60.7
—B
<0.
01<
.003
0.01
00.
080
09/1
6/02
10:5
020
.0N
utrie
nts
22.0
8.1
5.48
1.27
64.3
—84
”=2.
14 m
0.01
50.
003
0.02
00.
140
HA
GG
LA
KE
MO
NIT
OR
ING
200
2 —
PH
YS
ICA
L A
ND
CH
EM
ICA
L D
ATA
(C
ON
TIN
UE
D)
(SH
EE
T 3
OF
4)
[Abb
revi
atio
ns: D
O=
diss
olve
d ox
ygen
; Con
d.=
cond
uctiv
ity; T
urbi
d.=
turb
idity
; Tra
nspa
r=tr
ansp
aran
cy; D
UP
=du
plic
ate
sam
ples
; Tot
al P
=to
tal p
hosp
horu
s; S
RP
=so
lubl
e re
activ
e ph
osph
orus
; T
KN
=to
tal K
jeld
ahl n
itrog
en; P
P=
phyt
opla
nkto
n; B
acti=
bact
eria
; Chl
or a
=ch
loro
phyl
l a; *
the
turb
idity
pro
be h
ad in
term
itten
t pro
blem
s in
200
2 &
res
ults
sho
uld
be e
valu
ated
acc
ordi
ngly
. ]
Dat
eT
ime
FIE
LD
DA
TAR
ES
ULT
S O
F C
HE
MIC
AL
AN
ALY
SE
S
Air
Tem
p(º
C)
An
alys
esD
epth
(m)
Wat
er T
emp
(ºC
)p
HD
O(m
g/L)
Co
nd
.(µ
S/c
m)
Turb
id.*
(NT
U)
Tran
spar
Dup
Tota
l P(m
g/L
as
P)
SR
P(m
g/L
as
P)
Am
mo
nia
(mg/
L as
N
)
TK
N(m
g/L
as
N)
Ch
loro
ph
yll a
(µg/
L)

APPENDIX G—Hagg Lake Monitoring ProgramG-6 2002 Tualatin River Flow Management Report
09/2
4/02
10:1
217
.0PP
0.0
20.2
7.02
9.05
66.0
7.1*
09/2
4/02
10:1
217
.0Ba
cti
0.0
20.2
7.02
9.05
66.0
7.1*
09/2
4/02
10:0
717
.0Ba
cti
1.0
20.3
6.97
8.78
65.3
7.5*
09/2
4/02
10:0
717
.0C
hloa
1.0
20.3
6.97
8.78
65.3
7.5*
4.50
0
09/2
4/02
10:0
517
.0N
utrie
nts
1.0
20.3
6.97
8.78
65.3
7.5*
0.01
1<
0.00
3<
0.01
0.14
0
09/2
4/02
9:56
17.0
Nut
rient
s12
.515
.76.
364.
2364
.22.
3*A
0.02
2<
0.00
30.
010
0.08
0
09/2
4/02
10:0
017
.0N
utrie
nts
12.5
15.8
6.35
4.27
64.3
0.0*
B0.
012
<0.
003
0.01
00.
080
09/2
4/02
9:51
17.0
Nut
rient
s17
.58.
66.
251.
2164
.03.
9*0.
017
<0.
003
0.01
00.
080
09/2
4/02
9:46
17.0
Nut
rient
s20
.08.
16.
240.
7466
.16.
2*14
1”=3
.58
m0.
051
<0.
003
0.02
00.
100
10/0
8/02
11:2
017
.0PP
0.0
18.0
6.88
8.75
66.3
2.7*
10/0
8/02
11:2
017
.0Ba
cti
0.0
18.0
6.88
8.75
66.3
2.7*
10/0
8/02
11:1
217
.0Ba
cti
1.0
18.0
6.84
8.43
66.2
2.7*
10/0
8/02
11:1
217
.0C
hlor
a1.
018
.06.
848.
4366
.22.
7*2.
400
10/0
8/02
11:1
217
.0N
utrie
nts
1.0
18.0
6.84
8.43
66.2
2.7*
<0.
01<
0.00
30.
010
0.16
0
10/0
8/02
11:0
417
.0N
utrie
nts
10.0
17.8
6.73
8.26
66.0
3.4*
A<
0.01
<0.
003
0.01
00.
150
10/0
8/02
11:0
417
.0N
utrie
nts
10.0
17.8
6.73
8.26
66.0
3.4*
B<
0.01
<0.
003
0.03
00.
170
10/0
8/02
10:5
717
.0N
utrie
nts
13.0
11.9
6.27
2.41
63.8
4.9*
<.0
1<
0.00
3<
0.01
0.12
0
10/0
8/02
10:4
717
.0N
utrie
nts
16.0
8.8
6.23
0.54
66.0
5.7*
146”
=3.7
2 m
0.01
3<
0.00
30.
010
0.13
0
10/2
2/02
10:4
810
.0PP
0.0
15.7
6.88
8.81
66.8
—10
/22/
0210
:48
10.0
Bact
i0.
015
.76.
888.
8166
.8—
10/2
2/02
11:0
510
.0TP
H0.
015
.76.
888.
8166
.8—
10/2
2/02
11:0
510
.0TP
H0.
015
.76.
888.
8166
.8—
10/2
2/02
10:4
210
.0Ba
cti
1.0
15.8
6.87
8.72
66.8
—10
/22/
0210
:42
10.0
Chl
ora
1.0
15.8
6.87
8.72
66.8
—3.
600
10/2
2/02
10:4
210
.0N
utrie
nts
1.0
15.8
6.87
8.72
67.0
—A
0.01
2<
0.00
3<
0.01
0.12
0
10/2
2/02
10:4
210
.0N
utrie
nts
1.0
15.8
6.87
8.72
66.8
—B
<0.
01<
0.00
3<
0.01
0.12
0
10/2
2/02
10:3
410
.0N
utrie
nts
11.0
15.0
6.67
6.70
66.2
—<
0.01
<0.
003
<0.
010.
080
10/2
2/02
10:2
710
.0N
utrie
nts
13.5
9.6
6.34
0.33
117.
5—
0.03
1<
0.00
30.
010
0.08
0
10/2
2/02
10:2
210
.0N
utrie
nts
20.0
8.2
6.39
0.12
—10
1”=2
.57
m0.
021
<0.
003
0.38
00.
740
11/1
9/02
11:2
512
.0PP
0.0
10.3
6.38
10.1
568
.42.
3*
11/1
9/02
11:2
512
.0Ba
cti
0.0
10.3
6.38
10.1
568
.42.
3*
11/1
9/02
11:2
012
.0Ba
cti
1.0
10.2
6.45
9.51
68.2
2.5*
11/1
9/02
11:2
012
.0N
utrie
nts
1.0
10.2
6.45
9.51
68.2
2.5*
<0.
01<
0.00
30.
010
0.16
0
11/1
9/02
11:0
812
.0N
utrie
nts
6.0
10.2
6.35
9.27
68.8
2.8*
A0.
029
<0.
003
0.01
00.
090
11/1
9/02
11:0
812
.0N
utrie
nts
6.0
10.2
6.35
9.27
68.8
2.8*
B0.
021
<0.
003
0.01
00.
160
11/1
9/02
11:0
012
.0N
utrie
nts
11.0
10.0
6.35
9.16
70.2
4.6*
<0.
01<
0.00
3<
0.01
0.16
0
11/1
9/02
10:5
112
.0N
utrie
nts
15.5
8.4
6.09
0.20
94.1
4.4*
95”=
2.41
m<
0.01
<0.
003
0.01
00.
230
HA
GG
LA
KE
MO
NIT
OR
ING
200
2 —
PH
YS
ICA
L A
ND
CH
EM
ICA
L D
ATA
(C
ON
TIN
UE
D)
(SH
EE
T 4
OF
4)
[Abb
revi
atio
ns: D
O=
diss
olve
d ox
ygen
; Con
d.=
cond
uctiv
ity; T
urbi
d.=
turb
idity
; Tra
nspa
r=tr
ansp
aran
cy; D
UP
=du
plic
ate
sam
ples
; Tot
al P
=to
tal p
hosp
horu
s; S
RP
=so
lubl
e re
activ
e ph
osph
orus
; T
KN
=to
tal K
jeld
ahl n
itrog
en; P
P=
phyt
opla
nkto
n; B
acti=
bact
eria
; Chl
or a
=ch
loro
phyl
l a; *
the
turb
idity
pro
be h
ad in
term
itten
t pro
blem
s in
200
2 &
res
ults
sho
uld
be e
valu
ated
acc
ordi
ngly
. ]
Dat
eT
ime
FIE
LD
DA
TAR
ES
ULT
S O
F C
HE
MIC
AL
AN
ALY
SE
S
Air
Tem
p(º
C)
An
alys
esD
epth
(m)
Wat
er T
emp
(ºC
)p
HD
O(m
g/L)
Co
nd
.(µ
S/c
m)
Turb
id.*
(NT
U)
Tran
spar
Dup
Tota
l P(m
g/L
as
P)
SR
P(m
g/L
as
P)
Am
mo
nia
(mg/
L as
N
)
TK
N(m
g/L
as
N)
Ch
loro
ph
yll a
(µg/
L)

APPENDIX G—Hagg Lake Monitoring Program2002 Tualatin River Flow Management Report G-7
HAGG LAKE MONITORING 2002 — PETROLEUM HYDROCARBON ANALYSES
DateGasoline Range
(µg/L)Diesel Range
(µg/L)
5/20/2002 <50 <96
10/22/2002 <50 <100
HAGG LAKE MONITORING 2002 — BACTERIOLOGICAL DATA
Date TimeSample Depth
(m)E. coli /100 ml
(MPN)Total Coliform/100 ml
(MPN)
01/15/02 10:56 0.0 10 248
01/15/02 10:52 1.0 8 129
02/12/02 10:27 0.0 1 132
02/12/02 10:21 1.0 2 82
03/19/02 9:21 0.0 <1 25
03/19/02 9:18 1.0 <1 16
04/23/02 10:38 0.0 <1 2
04/23/02 10:33 1.0 <1 3
05/20/02 11:15 0.0 <1 5
05/20/02 11:05 1.0 <1 5
06/03/02 11:15 0.0 <1 20
06/03/02 11:10 1.0 <1 15
06/24/02 11:43 0.0 <1 16
06/24/02 11:37 1.0 <1 22
07/15/02 10:57 0.0 <1 29
07/15/02 10:52 1.0 <1 14
07/30/02 10:16 0.0 <1 39
07/30/02 10:12 1.0 <1 45
08/20/02 10:54 0.0 <1 16
08/20/02 10:48 1.0 <1 14
08/26/02 — 0.5 <1 16
08/26/02 — 1.0 <1 25
09/16/02 11:30 0.0 <1 47
09/16/02 11:25 1.0 <1 61
09/24/02 10:12 0.0 <1 28
09/24/02 10:07 1.0 <1 38
10/08/02 11:20 0.0 <1 12
10/08/02 11:12 1.0 <1 11
10/22/02 10:48 0.0 <1 14
10/22/02 10:42 1.0 <1 12
11/19/02 11:25 0.0 2 15
11/19/02 11:20 1.0 5 24

APPENDIX G—Hagg Lake Monitoring ProgramG-8 2002Tualatin River Flow Management Report
HAGG LAKE MONITORING 2002 — PHYTOPLANKTON DENSITY & BIOVOLUME (SHEET 1 OF 4)
Date Species GenusDensity Biovolume
number/mL percent µm3/mL percent
1/15/2002 Trophic State Index= 34.41/15/2002 Gomphonema angustatum Baccillariophyta (Diatoms) 6 0.9 1,002 0.9
1/15/2002 Melosira italica Baccillariophyta (Diatoms) 33 5.6 62,940 53.9
1/15/2002 Stephanodiscus astraea minutula Baccillariophyta (Diatoms) 6 0.9 1,949 1.7
1/15/2002 Stephanodiscus hantzschii Baccillariophyta (Diatoms) 6 0.9 668 0.6
1/15/2002 Synedra rumpens Baccillariophyta (Diatoms) 11 1.9 1,559 1.3
1/15/2002 Achnanthes lanceolata Chrysophyta (Golden-brown algae) 6 0.9 1,002 0.9
1/15/2002 Achnanthes minutissima Chrysophyta (Golden-brown algae) 11 1.9 557 0.5
1/15/2002 Mallomonas sp. Chrysophyta (Golden-brown algae) 17 2.8 6,347 5.4
1/15/2002 Cryptomonas erosa Cryptophyta 61 10.3 31,848 27.3
1/15/2002 Rhodomonas minuta Cryptophyta 440 73.8 8,797 7.5
1/15/2002 Total 596 100 116,670 100
2/12/2002 Trophic State Index= 40.82/12/2002 Cyclotella meneghiniana Baccillariophyta (Diatoms) 3 0.9 1,198 0.4
2/12/2002 Cyclotella stelligera Baccillariophyta (Diatoms) 6 1.9 347 0.1
2/12/2002 Fragilaria capucina mesolepta Baccillariophyta (Diatoms) 3 0.9 3,217 1.1
2/12/2002 Gomphonema angustatum Baccillariophyta (Diatoms) 3 0.9 568 0.2
2/12/2002 Melosira italica Baccillariophyta (Diatoms) 98 29.2 257,876 91.2
2/12/2002 Nitzschia acicularis Baccillariophyta (Diatoms) 3 0.9 883 0.3
2/12/2002 Stephanodiscus astraea minutula Baccillariophyta (Diatoms) 6 1.9 2,208 0.8
2/12/2002 Stephanodiscus hantzschii Baccillariophyta (Diatoms) 9 2.8 1,135 0.4
2/12/2002 Crucigenia quadrata Chlorophyta (Green Algae) 6 1.9 536 0.2
2/12/2002 Achnanthes minutissima Chrysophyta (Golden-brown algae) 3 0.9 158 0.1
2/12/2002 Chrysococcus rufescens Chrysophyta (Golden-brown algae) 9 2.8 804 0.3
2/12/2002 Mallomonas sp. Chrysophyta (Golden-brown algae) 6 1.9 2,397 0.8
2/12/2002 Cryptomonas erosa Cryptophyta 16 4.7 8,200 2.9
2/12/2002 Rhodomonas minuta Cryptophyta 161 48.1 3,217 1.1
2/12/2002 Total 334 100 282,744 100
3/19/2002 Trophic State Index=47.6 3/19/2002 Cyclotella comta Baccillariophyta (Diatoms) 6 0.9 12,797 1.7
3/19/2002 Fragilaria vaucheria Baccillariophyta (Diatoms) 6 0.9 3,247 0.4
3/19/2002 Melosira italica Baccillariophyta (Diatoms) 209 33.6 510,873 69.8
3/19/2002 Nitzschia acicularis Baccillariophyta (Diatoms) 6 0.9 1,579 0.2
3/19/2002 Stephanodiscus astraea Baccillariophyta (Diatoms) 6 0.9 45,337 6.2
3/19/2002 Stephanodiscus astraea minutula Baccillariophyta (Diatoms) 56 9.1 19,731 2.7
3/19/2002 Ankistrodesmus falcatus Chlorophyta (Green Algae) 6 0.9 282 0.0
3/19/2002 Achnanthes lanceolata Chrysophyta (Golden-brown algae) 6 0.9 1,015 0.1
3/19/2002 Asterionella formosa Chrysophyta (Golden-brown algae) 288 46.4 132,831 18.2
3/19/2002 Chrysococcus rufescens Chrysophyta (Golden-brown algae) 6 0.9 479 0.1
3/19/2002 Cryptomonas erosa Cryptophyta 6 0.9 2,932 0.4
3/19/2002 Rhodomonas minuta Cryptophyta 23 3.6 451 0.1
3/19/2002 Total 620 100 731,552 100
4/23/2002 Trophic State Index= 41.94/23/2002 Cyclotella comta Baccillariophyta (Diatoms) 6 1.0 12,639 3.8
4/23/2002 Gomphonema sp. Baccillariophyta (Diatoms) 6 1.0 1,114 0.3
4/23/2002 Melosira italica Baccillariophyta (Diatoms) 61 11.0 103,850 31.2
4/23/2002 Nitzschia paleacea Baccillariophyta (Diatoms) 11 2.0 1,091 0.3
4/23/2002 Synedra radians Baccillariophyta (Diatoms) 17 3.0 6,013 1.8
4/23/2002 Tabellaria flocculosa Baccillariophyta (Diatoms) 6 1.0 3,285 1.0
4/23/2002 Ankistrodesmus falcatus Chlorophyta (Green Algae) 33 6.0 2,923 0.9
4/23/2002 Asterionella formosa Chrysophyta (Golden-brown algae) 362 65.0 183,128 55.1
4/23/2002 Dinobryon bavaricum Chrysophyta (Golden-brown algae) 6 1.0 668 0.2
4/23/2002 Cryptomonas erosa Cryptophyta 33 6.0 17,372 5.2
4/23/2002 Rhodomonas minuta Cryptophyta 17 3.0 334 0.1
4/23/2002 Total 557 100 332,418 100

APPENDIX G—Hagg Lake Monitoring Program2002 Tualatin River Flow Management Report G-9
5/20/2002 Trophic State Index= 33.55/20/2002 Fragilaria capucina mesolepta Baccillariophyta (Diatoms) 4 0.9 4,510 4.4
5/20/2002 Melosira italica Baccillariophyta (Diatoms) 4 0.9 8,330 8.0
5/20/2002 Synedra radians Baccillariophyta (Diatoms) 9 1.8 3,184 3.1
5/20/2002 Asterionella formosa Chrysophyta (Golden-brown algae) 4 0.9 1,945 1.9
5/20/2002 Dinobryon sertularia Chrysophyta (Golden-brown algae) 349 71.8 45,724 44.1
5/20/2002 Cryptomonas erosa Cryptophyta 75 15.5 39,087 37.7
5/20/2002 Rhodomonas minuta Cryptophyta 40 8.2 796 0.8
5/20/2002 Total 486 100 103,576 100
6/3/2002 Trophic State Index= 29.06/3/2002 Fragilaria capucina mesolepta Baccillariophyta (Diatoms) 6 7.7 20,014 36.5
6/3/2002 Fragilaria vaucheria Baccillariophyta (Diatoms) 2 1.9 435 0.8
6/3/2002 Gomphonema angustatum Baccillariophyta (Diatoms) 2 1.9 272 0.5
6/3/2002 Melosira italica Baccillariophyta (Diatoms) 9 11.5 18,768 34.3
6/3/2002 Nitzschia frustulum Baccillariophyta (Diatoms) 2 1.9 181 0.3
6/3/2002 Nitzschia paleacea Baccillariophyta (Diatoms) 2 1.9 148 0.3
6/3/2002 Synedra radians Baccillariophyta (Diatoms) 14 17.3 4,890 8.9
6/3/2002 Synedra rumpens Baccillariophyta (Diatoms) 6 7.7 1,014 1.9
6/3/2002 Ankistrodesmus falcatus Chlorophyta (Green Algae) 2 1.9 75 0.1
6/3/2002 Achnanthes minutissima Chrysophyta (Golden-brown algae) 9 11.5 453 0.8
6/3/2002 Asterionella formosa Chrysophyta (Golden-brown algae) 6 7.7 1,328 2.4
6/3/2002 Cryptomonas erosa Cryptophyta 14 17.3 7,064 12.9
6/3/2002 Rhodomonas minuta Cryptophyta 8 9.6 151 0.3
6/3/2002 Total 78 100 54,794 100
6/24/2002 Trophic State Index= 36.96/24/2002 Cyclotella comta Baccillariophyta (Diatoms) 29 12.4 64,721 39.3
6/24/2002 Cyclotella stelligera Baccillariophyta (Diatoms) 3 1.1 143 0.1
6/24/2002 Melosira italica Baccillariophyta (Diatoms) 5 2.2 7,325 4.5
6/24/2002 Nitzschia dissipata Baccillariophyta (Diatoms) 3 1.1 697 0.4
6/24/2002 Synedra radians Baccillariophyta (Diatoms) 145 62.9 52,254 31.8
6/24/2002 Oocystis pusilla Chlorophyta (Green Algae) 8 3.4 1,680 1.0
6/24/2002 Dinobryon sertularia Chrysophyta (Golden-brown algae) 5 2.2 617 0.4
6/24/2002 Cryptomonas erosa Cryptophyta 21 9.0 10,783 6.6
6/24/2002 Rhodomonas minuta Cryptophyta 5 2.2 104 0.1
6/24/2002 Anabaena planctonica Cyanophyta (Blue-green algae) 3 1.1 26,054 15.8
6/24/2002 Unidentified flagellate 0 5 2.2 104 0.1
6/24/2002 Total 231 100 164,480 100
7/15/2002 Trophic State Index= 35.07/15/2002 Cyclotella comta Baccillariophyta (Diatoms) 43 27.4 97,230 76.9
7/15/2002 Melosira italica Baccillariophyta (Diatoms) 13 8.1 18,987 15.0
7/15/2002 Navicula cryptocephala Baccillariophyta (Diatoms) 3 1.6 466 0.4
7/15/2002 Nitzschia frustulum Baccillariophyta (Diatoms) 3 1.6 302 0.2
7/15/2002 Synedra famelica Baccillariophyta (Diatoms) 3 1.6 1,260 1.0
7/15/2002 Synedra rumpens Baccillariophyta (Diatoms) 5 3.2 705 0.6
7/15/2002 Chlamydomonas sp. Chlorophyta (Green Algae) 3 1.6 819 0.6
7/15/2002 Oocystis pusilla Chlorophyta (Green Algae) 3 1.6 544 0.4
7/15/2002 Achnanthes minutissima Chrysophyta (Golden-brown algae) 60 38.7 3,023 2.4
7/15/2002 Kephyrion littorale Chrysophyta (Golden-brown algae) 3 1.6 239 0.2
7/15/2002 Cryptomonas erosa Cryptophyta 5 3.2 2,620 2.1
7/15/2002 Rhodomonas minuta Cryptophyta 15 9.7 302 0.2
7/15/2002 Total 156 100 126,499 100
HAGG LAKE MONITORING 2002 — PHYTOPLANKTON DENSITY & BIOVOLUME (CONTINUED) (SHEET 2 OF 4)
Date Species GenusDensity Biovolume
number/mL percent µm3/mL percent

APPENDIX G—Hagg Lake Monitoring ProgramG-10 2002Tualatin River Flow Management Report
7/30/2002 Trophic State Index= 40.77/30/2002 Cyclotella comta Baccillariophyta (Diatoms) 16 17.1 35,506 12.7
7/30/2002 Cyclotella stelligera Baccillariophyta (Diatoms) 3 2.9 143 0.1
7/30/2002 Melosira italica Baccillariophyta (Diatoms) 13 14.3 27,013 9.7
7/30/2002 Nitzschia sp. Baccillariophyta (Diatoms) 3 2.9 313 0.1
7/30/2002 Synedra rumpens Baccillariophyta (Diatoms) 5 5.7 730 0.3
7/30/2002 Ankistrodesmus falcatus Chlorophyta (Green Algae) 5 5.7 196 0.1
7/30/2002 Chodatella wratislawiensis Chlorophyta (Green Algae) 3 2.9 156 0.1
7/30/2002 Oocystis pusilla Chlorophyta (Green Algae) 3 2.9 563 0.2
7/30/2002 Achnanthes minutissima Chrysophyta (Golden-brown algae) 10 11.4 521 0.2
7/30/2002 Rhodomonas minuta Cryptophyta 5 5.7 104 0.0
7/30/2002 Anabaena planctonica Cyanophyta (Blue-green algae) 23 25.7 212,260 76.0
7/30/2002 Glenodinium sp. Pyrrophycophyta (Dinoflagellates) 3 2.9 1,825 0.7
7/30/2002 Total 91 100 279,331 100
8/2/2002 Trophic State Index= 53.78/2/2002 Cyclotella comta Baccillariophyta (Diatoms) 5 0.9 12,335 0.7
8/2/2002 Melosira italica Baccillariophyta (Diatoms) 33 5.1 55,281 3.2
8/2/2002 Nitzschia frustulum Baccillariophyta (Diatoms) 5 0.9 652 0.0
8/2/2002 Synedra radians Baccillariophyta (Diatoms) 49 7.7 17,605 1.0
8/2/2002 Synedra rumpens Baccillariophyta (Diatoms) 11 1.7 1,521 0.1
8/2/2002 Ankistrodesmus falcatus Chlorophyta (Green Algae) 22 3.4 543 0.0
8/2/2002 Achnanthes minutissima Chrysophyta (Golden-brown algae) 5 0.9 272 0.0
8/2/2002 Cryptomonas erosa Cryptophyta 27 4.3 14,128 0.8
8/2/2002 Rhodomonas minuta Cryptophyta 190 29.9 3,804 0.2
8/2/2002 Anabaena planctonica Cyanophyta (Blue-green algae) 223 35.0 1,567,591 91.4
8/2/2002 Glenodinium sp. Pyrrophycophyta (Dinoflagellates) 60 9.4 41,840 2.4
8/2/2002 Unidentified flagellate 0 5 0.9 109 0.0
8/2/2002 Total 636 100 1,715,680 100
8/20/2002 Trophic State Index= 54.88/20/2002 Cyclotella stelligera Baccillariophyta (Diatoms) 5 0.9 251 0.0
8/20/2002 Melosira italica Baccillariophyta (Diatoms) 23 4.7 42,913 2.2
8/20/2002 Navicula sp. Baccillariophyta (Diatoms) 5 0.9 683 0.0
8/20/2002 Rhizosolenia eriensis Baccillariophyta (Diatoms) 5 0.9 433 0.0
8/20/2002 Synedra radians Baccillariophyta (Diatoms) 23 4.7 8,200 0.4
8/20/2002 Ankistrodesmus falcatus Chlorophyta (Green Algae) 14 2.8 444 0.0
8/20/2002 Oocystis pusilla Chlorophyta (Green Algae) 5 0.9 984 0.0
8/20/2002 Cryptomonas erosa Cryptophyta 14 2.8 7,107 0.4
8/20/2002 Rhodomonas minuta Cryptophyta 118 24.3 2,369 0.1
8/20/2002 Anabaena planctonica Cyanophyta (Blue-green algae) 273 56.1 1,923,283 96.7
8/20/2002 Glenodinium sp. Pyrrophycophyta (Dinoflagellates) 5 0.9 3,189 0.2
8/20/2002 Total 487 100 1,989,855 100
Trophic State Index= 48.4 9/16/2002 Achnanthes minutissima Chrysophyta (Golden-brown algae) 6 0.9 318 0.0
9/16/2002 Anabaena planctonica Cyanophyta (Blue-green algae) 38 5.6 249,021 30.5
9/16/2002 Chromulina sp. Chrysophyta (Golden-brown algae) 6 0.9 127 0.0
9/16/2002 Chrysochromulina sp. Haptophyta 95 14.0 1,906 0.2
9/16/2002 Cryptomonas erosa Cryptophyta 127 18.7 66,062 8.1
9/16/2002 Cyclotella comta Baccillariophyta (Diatoms) 6 0.9 14,419 1.8
9/16/2002 Cyclotella stelligera Baccillariophyta (Diatoms) 127 18.7 6,987 0.9
9/16/2002 Dinobryon sertularia Chrysophyta (Golden-brown algae) 32 4.7 3,780 0.5
9/16/2002 Fragilaria crotonensis Baccillariophyta (Diatoms) 13 1.9 373,504 45.7
9/16/2002 Glenodinium sp. Pyrrophycophyta (Dinoflagellates) 19 2.8 13,339 1.6
9/16/2002 Melosira italica Baccillariophyta (Diatoms) 44 6.5 83,772 10.3
9/16/2002 Rhodomonas minuta Cryptophyta 159 23.4 3,176 0.4
9/16/2002 Unidentified flagellate 6 0.9 127 0.0
9/16/2002 Total 680 100 816,537 100
HAGG LAKE MONITORING 2002 — PHYTOPLANKTON DENSITY & BIOVOLUME (CONTINUED) (SHEET 3 OF 4)
Date Species GenusDensity Biovolume
number/mL percent µm3/mL percent

APPENDIX G—Hagg Lake Monitoring Program2002 Tualatin River Flow Management Report G-11
Trophic State Index= 50.39/24/2002 Cyclotella comta Baccillariophyta (Diatoms) 11 1.8 26,083 2.4
9/24/2002 Cyclotella stelligera Baccillariophyta (Diatoms) 6 0.9 316 0.0
9/24/2002 Fragilaria crotonensis Baccillariophyta (Diatoms) 69 11.0 810,766 75.8
9/24/2002 Melosira italica Baccillariophyta (Diatoms) 52 8.3 102,287 9.6
9/24/2002 Nitzschia frustulum Baccillariophyta (Diatoms) 6 0.9 2,758 0.3
9/24/2002 Nitzschia paleacea Baccillariophyta (Diatoms) 6 0.9 563 0.1
9/24/2002 Chlamydomonas sp. Chlorophyta (Green Algae) 11 1.8 3,734 0.3
9/24/2002 Sphaerocystis schroeteri Chlorophyta (Green Algae) 6 0.9 1,609 0.2
9/24/2002 Dinobryon sertularia Chrysophyta (Golden-brown algae) 23 3.7 2,735 0.3
9/24/2002 Cryptomonas erosa Cryptophyta 80 12.8 41,825 3.9
9/24/2002 Rhodomonas minuta Cryptophyta 57 9.2 1,149 0.1
9/24/2002 Anabaena planctonica Cyanophyta (Blue-green algae) 11 1.8 57,751 5.4
9/24/2002 Chrysochromulina sp. Haptophyta 270 43.1 5,401 0.5
9/24/2002 Glenodinium sp. Pyrrophycophyta (Dinoflagellates) 17 2.8 12,065 1.1
9/24/2002 Total 626 100 1,069,041 100
10/8/2002 Trophic State Index= 39.610/8/2002 Diploneis elliptica Baccillariophyta (Diatoms) 3 1.0 832 0.3
10/8/2002 Fragilaria crotonensis Baccillariophyta (Diatoms) 10 2.9 32,242 13.4
10/8/2002 Melosira italica Baccillariophyta (Diatoms) 70 21.2 125,946 52.2
10/8/2002 Stephanodiscus astraea minutula Baccillariophyta (Diatoms) 3 1.0 1,120 0.5
10/8/2002 Ankistrodesmus falcatus Chlorophyta (Green Algae) 10 2.9 312 0.1
10/8/2002 Chlamydomonas sp. Chlorophyta (Green Algae) 3 1.0 1,040 0.4
10/8/2002 Oocystis lacustris Chlorophyta (Green Algae) 3 1.0 1,970 0.8
10/8/2002 Oocystis pusilla Chlorophyta (Green Algae) 3 1.0 345 0.1
10/8/2002 Sphaerocystis schroeteri Chlorophyta (Green Algae) 3 1.0 896 0.4
10/8/2002 Asterionella formosa Chrysophyta (Golden-brown algae) 32 9.6 52,777 21.9
10/8/2002 Dinobryon sertularia Chrysophyta (Golden-brown algae) 16 4.8 1,903 0.8
10/8/2002 Kephyrion littorale Chrysophyta (Golden-brown algae) 6 1.9 608 0.3
10/8/2002 Cryptomonas erosa Cryptophyta 26 7.7 13,306 5.5
10/8/2002 Rhodomonas minuta Cryptophyta 96 28.8 1,919 0.8
10/8/2002 Chrysochromulina sp. Haptophyta 38 11.5 768 0.3
10/8/2002 Glenodinium sp. Pyrrophycophyta (Dinoflagellates) 6 1.9 4,478 1.9
10/8/2002 Hemidinium sp. Pyrrophycophyta (Dinoflagellates) 3 1.0 960 0.4
10/8/2002 Total 333 100 241,420 100
10/22/2002 Trophic State Index= 45.710/22/2002 Melosira italica Baccillariophyta (Diatoms) 66 5.6 62,172 11.1
10/22/2002 Navicula cryptocephala Baccillariophyta (Diatoms) 11 0.9 2,035 0.4
10/22/2002 Navicula cryptocephala veneta Baccillariophyta (Diatoms) 11 0.9 1,045 0.2
10/22/2002 Ankistrodesmus falcatus Chlorophyta (Green Algae) 22 1.9 1,100 0.2
10/22/2002 Asterionella formosa Chrysophyta (Golden-brown algae) 715 60.7 456,170 81.2
10/22/2002 Dinobryon sertularia Chrysophyta (Golden-brown algae) 187 15.9 24,478 4.4
10/22/2002 Kephyrion sp. Chrysophyta (Golden-brown algae) 11 0.9 693 0.1
10/22/2002 Cryptomonas erosa Cryptophyta 22 1.9 11,440 2.0
10/22/2002 Rhodomonas minuta Cryptophyta 132 11.2 2,640 0.5
10/22/2002 Total 1,177 100 561,773 100
11/19/2002 Trophic State Index= 29.011/19/2002 Melosira italica Baccillariophyta (Diatoms) 6 0.9 5,245 9.6
11/19/2002 Nitzschia communis Baccillariophyta (Diatoms) 6 0.9 251 0.5
11/19/2002 Ankistrodesmus falcatus Chlorophyta (Green Algae) 11 1.7 278 0.5
11/19/2002 Chrysococcus rufescens Chrysophyta (Golden-brown algae) 6 0.9 473 0.9
11/19/2002 Kephyrion littorale Chrysophyta (Golden-brown algae) 72 11.2 6,876 12.5
11/19/2002 Kephyrion sp. Chrysophyta (Golden-brown algae) 6 0.9 351 0.6
11/19/2002 Cryptomonas erosa Cryptophyta 61 9.5 31,848 58.0
11/19/2002 Rhodomonas minuta Cryptophyta 479 74.1 9,577 17.4
11/19/2002 Total 646 100 54,900 100
HAGG LAKE MONITORING 2002 — PHYTOPLANKTON DENSITY & BIOVOLUME (CONTINUED) (SHEET 4 OF 4)
Date Species GenusDensity Biovolume
number/mL percent µm3/mL percent

APPENDIX G—Hagg Lake Monitoring ProgramG-12 2002Tualatin River Flow Management Report
HAGG LAKE MONITORING 2002 — ZOOPLANKTON DENSITY (SHEET 1 OF 3)
Zooplankton 15-Jan-02 12-Feb-02 20-May-02 3-Jun-02 24-Jun-02
Time Sampled 11:00 10:35 11:25 11:20 11:50
Depth Sampled (meters) 24 22 30 30 30
Volume (m3) 0.7783 0.71344 0.97288 0.97288 0.97288
Genus Species CodeDensity ±SE
(number/m3)
Density ±SE
(number/m3)
Density ±SE
(number/m3)
Density ±SE
(number/m3)
Density ±SE
(number/m3)
CL
AD
OC
ER
A
Bosmina longirostris 6103101 82.2 ± 58.1 — 16.4 ± 16.4 197.4 ± 80.6 592.1 ± 139.5
Chydorus sphaericus 6107101 — 5.6 ± 5.6 16.4 ± 16.4 16.4 ± 16.4 16.4 ± 16.4
Daphnia galeata mendotae 6102111 1151.2 ± 217.6 74.8 ± 33.4 2795.8 ± 303.3 526.3 ± 131.6 2861.6 ± 306.8
Daphnia pulicaria * 6102116 — 239.2 ± 59.8 3453.7 ± 337.0 888.1 ± 170.9 1019.7 ± 183.1
Daphnia rosea * 6102114 — — 394.7 ± 113.9 32.9 ± 32.9 723.6 ± 154.3
Diaphanosoma brachyurum 6102111 — — — — —
Eurycercus laellatus 6107181 — — 8.2 ± 8.2 — —
Leptodora kindti * 6108101 — — — — —
Total cladocerans 1233.5 ± 225.2 319.6 ± 68.1 6685.3 ± 466.9 1661.1 ± 232.6 5213.4 ± 413.4
CO
PE
PO
DA
Copepod nauplii 6170090 17350.6 ± 844.6 5038.5 ± 274.5 8387.5 ± 525.2 9900.5 ± 570.7 5164.1 ± 412.1
Cyclops bicuspidatus th. 6128101 863.4 ± 188.4 194.4 ± 53.9 1315.7 ± 208.0 1480.1 ± 220.6 2302.4 ± 275.2
Cyclopoid copepodites 6128000 1850.2 ± 275.8 762.5 ± 106.8 756.5 ± 157.7 4341.8 ± 377.9 3420.8 ± 335.4
Diaptomid copepodites 6183100 123.3 ± 17.8 44.9 ± 11.2 26.7 ± 7.4 180.9 ± 19.3 283.7 ± 24.2
Diaptomus reighardi 6183184 10.3 ± 5.1 25.2 ± 8.4 22.6 ± 6.8 43.2 ± 9.4 39.1 ± 9.0
Epischura nevadensis * 6182031 — — — — 4.1 ± 4.1
Epischurid copepodites * 6182030 — — — — —
Microcyclops varians 6128103 — — — — —
Total copepods 20197.8 ± 869.2 6065.4 ± 293.9 10509 ± 568.3 15946.5 ± 658.2 11214.1 ± 507.1
RO
TIF
ER
A &
PR
OT
ISTA
Anuraeopsis sp. 4501150 — — — — —
Ascomorpha ovalis 4508023 — — 65.8 ± 46.5 32.9 ± 32.9 —
Asplanchna priodonta 4512011 — — 296 ± 98.7 3585.2 ± 343.4 —
Brachionus calyciflorus 4501042 — 15.0 ± 15.0 — — —
Collotheca pelagica 4519011 41.1 ± 41.1 59.8 ± 29.9 — — 1907.7 ± 250.5
Conochiloides natans 4518022 — — 164.5 ± 73.5 32.9 ± 32.9 —
Difflugia sp. 1000100 — — — — —
Filinia terminalis 4515011 — — — — —
Gastropus stylifer 4508011 — — 164.5 ± 73.5 1282.8 ± 205.4 1184.1 ± 197.4
Keratella cochlearis 4501013 — 15.0 ± 15.0 10591.3 ± 590.2 8387.5 ± 525.2 4177.3 ± 370.7
Keratella hiemalis 4501011 — — — 32.9 ± 32.9 65.8 ± 46.5
Keratella quadrata 4501012 — — — — 32.9 ± 32.9
Kellicottia longispina 4501051 3453.7 ± 376.8 74.8 ± 33.4 4999.6 ± 405.5 2105.1 ± 263.1 164.5 ± 73.5
Lecane sp. 4502010 — — — — —
peritrich colony 1000500 — — — — —
Philodina sp. 4520020 — — — — —
Ploesoma truncatum 4512031 — — — — —
Polyarthra vulgaris 4513011 2508.0 ± 321.1 1211.0 ± 134.6 1052.5 ± 186.1 756.5 ± 157.7 328.9 ± 104
Polyarthra major 4513015 205.6 ± 91.9 15.0 ± 15.0 559.2 ± 135.6 1249.9 ± 202.8 3223.4 ± 325.6
Pompholyx sulcata 4515031 — — — — —
Synchaeta oblonga 4513021 164.5 ± 82.2 224.3 ± 57.9 657.8 ± 147.1 3091.9 ± 318.9 131.6 ± 65.8
Total rotifers and protozoans 6372.8 ± 1614.7 ± 155.4 18551.1 ± 781.1 20557.6 ± 822.3 11216.2 ± 607.4
MISC Cypridopsis vidua 6135271 — — — — —
TOTA
L Z
OO
PLA
NKTO
N Total Density 27804.1 ±1032.6 7999.7 ± 339.3 35745.5 ±1072.4 38165.1 ±1073.9 27643.7 ± 879.0
Density of Edible Zooplankton (*) 0 239.2 ± 59.8 3848.4 ± 355.8 921 ± 174.0 1747.4 ± 237.8
% Edible Zooplankton 0 3.7 22.4 5.2 10.6
Biovolume Measured (in mls): 1 1 8 3 4
Biovolume Density (ml/m3): 1.28 1.40 8.22 3.08 4.11

APPENDIX G—Hagg Lake Monitoring Program2002 Tualatin River Flow Management Report G-13
HAGG LAKE MONITORING 2002 — ZOOPLANKTON DENSITY (CONTINUED) (SHEET 2 OF 3)
Zooplankton 15-Jul-02 30-Jul-02 20-Aug-02 26-Aug-02 16-Sep-02
Time Sampled 11:00 10:20 11:00 10:40 11:40
Depth Sampled (meters) 29 28 26 16 22
Volume (m3) 0.94045 0.90802 0.84316 0.51887 0.71344
Genus Species CodeDensity ±SE
(number/m3)
Density ±SE
(number/m3)
Density ±SE
(number/m3)
Density ±SE
(number/m3)
Density ±SE
(number/m3)
CL
AD
OC
ER
A
Bosmina longirostris 6103101 204.2 ± 68.1 105.7 ± 43.2 136.6 ± 45.5 308.4 ± 97.5 82.2 ± 24.8
Chydorus sphaericus 6107101 11.3 ± 11.3 — — — —
Daphnia galeata mendotae 6102111 793.9 ± 134.2 511 ± 94.9 1093 ± 128.8 2004.4 ± 248.6 441.1 ± 57.4
Daphnia pulicaria * 6102116 204.2 ± 68.1 35.2 ± 24.9 75.9 ± 33.9 215.9 ± 81.6 15 ± 10.6
Daphnia rosea * 6102114 226.8 ± 71.7 52.9 ± 30.5 30.4 ± 21.5 30.8 ± 30.8 ±
Diaphanosoma brachyurum 6102111 — — — — —
Eurycercus laellatus 6107181 — — — — —
Leptodora kindti * 6108101 4.3 ± 4.3 — — 15.4 ± 10.9 15 ± 10.6
Total cladocerans 1444.7 ± 179.2 704.8 ± 111.4 1335.9 ± 142.4 2574.8 ± 279.3 553.2 ± 64.3
CO
PE
PO
DA
Copepod nauplii 6170090 3947.1 ± 299.2 7841.2 ± 371.7 2064.6 ± 177 8418.3 ± 509.5 201.8 ± 38.8
Cyclops bicuspidatus th. 6128101 1905.5 ± 207.9 1797.3 ± 178 895.7 ± 116.6 555.1 ± 130.8 463.5 ± 58.9
Cyclopoid copepodites 6128000 1724 ± 197.8 1233.5 ± 147.4 409.9 ± 78.9 34.7 ± 8.2 717.6 ± 73.2
Diaptomid copepodites 6183100 155.2 ± 18.2 138.8 ± 17.5 149.4 ± 18.8 690 ± 51.6 145.8 ± 20.2
Diaptomus reighardi 6183184 68.1 ± 12 105.7 ± 15.3 260.9 ± 24.9 624.4 ± 49.1 375.6 ± 32.5
Epischura nevadensis * 6182031 — 4.4 ± 4.4 — — —
Epischurid copepodites * 6182030 — — — — —
Microcyclops varians 6128103 — — — — —
Total copepods 7799.8 ± 372.3 11120.9 ± 411.9 3780.5 ± 190.2 10322.5 ± 404.9 1904.4 ± 98.9
RO
TIF
ER
A &
PR
OT
ISTA
Anuraeopsis sp. 4501150 — — — — —
Ascomorpha ovalis 4508023 — — — — —
Asplanchna priodonta 4512011 — 35.2 ± 35.2 — — —
Brachionus calyciflorus 4501042 — — — — —
Collotheca pelagica 4519011 — — — — —
Conochiloides natans 4518022 45.4 ± 32.1 — 91.1 ± 37.2 — —
Difflugia sp. 1000100 — — — 215.9 ± 81.6 —
Filinia terminalis 4515011 — — 15.2 ± 15.2 — —
Gastropus stylifer 4508011 930.1 ± 145.3 2748.8 ± 311.2 394.7 ± 77.4 678.4 ± 144.6 —
Keratella cochlearis 4501013 2835.5 ± 253.6 17233.1 ± 779.3 819.8 ± 111.6 339.2 ± 102.3 7.5 ± 7.5
Keratella hiemalis 4501011 90.7 ± 45.4 35.2 ± 35.2 45.5 ± 26.3 — —
Keratella quadrata 4501012 22.7 ± 22.7 70.5 ± 49.8 91.1 ± 37.2 61.7 ± 43.6 —
Kellicottia longispina 4501051 22.7 ± 22.7 281.9 ± 99.7 364.3 ± 74.4 92.5 ± 53.4 7.5 ± 7.5
Lecane sp. 4502010 — — — — —
peritrich colony 1000500 — — — — —
Philodina sp. 4520020 — — — — —
Ploesoma truncatum 4512031 — — — 30.8 ± 30.8 —
Polyarthra vulgaris 4513011 453.7 ± 101.4 634.3 ± 149.5 440.2 ± 81.8 986.8 ± 174.4 37.4 ± 16.7
Polyarthra major 4513015 8529.3 ± 439.9 7118.8 ± 500.9 1457.4 ± 148.7 5581.4 ± 414.9 —
Pompholyx sulcata 4515031 — — — — —
Synchaeta oblonga 4513021 90.7 ± 45.4 17.6 ± 17.6 15.2 ± 15.2 308.4 ± 97.5 —
Total rotifers and protozoans 13020.7 ± 543.5 28193.2 ± 996.8 3734.5 ± 238.1 8295.0 ± 505.8 52.3 ± 19.8
MISC Cypridopsis vidua 6135271 — — — — —
TOTA
L Z
OO
PLA
NKTO
N Total Density 22265.2 ± 678.1 40019 ±1010.3 8851 ± 327.8 21192.3 ± 668.8 2524.8 ± 118.5
Density of Edible Zooplankton (*) 435.3 ± 97.3 92.5 ± 37.8 106.3 ± 40.2 262.1 ± 82.9 29.9 ± 15.0
% Edible Zooplankton 4.7 0.8 2.1 2 1.2
Biovolume Measured (in mls): 4 2.5 3 2.5 (not measured— too much debris)Biovolume Density (ml/m3): 4.25 2.75 3.56 4.82
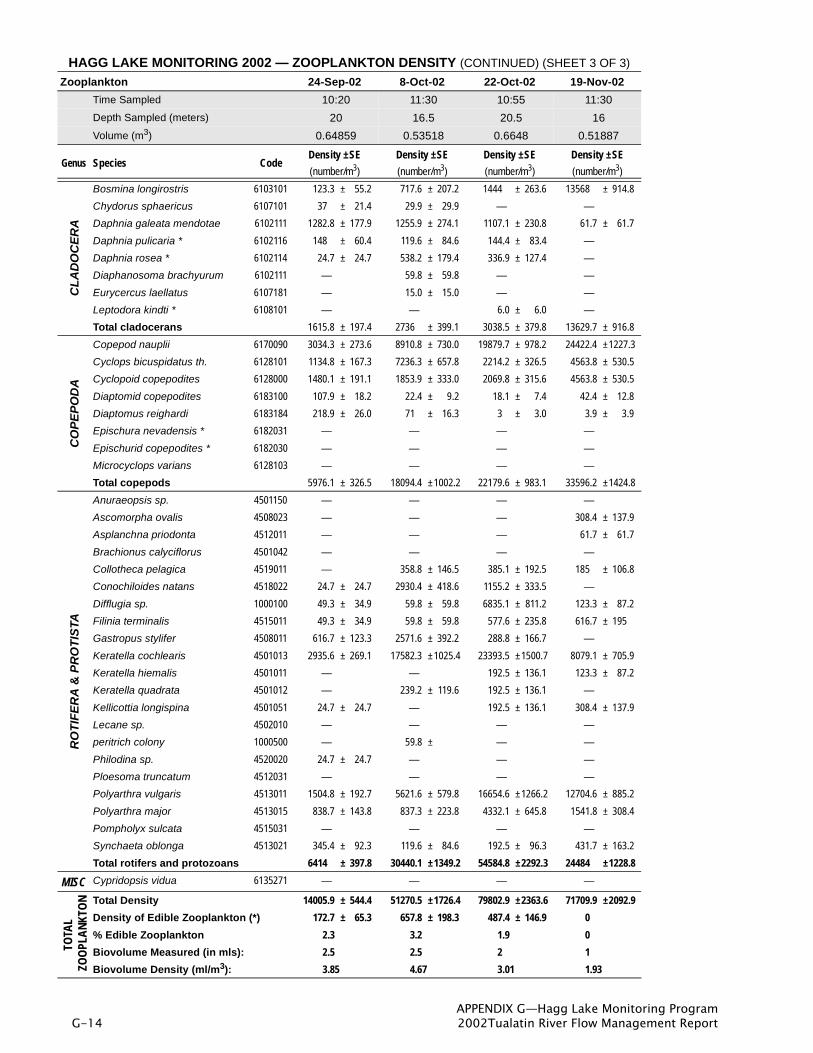
APPENDIX G—Hagg Lake Monitoring ProgramG-14 2002Tualatin River Flow Management Report
HAGG LAKE MONITORING 2002 — ZOOPLANKTON DENSITY (CONTINUED) (SHEET 3 OF 3)
Zooplankton 24-Sep-02 8-Oct-02 22-Oct-02 19-Nov-02
Time Sampled 10:20 11:30 10:55 11:30
Depth Sampled (meters) 20 16.5 20.5 16
Volume (m3) 0.64859 0.53518 0.6648 0.51887
Genus Species CodeDensity ±SE
(number/m3)
Density ±SE
(number/m3)
Density ±SE
(number/m3)
Density ±SE
(number/m3)
CL
AD
OC
ER
A
Bosmina longirostris 6103101 123.3 ± 55.2 717.6 ± 207.2 1444 ± 263.6 13568 ± 914.8
Chydorus sphaericus 6107101 37 ± 21.4 29.9 ± 29.9 — —
Daphnia galeata mendotae 6102111 1282.8 ± 177.9 1255.9 ± 274.1 1107.1 ± 230.8 61.7 ± 61.7
Daphnia pulicaria * 6102116 148 ± 60.4 119.6 ± 84.6 144.4 ± 83.4 —
Daphnia rosea * 6102114 24.7 ± 24.7 538.2 ± 179.4 336.9 ± 127.4 —
Diaphanosoma brachyurum 6102111 — 59.8 ± 59.8 — —
Eurycercus laellatus 6107181 — 15.0 ± 15.0 — —
Leptodora kindti * 6108101 — — 6.0 ± 6.0 —
Total cladocerans 1615.8 ± 197.4 2736 ± 399.1 3038.5 ± 379.8 13629.7 ± 916.8
CO
PE
PO
DA
Copepod nauplii 6170090 3034.3 ± 273.6 8910.8 ± 730.0 19879.7 ± 978.2 24422.4 ±1227.3
Cyclops bicuspidatus th. 6128101 1134.8 ± 167.3 7236.3 ± 657.8 2214.2 ± 326.5 4563.8 ± 530.5
Cyclopoid copepodites 6128000 1480.1 ± 191.1 1853.9 ± 333.0 2069.8 ± 315.6 4563.8 ± 530.5
Diaptomid copepodites 6183100 107.9 ± 18.2 22.4 ± 9.2 18.1 ± 7.4 42.4 ± 12.8
Diaptomus reighardi 6183184 218.9 ± 26.0 71 ± 16.3 3 ± 3.0 3.9 ± 3.9
Epischura nevadensis * 6182031 — — — —
Epischurid copepodites * 6182030 — — — —
Microcyclops varians 6128103 — — — —
Total copepods 5976.1 ± 326.5 18094.4 ±1002.2 22179.6 ± 983.1 33596.2 ±1424.8
RO
TIF
ER
A &
PR
OT
ISTA
Anuraeopsis sp. 4501150 — — — —
Ascomorpha ovalis 4508023 — — — 308.4 ± 137.9
Asplanchna priodonta 4512011 — — — 61.7 ± 61.7
Brachionus calyciflorus 4501042 — — — —
Collotheca pelagica 4519011 — 358.8 ± 146.5 385.1 ± 192.5 185 ± 106.8
Conochiloides natans 4518022 24.7 ± 24.7 2930.4 ± 418.6 1155.2 ± 333.5 —
Difflugia sp. 1000100 49.3 ± 34.9 59.8 ± 59.8 6835.1 ± 811.2 123.3 ± 87.2
Filinia terminalis 4515011 49.3 ± 34.9 59.8 ± 59.8 577.6 ± 235.8 616.7 ± 195
Gastropus stylifer 4508011 616.7 ± 123.3 2571.6 ± 392.2 288.8 ± 166.7 —
Keratella cochlearis 4501013 2935.6 ± 269.1 17582.3 ±1025.4 23393.5 ±1500.7 8079.1 ± 705.9
Keratella hiemalis 4501011 — — 192.5 ± 136.1 123.3 ± 87.2
Keratella quadrata 4501012 — 239.2 ± 119.6 192.5 ± 136.1 —
Kellicottia longispina 4501051 24.7 ± 24.7 — 192.5 ± 136.1 308.4 ± 137.9
Lecane sp. 4502010 — — — —
peritrich colony 1000500 — 59.8 ± — —
Philodina sp. 4520020 24.7 ± 24.7 — — —
Ploesoma truncatum 4512031 — — — —
Polyarthra vulgaris 4513011 1504.8 ± 192.7 5621.6 ± 579.8 16654.6 ±1266.2 12704.6 ± 885.2
Polyarthra major 4513015 838.7 ± 143.8 837.3 ± 223.8 4332.1 ± 645.8 1541.8 ± 308.4
Pompholyx sulcata 4515031 — — — —
Synchaeta oblonga 4513021 345.4 ± 92.3 119.6 ± 84.6 192.5 ± 96.3 431.7 ± 163.2
Total rotifers and protozoans 6414 ± 397.8 30440.1 ±1349.2 54584.8 ±2292.3 24484 ±1228.8
MISC Cypridopsis vidua 6135271 — — — —
TOTA
L Z
OO
PLA
NKTO
N Total Density 14005.9 ± 544.4 51270.5 ±1726.4 79802.9 ±2363.6 71709.9 ±2092.9
Density of Edible Zooplankton (*) 172.7 ± 65.3 657.8 ± 198.3 487.4 ± 146.9 0
% Edible Zooplankton 2.3 3.2 1.9 0
Biovolume Measured (in mls): 2.5 2.5 2 1
Biovolume Density (ml/m3): 3.85 4.67 3.01 1.93

APPENDIX G—Hagg Lake Monitoring Program2002 Tualatin River Flow Management Report G-15
DISTRIBUTION OF ZOOPLANKTON LENGTHS
Statistic[based on n=50]
Organism Length (millimeters)
Daphnia spp.Cyclops bicuspidatus
thomasiDiaptomus reighardi
Bosmina longirostris
May 20, 2002
Minimum 0.725 0.350 0.350 —
Maximum 1.825 1.325 1.325 —
Median 1.125 0.913 1.038 —
Mean 1.137 0.859 0.873 —
Standard deviation 0.277 0.290 0.357 —
June 3, 2002
Minimum 0.800 0.350 0.375 —
Maximum 2.000 1.225 1.275 —
Median 1.175 0.863 0.588 —
Mean 1.225 0.786 0.735 —
Standard deviation 0.281 0.266 0.311 —
June 24, 2002
Minimum 0.650 0.325 0.425 0.263*
Maximum 1.375 1.150 1.200 0.513*
Median 1.050 0.800 0.738 0.388*
Mean 1.046 0.768 0.747 0.381*
Standard deviation 0.209 0.194 0.182 0.077*
July 15, 2002
Minimum 0.650 0.450 0.575 0.238**
Maximum 1.675 1.200 1.125 0.475**
Median 1.325 0.975 0.913 0.344**
Mean 1.243 0.939 0.894 0.341**
Standard deviation 0.240 0.186 0.135 0.059**
September 24, 2002
Minimum 0.600 0.400 0.500 —
Maximum 1.700 1.150 1.150 —
Median 1.113 0.919 0.925 —
Mean 1.146 0.890 0.893 —
Standard deviation 0.304 0.207 0.156 —
October 8, 2002
Minimum 0.600 0.400 0.425 0.750**
Maximum 1.800 1.200 1.125 1.125**
Median 1.363 1.075 0.988 0.350**
Mean 1.303 1.006 0.931 0.993**
Standard deviation 0.315 0.207 0.177 0.098**
October 22, 2002
Minimum 0.675 0.325 0.425 0.225
Maximum 1.700 1.200 1.150 0.475
Median 1.038 0.950 0.700 0.325
Mean 1.058 0.869 0.723 0.323
Standard deviation 0.237 0.280 0.212 0.062
*based on n=34**based on n=30

APPENDIX G—Hagg Lake Monitoring ProgramG-16 2002 Tualatin River Flow Management Report
H
AG
G L
AK
E T
RIB
UTA
RY
MO
NIT
OR
ING
200
2 —
PH
YS
ICA
L A
ND
CH
EM
ICA
L D
ATA
(S
HE
ET
1 O
F 3
)[A
bbre
viat
ions
:Sto
rm=
an X
indi
cate
s a
stor
m s
ampl
e; T
emp=
wat
er te
mpe
ratu
re; D
O=
diss
olve
d ox
ygen
; Con
d.=
cond
uctiv
ity; T
urbi
d.=
turb
idity
; DU
P=
dupl
icat
e sa
mpl
es; T
otal
P=
tota
l ph
osph
orus
; SR
P=
solu
ble
reac
tive
phos
phor
us; T
KN
=to
tal K
jeld
ahl n
itrog
en; T
SS
=to
tal s
uspe
nded
sol
ids;
Nut
r &
SS
=nu
trie
nts
and
susp
ende
d so
lids;
Bac
ti=ba
cter
ia; *
the
turb
idity
pro
be
had
inte
rmitt
ent p
robl
ems
in 2
002
& r
esul
ts s
houl
d be
eva
luat
ed a
ccor
ding
ly.]
Dat
eT
ime
Lo
cati
on
An
alys
es
Storm
FIE
LD
DA
TAR
ES
ULT
S O
F C
HE
MIC
AL
AN
ALY
SE
S
Sta
ge
(fee
t)F
low
(CF
S)
Tem
p.
(ºC
)p
HD
O(m
g/L)
Co
nd
.(µ
S/c
m)
Turb
id.
(NT
U)
Dup
Tota
l P(m
g/L
as
P)
SR
P(m
g/L
as
P)
NO
3/N
O2
(mg/
L as
N
)
TK
N(m
g/L
as
N)
Am
mo
nia
(mg/
L as
N
)
TS
S(m
g/L)
01/2
9/02
9:24
Sain
(RM
1.6
) Ba
cti
3.18
96.1
4.6
6.49
14.6
451
.44.
3*
01/2
9/02
9:22
Sain
(RM
1.6
)N
utr &
SS
3.18
96.1
4.6
6.49
14.6
551
.43.
0*0.
023
0.00
50.
280
6.0
01/2
9/02
9:04
Scog
gins
(RM
8.0
)Ba
cti
3.36
140.
44.
06.
2913
.82
48.6
0.0*
01/2
9/02
9:06
Scog
gins
(RM
8.0
)N
utr &
SS
3.36
140.
43.
96.
2713
.77
48.7
4.3*
A0.
019
0.00
60.
170
4.0
01/2
9/02
9:08
Scog
gins
(RM
8.0
)N
utr &
SS
3.36
140.
43.
96.
2713
.80
48.7
0.0*
B0.
021
0.00
60.
170
3.0
01/2
9/02
8:48
Tann
er (R
M 1
.6)
Bact
i0.
657.
085.
56.
6316
.23
91.3
14.2
*
01/2
9/02
8:45
Tann
er (R
M 1
.6)
Nut
r & S
S0.
657.
085.
56.
7816
.41
91.6
10.3
*0.
080
0.03
90.
440
21.0
01/2
9/02
9:45
Scog
gins
(RM
4.8
)Ba
cti
5.7
6.84
14.1
357
.223
.7*
01/2
9/02
9:47
Scog
gins
(RM
4.8
)N
utr &
SS
5.7
6.84
14.1
357
.224
.1*
0.06
70.
013
0.32
020
.0
02/2
6/02
9:10
Sain
(RM
1.6
)Ba
cti
2.73
43.2
4.1
6.54
13.3
056
.11.
9*
02/2
6/02
9:08
Sain
(RM
1.6
)N
utr &
SS
2.73
43.2
4.1
6.53
13.2
855
.81.
9*<
0.01
0.00
80.
210
4.0
02/2
6/02
8:55
Scog
gins
(RM
8.0
)Ba
cti
3.06
75.7
3.7
5.92
13.3
747
.71.
6*
02/2
6/02
8:57
Scog
gins
(RM
8.0
)N
utr &
SS
3.06
75.7
3.7
5.92
13.3
947
.62.
1*0.
016
0.00
80.
110
2.0
02/2
6/02
8:44
Tann
er (R
M 1
.6)
Bact
i0.
371.
384.
85.
9312
.89
113.
910
.2*
02/2
6/02
8:40
Tann
er (R
M 1
.6)
Nut
r & S
S0.
371.
384.
85.
9312
.96
114.
07.
5*A
0.04
70.
046
0.35
04.
0
02/2
6/02
8:42
Tann
er (R
M 1
.6)
Nut
r & S
S0.
371.
384.
85.
9312
.91
113.
99.
2*B
0.04
60.
046
0.38
04.
0
02/2
6/02
9:28
Scog
gins
(RM
4.8
)Ba
cti
5.9
6.58
11.3
896
.78.
6*
02/2
6/02
9:30
Scog
gins
(RM
4.8
)N
utr &
SS
5.9
6.58
11.3
895
.09.
7*0.
147
0.08
80.
330
3.0
03/1
9/02
10:4
9Sa
in (R
M 1
.6)
Bact
iX
3.34
120.
95.
67.
0213
.94
50.6
18.1
*
03/1
9/02
10:4
7Sa
in (R
M 1
.6)
Nut
r & S
SX
3.34
120.
95.
67.
0213
.94
50.6
18.1
*0.
031
0.00
60.
290
20.0
03/1
9/02
10:3
2Sc
oggi
ns (R
M 8
.0)
Bact
iX
3.42
158.
55.
27.
1012
.41
48.3
10.7
*
03/1
9/02
10:3
0Sc
oggi
ns (R
M 8
.0)
Nut
r & S
SX
3.42
158.
55.
27.
1012
.41
48.3
10.7
*0.
026
0.00
70.
150
8.0
03/1
9/02
10:1
4Ta
nner
(RM
1.6
) Ba
cti
X0.
687.
596.
77.
0914
.71
90.7
52.8
*
03/1
9/02
10:1
0Ta
nner
(RM
1.6
) N
utr &
SS
X0.
687.
596.
77.
0914
.71
90.7
52.8
*A
0.09
70.
040
0.35
048
.0
03/1
9/02
10:1
5Ta
nner
(RM
1.6
) N
utr &
SS
X0.
687.
596.
77.
0914
.71
90.7
52.8
*B
0.09
80.
038
0.35
046
.0
03/1
9/02
11:1
2Sc
oggi
ns (R
M 4
.8)
Bact
iX
6.4
6.99
14.6
957
.417
.0*
03/1
9/02
11:1
0Sc
oggi
ns (R
M 4
.8)
Nut
r & S
SX
6.4
6.99
14.6
957
.417
.0*
0.04
90.
015
0.25
012
.0
04/0
2/02
9:49
Sain
(RM
1.6
)Ba
cti
2.60
32.4
6.4
7.58
11.4
661
.59.
5*
04/0
2/02
9:47
Sain
(RM
1.6
)N
utr &
SS
2.60
32.4
6.4
7.58
11.4
661
.59.
5*0.
031
0.00
60.
160
2.0
04/0
2/02
9:29
Scog
gins
(RM
8.0
)Ba
cti
2.80
41.0
6.1
7.48
10.8
555
.40.
5*
04/0
2/02
9:27
Scog
gins
(RM
8.0
)N
utr &
SS
2.80
41.0
6.1
7.48
10.8
555
.40.
5*A
0.02
20.
006
0.07
02.
0
04/0
2/02
9:31
Scog
gins
(RM
8.0
)N
utr &
SS
2.80
41.0
6.1
7.48
10.8
555
.40.
5*B
0.01
50.
006
0.07
02.
0
04/0
2/02
9:08
Tann
er (R
M 1
.6)
Bact
i0.
310.
807.
07.
6711
.58
123.
40.
0*
04/0
2/02
9:06
Tann
er (R
M 1
.6)
Nut
r & S
S0.
310.
807.
07.
6611
.40
123.
20.
0*0.
048
0.03
70.
250
2.0
04/0
2/02
10:1
7Sc
oggi
ns (R
M 4
.8)
Bact
i6.
57.
6412
.04
59.1
7.8*
04/0
2/02
10:1
5Sc
oggi
ns (R
M 4
.8)
Nut
r & S
S6.
57.
6412
.04
59.1
7.8*
0.02
70.
008
0.23
03.
0

APPENDIX G—Hagg Lake Monitoring Program2002 Tualatin River Flow Management Report G-17
05/2
0/02
12:4
0Sa
in (R
M 1
.6)
Bact
i2.
3013
.99.
77.
363.
0870
.81.
7*
05/2
0/02
12:4
0Sa
in (R
M 1
.6)
Nut
r & S
S2.
3013
.99.
77.
363.
0870
.81.
7*0.
011
0.00
90.
100
2.0
05/2
0/02
12:2
2Sc
oggi
ns (R
M 8
.0)
Bact
iN
AN
A9.
97.
542.
4066
.90.
0*
05/2
0/02
12:2
0Sc
oggi
ns (R
M 8
.0)
Nut
r & S
SN
AN
A9.
97.
542.
4066
.90.
0*0.
013
0.00
70.
040
2.0
05/2
0/02
12:0
5Ta
nner
(RM
1.6
)Ba
cti
0.15
<0.
2110
.17.
323.
4714
8.2
0.0*
05/2
0/02
12:0
0Ta
nner
(RM
1.6
) N
utr &
SS
0.15
<0.
2110
.17.
323.
4714
8.2
0.0*
A0.
054
0.04
80.
160
5.0
05/2
0/02
12:0
3Ta
nner
(RM
1.6
) N
utr &
SS
0.15
<0.
2110
.17.
323.
4714
8.2
0.0*
B0.
049
0.04
90.
160
3.0
05/2
0/02
13:0
0Sc
oggi
ns (R
M 4
.8)
Bact
i8.
17.
223.
2662
.80.
0*
05/2
0/02
13:0
0Sc
oggi
ns (R
M 4
.8)
Nut
r & S
S8.
17.
223.
2662
.80.
0*0.
022
0.01
30.
220
2.0
06/2
5/02
10:0
0Sa
in (R
M 1
.6)
Bact
i2.
065.
0413
.27.
3210
.24
79.8
0.0*
06/2
5/02
10:0
0Sa
in (R
M 1
.6)
Nut
r & S
S2.
065.
0413
.27.
3210
.24
79.8
0.0*
0.03
00.
008
0.15
02.
0
06/2
5/02
9:15
Scog
gins
(RM
8.0
)Ba
cti
NA
NA
13.4
7.36
8.80
74.9
1.2*
06/2
5/02
9:15
Scog
gins
(RM
8.0
)N
utr &
SS
NA
NA
13.4
7.36
8.80
74.9
1.2*
0.01
80.
008
0.08
01.
0
06/2
5/02
8:45
Tann
er (R
M 1
.6)
Bact
i0.
08<
0.21
12.2
7.33
10.3
016
3.7
0.0*
06/2
5/02
8:45
Tann
er (R
M 1
.6)
Nut
r & S
S0.
08<
0.21
12.2
7.33
10.3
016
3.7
0.0*
A0.
064
0.05
40.
140
3.0
06/2
5/02
8:45
Tann
er (R
M 1
.6)
Nut
r & S
S0.
08<
0.21
12.2
7.33
10.3
016
3.7
0.0*
B0.
059
0.05
30.
140
3.0
06/2
5/02
10:3
5Sc
oggi
ns (R
M 4
.8)
Bact
i12
.86.
8612
.46
55.7
0.0*
06/2
5/02
10:3
5Sc
oggi
ns (R
M 4
.8)
Nut
r & S
S12
.86.
8612
.46
55.7
0.0*
0.01
4<
.003
0.22
04.
0
07/2
3/02
10:4
5Sa
in (R
M 1
.6)
Bact
i1.
901.
8516
.07.
529.
3780
.82.
1*
07/2
3/02
10:4
5Sa
in (R
M 1
.6)
Nut
r & S
S1.
901.
8516
.07.
529.
3780
.82.
1*A
0.01
80.
010
0.22
00.
050
<1
07/2
3/02
10:4
5Sa
in (R
M 1
.6)
Nut
r & S
S1.
901.
8516
.07.
529.
3780
.82.
1*B
0.01
80.
010
0.22
00.
050
<1
07/2
3/02
9:28
Scog
gins
(RM
8.0
)Ba
cti
2.26
3.26
16.4
7.79
7.40
80.1
3.7*
07/2
3/02
9:28
Scog
gins
(RM
8.0
)N
utr &
SS
2.26
3.26
16.4
7.79
7.40
80.1
3.7*
0.02
80.
010
0.19
00.
040
<1
07/2
3/02
9:04
Tann
er (R
M 1
.6)
Bact
i0.
401.
7614
.78.
029.
0917
1.3
2.5*
07/2
3/02
9:04
Tann
er (R
M 1
.6)
Nut
r & S
S0.
401.
7614
.78.
029.
0917
1.3
2.5*
0.07
90.
056
0.20
00.
040
2.0
07/2
3/02
11:2
0Sc
oggi
ns (R
M 4
.8)
Bact
i8.
57.
1312
.39
57.9
0.0*
07/2
3/02
11:2
0Sc
oggi
ns (R
M 4
.8)
Nut
r & S
S8.
57.
1312
.39
57.9
0.0*
0.02
4<
0.00
30.
250
0.06
03.
0
08/2
0/02
12:0
6Sa
in (R
M 1
.6)
Bact
i1.
830.
9414
.17.
249.
8793
.65.
3*
08/2
0/02
12:0
6Sa
in (R
M 1
.6)
Nut
r & S
S1.
830.
9414
.17.
249.
8793
.65.
3*0.
034
0.00
80.
160
2.0
08/2
0/02
11:4
8Sc
oggi
ns (R
M 8
.0)
Bact
i2.
202.
0014
.87.
258.
4981
.00.
0*
08/2
0/02
11:4
8Sc
oggi
ns (R
M 8
.0)
Nut
r & S
S2.
202.
0014
.87.
258.
4986
.30.
0*0.
028
0.08
00.
120
1.0
08/2
0/02
11:4
8Sc
oggi
ns (R
M 8
.0)
Nut
r & S
S2.
202.
0014
.87.
258.
4981
.00.
0*0.
022
0.00
80.
110
1.0
08/2
0/02
11:3
4Ta
nner
(RM
1.6
)Ba
cti
0.04
<0.
2113
.97.
038.
9818
1.6
0.0*
08/2
0/02
11:3
4Ta
nner
(RM
1.6
)N
utr &
SS
0.04
<0.
2113
.97.
038.
9818
1.6
0.0*
0.08
50.
056
0.10
01.
0
08/2
0/02
12:3
0Sc
oggi
ns (R
M 4
.8)
Bact
i10
.96.
9512
.70
60.0
3.2*
08/2
0/02
12:3
0Sc
oggi
ns (R
M 4
.8)
Nut
r & S
S10
.96.
9512
.70
60.0
3.2*
0.01
6<
0.00
30.
090
4.0
HA
GG
LA
KE
TR
IBU
TAR
Y M
ON
ITO
RIN
G 2
002
— P
HY
SIC
AL
AN
D C
HE
MIC
AL
DA
TA (
CO
NT
INU
ED
) (S
HE
ET
2 O
F 3
)[A
bbre
viat
ions
:Sto
rm=
an X
indi
cate
s a
stor
m s
ampl
e; T
emp=
wat
er te
mpe
ratu
re; D
O=
diss
olve
d ox
ygen
; Con
d.=
cond
uctiv
ity; T
urbi
d.=
turb
idity
; DU
P=
dupl
icat
e sa
mpl
es; T
otal
P=
tota
l ph
osph
orus
; SR
P=
solu
ble
reac
tive
phos
phor
us; T
KN
=to
tal K
jeld
ahl n
itrog
en; T
SS
=to
tal s
uspe
nded
sol
ids;
Nut
r &
SS
=nu
trie
nts
and
susp
ende
d so
lids;
Bac
ti=ba
cter
ia; *
the
turb
idity
pro
be
had
inte
rmitt
ent p
robl
ems
in 2
002
& r
esul
ts s
houl
d be
eva
luat
ed a
ccor
ding
ly.]
Dat
eT
ime
Lo
cati
on
An
alys
es
Storm
FIE
LD
DA
TAR
ES
ULT
S O
F C
HE
MIC
AL
AN
ALY
SE
S
Sta
ge
(fee
t)F
low
(CF
S)
Tem
p.
(ºC
)p
HD
O(m
g/L)
Co
nd
.(µ
S/c
m)
Turb
id.
(NT
U)
Dup
Tota
l P(m
g/L
as
P)
SR
P(m
g/L
as
P)
NO
3/N
O2
(mg/
L as
N
)
TK
N(m
g/L
as
N)
Am
mo
nia
(mg/
L as
N
)
TS
S(m
g/L)

APPENDIX G—Hagg Lake Monitoring ProgramG-18 2002 Tualatin River Flow Management Report
09/2
4/02
11:2
8Sa
in (R
M 1
.6)
Bact
i1.
750.
3211
.77.
1510
.50
96.1
2.8*
09/2
4/02
11:2
5Sa
in (R
M 1
.6)
Nut
r & S
S1.
750.
3211
.77.
1510
.50
96.1
2.8*
0.01
70.
011
0.19
02.
0
09/2
4/02
11:1
4Sc
oggi
ns (R
M 8
.0)
Bact
i2.
15<
2.00
12.4
7.15
9.08
88.1
0.0*
09/2
4/02
11:1
1Sc
oggi
ns (R
M 8
.0)
Nut
r & S
S2.
15<
2.00
12.4
7.15
9.08
88.1
0.0*
A0.
010
0.00
80.
130
2.0
09/2
4/02
11:1
6Sc
oggi
ns (R
M 8
.0)
Nut
r & S
S2.
15<
0.21
12.4
7.15
9.08
88.1
0.0*
B0.
012
0.00
80.
130
1.0
09/2
4/02
10:5
7Ta
nner
(RM
1.6
)Ba
cti
0.02
<0.
2111
.76.
9810
.67
188.
60.
0*
09/2
4/02
10:5
5Ta
nner
(RM
1.6
)N
utr &
SS
0.02
<0.
2111
.76.
9810
.67
188.
60.
0*0.
065
0.05
90.
160
3.0
09/2
4/02
11:5
2Sc
oggi
ns (R
M 4
.8)
Bact
i16
.47.
0210
.53
66.3
4.7*
09/2
4/02
11:5
0Sc
oggi
ns (R
M 4
.8)
Nut
r & S
S16
.47.
0210
.53
66.3
4.7*
0.01
2<
0.00
30.
030
4.0
10/2
2/02
12:2
2Sa
in (R
M 1
.6)
Bact
i1.
800.
709.
37.
2411
.13
97.0
—10
/22/
0212
:22
Sain
(RM
1.6
)N
utr &
SS
1.80
0.70
9.3
7.24
11.1
397
.0—
<.01
0.00
40.
050
<1
10/2
2/02
12:0
4Sc
oggi
ns (R
M 8
.0)
Bact
i2.
222.
369.
67.
1910
.21
90.3
—10
/22/
0212
:04
Scog
gins
(RM
8.0
)N
utr &
SS
2.22
2.36
9.6
7.19
10.2
190
.3—
A<
0.01
<0.
003
0.01
0<
1
10/2
2/02
12:0
4Sc
oggi
ns (R
M 8
.0)
Nut
r & S
S2.
222.
369.
67.
1910
.21
90.3
—B
<0.
010.
003
0.01
0<
1
10/2
2/02
11:4
6Ta
nner
(RM
1.6
)Ba
cti
0.03
<0.
219.
87.
0111
.01
188.
9—
10/2
2/02
11:4
6Ta
nner
(RM
1.6
)N
utr &
SS
0.03
<0.
219.
87.
0111
.01
188.
9—
0.06
30.
051
0.06
0<
1
10/2
2/02
12:4
6Sc
oggi
ns (R
M 4
.8)
Bact
i15
.67.
289.
9267
.6—
10/2
2/02
12:4
6Sc
oggi
ns (R
M 4
.8)
Nut
r & S
S15
.67.
289.
9267
.6—
0.02
0<
0.00
30.
010
4.0
12/1
0/02
11:2
5Sa
in (R
M 1
.6)
Bact
iX
2.40
19.1
5.5
7.04
10.4
874
.827
.8*
12/1
0/02
11:2
5Sa
in (R
M 1
.6)
Nut
r & S
SX
2.40
19.1
5.5
7.04
10.4
874
.827
.8*
0.08
60.
006
0.20
037
.0
12/1
0/02
10:4
5Sc
oggi
ns (R
M 8
.0)
Bact
iX
2.55
18.6
5.2
7.13
9.93
69.2
5.2*
12/1
0/02
10:4
5Sc
oggi
ns (R
M 8
.0)
Nut
r & S
SX
2.55
18.6
5.2
7.13
9.93
69.2
5.2*
A0.
023
0.00
50.
120
6.0
12/1
0/02
10:4
5Sc
oggi
ns (R
M 8
.0)
Nut
r & S
SX
2.55
18.6
5.2
7.13
9.93
69.2
5.2*
B0.
021
0.00
40.
120
6.0
12/1
0/02
10:1
0Ta
nner
(RM
1.6
)Ba
cti
X0.
200.
216.
16.
9811
.47
158.
06.
7*
12/1
0/02
10:1
0Ta
nner
(RM
1.6
)N
utr &
SS
X0.
200.
216.
16.
9811
.47
158.
06.
7*0.
320
0.05
40.
110
77.0
HA
GG
LA
KE
TR
IBU
TAR
Y M
ON
ITO
RIN
G 2
002
— P
HY
SIC
AL
AN
D C
HE
MIC
AL
DA
TA (
CO
NT
INU
ED
) (S
HE
ET
3 O
F 3
)[A
bbre
viat
ions
:Sto
rm=
an X
indi
cate
s a
stor
m s
ampl
e; T
emp=
wat
er te
mpe
ratu
re; D
O=
diss
olve
d ox
ygen
; Con
d.=
cond
uctiv
ity; T
urbi
d.=
turb
idity
; DU
P=
dupl
icat
e sa
mpl
es; T
otal
P=
tota
l ph
osph
orus
; SR
P=
solu
ble
reac
tive
phos
phor
us; T
KN
=to
tal K
jeld
ahl n
itrog
en; T
SS
=to
tal s
uspe
nded
sol
ids;
Nut
r &
SS
=nu
trie
nts
and
susp
ende
d so
lids;
Bac
ti=ba
cter
ia; *
the
turb
idity
pro
be
had
inte
rmitt
ent p
robl
ems
in 2
002
& r
esul
ts s
houl
d be
eva
luat
ed a
ccor
ding
ly.]
Dat
eT
ime
Lo
cati
on
An
alys
es
Storm
FIE
LD
DA
TAR
ES
ULT
S O
F C
HE
MIC
AL
AN
ALY
SE
S
Sta
ge
(fee
t)F
low
(CF
S)
Tem
p.
(ºC
)p
HD
O(m
g/L)
Co
nd
.(µ
S/c
m)
Turb
id.
(NT
U)
Dup
Tota
l P(m
g/L
as
P)
SR
P(m
g/L
as
P)
NO
3/N
O2
(mg/
L as
N
)
TK
N(m
g/L
as
N)
Am
mo
nia
(mg/
L as
N
)
TS
S(m
g/L)

APPENDIX G—Hagg Lake Monitoring Program2002 Tualatin River Flow Management Report G-19
HAGG LAKE TRIBUTARY MONITORING 2002 — BACTERIOLOGICAL DATA
Date Time LocationSample Depth
(m)E. coli /100 ml
(MPN)Total Coliform/100 ml
(MPN)
01/29/02 9:24 Sain Ck (RM 1.6) 0.0 2 210
01/29/02 9:04 Scoggins Ck (RM 8.0) 0.0 2 166
01/29/02 8:48 Tanner Ck (RM 1.6) 0.0 7 461
01/29/02 9:45 Scoggins Ck (RM 4.8) 0.0 7 579
02/26/02 9:10 Sain Ck (RM 1.6) 0.0 1 96
02/26/02 8:55 Scoggins Ck (RM 8.0) 0.0 4 91
02/26/02 8:44 Tanner Ck (RM 1.6) 0.0 11 285
02/26/02 9:28 Scoggins Ck (RM 4.8) 0.0 6 435
03/19/02 10:49 Sain Ck (RM 1.6) 0.0 12 649
03/19/02 10:32 Scoggins Ck (RM 8.0) 0.0 4 308
03/19/02 10:14 Tanner Ck (RM 1.6) 0.0 81 >2419
03/19/02 11:12 Scoggins Ck (RM 4.8) 0.0 10 816
04/02/02 9:49 Sain Ck (RM 1.6) 0.0 <1 156
04/02/02 9:29 Scoggins Ck (RM 8.0) 0.0 1 133
04/02/02 9:08 Tanner Ck (RM 1.6) 0.0 20 225
04/02/02 10:17 Scoggins Ck (RM 4.8) 0.0 6 179
05/20/02 12:40 Sain Ck (RM 1.6) 0.0 8 411
05/20/02 12:22 Scoggins Ck (RM 8.0) 0.0 7 178
05/20/02 12:05 Tanner Ck (RM 1.6) 0.0 30 980
05/20/02 13:00 Scoggins Ck (RM 4.8) 0.0 12 579
06/25/02 10:00 Sain Ck (RM 1.6) 0.0 51 387
06/25/02 9:15 Scoggins Ck (RM 8.0) 0.0 52 579
06/25/02 8:45 Tanner Ck (RM 1.6) 0.0 78 1553
06/25/02 10:35 Scoggins Ck (RM 4.8) 0.0 72 1986
07/23/02 10:45 Sain Ck (RM 1.6) 0.0 88 1414
07/23/02 9:28 Scoggins Ck (RM 8.0) 0.0 24 1300
07/23/02 9:04 Tanner Ck (RM 1.6) 0.0 249 >2419
07/23/02 11:20 Scoggins Ck (RM 4.8) 0.0 12 613
08/20/02 12:06 Sain Ck (RM 1.6) 0.0 128 1414
08/20/02 11:48 Scoggins Ck (RM 8.0) 0.0 46 921
08/20/02 11:34 Tanner Ck (RM 1.6) 0.0 78 1553
08/20/02 12:30 Scoggins Ck (RM 4.8) 0.0 9 517
09/24/02 11:28 Sain Ck (RM 1.6) 0.0 36 866
09/24/02 11:14 Scoggins Ck (RM 8.0) 0.0 6 1300
09/24/02 10:57 Tanner Ck (RM 1.6) 0.0 20 1553
09/24/02 11:52 Scoggins Ck (RM 4.8) 0.0 5 231
10/22/02 12:22 Sain Ck (RM 1.6) 0.0 13 517
10/22/02 12:04 Scoggins Ck (RM 8.0) 0.0 6 727
10/22/02 11:46 Tanner Ck (RM 1.6) 0.0 144 1120
10/22/02 12:46 Scoggins Ck (RM 4.8) 0.0 6 204
12/10/02 11:25 Sain Ck (RM 1.6) 0.0 172 >2419
12/10/02 10:45 Scoggins Ck (RM 8.0) 0.0 56 2419
12/10/02 10:10 Tanner Ck (RM 1.6) 0.0 548 >2419
12/10/02 — Scoggins Ck (RM 4.8) 0.0 — —

APPENDIX G—Hagg Lake Monitoring ProgramG-20 2002Tualatin River Flow Management Report
HAGG LAKE MONITORING 2002 — BENTHIC INVERTEBRATE INDEX OF BIOLOGICAL INTEGRITY[Metric code: a ‘ +’ indicates a direct relation between metric value and biological integrity; a ‘–’ indicates an inverse relation between metric value and biological integrity. Condition categories: L= low, M=medium, H=high. Sample collected 10/25/02.]
MetricSain Creek Scoggins Ck Tanner Ck
Value Score Value Score Value Score
+ Total number of taxa 39 3 42 5 41 5
+ Number of Ephemeroptera taxa 12 5 8 3 7 3
+ Number of Plecoptera taxa 6 3 5 3 7 3
+ Number of Tricoptera taxa 3 1 1 1 7 3
+ Number of long-lived taxa 6 5 2 1 4 3
+ Number of intolerant taxa 3 3 2 3 1 1
– Percent tolerant taxa 25.65 3 34.74 3 46.12 3
+ Percent predator 1.24 1 3.15 1 3.82 1
+ Number of clinger taxa >20 5 >20 5 >20 5
– Percent Dominance (3 taxa) 87.33 1 63.18 3 68.92 3
BIBI TOTAL SCORE 30 28 30
BIOLOGICAL CONDITION CATEGORY M M M
Cagegories based on comparison with unimpacted Puget Lowland and Willamette Valley streams. Scores indicate: 1-low, 3-moderate, 3-high. Maximum IBI score=50. BIBI scores: 0–24=L, 25–39=M, >40=H. Based on average/summation of 3 replicates, not on each individual replicate. Riffle habitat. D-Frame net; 5 point composite sample; total 2 m2; 500 micron mesh; 500+ organism subsample minimum. Based on single composite sample.
HAGG LAKE MONITORING 2002 — BENTHIC COMMUNITY INDICATORS OF BIOLOGICAL CONDITION[Metric code: a ‘ +’ indicates a direct relation between metric value and biological integrity; a ‘–’ indicates an inverse relation between metric value and biological integrity. Condition: L= low, M=medium, H=high. Sample collected 11/8/01.]
MetricSain Creek Scoggins Ck Tanner Ck
Value Condition Value Condition Value Condition
+ Total abundance (number/m2) 5730 H 2672 H 4840 H
+ EPT taxa richness 21 L 14 L 21 L
+ Predator richness 7 L 6 H 8 L
+ Scraper richness 17 H 11 M 12 M
+ Shredder richness 4 L 5 M 7 M
+ Percent intolerant taxa 0.41 L 0.3 L 0.33 L
– Community tolerance 5.6 L 4.97 L 5.05 L
– Percent collector 91.37 L 72.92 L 81.19 L
– Percent Parasite 0.42 H 3.89 L 0.67 H
– Percent Oligochaeta 0.1 H 0.75 H 1.82 M
– Number of tolerant taxa 6 L 6 L 4 M
– Percent Simuliidae 61.57 L 24.85 L 6.28 M
– Percent Chironomidae 2.41 H 14.97 M 7.6 H
Condition based on comparisons with a Pacific Northwest montane stream with high biological integrity.

APPENDIX G—Hagg Lake Monitoring Program2002 Tualatin River Flow Management Report G-21
HAGG LAKE MONITORING 2002 — BENTHIC INVERTEBRATE DENSITY (SHEET 1 OF 2)[Sample collected October 25, 2002]
TAXON
SAIN CK (RM 1.6) SCOGGINS CK (RM 8.0) TANNER CK (RM 1.6)
Abundance(number/m2)
Percent of Total
Abundance(number/m2)
Percent of Total
Abundance(number/m2)
Percent of Total
NO
N-I
NS
EC
TS
Acari 24 0.42 104 3.89 24 0.50
Fluminicola 6 0.10 — — — —
Juga 96 1.68 28 1.05 16 0.33
Nematoda — — — — 8 0.17
Oligochaeta 6 0.10 20 0.75 88 1.82
Physella — — — — 8 0.17
Pisidium 6 0.10 — — — —
TOTAL NON-INSECTS 138 2.41 152 5.69 144 2.98
EP
HE
ME
RO
PT
ER
A
Ameletus — — 16 0.60 8 0.17
Baetis tricaudatus 1332 23.25 828 30.99 2120 43.80
Caudatella hystrix 12 0.21 — — — —
Cinygmula 18 0.31 32 1.20 168 3.47
Diphetor hageni 6 0.10 4 0.15 120 2.48
Drunella coloradensis/flavilinea 12 0.21 — — — —
Drunella doddsi 6 0.10 — — — —
Epeorus-early instar 36 0.63 72 2.69 — —
Epeorus grandis 6 0.10 — — — —
Ephemerella inermis/infrequens 18 0.31 12 0.45 8 0.17
Ironodes 12 0.21 — — — —
Paraleptophlebia 42 0.73 40 1.50 912 18.84
Rhithrogena 138 2.41 120 4.49 8 0.17
TOTAL EPHEMEROPTERA 1638 28.59 1124 42.07 3344 69.09
PL
EC
OP
TE
RA
Calineuria californica — — — — 8 0.17
Capniidae — — 68 2.54 104 2.15
Hesperoperla pacifica 6 0.10 — — — —
Isoperla 12 0.21 — — 16 0.33
Leuctridae — — 4 0.15 16 0.33
Pteronarcys californica 6 0.10 — — — —
Skwala 6 0.10 4 0.15 8 0.17
Sweltsa 24 0.42 40 1.50 72 1.49
Zapada cinctipes 12 0.21 24 0.90 56 1.16
TOTAL PLECOPTERA 66 1.15 140 5.24 280 5.79
TR
ICH
OP
TE
RA
Arctopsyche grandis 12 0.21 — — — —
Glossosoma — — — — 32 0.66
Hydropsyche 144 2.51 — — 16 0.33
Hydroptila — — 4 0.15 — —
Lepidostoma-panel case larvae — — — — 8 0.17
Lepidostoma-turret case larvae — — — — 8 0.17
Micrasema — — — — 8 0.17
Onocosmoecus unicolor — — — — 8 0.17
Rhyacophila Betteni group 6 0.10 — — 32 0.66
TOTAL TRICHOPTERA 162 2.83 4 0.15 112 2.31

APPENDIX G—Hagg Lake Monitoring ProgramG-22 2002Tualatin River Flow Management Report
CO
LE
OP
TE
RA
Dytiscidae 6 0.10 8 0.30 — —
Heterlimnius — — 12 0.45 144 2.98
Lara avara — — — — 8 0.17
Narpus 6 0.10 4 0.15 — —
Optioservus 12 0.21 56 2.10 88 1.82
Zaitzevia 18 0.31 — — — —
TOTAL COLEOPTERA 42 0.73 80 2.99 240 4.96
DIP
TE
RA
Antocha 6 0.10 68 2.54 — —
Ceratopogoninae — — 8 0.30 — —
Cryptolabis — — 16 0.60 — —
Dixa — — 12 0.45 40 0.83
Hexatoma — — — — 8 0.17
Maruina 12 0.21 — — — —
Sciomyzidae — — 4 0.15 — —
Simulium 3528 61.57 664 24.85 304 6.28
TOTAL DIPTERA 3546 61.88 772 28.89 352 7.27
CH
IRO
NO
MID
AE
Brillia 18 0.31 16 0.60 — —
Chironomidae-pupae 6 0.10 32 1.20 48 0.99
Corynoneura — — 8 0.30 8 0.17
Cricotopus Bicinctus group — — 20 0.75 — —
Eukiefferiella 18 0.31 40 1.50 120 2.48
Larsia — — — — 16 0.33
Lopescladius — — 4 0.15 — —
Micropsectra 6 0.10 28 1.05 — —
Microtendipes — — — — 8 0.17
Parametriocnemus 18 0.31 — — 40 0.83
Paratanytarsus — — 4 0.15 — —
Polypedilum — — 16 0.60 — —
Potthastia Lingimana group — — 4 0.15 — —
Pseudomittia — — 4 0.15 — —
Synorthocladius — — 4 0.15 — —
Tanytarsus — — 4 0.15 24 0.50
Thienemannimyia group — — 20 0.75 24 0.50
Tvetenia Bavarica group 72 1.26 196 7.34 80 1.65
TOTAL CHIRONOMIDAE 138 2.41 400 14.97 368 7.60
TOTAL BENTHIC INVERTEBRATES 5730 100.00 2672 100.00 4840 100.00
HAGG LAKE MONITORING 2002 — BENTHIC INVERTEBRATE DENSITY (CONTINUED) (SHEET 2 OF 2)[Sample collected October 25, 2002]
TAXON
SAIN CK (RM 1.6) SCOGGINS CK (RM 8.0) TANNER CK (RM 1.6)
Abundance(number/m2)
Percent of Total
Abundance(number/m2)
Percent of Total
Abundance(number/m2)
Percent of Total

APPENDIX G—Hagg Lake Monitoring Program2002 Tualatin River Flow Management Report G-23
HAGG LAKE MONITORING 2002 — WEATHER OBSERVATIONS
Date Time LocationAir Temp
(ºC)Barometer
(mm Hg)
Wind(Beaufort
Scale)
Wind Direction
% Cloud Cover
Comments
1/15/2002 9:49 Hagg Lake 0 771 2 E 100 Heavy fog
1/29/2002 8:35 Tanner Cr -2 770 1 N 100
1/29/2002 9:00 Scoggins Cr (RM 8.0) -2 770 1 N 100
1/29/2002 9:22 Sain Cr -1 770 1 N 100
1/29/2002 9:44 Scoggins Cr (RM 4.8) 0 770 1 N 100
2/12/2002 7:45 Hagg Lake -2 773 1 E 80
2/26/2002 8:40 Tanner Cr 2 775 0 — 0
2/26/2002 8:49 Scoggins Cr (RM 8.0) 3 775 0 — 0
2/26/2002 9:06 Sain Cr 3 775 0 — 0
2/26/2002 9:26 Scoggins Cr (RM 4.8) 2 775 0 — 0
3/19/2002 8:33 Hagg Lake 8 766 2 W 100 Rain
3/19/2002 10:10 Tanner Cr 9 766 2 W 100 Rain
3/19/2002 10:28 Scoggins Cr (RM 8.0) 9 766 2 W 100 Rain
3/19/2002 10:49 Sain Cr 9 766 2 W 100 Rain
3/19/2002 11:05 Scoggins Cr (RM 4.8) 9 766 2 W 100 Rain
4/2/2002 8:57 Tanner Cr 12 767 2 NW 60
4/2/2002 9:21 Scoggins Cr (RM 8.0) 12 767 1 NW 70
4/2/2002 9:46 Sain Cr 12 767 1 NW 60
4/2/2002 10:14 Scoggins Cr (RM 4.8) 12 767 2 W 70
4/23/2002 9:00 Hagg Lake 10 768 1 w 80 Hazy
5/20/2002 10:00 Hagg Lake 10 757 0 — 100 Ready to rain
5/20/2002 N00N Tanner Cr 16 757 0 — 75 Clearing skies
5/20/2002 12:20 Scoggins Cr (RM 8.0) 18 757 0 — 40
5/20/2002 12:40 Sain Cr 18 757 0 — 70
5/20/2002 13:00 Scoggins Cr (RM 4.8) 19 757 0 — 50
6/3/2002 10:00 Hagg Lake 12 764 2 W 100
6/24/2002 10:30 Hagg Lake 32 766 0 — 10
6/25/2002 8:30 Tanner Cr 22 763 0 50
6/25/2002 9:10 Scoggins Cr (RM 8.0) 22 763 0 70
6/25/2002 10:00 Sain Cr 24 763 0 60
6/25/2002 10:35 Scoggins Cr (RM 4.8) 25 763 0 60
7/15/2002 9:45 Hagg Lake 22 762 1 SE 5
7/23/2002 8:45 Tanner Cr 20 764 0 10
7/23/2002 9:25 Scoggins Cr (RM 8.0) 22 764 0 15
7/23/2002 10:40 Sain Cr 22 764 0 100
7/23/2002 11:11 Scoggins Cr (RM 4.8) 23 764 0 75
7/30/2002 9:00 Hagg Lake 26 765 0 30
8/20/2002 9:22 Hagg Lake 14 762 1 E 60
8/20/2002 11:34 Tanner Cr 16 762 0 75
8/20/2002 11:48 Scoggins Cr (RM 8.0) 16 762 0 80
8/20/2002 12:06 Sain Cr 16 762 0 100
8/20/2002 12:30 Scoggins Cr (RM 4.8) 18 762 0 100
8/26/2002 9:10 Hagg Lake 22 762 4 N 75

APPENDIX G—Hagg Lake Monitoring ProgramG-24 2002Tualatin River Flow Management Report
9/16/2002 10:04 Hagg Lake 20 759 1 SW 100
9/24/2002 8:49 Hagg Lake 17 762 0 0
9/24/2002 10:55 Tanner Cr 20 762 0 0
9/24/2002 11:10 Scoggins Cr (RM 8.0) 22 762 0 0
9/24/2002 11:25 Sain Cr 23 762 0 0
9/24/2002 11:50 Scoggins Cr (RM 4.8) 25 762 0 0
10/8/2002 10:00 Hagg Lake 17 767 2 SW 95
10/22/2002 9:46 Hagg Lake 10 763 1 NW 100
10/22/2002 11:46 Tanner Cr 14 763 1 NW 5
10/22/2002 N00N Scoggins Cr (RM 8.0) 15 763 0 0
10/22/2002 12:25 Sain Cr 15 763 0 0
10/22/2002 12:45 Scoggins Cr (RM 4.8) 15 763 0 0
11/19/2002 10:15 Hagg Lake 12 773 2 SW 100
12/10/2002 2 Tanner Cr 7 759 2 SW 10 Rain
12/10/2002 10:45 Scoggins Cr (RM 8.0) 8 759 3 SW 100 Heavy rain
12/10/2002 11:25 Sain Cr 8 759 3 sw 100 Heavy rain
HAGG LAKE MONITORING 2002 — WEATHER OBSERVATIONS
Date Time LocationAir Temp
(ºC)Barometer
(mm Hg)
Wind(Beaufort
Scale)
Wind Direction
% Cloud Cover
Comments
Appendix HAppendix HAppendix HAppendix H
Monthly PrecipitationMonthly PrecipitationMonthly PrecipitationMonthly Precipitation

APPENDIX H—Monthly PrecipitationH-2 2002 Tualatin River Flow Management Report
PRECIPITATION AT SCOGGINS DAM
YearMay
(inches)June
(inches)July
(inches)August(inches)
September(inches)
October(inches)
November(inches)
May-Oct Total
(inches)
1990 — 2.02 0.26 1.18 0.00 2.62 4.49 >6.08
1991 2.29 1.42 0.22 0.54 0.23 1.80 — >6.50
1992 0.09 0.71 0.42 0.35 1.47 2.84 5.94 5.88
1993 3.95 2.26 2.59 0.17 0.02 1.21 1.92 10.20
1994 0.96 1.30 0.00 0.13 0.98 4.94 9.30 8.31
1995 1.47 2.44 0.58 1.01 1.89 3.70 12.24 11.09
1996 4.49 1.59 0.58 0.34 2.32 5.44 8.73 14.76
1997 2.68 3.34 0.29 1.28 4.52 8.57 4.41 20.68
1998 4.56 0.96 0.24 0.00 0.91 4.51 15.20 11.18
1999 2.15 0.93 0.08 0.96 0.06 3.13 12.68 7.31
2000 2.94 2.26 0.03 0.19 0.81 3.24 3.08 9.47
2001 2.20 1.79 0.23 0.78 0.53 3.28 12.10 8.81
2002 1.58 1.46 0.13 0.19 0.57 0.73 4.37 4.66
Minimum 0.09 0.71 0.00 0.00 0.00 0.73 1.92 4.66
Maximum 4.56 3.34 2.59 1.28 4.52 8.57 15.20 20.68
Mean 2.45 1.73 0.43 0.55 1.10 3.54 7.87 9.61

APPENDIX H—Monthly Precipitation2002 Tualatin River Flow Management Report H-3
May June July August September October November
Pre
cip
tiat
ion
(in
ches
)
0.0
16.0
14.0
12.0
10.0
8.0
6.0
4.0
2.0
Range of values 1990–2002
Mean of values 1990–2002
2002 value
Monthly Precipitation Comparison
0.0
22.0
20.0
18.0
16.0
8.0
6.0
4.0
2.0
14.0
12.0
10.0
Annual ‘Dry Season’ Precipitation Comparison
May
– O
cto
ber
To
tal P
reci
pti
atio
n (
inch
es)
1990 1991 1992 1993 1996 1999 2001200019981994 19971995 2002

Appendix IAppendix IAppendix IAppendix I
River Mile IndicesRiver Mile IndicesRiver Mile IndicesRiver Mile Indices

APPENDIX I—River Mile IndicesI-2 2001 Tualatin River Flow Management Report
STREAMS INDEXED
Fanno Creek
Cr
Cr
Cr
S. Rock
McF
ee C
r
Christensen
Creek
Creek
Rock
Gales
Creek
SCHO
Scog
Barney Reservoir
Scoggins Reservoir
Lake Oswego
WI L L A M
E T T E RI V
ER
TU
AL
R
Streams that are Indexed
Withdrawal Points
Wastewater Treatment Plants
Dairy
Creek
Burris Cr
He Cr
Baker CrChicken
Cedar Cr
Canal
(Hagg Lake)
Ash C
r
Hedges Cr
Sain Cr
Ta
gins
Car
pe
Dawson Cr
Beave
rton
Creek
nner Cr
nter
Cr
onat
Lake Oswego
AT
IN
VE
RI
Coun
sil
Cr
S. Johns on Cr
Saum Cr
Springbrook Cr
Butternut Cr
CreekMcKay
East
West Fork
Fork
Brons
CedarMill Cr
on Cr
North
SCHEMATIC MAPSCHEMATIC MAPSCHEMATIC MAPSCHEMATIC MAPNot to Scale

APPENDIX I—River Mile Indices2001 Tualatin River Flow Management Report I-3
STREAMS INDEXED
STREAM NAME HYDROLOGIC UNIT CODE PAGE
Tualatin River 211400300 I-4
Dairy Creek 211400300480 I-9
East Fork Dairy Creek 211400300480080 I-11
West Fork Dairy Creek 211400300480090 I-12
Fanno Creek 211400300180 I-13
McKay Creek 211400300480020 I-10
Scoggins Creek 211400300640 I-7
Gales Creek 211400300560 I-8

APPENDIX I—River Mile IndicesI-4 2001 Tualatin River Flow Management Report
TUALATIN RIVER — RIVER MILE INDEXHUC: 211400300[Elevation measured relative to 0.00 gage datum; Abbreviations: RB= right bank, LB= left bank, HUC= Hydrologic Unit Code]
River Mile Bank DescriptionDrainage Area(square miles)
Elevation(feet)
0.00 Mouth of Tualatin River at Willamette River(LB of Willamette River @ River Mile 28.5)
712
0.20 Weiss Bridge – Petes Mtn Rd.
1.60 RB Fields Creek (HUC: 02114003000010)
1.69 State Hwy 212 Bridge (Fields Bridge)
1.75 LB West Linn Stream Gage Station – USGS #14207500 706 85.61
2.40 LB Tate Creek (HUC: 02114003000020)
3.45 Lake Oswego Corp. Diversion Dam
4.25 Interstate 205 Bridge
4.56 LB Wilson Creek (HUC: 02114003000080)
5.34 LB Boat Launch
5.36 LB Shipley Creek (HUC: 02114003000100)
5.38 Shipley Bridge– Stafford Rd.NWS Wire Weight Gage
5.62 LB Pecan Creek (HUC: 02114003000120)
6.02 RB Athey Creek (HUC: 02114003000123)
6.70 RB Saum Creek (HUC: 02114003000130)
6.70LB
Oswego Canal DiversionRiver Elevation Recording Gage #14206990, Headgate, andCanal Recording Gage #14207000
7.36 LB Boat Launch – Dogwood Drive
7.67 RB Browns Ferry Park Canoe Launch
7.83 Clackamas County – Washington County Boundary(Underground Cable Crossing Sign)
8.18 Interstate 5 Bridge
8.60 Boones Ferry Road Bridge
8.64 RB Hedges Creek (HUC: 02114003000150)
8.90 RB Tualatin Park Boat Launch
8.91RB
Southern Pacific RR BridgeTualatin River at Tualatin Elevation Recording Station #14206960
9.32 LB Fanno Creek (HUC: 02114003000180) [Index on page I-13] 26.8
9.33 LB Durham Wastewater Treatment Plant Outfall
9.34 Oregon Electric RR Bridge
9.80 LB Cook Park Boat Launch
11.50LB
US Hwy. 99W Bridge (Pacific Highway)Canoe Launch(access from southeast of bridge)
12.68 Overhead BPA Transmission Line; Vancouver–Eugene
12.80 LB Rivermeade Boat Launch (Private)
15.20 RB Rock Creek–South (HUC: 02114003000250) 13.7
15.50 RB Chicken Creek (HUC: 02114003000270)
16.09 RB Chicken Creek Drainage Ditch
16.22RB
Shamberg Bridge (Elsner Road)Rated Staff Gage for Stream Flow

APPENDIX I—River Mile Indices2001 Tualatin River Flow Management Report I-5
21.12 Overhead BPA Transmission Line; Big Eddy–Keeler
26.90 State Hwy. 210 bridge (Scholls)
28.20 RB McFee Creek (HUC: 02114003000310)
30.76 LB Unnamed Stream (HUC: 02114003000320) (Jacktown)
31.62 RB Burris Creek (HUC: 02114003000330)
31.92 RB Christensen Creek (HUC: 02114003000350)
33.30LB
Harris Bridge (State Highway 208)Farmington Recording Stream Gage #14206500
568 100.42
35.68 LB Butternut Creek (HUC: 02114003000380)
37.38 LB Gordon Creek (HUC: 02114003000400)
38.08 LB Rock Creek Wastewater Treatment Plant Outfall
38.09 LB Rock Creek (HUC: 02114003000420Beaverton Creek (HUC:02114003000420060)
74.636
38.44 LB
LB
Rood Bridge Small Watercraft LaunchRood Bridge Road BridgeRecording Stream Gage #14206295 105.16
40.44 RB Davis Creek (HUC: 02114003000430)
41.64 Minter Bridge Road Bridge
43.88 LB
LB
Jackson SloughJackson Bottom WetlandsHillsboro Wastewater Treatment Plant Effluent Outfall
44.40RB
State Highway 219 BridgeRated Staff Gage for Stream Flow
44.73 LB Dairy Creek (HUC: 02114003000480) [Index on page I-9]McKay Creek (LB) (HUC: 02114003000480020) [Index on page I-10]East Fork Dairy Creek (HUC: 02114003000480080) [Index on page I-11]West Fork Dairy Creek (HUC: 02114003000480090) [Index on page I-12]
22663.4
51.54RB
Golf Course Road BridgeGolf Course Recording Stream Gage #14204800
53.74 LaFollett Road (Bridge removed)
55.24 LB Forest Grove Wastewater Treatment Plant OutfallFern Hill Wetlands
55.32 Fernhill Road Bridge
56.10 Springhill Pump Plant Intake
56.80 LB Gales Creek (HUC: 02114003000560) [Index on page I-8] 78.6
57.38 LB Carpenter Creek (HUC: 02114003000580)
57.84 LB Dilley Creek (HUC: 02114003000600)
58.04 LB Johnson Creek (HUC: 02114003000602)
58.82LB
Springhill Road BridgeTualatin River at Dilley Stream Gage; USGS #14203500
125 147.57
59.02 LB O'Neil Creek (HUC: 02114003000620)
60.00 LB Scoggins Creek (HUC: 02114003000640) [Index on page I-7]
60.80 RB Wapato Creek (HUC: –02114003000670)Wapato Creek Improvement District Return Flow
62.00 RB Wapato Improvement District Headgate)
62.24 Southern Pacific RR Bridge
TUALATIN RIVER — RIVER MILE INDEXHUC: 211400300[Elevation measured relative to 0.00 gage datum; Abbreviations: RB= right bank, LB= left bank, HUC= Hydrologic Unit Code]
River Mile Bank DescriptionDrainage Area(square miles)
Elevation(feet)

APPENDIX I—River Mile IndicesI-6 2001 Tualatin River Flow Management Report
62.25 State Highway 47 Bridge (Gaston)New Tualatin River at Gaston Recording Stream Gage #14202510
62.30 Bates Road Bridge
62.80 LB Black Jack Creek (HUC: 02114003000700)
62.90 Overhead BPA Transmission Line; Forest Grove–McMinnville
63.13 TVID Patten Valley Pump Station Outfall #1
63.87 RB Discontinued Tualatin River at Gaston Recording Stream Gage 48.5
64.26 TVID Patten Valley Pump Station Outfall #2
65.34 RB Williams Canyon (HUC: 02114003000730)
65.90 Mt. Richmond Road Bridge
67.30 LB Hering Creek (HUC: 02114003000760)
67.83 South Road Bridge (Cherry Grove)
68.44 RB Roaring Creek (HUC: 02114003000790)
69.42 Little Lee Falls
70.70LB
Raines Bridge– Tualatin River below Lee FallsRated Staff Gage for Stream Flow
71.07 Lee Falls
73.28 Haines Falls
73.30 LB City of Hillsboro Haines Falls Intake
74.00 LB Lee Creek (LB–02114003000860)
74.05 RB Patten Creek (HUC: 02114003000870)
75.70 LB Sunday Creek (HUC: 02114003000900)
76.60 LB Maple Creek (HUC: –02114003000940)
76.95 Ki–A–Cut Falls
78.00 RB Barney Reservoir Aqueduct Outfall
79.3+ Headwaters of Tualatin River
TUALATIN RIVER — RIVER MILE INDEXHUC: 211400300[Elevation measured relative to 0.00 gage datum; Abbreviations: RB= right bank, LB= left bank, HUC= Hydrologic Unit Code]
River Mile Bank DescriptionDrainage Area(square miles)
Elevation(feet)

APPENDIX I—River Mile Indices2001 Tualatin River Flow Management Report I-7
SCOGGINS CREEK — STREAM MILE INDEXHUC: 2114003000640[Abbreviations: RB= right bank, LB= left bank, HUC= Hydrologic Unit Code]
River Mile Bank Description
0.00 Confluence with Tualatin River (HUC: 0211400300) @ River Mile 60.00
0.94 RR Bridge
1.00 State Highway 47 Bridge
1.70 Old State Highway 47 Bridge
1.71 Scoggins Creek near Gaston, OR – Former USGS Gage #14203000 (10/1940 – 9/1974)Drainage Area = 43.3 square miles
4.80 Scoggins Creek below Henry Hagg Lake, near Gaston, OR – USGS Gage #14202980 (1/1975 –present)Drainage Area = 38.8 square miles
5.10 Scoggins Dam
7.00 RB Sain Creek (HUC: 02114003000640170)
7.62 LB Tanner Creek (HUC: 02114003000640200)
8.40 LB Wall Creek (HUC: 02114003000640220)
9.00 Lake Loop Road Bridge
9.30 Scoggins Creek above Henry Hagg, near Gaston, OR – Gage #14202850 (10/1972 – present)Drainage Area = 15.9 square miles
10.52 LB Parson Creek (HUC: 02114003000640240)
15.50 LB Fisher Creek (HUC: 02114003000640300)

APPENDIX I—River Mile IndicesI-8 2001 Tualatin River Flow Management Report
GALES CREEK — STREAM MILE INDEXHUC: 2114003000560[Abbreviations: RB= right bank, LB= left bank, HUC= Hydrologic Unit Code, ISWR= Instream Water Right]
River Mile RB Description
0.00 Confluence with Tualatin River (HUC: 0211400300) @ River Mile 56.80ISWR: C–59523 5/25/66
1.63 Southern Pacific RR Bridge
1.75 Forest Grove Bypass Bridge – State Highway 47 to State Highway 8
2.36 State Highway 47 BridgeGales Creek Recording Stream Gage #14204530
3.66 Ritchey Road Bridge (County Road 461)
6.53 RB Prickett Creek (HUC: 02114003000560090)
6.98 Stringtown Road Bridge (County Road A–176)
7.70 RB Roderick Creek (HUC: 02114003000560110)
8.56 Roderick Road Bridge (County Road 395)Gales Creek near Forest Grove Oregon – Former USGS Gage #14204500 (10/40–9/56 & 10/70–9/81)
8.94 RB Godfrey Creek (HUC: 02114003000560130)
9.22 LB Kelly Creek (HUC: 02114003000560120)
10.68 RB Clear Creek (HUC: 02114003000560150)
11.44 RB Iler Creek (HUC: 02114003000560170)
11.46 NW Gales Creek Road (County Road 1312)Community of Gales Creek
11.47 RB Fir Creek (HUC: 02114003000560190)
12.00 ISWR: C–59509 5/25/66 above this point
12.36 Clapshaw Hill Road Bridge (County Road 2037)Rated Staff Gage for Stream Flow
12.40 LB Little Beaver Creek (HUC: 02114003000560200)
ISWR: C–59512 5/25/66
12.92 Parson Road Bridge
14.44 RB White Creek (HUC: 02114003000560210)
14.68 NW Wilson River Highway Bridge (State Highway 6)
15.74 RB Lyda Creek (HUC: 02114003000560230)
16.26 RB Bateman Creek (HUC: 02114003000560250)
17.50 Gales Creek near Gales Creek, OR – Former USGS Gage #1420400 (10/35–9/45 & 10/639/70)
18.00 LB Beaver Creek (HUC: 02114003000560280)Community of GlenwoodISWR: C–59524 5/25/66
18.45 NW Timber Road Bridge (County Road 374)
18.65 Wilson River Highway Bridge (State Highway 6)
19.70 Wilson River Highway Bridge (State Highway 6)
19.88 LB Coffee Creek (HUC: 02114003000560300)
20.07 LB Finger Creek (HUC: 02114003000560305)
20.70 RB South Fork Gales Creek (HUC: 02114003000560310)ISWR: C–59514 5/25/66
21.60 LB North Fork Gales Creek (HUC: 02114003000560320)ISWR: C–59513 5/25/66
22.76 RB Low Divide Creek (HUC: 02114003000560330)
Gales Creek Forest Park
23.20 Gales Creek near Glenwood, OR – USGS Gage #14203750 (7/94 – present )

APPENDIX I—River Mile Indices2001 Tualatin River Flow Management Report I-9
DAIRY CREEK — STREAM MILE INDEXHUC: 02114003000480[Abbreviations: RB= right bank, LB= left bank, HUC= Hydrologic Unit Code]
River Mile Bank Description
0.00 Confluence with Tualatin River (HUC: 0211400300) @ River Mile 44.73
1.65 Southern Pacific RR Bridge
2.06 State Highway 8 BridgeDairy Creek at TW Hwy Recording Stream Gage #14206200
2.20 Oregon Electric RR Bridge
2.26 LB McKay Creek (HUC: 02114003000480020)
3.53 RB Council Creek (HUC: 02114003000480040)
6.02 Susbauer Road Bridge (County Road 196)
7.39 BPA Power Line Crossing
8.51 Cornelius–Schefflin Road Bridge (County Road 2161)Rated Staff Gage for Stream Flow
10.55 Confluence of East Fork Dairy Ck (HUC: 02114003000480080) & West Fork Dairy Ck (02114003000480090)

APPENDIX I—River Mile IndicesI-10 2001 Tualatin River Flow Management Report
MC KAY CREEK — STREAM MILE INDEXHUC: 2114003000480020[Abbreviations: RB= right bank, LB= left bank, HUC= Hydrologic Unit Code]
River Mile Bank Description
0.00 Confluence with Dairy Creek (HUC: 02114003000480) @ River Mile 2.26
1.31 Padgett Road Bridge (County Road 2245)
2.25 Hornecker Road Bridge (County Road 2393)Rated Staff Gage for Stream Flow
2.30 Southern Pacific RR Crossing
4.32 Glencoe Road Bridge (County Road A–146½)Rated Staff Gage for Stream Flow
4.46 BPA Transmission Line Crossing
5.34 LB Waible Creek (HUC: 02114003000480020040)
6.30 NW Old Scotch Church Road Bridge (County Road A–66)
8.00 US Hwy 26 Bridge – Sunset Highway
9.36 NW West Union Road Bridge (County Road 2496)City of North Plains to West
9.38 Southern Pacific RR Crossing
10.94 LB Jackson Creek (HUC: 02114003000480020100)
12.80 NW Shadybrook Road Bridge (County Road A–110)
15.56 NW Collins Road Bridge (County Road 1889)Rated Staff Gage for Stream Flow
16.56 RB Brunswick Canyon (HUC: 02114003000480020179)
16.66 LB East Fork McKay Creek (HUC: 02114003000480020180)
24.0+ Headwaters

APPENDIX I—River Mile Indices2001 Tualatin River Flow Management Report I-11
EAST FORK DAIRY CREEK — STREAM MILE INDEXHUC: 2114003000480080[Abbreviations: RB= right bank, LB= left bank, HUC= Hydrologic Unit Code, ISWR= Instream Water Right]
River Mile Bank Description
0.00 Confluence with West Fork Dairy Creek (HUC: 02114003000480090) @ River Mile 10.56 of Dairy Creek (HUC: 02114003000480)
1.24 Roy Road Bridge (County Road A–159)Rated Staff Gage for Stream Flow
2.34 Port of Tillamook Bay RR Bridge
3.04 RB Bledsoe Creek (HUC: 02114003000480080030)
3.20 Harrington Road Bridge (County Road 1989)
4.80 SP&S RR Bridge
5.56 US Highway 26 Bridges
6.91 Mountaindale Road Bridge (County Road 12)
6.97 LB Baker Creek (HUC: 02114003000480080080)
8.44 Dairy Creek Road Bridge (County Road 2067)Rated Staff Gage for Stream Flow
8.55 East Fork Dairy Creek at Mountaindale, OR – Former USGS Gage #14205500 (10/40–9/51)Drainage Area = 43.0 square miles
9.62 NW Uebel Road Bridge (County Road 304)
12.50 Murphy Lane Bridge (Private)Rated Staff Gage for Stream Flow
12.82 RB Big Canyon (HUC: 02114003000480080150)
13.00 ISWR: C–59525 5/25/66
13.95 RB Murtaugh Creek (HUC: 02114003000480080170)
14.04 LB Meadow Brook Creek (HUC: 02114003000480080180)
14.17 Meacham Road Bridge (County Road 742)
15.55 LB Plentywater Creek (HUC: 02114003000480080200)ISWR: C–59527 5/25/66
16.52 RB Denny Creek (HUC: 02114003000480080210)ISWR: C–59526 5/25/66
16.56 Bacona Road Bridge (County Road 422 )Snooseville Corner
17.21 Greener Road Bridge (County Road 1990)
17.34 LB Rock Creek (HUC: 02114003000480080260)
17.50 Little Bend Park
17.60 Fern Flat Road Crossing (County Road 241)
18.15 LB Panther Creek (HUC: 02114003000480080280)
18.31 Fern Flat Road Crossing (County Road 241)
18.84 RB Roundy Creek (HUC: 02114003000480080290)
19.10 RB Campbell Creek (HUC: 02114003000480080310)
21.30 Washington County – Columbia County Boundary
21.48 BPA Power Line Crossing
22.0 + Headwaters

APPENDIX I—River Mile IndicesI-12 2001 Tualatin River Flow Management Report
WEST FORK DAIRY CREEK — STREAM MILE INDEXHUC: 2114003000480090[Abbreviations: RB= right bank, LB= left bank, HUC= Hydrologic Unit Code]
River Mile Bank Description
0.00 Confluence with East Fork Dairy Creek (HUC: 02114003000480080) @ River Mile 10.56 of Dairy Creek (HUC: 02114003000480)
1.96 Evers Road Bridge (County Road A–187)Rated Staff Gage for Stream Flow
2.09 RB Lousignant Canal (HUC: 02114003000480090010)
2.82 State Highway 47 Bridge
5.28 Greenville Road Bridge (County Road A–159)
6.20 State Highway 6 Bridge
6.22 RB Cedar Canyon Creek (HUC: 02114003000480090110)
7.53 Cedar Canyon Road Bridge (County Road 1938)City of Banks to SE
7.70 State Hwy 47 Bridge – Rated Staff Gage for Stream FlowWest Fork Dairy Creek at Banks, OR –Former USGS Gage #14205000 (10/40 – 9/43)
Drainage Area = 47.5 square miles
7.72 Port of Tillamook Bay RR Bridge
9.30 US Highway 26 Bridge
10.60 NW Green Mountain Road Bridge (County Road 127)
11.02 LB Garrigus Creek (HUC: 02114003000480090180)
12.19 NW Turk Road Bridge (County Road 233)
12.36 RB Kuder Creek (HUC: 02114003000480090190)
12.90 NW Pihl Road Bridge (County Road 1045)Community of Manning
13.33 Port of Tillamook Bay RR Bridge
13.48 Port of Tillamook Bay RR Bridge
13.58 LB Witcher Creek (HUC: 02114003000480090200)
14.37 Port of Tillamook Bay RR Bridge
14.50 US Highway 26 Bridge
15.00 NW Fisher Road Bridge (County Road 394)
15.11 LB Mendenhall Creek (HUC: 02114003000480090220)
15.58 RB Burgholzer Creek (HUC: 02114003000480090230)
15.60 US Highway 26 Bridge
16.00 Community of Buxton – ½ mile east
17.02 LB Williams Creek (HUC: 02114003000480090240)
17.98 RB Cummings Creek (HUC: 02114003000480090250)
18.10 State Highway 47 Bridge
18.85 Port of Tillamook Bay RR Bridge
22+ Headwaters

APPENDIX I—River Mile Indices2001 Tualatin River Flow Management Report I-13
FANNO CREEK — STREAM MILE INDEXHUC: 2114003000180[Abbreviations: RB= right bank, LB= left bank, HUC= Hydrologic Unit Code, ISWR= Instream Water Right]
River Mile Bank Description
0.00 Confluence with the Tualatin River (HUC: 02114003000) at River Mile 9.32
0.86 Oregon Electric RR Bridge
1.19 Durham Road BridgeUSGS Gage #14206950
2.00 LB Ball Creek (HUC: 02114003000180020)
2.12 Bonita Street BridgeRated Staff Gage
3.28 SW Hall Blvd Bridge
3.95 SW Ash Avenue Bridge
4.28 SW Main St Bridge
4.30 State Hwy 99W Bridge
4.49 SW Grant Ave Bridge
5.07 SW Tiederman Ave. Bridge
5.08 RB Summer Creek (HUC: 02114003000180070)Rated Staff Gage at Fowler School
5.32 SW Tigard Ave Bridge
5.53 SW North Dakota St Bridge
5.54 LB Ash Creek (HUC: 02114003000180080)Rated Staff Gage at Greenburg Road
6.38 Scholls Ferry Road Bridge
7.30 Tuckerwood – Rated Staff Gage
7.66 SW Hall Blvd Bridge
8.40 SW Denny Rd Bridge
8.60 Oregon Electric RR Bridge
8.70 State Hwy 217 Bridge
9.42 Scholls Ferry Road BridgeRated Staff Gage
9.66 SW 92nd Ave Bridge
9.90 SW Bohmann Parkway Bridge
10.16 SW 86th Ave Bridge
10.78 SW Nicol Road Bridge
11.76 Olson Road Bridge
11.96 RB Sylvan Creek (HUC: 02114003000180190)
11.98 SW Beaverton–Hillsdale Hwy (State Hwy 10)
12.10 Washington County – Multnomah County Line
12.58 SW 56th Ave BridgeUSGS Gage #14206900
12.81 SW Shattuck Road Bridge
13.22 SW 45th Ave Bridge
13.23 RB Ivey Creek (HUC: 02114003000180250)
13.32 SW 43rd Ave Bridge
13.38 SW 42nd Ave Bridge
13.48 SW 39th Ave Bridge
13.98 SW Beaverton–Hillsdale Hwy (State Hwy 10)
14.10 SW 30th Ave Bridge