Embed Size (px)
Citation preview
Please refer to important disclosures at the end of this report 1
Y/E March (consolidated ` cr) 2QFY13 2QFY12 % chg (yoy) 1QFY13 % chg (qoq)
Net sales 43,403 36,198 19.9 43,324 0.2
EBITDA 5,334 4,504 18.4 5,755 (7.3)
EBITDA margin (%) 12.3 12.4 (15)bp 13.3 (99)bp
Adjusted PAT 2,085 2,316 (10.0) 2,685 (22.4)
Source: Company, Angel Research
Strong JLR performance; weak standalone results: Tata Motors (TTMT) registered a lower-than-expected bottom-line performance for 2QFY2013 due to sequential decline in operating margins (down 99bp to 12.3%) on account of deteriorating standalone performance and higher tax rate (32% as against 27.3% in 1QFY2013). Nevertheless, Jaguar and Land Rover (JLR) witnessed margin expansion of 40bp qoq to 14.8% led by favorable product-mix (higher share of Range Rover Sport) and exchange rate movement. The consolidated top-line registered a strong 19.9% yoy (flat qoq) growth, which was broadly in-line with our estimates aided by a 35.3% yoy (down 5.9% qoq) growth in JLR revenues. However, the adjusted net profit declined 22.4% qoq (10% yoy) due to high tax rate on recognition of deferred tax assets in 4QFY2012.
Standalone operating performance deteriorates further: TTMT recorded a 3.6% yoy (up strongly by 17.9% qoq on 17.1% volume growth) decline in top-line as net average realization declined 10.1% yoy on account of lower share of medium and heavy commercial vehicles (MHCV) in the product-mix. The EBITDA margin deteriorated to 5.2% (down 137bp qoq) on adverse product-mix, higher discounting and marketing spends in passenger vehicles (PV) and MHCV business and lower operating leverage benefits. During the quarter, JLR paid a dividend of GBP150mn to the parent company due to which other income stood at `1,439cr (`130cr in 2QFY2012). In the absence of the dividend income, standalone operations could have reported a net loss.
Outlook and valuation: We retain our positive view on JLR and expect a 12% volume CAGR over FY2012-14E driven by Evoque, new product launches (Range Rover, Range Rover Sport, Jaguar F-type and Sportbrake) and continuous ramp-up in China. Further, favorable market and product-mix and stable commodity prices will help mitigate raw-material cost pressures. At `269, the stock is attractively valued at 6x and 3.2x FY2014E earnings and EV/EBITDA respectively. We maintain our Buy rating on the stock with a sum-of-the-parts (SOTP) target price of `319.
Key financials (Consolidated) Y/E March (` cr) FY2011 FY2012 FY2013E FY2014E
Net Sales 122,128 165,654 192,330 219,770 % chg 32.0 35.6 16.1 14.3 Net Profit 9,043 11,442 11,741 14,126 % chg 492.6 26.5 2.6 20.3 EBITDA (%) 13.8 13.3 12.8 13.1 EPS (`) 28.5 36.1 37.0 44.5 P/E (x) 9.7 6.1 7.3 6.0 P/BV (x) 4.5 2.6 2.0 1.6 RoE (%) 65.6 44.1 31.2 28.9 RoCE (%) 23.6 24.2 22.3 23.5 EV/Sales (x) 0.8 0.6 0.5 0.4 EV/EBITDA (x) 6.1 4.4 3.8 3.2
Source: Company, Angel Research
BUY CMP `269 Target Price `319
Investment Period 12 Months
Stock Info
Sector
Net Debt (` cr) 18,030
Bloomberg Code TTMT@IN
Shareholding Pattern (%)
Promoters 34.7
MF / Banks / Indian Fls 12.3
FII / NRIs / OCBs 28.5
Indian Public / Others 24.5
Abs. (%) 3m 1yr 3yr
Sensex 7.4 7.6 17.0
Tata Motors 12.8 43.2 136.4
Reuters Code TAMO.BO
BSE Sensex 18,902
Nifty 5,760
Avg. Daily Volume 1,484,540
Face Value (`) 2
Beta 1.5
52 Week High / Low 321/160
Automobile
Market Cap (` cr) 71,758
Yaresh Kothari 022-3935 7800 Ext: 6844
Tata Motors Performance Highlights
2QFY2013 Result Update | Automobile
November 7, 2012
Tata Motors | 2QFY2013 Result Update
November 7, 2012
2
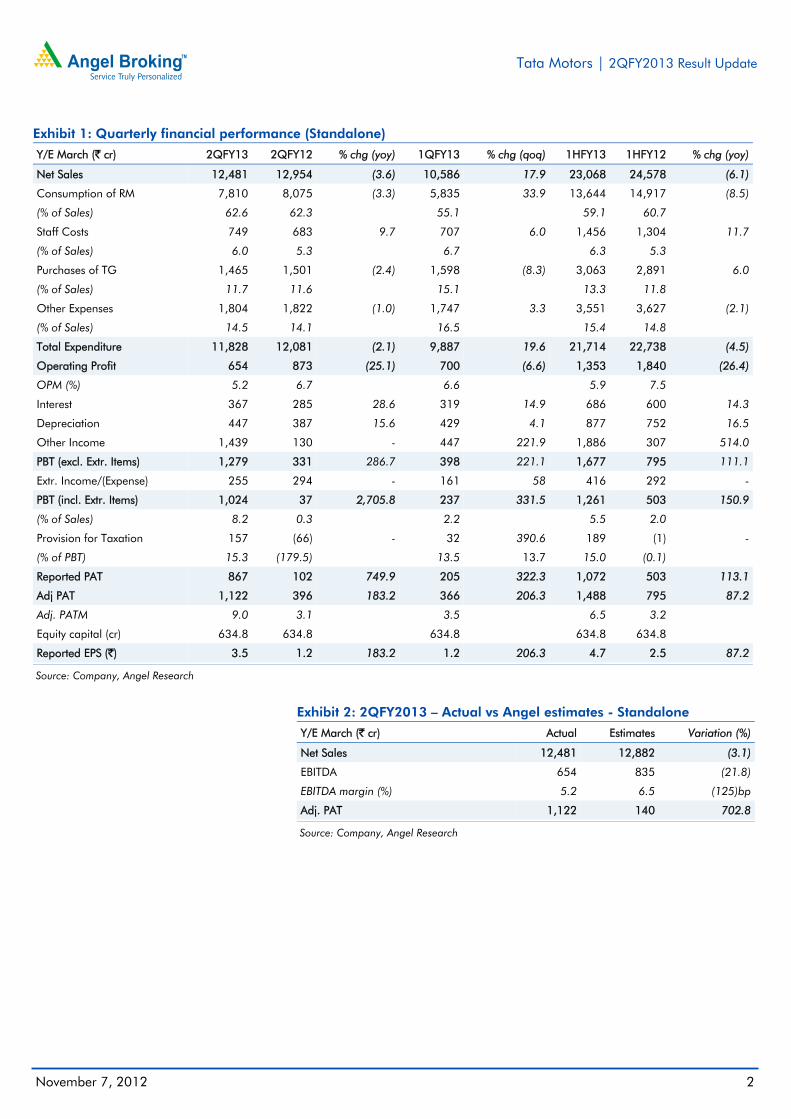
Exhibit 1: Quarterly financial performance (Standalone)
Y/E March (` cr) 2QFY13 2QFY12 % chg (yoy) 1QFY13 % chg (qoq) 1HFY13 1HFY12 % chg (yoy)
Net Sales 12,481 12,954 (3.6) 10,586 17.9 23,068 24,578 (6.1)
Consumption of RM 7,810 8,075 (3.3) 5,835 33.9 13,644 14,917 (8.5)
(% of Sales) 62.6 62.3 55.1 59.1 60.7 Staff Costs 749 683 9.7 707 6.0 1,456 1,304 11.7
(% of Sales) 6.0 5.3 6.7 6.3 5.3 Purchases of TG 1,465 1,501 (2.4) 1,598 (8.3) 3,063 2,891 6.0
(% of Sales) 11.7 11.6 15.1 13.3 11.8 Other Expenses 1,804 1,822 (1.0) 1,747 3.3 3,551 3,627 (2.1)
(% of Sales) 14.5 14.1 16.5 15.4 14.8 Total Expenditure 11,828 12,081 (2.1) 9,887 19.6 21,714 22,738 (4.5)
Operating Profit 654 873 (25.1) 700 (6.6) 1,353 1,840 (26.4)
OPM (%) 5.2 6.7 6.6 5.9 7.5 Interest 367 285 28.6 319 14.9 686 600 14.3
Depreciation 447 387 15.6 429 4.1 877 752 16.5
Other Income 1,439 130 - 447 221.9 1,886 307 514.0
PBT (excl. Extr. Items) 1,279 331 286.7 398 221.1 1,677 795 111.1
Extr. Income/(Expense) 255 294 - 161 58 416 292 -
PBT (incl. Extr. Items) 1,024 37 2,705.8 237 331.5 1,261 503 150.9
(% of Sales) 8.2 0.3 2.2 5.5 2.0 Provision for Taxation 157 (66) - 32 390.6 189 (1) -
(% of PBT) 15.3 (179.5) 13.5 13.7 15.0 (0.1) Reported PAT 867 102 749.9 205 322.3 1,072 503 113.1
Adj PAT 1,122 396 183.2 366 206.3 1,488 795 87.2
Adj. PATM 9.0 3.1 3.5 6.5 3.2 Equity capital (cr) 634.8 634.8 634.8 634.8 634.8 Reported EPS (`) 3.5 1.2 183.2 1.2 206.3 4.7 2.5 87.2
Source: Company, Angel Research
Exhibit 2: 2QFY2013 – Actual vs Angel estimates - Standalone
Y/E March (` cr) Actual Estimates Variation (%)
Net Sales 12,481 12,882 (3.1)
EBITDA 654 835 (21.8)
EBITDA margin (%) 5.2 6.5 (125)bp
Adj. PAT 1,122 140 702.8
Source: Company, Angel Research
Tata Motors | 2QFY2013 Result Update
November 7, 2012
3
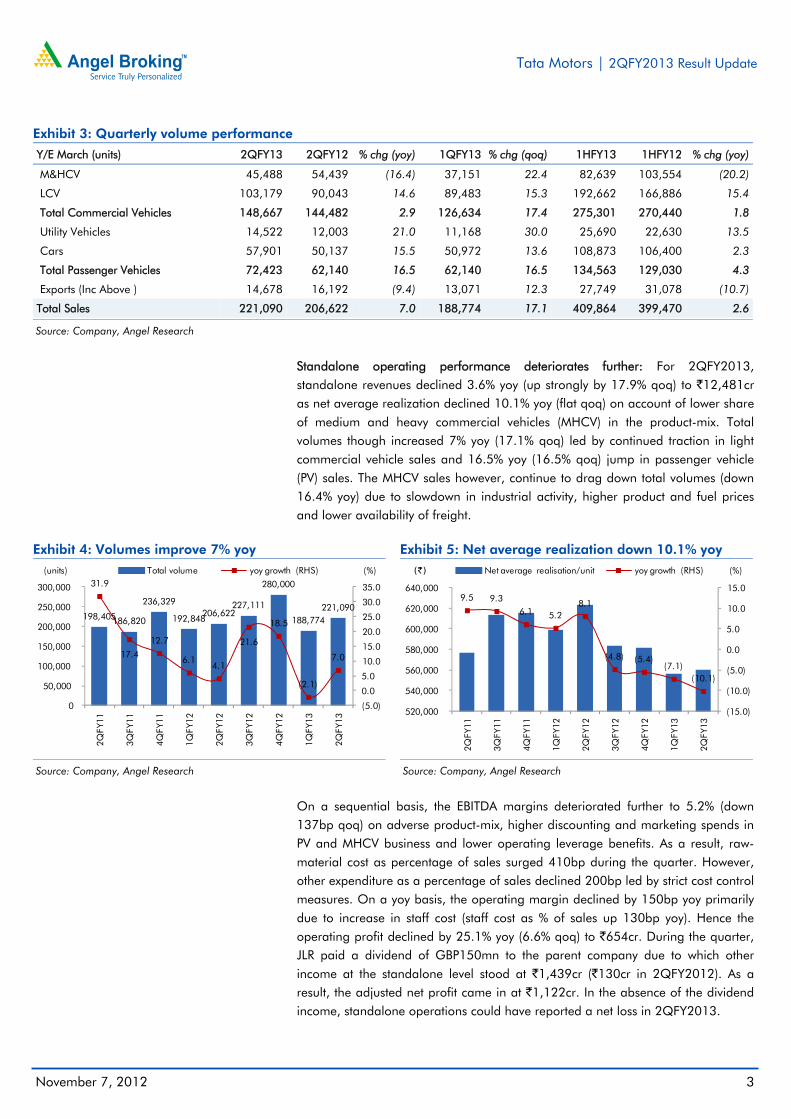
Exhibit 3: Quarterly volume performance
Y/E March (units) 2QFY13 2QFY12 % chg (yoy) 1QFY13 % chg (qoq) 1HFY13 1HFY12 % chg (yoy)
M&HCV 45,488 54,439 (16.4) 37,151 22.4 82,639 103,554 (20.2)
LCV 103,179 90,043 14.6 89,483 15.3 192,662 166,886 15.4
Total Commercial Vehicles 148,667 144,482 2.9 126,634 17.4 275,301 270,440 1.8
Utility Vehicles 14,522 12,003 21.0 11,168 30.0 25,690 22,630 13.5
Cars 57,901 50,137 15.5 50,972 13.6 108,873 106,400 2.3
Total Passenger Vehicles 72,423 62,140 16.5 62,140 16.5 134,563 129,030 4.3
Exports (Inc Above ) 14,678 16,192 (9.4) 13,071 12.3 27,749 31,078 (10.7)
Total Sales 221,090 206,622 7.0 188,774 17.1 409,864 399,470 2.6
Source: Company, Angel Research
Standalone operating performance deteriorates further: For 2QFY2013, standalone revenues declined 3.6% yoy (up strongly by 17.9% qoq) to `12,481cr as net average realization declined 10.1% yoy (flat qoq) on account of lower share of medium and heavy commercial vehicles (MHCV) in the product-mix. Total volumes though increased 7% yoy (17.1% qoq) led by continued traction in light commercial vehicle sales and 16.5% yoy (16.5% qoq) jump in passenger vehicle (PV) sales. The MHCV sales however, continue to drag down total volumes (down 16.4% yoy) due to slowdown in industrial activity, higher product and fuel prices and lower availability of freight.
Exhibit 4: Volumes improve 7% yoy
Source: Company, Angel Research
Exhibit 5: Net average realization down 10.1% yoy
Source: Company, Angel Research
On a sequential basis, the EBITDA margins deteriorated further to 5.2% (down 137bp qoq) on adverse product-mix, higher discounting and marketing spends in PV and MHCV business and lower operating leverage benefits. As a result, raw-material cost as percentage of sales surged 410bp during the quarter. However, other expenditure as a percentage of sales declined 200bp led by strict cost control measures. On a yoy basis, the operating margin declined by 150bp yoy primarily due to increase in staff cost (staff cost as % of sales up 130bp yoy). Hence the operating profit declined by 25.1% yoy (6.6% qoq) to `654cr. During the quarter, JLR paid a dividend of GBP150mn to the parent company due to which other income at the standalone level stood at `1,439cr (`130cr in 2QFY2012). As a result, the adjusted net profit came in at `1,122cr. In the absence of the dividend income, standalone operations could have reported a net loss in 2QFY2013.
198,405 186,820
236,329
192,848 206,622
227,111
280,000
188,774 221,090
31.9
17.4
12.7
6.1 4.1
21.6
18.5
(2.1)
7.0
(5.0)
0.0
5.0
10.0
15.0
20.0
25.0
30.0
35.0
0
50,000
100,000
150,000
200,000
250,000
300,000
2QFY
11
3QFY
11
4QFY
11
1QFY
12
2QFY
12
3QFY
12
4QFY
12
1QFY
13
2QFY
13
(%)(units) Total volume yoy growth (RHS)
9.5 9.3 6.1 5.2
8.1
(4.8) (5.4)(7.1)
(10.1)
(15.0)
(10.0)
(5.0)
0.0
5.0
10.0
15.0
520,000
540,000
560,000
580,000
600,000
620,000
640,000
2QFY
11
3QFY
11
4QFY
11
1QFY
12
2QFY
12
3QFY
12
4QFY
12
1QFY
13
2QFY
13
(%)(`) Net average realisation/unit yoy growth (RHS)

Tata Motors | 2QFY2013 Result Update
November 7, 2012
4
Exhibit 6: EBITDA margin deteriorated further
Source: Company, Angel Research
Exhibit 7: High other income boosts reported net profit
Source: Company, Angel Research
Exhibit 8: Quarterly performance (Consolidated) Y/E March (` cr) 2QFY13 2QFY12 % chg (yoy) 1QFY13 % chg (qoq) 1HFY13 1HFY12 % chg (yoy)
Net Sales 43,403 36,198 19.9 43,324 0.2 86,726 69,486 24.8
Consumption of RM 24,677 21,335 15.7 24,835 (0.6) 49,513 40,677 21.7
(% of Sales) 56.9 58.9 57.3 57.1 58.5 Staff Costs 4,019 2,866 40.3 3,790 6.1 7,809 5,458 43.1
(% of Sales) 9.3 7.9 8.7 9.0 7.9 Purchase of Goods 3,044 2,804 8.6 2,914 4.5 5,958 5,397 10.4
(% of Sales) 7.0 7.7 6.7 6.9 7.8 Other Expenses 6,329 4,689 35.0 6,030 5.0 12,359 9,214 34.1
(% of Sales) 14.6 13.0 13.9 14.3 13.3 Total Expenditure 38,069 31,694 20.1 37,569 1.3 75,638 60,747 24.5
EBITDA 5,334 4,504 18.4 5,755 (7.3) 11,089 8,740 26.9
EBITDA margin (%) 12.3 12.4 13.3 12.8 12.6 Interest 847 634 33.6 804 5.3 1,652 1,490 10.9
Depreciation 1,594 1,331 19.8 1,566 1.8 3,160 2,474 27.7
Other Income 207 170 21.7 239 (13.3) 445 336 32.7
PBT (excl. Extr. Items) 3,099 2,709 14.4 3,623 (14.5) 6,722 5,112 31.5
Exceptional Items 10 439 441 451 496 PBT (incl. Extr. Items) 3,089 2,270 36.1 3,183 (3.0) 6,271 4,616 35.9
(% of Sales) 7.1 6.3 7.3 7.2 6.6 Provision for Taxation 988 363 172.0 869 13.7 1,856 715 159.7
(% of PBT) 32.0 16.0 27.3 17.1 29.6 15.5 PAT 2,101 1,907 10.2 2,314 (9.2) 4,415 3,901 13.2
PATM 4.8 5.3 5.3 5.1 5.6 Minority Interest 23 34 (31.3) 28 (16.6) 51 37 35.3
Associate Companies Profit (3) 4 (180.8) (41) (92.3) (45) 14 (428.0)
PAT after MI 2,075 1,877 10.5 2,245 (7.6) 4,320 3,877 11.4
Adjusted PAT 2,085 2,316 (10.0) 2,685 (22.4) 4,770 4,373 9.1
Equity shares (cr) 634.8 634.8 634.8 634.8 634.8 Reported EPS (`) 6.5 5.9 10.5 7.1 (7.6) 13.6 12.2 11.4
Adjusted EPS (`) 6.6 7.3 (10.0) 8.5 (22.4) 15.0 13.8 9.1
Source: Company, Angel Research
9.7 10.1 8.7 8.3 6.7 6.4 9.1 6.6 5.2
72.9 70.4 73.5 71.2 74.3 74.3 73.9 70.7 74.8
0.0
10.0
20.0
30.0
40.0
50.0
60.0
70.0
80.0
2QFY
11
3QFY
11
4QFY
11
1QFY
12
2QFY
12
3QFY
12
4QFY
12
1QFY
13
2QFY
13
(%) EBITDA margin Raw material cost/sales
433 410 574 401 102 174 565 205 867
3.8 3.6 4.0
3.5
0.8 1.3
3.4
1.9
6.9
0.0
1.0
2.0
3.0
4.0
5.0
6.0
7.0
8.0
0 100 200 300 400 500 600 700 800 900
1,000
2QFY
11
3QFY
11
4QFY
11
1QFY
12
2QFY
12
3QFY
12
4QFY
12
1QFY
13
2QFY
13
(%)(` cr) Net profit (LHS) Net profit margin (RHS)

Tata Motors | 2QFY2013 Result Update
November 7, 2012
5
Exhibit 9: 2QFY2013 – Actual vs Angel estimates – Consolidated
Y/E March (` cr) Actual Estimates Variation (%)
Net Sales 43,403 43,867 (1.1)
EBITDA 5,334 5,645 (5.5)
EBITDA margin (%) 12.3 12.9 (58)bp
Adj. PAT 2,085 2,499 (16.6)
Source: Company, Angel Research
Strong JLR performance; weak standalone results: For 2QFY2013, the consolidated top-line registered a strong 19.9% yoy growth to `43,403cr, which was broadly in-line with our estimates aided by a 35.3% yoy growth in JLR revenues. JLR performance was driven by a strong 13.9% yoy growth in volumes (led by Evoque - 23,340 units and robust growth in China - volumes up 47% yoy) and due to depreciation of INR versus GBP (down 18.2% yoy). The JLR net average realization however, declined 1% yoy (2.6% qoq) primarily on account of higher share of Evoque in the product-mix. Standalone revenues declined 3.6% yoy as net average realization declined 10.1% yoy on account of lower share of MHCVs in the product-mix. On a sequential basis though, the top-line stood flat as the impact of 5.9% decline in JLR revenues (volumes down 7.2% on plant shutdowns due to maintenance activity and holidays) was mitigated by a 17.9% increase (driven by volume growth of 17.1%) in standalone revenues.
Exhibit 10: Net sales up 19.9% yoy led by JLR
Source: Company, Angel Research
On a sequential basis, operating margins declined 99bp to 12.3% (lower than our estimates of 12.9%) due to 70bp and 60bp increase in other expenditure and employee expenses as a percentage of sales. While, other expenditure increased due to higher marketing spends and higher discounts on PVs and MHCVs; employee expenses were higher due to employee addition at Halewood and Solihull plants. On the JLR front, operating margins expanded 40bp qoq to 14.8%, slightly ahead of estimates, led by favorable product-mix (higher share of Range Rover Sport) and exchange rate movement. However, standalone margins deteriorated further to 5.2% (down 137bp qoq) on adverse product-mix, higher discounting and marketing spends in PV and MHCV business and lower operating leverage benefits. The adjusted net profit declined 22.4% qoq (10% yoy) to
28,782 31,442
35,287 33,289 36,198
45,260 50,908
43,324 43,867 36.5
20.7 21.7 23.0 25.8
44.0 44.3
30.1
21.2
0.0 5.0 10.0 15.0 20.0 25.0 30.0 35.0 40.0 45.0 50.0
0
10,000
20,000
30,000
40,000
50,000
60,000
2Q
FY1
1
3Q
FY1
1
4Q
FY1
1
1Q
FY1
2
2Q
FY1
2
3Q
FY1
2
4Q
FY1
2
1Q
FY1
3
2Q
FY1
3
(%)(` cr) Net sales (LHS) Net sales growth (RHS)

Tata Motors | 2QFY2013 Result Update
November 7, 2012
6
`2,085cr on account of higher tax-rate due to recognition of deferred tax assets in 4QFY2012. The tax rate stood at 32% as against 16% in 2QFY2012.
Exhibit 11: EBITDA margin down slightly to 12.9%
Source: Company, Angel Research
Exhibit 12: Higher tax rate restricts profitability
Source: Company, Angel Research
Exhibit 13: Subsidiary performance Key Subsidiaries (` cr) 2QFY2013 2QFY2012
Net sales EBITDA EBITDAM (%) Net profit Net sales EBITDA EBITDAM (%) Net profit
Tata Motor Finance 678 105 15.5 69 494 79 16.0 52
Tata Technologies 469 77 16.5 68 378 60 16.0 48
Tata Daewoo (KRW bn) 205 10 4.7 1 213 7 3.3 1
TML Drivelines 125 62 49.5 33 166 98 59.1 55
Source: Company, Angel Research
Exhibit 14: JLR – Income statement (£ mn) 2QFY13 2QFY12 yoy chg (%) 1QFY13 qoq chg (%) FY2012 FY2013E FY2014E
Volume (units) 77,442 68,000 13.9 83,452 (7.2) 314,428 356,394 395,597
Net realization (£) 42,458 42,866 (1.0) 43,596 (2.6) 42,963 42,915 43,773
Net sales 3,288 2,915 12.8 3,638 (9.6) 13,512 15,294 17,316
Operating profit 486 420 15.7 525 (7.4) 1,989 2,227 2,563
OPM (%) 14.8 14.4 14.4 14.6 14.6 14.8
PAT 305 172 77.3 236 29.2 1,481 1,169 1,316
Source: Company, Angel Research
Exhibit 15: 2QFY2013 – Actual vs Angel estimates – JLR
Y/E March (£ mn) Actual Estimates Variation (%)
Net Sales 3,288 3,421 (3.9)
EBITDA 486 479 1.5
EBITDA margin (%) 14.8 14.0 (80)bp
Reported PAT 305 264 15.5
Source: Company, Angel Research
13.9 14.3 12.7 12.7 12.4 15.1 13.2 13.3 12.9
64.6 64.7 66.2 66.3 67.2 66.4 66.0 64.3 64.5
0.0
10.0
20.0
30.0
40.0
50.0
60.0
70.0
80.0
2QFY
11
3QFY
11
4QFY
11
1QFY
12
2QFY
12
3QFY
12
4QFY
12
1QFY
13
2QFY
13
(%) EBITDA margin Raw material cost/sales
2,223 2,424
2,638
2,000 1,877
3,406 3,521
2,245 2,499
7.7 7.7 7.5
6.0 5.2
7.5 6.9
5.2
5.7
0.0
1.0
2.0
3.0
4.0
5.0
6.0
7.0
8.0
9.0
0
500
1,000
1,500
2,000
2,500
3,000
3,500
4,000
2QFY
11
3QFY
11
4QFY
11
1QFY
12
2QFY
12
3QFY
12
4QFY
12
1QFY
13
2QFY
13
(%)(` cr) Net profit (LHS) Net profit margin (RHS)
Tata Motors | 2QFY2013 Result Update
November 7, 2012
7
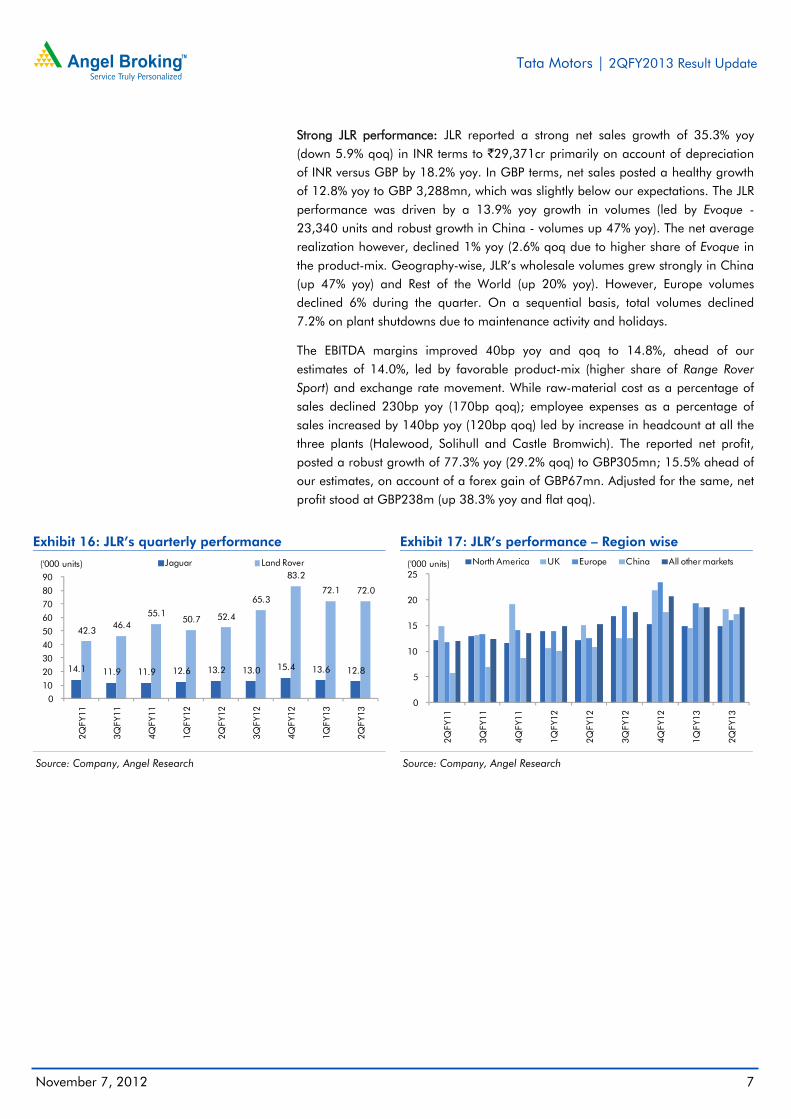
Strong JLR performance: JLR reported a strong net sales growth of 35.3% yoy (down 5.9% qoq) in INR terms to `29,371cr primarily on account of depreciation of INR versus GBP by 18.2% yoy. In GBP terms, net sales posted a healthy growth of 12.8% yoy to GBP 3,288mn, which was slightly below our expectations. The JLR performance was driven by a 13.9% yoy growth in volumes (led by Evoque - 23,340 units and robust growth in China - volumes up 47% yoy). The net average realization however, declined 1% yoy (2.6% qoq due to higher share of Evoque in the product-mix. Geography-wise, JLR’s wholesale volumes grew strongly in China (up 47% yoy) and Rest of the World (up 20% yoy). However, Europe volumes declined 6% during the quarter. On a sequential basis, total volumes declined 7.2% on plant shutdowns due to maintenance activity and holidays.
The EBITDA margins improved 40bp yoy and qoq to 14.8%, ahead of our estimates of 14.0%, led by favorable product-mix (higher share of Range Rover Sport) and exchange rate movement. While raw-material cost as a percentage of sales declined 230bp yoy (170bp qoq); employee expenses as a percentage of sales increased by 140bp yoy (120bp qoq) led by increase in headcount at all the three plants (Halewood, Solihull and Castle Bromwich). The reported net profit, posted a robust growth of 77.3% yoy (29.2% qoq) to GBP305mn; 15.5% ahead of our estimates, on account of a forex gain of GBP67mn. Adjusted for the same, net profit stood at GBP238m (up 38.3% yoy and flat qoq).
Exhibit 16: JLR’s quarterly performance
Source: Company, Angel Research
Exhibit 17: JLR’s performance – Region wise
Source: Company, Angel Research
14.1 11.9 11.9 12.6 13.2 13.0 15.4 13.6 12.8
42.3 46.4
55.1 50.7 52.4
65.3
83.2
72.1 72.0
0
10
20
30
40
50
60
70
80
90
2QFY
11
3QFY
11
4QFY
11
1QFY
12
2QFY
12
3QFY
12
4QFY
12
1QFY
13
2QFY
13
('000 units) Jaguar Land Rover
0
5
10
15
20
25
2QFY
11
3QFY
11
4QFY
11
1QFY
12
2QFY
12
3QFY
12
4QFY
12
1QFY
13
2QFY
13
('000 units) North America UK Europe China All other markets
Tata Motors | 2QFY2013 Result Update
November 7, 2012
8
Investment arguments
JLR to register a healthy 12% volume CAGR over FY2012-14E: The global luxury vehicle market has managed to post a healthy volume growth in 1HFY2013 despite a challenging macro environment. Volumes of the top four players (Audi, BMW, Mercedez Benz and JLR) are up 9% yoy for the period as growth in the key markets continues to hold up with China registering a strong growth of 22.7% yoy. We expect JLR to deliver a 12% volume CAGR over FY2012-14E on the back of momentum in the luxury vehicle market, coupled with strong Evoque volumes, and new product launches (Range Rover, Range Rover Sport, and Jaguar F). Further, expansion of dealer network in China from 110 to 145 by March 2013 will also aid growth. Additionally, favorable market mix (China's contribution increased from 11% in FY2011 to 17% in FY2012) and sourcing from low-cost countries will help TTMT mitigate raw-material cost pressures to a certain extent.
Domestic business to thrive on the strength of the CV segment: While we expect the commercial vehicle (CV) segment to maintain its healthy growth rate (8-10% CAGR over FY2012-14E) on the back of the strong volume momentum in LCV sales, the PV segment is likely to remain under pressure led by a sluggish domestic demand and weak product offerings. Further, led by cost pressures and higher discounts in the PV segment, we expect the standalone margins to remain under pressure.
Outlook and valuation
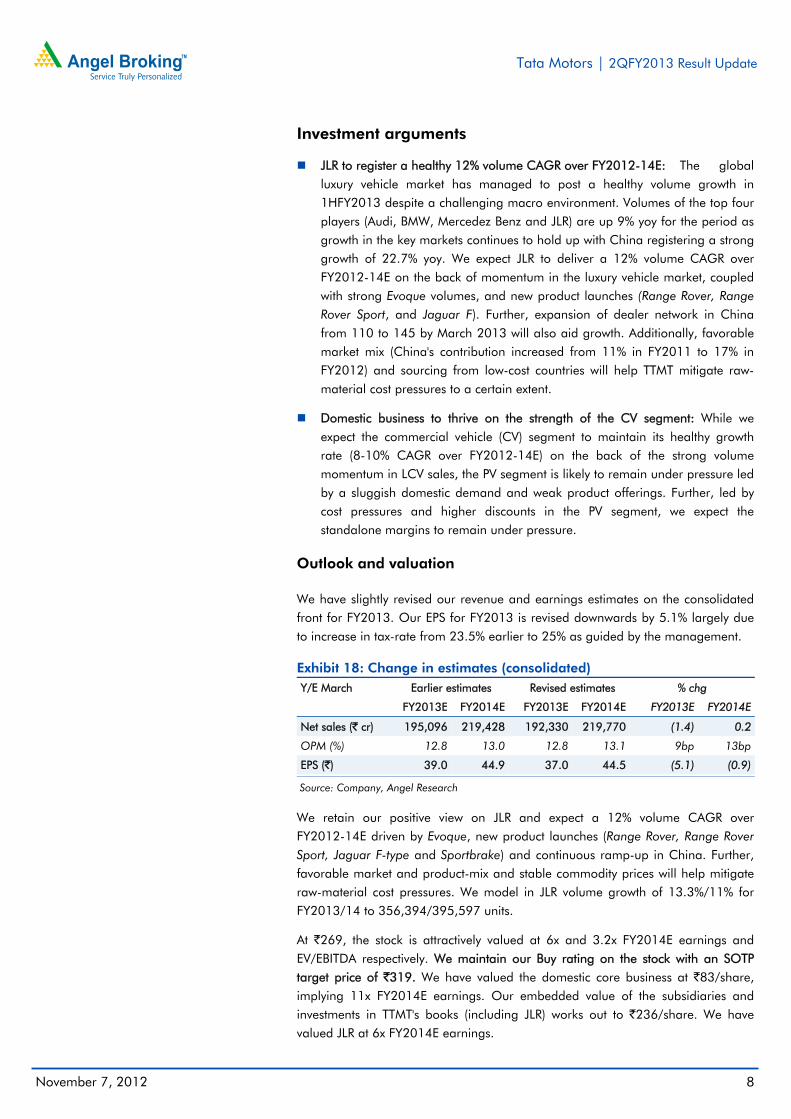
We have slightly revised our revenue and earnings estimates on the consolidated front for FY2013. Our EPS for FY2013 is revised downwards by 5.1% largely due to increase in tax-rate from 23.5% earlier to 25% as guided by the management.
Exhibit 18: Change in estimates (consolidated) Y/E March Earlier estimates Revised estimates % chg
FY2013E FY2014E FY2013E FY2014E FY2013E FY2014E
Net sales (` cr) 195,096 219,428 192,330 219,770 (1.4) 0.2
OPM (%) 12.8 13.0 12.8 13.1 9bp 13bp
EPS (`) 39.0 44.9 37.0 44.5 (5.1) (0.9)
Source: Company, Angel Research
We retain our positive view on JLR and expect a 12% volume CAGR over FY2012-14E driven by Evoque, new product launches (Range Rover, Range Rover Sport, Jaguar F-type and Sportbrake) and continuous ramp-up in China. Further, favorable market and product-mix and stable commodity prices will help mitigate raw-material cost pressures. We model in JLR volume growth of 13.3%/11% for FY2013/14 to 356,394/395,597 units.
At `269, the stock is attractively valued at 6x and 3.2x FY2014E earnings and EV/EBITDA respectively. We maintain our Buy rating on the stock with an SOTP target price of `319. We have valued the domestic core business at `83/share, implying 11x FY2014E earnings. Our embedded value of the subsidiaries and investments in TTMT's books (including JLR) works out to `236/share. We have valued JLR at 6x FY2014E earnings.
Tata Motors | 2QFY2013 Result Update
November 7, 2012
9
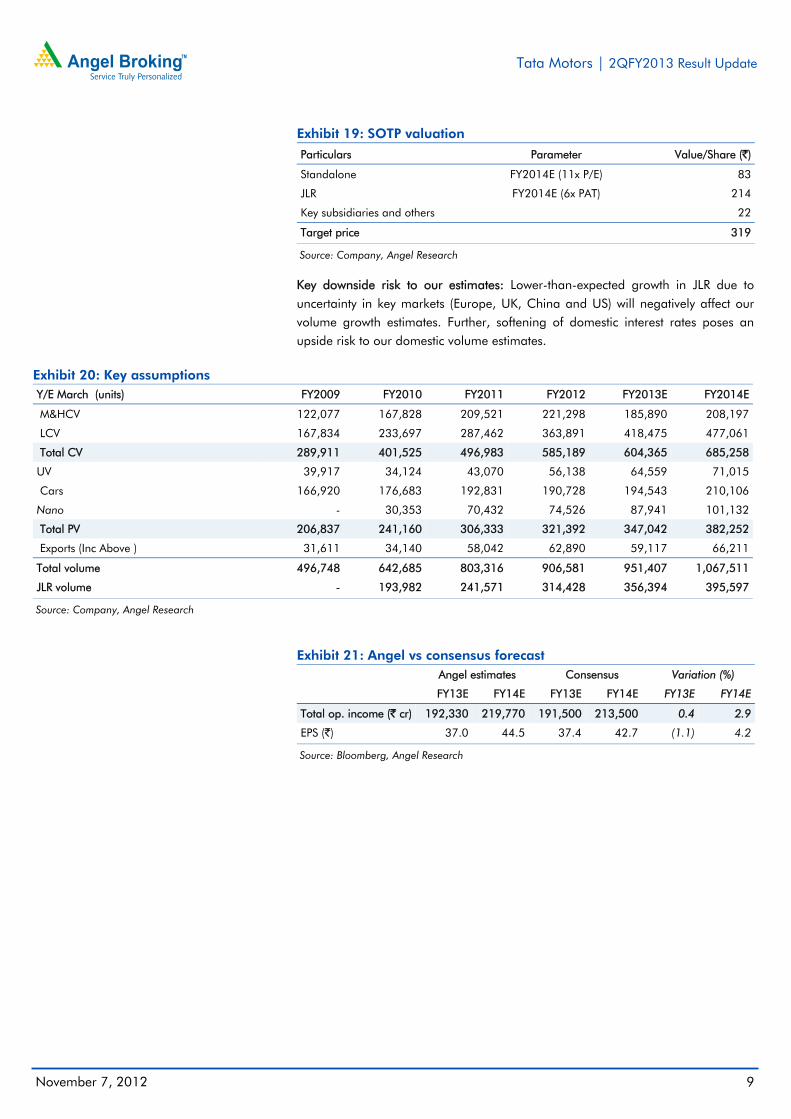
Exhibit 19: SOTP valuation
Particulars Parameter Value/Share (`)
Standalone FY2014E (11x P/E) 83
JLR FY2014E (6x PAT) 214
Key subsidiaries and others 22
Target price 319
Source: Company, Angel Research
Key downside risk to our estimates: Lower-than-expected growth in JLR due to uncertainty in key markets (Europe, UK, China and US) will negatively affect our volume growth estimates. Further, softening of domestic interest rates poses an upside risk to our domestic volume estimates.
Exhibit 20: Key assumptions Y/E March (units) FY2009 FY2010 FY2011 FY2012 FY2013E FY2014E
M&HCV 122,077 167,828 209,521 221,298 185,890 208,197
LCV 167,834 233,697 287,462 363,891 418,475 477,061
Total CV 289,911 401,525 496,983 585,189 604,365 685,258
UV 39,917 34,124 43,070 56,138 64,559 71,015
Cars 166,920 176,683 192,831 190,728 194,543 210,106
Nano - 30,353 70,432 74,526 87,941 101,132
Total PV 206,837 241,160 306,333 321,392 347,042 382,252
Exports (Inc Above ) 31,611 34,140 58,042 62,890 59,117 66,211
Total volume 496,748 642,685 803,316 906,581 951,407 1,067,511
JLR volume - 193,982 241,571 314,428 356,394 395,597
Source: Company, Angel Research
Exhibit 21: Angel vs consensus forecast
Angel estimates Consensus Variation (%)
FY13E FY14E FY13E FY14E FY13E FY14E
Total op. income (` cr) 192,330 219,770 191,500 213,500 0.4 2.9
EPS (`) 37.0 44.5 37.4 42.7 (1.1) 4.2
Source: Bloomberg, Angel Research
Tata Motors | 2QFY2013 Result Update
November 7, 2012
10
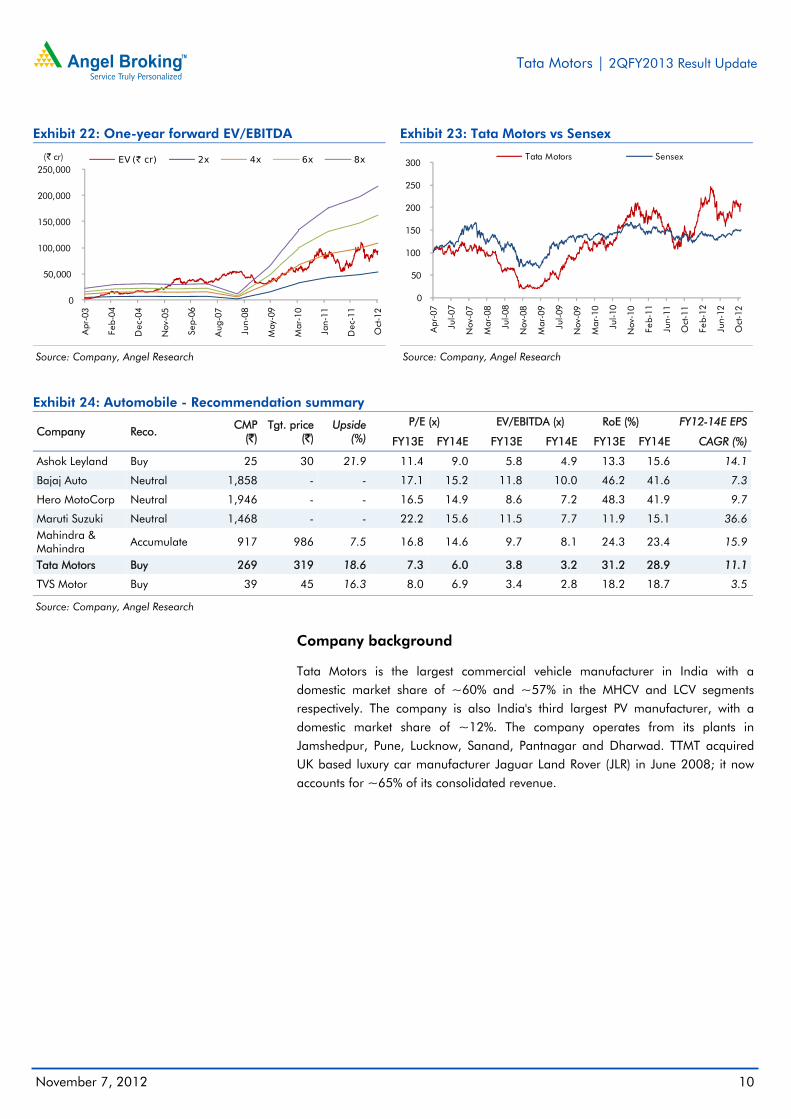
Exhibit 22: One-year forward EV/EBITDA
Source: Company, Angel Research
Exhibit 23: Tata Motors vs Sensex
Source: Company, Angel Research
Exhibit 24: Automobile - Recommendation summary
Company Reco. CMP (`)
Tgt. price (`)
Upside (%)
P/E (x) EV/EBITDA (x) RoE (%) FY12-14E EPS
FY13E FY14E FY13E FY14E FY13E FY14E CAGR (%)
Ashok Leyland Buy 25 30 21.9 11.4 9.0 5.8 4.9 13.3 15.6 14.1
Bajaj Auto Neutral 1,858 - - 17.1 15.2 11.8 10.0 46.2 41.6 7.3
Hero MotoCorp Neutral 1,946 - - 16.5 14.9 8.6 7.2 48.3 41.9 9.7
Maruti Suzuki Neutral 1,468 - - 22.2 15.6 11.5 7.7 11.9 15.1 36.6 Mahindra & Mahindra Accumulate 917 986 7.5 16.8 14.6 9.7 8.1 24.3 23.4 15.9
Tata Motors Buy 269 319 18.6 7.3 6.0 3.8 3.2 31.2 28.9 11.1
TVS Motor Buy 39 45 16.3 8.0 6.9 3.4 2.8 18.2 18.7 3.5
Source: Company, Angel Research
Company background
Tata Motors is the largest commercial vehicle manufacturer in India with a domestic market share of ~60% and ~57% in the MHCV and LCV segments respectively. The company is also India's third largest PV manufacturer, with a domestic market share of ~12%. The company operates from its plants in Jamshedpur, Pune, Lucknow, Sanand, Pantnagar and Dharwad. TTMT acquired UK based luxury car manufacturer Jaguar Land Rover (JLR) in June 2008; it now accounts for ~65% of its consolidated revenue.
0
50,000
100,000
150,000
200,000
250,000
Apr
-03
Feb-
04
Dec
-04
Nov
-05
Sep-
06
Aug
-07
Jun-
08
May
-09
Mar
-10
Jan-
11
Dec
-11
Oct
-12
(` cr) EV (` cr) 2x 4x 6x 8x
0
50
100
150
200
250
300
Apr
-07
Jul-0
7
Nov
-07
Mar
-08
Jul-0
8
Nov
-08
Mar
-09
Jul-0
9
Nov
-09
Mar
-10
Jul-1
0
Nov
-10
Feb-
11
Jun-
11
Oct
-11
Feb-
12
Jun-
12
Oct
-12
Tata Motors Sensex
Tata Motors | 2QFY2013 Result Update
November 7, 2012
11
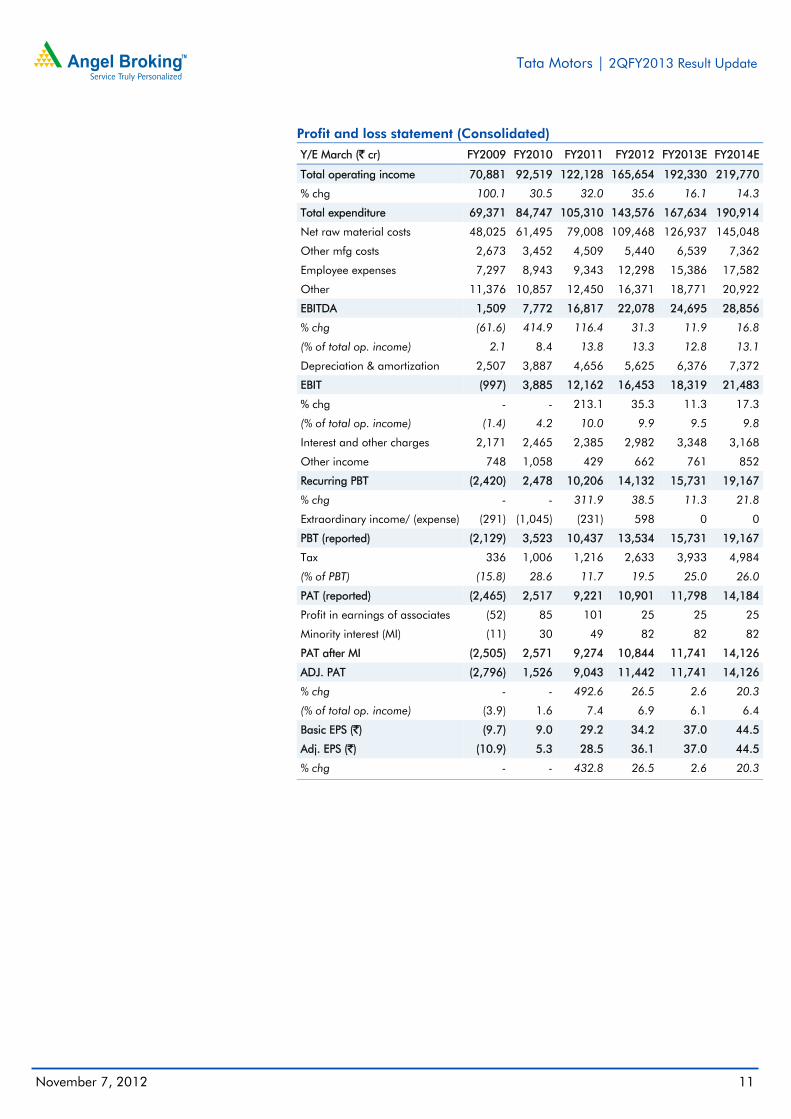
Profit and loss statement (Consolidated)
Y/E March (` cr) FY2009 FY2010 FY2011 FY2012 FY2013E FY2014E
Total operating income 70,881 92,519 122,128 165,654 192,330 219,770
% chg 100.1 30.5 32.0 35.6 16.1 14.3
Total expenditure 69,371 84,747 105,310 143,576 167,634 190,914
Net raw material costs 48,025 61,495 79,008 109,468 126,937 145,048
Other mfg costs 2,673 3,452 4,509 5,440 6,539 7,362
Employee expenses 7,297 8,943 9,343 12,298 15,386 17,582
Other 11,376 10,857 12,450 16,371 18,771 20,922
EBITDA 1,509 7,772 16,817 22,078 24,695 28,856
% chg (61.6) 414.9 116.4 31.3 11.9 16.8
(% of total op. income) 2.1 8.4 13.8 13.3 12.8 13.1
Depreciation & amortization 2,507 3,887 4,656 5,625 6,376 7,372
EBIT (997) 3,885 12,162 16,453 18,319 21,483
% chg - - 213.1 35.3 11.3 17.3
(% of total op. income) (1.4) 4.2 10.0 9.9 9.5 9.8
Interest and other charges 2,171 2,465 2,385 2,982 3,348 3,168
Other income 748 1,058 429 662 761 852
Recurring PBT (2,420) 2,478 10,206 14,132 15,731 19,167
% chg - - 311.9 38.5 11.3 21.8
Extraordinary income/ (expense) (291) (1,045) (231) 598 0 0
PBT (reported) (2,129) 3,523 10,437 13,534 15,731 19,167
Tax 336 1,006 1,216 2,633 3,933 4,984
(% of PBT) (15.8) 28.6 11.7 19.5 25.0 26.0
PAT (reported) (2,465) 2,517 9,221 10,901 11,798 14,184
Profit in earnings of associates (52) 85 101 25 25 25
Minority interest (MI) (11) 30 49 82 82 82
PAT after MI (2,505) 2,571 9,274 10,844 11,741 14,126
ADJ. PAT (2,796) 1,526 9,043 11,442 11,741 14,126
% chg - - 492.6 26.5 2.6 20.3
(% of total op. income) (3.9) 1.6 7.4 6.9 6.1 6.4
Basic EPS (`) (9.7) 9.0 29.2 34.2 37.0 44.5
Adj. EPS (`) (10.9) 5.3 28.5 36.1 37.0 44.5
% chg - - 432.8 26.5 2.6 20.3

Tata Motors | 2QFY2013 Result Update
November 7, 2012
12
Balance sheet statement (Consolidated)
Y/E March (` cr) FY2009 FY2010 FY2011 FY2012 FY2013E FY2014E
SOURCES OF FUNDS
Equity share capital 514 571 635 635 635 635
Reserves & surplus 5,427 7,827 18,537 32,064 42,010 54,342
Shareholders’ Funds 5,941 8,398 19,171 32,699 42,645 54,977
Minority interest 403 214 247 307 307 307
Total loans 34,974 35,108 30,362 38,704 37,204 35,204
Deferred tax liability 680 1,154 1,464 (2,374) (2,374) (2,374)
Other long term liabilities - - 2,293 2,459 2,459 2,459
Long term provisions - - 4,826 6,071 6,071 6,071
Total Liabilities 41,998 44,873 58,362 77,865 86,312 96,644
APPLICATION OF FUNDS Gross block 58,469 63,823 71,463 89,779 109,939 127,111
Less: Acc. depreciation 33,269 34,232 39,699 49,512 55,889 63,261
Net Block 25,200 29,590 31,764 40,267 54,050 63,849
Capital work-in-progress 10,533 8,916 11,457 15,946 15,391 17,796
Goodwill 3,719 3,423 3,585 4,094 4,094 4,094
Investments 1,257 2,219 2,544 8,918 8,918 8,918
Long term loans and advances - - 9,818 13,658 13,658 13,658
Other noncurrent assets - - 332 575 575 575
Current assets 33,322 42,446 40,881 56,935 61,490 68,238
Cash 4,121 8,743 11,410 18,238 18,816 19,475
Loans & advances 13,456 15,199 8,875 12,244 12,501 14,285
Other 15,745 18,503 20,596 26,453 30,173 34,478
Current liabilities 32,120 41,721 42,019 62,526 71,864 80,484
Net current assets 1,202 725 (1,138) (5,591) (10,374) (12,246)
Misc. exp. not written off 86 - - - - -
Total Assets 41,998 44,873 58,362 77,865 86,312 96,644

Tata Motors | 2QFY2013 Result Update
November 7, 2012
13
Cash flow statement (Consolidated)
Y/E March (` cr) FY2009 FY2010 FY2011 FY2012 FY2013E FY2014E
Profit before tax (2,129) 3,523 10,206 14,132 15,731 19,167
Depreciation 2,507 3,887 4,656 5,625 6,376 7,372
Change in working capital 4,709 5,099 4,048 2,280 5,167 2,339
Others (3,263) (1,448) (6,024) (359) - -
Other income (748) (1,058) (429) (662) (761) (852)
Direct taxes paid (336) (1,006) (1,216) (2,633) (3,933) (4,984)
Cash Flow from Operations 739 8,997 11,240 18,384 22,581 23,042
(Inc.)/Dec. in fixed assets (50,078) (3,736) (8,113) (13,783) (19,606) (19,576)
(Inc.)/Dec. in investments 1,408 (962) (325) (962) - -
Other income 748 1,058 429 662 761 852
Cash Flow from Investing (47,922) (3,640) (8,008) (14,083) (18,844) (18,724)
Issue of equity 3,958 1,405 4,700 (164) - -
Inc./(Dec.) in loans 23,389 135 (4,746) 8,342 (1,500) (2,000)
Dividend paid (Incl. Tax) 677 365 1,002 1,481 1,659 1,659
Others (19,448) 3,113 1,521 7,132 - -
Cash Flow from Financing 47,471 (1,209) (565) 2,527 (3,159) (3,659)
Inc./(Dec.) in cash 288 4,148 2,666 6,828 578 660
Opening Cash balances 3,833 4,121 8,743 11,410 18,238 18,816
Closing Cash balances 4,121 8,743 11,410 18,238 18,816 19,475
Tata Motors | 2QFY2013 Result Update
November 7, 2012
14
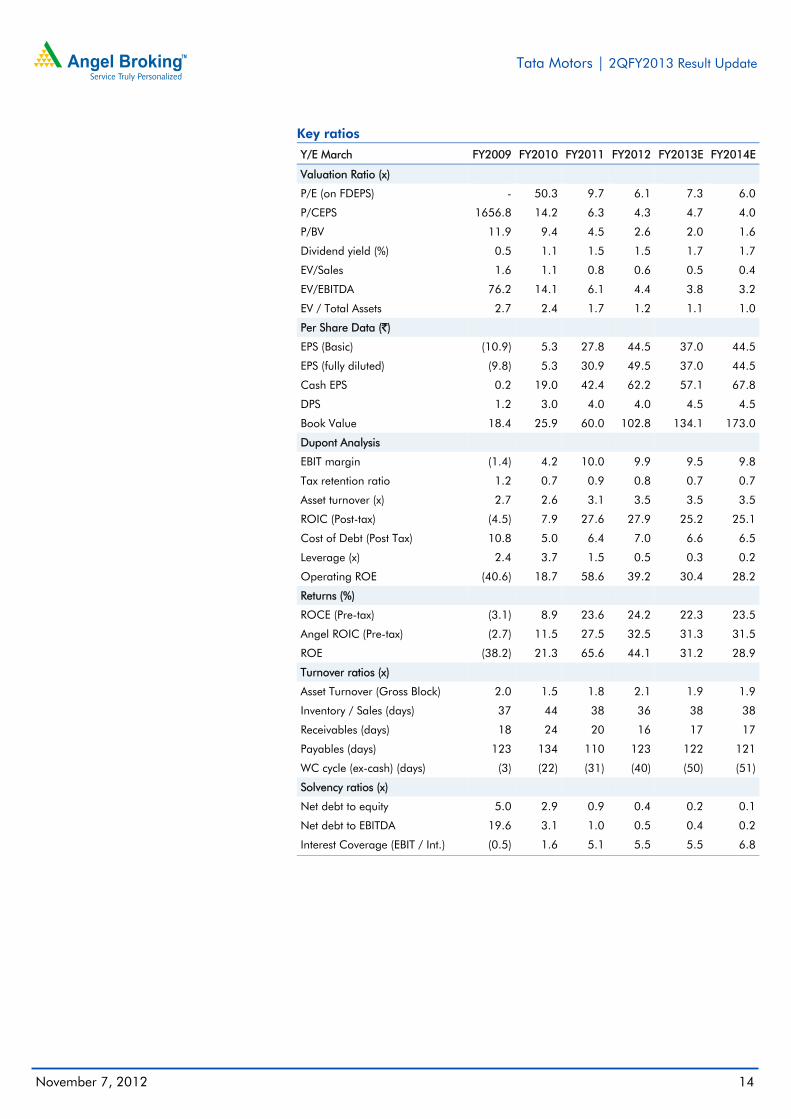
Key ratios
Y/E March FY2009 FY2010 FY2011 FY2012 FY2013E FY2014E
Valuation Ratio (x) P/E (on FDEPS) - 50.3 9.7 6.1 7.3 6.0
P/CEPS 1656.8 14.2 6.3 4.3 4.7 4.0
P/BV 11.9 9.4 4.5 2.6 2.0 1.6
Dividend yield (%) 0.5 1.1 1.5 1.5 1.7 1.7
EV/Sales 1.6 1.1 0.8 0.6 0.5 0.4
EV/EBITDA 76.2 14.1 6.1 4.4 3.8 3.2
EV / Total Assets 2.7 2.4 1.7 1.2 1.1 1.0
Per Share Data (`)
EPS (Basic) (10.9) 5.3 27.8 44.5 37.0 44.5
EPS (fully diluted) (9.8) 5.3 30.9 49.5 37.0 44.5
Cash EPS 0.2 19.0 42.4 62.2 57.1 67.8
DPS 1.2 3.0 4.0 4.0 4.5 4.5
Book Value 18.4 25.9 60.0 102.8 134.1 173.0
Dupont Analysis
EBIT margin (1.4) 4.2 10.0 9.9 9.5 9.8
Tax retention ratio 1.2 0.7 0.9 0.8 0.7 0.7
Asset turnover (x) 2.7 2.6 3.1 3.5 3.5 3.5
ROIC (Post-tax) (4.5) 7.9 27.6 27.9 25.2 25.1
Cost of Debt (Post Tax) 10.8 5.0 6.4 7.0 6.6 6.5
Leverage (x) 2.4 3.7 1.5 0.5 0.3 0.2
Operating ROE (40.6) 18.7 58.6 39.2 30.4 28.2
Returns (%)
ROCE (Pre-tax) (3.1) 8.9 23.6 24.2 22.3 23.5
Angel ROIC (Pre-tax) (2.7) 11.5 27.5 32.5 31.3 31.5
ROE (38.2) 21.3 65.6 44.1 31.2 28.9
Turnover ratios (x)
Asset Turnover (Gross Block) 2.0 1.5 1.8 2.1 1.9 1.9
Inventory / Sales (days) 37 44 38 36 38 38
Receivables (days) 18 24 20 16 17 17
Payables (days) 123 134 110 123 122 121
WC cycle (ex-cash) (days) (3) (22) (31) (40) (50) (51)
Solvency ratios (x)
Net debt to equity 5.0 2.9 0.9 0.4 0.2 0.1
Net debt to EBITDA 19.6 3.1 1.0 0.5 0.4 0.2
Interest Coverage (EBIT / Int.) (0.5) 1.6 5.1 5.5 5.5 6.8
Tata Motors | 2QFY2013 Result Update
November 7, 2012
15
Research Team Tel: 022 - 39357800 E-mail: [email protected] Website: www.angelbroking.com DISCLAIMER This document is solely for the personal information of the recipient, and must not be singularly used as the basis of any investment decision. Nothing in this document should be construed as investment or financial advice. Each recipient of this document should make such investigations as they deem necessary to arrive at an independent evaluation of an investment in the securities of the companies referred to in this document (including the merits and risks involved), and should consult their own advisors to determine the merits and risks of such an investment.
Angel Broking Limited, its affiliates, directors, its proprietary trading and investment businesses may, from time to time, make investment decisions that are inconsistent with or contradictory to the recommendations expressed herein. The views contained in this document are those of the analyst, and the company may or may not subscribe to all the views expressed within.
Reports based on technical and derivative analysis center on studying charts of a stock's price movement, outstanding positions and trading volume, as opposed to focusing on a company's fundamentals and, as such, may not match with a report on a company's fundamentals.
The information in this document has been printed on the basis of publicly available information, internal data and other reliable sources believed to be true, but we do not represent that it is accurate or complete and it should not be relied on as such, as this document is for general guidance only. Angel Broking Limited or any of its affiliates/ group companies shall not be in any way responsible for any loss or damage that may arise to any person from any inadvertent error in the information contained in this report. Angel Broking Limited has not independently verified all the information contained within this document. Accordingly, we cannot testify, nor make any representation or warranty, express or implied, to the accuracy, contents or data contained within this document. While Angel Broking Limited endeavours to update on a reasonable basis the information discussed in this material, there may be regulatory, compliance, or other reasons that prevent us from doing so. This document is being supplied to you solely for your information, and its contents, information or data may not be reproduced, redistributed or passed on, directly or indirectly.
Angel Broking Limited and its affiliates may seek to provide or have engaged in providing corporate finance, investment banking or other advisory services in a merger or specific transaction to the companies referred to in this report, as on the date of this report or in the past.
Neither Angel Broking Limited, nor its directors, employees or affiliates shall be liable for any loss or damage that may arise from or in connection with the use of this information.
Note: Please refer to the important `Stock Holding Disclosure' report on the Angel website (Research Section). Also, please refer to the latest update on respective stocks for the disclosure status in respect of those stocks. Angel Broking Limited and its affiliates may have investment positions in the stocks recommended in this report.
Disclosure of Interest Statement Tata Motors
1. Analyst ownership of the stock No
2. Angel and its Group companies ownership of the stock No
3. Angel and its Group companies' Directors ownership of the stock No
4. Broking relationship with company covered No
Ratings (Returns): Buy (> 15%) Accumulate (5% to 15%) Neutral (-5 to 5%) Reduce (-5% to 15%) Sell (< -15%)
Note: We have not considered any Exposure below ` 1 lakh for Angel, its Group companies and Directors


![4AN 6 2~ In tlje ~w~ttmt Ceurt et the Eln/telJ ~tates · 1/11/2006 · ~utjL~ea~ Co.rk US. I~ILED 4AN 6 2~ OF]ICE 02 qq-{5! CLEF-~ In tlje ~w~ttmt Ceurt et the Eln/telJ ~tates SALIM](https://img.dokumen.tips/doc/110x75/5fd65d65a62e3b3c5c207ead/4an-6-2-in-tlje-wttmt-ceurt-et-the-elntelj-tates-1112006-utjlea-cork.jpg)


