Embed Size (px)
Citation preview

CMP: INR1,008 TP: INR1,240 BuyBSE SENSEX S&P CNX
16,739 5,049
Bloomberg AXSB IN
Equity Shares (m) 410.5
52-Week Range 1,461/785
1,6,12 Rel.Perf.(%) 11/-9/-9
M.Cap. (INR b) 413.8
M.Cap. (USD b) 8.2
Axis Bank
20 January 2012
3QFY12 Results Update | Sector: Financials
Alpesh Mehta ([email protected]) + 91 22 3982 5415
Sohail Halai ([email protected])+ 91 22 3982 5430
Axis Bank 3QFY12 PAT grew ~24% YoY to INR11b (est. of INR10.4b). Stable margins QoQ (3.75%), healthy loan
growth, strong fee income (+9% QoQ and +26% YoY) and savings deposit growth (+19% YoY on daily average basis)
were the key positives. Higher profit of INR1.3b on account of proprietary forex trading was one of the key
reasons for surprise in profitability. Key highlights:
Slippages at INR5.35b - stable QoQ: Slippages in absolute terms increased to INR5.35b and bank restructured
~INR3b of loans (20bp of overall loans). Slippage ratio stood at ~1.7% v/s 1.8% in 2QFY12.
Loans growth remains strong led by strong traction in retail loans: Loans grew 6% QoQ and 20% YoY to INR1.5t.
Incremental loan growth was driven by strong growth in retail segment (+13% QoQ and 32% YoY) and corporate
segment (up 6% QoQ and 19% YoY). While YTD loan growth stood at just 5%, mgmt remains confident of
achieving loan growth of 16%+.
Fee income traction remains impressive: Fee income grew 9% QoQ and 26%YoY to INR12.2b led by large and
mid-corporate related fees (+25% QoQ and +34% YoY), retail banking (+13% QoQ and 26% YoY) and business
banking related fees (+12% QoQ and 15% YoY)
Valuation and view: Strong NII growth and healthy fee income will lead to PAT CAGR of 18% over FY12/13. With
Tier 1 nearing 9%, capital raising possibility will increase in FY13. We have factored in equity dilution of ~3% on
account of Enam acquisition deal. Stock trades at 1.6x FY13 BV and 9x FY13 EPS. We expect RoE of 19%+ in FY11-13
and RoA of ~1.5% over FY11-13. Maintain Buy.

Axis Bank
20 January 2012 2
Quarterly performance: Above estimates (INR m)Y/E March 3QFY12A 3QFY12E Var. (%) Comments
Net Interest Income 21,403 21,033 2 Margins largely stable QoQ - a positive surprise
% Change (YoY) 23 21
Other Income 14,298 14,144 1 Higher forex trading income
Net Income 35,701 35,177 1
Operating Expenses 15,109 15,432 -2 Strong control over cost
Operating Profit 20,592 19,745 4 Strong core operating performance
% Change (YoY) 24 19
Other Provisions 4,223 4,350 -3 Asset quality remains stable
Profit before Tax 16,369 15,395 6
Tax Provisions 5,346 5,003 7
Net Profit 11,023 10,392 6 Higher trading profits and lower opex leading to higher than est PAT
% Change (YoY) 24 17
Source: Company/MOSL
Loans growth remains strong led by strong traction in retail loans: Loans grew 6% QoQ
and 20% YoY to INR1.5t. Incremental loan growth was driven by strong growth in retail
segment (+13% QoQ and 32% YoY) and corporate segment (up 6% QoQ and 19% YoY).
Housing loans grew 12% QoQ and 48% YoY. Overall share of retail loan to overall loan
has increased to 22.4% as compared to 20.9% a quarter ago and will increase further.
Agriculture and SME loans remained flat QoQ. However, on a YoY basis SME segment
grew 21%.
Core CASA largely stable QoQ: For 3QFY12, CASA on average daily basis grew 13% YoY
led by strong growth in average SA deposit growth (+19% YoY) - a positive. However
moderation in CA deposit growth (+4% YoY) led to overall moderation. For 9MFY12,
SA deposits growth stood at 20%, CA deposits growth at 12% and overall CASA growth
stood at 17% YoY. Daily average CASA mix declined to 37% v/s 38% a quarter ago.
Margins stable QoQ - a positive surprise: Reported margins was stable QoQ at 3.75%
- better than est., led by re-pricing of assets and containment of cost of funds (+15bp
QoQ). Stable CASA ratio and moderation in bulk deposit rates further aided margins.
Mgmt reiterated its guidance of maintaining NIMs in the range of 3.25-3.5%.
Fee income traction remains impressive: During the quarter fee income grew 9%
QoQ and 26%YoY to INR12.2b. Strong growth in fee income was led by large and mid-
corporate related fees (+25% QoQ and +34% YoY), retail banking (+13% QoQ and 26%
YoY) and business banking related fees (+12% QoQ and 15% YoY). On a sequential
basis, treasury related fees declined 15% QoQ to INR2.3b, however remained healthy
at +25% YoY. Agri and SME segment related fees, capital market related fees were
muted. Strong traction in fee income streams have been the key driver for RoA's of
AXSB. We model in fee income growth of 25%+ over FY12-13. During the quarter bank
booked forex-related trading gains of INR1.3b as against INR424m a quarter ago and
INR303m driving strong growth in other income. While increased volatility in currency
rate has resulted in sharp trading gain it is expected to normalize going forward.
Slippages at INR5.35b - stable QoQ.: During the quarter INR5.35b (annualized slippage
ratio of 1.73% as against 1.8% a quarter ago and 1.4% in FY11) slipped into NPA.
Recoveries and up-gradation stood at INR1.2b as compared to INR1.6b a quarter ago,
Axis Bank
20 January 2012 3
whereas write-offs stood at INR2.4b (v/s INR1.6b a quarter ago and INR870m a year
ago). On a sequential basis, GNPA and NNPA in absolute terms increased 10% and 24%
respectively. In % terms GNPA was flat QoQ while NNPA was up 5bp QoQ at 40bp.
Credit cost at 75bp; Mgmt guides it to be ~80bp: During the quarter bank made NPA
provision of INR3.3b (credit cost of 90bp v/s70bp in 2QFY12 and 90bp in FY11).
Management guided for credit cost of ~80bp in the current state of environment. PCR
(calc.) declined to 64.3% as compared to 68.5% a quarter ago, however including
prudential write offs, PCR stood at 75%. During the quarter, bank provided INR430m
towards depreciation on investment and INR570m on account of provisions towards
standard asset.
Restructured loan of ~INR3b (20bp of overall loan) in 3QFY12: During the quarter,
bank restructured loan of ~INR3b (20bp of overall loans) and INR70m slipped into NPA
from restructured portfolio. Cumulatively outstanding restructured loan stood at
INR27b (1.8% of overall loans), of which 75% comprised of corporate segment, 9% of
SME segment, 11% of agri. and MFI segment and 5% related to capital market segment.
Sector wise textiles, petroleum and shipping forms 50% of the restructured loans.
~70% of the RL have already completed the period of 12 months.
Other Details: (1) CAR (including quarterly profits) of the bank stood at 13.1%, of
which Tier I ratio stood at 9.6%. (2) During the quarter AXSB opened 50 (730 ATM)
branches and in last one year branch network increased by 375 (3021 ATM) to 1493
(8324 ATM). Going forward mgmt guided for addition of 250 branches per annum.
Concall highlights Management guided credit cost of 80bp going forward in the state of current
environment. Management mentioned that it does not have any significant
restructuring pipeline, however it would be difficult to provide outlook on same.
While YTD loan growth stood at just 5% management remains confident of
achieving loan growth of 16%+. Working capital loan, disbursement from existing
sanction pipeline will drive loan growth in corporate segment and retail loan
growth will be driven by secured loans. Besides strong growth in PSL book (as
bank strives to achieve its PSL target) will remain the key driver.
Retail loan as a % to overall portfolio increased by 150bp QoQ to 22.4%, and
management expects to leverage its branch network and targets to increase the
proportion of retail loan further. Currently 30% of the retail loans in sourced through
branch network.
Environment for infrastructure financing remains challenging, however
management mentioned that it has not seen any significant stress in this segment
so far.
CASA on daily average basis declined 100bp QoQ to 37%. While increase in deposit
rate is leading to cannibalization of saving deposit into term deposit new customer
acquisition remains healthy. Average SA deposits balance stood at INR30,000. On
period ending basis CASA ratio remained stable at 42% and management expects
to maintain CASA ratio in the range of 38-42%.

Axis Bank
20 January 2012 4
We largely maintain our earning estimates (INR b)Old Revised Change (%)
FY12 FY13 FY12 FY13 FY12 FY13
Net Interest Income 79.9 95.5 80.7 94.8 1.0 -0.7
Other Income 54.8 67.5 54.7 67.5 -0.3 0.0
Total Income 134.7 163.0 135.4 162.3 0.5 -0.4
Operating Expenses 60.1 74.2 59.8 71.7 -0.6 -3.3
Operating Profits 74.6 88.8 75.6 90.6 1.4 2.0
Provisions 14.9 17.5 14.6 20.2 -1.5 15.5
PBT 59.7 71.4 61.0 70.5 2.1 -1.3
Tax 19.4 23.9 19.8 22.9 2.1 -4.2
PAT 40.3 47.5 41.2 47.6 2.1 0.2
Margins (%) 3.3 3.2 3.3 3.2
Credit Cost (%) 0.7 0.8 0.7 1.0
RoA (%) 1.5 1.5 1.5 1.5
RoE (%) 19.5 19.6 19.9 19.5
Source: MOSL
Axis Bank: One year forward P/E Axis Bank: One year forward P/BV
Valuation and viewWhile margins are likely to moderate in 4QFY12 as bank increase its PSL book for FY12,
it is likely to be strong at 3.5%+. Further in FY13, we model margin decline of ~10bp
(considering higher share of bulk deposits - positive surprises are likely). Healthy
loan growth of 20% and largely stable NIMs will translate into NII CAGR of ~20% over
FY12/13. Axis Bank's key strengths have been its ability to grow CASA deposits (CAGR
of 37% over FY06-11). Given Bank's strong and rapidly growing liability franchise, we
expect CASA growth to remain strong. Strong growth across fee income segment is
also impressive, and is a key driver for RoA. Even with some moderation (in FY13), we
model in fee income growth of ~25% over FY12/13.
While performance on asset quality has been healthy we built in higher credit cost of
100bp (mgmt guidance of 80bp) for FY13 as against 70bp in FY12. Strong NII growth and
healthy fee income will lead to PAT CAGR of 18% over FY12/13. With Tier 1 nearing 9%,
capital raising possibility will increase in FY13. We have factored in equity dilution of
~3% on account of Enam acquisition deal. We estimate BV of INR528 and INR619 and
EPS to be INR97 and INR112 over FY12 and FY13 respectively.
Stock trades at 1.6x FY13 BV and 9x FY13 EPS. We expect RoE of 19%+ in FY11-13 and
RoA of ~1.5% over FY11-13. Maintain Buy with a target price of INR1,240 (2x FY13 PBV
and implied targeted PE of 11x) - upside of ~23%.
9.013.8
23.6
5.7
0
7
14
21
28
Jan-
07
Aug
-07
Jan-
08
Jul-
08
Jan-
09
Jul-
09
Jan-
10
Jul-
10
Jan-
11
Jul-
11
Jan-
12
P/E (x) Avg(x) Peak(x) Min(x)
1.72.3
4.0
0.9
0.0
1.2
2.4
3.6
4.8
Jan-
07
Aug
-07
Jan-
08
Jul-
08
Jan-
09
Jul-
09
Jan-
10
Jul-
10
Jan-
11
Jul-
11
Jan-
12
P/B (x) Avg(x) Peak(x) Min(x)

Axis Bank
20 January 2012 5
Quaterly trends
Deposit growth remains strong
Customer Assets grew 8% QoQ and 32% YoY
Cost of funds up remains under check (%)
Deposits grew 7% QoQ and 34% YoY
Customer asset growth remains strong
Stable CASA ratio and moderation in bulk deposit rates
led to marginal increase in cost of funds
Loan growth remains healthy (+6% QoQ and 20% YoY)
Margin stable QoQ - a positive surprise (%)
Re-pricing of assets and containment of cost of funds
(+15bp QoQ) led to stable margins
Average daily CASA Ratio declines ~100bp QoQ
CASA on average daily basis grew 13% YoY led by 19%+
growth in average SA deposit growth
1,31
9
1,48
7
1,40
1
1,42
4
1,23
5
1,10
6
1,08
6
1,04
3
848
810
781
816
753
689
612
2027
21
36
46
3639
28
1318
2837
555448
1QF
Y09
2QF
Y09
3QF
Y09
4QF
Y09
1QF
Y10
2QF
Y10
3QF
Y10
4QF
Y10
1QF
Y11
2QF
Y11
3QF
Y11
4QF
Y11
1QF
Y12
2QF
Y12
3QF
Y12
Loans (INR b) YoY Growth (%)
1,47
5
1,56
9
1,83
6
2,08
7
1,9
45
1,89
2
1,55
8
1,41
3
1,13
9
1,15
6
1,10
3
1,1
74
1,05
7
1,02
9
890
34
2424
34373634
208
12
24
34
5460
46
1QFY
09
2QFY
09
3QFY
09
4QFY
09
1QFY
10
2QFY
10
3QFY
10
4QFY
10
1QFY
11
2QFY
11
3QFY
11
4QFY
11
1QFY
12
2QFY
12
3QFY
12
Depos i ts (INR b) YoY growth (%)
354
414
401
506
442
495
519
660
592
652
659
778
744
868
821
4242424240 4141
474643
4043
384040
1QF
Y09
2QF
Y09
3QF
Y09
4QF
Y09
1QF
Y10
2QF
Y10
3QF
Y10
4QF
Y10
1QF
Y11
2QF
Y11
3QF
Y11
4QF
Y11
1QF
Y12
2QF
Y12
3QF
Y12
CASA (INR b) CASA Ratio (%)
693
783
877
927
895
926
1,1
64
1,1
81
1,2
04
1,3
29
1,5
78
1,4
92
1,7
51
1,6
14
934
3234
26
36
42
303226
718
29
34
5753
45
1QF
Y09
2QF
Y09
3QF
Y09
4QF
Y09
1QF
Y10
2QF
Y10
3QF
Y10
4QF
Y10
1QF
Y11
2QF
Y11
3QF
Y11
4QF
Y11
1QF
Y12
2QF
Y12
3QF
Y12
Customer Assets (INR b) YoY Growth (%)
6.26.9 6.6
6.1
5.4
4.84.5 4.6 4.8 4.8
5.6
6.1 6.2 6.36.1
1QF
Y09
2QF
Y09
3QF
Y09
4QF
Y09
1QF
Y10
2QF
Y10
3QF
Y10
4QF
Y10
1QF
Y11
2QF
Y11
3QF
Y11
4QF
Y11
1QF
Y12
2QF
Y12
3QF
Y12
3.5
3.1
3.4 3.33.5
4.0
3.7 3.73.8
3.43.3
3.8 3.8
4.1
3.4
1QFY09
2QFY09
3QFY09
4QFY09
1QFY10
2QFY10
3QFY10
4QFY10
1QFY11
2QFY11
3QFY11
4QFY11
1QFY12
2QFY12
3QFY12
Corporate segment and secured retail loan to drive loan
growth

Axis Bank
20 January 2012 6
Quarterly trends (coninued)
Share of large and mid corporate related fees improves (%)
Branch expansion continues (Nos.)
Slippages stable QoQ (INR b)
Large & Mid corp. & Retail fees drive fee income growth
In last one year branch network increased by 375 and
3,021 ATM. Mgmt targets addition of 250 branches p.a.
In 3QFY12, INR5.35b slipped into NPA (annualized
slippage ratio of 1.7% v/s 1.8% a quarter ago)
Traction in fee income remains impressive (%)
Strong fee income growth has been one of the key drivers
of RoA
Strong control over opex demonstrated (%)
Healthy NIMs and strong growth in fee income led to
improvement in cost to income ratio
Stable asset quality
On a sequential basis, GNPA and NNPA in absolute terms
increased 10% and 24% respectively
5,3
70
6,2
68
6,1
89
6,6
30
6,2
70
7,2
00
8,0
00
7,7
90
7,5
30
8,4
90
9,6
70
12,
310
10,
570
11,
200
12,
210
1.8 1.9 1.92.2
1.9 2.11.9 1.9 1.7
2.0 2.1 1.9
1.6 1.71.9
1Q
FY0
9
2Q
FY0
9
3Q
FY0
9
4Q
FY0
9
1Q
FY1
0
2Q
FY1
0
3Q
FY1
0
4Q
FY1
0
1Q
FY1
1
2Q
FY1
1
3Q
FY1
1
4Q
FY1
1
1Q
FY1
2
2Q
FY1
2
3Q
FY1
2
Fee Income (INR m) Fee Inc as % of avg assets
26 27 32 33 30 35 36 36 39 34 39
21 20 16 18 22 22 19 21 20 24 196 8 8 9 56 6 8 4 6 514 13 13 11 12 11 9 9 9 9
30 30 29 28 27 25 27 25 26 26 27
10
1QF
Y10
2QF
Y10
3QF
Y10
4QF
Y10
1QF
Y11
2QF
Y11
3QF
Y11
4QF
Y11
1QF
Y12
2QF
Y12
3QF
Y12
La rge and Mid Corp Treas uryAgri and SME Bus BankingCapital Markets Reta i l
0.9 1.0 1.0
1.2 1.21.1 1.1 1.1 1.1 1.1 1.11.1
1.0
0.40.30.30.30.30.30.40.40.50.50.40.40.4
3QFY
09
4QFY
09
1QFY
10
2QFY
10
3QFY
10
4QFY
10
1QFY
11
2QFY
11
3QFY
11
4QFY
11
1QFY
12
2QFY
12
3QFY
12
Gross NPA (%) Net NPA (%)
2.3
2.4
2.3
2.1
2.3
2.5
2.5
2.4
2.3
2.4
2.4
2.4
2.2
2.4
2.3
47.0 47.6
45.1
47.0
47.2
45.3
45.4
47.9
46.9
45.0
44.8
48.649
.5
43.6
48.6
1QFY09
2QFY09
3QFY09
4QFY09
1QFY10
2QFY10
3QFY10
4QFY10
1QFY11
2QFY11
3QFY11
4QFY11
1QFY12
2QFY12
3QFY12
Cos t to average assets Cos t to Core Income
713
729
749
835 861
916
949
1,035
1,050
1,103
1,120 1,390
1,411
1,446
1,493
1QFY09
2QFY09
3QFY09
4QFY09
1QFY10
2QFY10
3QFY10
4QFY10
1QFY11
2QFY11
3QFY11
4QFY11
1QFY12
2QFY12
3QFY12
2.5
4.24.5
3.3
2.53.0
5.05.4
4QFY10
1QFY11
2QFY11
3QFY11
4QFY11
1QFY12
2QFY12
3QFY12

Axis Bank
20 January 2012 7
Quarterly Snapshot
FY11 FY12 Variation (%) Cumulative Numbers
1Q 2Q 3Q 4Q 1Q 2Q 3Q QoQ YoY 9M 9M YoY
FY11 FY12 Gr (%)
Profit and Loss (INR m)
Net Interest Income 15,138 16,151 17,331 17,010 17,241 20,073 21,403 7 23 48,620 58,717 21
Other Income 10,008 10,332 11,477 14,504 11,679 12,349 14,298 16 25 31,817 38,326 20
Trading profits 1,957 1,080 1,350 581 702 280 1,180 321 -13 4,387 2,162 -51
Fee Income 7,530 8,490 9,670 12,310 10,570 11,200 12,210 9 26 25,690 33,980 32
Miscellaneous Income 520 762 457 1,613 406 869 908 4 99 1,740 2,184 26
Total Income 25,146 26,483 28,808 31,514 28,920 32,422 35,701 10 24 80,437 97,043 21
Operating Expenses 10,645 11,620 12,224 13,306 13,335 14,665 15,109 3 24 34,488 43,109 25
Employee 4,164 4,053 3,962 3,960 5,100 4,986 5,420 9 37 12,179 15,506 27
Others 6,481 7,567 8,262 9,346 8,235 9,679 9,689 0 17 22,310 27,603 24
Operating Profits 14,501 14,864 16,585 18,208 15,585 17,756 20,592 16 24 45,949 53,933 17
Provisions 3,330 3,788 3,139 2,544 1,758 4,056 4,223 4 35 10,256 10,038 -2
PBT 11,171 11,076 13,446 15,664 13,826 13,701 16,369 19 22 35,692 43,896 23
Taxes 3,752 3,725 4,532 5,463 4,403 4,497 5,346 19 18 12,009 14,246 19
PAT 7,419 7,351 8,914 10,201 9,424 9,203 11,023 20 24 23,684 29,649 25
Asset Quality
GNPA 13,409 13,624 14,829 15,994 15,731 17,438 19,145 10 29
NNPA 4,134 4,094 3,855 4,104 4,625 5,488 6,829 24 77
GNPA (%) 1.1 1.1 1.1 1.0 1.1 1.1 1.1 2.0 1.0
NNPA (%) 0.4 0.3 0.3 0.3 0.3 0.3 0.4 5.0 10.0
PCR (Calculated, %) 69 70 74 74 71 69 64 -420 -967
PCR (Reported, %) 77 80 83 81 80 78 75 -241 -741
Sl ippages 4,210 4,460 3,340 2,480 2,960 4,960 5,350 8 60
Slippage Ratio 2.2 2.2 1.6 1.0 1.1 1.8 1.7 -6 16
Prov. for NPA in qtr 3,020 3,210 2,330 970 1,530 2,470 3,340 35 43 8,560 7,340 -14
Credit Cost 1.1 1.2 0.8 0.3 0.4 0.7 0.9 20 13
Restructured loans 21,510 20,610 21,170 19,300 21,510 24,100 27,010 12 28
% to Loans 2.0 1.9 1.7 1.4 1.6 1.7 1.8 10 10
Ratios (%)
Fees to Total Income 29.9 32.1 33.6 39.1 36.5 34.5 34.2 31.9 35.02
Cost to Core Income 47.0 47.2 45.3 45.4 47.9 46.9 45.0 46.4 47
Tax Rate 33.6 33.6 33.7 34.9 31.8 32.8 32.7 33.6 32
CASA (Cal.) 40.2 41.5 42.3 41.1 40.5 42.2 41.6
Loan/Deposit 73.6 70.5 79.3 75.3 71.8 72.0 71.3
CAR 15.0 14.6 13.8 12.7 13.0 12.2 13.1
Tier I 10.8 10.7 10.2 9.4 9.8 9.3 9.6
Fee income distribution
Large and Mid Corp 2,280 2,980 3,520 4,380 4,130 3,790 4,730 25 34 8,780 12,650 44
Treasury & DCM 1,690 1,850 1,860 2,550 2,100 2,740 2,320 -15 25 5,400 7,160 33
Agri and SME 370 480 580 1,000 430 640 660 3 14 1,430 1,730 21
Business Banking 940 920 950 1,070 990 970 1,090 12 15 2,810 3,050 9
Capital Markets 200 160 150 190 160 150 130 -13 -13 510 440 -14
Retail Banking 2,050 2,100 2,610 3,120 2,760 2,910 3,280 13 26 6,760 8,950 32
Wealth management 190 390 640 1,030 590 770 980 27 53
Cards Fees 570 710 800 850 810 1,090 1,110 2 39
Other 1,290 1,000 1,170 1,240 1,360 1,050 1,190 13 2
Margins - Reported (%)
Cost of Funds 4.6 4.8 4.8 5.6 6.1 6.2 6.3 15 155
Margins 3.7 3.7 3.8 3.4 3.3 3.8 3.8 -3 -6
Franchise
Branches 1,050 1,103 1,120 1,390 1,411 1,446 1,493 47 373
ATM 4,474 4,846 5,303 6,270 6,871 7,594 8,324 730 3,021
For %age change QoQ and YoY is bp Source: Company/MOSL

Axis Bank
20 January 2012 8
Quarterly Snapshot
FY10 FY11 FY12 Variation (%)
INR b 1Q 2Q 3Q 4Q 1Q 2Q 3Q 4Q 1Q 2Q 3Q QoQ YoY
Balance Sheet
Loans 781 810 848 1,043 1,086 1,106 1,235 1,424 1,319 1,401 1,487 6 20
Investments 463 521 493 560 575 619 596 720 753 850 903 6 51
Customer Assets 895 926 934 1,164 1,181 1,204 1,329 1,578 1,492 1,614 1,751 8 32
Deposits 1,103 1,156 1,139 1,413 1,475 1,569 1,558 1,892 1,836 1,945 2,087 7 34
Borrowings 160 157 160 172 196 190 256 263 223 268 308 15 20
Total Assets 1,411 1,517 1,505 1,806 1,895 1,998 2,067 2,427 2,331 2,506 2,693 7 30
Deposits Break Up
Retail Deposits 442 483 513 551 638 679 615 743 797 875 919 5 50
% to total Deposits 40 42 45 39 43 43 39 39 43 45 44
Other Deposits 660 673 625 862 837 890 944 1,149 1,039 1,070 1,168 9 24
% to total Deposits 60 58 55 61 57 57 61 61 57 55 56
Deposits Break Up
CASA Deposits 442 495 519 660 592 652 659 778 744 821 868 6 32
% to total Deposits 40 43 46 47 40 42 42 41 41 42 42
Savings 252 280 296 339 347 378 391 409 429 468 473 1 21
% to total Deposits 23 24 26 24 24 24 25 22 23 24 23
Current 190 215 223 322 245 274 268 369 315 354 395 12 47
% to total Deposits 17 19 20 23 17 17 17 20 17 18 19
Term Deposits 661 661 619 753 882 917 899 1,115 1,092 1,123 1,219 9 36
% to total Deposits 60 57 54 53 60 58 58 59 59 58 58
Loan Break Up
Agriculture 75 79 78 115 106 91 108 173 147 106 107 1 -1
SME Loans 149 150 165 195 168 168 171 214 198 208 207 0 21
Retail Loans 168 180 189 208 211 210 252 278 270 293 333 13 32
of which
Auto 22 25 28 28 27 27 28 31 35 38 43 13 56
Housing 109 120 134 147 150 153 169 189 203 223 249 12 48
Personal Loans 25 23 15 20 21 21 45 44 16 18 20 13 -56
Others 12 11 11 13 13 8 10 14 16 15 20 36 98
Other loans 389 401 416 525 601 637 705 759 703 794 841 6 19
Loan Mix (%)
Agriculture 10 10 9 11 10 8 9 12 11 8 7
SME Loans 19 19 19 19 15 15 14 15 15 15 14
Reta i l s 21 22 22 20 19 19 20 19 20 21 22
Others 50 49 49 50 55 58 57 53 53 57 57
Ratings Profile (%)
Large and Mid Corp
AAA 4 2 6 10 9 8 8 7 8 7 6
AA 22 23 19 18 19 22 24 25 26 24 23
A 54 53 49 47 46 44 41 43 41 42 41
BBB 18 19 22 22 23 23 25 23 23 24 27
<BBB and below 2 3 4 3 3 3 2 2 2 3 3
SME
SME1 1 1 1 2 2 2 2 5 5 5 6
SME2 10 11 11 13 15 17 17 18 20 18 18
SME3 65 63 62 62 60 60 59 59 55 56 55
SME4 16 17 17 13 13 12 12 11 12 13 12
SME 5-8 8 8 9 10 9 9 10 7 8 8 9
Source: Company/MOSL

Axis Bank
20 January 2012 9
EPS: MOSL forecast v/s consensus (INR)MOSL Consensus Variation
Forecast Forecast (%)
FY12 97.0 95.8 1.2
FY13 112.1 114.0 -1.7
Shareholding pattern (%)Dec-11 Sep-11 Dec-10
Promoter 37.6 37.2 37.4
Domestic Inst 6.7 7.0 5.3
Foreign 40.6 42.9 45.8
Others 15.1 12.9 11.6
1-year Sensex rebased
Stock Info
600
850
1,100
1,350
1,600
Jan-11 Apr-11 Jul -11 Oct-11 Jan-12
Axis Bank Sensex - Rebased

Axis Bank
20 January 2012 10
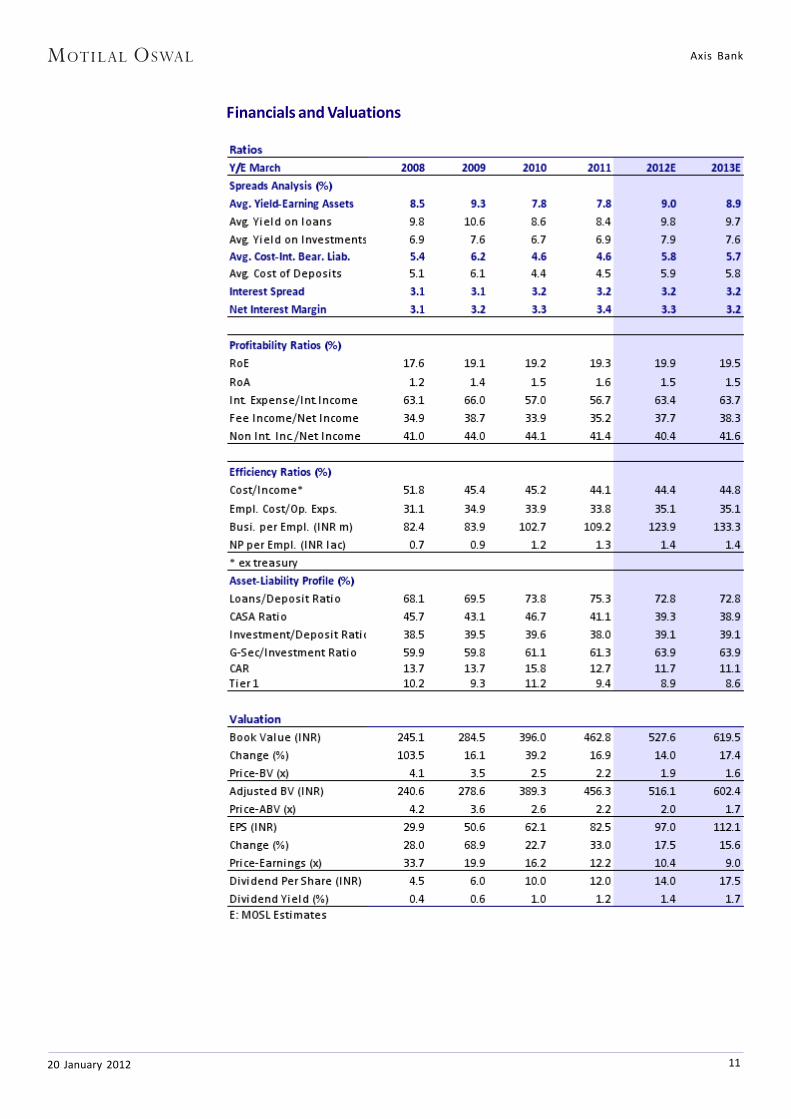
Financials and Valuations
Axis Bank
20 January 2012 11
Financials and Valuations

DisclosuresThis report is for personal information of the authorized recipient and does not construe to be any investment, legal or taxation advice to you. This research report does not constitute an offer, invitation or inducementto invest in securities or other investments and Motilal Oswal Securities Limited (hereinafter referred as MOSt) is not soliciting any action based upon it. This report is not for public distribution and has beenfurnished to you solely for your information and should not be reproduced or redistributed to any other person in any form.
Unauthorized disclosure, use, dissemination or copying (either whole or partial) of this information, is prohibited. The person accessing this information specifically agrees to exempt MOSt or any of its affiliates
or employees from, any and all responsibility/liability arising from such misuse and agrees not to hold MOSt or any of its affiliates or employees responsible for any such misuse and further agrees to hold MOStor any of its affiliates or employees free and harmless from all losses, costs, damages, expenses that may be suffered by the person accessing this information due to any errors and delays.
The information contained herein is based on publicly available data or other sources believed to be reliable. While we would endeavour to update the information herein on reasonable basis, MOSt and/or itsaffiliates are under no obligation to update the information. Also there may be regulatory, compliance, or other reasons that may prevent MOSt and/or its affiliates from doing so. MOSt or any of its affiliates or
employees shall not be in any way responsible and liable for any loss or damage that may arise to any person from any inadvertent error in the information contained in this report . MOSt or any of its affiliatesor employees do not provide, at any time, any express or implied warranty of any kind, regarding any matter pertaining to this report, including without limitation the implied warranties of merchantability, fitnessfor a particular purpose, and non-infringement. The recipients of this report should rely on their own investigations.
This report is intended for distribution to institutional investors. Recipients who are not institutional investors should seek advice of their independent financial advisor prior to taking any investment decision
based on this report or for any necessary explanation of its contents.
MOSt and/or its affiliates and/or employees may have interests/positions, financial or otherwise in the securities mentioned in this report. To enhance transparency, MOSt has incorporated a Disclosure of InterestStatement in this document. This should, however, not be treated as endorsement of the views expressed in the report.
Disclosure of Interest Statement Axis Bank1. Analyst ownership of the stock No2. Group/Directors ownership of the stock No3. Broking relationship with company covered No4. Investment Banking relationship with company covered No
Analyst CertificationThe views expressed in this research report accurately reflect the personal views of the analyst(s) about the subject securities or issues, and no part of the compensation of the research analyst(s) was, is, orwill be directly or indirectly related to the specific recommendations and views expressed by research analyst(s) in this report. The research analysts, strategists, or research associates principally responsiblefor preparation of MOSt research receive compensation based upon various factors, including quality of research, investor client feedback, stock picking, competitive factors and firm revenues.
Regional Disclosures (outside India)This report is not directed or intended for distribution to or use by any person or entity resident in a state, country or any jurisdiction, where such distribution, publication, availability or use would be contrary tolaw, regulation or which would subject MOSt & its group companies to registration or licensing requirements within such jurisdictions.
For U.K.This report is intended for distribution only to persons having professional experience in matters relating to investments as described in Article 19 of the Financial Services and Markets Act 2000 (Financial
Promotion) Order 2005 (referred to as "investment professionals"). This document must not be acted on or relied on by persons who are not investment professionals. Any investment or investment activity towhich this document relates is only available to investment professionals and will be engaged in only with such persons.
For U.S.MOSt is not a registered broker-dealer in the United States (U.S.) and, therefore, is not subject to U.S. rules. In reliance on the exemption from registration provided by Rule 15a-6 of the U.S. Securities Exchange
Act of 1934, as amended (the "Exchange Act") and interpretations thereof by the U.S. Securities and Exchange Commission ("SEC") in order to conduct business with Institutional Investors based in the U.S.,Motilal Oswal has entered into a chaperoning agreement with a U.S. registered broker-dealer, Marco Polo Securities Inc. ("Marco Polo").
This report is intended for distribution only to "Major Institutional Investors" as defined by Rule 15a-6(b)(4) of the Exchange Act and interpretations thereof by SEC (henceforth referred to as "major institutionalinvestors"). This document must not be acted on or relied on by persons who are not major institutional investors. Any investment or investment activity to which this document relates is only available to major
institutional investors and will be engaged in only with major institutional investors.
The Research Analysts contributing to the report may not be registered /qualified as research analyst with FINRA. Such research analyst may not be associated persons of the U.S. registered broker-dealer, MarcoPolo and therefore, may not be subject to NASD rule 2711 and NYSE Rule 472 restrictions on communication with a subject company, public appearances and trading securities held by a research analyst account.
Motilal Oswal Securities Ltd3rd Floor, Hoechst House, Nariman Point, Mumbai 400 021
Phone: (91-22) 39825500 Fax: (91-22) 22885038. E-mail: [email protected]