Embed Size (px)
Citation preview
1
FINANCE AND AUDITOperating Funds Investment Program

2
Operating Funds Investment Program
History
March 2005 Concluded competitive solicitation for investment consultant
June 2005 BOT approved the original investment policy
March 2006 Implemented with Wilshire Consulting
Prior to the implementation of the current investment program, all FIU operating funds were invested with the Florida State Treasury’s Special Purpose Investment Account (SPIA)

3
Operating Funds Investment ProgramGovernance
Florida Statute 218.415, Local Government Investment Policies
• Requires written investment policy• Prioritizes safety of capital, liquidity and return• Requires prudent and ethical standards• Recognizes risk and diversification
Investment Policy• BOT approved original and all subsequent amendments• Eight revisions since 2005• Most recent amendment, January 2015, added Credit Fixed Income and
Master Limited Partnerships

4
Operating Funds Investment ProgramGovernance (continued)
Audit Review• Policy and procedures audited by the State’s Auditor General in 2013• Concluded the investments were made in accordance with BOT policy and
F.S. 218.415• Noted that policy did not explicitly require continuing education although
requirement was fulfilled• Resolved by amending policy to include annual certification of CE
requirement
Committee• Designee of the BOT: Gerald C. Grant, Jr.• CFO of the University: Kenneth A. Jessell, Ph.D.• Treasurer of the University: P. Tony Vu• Representative from Academics: Chun-Hao Chang, Ph.D.• Community Expert: William Welch, Ph.D. (optional, up to two)
5
Operating Funds Investment ProgramGovernance (continued)
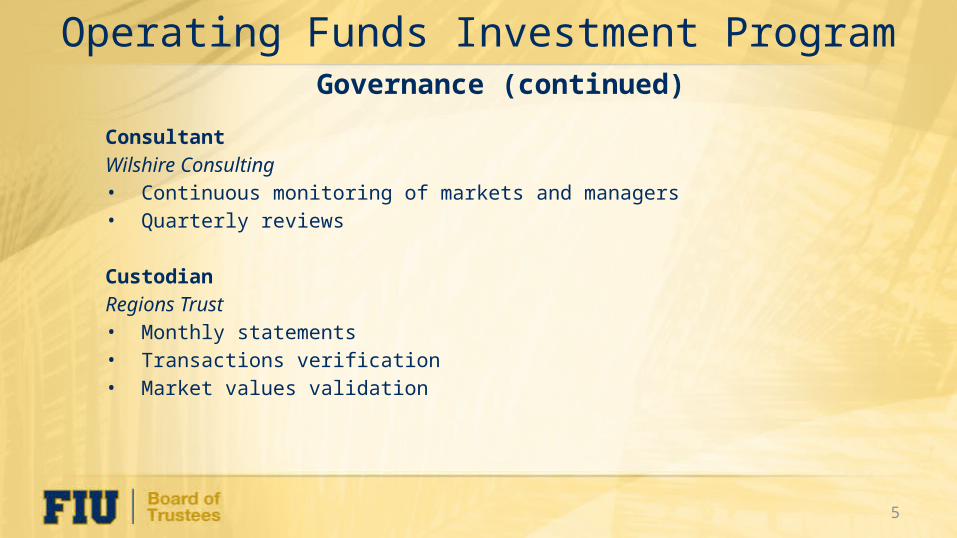
ConsultantWilshire Consulting• Continuous monitoring of markets and managers• Quarterly reviews
CustodianRegions Trust• Monthly statements• Transactions verification• Market values validation

6
Operating Funds Investment ProgramDiversification
Market Value, June 30, 2015: $294.2 million
21%
27%
23%
20%
10%
Broad Markets Exposure Across Several Asset ClassesA. Working Capital Pool ($76.1 M) •SPIA, Money Markets, Depository Account
B. Fixed Income ($73.6 M) •Investment Grade Core, High Yield, Credit
C. Real Assets ($63.4 M) •TIPS, Commodities, Global REITs, MLPs
D. Equities ($54.5 M) •US Large Cap, US Small Cap, Non-US, Private
E. Absolute Return ($26.6 M) •Hedge Fund of Funds
A
BC
DE
7
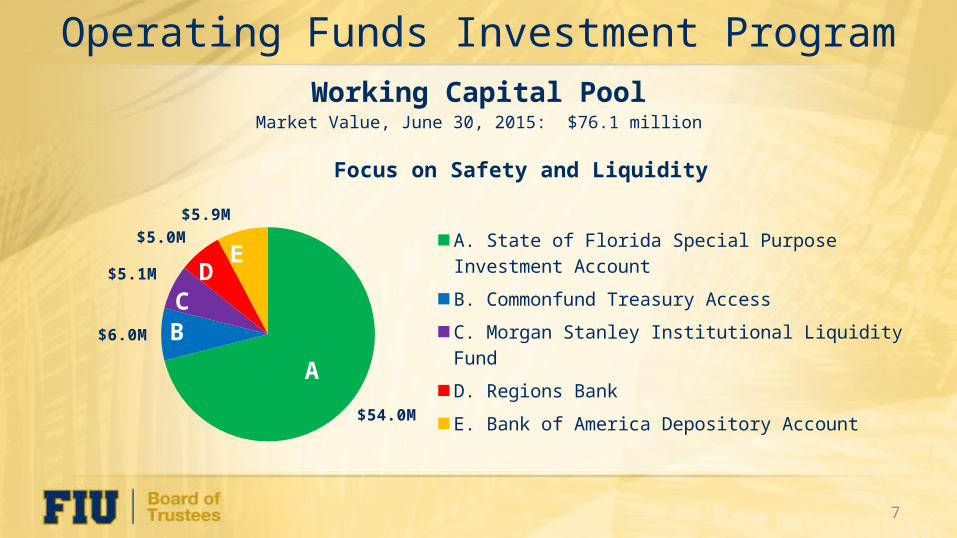
Operating Funds Investment ProgramWorking Capital Pool
Market Value, June 30, 2015: $76.1 million
$54.0M
$6.0M
$5.1M
$5.0M $5.9M
Focus on Safety and Liquidity
A. State of Florida Special Purpose Investment AccountB. Commonfund Treasury AccessC. Morgan Stanley Institutional Liquidity FundD. Regions BankE. Bank of America Depository Account
ABC
D E

8
Operating Funds Investment ProgramStrategic Capital and Reserve Pools
Market Value, June 30, 2015: $218.1 million
Focus on Diversification and Risk-Adjusted Returns for Funds Not Needed Short Term
$73.6M
$63.4M
$54.5M
$26.6M
A. Fixed Income
B. Real Assets
C. Equity
D. Absolute Return
A
B
C
D

9
Efficient Frontier 1 Total Combined Strategic/Reserve Working Capital
0.00
1.00
2.00
3.00
4.00
5.00
6.00
7.00
8.00
Ret
urn
0.00 1.00 2.00 3.00 4.00 5.00 6.00 7.00 8.00 9.00 10.00 11.00 12.00Risk
Efficient Frontier
* Compound Annual Return
Operating Funds Investment ProgramDiversification and Safety of Capital
SPIA (Benchmark)
10
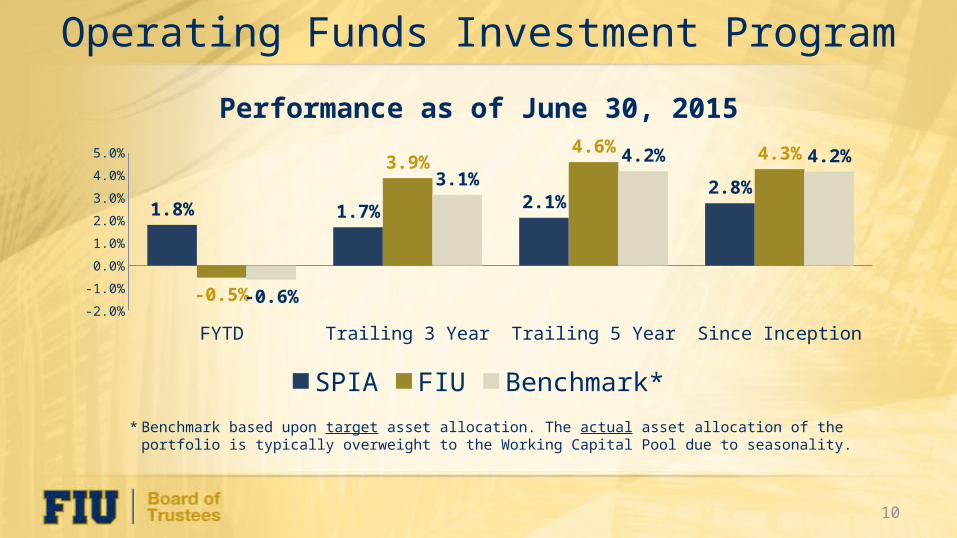
Operating Funds Investment ProgramPerformance as of June 30, 2015
* Benchmark based upon target asset allocation. The actual asset allocation of the portfolio is typically overweight to the Working Capital Pool due to seasonality.
FYTD Trailing 3 Year Trailing 5 Year Since Inception-2.0%-1.0%0.0%1.0%2.0%3.0%4.0%5.0%
1.8% 1.7% 2.1%2.8%
-0.5%
3.9%4.6% 4.3%
-0.6%
3.1%4.2% 4.2%
SPIA FIU Benchmark*

11
Operating Funds Investment ProgramContribution to University’s Unrestricted Net Position
2010 2011 2012 2013 2014 2015e$0
$50
$100
$150
$200
$250
$146.8 $143.5 $132.5 $119.5 $97.6 $87.3
$10.7 $13.2 $6.0 $8.2
$9.1 $9.3
$21.1 $41.4 $44.2 $54.7 $75.8
$69.2
Committed Fund Balances SPIA Performance Treasury Performance

12
FINANCE AND AUDITUniversity Investment Committee