Embed Size (px)
Citation preview
Higher Committee for Japan International Cooperation Agency Greater Cairo Transportation Planning (JICA) Government of the Arab Republic of Egypt
Transportation Master Plan and
Feasibility Study of Urban Transport Projects in
Greater Cairo Region in
the Arab Republic of Egypt
PHASE I FINAL REPORT
Volume II: Urban Transport Policy and Strategy
November 2002
Pacific Consultants International (PCI)

The following foreign exchange rates are applied in this study. USD $1.00 = 4.58 Egyptian Pound (LE)
(As of August 2002)

PREFACE
In response to a request from the Government of the Arab Republic of Egypt, the Government of Japan decided to conduct the Study for the Transportation Master Plan and Feasibility Study of Urban Transport Projects in Greater Cairo Region in the Arab Republic of Egypt and entrusted the Study to the Japan International Cooperation Agency (JICA). JICA selected and dispatched a study team headed by Dr. Katsuhide Nagayama of Pacific Consultants International to the Arab Republic of Egypt between March 2001 and September 2002. In addition, JICA set up an Advisory Committee headed by Professor Noboru Harata of Tokyo University between March 2001 and October 2002, which examined the Study from Specialist and technical point of view. The Study Team held discussions with the officials concerned of the Government of the Arab Republic of Egypt and conducted field surveys at the study area. Upon returning to Japan, the Study Team conducted further studies and prepared this report. I hope that this report will contribute to development in the Arab Republic of Egypt, and to the enhancement of friendly relationship between our two countries. Finally, I wish to express my sincere appreciation to the officials concerned of the Government of the Arab Republic of Egypt for their close cooperation extended to the Study Team.
November 2002
Takao Kawakami
President Japan International Cooperation Agency

November 2002 Mr. Takao Kawakami President Japan International Cooperation Agency Tokyo, Japan
Letter of Transmittal
Dear Sir, We are pleased to formally submit herewith the Final Report of “Transportation Master Plan and Feasibility Study of Urban Transport Project in Greater Cairo Region in the Arab Republic of Egypt.”
This report compiles the results of the Study which was undertaken in the Arab Republic of Egypt from March 2001 through September 2002 by the Study Team organized by Pacific Consultants International under the contract with the JICA.
This report compiles Transport Master Plan based upon identification of present condition in order to contribute to the sustainable development in Greater Cairo Region.
We would like to express our sincere gratitude and appreciation to all the officials of your agency and the JICA advisory Committee. We also would like to send our great appreciation to all those extended their kind assistance and cooperation to the Study Team, in particular, Ministry of Transport and Egyptian National Institute of Egypt as the counterpart agency. We beg to acknowledge our sincere gratitude to Dr. Ibrahim El Dimeery, the ex- Minister of Transport, for his devoted initiation of the Study as well as H.E. Eng. Hamdy Al Shayeb, the Minister of Transport, for his strong support to our activities.
We hope that the report will be able to contribute significantly to development in the Arab Republic of Egypt.
Very truly yours,
Dr. Katsuhide Nagayama Team Leader, The Study Team for the Transportation Master Plan and Feasibility Study of Urban Transport Project in Greater Cairo Region in the Arab Republic of Egypt
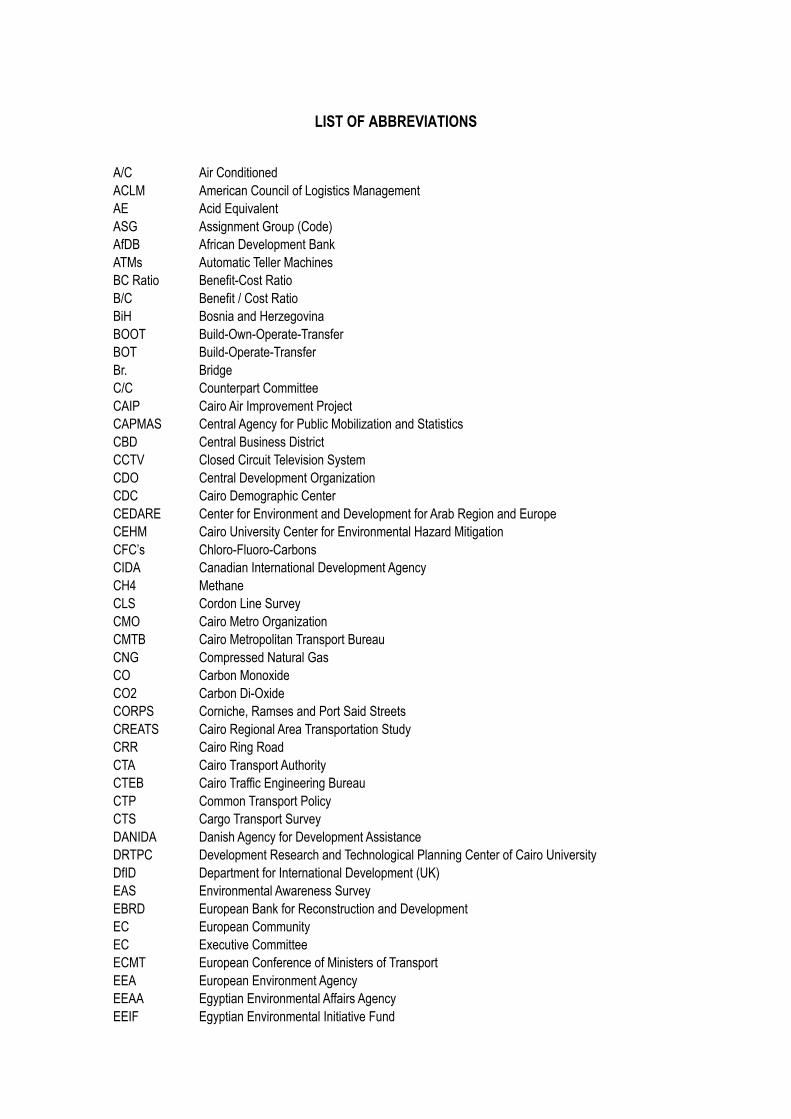
LIST OF ABBREVIATIONS A/C Air Conditioned ACLM American Council of Logistics Management AE Acid Equivalent ASG Assignment Group (Code) AfDB African Development Bank ATMs Automatic Teller Machines BC Ratio Benefit-Cost Ratio B/C Benefit / Cost Ratio BiH Bosnia and Herzegovina BOOT Build-Own-Operate-Transfer BOT Build-Operate-Transfer Br. Bridge C/C Counterpart Committee CAIP Cairo Air Improvement Project CAPMAS Central Agency for Public Mobilization and Statistics CBD Central Business District CCTV Closed Circuit Television System CDO Central Development Organization CDC Cairo Demographic Center CEDARE Center for Environment and Development for Arab Region and Europe CEHM Cairo University Center for Environmental Hazard Mitigation CFC’s Chloro-Fluoro-Carbons CIDA Canadian International Development Agency CH4 Methane CLS Cordon Line Survey CMO Cairo Metro Organization CMTB Cairo Metropolitan Transport Bureau CNG Compressed Natural Gas CO Carbon Monoxide CO2 Carbon Di-Oxide CORPS Corniche, Ramses and Port Said Streets CREATS Cairo Regional Area Transportation Study CRR Cairo Ring Road CTA Cairo Transport Authority CTEB Cairo Traffic Engineering Bureau CTP Common Transport Policy CTS Cargo Transport Survey DANIDA Danish Agency for Development Assistance DRTPC Development Research and Technological Planning Center of Cairo University DfID Department for International Development (UK) EAS Environmental Awareness Survey EBRD European Bank for Reconstruction and Development EC European Community EC Executive Committee ECMT European Conference of Ministers of Transport EEA European Environment Agency EEAA Egyptian Environmental Affairs Agency EEIF Egyptian Environmental Initiative Fund

EEIS Egyptian Environmental Information System EIA Environmental Impact Assessment EIRR Economic Internal Rate of Return EIS Environmental Impact Study EIMP Environmental Information and Monitoring Program EMT Environmental Management and Technology Fund ENIT Egyptian National Institute of Transport ENL Effective Number of Lanes ENR Egyptian National Railways EQI Environmental Quality International ESCAP Economic and Social Commission for Asia and Pacific ESCPR Economic and Social Counsel of Paris Region ESE Egyptian Stock Exchange EU European Union FLC Fully Loaded Containers FDI Foreign Direct Investments FIRR Financial Internal Rage of Return FRN French Railway Network FY Fiscal Year GAM Goal Achievement Matrix GARBLT General Authority for Roads, Bridges and Land Transport GC Greater Cairo GCBC Greater Cairo Bus Company GCMA Greater Cairo Metropolitan Area GCMP Greater Cairo Master Plan GCR Greater Cairo Region GDP Gross Domestic Product GIS Geographic Information System GNP Gross National Product GOE Government of Egypt GOPP General Organization for Physical Planning GOV. Governorate GRDP Gross Regional Domestic Product GSLTD General Syndicate for Land Transport Drivers HBE Home Based Education HBO Home Based Other HBW Home Based Work HC Hydro-Carbons H.C. Higher Committee HCM Highway Capacity Manual HDM Highway Development and Management System HIS Home Interview Survey HM Heavy Metals HOV High Occupancy Vehicle (Lane) HRT Heavy Rail Transit HSR High Speed Rail IAURIF I'Insitut d'Aménagement et d'Urbanisme de la Region d'Ile-de-France I/C Interchange ICM Intermodal Concept and Management ICT International Cargo Transport

ID Identification IEE Initial Environmental Examination IHCM Indonesian Highway Capacity Manual IHS Internal Homogeneous Planning Sector IIA Independence of Irrelevant Alternative IM Inter-Modal IMF International Monetary Fund IRF International Road Federation IRMS Integrated Road Management System ISESCO Islamic Educational, Scientific and Cultural Organization ISO International Organization for Standardization ITS Information Transfer Strategy ITU Intermodal Transport Unit JICA Japan International Cooperation Agency JIT Just In Time KAP Knowledge, Attitude and Practice LAN Local Area Network LE Egyptian Pound LOS Level of Service LRT Light Rail Transit MAD Mean Absolute Difference M/M Minutes of the Meetings MCA Multi-Criteria Analysis MEA Metropolitan Expressway Authority MENA Middle East and North African Nations MHUUC Ministry of Housing, Utilities and Urban Communities MINUTP Mini Urban Transport Planning Program MOE Ministry of Environment MOI Ministry of Interior MOIC Ministry of International Cooperation MOO Metro Operation Organization MOP Ministry of Planning MOT Ministry of Transport MP Master Plan MRT Mass Rapid Transit MS Mobile Station for Air Quality Monitoring MSEA Ministry of State for Environmental Affairs MTBE Methyl Tertiary Butyl Ether Mµ Micrometer N.A. Not Applicable/Available NAT National Authority for Tunnels NCPDM National Council of Physical Distribution Management NEAP National Environmental Action Plan NGO Non Governmental Organization NH4 Methane NHB Non Home Based NMHC Non Methane Hydro-Carbons NMVOC’s Non-Methane Volatile Organic Compounds NNL Nominal Number of Lanes NO Nitrogen Monoxide
NO2 Nitrogen Dioxide NOx Nitrogen Oxides NPDCR National Project for the Development of Cairo Region NPV Net Present Value NRR Net Reproduction Rate NU National Universities O3 Ozone OD Origin-Destination OECD Organization for Economic Co-operation and Development O&M Operation & Maintenance PCI Pacific Consultants International PCI Pavement Condition Index PCU Passenger Car Unit PHR Peak Hour Ratio (peak hour volume/daily volume) PM10 Particulate Matter (particles) less than 10 micro meter (µm) PM2.5 Particulate Matter (particles) less than 2.5 micro meter (µm) PPP Public-Private Partnership PPP Purchasing Power Parity PRD Paris Region Division PR/PI Public Relations and Public Involvement PRT Public Road Transport PRTC Parisian Region Transport Company PT Public Transport PTB Public Transport Bus PTF Public Transport Ferry PTM Public Transport Metro PTSR Public Transport Suburban Rail PTST Public Transport Super Tram PTT Public Transport Tram PTXR Public Transport Express Rail RCPR Regional Council of Paris Region ROI Return on Investment RPS Revealed Preference Survey S/C Steering Committee SCF Standard Conversion Factor SE Socio-economic SEA Strategic Environmental Assessment SLS Screen Line Survey SO2 Sulphur Dioxide SOx Sulphur Oxide SPS Stated Preference Survey TAP Transport Action Program TCB/AET Technical Consultation Bureau & Applied Engineering Technologies TDM Transport Demand Management TEN Trans-European Networks TEU Twenty-feet Equivalent Unit TNI Traffic Noise Index TOR Terms of Reference TP Traffic Police TPA Transport Planning Authority
TRASAC Traffic Safety Council TRASEC Traffic Safety Education Center TRASIC Traffic Safety Information Center TRASOs Traffic Safety Organizations TSP Total Suspended Particulate Matter TSP Traffic Safety Program TransCAD Transportation Computer Assisted Design Program UAE United Arab Emirates UK United Kingdom of Great Britain and Northern Ireland UNCTAD United Nations Conference on Trade and Development USA United States of America USAID United States Agency for International Development UTPU Urban Transport Planning Unit V/C Volume to Capacity Ratio (Volume divided by Capacity) VOC Vehicle Operating Cost VOC Volatile Organic Compounds WB World Bank (International Bank for Reconstruction and Development) WHO World Health Organization ZTEB Zone Traffic Engineering Bureau
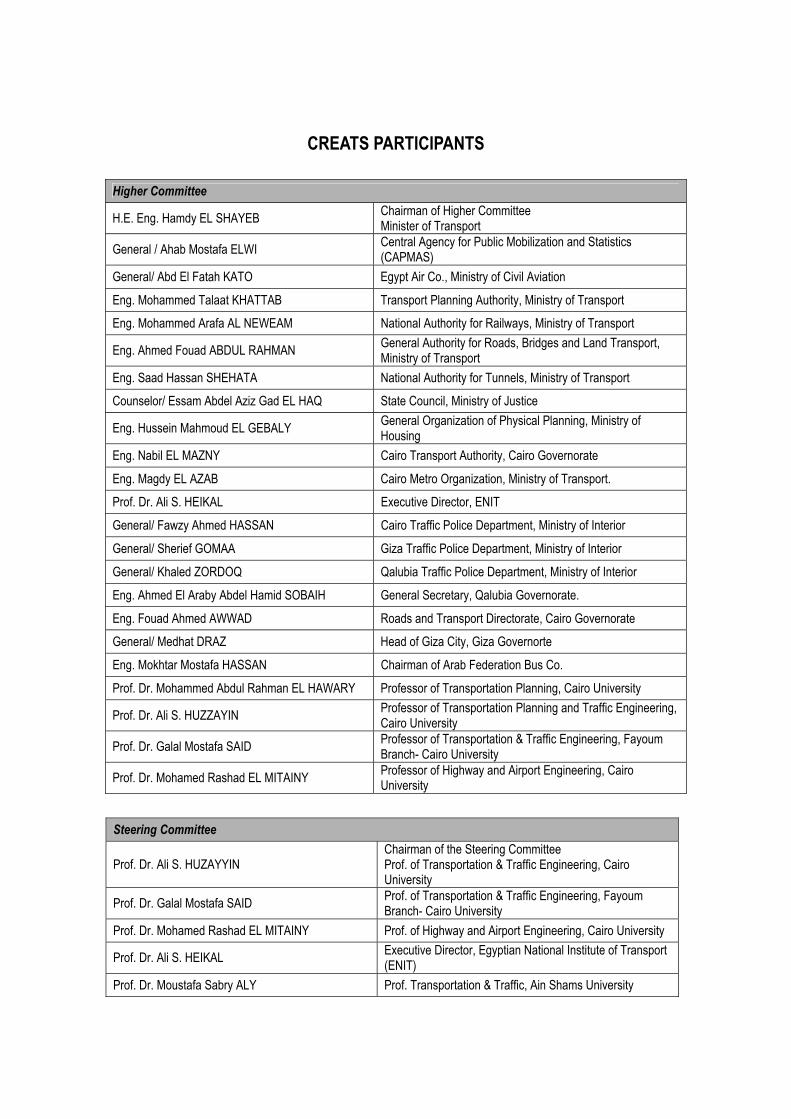
CREATS PARTICIPANTS Higher Committee
H.E. Eng. Hamdy EL SHAYEB Chairman of Higher Committee Minister of Transport
General / Ahab Mostafa ELWI Central Agency for Public Mobilization and Statistics (CAPMAS)
General/ Abd El Fatah KATO Egypt Air Co., Ministry of Civil Aviation
Eng. Mohammed Talaat KHATTAB Transport Planning Authority, Ministry of Transport
Eng. Mohammed Arafa AL NEWEAM National Authority for Railways, Ministry of Transport
Eng. Ahmed Fouad ABDUL RAHMAN General Authority for Roads, Bridges and Land Transport, Ministry of Transport
Eng. Saad Hassan SHEHATA National Authority for Tunnels, Ministry of Transport
Counselor/ Essam Abdel Aziz Gad EL HAQ State Council, Ministry of Justice
Eng. Hussein Mahmoud EL GEBALY General Organization of Physical Planning, Ministry of Housing
Eng. Nabil EL MAZNY Cairo Transport Authority, Cairo Governorate
Eng. Magdy EL AZAB Cairo Metro Organization, Ministry of Transport.
Prof. Dr. Ali S. HEIKAL Executive Director, ENIT
General/ Fawzy Ahmed HASSAN Cairo Traffic Police Department, Ministry of Interior
General/ Sherief GOMAA Giza Traffic Police Department, Ministry of Interior
General/ Khaled ZORDOQ Qalubia Traffic Police Department, Ministry of Interior
Eng. Ahmed El Araby Abdel Hamid SOBAIH General Secretary, Qalubia Governorate.
Eng. Fouad Ahmed AWWAD Roads and Transport Directorate, Cairo Governorate
General/ Medhat DRAZ Head of Giza City, Giza Governorte
Eng. Mokhtar Mostafa HASSAN Chairman of Arab Federation Bus Co.
Prof. Dr. Mohammed Abdul Rahman EL HAWARY Professor of Transportation Planning, Cairo University
Prof. Dr. Ali S. HUZZAYIN Professor of Transportation Planning and Traffic Engineering, Cairo University
Prof. Dr. Galal Mostafa SAID Professor of Transportation & Traffic Engineering, Fayoum Branch- Cairo University
Prof. Dr. Mohamed Rashad EL MITAINY Professor of Highway and Airport Engineering, Cairo University
Steering Committee
Prof. Dr. Ali S. HUZAYYIN Chairman of the Steering Committee Prof. of Transportation & Traffic Engineering, Cairo University
Prof. Dr. Galal Mostafa SAID Prof. of Transportation & Traffic Engineering, Fayoum Branch- Cairo University
Prof. Dr. Mohamed Rashad EL MITAINY Prof. of Highway and Airport Engineering, Cairo University
Prof. Dr. Ali S. HEIKAL Executive Director, Egyptian National Institute of Transport (ENIT)
Prof. Dr. Moustafa Sabry ALY Prof. Transportation & Traffic, Ain Shams University
Eng. Nabil Fathi El MAZNY Chairman of the Board, Cairo Transport Authority (CTA)
Eng. Fouad Ahmed AWWAD Roads and Transport Directorate, Cairo Governorate
Eng. Hassan Ahmed SELIM Transport Planning Authority, Ministry of Transport
Eng. Refki Khalil AL KADI Director of Cairo Traffic Engineering and Planning Bureau, Cairo Govern orate
Eng. Hoda Edward MICHEAL Director of Greater Cairo Region Urban Planning Center, General Organization for Physical Planning (GOPP), Ministry of Housing
General/ Fawzy Ahmed HASSAN Cairo Traffic Police Department, Ministry of Interior
General/ Sherif GOMAAH Giza Traffic Police Department, Ministry of Interior
Ms. Sanaa HEGAZY State Ministry for Foreign Affairs, Sector of International Cooperation
Eng. Enayat Benyamin KOLTA Ministry of Planning
Dr. Mawahab ABOU EL-AZM Egyptian Environmental Affairs Agency
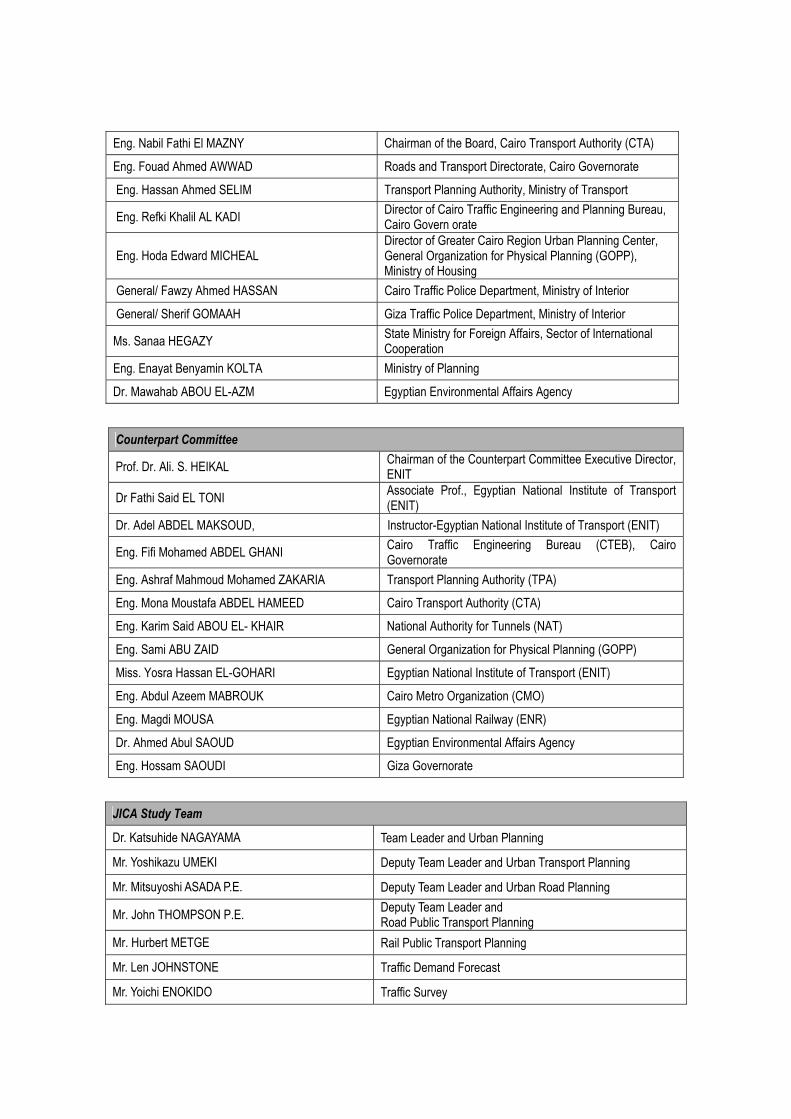
Counterpart Committee
Prof. Dr. Ali. S. HEIKAL Chairman of the Counterpart Committee Executive Director, ENIT
Dr Fathi Said EL TONI Associate Prof., Egyptian National Institute of Transport (ENIT)
Dr. Adel ABDEL MAKSOUD, Instructor-Egyptian National Institute of Transport (ENIT)
Eng. Fifi Mohamed ABDEL GHANI Cairo Traffic Engineering Bureau (CTEB), Cairo Governorate
Eng. Ashraf Mahmoud Mohamed ZAKARIA Transport Planning Authority (TPA)
Eng. Mona Moustafa ABDEL HAMEED Cairo Transport Authority (CTA)
Eng. Karim Said ABOU EL- KHAIR National Authority for Tunnels (NAT)
Eng. Sami ABU ZAID General Organization for Physical Planning (GOPP)
Miss. Yosra Hassan EL-GOHARI Egyptian National Institute of Transport (ENIT)
Eng. Abdul Azeem MABROUK Cairo Metro Organization (CMO)
Eng. Magdi MOUSA Egyptian National Railway (ENR)
Dr. Ahmed Abul SAOUD Egyptian Environmental Affairs Agency
Eng. Hossam SAOUDI Giza Governorate
JICA Study Team
Dr. Katsuhide NAGAYAMA Team Leader and Urban Planning
Mr. Yoshikazu UMEKI Deputy Team Leader and Urban Transport Planning
Mr. Mitsuyoshi ASADA P.E. Deputy Team Leader and Urban Road Planning
Mr. John THOMPSON P.E. Deputy Team Leader and Road Public Transport Planning
Mr. Hurbert METGE Rail Public Transport Planning
Mr. Len JOHNSTONE Traffic Demand Forecast
Mr. Yoichi ENOKIDO Traffic Survey

Mr. Kazuto HONDA Traffic Survey and Analysis
Dr. Ahmed Hamdy GHAREIB Traffic Data Analysis
Dr. Eddy DECLERCQ Mode Interchange and Cargo Transport Planning
Mr. Kimio KANEKO Traffic Management Planning
Mr. Masao OWADA Construction Planning, Design and Cost Estimate
Dr. Nabil SEHSAH Organization, Management and Legal Structure
Mr. Frank de ZANGER Environmental Evaluation
Mr. Masatoshi KANEKO Economic & Financial Analyses
Mr. Peter WATSON Socio-economic Framework and Transport Economy
Ms. Mihoko OGASAWARA Administration and Urban Land Use
JICA Advisory Committee
Prof. Dr. Noboru HARATA Chairman of JICA Advisory Committee, University of Tokyo
Mr. Kazuhiro TANAKA Public Transport Planning Railway Technical Research Institute
Mr. Tsuyoshi FUJISAKI Urban Transport Planning Japan Institute of Construction Engineering
Mr. Akira ENDO Urban Transport Planning Japan Institute of Construction Engineering
JICA Secretariat
Mr. Takeshi NARUSE Director, First Development Study Division, Social Development Study Department
Mr. Satoshi UMENAGA Deputy Director, First Development Study Division, Social Development Study Department
Mr. Kenichi KONYA First Development Study Division, Social Development Study Department
Mr. Norio SHIMOMURA Resident Representative, Egypt Office
Mr. Toshiyuki IWAMA Deputy Resident Representative, Egypt Office
Mr. Tomoyuki UDA Assistant Resident Representative Egypt Office
Consultants Group 1
The Transportation Programme, Development Research and Technological Planning Center, DRTPC, Cairo University
The Transport and Traffic Consultations Unit (TTCU), Ain Shams University
Surveys • Household Interview Survey (HIS) • Revealed Preference Survey (RPS) • Stated Preference Survey (SPS) • Environmental Awareness Survey (EAS) • Cordon Line Survey • Cargo Transport Survey • Public Transport Passengers Survey • Transport Network Survey
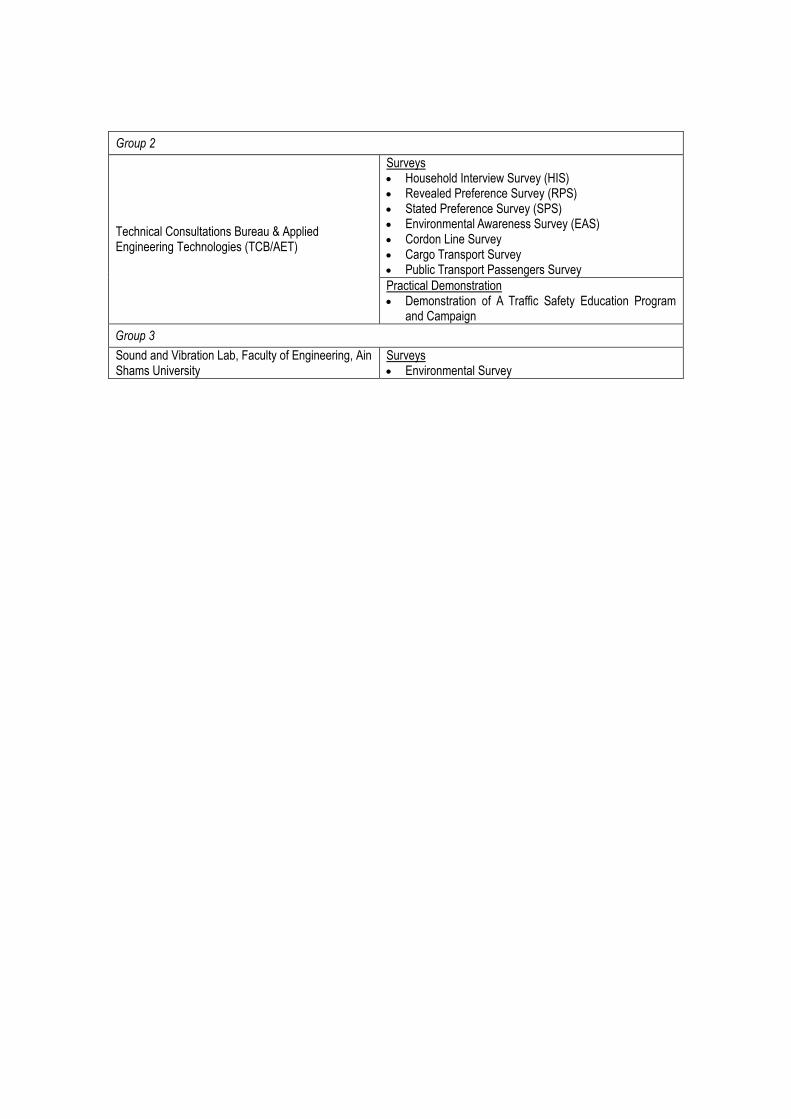
Group 2 Surveys • Household Interview Survey (HIS) • Revealed Preference Survey (RPS) • Stated Preference Survey (SPS) • Environmental Awareness Survey (EAS) • Cordon Line Survey • Cargo Transport Survey • Public Transport Passengers Survey
Technical Consultations Bureau & Applied Engineering Technologies (TCB/AET)
Practical Demonstration • Demonstration of A Traffic Safety Education Program
and Campaign Group 3 Sound and Vibration Lab, Faculty of Engineering, Ain Shams University
Surveys • Environmental Survey
CREATS: Phase I Final Report Vol. II: Urban Transport Policy and Strategy
1
TABLE OF CONTENTS
TABLE OF CONTENTS 1 1. INTRODUCTION 3 2. CHALLENGE FOR INNOVATIVE CAIRO TRANSPORT 6
Overall Issues 6 Planning Objectives of CREATS 7
3. PERSPECTIVES OF GREATER CAIRO IN 2022 10 Perspectives of Socioeconomic Evolution 10 Perspectives of Trip Generation and Demands 11 Perspectives of Urbanization 12
4. ALTERNATIVE SCENARIOS AND OPTIMAL TRANSPORT NETWORK 14 What Will Happen Without Integrated Transport? 14 Alternative Scenario Setting to Seek for an Optimal Transport Network 14 Overall Evaluation of Alternative Scenarios and the Optimal Transport Network 19
5. STRATEGY 1: IMPROVEMENT OF PEOPLE’S MOBILITY 23 Further Enhanced Policy to Improve People’s Mobility 23 Introduction of Traffic Demand Management (TDM) 24
6. STRATEGY 2: OPTIMAL INFRASTRUCTURE DEVELOPMENT & MANAGEMENT 25
PUBLIC TRANSPORT SYSTEM 25 An Efficient and User-friendly Public Transport System as the Backbone of Urban Mobility 25 Infrastructure Proposals for Structuring an Integrated Public Transport System 29 Infrastructure Investment: Summary 31
ROAD TRANSPORT NETWORK 32 Structuring a Hierarchical and Functional Road Network to Meet Increasing Traffic Demands 32 Road Sector Investment: Summary 36
INTERMODAL TRANSPORT SYSTEM 37 User-oriented Intermodal System with More Accessible Public Transport for All 37
TRAFFIC MANAGEMENT 39 Traffic Management for Pedestrian-friendly, Safe and Smooth Traffic 39 Medium-(2012) and Long-Term (2022) Actions 42
CARGO TRANSPORT SYSTEM 43 Rationalization of Cargo Traffic Movements and Mitigation of Negative Impacts 43 Strategic Measures for Cargo Transport System 44
Preface
Letter of Transmittal
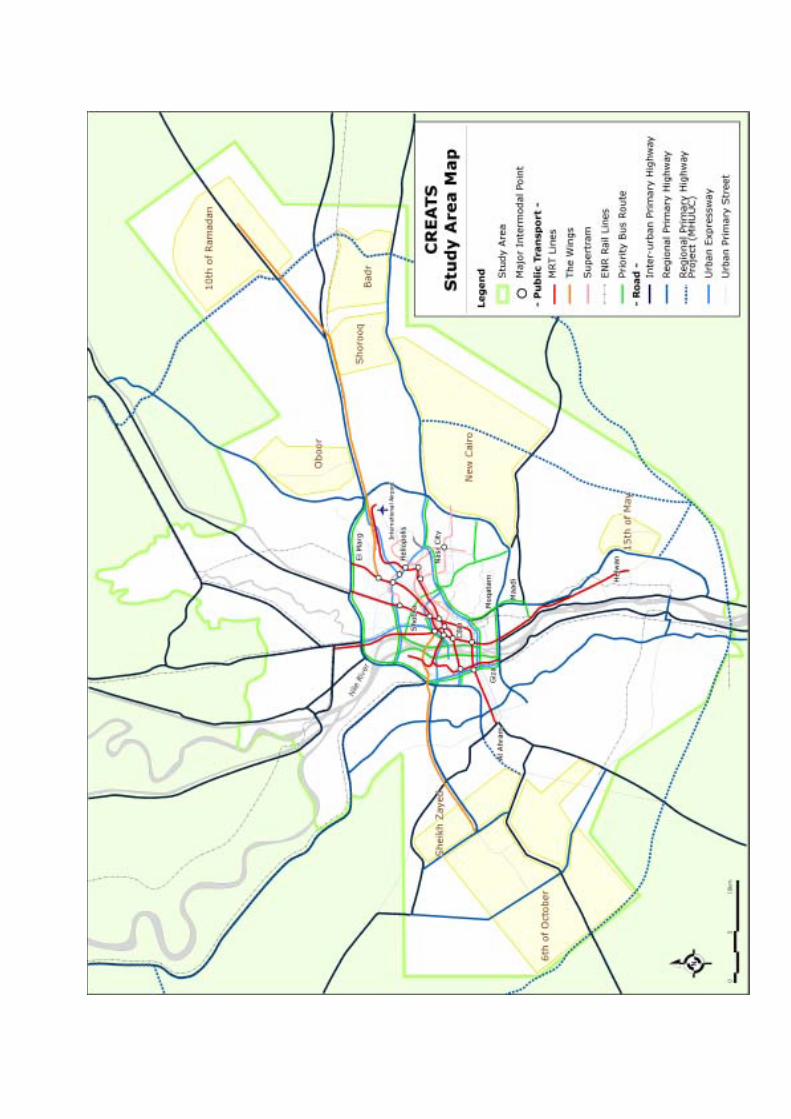
Study Area Map
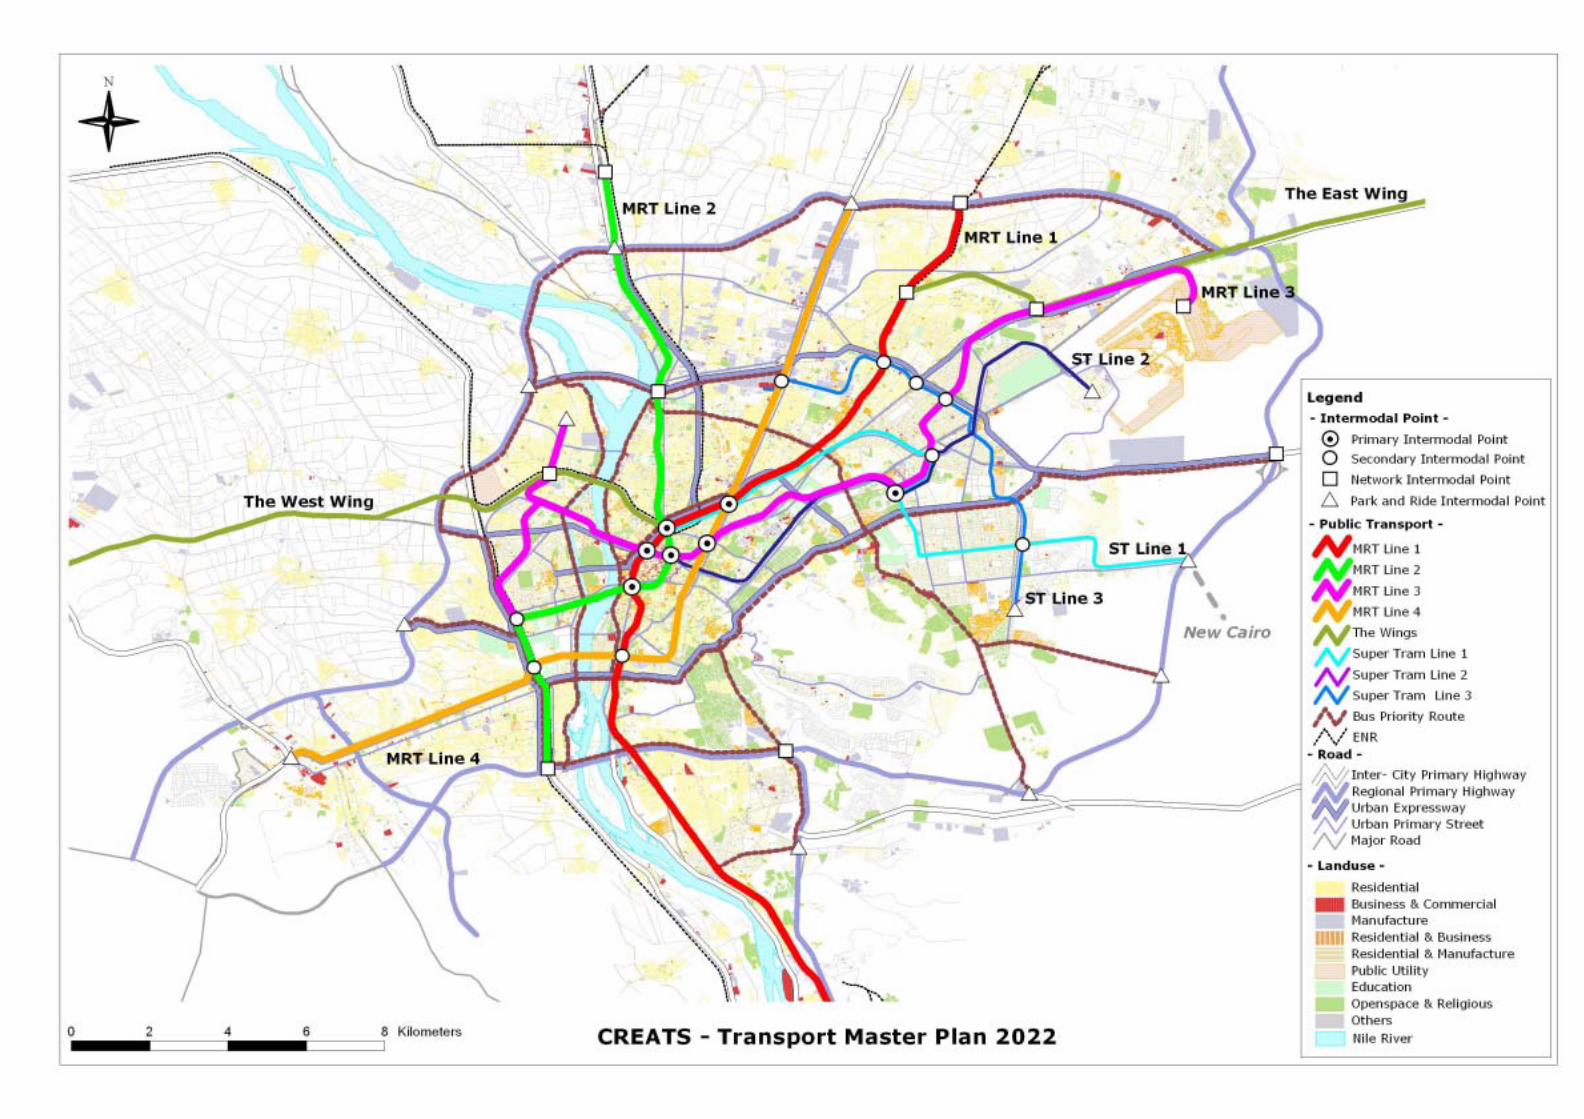
CREATS Master Plan 2022
Abbreviation
CREATS Participants
Table of Contents
Preface
Letter of Transmittal
Study Area Map
CREATS Master Plan 2022
Abbreviation
CREATS Participants
CREATS: Phase I Final Report Vol. II: Urban Transport Policy and Strategy
2
7. STRATEGY 3: SAFE AND ENVIRONMENT-FRIENDLY TRANSPORT 47 Enhancement of Human Factors to Promote Safe Transport 47 Considerations of Environment-friendly Transport 49
8. STRATEGY 4: ACCESSIBLE TRANSPORT FOR ALL 51 Accessible Transport for All to Assure Social Equity 51 Transport Service without Barriers 53
9. STRATEGY 5: SUSTAINABLE INSTITUTIONAL AND FINANCIAL MECHANISM 55
Institutional Reform for Transport Policy 55 Establishment of a Sustainable Financial Mechanism 57 Restructuring and Modernization of Public Operators 59
10. TDM POLICIES: EFFECTS AND IMPLICATIONS 61 Effective Non-physical Policy Tools for Transport Management 61 Urban Structure Reform 63
11. RECOMMENDED PROJECTS AND PROGRAMS 65 Integrated Programming of the CREATS Master Plan 65 Proposed Projects and Programs 66
12. PRIORITIZATION OF PROJECTS AND PROGRAMS 68 Methodology and Process 68 Priority of Recommended Projects and Programs 70
13. FOR THE IMPLEMENTATION 74 Economic Evaluation of the CREATS Master Plan 74 Urgent Initiatives Necessary for Materializing the CREATS Master Plan 75
14. THE WAY FORWARD 76

CREATS: Phase I Final Report Vol. II: Urban Transport Policy and Strategy
3
BACKGROUND
Japan International Cooperation Agency (JICA) and the Higher Committee for Greater Cairo Transport Planning, Ministry of Transport, are cooperating in the Transportation Master Plan and Feasibility Study of Urban Transport Projects in Greater Cairo Region in the Arab Republic of Egypt (CREATS – Cairo Regional Area Transportation Study), based upon the bilateral agreements finalized during November, 2000.
Pacific Consultants International, headquartered in Tokyo, Japan, is designated to be the lead consultant for the study, and organized the Study Team, head by Dr. Katsuhide Nagayama, comprising of a total of 17 experts. Technical efforts in Egypt were initiated during March 2001.
OBJECTIVES
CREATS is comprehensive in nature, that is, adopt approaches designed to mitigate urban transport problems and contribute to the sustainable development of the Greater Cairo Region. Three key objectives form the foundation of planning efforts:
• To formulate a master plan for the urban transport network in the Study Area to the year 2022;
• To conduct a feasibility study for the priority project(s) identified under the master plan (however, this object shall be undertaken as a follow-up effort to the master plan study); and
• To carry out technology transfer to the Egyptian counter personnel in the course of the study
The transport strategy embedded in the Master Plan must concurrently contribute to an efficient economic structure of the region, strengthen linkages with other parts of Egypt as well as neighboring countries, and provide a base for market-oriented transport activity. The foci of future planning efforts must gradually shift from alleviation of present deficiencies to realization of a transport system founded upon sustainable evolution and integrated, mutually supportive transport solutions.
THE STUDY AREA
The Study Area is defined as consisting of the entire Greater Cairo where is a massive conurbation whose year 2000 population is estimated at some 14 million, including new communities of 10th of Ramadan, and 6th of October, as shown in the Study Area Map. Administratively, the Study Area is encompassed with Cairo Governorate, Giza Governorate and part of Qalubia and Sharqia Governorates.
The Study Area includes the Republic’s capital city and serves as Egypt’s focal point for commercial, cultural, religious and economic activities. The urbanization is still progressive, and its entire transport system has worsen, despite that the government of Egypt has striven massive efforts to tackle with transport issues such as road traffic congestions and environmental deterioration, introducing a metro-system and bus network. Yet, an intermodal system has not been structured to lead to a substantial solution.
INTRODUCTION 1
CREATS: Phase I Final Report Vol. II: Urban Transport Policy and Strategy
4
SCOPE OF THE STUDY
The Study includes a full set of transport and traffic surveys with eleven kinds including a person trip-based home interview survey for about 57,000 sample households for identification of present conditions as well as building a reliable transport models.
The components of the Master Plan diversify beyond the traditional “Hardware” concepts associated with transport infrastructure provision. Additional key elements of the process consist of “Software” aspects, that is: technology and equipment, international standards, and multi-modal integration needs (cargo/passenger terminals, transfer points); and “Humanware” needs, or the cultivation of human resources via the designation of training and education programs as well as integration of those components, problem/issue identification and other requirements for developing expertise. The “Sustainability” of the future transport system shall be assured with the notion that the planning process must allow Egyptian stakeholders to participate in shaping their own future.
RELEVANCE TO PREVIOUS TRANSPORT STUDIES
There exist three transport master plan studies for Cairo so far. The first effort was made in 1973 by the French support under Transport Planning Authority (PTA), MOT, focusing on Metro Line Development. The second one was made in 1989, with technical support of JICA under Cairo Governorate, and the third one is “Public Transport Study” by the French support in 1999 under NAT. All efforts are appreciable and some recommendations are reasonable. However, as these studies had different objectives for different study areas (Fig. 1.1), all are not necessarily comparative on the same ground. CREATS is the first attempt to delineate a comprehensive transport master plan, covering the entire metropolitan areas of Greater Cairo Region. CREATS reviewed all the previous transport studies and kept relevance to these previous efforts as well as Five Years Plans of both National and relevant Governorates.
INFORMATION DISSEMINATION
Efforts were made until November 2002 when the final Master Plan was completed. Wide-spread information dissemination methodologies were, during that period, employed through holding a number of workshops, and seminars as well as distributing periodic “CREATS Newsletter” to the stakeholders. The CREATS Web-site was created for all those who are interested in the publications issued in the planning process.
STUDY MANAGEMENT AND COLLABORATION
CREATS is a result of close collaboration with well-organized Higher Committee, chaired by H. E. Eng. Hamdy Al Shayeb, Minister of Transport, Steering Committee, chaired by Prof. Dr. Ali S. Huzayyin, and Counterpart Committee chaired by Dr. Ali S. Heikal. The Study was supported by capacities of local resources from relevant ministries and authorities, academic institutions, the business sector as well as local consultants. The Study Team was also advised by the JICA Advisory Committee, chaired by Prof. Dr. Noboru Harata.
During the study period, efforts were made for technical transfer to the counterpart personnel through daily collaborative work and special workshops for modeling technique.
REPORTING STRUCTURE
The CREATS Master Plan (the outcomes from Phase I Study) is composed of four (4) separate volumes of reports:

CREATS: Phase I Final Report Vol. II: Urban Transport Policy and Strategy
5
Volume I: Executive Summary Volume II: Urban Transport Policy and Strategy Volume III: Transport Master Plan Volume IV: CREATS Urban Transport Database
Volume I complies essences of the CREATS Master Plan and summarizes recommendations derived from the Study. Volume II presents essential policies and strategies for improvement and development of the Greater Cairo transport system in the long-term, based on technical and analytical findings. Volume III discusses full-range of technical outcomes by sub-sector, including analytical findings, planning issues, approaches and methodologies, planning thoughts, projects and programs and recommendations for the implementation.
Meanwhile, Volume IV complies all supporting information and data collected/surveyed through the Study as well as the basic framework of the CREATS Model developed by the Study Team for simulation analyses. All those who are interested in technical and analytical methodologies in urban transport planning, and who are obliged to review the Master Plan periodically may refer to Volume IV.
15. 16.
Fig. 1.1 CREATS Study Area and Administrative Planning
CREATS: Phase I Final Report Vol. II: Urban Transport Policy and Strategy
6
OVERALL ISSUES Cairo, the premier city of Egypt and one of the cultural as well as historical beacons of the Arab World, has reached a cross-roads; her population has swelled to more than 14 million persons and will reach 20 million in 2022, thus placing growing stress on a variety of infrastructure systems. The increasingly difficult urban transport situation, characterized by a high degree of traffic congestion, constrained resources for public transport services and deteriorating air quality, lies in the forefront of such concerns. Concurrently, the political, spatial and economic roles of Greater Cairo are changing; the on-going implementation of the new communities program, anchored by the potentially massive 6th October and 10th Ramadan cities, require unique solutions which are capable of addressing both the functional integration of the region, as well as the needs of inner city development.
No single remedy can be expected to comprehensively address such concerns, instead, a more holistic approach is needed. Herein lies the challenge for CREATS; innovative solutions are needed whose practicality can be viewed through the prism of existing realities. The transport strategy embedded in the Master Plan must not only address cornerstone issues such as infrastructure, policies and human resources, but concurrently contribute to an efficient economic structure of the region, strengthen linkages with other parts of Egypt as well as neighboring countries, and provide a base for market-oriented transport activity.
Economic expansion within Egypt is well underway; continuing improvements in productivity and well-being are expected. As economic growth continues, changes in transport activities and behavior will follow suit. Thus, the foci of transport planning must gradually shift from alleviation of present deficiencies to realization of a transport system founded upon sustainable evolution and integrated, mutually supportive transport solutions. This strategy is particularly valid in the 20-year planning horizon.
If history holds any lessons, it is that future growth in income will inevitably catalyze an increase in trip making, as well as changes in the types of modes used to accomplish such trips. It is likely that private modes of transport, such as passenger cars, will continue to become increasingly popular with Cairo people. The key issue is therefore how to manage growth in transport demand by developing transport systems that ultimately enhance economic productivity, increase personal mobility, improve the urban environment and ensure financial viability. A key consideration in this regard is that ultimately the need to move people must take precedence over the need to move vehicles.
A need for capital-intensive improvement projects has been confirmed as part of investigative efforts. This, in turn, will require careful thought regarding investment decisions. Domestic funds will likely be limited for the foreseeable future, thus, international funding in the form of aid, grants and other monetary mechanisms is expected to evolve as an important source of finance, including the participation of the private sector.
A series of extensive surveys conducted by CREATS revealed a number of notable findings and planning implications on the current transport situation in the Greater Cairo Metropolis. Based on those, it is clear that new additional infrastructure construction cannot, in isolation, provide a comprehensive solution. Other mutually supportive
CHALLENGE FOR INNOVATIVE CAIRO TRANSPORT 2

CREATS: Phase I Final Report Vol. II: Urban Transport Policy and Strategy
7
strategies are required including strengthening of institutional and humanware components.
PLANNING OBJECTIVES OF CREATS CREATS aims at a social goal to ultimately achieve three visions, each of which is the vital factor to improve the Egyptian people’s quality of lives:
Vision 1: To Achieve a Sustainable Social and Economic Growth
Cairo, the premier city of Egypt, should be a robust engine to drive the Egyptian economy towards keeping its position as the economic and cultural center in the Arab world as well as Egypt in the future. A sustainable growth, in terms of people’s quality of lives as well as the urban economy, needs to be assured.
Vision 2: To Assure Social Equity
Benefits of the development should not be concentrated on selected groups, but should be equitably prevailed for all the people. Getting one happy must not worsen another.
Vision 3: To Improve Urban Environment
Being free from any fear of environmental risks is an essential human right for all urban habitants to enjoy sustainable urban life and economic activities. The healthy city must be a pride of all the Cairo citizens.
The transport sector shall play a significant role to materialize the above three social visions. In the line with them, the Cairo urban transport should be developed to satisfy the following three missions:
Economically Effective Urban Transport Systems Since a transport cost is part of diseconomies against the economic efficiency, the transport cost needs to be minimized to realize a sustainable social and economic growth in Greater Cairo Region (Vision 1). An economically effective urban transport system should be re-structured in such ways that travel time and costs spent for all urban activities can be minimized and that capital investments for construction of the system and recurrent expenditures for the operation and maintenance of the system can be economically feasible. Equitable People’s Mobility
The transport sector is greatly responsible for assuring social equity (Vision 2), providing all people with equitable accessibility to places for their employments, educations, medical cares, social services and other daily activities. To this end, all people’s mobility should be guaranteed by the public sector. Safe and Environment-friendly Transport System
Any mechanized transport means generates more or less environmental pollutions as far as fossil fuels are used for the energy source; and it is likely to incur risks of accidents. Making best use of appropriate technologies and human intelligence, a safe and environment-friendly transport system should be realized to improve urban environment (Vision 3).
GOAL AND VISIONS
MISSIONS OF TRANSPORT

CREATS: Phase I Final Report Vol. II: Urban Transport Policy and Strategy
8
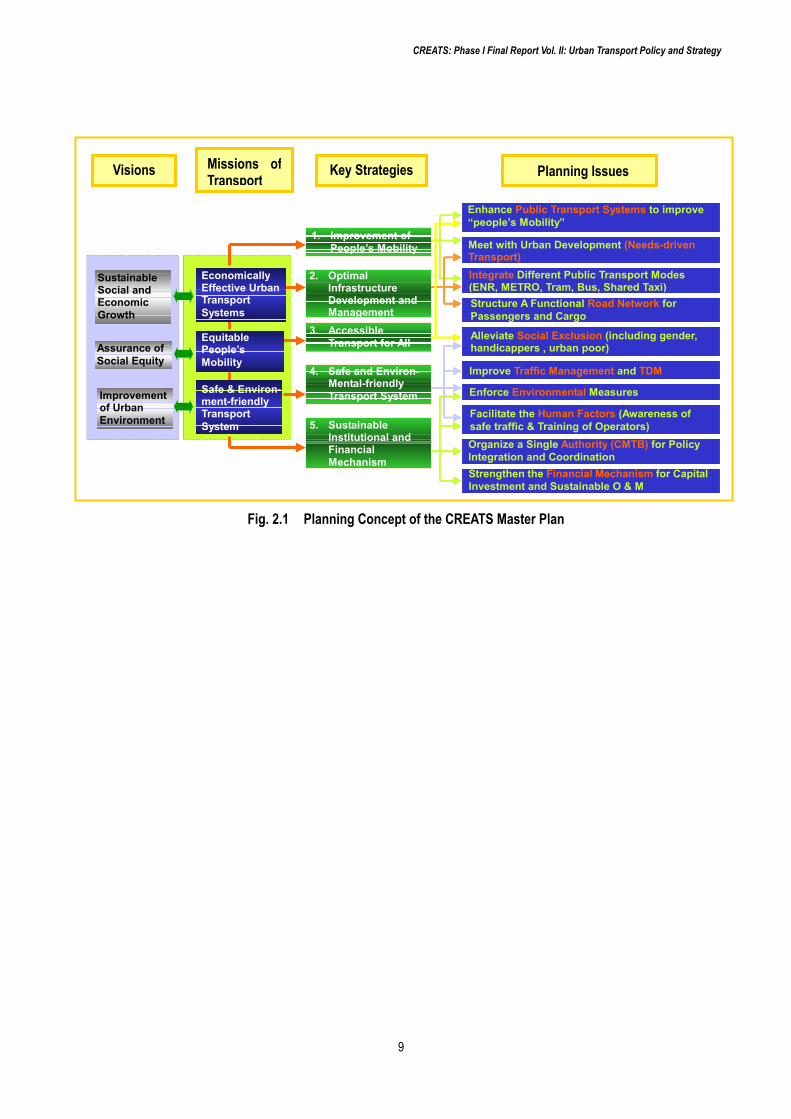
In response to the three missions of transport, extensive and intensive efforts should be made to build a robust and sustainable system to respond to future transport demands, while solving current problems and constraints. To this end, five (5) key strategies are proposed towards making Cairo Transport innovative over the next two decades time-horizon (Fig. 1). As each strategy needs some institutional and managerial reform as well as a considerable amount of public investments, the implementation of the five strategies requires challenging and innovative efforts by all government parties concerned.
Strategy 1: Improvement of People’s Mobility
Urban economies are supported by smooth and uneventful travel activities of an individual from one place to another with a purpose, which can be achieved by an optimal transport mode, not necessarily with a private vehicle. The most important is that people’s mobility should be improved in such a way that every travel can be made by the optimal cost, time and mode. Alleviation of road congestion is one of vital issues to be tackled, however, this shall contribute to improve the people’s mobility not only for vehicle’s mobility. To support the megalopolis with a 20 million population in this sense, development of a well-functioning public transport system is a must.
Strategy 2: Optimal Infrastructure Development and Management
Viewing future changes in social and economic activities as well as people’s travel behaviors, economically justifiable investments should be explored in order to fulfill a gap between demands and supplies. Over-investments to provide a supply capacity eventually shoulder a negative burden on the society, and under-investments will cause economical losses in the society. The keyword must be “optimal” in terms of the budgetary and economic affordability of capital investments and costs for the operation and maintenance. At the same time, the optimally developed infrastructures should be properly and efficiently managed with well-organized operational systems. Hence, the management is crucial part of the infrastructure development strategy.
Strategy 3: Safe and Environmental-friendly Transport
Safe transport is not only a basic requisite for the human right but also a critical factor to alleviate social and economic losses. A social norm that pedestrians shall take priority in traffic operations should be fostered among all people. The environmentally risky society should be ameliorated to realize sustainable prosperity of people.
Strategy 4: Accessible Transport for All
Public transport services should be equally provided for all the poor, handicapped and the weak in the society. The social welfare sector needs to address effective measures even in the transport sector based on a definite policy that any social exclusion shall not be accepted referring to the constitution.
Strategy 5: Establishment of a Sustainable Institutional and Financial Mechanism
An integrated policy implementation, a strong leadership for appropriate and timely decision-making and a sustainable mechanism to meet financial demands need to be established in order to make the Cairo Transport more functional and rational. In this regard, a number of institutional reforms should be taking into action with a firmed will by the elected people.
KEY STRATEGIES
CREATS: Phase I Final Report Vol. II: Urban Transport Policy and Strategy
9
1. Improvement of People’s Mobility
Enhance Public Transport Systems to improve “people’s Mobility”
Sustainable Social and Economic Growth
Improvement of Urban Environment
Assurance of Social Equity
Visions Missions of Transport Planning Issues Key Strategies
Meet with Urban Development (Needs-driven Transport) Integrate Different Public Transport Modes (ENR, METRO, Tram, Bus, Shared Taxi)Structure A Functional Road Network for Passengers and Cargo
Alleviate Social Exclusion (including gender, handicappers , urban poor)
Improve Traffic Management and TDM
Enforce Environmental Measures
Facilitate the Human Factors (Awareness of safe traffic & Training of Operators) Organize a Single Authority (CMTB) for Policy Integration and Coordination Strengthen the Financial Mechanism for CapitalInvestment and Sustainable O & M
2. OptimalInfrastructure Development and Management
3. AccessibleTransport for All
4. Safe and Environ-Mental-friendly Transport System
5. SustainableInstitutional and Financial Mechanism
Economically Effective Urban Transport Systems
Equitable People’s Mobility
Safe & Environ- ment-friendly Transport System
Fig. 2.1 Planning Concept of the CREATS Master Plan
CREATS: Phase I Final Report Vol. II: Urban Transport Policy and Strategy
10
PERSPECTIVES OF SOCIOECONOMIC EVOLUTION The Study Area, encompassing the Greater Cairo Region and new communities, has a population of 14.4 million as of 2001, which will increase to be 20.7 million in 2022 at the average growth rate of 1.7 percent per annum. The number of households is 3.5 million as of 2001, and will increase to be 5.1 million in 2022 at the average growth rate of 1.77 percent per annum.
Three scenarios of the economic growth in GCR until 2022 can be envisaged in terms of GRDP. The highest growth scenario will attain a 6.1% p.a. growth over two decades; the medium, a 4.6% growth, and the lowest, a 3.7% growth. It is assessed that the GCR economy is endowed with a potential to achieve the medium growth scenario. The per capita GRDP, therefore, will increase at about 2.9% p.a. during the period between 2001 and 2022, which implies that the per capita income of Cairo people will be 1.86 times as much as the present level.
The number of employments accounts for about 3.97 million in total in 2001, of which 2.44 million (62%) are provided by the tertiary sector, and 1.38 million (35%) by the secondary sector. Those who are engaged in the primary sector are marginal. Employment opportunities will increase along with the economic growth, and account for 6.94 million in total in 2022. The tertiary sector will slightly increase its share: 4.36 million (63%), while the secondary sector will be 2.41 million (35%).
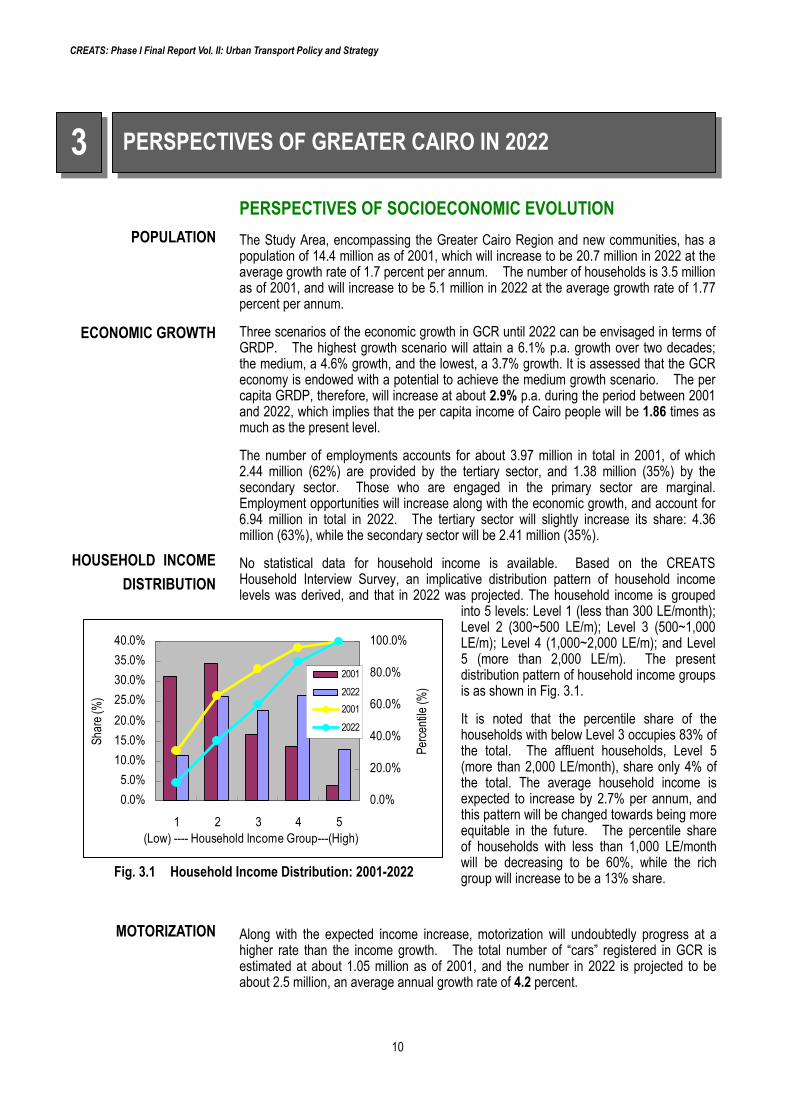
No statistical data for household income is available. Based on the CREATS Household Interview Survey, an implicative distribution pattern of household income levels was derived, and that in 2022 was projected. The household income is grouped
into 5 levels: Level 1 (less than 300 LE/month); Level 2 (300~500 LE/m); Level 3 (500~1,000 LE/m); Level 4 (1,000~2,000 LE/m); and Level 5 (more than 2,000 LE/m). The present distribution pattern of household income groups is as shown in Fig. 3.1.
It is noted that the percentile share of the households with below Level 3 occupies 83% of the total. The affluent households, Level 5 (more than 2,000 LE/month), share only 4% of the total. The average household income is expected to increase by 2.7% per annum, and this pattern will be changed towards being more equitable in the future. The percentile share of households with less than 1,000 LE/month will be decreasing to be 60%, while the rich group will increase to be a 13% share.
Along with the expected income increase, motorization will undoubtedly progress at a higher rate than the income growth. The total number of “cars” registered in GCR is estimated at about 1.05 million as of 2001, and the number in 2022 is projected to be about 2.5 million, an average annual growth rate of 4.2 percent.
PERSPECTIVES OF GREATER CAIRO IN 2022 3
Fig. 3.1 Household Income Distribution: 2001-2022
0.0%5.0%
10.0%15.0%20.0%25.0%30.0%35.0%40.0%
1 2 3 4 5(Low) ---- Household Income Group---(High)
Shar
e (%
)
0.0%
20.0%
40.0%
60.0%
80.0%
100.0%
Perce
ntile
(%)
2001
20222001
2022
POPULATION
ECONOMIC GROWTH
HOUSEHOLD INCOME DISTRIBUTION
MOTORIZATION
CREATS: Phase I Final Report Vol. II: Urban Transport Policy and Strategy
11
The CREATS survey reveals that only 30 percent of the households have access to a vehicle at present. Naturally, the higher income households feature higher accessibility. The Study Team correspondingly projected vehicle accessibility with respect to household income (Table 3.1).
It is noted that even given such a rapid motorization process, the households without car access will still be the majority, sharing 55% of the total.
Table 3.1 Households with Access to a Vehicle: Years 2001 and 2022 (Unit: million)
Household Economic Activity Class (Indicative Household Income) 2001 2022
Low (less than 500 LE/month) 0.27 0.25 Medium (500 ~1,000 LE/month) 0.23 0.43 High (more than 1,000 LE/month) 0.56 1.83
Total 1.06 2.51 Average Vehicle Accessibility per Household 0.30 0.49
Source: JICA Study Team
Not only the number of households with access to a vehicle increases but the number of motorized trips generated by these households will increase as well. This double impact is likely to increase the number of trips by more than 4 percent per annum over the next twenty years even with a substantial investment in public transport.
PERSPECTIVES OF TRIP GENERATION AND DEMANDS
MODAL PATTERN
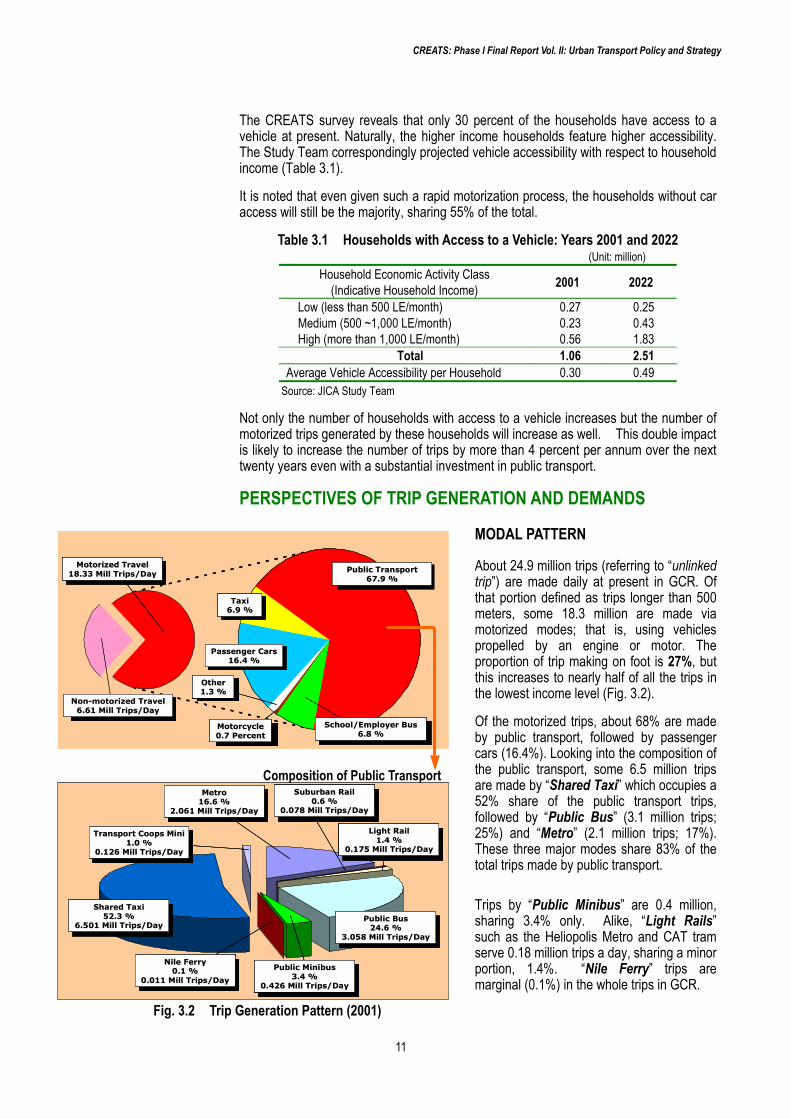
About 24.9 million trips (referring to “unlinked trip”) are made daily at present in GCR. Of that portion defined as trips longer than 500 meters, some 18.3 million are made via motorized modes; that is, using vehicles propelled by an engine or motor. The proportion of trip making on foot is 27%, but this increases to nearly half of all the trips in the lowest income level (Fig. 3.2).
Of the motorized trips, about 68% are made by public transport, followed by passenger cars (16.4%). Looking into the composition of the public transport, some 6.5 million trips are made by “Shared Taxi” which occupies a 52% share of the public transport trips, followed by “Public Bus” (3.1 million trips; 25%) and “Metro” (2.1 million trips; 17%). These three major modes share 83% of the total trips made by public transport. Trips by “Public Minibus” are 0.4 million, sharing 3.4% only. Alike, “Light Rails” such as the Heliopolis Metro and CAT tram serve 0.18 million trips a day, sharing a minor portion, 1.4%. “Nile Ferry” trips are marginal (0.1%) in the whole trips in GCR.
Passenger Cars16.4 %
Passenger CarsPassenger Cars16.4 %16.4 %
Taxi6.9 %
TaxiTaxi6.9 %6.9 %
Motorized Travel18.33 Mill Trips/Day
Motorized TravelMotorized Travel18.33 Mill Trips/Day18.33 Mill Trips/Day
Motorized Travel18.33 Mill Trips/Day
NonNon--motorized Travelmotorized Travel6.61 Mill Trips/Day6.61 Mill Trips/Day
Other1.3 %
OtherOther1.3 %1.3 %
Motorcycle0.7 Percent
MotorcycleMotorcycle0.7 Percent0.7 Percent
Motorized Travel18.33 Mill Trips/Day
School/Employer BusSchool/Employer Bus6.8 %6.8 %
Public TransportPublic Transport67.9 %67.9 %
Passenger Cars16.4 %
Passenger CarsPassenger Cars16.4 %16.4 %
Taxi6.9 %
TaxiTaxi6.9 %6.9 %
Passenger Cars16.4 %
Passenger CarsPassenger Cars16.4 %16.4 %
Passenger Cars16.4 %
Passenger CarsPassenger Cars16.4 %16.4 %
Taxi6.9 %
TaxiTaxi6.9 %6.9 %
Taxi6.9 %
TaxiTaxi6.9 %6.9 %
Motorized Travel18.33 Mill Trips/Day
Motorized TravelMotorized Travel18.33 Mill Trips/Day18.33 Mill Trips/Day
Motorized Travel18.33 Mill Trips/Day
Motorized TravelMotorized Travel18.33 Mill Trips/Day18.33 Mill Trips/Day
Motorized Travel18.33 Mill Trips/Day
Motorized TravelMotorized Travel18.33 Mill Trips/Day18.33 Mill Trips/Day
Motorized Travel18.33 Mill Trips/Day
NonNon--motorized Travelmotorized Travel6.61 Mill Trips/Day6.61 Mill Trips/Day
Motorized Travel18.33 Mill Trips/Day
NonNon--motorized Travelmotorized Travel6.61 Mill Trips/Day6.61 Mill Trips/Day
Motorized Travel18.33 Mill Trips/Day
NonNon--motorized Travelmotorized Travel6.61 Mill Trips/Day6.61 Mill Trips/Day
Other1.3 %
OtherOther1.3 %1.3 %
Motorcycle0.7 Percent
MotorcycleMotorcycle0.7 Percent0.7 Percent
Other1.3 %
OtherOther1.3 %1.3 %
Other1.3 %
OtherOther1.3 %1.3 %
Other1.3 %
OtherOther1.3 %1.3 %
Motorcycle0.7 Percent
MotorcycleMotorcycle0.7 Percent0.7 Percent
Motorcycle0.7 Percent
MotorcycleMotorcycle0.7 Percent0.7 Percent
Motorcycle0.7 Percent
MotorcycleMotorcycle0.7 Percent0.7 Percent
Motorized Travel18.33 Mill Trips/Day
School/Employer BusSchool/Employer Bus6.8 %6.8 %
Motorized Travel18.33 Mill Trips/Day
School/Employer BusSchool/Employer Bus6.8 %6.8 %
Motorized Travel18.33 Mill Trips/Day
School/Employer BusSchool/Employer Bus6.8 %6.8 %
Public TransportPublic Transport67.9 %67.9 %
Public TransportPublic Transport67.9 %67.9 %
Shared Taxi52.3 %
6.501Mill Trips/Day
Shared TaxiShared Taxi52.3 %52.3 %
6.501 Mill Trips/Day6.501 Mill Trips/Day Shared Taxi52.3 %
6.501Mill Trips/Day
Public BusPublic Bus24.6 %24.6 %
3.058 Mill Trips/Day3.058 Mill Trips/Day
Shared Taxi52.3 %
6.501Mill Trips/Day
MetroMetro16.6 %16.6 %
2.061 Mill Trips/Day2.061 Mill Trips/Day
Shared Taxi52.3 %
6.501Mill Trips/Day
Transport Coops MiniTransport Coops Mini1.0 %1.0 %
0.126 Mill Trips/Day0.126 Mill Trips/Day
Shared Taxi52.3 %
6.501Mill Trips/Day
Suburban RailSuburban Rail0.6 %0.6 %
0.078 Mill Trips/Day0.078 Mill Trips/Day
Shared Taxi52.3 %
6.501Mill Trips/Day
Light RailLight Rail1.4 %1.4 %
0.175 Mill Trips/Day0.175 Mill Trips/Day
Shared Taxi52.3 %
6.501Mill Trips/Day
Public MinibusPublic Minibus3.4 %3.4 %
0.426 Mill Trips/Day0.426 Mill Trips/Day
Shared Taxi52.3 %
6.501Mill Trips/Day
Nile FerryNile Ferry0.1 %0.1 %
0.011 Mill Trips/Day0.011 Mill Trips/Day
Shared Taxi52.3 %
6.501Mill Trips/Day
Shared TaxiShared Taxi52.3 %52.3 %
6.501 Mill Trips/Day6.501 Mill Trips/Day
Shared Taxi52.3 %
6.501Mill Trips/Day
Shared TaxiShared Taxi52.3 %52.3 %
6.501 Mill Trips/Day6.501 Mill Trips/Day Shared Taxi52.3 %
6.501Mill Trips/Day
Public BusPublic Bus24.6 %24.6 %
3.058 Mill Trips/Day3.058 Mill Trips/Day
Shared Taxi52.3 %
6.501Mill Trips/Day
Public BusPublic Bus24.6 %24.6 %
3.058 Mill Trips/Day3.058 Mill Trips/Day
Shared Taxi52.3 %
6.501Mill Trips/Day
MetroMetro16.6 %16.6 %
2.061 Mill Trips/Day2.061 Mill Trips/Day
Shared Taxi52.3 %
6.501Mill Trips/Day
MetroMetro16.6 %16.6 %
2.061 Mill Trips/Day2.061 Mill Trips/Day
Shared Taxi52.3 %
6.501Mill Trips/Day
MetroMetro16.6 %16.6 %
2.061 Mill Trips/Day2.061 Mill Trips/Day
Shared Taxi52.3 %
6.501Mill Trips/Day
Transport Coops MiniTransport Coops Mini1.0 %1.0 %
0.126 Mill Trips/Day0.126 Mill Trips/Day
Shared Taxi52.3 %
6.501Mill Trips/Day
Suburban RailSuburban Rail0.6 %0.6 %
0.078 Mill Trips/Day0.078 Mill Trips/Day
Shared Taxi52.3 %
6.501Mill Trips/Day
Light RailLight Rail1.4 %1.4 %
0.175 Mill Trips/Day0.175 Mill Trips/Day
Shared Taxi52.3 %
6.501Mill Trips/Day
Public MinibusPublic Minibus3.4 %3.4 %
0.426 Mill Trips/Day0.426 Mill Trips/Day
Shared Taxi52.3 %
6.501Mill Trips/Day
Nile FerryNile Ferry0.1 %0.1 %
0.011 Mill Trips/Day0.011 Mill Trips/Day
Shared Taxi52.3 %
6.501Mill Trips/Day
Transport Coops MiniTransport Coops Mini1.0 %1.0 %
0.126 Mill Trips/Day0.126 Mill Trips/Day
Shared Taxi52.3 %
6.501Mill Trips/Day
Transport Coops MiniTransport Coops Mini1.0 %1.0 %
0.126 Mill Trips/Day0.126 Mill Trips/Day
Shared Taxi52.3 %
6.501Mill Trips/Day
Transport Coops MiniTransport Coops Mini1.0 %1.0 %
0.126 Mill Trips/Day0.126 Mill Trips/Day
Shared Taxi52.3 %
6.501Mill Trips/Day
Suburban RailSuburban Rail0.6 %0.6 %
0.078 Mill Trips/Day0.078 Mill Trips/Day
Shared Taxi52.3 %
6.501Mill Trips/Day
Suburban RailSuburban Rail0.6 %0.6 %
0.078 Mill Trips/Day0.078 Mill Trips/Day
Shared Taxi52.3 %
6.501Mill Trips/Day
Suburban RailSuburban Rail0.6 %0.6 %
0.078 Mill Trips/Day0.078 Mill Trips/Day
Shared Taxi52.3 %
6.501Mill Trips/Day
Light RailLight Rail1.4 %1.4 %
0.175 Mill Trips/Day0.175 Mill Trips/Day
Shared Taxi52.3 %
6.501Mill Trips/Day
Light RailLight Rail1.4 %1.4 %
0.175 Mill Trips/Day0.175 Mill Trips/Day
Shared Taxi52.3 %
6.501Mill Trips/Day
Light RailLight Rail1.4 %1.4 %
0.175 Mill Trips/Day0.175 Mill Trips/Day
Shared Taxi52.3 %
6.501Mill Trips/Day
Public MinibusPublic Minibus3.4 %3.4 %
0.426 Mill Trips/Day0.426 Mill Trips/Day
Shared Taxi52.3 %
6.501Mill Trips/Day
Public MinibusPublic Minibus3.4 %3.4 %
0.426 Mill Trips/Day0.426 Mill Trips/Day
Shared Taxi52.3 %
6.501Mill Trips/Day
Public MinibusPublic Minibus3.4 %3.4 %
0.426 Mill Trips/Day0.426 Mill Trips/Day
Shared Taxi52.3 %
6.501Mill Trips/Day
Nile FerryNile Ferry0.1 %0.1 %
0.011 Mill Trips/Day0.011 Mill Trips/Day
Shared Taxi52.3 %
6.501Mill Trips/Day
Nile FerryNile Ferry0.1 %0.1 %
0.011 Mill Trips/Day0.011 Mill Trips/Day
Shared Taxi52.3 %
6.501Mill Trips/Day
Nile FerryNile Ferry0.1 %0.1 %
0.011 Mill Trips/Day0.011 Mill Trips/Day
Fig. 3.2 Trip Generation Pattern (2001)
Composition of Public Transport
CREATS: Phase I Final Report Vol. II: Urban Transport Policy and Strategy
12
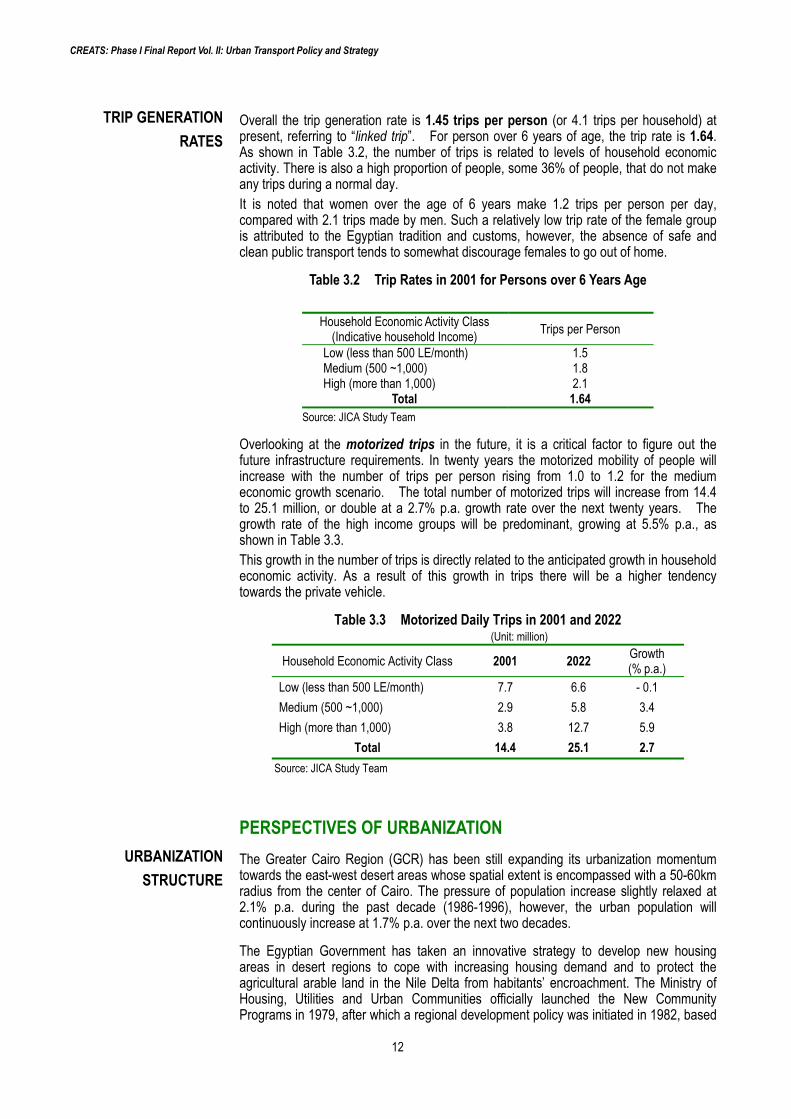
Overall the trip generation rate is 1.45 trips per person (or 4.1 trips per household) at present, referring to “linked trip”. For person over 6 years of age, the trip rate is 1.64. As shown in Table 3.2, the number of trips is related to levels of household economic activity. There is also a high proportion of people, some 36% of people, that do not make any trips during a normal day. It is noted that women over the age of 6 years make 1.2 trips per person per day, compared with 2.1 trips made by men. Such a relatively low trip rate of the female group is attributed to the Egyptian tradition and customs, however, the absence of safe and clean public transport tends to somewhat discourage females to go out of home.
Table 3.2 Trip Rates in 2001 for Persons over 6 Years Age
Household Economic Activity Class (Indicative household Income) Trips per Person
Low (less than 500 LE/month) 1.5 Medium (500 ~1,000) 1.8 High (more than 1,000) 2.1
Total 1.64 Source: JICA Study Team
Overlooking at the motorized trips in the future, it is a critical factor to figure out the future infrastructure requirements. In twenty years the motorized mobility of people will increase with the number of trips per person rising from 1.0 to 1.2 for the medium economic growth scenario. The total number of motorized trips will increase from 14.4 to 25.1 million, or double at a 2.7% p.a. growth rate over the next twenty years. The growth rate of the high income groups will be predominant, growing at 5.5% p.a., as shown in Table 3.3. This growth in the number of trips is directly related to the anticipated growth in household economic activity. As a result of this growth in trips there will be a higher tendency towards the private vehicle.
Table 3.3 Motorized Daily Trips in 2001 and 2022 (Unit: million)
Household Economic Activity Class 2001 2022 Growth (% p.a.)
Low (less than 500 LE/month) 7.7 6.6 - 0.1 Medium (500 ~1,000) 2.9 5.8 3.4 High (more than 1,000) 3.8 12.7 5.9
Total 14.4 25.1 2.7 Source: JICA Study Team
PERSPECTIVES OF URBANIZATION The Greater Cairo Region (GCR) has been still expanding its urbanization momentum towards the east-west desert areas whose spatial extent is encompassed with a 50-60km radius from the center of Cairo. The pressure of population increase slightly relaxed at 2.1% p.a. during the past decade (1986-1996), however, the urban population will continuously increase at 1.7% p.a. over the next two decades.
The Egyptian Government has taken an innovative strategy to develop new housing areas in desert regions to cope with increasing housing demand and to protect the agricultural arable land in the Nile Delta from habitants’ encroachment. The Ministry of Housing, Utilities and Urban Communities officially launched the New Community Programs in 1979, after which a regional development policy was initiated in 1982, based
URBANIZATIONSTRUCTURE
TRIP GENERATIONRATES
CREATS: Phase I Final Report Vol. II: Urban Transport Policy and Strategy
13
on the Physical Planning Law No. 3. Nowadays, five large urban agglomerations, comprised of eight new towns shape the Cairo metropolitan structure. These new suburban communities were originally designed to accommodate about 3.9 million population in total, with about 1,000 sq. km land area. This target was revised to be 4.2 million. It is generally recognized that in the new community structure, two urban agglomerations with a 2 million population are to be located in the east and west side of the GCR, namely the 10th of Ramadan and the 6th of October. Another 1.5 million inhabitants are to be located in three major new communities which are the Obour, the New Cairo and the 15th of May towns. In terms of urban land capacity, it is assessed that these new communities can spatially and physically accommodate the increasing housing demand for the next two decades, given even a 2% population growth in the GCR.
Towards the future, GCR faces two crucial urban planning issues. The first is how to redevelop or restructure the inner city areas with an extremely high population density (about 21,700 persons/sq. km on the average) to alleviate economic losses due to the congestions.
The second issue is how to functionally integrate the growing new communities physically spreading over more than 50km distant from the metropolitan center. Eventually, such an extensive megalopolis structure requires substantially huge capital investments to build new infrastructures, utilities and the transport system. In order not to hinder expected economic growth, the establishment of a functionally integrated transport network system, must be a key issue for the GCR.
The development of the new suburban communities depends greatly upon four key factors: 1) Economic performance in general; 2) State investment for housing and utilities; 3) Private capital for housing, facilities and employment; and 4) Transport links. Taking into account these factors, it was projected what degree of the achievement can be predicted in the CREATS target year 2022, in other words, how many people will reside there.
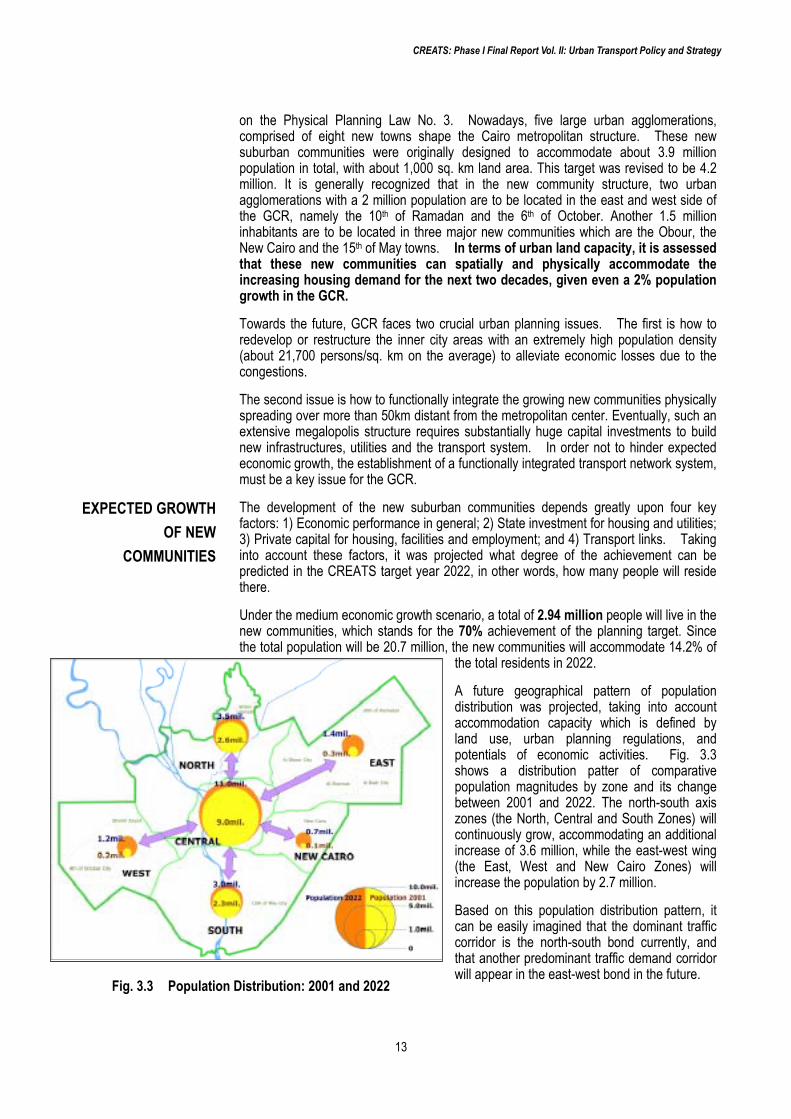
Under the medium economic growth scenario, a total of 2.94 million people will live in the new communities, which stands for the 70% achievement of the planning target. Since the total population will be 20.7 million, the new communities will accommodate 14.2% of
the total residents in 2022.
A future geographical pattern of population distribution was projected, taking into account accommodation capacity which is defined by land use, urban planning regulations, and potentials of economic activities. Fig. 3.3 shows a distribution patter of comparative population magnitudes by zone and its change between 2001 and 2022. The north-south axis zones (the North, Central and South Zones) will continuously grow, accommodating an additional increase of 3.6 million, while the east-west wing (the East, West and New Cairo Zones) will increase the population by 2.7 million.
Based on this population distribution pattern, it can be easily imagined that the dominant traffic corridor is the north-south bond currently, and that another predominant traffic demand corridor will appear in the east-west bond in the future.
Fig. 3.3 Population Distribution: 2001 and 2022
EXPECTED GROWTH OF NEW
COMMUNITIES

CREATS: Phase I Final Report Vol. II: Urban Transport Policy and Strategy
14
WHAT WILL HAPPEN WITHOUT INTEGRATED TRANSPORT? Given only currently committed projects in the road and public transport sectors and given nothing more than the committed efforts, the traffic situation of GCR in 2022 will be chaotic. This was envisaged by the CREATS model (see Box in the next page). It is assumed that the committed public transport projects include Metro Line 3, extension of Metro Line 2 and minor enhancements of the Heliopolis metro/CTA tram in the public transport system, while a number of on-going road improvement projects and those included in the Five Year Plan (2002-2007) are considered in the road sub-sector as tabulated below:
Table 4.1 Components of “Scenario A: Committed Network” Modes Projects Components
Road Network Projects under construction; Projects included in the Five Year Plan
Public Transport
MRT Moneeb Extension of Metro Line 2 Metro Line 3
LRT Existing Heliopolis Metro and CTA Trams Bus/Shared Taxi Existing route structure
The CREATS model reveals that under such a transport condition only with the committed projects, the trip speed on the average of all modes will be as low as 11.6 km/h in 2022, compared to the current trip speed of 19.0 km/h. This means that the major roads will be fully congested all day, that is, the volume/capacity (V/C) rate on the daily average will reach 1.5, which means a saturated condition, compared to 0.8 at present.
Another indicator shows that a home-based work trip (or a commuting trip) takes about 37 minutes by car on the average at present, while it will take more than 100 minutes by car in 2022 under the condition without any additional efforts other than the committed project. This means that given such a condition in the future, car commuters shall suffer from enormous time and economic losses.
ALTERNATIVE SCENARIO SETTING TO SEEK FOR AN OPTIMAL TRANSPORT NETWORK CREATS initially developed alternative infrastructure projects and/or programs by sub-sector which are assessed to be improved and newly developed, based on analyses and examinations about the current and future transport issues. These sub-sector improvement plans are integrated into several scenarios for an Integrated Master Plan, and were tested in terms of the economic efficiency, the complementary effects and the projected future transport demands.
Four (4) scenarios (Scenarios A, B, C and D) are composed of different project components as shown below. The structural concept of the scenario setting is as illustrated on Fig. 4.1. The scenarios were evaluated by using indices of the effects to the three basic visions, i.e. 1) Economically efficient urban transport system; 2) Equitable people’s mobility; and 3) Alleviation of environmental problems.
ALTERNATIVE SCENARIOS AND OPTIMAL TRANSPORT NETWORK (MODEL ANALYSES)
4
A HYPOTHETICAL
SCENARIO: COMMITTED NETWORK
ALTERNATIVE TRANSPORT NETWORK
SCENARIOS

CREATS: Phase I Final Report Vol. II: Urban Transport Policy and Strategy
15
Scenario A: This scenario is assumed to network with only committed projects in the road and public transport sectors, as discussed in the preceding section. This scenario represents a minimum investment scenario and implies “Do-Nothing” other than presently committed projects. The project components are summarized in Table 4.1.
Since it cannot be conceivable in practice that no additional transport projects will be implemented over the next two decades, this scenario is regarded as a hypothetical worst scenario. This also provides with a comparative evaluation standard to measure how much the other scenarios are effective to improve the worst situation.
Scenario B: This scenario is assumed to be the most ambitious transport network with all metro lines that were proposed by the Greater Cairo Public Transport Master Plan
(1998, Systra), plus several projects which are proposed by CREATS such as improvement of the Heliopolis Metro (Supertram), Satellites City Connections called “the East and West Wings”, priority bus service systems in association with re-structured shared-taxi service system for the public transport network.
Scenario D“Optimized Core Network”
CREATSUrban Transport Network Plan
Scenario A“Committed Network”
Evidence-based Transport Simulation Model
Scenario C“Core Network”
Public Transport (Rail) Plan
Scenario B“Do Maximum Network”
Road Plan Public Transport(Road) Plan
Initial Screening
Scenario D“Optimized Core Network”
CREATSUrban Transport Network Plan
Scenario A“Committed Network”
Evidence-based Transport Simulation Model
Scenario C“Core Network”
Public Transport (Rail) Plan
Scenario B“Do Maximum Network”
Road Plan Public Transport(Road) Plan
Road Plan Public Transport(Road) Plan
Initial Screening
Fig. 4.1 Structural Concept of Scenario Setting
THE CREATS MODEL FOR TRANSPORT SIMULATION
The CREATS Study Team developed a state-of-the-art transport demand forecast model, named the CREATS Model andthe GIS database. The CREATS model was built, based on a series of surveys conducted in the Study. Major surveysutilized for the model development were a Home Interview Survey (HIS), which covered the whole study area with about57,000 households interviewed, and traffic count surveys at cordon lines and screen lines. The CREATS Database,compiling all the transport and traffic data sets, is the most sophisticated, comprehensive and reliable, compared to theothers previously made.
The model structure is with a conventional four-step procedure, consisting of trip generation/attraction; trip distribution;modal split; and trip assignment. The trip generation model was developed by using category analyses by adoptingfour-trip purpose categories (Home Based Work, Home Based Education, Home Based Others and Non Home Based) andby five household income level categories. The gravity model was selected as the trip distribution model. Regarding themodal split, a binary logit model was selected to split private and public transport usage. The trip assignment consists oftwo parts: one is for vehicle trips and the other is for public transport passenger trips. The vehicle trips were assigned tothe road network according to equilibrium assignment, while the public transport passenger trips were assigned byminimum generalized cost procedure.
The CREATS model whose validity has been proven, is capable enough to make simulation analyses of traffic demandforecasts. The developed simulation model can demonstrate its full capacities for problem identification, examination ofeffects of proposed plans, generation of evaluation indices for Master Plan scenarios, calculation of necessary informationfor economic and financial analyses.
CREATS: Phase I Final Report Vol. II: Urban Transport Policy and Strategy
16
While, the road network includes a propose Urban Expressway Network with 92 km long in addition to the committed road improvement projects. These components are as tabulated in Table 4.2. This scenario represents a “Do-Maximum” scenario, eventually requiring a maximum amount of capital investments to materialize.
Table 4.2 Scenario B: “Do-Maximum” Network
Modes Projects Components
Road Network Committed Network + Improvements Urban Expressway Network (92 km)
Public Transport
MRT Committed Network (Scenario A); Metro Lines 4, 5 and 6 as proposed by the 1998 Greater Cairo Public Transport Master Plan (Systra); and Satellite City Corridors (The East and West Wings)
LRT Improved Heliopolis Metro (Supertram System)
Bus/Shared Taxi Optimized bus and shared taxi route structure coordinated with MRT/LRT
Notes: 1) Metro Lines 4,5 and 6 are identical to metro line alignments proposed by the 1998 Public Transport Master Plan (Systra)
2) Satellite city corridors (the East and West Wings) include both regional rail and priority bus strategies, with modal evolution dependant on actual demand.
Scenario C: This scenario is assumed to be a dummy scenario derived in the optimization process of the rail systems. Scenario B (Do-Maximum) is given no considerations of financial constraints and capacity limits of the project implementation that must, in reality, be critical factors. Therefore, some project components in the rail system public transport, which require a huge amount of capitals, are scaled-down, altered and/or cancelled depending upon estimated demands, while the road network is kept the same as Scenario B.
Scenario D: This scenario is an optimal amendment of Scenarios B and C, derived from a result of the optimization process, assessing demand volumes simulated by a model analysis of Scenarios B and C, in consideration of practical difficulties in and financial constrains against the implementation during the next two decades. Thus, this scenario is recognized as an Optimized Scenario, consisting of several proposals such as: 1) Metro Line 4; 2) Line 2 extension; 3) Satellite Cities Connections (the Wings); 4) Supertram Systems which are to be upgraded the existing Heliopolis Metro; and 5) Optimized bus route network with operational and intermodal coordination with Shared-taxi and the Metro System; and 6) Urban Expressway Network, as tabulated Table 4.3. It should be noted that a newly proposed MRT line is newly named “Metro Line 4”, of which the alignment is different form that of Line 4 proposed by the 1998 Public Transport Master Plan (Systra). For the road network, the Urban Expressway Network System has a total length of 78 km, instead of 92 km in Scenario B, being altered based on an assessment of the simulated traffic volumes.
CREATS: Phase I Final Report Vol. II: Urban Transport Policy and Strategy
17
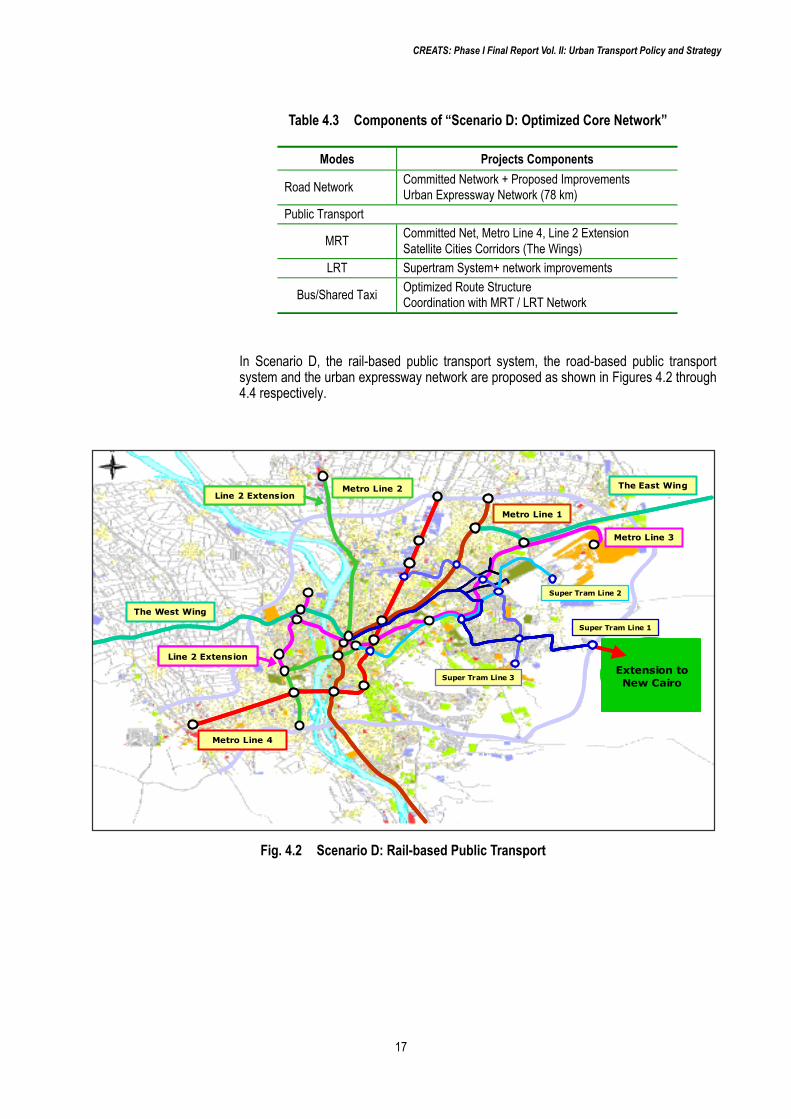
Table 4.3 Components of “Scenario D: Optimized Core Network”
In Scenario D, the rail-based public transport system, the road-based public transport system and the urban expressway network are proposed as shown in Figures 4.2 through 4.4 respectively.
Modes Projects Components
Road Network Committed Network + Proposed Improvements Urban Expressway Network (78 km)
Public Transport
MRT Committed Net, Metro Line 4, Line 2 Extension Satellite Cities Corridors (The Wings)
LRT Supertram System+ network improvements
Bus/Shared Taxi Optimized Route Structure Coordination with MRT / LRT Network
Fig. 4.2 Scenario D: Rail-based Public Transport
Metro Line 1
Metro Line 2
Metro Line 3
Metro Line 4
The East Wing
The West Wing
Super Tram Line 2
Super Tram Line 1
Super Tram Line 3Extension toNew Cairo
Extension toNew Cairo
Line 2 ExtensionLine 2 Extension
Line 2 ExtensionLine 2 Extension
CREATS: Phase I Final Report Vol. II: Urban Transport Policy and Strategy
18
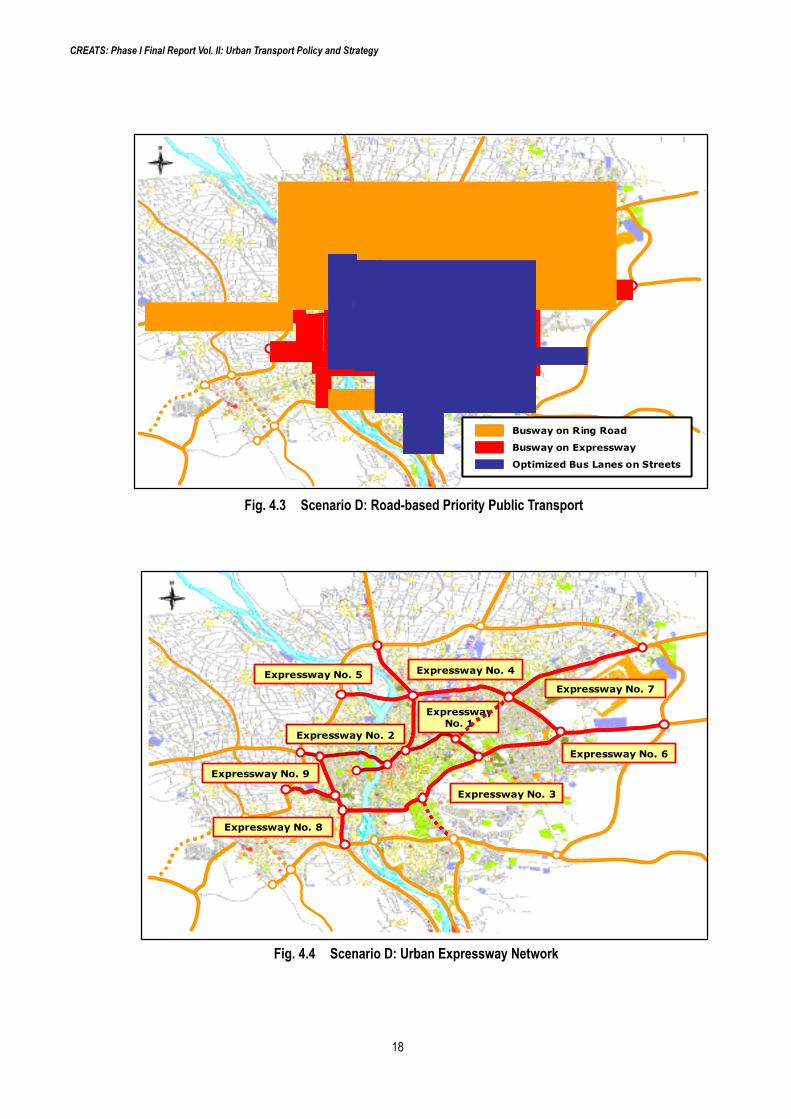
Fig. 4.3 Scenario D: Road-based Priority Public Transport
Busway on Ring Road
Busway on Expressway
Optimized Bus Lanes on Streets
Busway on Ring Road
Busway on Expressway
Optimized Bus Lanes on Streets
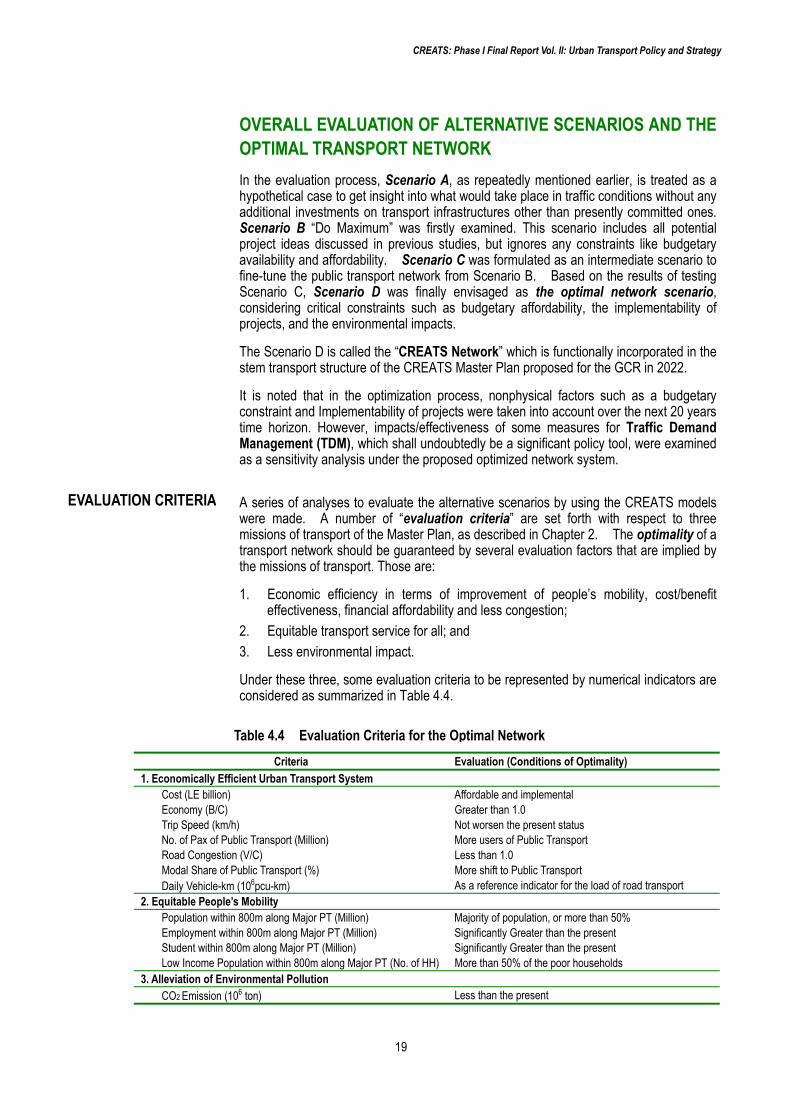
Fig. 4.4 Scenario D: Urban Expressway Network
ExpresswayNo. 1
Expressway No. 2
Expressway No. 3
Expressway No. 4Expressway No. 5
Expressway No. 6
Expressway No. 7
Expressway No. 8
Expressway No. 9
CREATS: Phase I Final Report Vol. II: Urban Transport Policy and Strategy
19
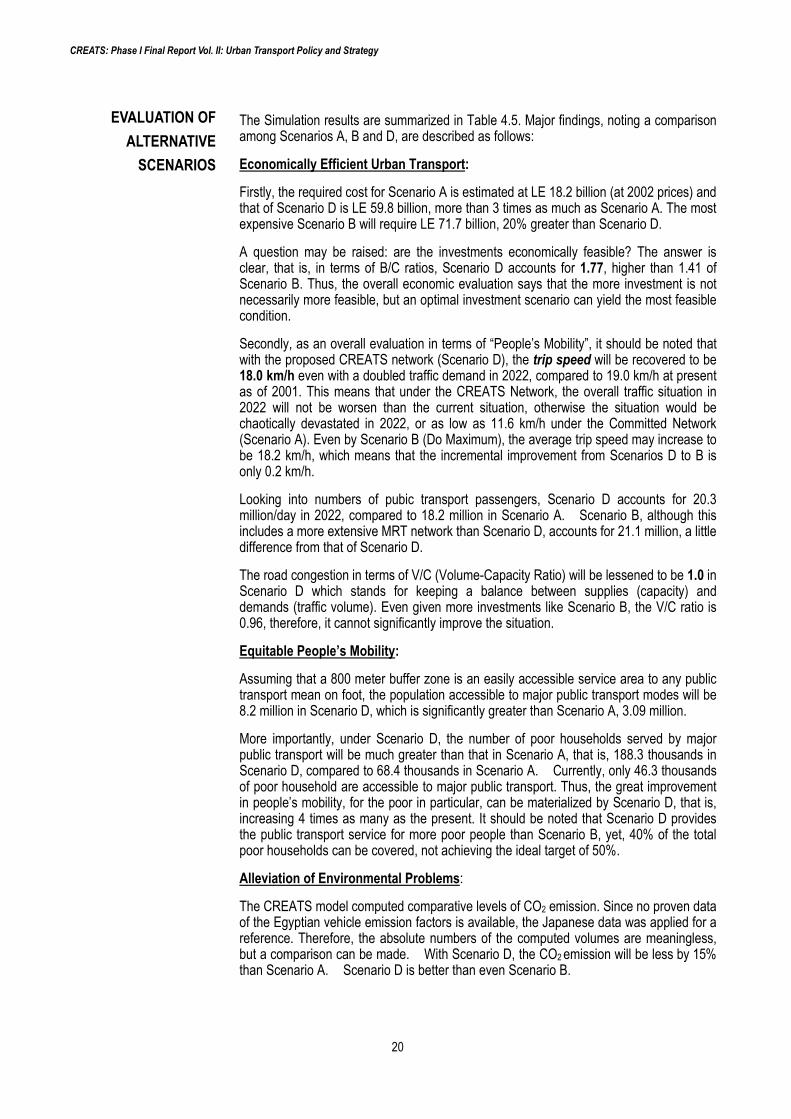
OVERALL EVALUATION OF ALTERNATIVE SCENARIOS AND THE OPTIMAL TRANSPORT NETWORK In the evaluation process, Scenario A, as repeatedly mentioned earlier, is treated as a hypothetical case to get insight into what would take place in traffic conditions without any additional investments on transport infrastructures other than presently committed ones. Scenario B “Do Maximum” was firstly examined. This scenario includes all potential project ideas discussed in previous studies, but ignores any constraints like budgetary availability and affordability. Scenario C was formulated as an intermediate scenario to fine-tune the public transport network from Scenario B. Based on the results of testing Scenario C, Scenario D was finally envisaged as the optimal network scenario, considering critical constraints such as budgetary affordability, the implementability of projects, and the environmental impacts.
The Scenario D is called the “CREATS Network” which is functionally incorporated in the stem transport structure of the CREATS Master Plan proposed for the GCR in 2022.
It is noted that in the optimization process, nonphysical factors such as a budgetary constraint and Implementability of projects were taken into account over the next 20 years time horizon. However, impacts/effectiveness of some measures for Traffic Demand Management (TDM), which shall undoubtedly be a significant policy tool, were examined as a sensitivity analysis under the proposed optimized network system.
A series of analyses to evaluate the alternative scenarios by using the CREATS models were made. A number of “evaluation criteria” are set forth with respect to three missions of transport of the Master Plan, as described in Chapter 2. The optimality of a transport network should be guaranteed by several evaluation factors that are implied by the missions of transport. Those are:
1. Economic efficiency in terms of improvement of people’s mobility, cost/benefit effectiveness, financial affordability and less congestion;
2. Equitable transport service for all; and 3. Less environmental impact.
Under these three, some evaluation criteria to be represented by numerical indicators are considered as summarized in Table 4.4.
Criteria Evaluation (Conditions of Optimality) 1. Economically Efficient Urban Transport System
Cost (LE billion) Affordable and implemental Economy (B/C) Greater than 1.0 Trip Speed (km/h) Not worsen the present status No. of Pax of Public Transport (Million) More users of Public Transport Road Congestion (V/C) Less than 1.0 Modal Share of Public Transport (%) More shift to Public Transport Daily Vehicle-km (106pcu-km) As a reference indicator for the load of road transport
2. Equitable People’s Mobility Population within 800m along Major PT (Million) Majority of population, or more than 50% Employment within 800m along Major PT (Million) Significantly Greater than the present Student within 800m along Major PT (Million) Significantly Greater than the present Low Income Population within 800m along Major PT (No. of HH) More than 50% of the poor households
3. Alleviation of Environmental Pollution CO2 Emission (106 ton) Less than the present
EVALUATION CRITERIA
Table 4.4 Evaluation Criteria for the Optimal Network
CREATS: Phase I Final Report Vol. II: Urban Transport Policy and Strategy
20
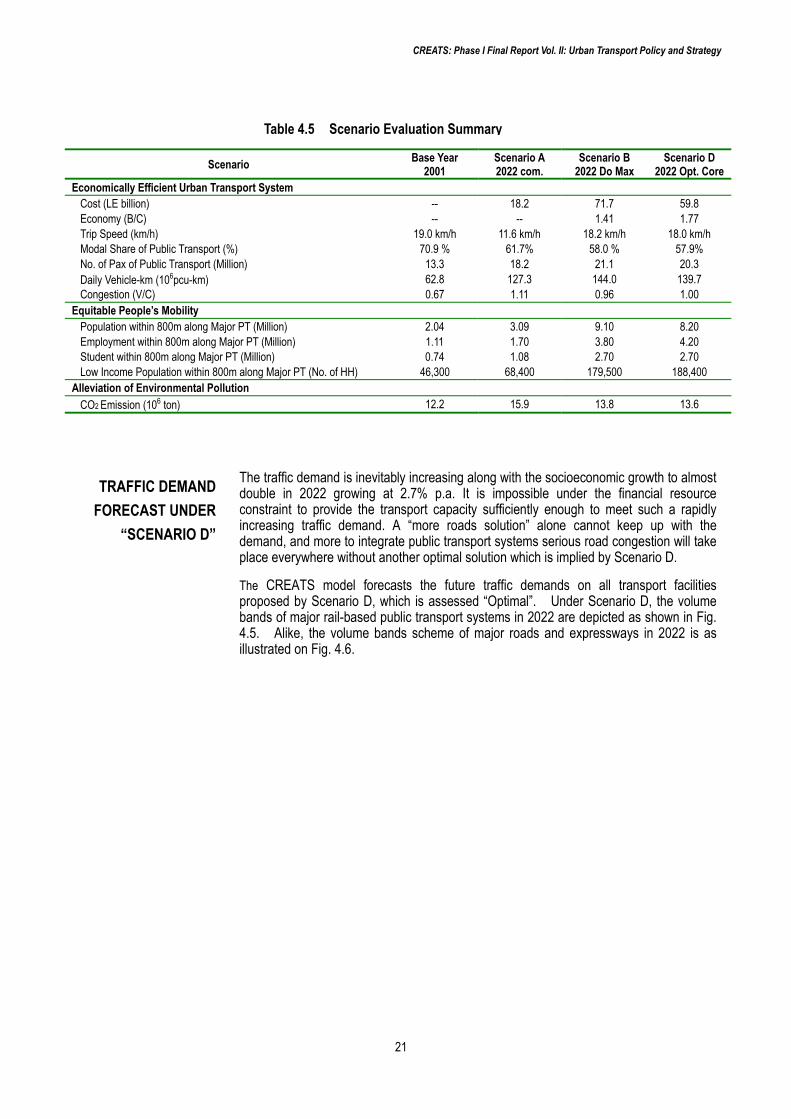
The Simulation results are summarized in Table 4.5. Major findings, noting a comparison among Scenarios A, B and D, are described as follows:
Economically Efficient Urban Transport:
Firstly, the required cost for Scenario A is estimated at LE 18.2 billion (at 2002 prices) and that of Scenario D is LE 59.8 billion, more than 3 times as much as Scenario A. The most expensive Scenario B will require LE 71.7 billion, 20% greater than Scenario D.
A question may be raised: are the investments economically feasible? The answer is clear, that is, in terms of B/C ratios, Scenario D accounts for 1.77, higher than 1.41 of Scenario B. Thus, the overall economic evaluation says that the more investment is not necessarily more feasible, but an optimal investment scenario can yield the most feasible condition.
Secondly, as an overall evaluation in terms of “People’s Mobility”, it should be noted that with the proposed CREATS network (Scenario D), the trip speed will be recovered to be 18.0 km/h even with a doubled traffic demand in 2022, compared to 19.0 km/h at present as of 2001. This means that under the CREATS Network, the overall traffic situation in 2022 will not be worsen than the current situation, otherwise the situation would be chaotically devastated in 2022, or as low as 11.6 km/h under the Committed Network (Scenario A). Even by Scenario B (Do Maximum), the average trip speed may increase to be 18.2 km/h, which means that the incremental improvement from Scenarios D to B is only 0.2 km/h.
Looking into numbers of pubic transport passengers, Scenario D accounts for 20.3 million/day in 2022, compared to 18.2 million in Scenario A. Scenario B, although this includes a more extensive MRT network than Scenario D, accounts for 21.1 million, a little difference from that of Scenario D.
The road congestion in terms of V/C (Volume-Capacity Ratio) will be lessened to be 1.0 in Scenario D which stands for keeping a balance between supplies (capacity) and demands (traffic volume). Even given more investments like Scenario B, the V/C ratio is 0.96, therefore, it cannot significantly improve the situation.
Equitable People’s Mobility:
Assuming that a 800 meter buffer zone is an easily accessible service area to any public transport mean on foot, the population accessible to major public transport modes will be 8.2 million in Scenario D, which is significantly greater than Scenario A, 3.09 million.
More importantly, under Scenario D, the number of poor households served by major public transport will be much greater than that in Scenario A, that is, 188.3 thousands in Scenario D, compared to 68.4 thousands in Scenario A. Currently, only 46.3 thousands of poor household are accessible to major public transport. Thus, the great improvement in people’s mobility, for the poor in particular, can be materialized by Scenario D, that is, increasing 4 times as many as the present. It should be noted that Scenario D provides the public transport service for more poor people than Scenario B, yet, 40% of the total poor households can be covered, not achieving the ideal target of 50%.
Alleviation of Environmental Problems:
The CREATS model computed comparative levels of CO2 emission. Since no proven data of the Egyptian vehicle emission factors is available, the Japanese data was applied for a reference. Therefore, the absolute numbers of the computed volumes are meaningless, but a comparison can be made. With Scenario D, the CO2 emission will be less by 15% than Scenario A. Scenario D is better than even Scenario B.
EVALUATION OF ALTERNATIVE
SCENARIOS
CREATS: Phase I Final Report Vol. II: Urban Transport Policy and Strategy
21
The traffic demand is inevitably increasing along with the socioeconomic growth to almost double in 2022 growing at 2.7% p.a. It is impossible under the financial resource constraint to provide the transport capacity sufficiently enough to meet such a rapidly increasing traffic demand. A “more roads solution” alone cannot keep up with the demand, and more to integrate public transport systems serious road congestion will take place everywhere without another optimal solution which is implied by Scenario D.
The CREATS model forecasts the future traffic demands on all transport facilities proposed by Scenario D, which is assessed “Optimal”. Under Scenario D, the volume bands of major rail-based public transport systems in 2022 are depicted as shown in Fig. 4.5. Alike, the volume bands scheme of major roads and expressways in 2022 is as illustrated on Fig. 4.6.
Scenario Base Year 2001
Scenario A 2022 com.
Scenario B 2022 Do Max
Scenario D 2022 Opt. Core
Economically Efficient Urban Transport System Cost (LE billion) -- 18.2 71.7 59.8 Economy (B/C) -- -- 1.41 1.77 Trip Speed (km/h) 19.0 km/h 11.6 km/h 18.2 km/h 18.0 km/h Modal Share of Public Transport (%) 70.9 % 61.7% 58.0 % 57.9% No. of Pax of Public Transport (Million) 13.3 18.2 21.1 20.3 Daily Vehicle-km (106pcu-km) 62.8 127.3 144.0 139.7 Congestion (V/C) 0.67 1.11 0.96 1.00
Equitable People’s Mobility Population within 800m along Major PT (Million) 2.04 3.09 9.10 8.20 Employment within 800m along Major PT (Million) 1.11 1.70 3.80 4.20 Student within 800m along Major PT (Million) 0.74 1.08 2.70 2.70 Low Income Population within 800m along Major PT (No. of HH) 46,300 68,400 179,500 188,400
Alleviation of Environmental Pollution CO2 Emission (106 ton) 12.2 15.9 13.8 13.6
Table 4.5 Scenario Evaluation Summary
TRAFFIC DEMAND FORECAST UNDER
“SCENARIO D”

CREATS: Phase I Final Report Vol. II: Urban Transport Policy and Strategy
22
202,000 pcu/day
338,000 pcu/day
131,000 pcu/day
276,000 pcu/day
202,000 pcu/day
338,000 pcu/day
131,000 pcu/day
276,000 pcu/day
Toll Level (2022)
LE5.00 (Flat Toll)
Fig. 4.6 Traffic Demand Estimates of Major Roads/Highways in 2022 (Scenario D)
100,000
Fig. 4.5 Traffic Demands of Major Public Transport Systems in 2022 (Scenario D)
(Highest Daily Sectional Volume on Each Line)
Line 3472,000
pass./day/dir.
West Wing205,000
pass./day/dir.
Line 4354,000
pass./day/dir.
Line 1575,000
pass./day/dir.
East Wing183,000
pass./day/dir.
Line 2509,000
pass./day/dir.
Line 3472,000
pass./day/dir.
West Wing205,000
pass./day/dir.
Line 4354,000
pass./day/dir.
Line 1575,000
pass./day/dir.
East Wing183,000
pass./day/dir.
Line 2509,000
pass./day/dir.
500,000
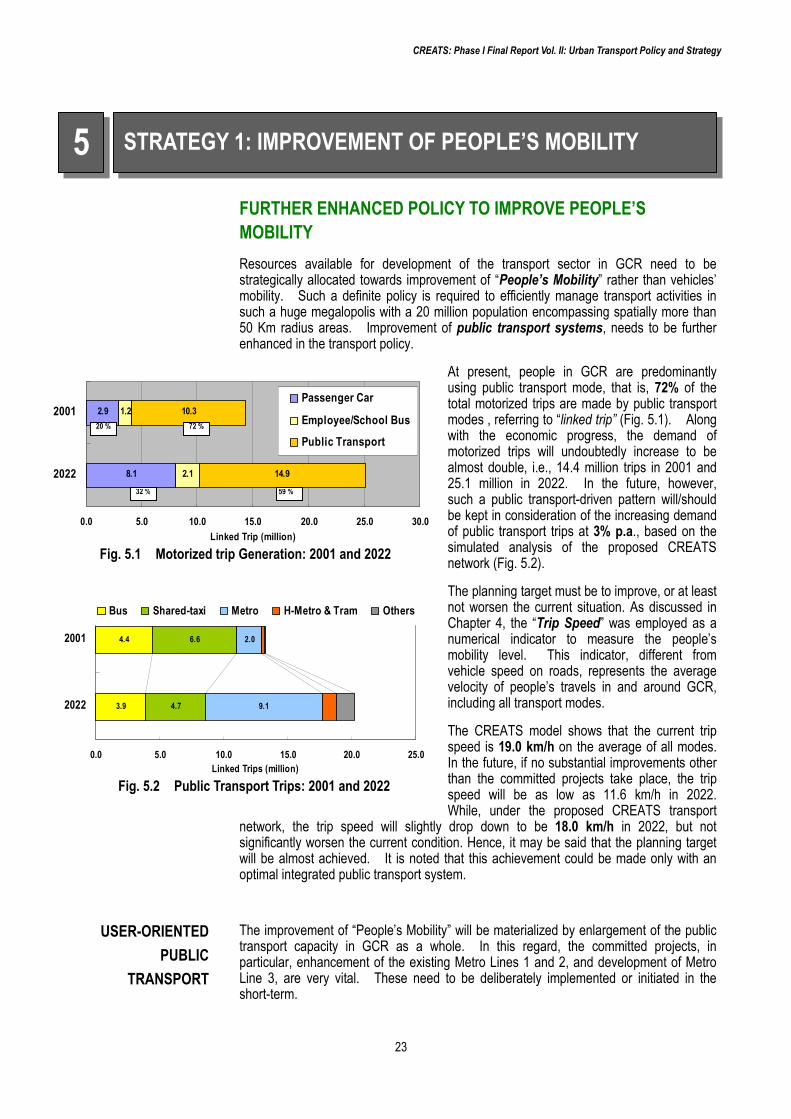
CREATS: Phase I Final Report Vol. II: Urban Transport Policy and Strategy
23
FURTHER ENHANCED POLICY TO IMPROVE PEOPLE’S MOBILITY Resources available for development of the transport sector in GCR need to be strategically allocated towards improvement of “People’s Mobility” rather than vehicles’ mobility. Such a definite policy is required to efficiently manage transport activities in such a huge megalopolis with a 20 million population encompassing spatially more than 50 Km radius areas. Improvement of public transport systems, needs to be further enhanced in the transport policy.
At present, people in GCR are predominantly using public transport mode, that is, 72% of the total motorized trips are made by public transport modes , referring to “linked trip” (Fig. 5.1). Along with the economic progress, the demand of motorized trips will undoubtedly increase to be almost double, i.e., 14.4 million trips in 2001 and 25.1 million in 2022. In the future, however, such a public transport-driven pattern will/should be kept in consideration of the increasing demand of public transport trips at 3% p.a., based on the simulated analysis of the proposed CREATS network (Fig. 5.2).
The planning target must be to improve, or at least not worsen the current situation. As discussed in Chapter 4, the “Trip Speed” was employed as a numerical indicator to measure the people’s mobility level. This indicator, different from vehicle speed on roads, represents the average velocity of people’s travels in and around GCR, including all transport modes.
The CREATS model shows that the current trip speed is 19.0 km/h on the average of all modes. In the future, if no substantial improvements other than the committed projects take place, the trip speed will be as low as 11.6 km/h in 2022. While, under the proposed CREATS transport
network, the trip speed will slightly drop down to be 18.0 km/h in 2022, but not significantly worsen the current condition. Hence, it may be said that the planning target will be almost achieved. It is noted that this achievement could be made only with an optimal integrated public transport system.
The improvement of “People’s Mobility” will be materialized by enlargement of the public transport capacity in GCR as a whole. In this regard, the committed projects, in particular, enhancement of the existing Metro Lines 1 and 2, and development of Metro Line 3, are very vital. These need to be deliberately implemented or initiated in the short-term.
STRATEGY 1: IMPROVEMENT OF PEOPLE’S MOBILITY 5
USER-ORIENTED PUBLIC
TRANSPORT
8.1
2.9
2.1 14.9
10.31.2
0.0 5.0 10.0 15.0 20.0 25.0 30.0
2022
2001
Linked Trip (million)
Passenger Car
Employee/School Bus
Public Transport72 %
59 %
20 %
32 %
Fig. 5.1 Motorized trip Generation: 2001 and 2022
3.9
4.4
4.7
6.6
9.1
2.0
0.0 5.0 10.0 15.0 20.0 25.0
2022
2001
Linked Trips (million)
Bus Shared-taxi Metro H-Metro & Tram Others
Fig. 5.2 Public Transport Trips: 2001 and 2022
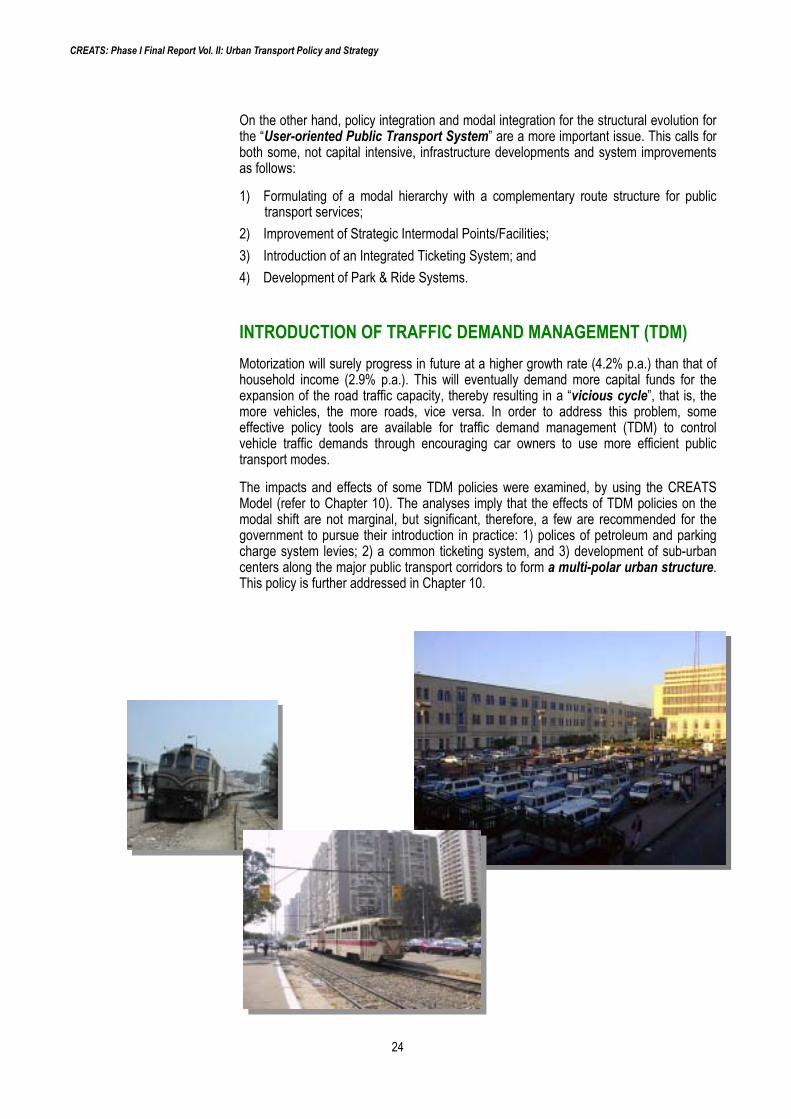
CREATS: Phase I Final Report Vol. II: Urban Transport Policy and Strategy
24
On the other hand, policy integration and modal integration for the structural evolution for the “User-oriented Public Transport System” are a more important issue. This calls for both some, not capital intensive, infrastructure developments and system improvements as follows:
1) Formulating of a modal hierarchy with a complementary route structure for public transport services;
2) Improvement of Strategic Intermodal Points/Facilities; 3) Introduction of an Integrated Ticketing System; and 4) Development of Park & Ride Systems.
INTRODUCTION OF TRAFFIC DEMAND MANAGEMENT (TDM) Motorization will surely progress in future at a higher growth rate (4.2% p.a.) than that of household income (2.9% p.a.). This will eventually demand more capital funds for the expansion of the road traffic capacity, thereby resulting in a “vicious cycle”, that is, the more vehicles, the more roads, vice versa. In order to address this problem, some effective policy tools are available for traffic demand management (TDM) to control vehicle traffic demands through encouraging car owners to use more efficient public transport modes.
The impacts and effects of some TDM policies were examined, by using the CREATS Model (refer to Chapter 10). The analyses imply that the effects of TDM policies on the modal shift are not marginal, but significant, therefore, a few are recommended for the government to pursue their introduction in practice: 1) polices of petroleum and parking charge system levies; 2) a common ticketing system, and 3) development of sub-urban centers along the major public transport corridors to form a multi-polar urban structure. This policy is further addressed in Chapter 10.


![Semana 3 HDM 2016 HDM en El Perú (1) [Recuperado]](https://img.dokumen.tips/doc/110x75/577c77af1a28abe0548d1a4f/semana-3-hdm-2016-hdm-en-el-peru-1-recuperado.jpg)