Embed Size (px)
Citation preview

TRANSPARENCY IN
MONITORING&EVALUATION OF
CONSTRUCTION PROJECTS
MASTER’S THESIS 4TH SEMESTER
MANAGEMENT IN THE BUILDING INDUSTRY
(MSc)
IRIS ENGHIS
1/6/2016
STUDENT PROJECT

TITLE SHEET
TITLE:
Transparency in Monitoring
and Evaluation of
construction projects
TOPIC:
Construction Management
PROJECT:
Autumn 2015
STUDENT NO:
20140382
STUDENT:
Iris Enghis
SUPERVISOR:
Arne P. Rasmussen
REPORT CONTENT:
90 pages
APPENDIX CONTENT:
27 pages
DELIVERY DATE:
6th
of January 2016
Synopsis
The research conducted by student: Iris
Enghis enrolled in the Master Programme in
Management of Building Industry at Aalborg
University; aims to understand how
subsidised projects are monitored and
evaluated in order to provide a transparent
process for the client and comply with the
quality demands.
The beginning of the report is presented in
context of Monitoring and Evaluation (M&E),
to offer the reader an overview and
comprehension within the subject.
Further analysis are made according to the
building case study “Støvring Bytorv” and
tools within Result Based Monitoring and
Evaluation (RBME) are applied to find out the
core problem of this research such as: What
are the factors impending quality?
Quality is achieved through an elaborated
M&E plan described in Implementation
Chapter. Furthermore, Byggeriets Evaluering
Center (BEC) provides the benchmark system
to enable a transparent process for the client
and evaluation of projects in terms of quality
and efficiency.

ABSTRACT
Management in the construction sector looks continuously on how industry practices can be
improved. New philosophies emerge constantly and in contrast to traditional methods, new modern
approaches take place. Result Based Management (RBM) is one of them, focusing on achieving
results and improving performance within construction projects.
Project Managers are encouraged to pay more attention to Monitoring and Evaluation (M&E)
system as an important part of the project process. For successful construction projects M&E is
essential, in order to track progress and detect failure or defects. Even with minor defects, re
construction may be required resulting in increased costs and delays, compromising quality of the
work performed. Therefore M&E should be done in all phases of the project cycle to minimize
failures and reduce costs.
Before implementation, projects must be carefully planned. Through planning, a number of
analyses are required to find out stakeholder’s interests, problem and objective analysis and the
appropriate strategy for the project in cause. The aim of the analysis is to find out what are the
objectives the project should achieve.
Byggeriets Evaluerings Center (BEC) is an organisation established in Denmark and through the
Construction Rating system the aim is to provide quality and efficiency during project process.
There are specific obligations of the contractor and advisor to comply with certain Key Performance
Indicators (KPI) in order to ensure a transparent qualitative process for the client. The quality of the
project will be measured and evaluated in terms of relevance, feasibility and effectiveness in
achieving its results.
Acronyms
RBM - Result Based Management
M&E - Monitoring and Evaluation
RBME - Result Based Monitoring and Evaluation
KPI - Key Performance Indicators
BEC - Byggeriets Evaluerings Cente

PREFACE
The report is conducted by Iris Enghis student of Aalborg University enrolled in Management of the
Building Industry program (MSc). The project was written during September 2015 until January
2016.
This research has a theoretical approach placing a great emphasis on managerial methodologies.
There was used methodologies such as Theory of change, Result Based Management, Project Cycle
Management, Traditional Monitoring and Evaluation and tools such Logical Framework, Result
Chains or the Result Based Monitoring and Evaluation Cycle. These have been deeply investigated
as part of a learning process and applicability to the Case Study. The student has collaborated with
Kuben Management and the information was provided in relation to the Case Study: Støvring
Bytorv and the company Kuben Management. The information was used for descriptions and
analysis.
There has been elaborated a result chain for this specific project in order to show which are the
objectives that are monitored and evaluated throughout the project life cycle. The objectives, long,
medium and short have been approved by the project manager Michael Gabba from Kuben
Management. See Appendix 1. “Objectives Approval”.
Regarding monitoring of activities, explanations of procedures and key performance indicators are
given according to Byggeriets Evaluerings Center. Additionally, a Monitoring and Evaluation Plan
guidelines are suggested on how project managers should collect, track and document their work.
Moreover, standard templates by Byggeriets Evaluering Center are provided as extra information to
show how is done practically in Appendix 6.
The procedures provided by Byggeriets Evaluerings Center and the guidelines in M&E plan, should
offer sufficient documentation to provide a transparent process for the client.
Other remarks during the writing of this research refer to collaboration with the two project
managers of the project, namely the client advisor and contractor. Communication can be different
between shareholders and external parties due to different construction language and terms.
Many thanks to Arne P.Rassmunsen, Michael Gabba, Christian Hannesbo and Theis Nørlem for
participation, support and knowledge share to conduct this research.
The report consists of three parts – Main report, Appendix and Annex. All the additional
information provided to support the given statements and results in the Main report can be found in
the Appendix and Annex.

TABLE OF CONTENTS
STUDENT PROJECT ..................................................................................................................... 1
ABSTRACT ......................................................................................................................................... 2
PREFACE ............................................................................................................................................ 3
1. REPORT INTRODUCTION ................................................................................................ 1
1.1. LITERATURE REVIEW ...................................................................................................... 2
1.2. COLLABORATION ............................................................................................................. 3
1.3. RESEARCH METHODOLOGY .......................................................................................... 4
2. INTRODUCTION MONITORING AND EVALUATION (M&E)..................................... 6
2.1. WHAT IS MONITORING .................................................................................................... 6
2.2. WHAT IS EVALUATION ................................................................................................... 8
2.3. CHALLENGES TO M&E SYSTEM ................................................................................. 10
2.4. ADVANTAGES OF M&E SYSTEMS .............................................................................. 10
3. COMPANY BACKGROUND AND DESCRIPTION ....................................................... 12
3.1. KUBEN MANAGEMENT – COMPANY DESCRIPTION .............................................. 12
3.2. KUBEN MANAGEMENT HISTORY .............................................................................. 12
3.3. COMPANY ORGANISATION .......................................................................................... 13
3.4. VISION MISSION AND STRATEGY .............................................................................. 15
3.5. KUBEN MANAGEMENT ECONOMY ............................................................................ 15
3.6. SWOT ANALYSIS FOR KUBEN MANAGEMENT ....................................................... 16
3.7. PROJECTS .......................................................................................................................... 17
3.8. CASE STUDY: STØVRING BYTORV ............................................................................ 18
3.9. PROJECT DESCRIPTION ................................................................................................ 18
3.10. CONTRACT FORM ........................................................................................................... 19
3.11. CLIENT SPECIFICATIONS AND CONTIDITONS TO TOTAL CONTRACTOR ........ 20
3.12. QUALITY MANAGEMENT ............................................................................................. 22
3.13. EVALUATION ................................................................................................................... 24
3.14. OTHER SPECIFICATIONS RELATED TO THE PROJECT ........................................... 24
3.15. PROJET SUMMARY ........................................................................................................ 25

4. PROBLEM STATEMENT ................................................................................................. 26
5. METHODS AND ANALYSIS ........................................................................................... 26
5.1. PROJECT CYCLE MANAGEMENT (PCM) .................................................................... 27
5.2. RBM OR TRADITIONAL M&E? ..................................................................................... 30
5.3. RESOURCE BASED MANAGEMENT (RBM)................................................................ 30
5.4. RESULT BASED MONITORING AND EVALUATION (RBME) ................................. 33
5.5. APPLICATION OF RBME CYCLE .................................................................................. 37
5.5.1. STAGE 1 PROGRAMMING- SETTING THE CONTEXT FOR MONITORING AND
EVALUATION .................................................................................................................................. 37
5.5.2. STAGE 2 IDENTIFICATION ON SOLVING PROBLEMS ............................................. 38
5.5.2.1. THEORY OF CHANGE (TOC) AND LOGICAL FRAMEWORK APPROACH (LFA). 40
5.5.2.2. LOGICAL FRAMEWORK APPROACH (LOGFRAME) (LFA) ..................................... 42
5.5.2.3. STAKEHOLDER ANALYSIS ........................................................................................... 44
5.5.2.4. PROBLEM ANALYSIS ..................................................................................................... 45
5.5.2.5. OBJECTIVE ANALYSIS ................................................................................................... 48
5.5.3. STAGE 3 FORMULATION ............................................................................................... 50
5.5.3.1. LFA MATRIX (LOGFRAME) ........................................................................................... 51
5.5.3.2. STEPS IN CREATING INTERVENTION LOGIC ........................................................... 52
5.5.3.3. FORMULATING OBJECTIVES ....................................................................................... 53
5.5.3.4. FORMULATING ASSUMPTIONS ................................................................................... 55
5.5.3.5. FORMULATING INDICATORS ....................................................................................... 56
5.5.3.6. SOURCES OF VERIFICATION (SOV) ............................................................................ 57
5.5.3.7. ACTIVITY SCHEDULE .................................................................................................... 57
5.5.3.8. LFA MATRIX ..................................................................................................................... 57
5.5.4. STAGE 4 APPRAISALS .................................................................................................... 58
5.5.5. STAGE 5 IMPLEMENTATION, INCL. MONITORING AND REPORTING ................ 59
6. IMPLEMENTATION ......................................................................................................... 60
6.1. DEVELOPING THE M&E PLAN ..................................................................................... 61
6.1.1. PURPOSE AND SCOPE OF M&E PLAN ......................................................................... 62
6.1.1.1. REVIEW THE PROJECT OPERATIONAL DESIGN (LOGFRAME) ............................ 62
6.1.1.2. IDENTIFY KEY STAKEHOLDERS INFORMATIONAL NEEDS AND
EXPECTATIONS .............................................................................................................................. 63

6.1.1.3. IDENTIFY ANY M&E REQUIREMENTS ....................................................................... 63
6.1.1.4. SCOPE OF MAJOR M&E EVENTS AND FUNCTIONS ................................................ 63
6.1.2. PLANNING INFORMATION GATHERING AND ORGANISATION .......................... 64
6.1.2.1. DEVELOP AN M&E PLAN TABLE ................................................................................ 64
6.1.2.2. ASSESS THE AVAILABILITY OF SECONDARY DATA ............................................. 65
6.1.2.3. DETERMINE THE BALANCE OF QUANTITATIVE AND QUALITATIVE DATA ... 65
6.1.2.4. TRIANGULATE DATA COLLECTION SOURCES AND METHODS.......................... 65
6.1.2.5. DETERMINE SAMPLING REQUIREMENTS ................................................................ 65
6.1.2.6. PREPARE FOR SURVEYS ............................................................................................... 65
6.1.2.7. PREPARE FOR SPECIFIC DATA COLLECTION METHODS/TOOLS ........................ 66
6.1.2.8. ESTABLISH STAKEHOLDER COMPLAINT AND FEEDBACK SYSTEM ............... 66
6.1.2.9. ESTABLISH PROJECT REVIEW MECHANISM............................................................ 66
6.1.3. PLAN FOR DATA MANAGEMENT ................................................................................ 67
6.1.3.1. USE AN INDICATOR TRACKING TABLE .................................................................... 67
6.1.3.2. USE A RISK LOG TABLE ................................................................................................ 68
6.1.3 PLANNING CRITICAL PROCESS AND DATA ANALYSIS ........................................ 68
6.1.4. PLANNING FOR NECESSARY CONDITIONS AND CAPACITY ............................... 71
6.1.5 PLANNING FOR COMMUNICATION AND REPORTING M&E FINDINGS ............. 73
6.1.6 PREPARE M&E BUDGET ................................................................................................ 75
6.3 STAGE 6 EVALUATIONS AND AUDIT ......................................................................... 77
6.3.1 BYGGERIETS EVALUERINGS CENTERS FOND (BENCHMARK CENTRE FOR
DANISH CONSTRUCTION SECTOR) ........................................................................................... 82
6.3.1.1 CONSTRUCTION RATING .............................................................................................. 82
6.3.1.2 PROCESS EVALUATION (INTERIM EVALUATION) ................................................. 84
6.3.1.3 AJOUR SYSTEM A/S ........................................................................................................ 85
6.3.1.4 AUDIT REPORTS .............................................................................................................. 86
6.3.1.5 DISCUSSION ..................................................................................................................... 87
6.3.1.6 CONCLUSION ................................................................................................................... 88
BIBLIOGRAPHY .............................................................................................................................. 89
LIST OF FIGURES ........................................................................................................................... 92
LIST OF TABLES ............................................................................................................................. 93

MASTER THESIS IRIS ENGHIS
4TH
SEM. MANAGEMENT IN THE BUILDING INDUSTRY (MSC)
1 AAU- Sofiendalsvej 11 9000 Aalborg
Autumn 2015
1. REPORT INTRODUCTION
Report introduction presents for the reader why Monitoring and Evaluation is important in the
Construction Industry and which are the research objectives that this paperwork strives to answer.
Moreover a literature review is presented to prove the reliability of information collected and how
collaboration was undertaken in conducting this research. Scientific research methodologies have
been used to further analyze data and come up with a conclusion at the end of this paperwork.
There is a great demand in construction projects to provide a good performance feedback system.
Stakeholders are interested nowadays in better performance and progress monitoring, to be one of
the most important tasks in construction management. For successful construction projects, there
needs to be made assessment how goals are achieved over time. There has been a continuous
development in this subject, starting from Strategic planning - by identifying clear and measurable
objectives, selecting indicators and setting targets, then Performance measurement by adding
performance monitoring systems, reviewing, analyzing and reporting actual results and lastly,
Results based performance management has evolved, where evaluation findings were introduced to
provide complementary information and using performance indicators for accountability, learning,
resource allocation, decision making and reporting to stakeholders.
Result Based Monitoring and Evaluation (RBME) is a powerful approach through which progress
can be tracked for decision making and impacts can be demonstrated. The focus is on impact and
outcome, rather than on activities and inputs. This is due to the fact that stakeholders demands are
on project results, as previously mentioned their interest in better performance. There has been a
growing recognition for investment in Monitoring and Evaluation (M&E), because at first it was
lacking established indicators and links between inputs and outcomes. Moreover, the attention has
been directed towards client surveys and governments have invested increasingly in IT platforms to
support Result Based Management (RBM).
Monitoring and Evaluation has become an executive order in Denmark construction industry since
11th of April 2008, which means builders are obliged now to participate in the collection and
evaluation of data within project design and implementation.
This research is looking at key figures for advisors and contractors, as demands are different.
Advisors key figures are based more on the systematic customer satisfaction survey and for
contractors key figures are based more on factual measurements. The client can now select advisors
and contractors based on their performance from previous projects. The research objectives of this
paperwork are to find out how transparency is enhanced in Monitoring and Evaluation of
Construction Projects to make sure quality is delivered as agreed by the client, using a particular
case study: Støvring Bytorv. The principle of transparency understands construction process as
transforming inputs into outputs by enabling better communication and evidence of project process.
It is also important to differentiate how procedures within M&E are different for advisor’s client
and for the total contractor employed by the client. The Project chose for this investigation is a
public subsidy by municipality and the client is a housing association agency.

MASTER THESIS IRIS ENGHIS
4TH
SEM. MANAGEMENT IN THE BUILDING INDUSTRY (MSC)
2 AAU- Sofiendalsvej 11 9000 Aalborg
Autumn 2015
1.1. LITERATURE REVIEW
Within this research there has been used academic and relevant references regarding Monitoring
and Evaluation methodology. This includes Monitoring and Evaluation guides and manuals and
other relevant documents certified by organizations such as: DPCD (Department of Planning and
Community Development) IFRC (International Federation of Red Cross) IDRC (International
Development Research Centre, European Commission Civil Fund, BEC (Byggeriets Evaluerings
Center) DCED (Donor Committer for Enterprise Development) Byggerreraadgivning and UNDG
(United Nations Development Group).
The IDRC M&E Manual interlinks PCM (project cycle management) with LFA (logical framework
approach). “Implementation Guidelines to articulate Result chains” by DCED has been used to link
LFA with RBM to further investigate how projects can monitor progress towards objectives, to
better measure, manage and demonstrate results, which part of RBM philosophy. In addition, the
IFRC Guide starts by explaining Result Based Management as an overall concept that contains
Monitoring and Evaluation. RBM is adding to PCM monitoring the quality aspect of service
delivery, by explaining the actual results versus planned ones. RBM can be seen as a whole system
that is incorporated in the culture of an organisation and its projects. RBME as the tool for RBM
looks at the project cycle and comprises 6 stages that are planned and designed at the same time
with the project. RBME cycle is used in order for M&E to be successful. And according to Result
Based Performance Monitoring and Evaluation (RBPME) Toolkit there are 6 stages starting from
project design and finishing with the implementation of the project, namely:
1. Programming
2. Identification
3. Formulation
4. Appraisal
5. Implementation
6. Evaluation
After understanding the stages of PCM in relation to Monitoring and Evaluation, IFRC proposes
six key steps to develop the M&E Plan, that are further used as guidelines to develop the plan:
1. Identifying the purpose and scope of M&E System
2. Planning for information gathering and data management
3. Planning for critical process and data analysis
4. Planning for quality communication and reporting
5. Planning for necessary conditions and capacity
6. Prepare the M&E Budget
Moreover, Evaluation is further presented in Step by step guide by DPCD, where guidelines are
presented on how assessment is performed through four processes, namely:
1. Thinking:
Describing the purpose
Identifying end products
Considering budgets and timeline

MASTER THESIS IRIS ENGHIS
4TH
SEM. MANAGEMENT IN THE BUILDING INDUSTRY (MSC)
3 AAU- Sofiendalsvej 11 9000 Aalborg
Autumn 2015
2. Planning:
Defining objectives
Establish Evaluation questions
Identifying information needed to answer the questions
Reviewing the Evaluation Plan
3. Collecting:
Identifying methods of data collection
Overlaying timelines and budget
Considering Privacy and Ethical Issues
4. Communicating: by utilising findings and contracting.
1.2. COLLABORATION
The report has been conducted in collaboration with project manager: Michael Gabba from Kuben
Management, as the client advisor and project manager Christian Hannesbo as the total contractor
from TL Byg and his assistant Theis Brønning Nørlem for the development of Støvring Bytorv
Project. This dissertation has been made under the supervision and guidance of Arne P. Rasmussen,
who provided during the writing of this research paper: constructive feedback, suggestions and
direction to improve its content, through supervision meetings.In Appendix 2 are included the
discussions with both project managers.
The collaboration was done through emails, interviews and site visits. The format of the interviews
was structured and directed in a way that discussions regarded only Monitoring and Evaluation
system and quality procedures. To direct discussions, interviewees were informed about the aim of
the study, and opinions were collected from both project managers.
Michael Gabba has provided the necessary documents about Kuben Management such as the
presentation of the company, quality management policy and risk analyses attached in Annex A, to
get an overall idea of the company performance. For the project in Støvring there has been provided
architect drawing, engineer drawings, bidding list, invitation to tendering, work specification, the
turnkey contract and the BNKI catalogue from TL Byg. All these documents can be found in
Annexes A, B, C and D.
The access for the project in Støvring has been granted through Byggeweb. Byggeweb is a web
portal with access granted for all parties involved in the project and the client to ensure a better
cooperation. Byggeweb working method integrates 5D virtual construction process into physical
process to ensure a digitalized way of working.
As already discussed, there has been made investments in IT platforms to better digitalise, which is
also the case with Byggeweb, a great initiative for construction project stakeholders. Within
Byggeweb, data is gathered and handled into separate information silos throughout the project
process: project setup, design, quantity take off, estimating, tendering, contracting, site preparation,
site contracting, material procuring, controlling and invoicing, in order to prevent errors and time
waste.

MASTER THESIS IRIS ENGHIS
4TH
SEM. MANAGEMENT IN THE BUILDING INDUSTRY (MSC)
4 AAU- Sofiendalsvej 11 9000 Aalborg
Autumn 2015
1.3. RESEARCH METHODOLOGY
The main methods employed to generate results have been done through primary and secondary
data plus the qualitative and quantitative methods. Primary and secondary research methods are
appropriate in order to differentiate data that is important with regard to Monitoring and Evaluation
for better quality, and avoid irrelevant details such as secondary data.
Quantitative refers to measuring the status or change of a specific variable through numerical
results. Qualitative methods are the information gathered by asking the participants about their
observations and beliefs through textual descriptions. Qualitative information can be also quantified
meaning that by clustering opinions in groups qualitative results can be subtracted.
Monitoring and Evaluation focus in the past has been more on the quantitative data, however
nowadays is balanced by qualitative data. Quantitative offers more information than qualitative data
because of the specific key performance indicators (KPI), but quantitative can be also useful in the
M&E System if it is clear and specific about the topic of interest.
Qualitative data is used throughout Analysis chapter, where the application of RBME cycle and
LFA approach, provides descriptive results. Quantitative data is used in the evaluation catalogue as
key performance indicators to provide more depth information. Both project managers from Kuben
Management and TL Byg use the key performance indicators requested by Byggeriets Evaluerings
Center (BEC). Additionally, Ajour System Program is used for documentation.
Data collection is done throughout the project cycle and it has been collated, summarized and
analysed. Collation represents grouping together related items to provide a record of events and
facilitate further processing. Collation in this context uses the information from Monitoring and
Evaluation findings to structure it to arrive later on to a conclusion that leads to action.
Data collection is verified through triangulation, by collecting data from different sources. In this
way both project managers were asked to make sure data collection is valid. The purpose of data
collection within Monitoring and Evaluation system is to provide informed decision making for
improving project results. ”As a general rule, data collection and analysis should be undertaken
with those to whom the data, analysis and decisions pertain and therefore, at the relevant level.”
(Fund)
Moreover, through triangulation data can be verified, by collecting information using different
methods such as: sampling, core M&E through stakeholder’s analysis and questionnaires,
discussion methods such as brainstorms and methods for time-based patterns of change such as
diaries and photographs. There are also, methods for analysing relationships and linkages such as
problem tree and methods for ranking and prioritization matrices, see chapter 5.5.3.8 LFA Matrix.
In the table below are listed the methods used in this report.
Methods such as Stakeholders analysis, problem analysis, objective analysis and log frame, are used
in a structured way by choosing Logical Framework Approach LFA, as a great tool for analysing
data and planning. In the log frame, data is summarised and for each indicator listed in this matrix,
there are used different methods, accordingly to Støvring Bytorv project. Indicators for monitoring
would be: if the project is running on schedule also if the project is running within planned costs

MASTER THESIS IRIS ENGHIS
4TH
SEM. MANAGEMENT IN THE BUILDING INDUSTRY (MSC)
5 AAU- Sofiendalsvej 11 9000 Aalborg
Autumn 2015
and receives adequate costs. Regarding documents for monitoring finances, such as running within
planned costs have not been made available, only documents regarding time monitoring.
Choosing Methods of collecting data is based upon costs, reliability of data, skills needed and
ability to quantify results. The methods presented below and used within Støvring Bytorv do not
necessitate any increased costs, than the prices for data collection.
Adapted from (Fund)
For evaluation, most used methods are: First-hand information regarding the progress, performance,
schedule and problem areas of a project. These are analyzed with direct observations and formal/
informal periodic reports consisting of project status report, project schedule report and project
financial status report.
Informal reports can be as anonymous letters, press reports and complaints. Moreover, graphic
representations: Flow charts are the most fundamental tools used to enhance monitoring and
evaluation through a visual representation of the process with inputs, outputs and actions. The flow
chart helps all the staff to be on the same page and presents information that is easy for everyone to
understand. In case a flowchart is not enough there are also scatter diagrams, histograms, pareto or
cause and effect diagrams.
The report is written to comply with the academic demands, semester curriculum and within the
Harvard style system referencing.
Methods Description
Stakeholder
Analysis
Identifies participants and information to be included in M&E.
Documentation
Review
Helps to track and understand the evolution of a project. It can help establish a
baseline, or information on a specific indicator.
Direct
Observation
Used to obtain useful and timely information by observing what people do. This
often complements statistical data.
Semi-Structured
Interviews
Used to gain information from an individual or small group, using a series of
broad questions to guide conversations. These allow for building an in-depth
understanding of issues.
Case Study
Used to document the sequence of events, or story related to a person, location,
group or any other unit of investigation. This provides useful information into
impact.
M&E matrix
A table describing the performance questions, information gathering
requirements (including indicators), reflection and review events with
stakeholders, and resources and activities required to implement a functional
M&E system.
MASTER THESIS IRIS ENGHIS
4TH
SEM. MANAGEMENT IN THE BUILDING INDUSTRY (MSC)
6 AAU- Sofiendalsvej 11 9000 Aalborg
Autumn 2015
2. INTRODUCTION MONITORING AND EVALUATION (M&E)
This chapter describes Monitoring and Evaluation (M&E) as the planning phase whereas the project
manager has responsibility for. The chapter ends by explaining the M&E System advantages and
disadvantages and the importance of M&E System. The basis for M&E contains the Logical
Framework, activity schedule, project budget and implementation schedule, which will be further
discussed in the next chapters.
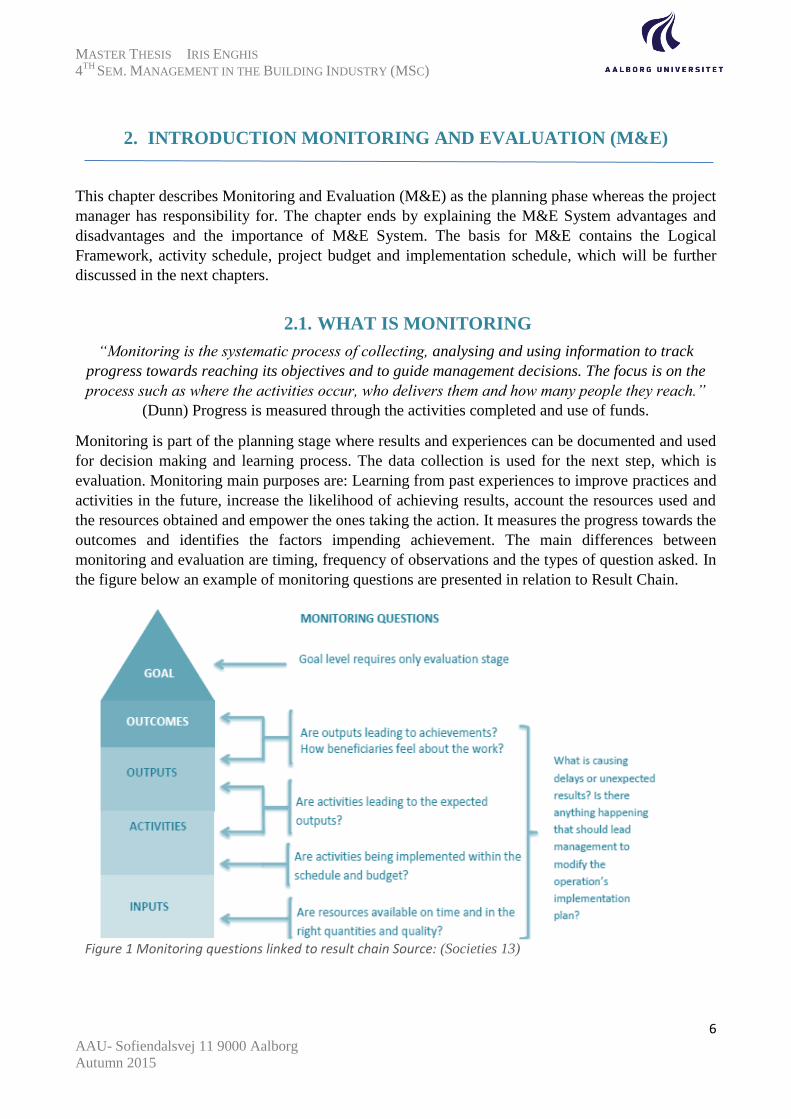
2.1. WHAT IS MONITORING
“Monitoring is the systematic process of collecting, analysing and using information to track
progress towards reaching its objectives and to guide management decisions. The focus is on the
process such as where the activities occur, who delivers them and how many people they reach.”
(Dunn) Progress is measured through the activities completed and use of funds.
Monitoring is part of the planning stage where results and experiences can be documented and used
for decision making and learning process. The data collection is used for the next step, which is
evaluation. Monitoring main purposes are: Learning from past experiences to improve practices and
activities in the future, increase the likelihood of achieving results, account the resources used and
the resources obtained and empower the ones taking the action. It measures the progress towards the
outcomes and identifies the factors impending achievement. The main differences between
monitoring and evaluation are timing, frequency of observations and the types of question asked. In
the figure below an example of monitoring questions are presented in relation to Result Chain.
Figure 1 Monitoring questions linked to result chain Source: (Societies 13)

MASTER THESIS IRIS ENGHIS
4TH
SEM. MANAGEMENT IN THE BUILDING INDUSTRY (MSC)
7 AAU- Sofiendalsvej 11 9000 Aalborg
Autumn 2015
Monitoring is done as day to day basis management, however there are different levels of
monitoring regarding to the periodicity and the information required;
Weekly monitoring is done for activities to make sure progress has been made, see client
demands description in 3.11 Client Specifications and Condition to Total Contractor, where
according to the case study these are weekly meetings to check progress monitoring of the
project. Documents such as time and financial planning versus actual results are used, and
represent quantitative methods of collecting and assessing data.
Earned value performance
management (EVPM) is a technique
that can be used, as seen in the
diagram below, through which
project performance is measured. It
combines scope with time and costs,
where:
PV is the planned value;
AC is the actual costs;
EV is the approved costs for actually
completed task by the specified date;
𝐸𝑉 = 𝑃𝑉 ∗ (% 𝑜𝑓 𝑤𝑜𝑟𝑘 𝑐𝑜𝑚𝑝𝑙𝑒𝑡𝑒𝑑 𝑜𝑢𝑡 𝑡𝑜𝑡𝑎𝑙 𝑤𝑜𝑟𝑘 𝑝𝑙𝑎𝑛𝑛𝑒𝑑 𝑏𝑦 𝑡ℎ𝑎𝑡 𝑡𝑖𝑚𝑒).
Moreover other KPI’s for cost and time are measured through Cost Variance (CV),
Schedule Variance (SV), Cost Performance Index (CPI) Schedule Performance Index (SPI),
Estimated Cost at Competition and Estimated Time to Complete, as part of EPVM. The rest
of formulas are included in Appendix 4.
Monthly monitoring is done to see resources used and cost incurred in relation to
implementation progress.
Quarterly monitoring is done to see if desired results are achieved.
Six- Monthly monitoring is done to see at what extent results are still relevant to the project
purpose, also to see what are the changes in project environment and if assumptions are held
true. This is monitored according to the log frame matrix, where indicators and assumptions
are specified for each activity monitored. See Chapter 5.5.3.8 Log Frame Matrix.
Monitoring can be classified as Activity/Process Monitoring or Results Monitoring. In this
paperwork, the concern is more about results monitoring as it measures the projects progress
towards reaching its objectives. In this context Monitoring is not just a tool for improving projects
performance but also it helps project managers to report information to donors, partners and internal
stakeholders. Activity Monitoring is used only for daily operations to asses’ compliance with
schedules, budgets and work plans; therefore Result Monitoring is more appropriate by focusing on
result achievements within this research.
Figure 2 Earned value performance management Source: (PMIS)
MASTER THESIS IRIS ENGHIS
4TH
SEM. MANAGEMENT IN THE BUILDING INDUSTRY (MSC)
8 AAU- Sofiendalsvej 11 9000 Aalborg
Autumn 2015
When designing a monitoring plans there are weaknesses that should be considered by the project
manager and by the ones that use it. This weakness regards the choice, design and testing of tools,
such as: choosing tools that are either too expensive, complex, not tested or adapted; lack of training
from the staff, commitment from stakeholder’s participation may lack, monitoring system can only
satisfy demands but there needs to be commitment for everyone involved in the process, the
framework defined by Monitoring may lead to interpretations; therefore it has to be clearly defined.
(Societies)
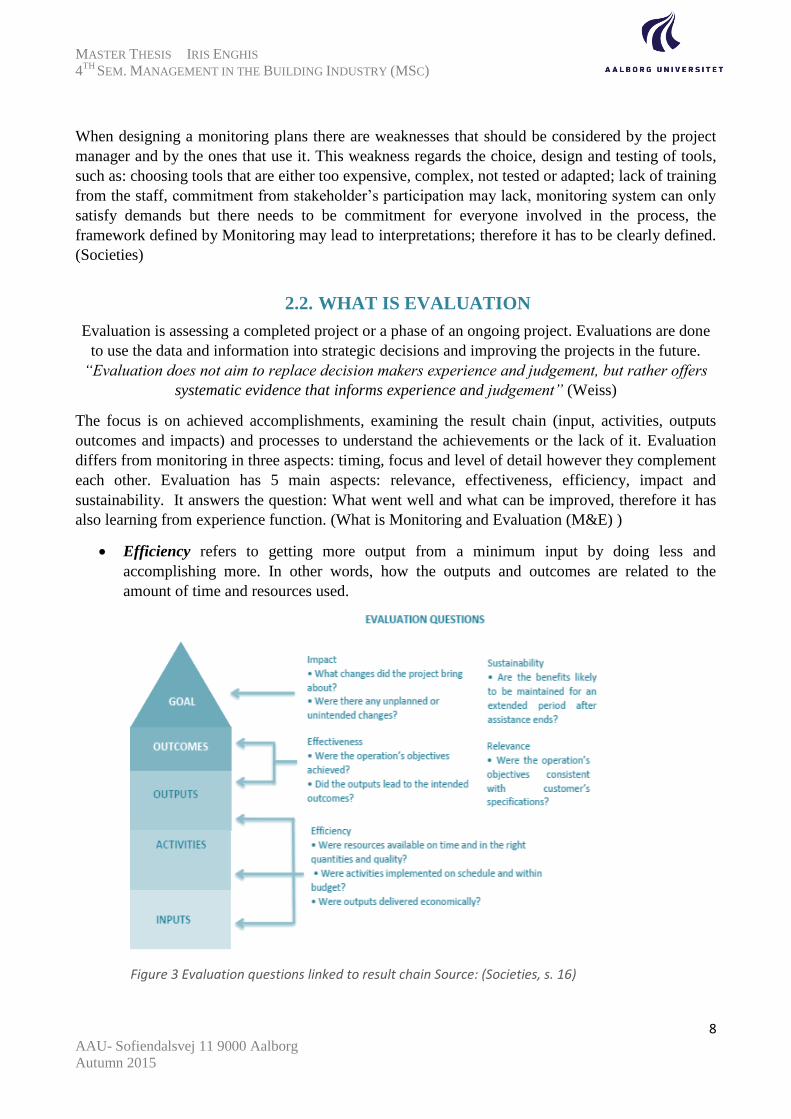
2.2. WHAT IS EVALUATION
Evaluation is assessing a completed project or a phase of an ongoing project. Evaluations are done
to use the data and information into strategic decisions and improving the projects in the future.
“Evaluation does not aim to replace decision makers experience and judgement, but rather offers
systematic evidence that informs experience and judgement” (Weiss)
The focus is on achieved accomplishments, examining the result chain (input, activities, outputs
outcomes and impacts) and processes to understand the achievements or the lack of it. Evaluation
differs from monitoring in three aspects: timing, focus and level of detail however they complement
each other. Evaluation has 5 main aspects: relevance, effectiveness, efficiency, impact and
sustainability. It answers the question: What went well and what can be improved, therefore it has
also learning from experience function. (What is Monitoring and Evaluation (M&E) )
Efficiency refers to getting more output from a minimum input by doing less and
accomplishing more. In other words, how the outputs and outcomes are related to the
amount of time and resources used.
Figure 3 Evaluation questions linked to result chain Source: (Societies, s. 16)

MASTER THESIS IRIS ENGHIS
4TH
SEM. MANAGEMENT IN THE BUILDING INDUSTRY (MSC)
9 AAU- Sofiendalsvej 11 9000 Aalborg
Autumn 2015
Effectiveness descries if the research process was useful in reaching project goals and
objectives. "Efficiency is doing things right; effectiveness is getting the right things done."
Relevance describes the usefulness, ethics and flexibility of a project within the particular
context.
Impact refers to the positive or negative changes produced by an intervention, directly or
indirectly intended or unintended.
Sustainability is concerned with measuring whether the benefits of an activity are likely to
continue after the project has ended.
An example of evaluation questions are presented in the figure above. However these questions
must be formulated later accordingly to the project being monitored and evaluated. Relevance is a
key aspect.
Evaluation can be done during implementation, often called as mid –term, at the end known as final
evaluation or afterwards known as post evaluation.
Mid-term evaluation reviews the progress of the project and changes can still be made
during project design or during the remaining period of implementation. These can be done
by involving the client in taking a customer satisfaction survey. See 6.3.1.2 Process
Evaluation.
Final evaluation is documenting the use of resources, results and progress towards reaching
objectives.
Post evaluation is done only after some years to assess the impact, which takes place after a
period of time.
Evaluation can be classified as formative or summative, depending on the purpose of the evaluation.
Formative evaluations only strengthen or improve the object being evaluated while Summative
evaluation will examine the effects or outcomes of the project.
In other words, formative evaluations happen at the beginning of the project in the development
phase while for summative evaluations, the projects are assessed at the end of the operating cycle.
The results obtained at the end of the project can be used to see if the program can be adopted,
continued or modified.
As in the case with Monitoring, in this paperwork the focus is on achieving results, therefore
summative evaluation is the appropriate one. Its purpose is to assess, determine the overall impact
and estimate the relative costs of the intervention. Summative evaluation can also be subdivided as:
Outcome evaluation: focusing on achievement of outcomes
Impact evaluation: focusing weather the specific aims of performance, strategy, practices,
products, experiences, policies, programs and technologies have achieved endpoints
outcomes.
Cost effectiveness and cost benefit analysis are based on financial evaluation, to determine
the feasibility of strategies, programs, products, experiences, policies, and technologies with
regard to monetary costs and ROI (return on investment)
Secondary analysis is based on empirical materials and data to reflect in issues or
implementation strategies without previous application.

MASTER THESIS IRIS ENGHIS
4TH
SEM. MANAGEMENT IN THE BUILDING INDUSTRY (MSC)
10 AAU- Sofiendalsvej 11 9000 Aalborg
Autumn 2015
Meta-Analysis represents the statistical analysis of a large collection of analysing results
from individual studies for the purpose to integrate findings. (Turk)
Evaluation is different from assessment. Evaluation examines the processes or outcomes to
facilitate the project development, implementation and improvement while assessment focuses
more on the individual performance by measuring their skill level based on the interest.
2.3. CHALLENGES TO M&E SYSTEM
Within Management a system is defined as a framework of policies, processes and procedures used
by an organization needs to fulfil the tasks required to achieve objectives. As with any other system
there are advantages and disadvantages. Within Monitoring and Evaluation these are:
Monitoring and evaluation requires time and commitment from the project manager
Underestimating the importance of monitoring and evaluation
Weak commitment regarding the process of collecting data and documenting evidence
Lack of incentives to carry out evaluation
Going into useless detail
Lack of interpretation data
Lacking professional expertise; it is therefore recommended an expert from outside to
conduct monitoring and evaluation; however it is an expensive procedure.
Underutilization of M&E data as it is not just paperwork to be put aside, but represents and
collects valuable data about the process and progress of a project that can be used later on
for other projects alike. (results)
2.4. ADVANTAGES OF M&E SYSTEMS
Monitoring and evaluation program can reduce costs and increase rehabilitation by minimizing
failures. Through evaluation, the project manager can find out what is working and what is not,
create staff development process through identifying weaknesses and strengths and improving
reputation by adding existing knowledge in the field.
It can also improve project management and process planning by better adapting to risk factors such
as social and power dynamics that generally affects the research process. Moreover, it improves
learning by identifying lessons learned that affect outcome and impact.
Through direct participation the various stakeholders understand each other views and values and
can design ways to resolve conflicting interests. Even a project with good planning, adequate
organizational machinery and sufficient flow of resources, may not achieve the desired results, if
there is not a warning mechanism for the organizations possible success or failure. By constant
monitoring and evaluation it is possible to save the waste of scarce resources and ensure a lean
execution of the project.
Lastly, monitoring and evaluation ensures accountability by assessing if the project is effectively
appropriate. Monitoring is rather descriptive and evaluation leans to be more interpretive. However

MASTER THESIS IRIS ENGHIS
4TH
SEM. MANAGEMENT IN THE BUILDING INDUSTRY (MSC)
11 AAU- Sofiendalsvej 11 9000 Aalborg
Autumn 2015
evaluation is not possible without monitoring. Evaluation purpose is to improve projects and
justification. After an evaluation is performed, conclusions can be taken with regard to:
Has the project achieved its goal?
How the project has achieved its intended purpose?
How efficient was converting resources into activities, objectives and goals
How sustainable was the project for the participants?
Decision makers can be informed on how to improve projects in the future. (Evaluation)
“The link between actions and outcomes is often not so obvious. Faced with the daily demands of
their job, many managers are unable to regularly and formally step back and reflect on the
cumulative results of their efforts. In the absence of such reflection, resources may be wasted and
objectives may not be achieved.”
“Evaluation of management effectiveness thus provides a formal way to learn from successes and
failures and helps people understand why and how management practices are to be adapted.”
(Pomeroy )
Monitoring and Evaluation is neither too expensive or complicated, however there needs to be a
constant involvement of the project manager to point out which are the important areas to be
monitored and evaluated for the specific project otherwise the research will be more academic than
useful to the project manager.

MASTER THESIS IRIS ENGHIS
4TH
SEM. MANAGEMENT IN THE BUILDING INDUSTRY (MSC)
12 AAU- Sofiendalsvej 11 9000 Aalborg
Autumn 2015
3. COMPANY BACKGROUND AND DESCRIPTION
This chapter introduces Kuben Management as the case study for this report. A short description
about the company’s history, organization, vision mission strategy and economy will follow to give
the reader an overview about the company status.
Lastly, strength, weaknesses, opportunities and threats (SWOT) analysis will be discussed to make
evidence of the companies’ competitive advantage.
Furthermore, a case study namely the Støvring Bytorv is presented as one of the company’s projects
as client advisors. The project will be used for further investigations in Methods and Analysis
Chapter for the application of Monitoring and Evaluation system.
3.1. KUBEN MANAGEMENT - COMPANY DESCRIPTION
Kuben Management A/S is a construction company that act as project developer, consultant for
private clients and advisers for energy, operational optimization of buildings and building
environment. The company provides construction solutions that are meant to be economical social
and environmental friendly.
- Within project development the company offers advice in all construction phases. Within
planning: the idea initiation and other necessary analysis, within programming: the tender
procurement, scrutiny the 1 to 5 years inspection, reports of energy consumption, financing
and user involvement.
- Within energy optimization the company services are offered in strategy and planning,
energy management and consumption monitoring, tender procurement and project
management.
- Within analysis plan and strategy the company offers vision presentations, masterplans,
project development, scenario analysis, strategy development and customer specification
analysis. (http://www.kubenman.dk/)
3.2. KUBEN MANAGEMENT - HISTORY
As seen in figure below, Kuben Management A/S was founded in 2008 as a result of Kuben A/S
and Kuben Byggherrerådgivning A/S a blending of Construction Administration, Construction
Rental and Consultancy and Urban Renewal.
In 2011 Kuben Management A/S was bought by NRGi Rådgivning. NRGi is one of the largest
energy companies in Denmark with focus on smart urban development that offers services within
infrastructure consulting, installation and product sales.
In an article from Dansk Energi, Ulf Christensen, CEO of NRGi Consulting has declared:

MASTER THESIS IRIS ENGHIS
4TH
SEM. MANAGEMENT IN THE BUILDING INDUSTRY (MSC)
13 AAU- Sofiendalsvej 11 9000 Aalborg
Autumn 2015
“Buying Kuben Management is an important strategic step meant to create a broader consultancy
platform for customers. In the same time, both companies will grow within strong academic skills
that enable the companies to become a market leader in sustainable consulting solutions within
social housing sector and construction industry as a whole.”
(http://www.danskenergi.dk/Aktuelt/Arkiv/2011/Marts/11_03_14A.aspx)
Aside growth in market leadership for sustainable consulting solutions, there are also benefits in
relation to development of new innovation solutions to ensure that new targets in construction
energy efficiency can be reached.
3.3. COMPANY ORGANISATION
The company has approximately 115 employees and is subsidiary of NRGi’S consulting division.
Offices are located Aarhus, Copenhagen, Odense, Kolding and Aalborg; in this report the
collaboration undergoes with Aalborg division. The company has 6 departments with experts from
different backgrounds such as:
- Engineers and architects
- Lawyers and economists
- Planners and geographers
- Sociologists and anthropologists
Figure 4 Kuben Management History Source: (Virksomhedspresentation) Annex A

MASTER THESIS IRIS ENGHIS
4TH
SEM. MANAGEMENT IN THE BUILDING INDUSTRY (MSC)
14 AAU- Sofiendalsvej 11 9000 Aalborg
Autumn 2015
- Constructing architects
- Machine operators
- VVS engineers and installations.
The client which can be the municipality or a public institution will directly collaborate with Kuben
Management as the client’s advisor. See client advisor responsibilities in connection to Støvring
Bytorv below. The figure below shows the different departments within Kuben Mnagement, where
the top down flow starts from the board of managers going through the Economy, IT and sales
department and lastly the consultancy services within construction, administration, analyse, tender
procurement and energy departments.
Figure 5 Kuben Management Organization Source: (Virksomhedspresentation, 2015) Annex A
As it can be seen in 3.6 SWOT Analysis there is a strong preference of the company on working
with public projects. The explanation for this is that public clients have more experience than
private ones, and working as client advisor for public institutions responsibilities may be less
hurdle. Within consultancy Michael Gabba has been appointed as the client advisor for the project
in Støvring and his responsibilities towards Nørdjylland Housing Association are:
- To assess the case
- To develop the project brief
- Select the type of procurement
- Carry out design reviews
- Monitor construction and testing
- Carry out post project reviews such as evaluation of the project delivery process
- Asses the performance in use
Directors
Co
nstr
uction
co
nsu
lta
nce
No
rth
Co
nstr
uction
co
nsu
lta
nce
So
uth
Constr
uction
co
nsu
lta
nce
Ce
ntr
e
Ad
min
istr
ation
C
onsu
lta
nce
and
A
naly
se
Ea
st
Co
nsu
lta
nce
and
T
end
er
pro
cu
rem
ent
East
En
erg
y a
nd
co
nstr
uction
Ea
st
Economy and IT Department Sales

MASTER THESIS IRIS ENGHIS
4TH
SEM. MANAGEMENT IN THE BUILDING INDUSTRY (MSC)
15 AAU- Sofiendalsvej 11 9000 Aalborg
Autumn 2015
3.4. VISION MISSION AND STRATEGY
As mentioned in the first interview with Michael Gabba, the company’s vision mission and strategy
is still under construction. However, with regard to the old vision, mission and strategy the
company would like to:
Create a sustainable balance between urban, business, people and the environment through
client consulting and energy consulting services;
To be recognized as the most professional and dedicated advisor in the markets for client
consultancy and energy consultancy services;
As mentioned previously in 3.2 Kuben Management history a change in the strategy has taken place
once the company was bought by NRGi. The company sees itself now as a market leader
maintaining a steady growth and improving services through innovation and skilled employers.
Source: (Virksomhedspresentation) Appendix 1.
3.5. KUBEN MANAGEMENT ECONOMY
From the company presentation, it is presented the turnover for the last 5 years, where a steady
growth is registered from 2010 until 2014. A good indicator is the equity ratio which was almost the
same in 2010 and 2014. However, in 2010 the equity ratio was higher than the turnover which
indicates the company was financing its growth by debt which compared to 2014 where the
turnover is higher and debts are still the same means a step ahead.
A result of main activities indicates how profitable the company is. Profit is also ascendant;
however in 2012 an abnormal low result of main activities is registered. This could be due to high
investments.
2014 2013 2012 2011 2010
Turnover (mio. kr.) 107,9 103,2 95,7 62,2 54,0
Result of main activities 11,2 11,3 1,1 6,0 3,3
Equity Ratio (%) 56,5 45,8 44,1 65,4 58,5
Number of workers 103 101 109 68 73
Table 1 Kuben management economy Source:: (Virksomhedspresentation)

MASTER THESIS IRIS ENGHIS
4TH
SEM. MANAGEMENT IN THE BUILDING INDUSTRY (MSC)
16 AAU- Sofiendalsvej 11 9000 Aalborg
Autumn 2015
3.6. SWOT ANALYSIS FOR KUBEN MANAGEMENT
SWOT as the strengths weakness opportunities and threats of the company, is a planning method
for evaluation. By identifying SWOT of a company brief evaluation of the companies’ competitive
advantage can be subtracted.
The data is collected by asking questions about each of the category. Other alternatives to SWOT
are Growth share matrix or Porter five forces analysis but for the compliance with LFA (logical
framework approach) and M&E, SWOT analyses will be used.
According to figure 6, it can be stated that Kuben Management competitive advantage is:
- Being the best and only choice on the market. Moreover by becoming a part of NRGi, the
company has positioned itself strong enough to maintain a stable position in the future.
One of the greatest strengths is working with the public sector, which on the other side working
with private sector is becoming a threat. More private constructions are in the focus now which
could force a change in the strategy and market focus. The project portfolio selection is done
strategically in order to become two times larger. This opportunity is increased also with Støvring
Bytorv and many other projects, some of them presented in the next subchapter.
Figure 6 SWOT Analyses. Source: showeet.com

MASTER THESIS IRIS ENGHIS
4TH
SEM. MANAGEMENT IN THE BUILDING INDUSTRY (MSC)
17 AAU- Sofiendalsvej 11 9000 Aalborg
Autumn 2015
3.7. PROJECTS
Kuben Management has built a strong relationship with the public sector to deliver construction
projects such as renovation, new construction and project development. On the other hand Kuben
Management has a great demand from municipalities for both large and small construction projects
whereas they perform as advisers to optimize the energy consumption and operation. Kuben
Management are advisers also for private investors for corporate and headquarter buildings. Among
the project references that worth to be named within project development is:
- City Campus Aalborg, a project of 11 hectares
- Skanderborg Municipality new city hall and sports center
- Bispebjerg Hospital client consultancy
- Slagelse Psychiatric Hospital client consultancy
- Canal Connection Odense Largest N. Europe Swing Bridge
Figure 7 Slagelse Psykiatriske Sygehus Figure 8 Kanalforbindelse, Odense
Figure 9 Bispebjerg Hospital

MASTER THESIS IRIS ENGHIS
4TH
SEM. MANAGEMENT IN THE BUILDING INDUSTRY (MSC)
18 AAU- Sofiendalsvej 11 9000 Aalborg
Autumn 2015
3.8. CASE STUDY: STØVRING BYTORV
3.9. PROJECT DESCRIPTION
The project will be built in 2 phases, the apartment phase and the shopping area phase. The methods
and analysis for this project are performed only for the apartment phase due time limitations. The
timeframe for this project started from October 2015 until August 2016. A master time schedule can
be seen in Appendix D. Before the construction started there had to be demolished the existing
buildings and there has also been an agreement with the municipality to enlarge the local plan.
There will be 20 subsidized family apartments consisting of 2 floors above ground level and
shopping centre with shops at ground floor. Storage rooms will be also constructed at basement
level. The apartments are fully furnished consisting of 3 up to 4 rooms with entrance, kitchen and
bathroom. All apartments have access through balcony. Balconies will be constructed as a wide area
so it can be used also as living area. All apartments have balconies towards Hobrovej, west side.
Part of the agreement is the construction of a center. For more information please check the
drawings in Appendix B.
Figur 11 Støvring Bytorv Local Plan Source: Byggesagbeskrivelse Annex C
Figure 10 Ground floor plan of the apartments; 2 floors Source: (Grænsefladenotat, July 2015) Annex C
MASTER THESIS IRIS ENGHIS
4TH
SEM. MANAGEMENT IN THE BUILDING INDUSTRY (MSC)
19 AAU- Sofiendalsvej 11 9000 Aalborg
Autumn 2015
The building is made out of concrete elements with polished masonry on the outside. Roof is flat
and made out of roofing felt. Balconies are made in concrete and stairs of steel.
According to Rebild Municipality it has been negotiated for a long time with TL Byg to sale
Støvring Bytorv. Støvring Bytorv was sold for 9.5 million kr. Mayor Anny Winther has stated:
“I am now delighted that the project is finally becoming a reality. For an active trading of Støvring
it is important to have a vibrant and thriving city center with even more great shops and homes.”
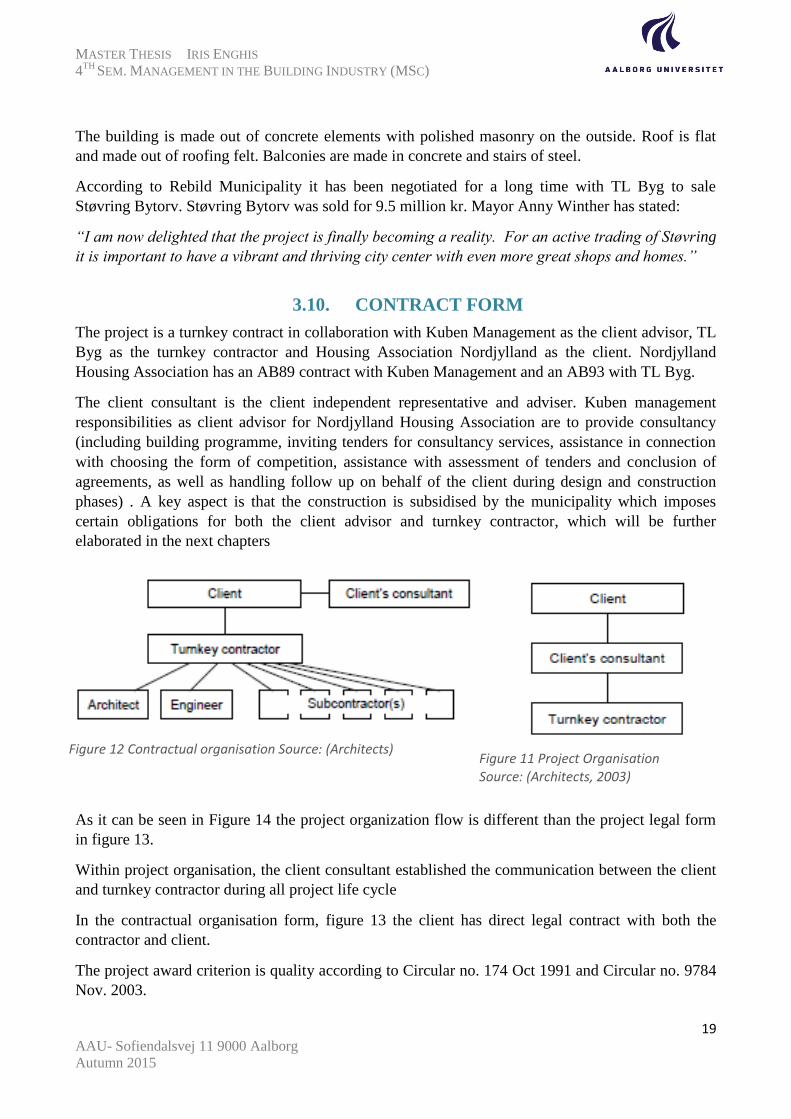
3.10. CONTRACT FORM
The project is a turnkey contract in collaboration with Kuben Management as the client advisor, TL
Byg as the turnkey contractor and Housing Association Nordjylland as the client. Nordjylland
Housing Association has an AB89 contract with Kuben Management and an AB93 with TL Byg.
The client consultant is the client independent representative and adviser. Kuben management
responsibilities as client advisor for Nordjylland Housing Association are to provide consultancy
(including building programme, inviting tenders for consultancy services, assistance in connection
with choosing the form of competition, assistance with assessment of tenders and conclusion of
agreements, as well as handling follow up on behalf of the client during design and construction
phases) . A key aspect is that the construction is subsidised by the municipality which imposes
certain obligations for both the client advisor and turnkey contractor, which will be further
elaborated in the next chapters
As it can be seen in Figure 14 the project organization flow is different than the project legal form
in figure 13.
Within project organisation, the client consultant established the communication between the client
and turnkey contractor during all project life cycle
In the contractual organisation form, figure 13 the client has direct legal contract with both the
contractor and client.
The project award criterion is quality according to Circular no. 174 Oct 1991 and Circular no. 9784
Nov. 2003.
Figure 12 Contractual organisation Source: (Architects) Figure 11 Project Organisation Source: (Architects, 2003)
MASTER THESIS IRIS ENGHIS
4TH
SEM. MANAGEMENT IN THE BUILDING INDUSTRY (MSC)
20 AAU- Sofiendalsvej 11 9000 Aalborg
Autumn 2015
3.11. CLIENT SPECIFICATIONS AND CONTIDITONS TO TOTAL
CONTRACTOR
Description of client specification with regard to total contractor contains secondary data which will
not be included in this report, only within Appendix. However, description of demands and
conditions with regard to monitoring and evaluation will be further scrutinised and included in the
report to be taken in consideration for further analysis. These include defects, project reviews,
documentation and testing, deterioration, damages or lost parts before delivery, changes in work,
clarification, client's supervisor specifications, contractor's control, closed meetings and site
meetings.
Defects - as an important KPI for monitoring
“(…) defects at delivery will be solved at the Arbitration tribunal.
If the contractor may fail to meet provision of subsection 4, (materials and other supplies to work
must be delivered within 5 years liability for defects) there will be significant additional costs for
him or significantly delays in the works or less substantial supplies will be difficult to monitor in
compliance with the provisions. The client should be notified if there are present essential defects at
delivery.”
§ 11 Project review, documentation and samples
“Project review should be performed by one of the parties. According to the contract there should
be documentation for work completion, materials used and the tests carried out by the contractor
must be delivered. These provisions must be included in the control plan. The participation in the
project review together with tests and provision of documentation are part of contractor’s
performance.
Stk. 2. Additional tests can be required by the client and in such cases the contractor should have
the necessary staff available for testing, sampling and examination. The client is obliged to pay the
additional work. If contrary the contractor will pay to the client the extra work as expenses.
Stk. 3. The contractor should provide to the client supervised access to the site and where work is
performed. The client can require the necessary information for how the performance is evaluated.
Stk. 5. The contractor must make ongoing cleaning, evacuation or removal of waste materials as
soon as possible.
§ 11 Deterioration, damages or lost parts before delivery
“It is the contractor’s responsibility to make sure the work is done according to the contractual
performance except the ratios attributed by the client. The contractor shall maintain the work
performed until delivery. The contractor provides reviews, applying for permits, and procures
certificates relating to execution, and pays the expenses hereby.”
§ 14. Changes in work:

MASTER THESIS IRIS ENGHIS
4TH
SEM. MANAGEMENT IN THE BUILDING INDUSTRY (MSC)
21 AAU- Sofiendalsvej 11 9000 Aalborg
Autumn 2015
Stk. 2. “If there are changes from the agreement regarding price, time and safety, the client
amendment must be made in writing and the same applies to the rest of parties. There should be as
soon as possible notifications with regard to changes.”
§ 15. Clarification:
“No additional work must start without prior written agreement. This also applies where the
contractor believes a work falls outside the contract. The contractor must arrange for the written
agreement and must be approved in time. If the contractor finds out that the work cannot be carried
out in accordance with the agreement, the contractor must inform the client and follow his
instructions.”
Stk 3. “The Contractor shall as soon as possible inform the developer, if there are any
circumstances, which prevents or hinders the work or makes it obvious that there will be a loss for
the developer or incurs liability against third parties. If there is no time to obtain the client's
instructions, it is best to take measures to prevent client losses.”
Stk. 4. “The tender documents should contain information regarding groundwater and pollution or
other obstacles. If despite the implementation of such feasibility studies (taking into account the
land, the nature, location and previous use), unforeseen circumstances happen which result in
prohibition that prevents proceeding, the contract is cancelled against compensation to the
contractor.
The compensation does not include the contractor lost profits by not completing the work, but just
the other losses, contractor suffers.
§ 17. The client's supervisor
The client's supervisor represents the developer to the contractor in terms of work. The supervisor
can provide and receive notifications regarding work and approve or reject materials or work.
§ 18. Contractor's control
Although the developer participating in the project review or supervising contractor work, this does
not entail any reduction in the contractor's responsibility project or work in general.
§ 19. Closed Meetings
Unless otherwise agreed, convene contractor building meetings with the developer and prepares
minutes, as soon as possible must be sent to the developer. Total contractor must keep site meeting
with the client every week during the construction period by prior arrangement.
§ 20. Site Meetings
At each site meeting it must be stated the reason and the number of working -waste days - where the
work is partially or completely done. This is an important part of monitoring and indicators;
however the only document that has been made available is the Master Plan Schedule with critical
Path.
MASTER THESIS IRIS ENGHIS
4TH
SEM. MANAGEMENT IN THE BUILDING INDUSTRY (MSC)
22 AAU- Sofiendalsvej 11 9000 Aalborg
Autumn 2015
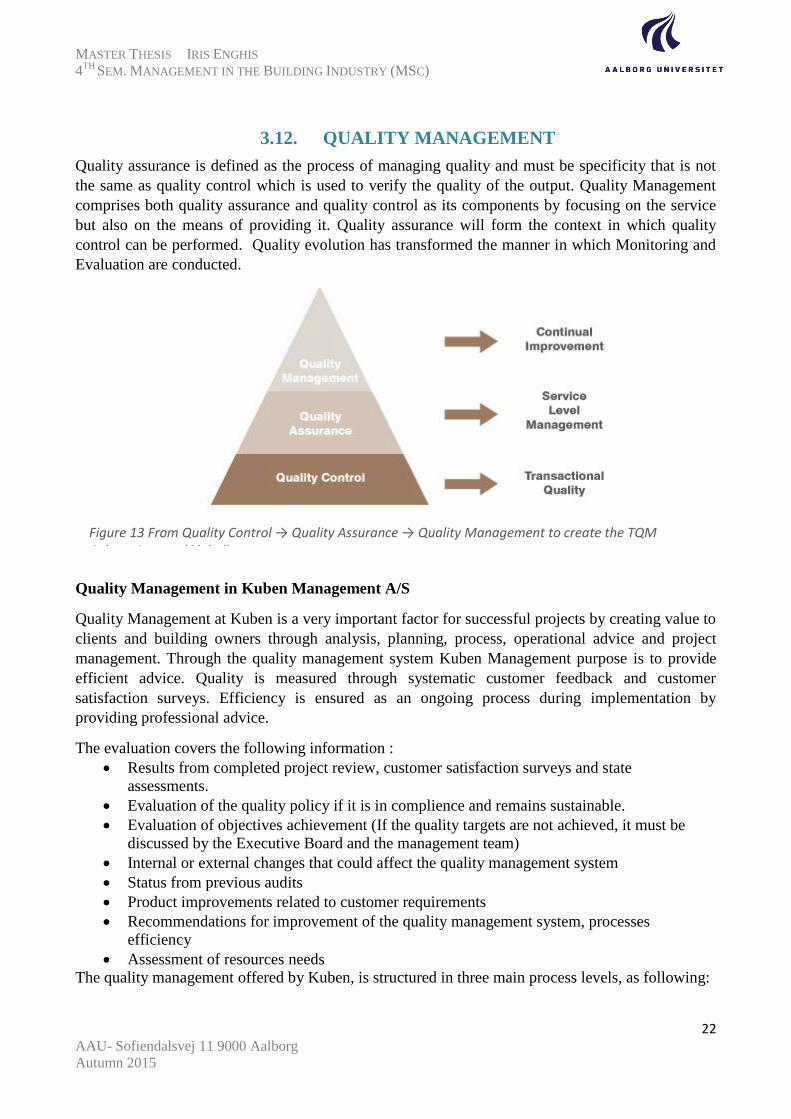
3.12. QUALITY MANAGEMENT
Quality assurance is defined as the process of managing quality and must be specificity that is not
the same as quality control which is used to verify the quality of the output. Quality Management
comprises both quality assurance and quality control as its components by focusing on the service
but also on the means of providing it. Quality assurance will form the context in which quality
control can be performed. Quality evolution has transformed the manner in which Monitoring and
Evaluation are conducted.
Quality Management in Kuben Management A/S
Quality Management at Kuben is a very important factor for successful projects by creating value to
clients and building owners through analysis, planning, process, operational advice and project
management. Through the quality management system Kuben Management purpose is to provide
efficient advice. Quality is measured through systematic customer feedback and customer
satisfaction surveys. Efficiency is ensured as an ongoing process during implementation by
providing professional advice.
The evaluation covers the following information :
Results from completed project review, customer satisfaction surveys and state
assessments.
Evaluation of the quality policy if it is in complience and remains sustainable.
Evaluation of objectives achievement (If the quality targets are not achieved, it must be
discussed by the Executive Board and the management team)
Internal or external changes that could affect the quality management system
Status from previous audits
Product improvements related to customer requirements
Recommendations for improvement of the quality management system, processes
efficiency
Assessment of resources needs
The quality management offered by Kuben, is structured in three main process levels, as following:
Figure 13 From Quality Control → Quality Assurance → Quality Management to create the TQM Culture Source: (Global)

MASTER THESIS IRIS ENGHIS
4TH
SEM. MANAGEMENT IN THE BUILDING INDUSTRY (MSC)
23 AAU- Sofiendalsvej 11 9000 Aalborg
Autumn 2015
1. Management: Quality management is linked to the overall business strategy and
management, within: quality policy, quality objectives, and requirements for customer
satisfaction surveys.
2. Benefits: by covering the processes offered for customers and documentation of quality
system documents including: description of related processes supplemented by income
documentation, checklists, specifications, standards and regulatory requiremenets
3. Support: by covering internal processes and ensuring good operations within the company.
(Management)
Client consultant: Regarding client’s consultant’s obligations during design phase, the following
indications have been taken from 2.4.5 Client Consultancy (byggerådgivning) where it is specified:
- The client’s consultant assesses whether the turnkey contractor’s quality management
system for the design phase is consistent with the provisions of the agreement.
- The client’s consultant performs spot checks to establish whether the turnkey contractor
complies with quality management systems agreed for the design phase.
- The client’s consultant reviews the project in general terms to check whether the quality of
the project complies with the requirements of the building programme and other agreements.
- The client’s consultant assesses the turnkey contractor’s proposals for tender verification
and supervision plans.
- The client’s consultant draws up a plan for its own overall supervision.
The Client consultant’s obligations within quality during construction phase are stated in section
2.5.5, as following:
- The client’s consultant assesses whether the turnkey contractor’s quality management
system for the construction phase is consistent with the provisions of the agreement.
- The client’s consultant participates in project review meetings to the extent agreed upon.
The client’s consultant performs spot checks to establish whether supervision and control
plans are followed.
Turnkey contractor: The turnkey contractor duty for quality management is listed in
Byggesagsbeskrivelse.pdf and specifies that it is the client to convene on the start-up meeting, and a
Quality Plan for all contracts should be outlined after this first meeting.
Subcontractors should forward to the supervisor their own process review no later than 5 working
days before the project review meeting. The contractor must participate actively in the project
review. Agenda includes the following points:
Reviewing contractor's presentation
Building supervisor's review of the material in question
Joint solution and investigation of possible problems
Moreover, there will be agreed fixed weekly meetings and the quality management documentation
should contain plan and control records, material documentation of supplies delivery and brochures
of supplies. The contractor shall participate actively in the necessary project review.

MASTER THESIS IRIS ENGHIS
4TH
SEM. MANAGEMENT IN THE BUILDING INDUSTRY (MSC)
24 AAU- Sofiendalsvej 11 9000 Aalborg
Autumn 2015
There should be delivered: advice for maintenance, cleaning instructions and operating instructions
before the handing on procedure.
3.13. EVALUATION
From the work specification it is stated that key figures are needed from previous evaluations, and if
these are not available an accredited third party should issue them as evaluation assessment is
compulsory for subsidized buildings.
Key figures are a Governmental order since 2005 aiming to create a better development of the
construction process with regard to the quality, price and productivity. The key figures for public
subsidy constructions became mandatory in 2008. The rating system shows the average which
represents the position of the company where: A is much better than the average, B better than the
average, C like the average, D worse than average and E much worse than average.
The contractor is selected in the tendering after the kpi’s from previous evaluation. The document is
attached in Annex and presents TL Byg previous ratios from the last three projects. The document,
as the BNKI Catalogue with key figures is issued by Byggeriets Evaluering Center (BEC) a
description of BEC is further presented in implementation chapter.
From the Byggerybeskrivelse is specified with regard to evaluation:
“Once the contract has been signed the contractor together with the developers should enter into
agreement with an evaluation company for evaluation of the particular contract. The contractor
pays a fee to an evaluation company, and receives no compensation from the developer for the
costs. The cost of fees and time by filling questionnaires etc. is part of the contractor's work.”
It has been agreed that quality should be delivered as demanded and this is done by delivering a
fully furnished apartment once the construction is closed. Key figures for the project in Støvring
should be issued no later than 8 weeks after handing in.
3.14. OTHER SPECIFICATIONS RELATED TO THE PROJECT
The deadline for handing in the construction is 1st of august 2016. According to the interview with
Michael Gabba, it has been mentioned that there are no fixed deadlines imposed by the client other
than final completion time. It is therefore the responsibility of Turnkey Contractor to set deadlines
for subcontractors to make sure construction is delivered on time. The price is also fixed, due to the
fact that is a subsidized construction by the Municipality. Most important is monitoring the quality
as this is the perquisite imposed by Nordjylland Housing Association. There has to be a clear and
good communication between all the stakeholders of the project to make sure quality is understood
by everyone in the same way. Miscommunication is an important topic in the construction industry,
as it plays an important role in the efficiency and effectiveness of the construction process.

MASTER THESIS IRIS ENGHIS
4TH
SEM. MANAGEMENT IN THE BUILDING INDUSTRY (MSC)
25 AAU- Sofiendalsvej 11 9000 Aalborg
Autumn 2015
3.15. PROJET SUMMARY
TITLE Støvring Bytorv
LOCATION Støvring Bytorv 5, 9530
STARTING DATE 1 october 2015
COST 24 478 750
TIMESCHEDULE
GOAL More public housing
Roof
Glass&Steel
Paintwork
Inventory
Windows&doors
Elevators
Construction Site
Masonry
Tiles
Concrete work
Carpentry
TURNKEY CONTRACTOR> TL Byg Heavy Elements
Structural Work
Plumbing
Electricity
The city council has promised
that about 2000 m2 of the
homes will be listed as public
housing. There is a general lack
of housing in Støvring, and the
municipality is interested to be
an attractive settlement.
PARTNERS
• Advisory Engineer with technical
supervision: Frandsen & Søndergaard K/S
Nylandsvej 15, 9000 Aalborg
• Project leader : Peter Gasberg
• Client: Boligskabet Nordjylland, Arsenalvej
20 9800 Hjørring, Contact person: Torben
Fisker
• Advisor: Kuben Management A/S
Skibbrogade 3, 9000 Aalborg, Contact
person: Michael Gabba
• Total Advisor including technical
supervision: Architects: Bjørk & Maigård ApS
Gasværkvej 30 Aalborg
• Project Manager: Søren Noses, tel. 96 31
40 44
Table 2 Project Støvring Bytorv Summary
Fige 14 Facade elevations through the courtyard 1:300 Annex B Project Drawings
MASTER THESIS IRIS ENGHIS
4TH
SEM. MANAGEMENT IN THE BUILDING INDUSTRY (MSC)
26 AAU- Sofiendalsvej 11 9000 Aalborg
Autumn 2015
4. PROBLEM STATEMENT
The problem formulation has been depicted as a result of investigations and analysis.
In the Analysis chapter, a problem and objective tree is developed where a logical sequence on
determining the focal problem is explained. The problem formulation contains the Study
Curriculum guidelines, the student’s topic of interest and the companies focus on complying with
client demands.
Moreover, from the analysis of a real building case study it has been shown that, the way resources
are managed, plays a key role in the performance and efficiency of achieving project objectives.
Having in mind that the building case is a public subsidised project, it is important to document the
process to ensure it complies with what has been agreed.
In this context it can be formulated: How to provide a transparent process for the parties involved
in the project, through Monitoring and Evaluation and what is the importance of involving
stakeholders in this process? With the following sub questions:
How Result based management as a modern approach within Monitoring and Evaluation
can ensure achievement of results, during planning, monitoring and evaluation phases?
How monitoring and evaluation can be sustained throughout the project life cycle?
What techniques can be used to manage better the use of resources?
How Monitoring and Evaluation can be implemented?
What are the differences in client’s advisor and contractor performance?
Delimitations:
Monitoring and evaluation is delimitated to Danish Building Regulations for a specific case project,
namely Støvring Bytorv. The data collection for investigating and analysing this cause, was
collected through discussions with the project manager Michael Gabba from Kuben Management,
and the project manager from TL Byg, Christian Hannesbo
Monitoring and Evaluation is limited to Kuben Management and Tl Big procedures. Due to time
restriction, evaluation results of Støvring Bytorv will be available only after August 2016, when
BEC ratings will submit the grading.

MASTER THESIS IRIS ENGHIS
4TH
SEM. MANAGEMENT IN THE BUILDING INDUSTRY (MSC)
27 AAU- Sofiendalsvej 11 9000 Aalborg
Autumn 2015
5. METHODS AND ANALYSIS
The structure of Methods and Analysis Chapter follows the stages corresponding to Result Based
Monitoring and Evaluation (RBME). There will be a total of 6 stages following the project cycle for
a successful implementation of M&E. The methods of collecting qualitative data were performed
through interviews. Moreover, Result Based Management (RBM) as the theory is build up on
Results Chain, a systematic process to offer a clear view over the projects purpose and outcomes
that will be used as a necessary part of analysis, through which objectives are defined.
This Chapter provides an assessment on how an approach is better than the other by comparing
Project cycle management (PCM) with Result Based Monitoring, RBM with traditional M&E,
Logical Framework Approach (LFA) as part of Theory of Change (ToC) and finally proposing the
structure for RBME.
There will be concluded to use the Logical Framework Approach (LFA) as a planning thin
Resource Based Monitoring and Evaluation (RBME) for a systematic planning, implementation,
monitoring and evaluating projects. This tool will be applied within this report due to its systematic
approach to analyse and identify a problem.
5.1. PROJECT CYCLE MANAGEMENT (PCM)
Project Cycle Management will be described in order to introduce Results Based Management
(RBM). Result Based Management together with Project Cycle Management are two approaches
that complement each other. PCM can be seen as a part of RBM. RBME will be presented in 6
phases that represent the structure of planning, designing and implementing M&E throughout
Støvring Bytorv. It is important to mention that the duration of each stage vary upon the project
scale, scope and operating modalities.
“PCM contributes to RBM by rationalizing the steps leading to a successful outcome.” (Societies)
And is accepted by European Commission since 1992 for project development and management.
Project Cycle Management (PCM) was introduced in 1990 by the European Commission to
improve the quality of the project and its effectiveness. It has been introduced as a result of poor
project planning, risks not being taken in consideration, also factors affecting the long term
sustainability of project benefits, and lessons learned that were not being used and integrated in the
next projects.
By describing and applying the stages of PCM there are used management principles, analytical
tools and techniques. Projects should be relevant, feasible and sustainable. The principles of PCM
refer to:
Make a well informed basis for decision making;
Provide sustainable benefits for the beneficiaries; in other words an inclination toward client
demands;
Incorporate aspects of sustainability into project design

MASTER THESIS IRIS ENGHIS
4TH
SEM. MANAGEMENT IN THE BUILDING INDUSTRY (MSC)
28 AAU- Sofiendalsvej 11 9000 Aalborg
Autumn 2015
Provide an analytical approach to project design and management through Logical
Framework Approach (LFA)
Make the process an integral system where objectives, work plans and budgets are prepared
on the basis of the project log frame.
“PCM obliges practitioners in project design to focus on the real needs of the beneficiaries by
requiring a detailed assessment of the existing situation and by applying the logical framework
method……Right from the beginning, aspects assuring sustainability are incorporated in the
project design. The strength of PCM is that project documents are structured according to a
standardised format dealing with all relevant issues, including the assumptions on which the
project is based. At each stage in the project cycle, these issues are examined and revised where
necessary and carried forward to the next stage. This system makes the project concept and context
in which it operates clear and visible, and enables therefore better monitoring and evaluation
(Comission)
An alternative to project cycle is offered by IFRC. In the diagram below there are presented three
stages of the project cycle. At project start it is presented an Initial Assessment, then a Planning
phase that comprises a log frame, an M&E planning and a baseline study, going through last phase
in the project end as the Implementation, M&E. Implementation and M&E is achieved during the
midterm evaluation with or without reviews, a final evaluation and the dissemination and use of
lessons learned. Throughout the project cycle there is ongoing reporting, reflection and learning.
IFRC states also that there is no generic project cycle associated with M&E activities and the one
below is just an example.
Figure 15 ey M&E Activities in the project cycle Source: (Societies, 2011, s. 12)

MASTER THESIS IRIS ENGHIS
4TH
SEM. MANAGEMENT IN THE BUILDING INDUSTRY (MSC)
29 AAU- Sofiendalsvej 11 9000 Aalborg
Autumn 2015
The quality of a project is measured in terms of relevance by meeting the imposed demands,
feasibility by delivering sustainable benefits to target groups and effectiveness if the project is well
managed and achieves the desired results. In the image below namely the Quality Frame each of
the attributes has a number of criteria which in total are 16 used for evaluating quality. Projects
should be analysed in each phase of the life cycle to make sure it still meets the quality criteria’s
and facilitates further decision making. (Barbera)
Figure 16 Quality Frame Source: (Barbera) EC* European Commission

MASTER THESIS IRIS ENGHIS
4TH
SEM. MANAGEMENT IN THE BUILDING INDUSTRY (MSC)
30 AAU- Sofiendalsvej 11 9000 Aalborg
Autumn 2015
5.2. RBM OR TRADITIONAL M&E?
Traditional M&E measures and reports the status of results while RBM measures and reports results
to produce results. Therefore, RBM is more of a pro-active tool than traditional M&E which tends
to be more reactive. RBM is a dynamic tool for planning and budgeting to improve performance
and achievement of results. (Khan)
Resource based management is looking inside the company in contrast to other strategy models
such as Porter’s Five Forces which focus is on the external competitive environment.
In other words by looking at the companies’ internal environment, strategic action can be
correlated with the internal resources and capabilities of the company, rather than focusing on the
external environment.
5.3. RESOURCE BASED MANAGEMENT (RBM)
RBM is a management and performance reporting system through which results aim to be achieved.
The evidence on the actual results resulting from the RBM system, is used for decision making.
Resource Based Management is a system useful for companies to incorporate it into the
organisation’s culture, operational systems and decision making procedures.
Traditionally the aim has been for long time to focus on inputs and activities as already described in
Traditional M&E; however RBM focus is on achieving outcomes and impact, which is in
accordance to nowadays trends.
Results are defined as changes that derive from the causality relationship and refer to the outputs
outcomes and impacts. Results are intended or unintended, positive and/or negative.
Management is referring to the effectiveness management of results. In order for results to be
achieved there needs to be a good management, but also flexibility in changing strategies and
activities. Results should be updated at least once a year to ensure a good management.
The main characteristics of the RBM system are:
Traditional Management Approach
Focuses mainly on inputs and activities
Result Based Management Approach
Focuses on results obtained rather than just on
inputs and activities conducted
Figure 17 Traditional Management approach vs. Results- Based Management Approach Source: Invalid source specified.

MASTER THESIS IRIS ENGHIS
4TH
SEM. MANAGEMENT IN THE BUILDING INDUSTRY (MSC)
31 AAU- Sofiendalsvej 11 9000 Aalborg
Autumn 2015
Goal Orientation towards change and improvement
Causality refers to the result chain where inputs and activities determine outputs, outcomes
and impact.
Continuous improvement by monitoring to keep track on the progress and if necessary
maximize the outcome.
Result based management is a technique initiated by United Nations in 1990 to improve
organizations effectiveness and accountability. It can be seen as a project cycle approach with
elements such a planning and defining the results. After these have been decided, implementation
becomes an essential task to ensure results are being achieved.
Overall, RBM is a strategy that contributes on achieving a set of desired results. As the name
suggests, the resources possessed by a firm, determinates its performance. The RBM Logic goes
through assessment, by asking: What is the current situation? Through thinking, asking: what has
caused it? Who is involved and what are we going to achieve? The third stage will be then,
planning, by asking: How are we going to do it, with whom, when and with what resources? Follow
up by doing and asking if there is needed to be adapted? Lastly, reviewing of what went good or
bad and what can it be learned from this next time?
“Resources (as the inputs and activities) are all the assets, capabilities, processes, information and
knowledge the company has and represents the basis for producing results.” (UNDP)
UNDP, the United Nations Development Programme, also OECD, DIFD are organisations that help
countries to develop policies, leadership skills, partnering abilities, institutional capabilities for
achievement of results in different sectors such as construction, agriculture, technology and so on.
Their advice on Result Based Management is commitment from organisational leadership that
values constant learning through evidence based information and openness.
Furthermore, the key elements or phases of RBM include:
Identifying clear and measurable objectives (results), aided by logical frameworks.
Selecting indicators that will be used to measure progress towards each objective.
Setting explicit targets for each indicator, used to judge performance.
Developing performance monitoring systems to regularly collect data on actual results
Reviewing, analysing and reporting actual results towards targets.
Integrating evaluations to provide complementary performance information.
Using performance information for internal management accountability, learning and
decision-making processes, and also for external performance reporting to stakeholders and
partners.
The first three stages are accordingly to the logical framework approach system used for planning
and emerging strategies. Adding the monitoring system and reporting on actual results refers to the
concept of performance measurement. All seven phases combined are essential to an effective
results based management system. (Garbutt)
RBM reporting should be done to:

MASTER THESIS IRIS ENGHIS
4TH
SEM. MANAGEMENT IN THE BUILDING INDUSTRY (MSC)
32 AAU- Sofiendalsvej 11 9000 Aalborg
Autumn 2015
Describe what has been achieved and indicators for success
Compare actual results with expected results
Quantify achievements
Document findings with quotes, testimonials, photos
Highlight any unforeseen problems or opportunities that may require new strategies or a
redesign of the initiative (UNDP)
Monitoring and Evaluation (M&E) is a vital part of RBM as it forms the basis for clear and accurate
reporting on results achieved by a project. Information reporting will have in this case a basis for
critical analysis and organizational learning.
In the figure below the RBM Approach as in the case with PCM, a diagram alternative is presented
where the same phase are followed but described slightly differently.
- Within Planning the context is on defining results, formulating them and creating a result
chain.
- Within Monitoring there will be developed a Monitoring and Evaluation Plan, (this will be
indicated with guidelines in chapter 6.1) and measuring progress;
- Within Evaluation phase RBM is used for programme improvement, accountability and
organisational learning. Evaluation step by step guideline is also presented further on in
chapter
Figure 18 RBM Approach Source (UNDP)

MASTER THESIS IRIS ENGHIS
4TH
SEM. MANAGEMENT IN THE BUILDING INDUSTRY (MSC)
33 AAU- Sofiendalsvej 11 9000 Aalborg
Autumn 2015
5.4. RESULT BASED MONITORING AND EVALUATION (RBME)
“If you do not measure results, you cannot tell success from failure
If you cannot see success, you cannot reward it
If you cannot reward success, you are probably rewarding failure
If you cannot see success, you cannot learn from it
If you cannot recognize failure, you cannot correct it
If you can demonstrate results, you can win public support” Osborne & Gaebler, 1992
Result based monitoring and evaluation is a management tool to track progress and demonstrate the
impact of a given project. Result Based Monitoring and Evaluation uses the Logical Framework
Approach to indicate objectives, monitoring indicators, assumptions and risks towards achievement.
RBME is adding to PCM the monitoring quality aspect, of service delivery. RBME provides extra
information on what are the actual results versus the planned results at the end of the project, by
reporting and taking corrective action if necessary. The results are collected to provide information
about the achievement of the programme. Furthermore, RBM interlinks Monitoring and Evaluation
with regular feedback and adjustment system, something that is not incorporated in PCM. PCM
leans more on the first stages of programming and proposal design while RBM adds accountability,
effectiveness and efficacy to the program by:
defining realistic expected results
integrating lessons learned into management decisions
reporting on performance
Furthermore, RBM is used to:
Identify stakeholders problems and opportunities
Set clear and agreed objectives, targets and milestones
Set the adequate resources to achieve objectives
Monitor progress with use of appropriate indicators
Identify and manage assumptions/risks
Using indicators to measure progress
Increase knowledge by lessons learned and integrate them into decision making
If necessary, change objectives according to lessons learned
Reporting results achieved (Spreckley)
From the methodology point of view the stages of Result Monitoring and Evaluation in figure 19,
can be seen on the right side as qualitative and on the left side quantitative measurement. The
qualitative measurement is used to gather data as external components that affect the project,
namely: stakeholders’ record and responses, assumptions, unforeseen positive and/or negative
consequences, DAC criteria and contribution to the overall strategy, which will be further described
in the project. Quantitative methods go through all stages from Project M&E design,
implementation, measurement and impact.

MASTER THESIS IRIS ENGHIS
4TH
SEM. MANAGEMENT IN THE BUILDING INDUSTRY (MSC)
34 AAU- Sofiendalsvej 11 9000 Aalborg
Autumn 2015
Project M&E design is done during first meetings for the creation of preliminary results and
indicators. This as a first stage influences the most the success or failure of M&E process.
Project delivery is done to finalise result statements, indicators and performance monitoring plan to
ensure achievement. If unrealistic objectives are set, then making a good M&E is impossible. The
direction must also be clear in order to get the relevant information.
Project Implementation is done by regular project reviews to ensure expected results and indicators
are still relevant. Information comes from tracking outputs, outcomes and impact that should be
achieved through project operations. Corrective action must be taken if it gets to the conclusion the
information does not show progress.
Figure 19 Result Based Monitoring and Evaluation Outline Source: (Spreckley)

MASTER THESIS IRIS ENGHIS
4TH
SEM. MANAGEMENT IN THE BUILDING INDUSTRY (MSC)
35 AAU- Sofiendalsvej 11 9000 Aalborg
Autumn 2015
Measures must be documented through analysis, reports, concl usions and recommendations, and a
reflection/ assessment of the project should be eventually formulated to understand the project
programme impact.
Result chains are the basis for M&E activities. The first two components in the result chain are
inputs and activities, as the basis for achieving results. It is important therefore to identify within a
project: What do we want to achieve and why by making use of the capabilities available.The result
framework also called result chain or log frame is a good tool for monitoring, management and
evaluation because it focuses on outcomes, as already mentioned the tendency is more on results
than just listing implementation activities, processes and inputs;
Result frameworks in RBME are providing evidence to help the policy makers understand if the
intervention has succeeded. Measuring is another factor that through result chains is possible and
crucial towards achieving objectives. Result frameworks are used in planning, coordination,
management, communication, eva luation and reporting
Result frameworks in RBME are providing evidence to help the policy makers understand if the
intervention has succeeded. Measuring is another factor that through result chains is possible and
crucial towards achieving objectives. Result frameworks are used in planning, coordination,
management, communication, evaluation and reporting.
Within Planning Result Chains are used to show the immediate results of activities in connection to
the overall objectives and goals.
Within Coordination result framework is used as the common ground regarding expected results,
while checking assumptions and specifying needed resources with the other parties involved in the
Figure 20 The RBM Result Chain Source: Invalid source specified.

MASTER THESIS IRIS ENGHIS
4TH
SEM. MANAGEMENT IN THE BUILDING INDUSTRY (MSC)
36 AAU- Sofiendalsvej 11 9000 Aalborg
Autumn 2015
program/project. Within Management the use of performance data should help on making decisions.
If there are impediments on achieving results, corrective actions should be taken and a relocation of
resources could be a good management tactic.
Within Communication and reporting the result framework is used as a visual tool for
communicating resources, activities and outcomes to the program staff and other interested parties.
(Group)
Lastly, within Evaluation and learning from experience, result frameworks should contain
indicators, measures and targets for the ongoing monitoring and evaluation and later on to assess
what approaches contribute most effectively to achieve the desired results. If such approaches are
verified to be successful and identify good practices than they may be used for replication in other
projects and similar contexts.
DAC Criteria is a standard set that relates the result chain from the log frame with evaluation
criteria’s, to guide process. It is summarised as seen in the figure below:
Figure 21 Hierarchy of objectives and DAC Criteria Source: (Spreckley 21)

MASTER THESIS IRIS ENGHIS
4TH
SEM. MANAGEMENT IN THE BUILDING INDUSTRY (MSC)
37 AAU- Sofiendalsvej 11 9000 Aalborg
Autumn 2015
5.5. APPLICATION OF RBME CYCLE
In figure below RBM Cycle is presented in six phases that are the basis for M&E to be successfully
implemented. These stages go through identification, implementation, monitoring and evaluation
and ending with lessons learned.
Each step will be applied within the Analysis chapter for the case study of this report, respectively
Kuben Management A/S. The stages use planned and actual quantitative measurement.
The cycle principles is to make decisions at each stage progressively, meaning that each phase must
be completed before the other starts ensuring monitoring and evaluation as a part of feedback and
learning process. At each stage, the activities/tasks that are implemented in the project will be
monitored and evaluated. In order that M&E to be successful, the whole cycle needs to be
understood and approached as an entity.
5.5.1. STAGE 1 PROGRAMMING- SETTING THE CONTEXT FOR
MONITORING AND EVALUATION
Programming phase refers to identifying problems, constraints and opportunities. Programming
should be concluded with identifying and agreeing on objectives and priorities and providing a
feasible framework for identification and preparation of the project.
Figure 22 RBM Cycle Source: (Spreckley, 2nd edition 2009, s. 8)

MASTER THESIS IRIS ENGHIS
4TH
SEM. MANAGEMENT IN THE BUILDING INDUSTRY (MSC)
38 AAU- Sofiendalsvej 11 9000 Aalborg
Autumn 2015
In this stage, a clear strategy must be defined in relevance with the project to achieve the sustainable
benefits it will create. Lessons learnt from previous projects should be revised as a contributor in
formulating the strategy.
LESSONS LEARNED
From the interview with Michael Gabba the lessons learned from previous projects that contribute
to the strategy are related to how the building site roads are used, economy and the collaboration
between the client and contractor.
The first cause, building site roads are monitored to be respected as it should due to a previous
incident Nordjylland Housing Association had. This incident was fined by Arbejdsmiljø (Health
and Safety work environment) due to the placement of heavy roads and traffic roads near to a crane.
It has been noticed some of the workers walking under the crane during mounting of elements.
There were no accidents but Arbejdmiljø are very strict with complying with regulations, therefore
they will check for the project in Støvring so this will not happen again.
Economy of building site activities has to be monitored at each stage to remain within the financial
threshold imposed by the municipality. However documents related to financing are not available,
as these are comprised in Ajour Program, which will be submitted later as reports. Taking in
account that the price is fixed, it is the total contractor responsibility to monitor finances frequently
to make sure there are no overrun costs.
The Client- contractor communication is essential within projects as it influences the projects
outcomes. Therefore employing the client advisor, will solve most of these issues where the client
advisor will make sure that the turnkey contractor fulfils the client demands.
STRATEGY
Another important factor for setting the context for Monitoring and Evaluation is formulating the
strategy. In formulating strategy lessons learned need also to be considered. Further in the Analysis
chapter, an identification of the main stakeholders and their demands are identified and should
formulate the strategy for the project in Stovring.
5.5.2. STAGE 2 IDENTIFICATION ON SOLVING PROBLEMS
Within identification stage, the purpose is to identify objectives expressed in relation to
programming. In the identification phase in order to ensure the relevance and feasibility of the
project, following assessments need to be done:
Assessment of policy and programming framework
Stakeholder analysis
Problem analysis
Assessment of other ongoing and planned initiatives
Assessment of lessons learned;
Preliminary objectives and strategy analysis;
Preliminary assessment of resources and cost parameters;

MASTER THESIS IRIS ENGHIS
4TH
SEM. MANAGEMENT IN THE BUILDING INDUSTRY (MSC)
39 AAU- Sofiendalsvej 11 9000 Aalborg
Autumn 2015
Preliminary assessment of project management, coordination and financing (Barbera)
In this stage, LFA Approach will be used as part of analysis stage where stakeholder mapping,
problem and objective analysis and determination of acceptable strategies will be developed. By
doing so, there will be established a logic in the project objectives and stakeholder expectation that
need to be monitored throughout the project. The relevance, feasibility and sustainability are
achieved by use of LFA project planning and management core tool. Internationals NGOs
(Bakewell & Garbutt, 2005) identified that:
- LFA encourages clear thinking by creating logic in how activities contribute to the desired
goal through delivering outputs and outcomes. It eliminates unnecessary information
provided by the researchers, also termed as “waffle” writing long and unclear reports.
- LFA provides a simple summary of the key elements and enables rapid understanding over
the projects.
There is also criticism towards using LFA however there are no currently viable alternatives,
according to Bakewell and Garbutt. Criticism of LFA relies on the linear logic of causality resulting
in just one dimension analysis of the project
Furthermore the challenges are:
- Communicating LFA thinking to others and is treated as a contract document, and
modifications are complicated to be made once it has been something agreed at multiple
stakeholders’ negotiation level.
- Unintended consequences and possible negative outcomes can appear in a project and LFA
does not provide any consideration and guidelines on how to cope in this situation
:
Figure 23 5 Merging PCM and Log frame approach Source: (Commission, Project Cycle Management Handbook)

MASTER THESIS IRIS ENGHIS
4TH
SEM. MANAGEMENT IN THE BUILDING INDUSTRY (MSC)
40 AAU- Sofiendalsvej 11 9000 Aalborg
Autumn 2015
Using LFA throughout the project cycle, in programming phase is to analyse problems, constraints
and opportunities and determine objectives. In the identification phase the initial project proposal
should be conceived and formulated by use of LFA.
Within formulation stage relevance and feasibility of the project should be confirmed, and there
should be prepared a financing plan, cost benefit analysis, risk management, monitoring and audit
arrangement.
Lastly in the implementation stage, resources can be managed efficiently to deliver the desired
results and achieve purposes to contribute to the overall objective of the project.
Monitoring is not used on basis of LFA however for Evaluation and audit stage the log frame
matrix is a good summary of records. (funds)
5.5.2.1. THEORY OF CHANGE (TOC) AND LOGICAL FRAMEWORK APPROACH
(LFA)
ToC is a methodology for planning and evaluation that defines long term goals in order to identify
necessary preconditions. Theory of change is vital to evaluations success. By using this as a
methodology, managers can be assured that the right activities are used to achieve the desired
outcomes. It shows the positive impacts (that are beneficial) the negative ones (that are detrimental),
and how they contribute to producing impacts. Overall, Toc refers to making a change in the
program/project and showing how that change is going to happen. In general ToC should be:
“Plausible. Do evidence and common sense suggest that the activities, if implemented, will
lead to desired outcomes?
Doable: Will the economic, technical, political, institutional, and human resources be
available to carry out the initiative?
Testable: Is the theory of change specific and complete enough for an evaluator to track its
progress in credible and useful ways?” (C.Kubich)
A good log frame has ToC embedded in its structure; the two approaches blend into each other as:
“If we do these Activities and these assumptions hold, then these Outputs will be delivered. If these
Outputs are delivered and these assumptions hold true then this Purpose will be achieved, and if
this Purpose is achieved and these assumptions hold true then this Goal will be achieved. The
whole thing is designed around an/if...and/then series of propositions.” (Rick Davies)
Logic Framework is a way to represent ToC, in a more simplistic way. Logical framework is
widespread while ToC seems to be less standardized. Log frames illustrate graphically the
components and helps through stakeholder involvement to clearly identify outcomes inputs and
activities while Toc links outcomes and activities to explain how and why the desired change is
expected.
Moreover, log frames focus more on specific program to meet the outcomes while Toc is more a
general picture. However Toc and logic framework is more or less the same thing but expressed
differently. There is still a debate over the differences. Toc has originated from two kinds of
thoughts: evaluation, by clarifying the links between inputs and outcomes and social action. To

MASTER THESIS IRIS ENGHIS
4TH
SEM. MANAGEMENT IN THE BUILDING INDUSTRY (MSC)
41 AAU- Sofiendalsvej 11 9000 Aalborg
Autumn 2015
conclude, log frames will be further used to show analysis more systematically and easier to
understand.
Figure 24 Theory of change versus Program Logic Source: http://www.tools4dev.org/

MASTER THESIS IRIS ENGHIS
4TH
SEM. MANAGEMENT IN THE BUILDING INDUSTRY (MSC)
42 AAU- Sofiendalsvej 11 9000 Aalborg
Autumn 2015
5.5.2.2. LOGICAL FRAMEWORK APPROACH (LOGFRAME) (LFA)
The Logical Framework Approach (LFA) is an analytical process and set of tools used to support
objectives-oriented project planning and management. It provides a set of interlocking concepts,
which are used as part of an iterative process to aid structured and systematic analysis of a project
or programme idea.” (Guide to the logical framework approach 10)
LFA was developed in 1969 for United States Agency for International Development (USAID). It
has 20 years of popularity, and has become universally known .LFA is agreed to be the most
appropriate management tool due to its usage within monitoring and evaluating international
development projects. However it does not replace target group analysis, cost benefit analysis, time
planning, and impact analysis. (Logical Framework : Making it Results Oriented)
The Logical Framework (log frame) is a way to apply RBM to the management of the project. The
LFA consists of two main stages – analysis stage and planning stage. The analysis stage comprises:
stakeholder analysis, problem analysis, objective analysis and strategy analysis, whereas the
planning stage includes the Logical Framework Matrix, activity scheduling and resource
scheduling.
When using a result oriented Logical Framework Approach, fundamental question arise such as:
Why are we doing this project? What results do we expect to achieve for the resources being
Figure 25 LFA Analysis and Planning Phase Contents, Source: (Commission, The logical framework approacg)

MASTER THESIS IRIS ENGHIS
4TH
SEM. MANAGEMENT IN THE BUILDING INDUSTRY (MSC)
43 AAU- Sofiendalsvej 11 9000 Aalborg
Autumn 2015
invested? Who will the project reach out to in terms of beneficiaries? How will progress toward the
achievement of results be measured? In order to get an effective result of using LFA, stakeholder’s
perspective and the intended outcomes play a crucial role in answering the questions above.
(Logical Framework : Making it Results Oriented) LFA helps to:
Analyse the existing situation within the company, including the identification of
stakeholders’ needs and the definition of related objectives
Establish a causal link between inputs, activities, results, purpose and overall objective
Define the assumptions on which the project logic builds
Identify the potential risks for achieving objectives and purpose
Establish a system for monitoring and evaluating project performance (Guide to the logical
framework approach)
As mentioned, PCM uses LFA as a core tool. This refers to the fact that LFA is used throughout all
the stages of Project Cycle Management, namely in: identification, formulation, implementation and
evaluation. In the identification, it is analysed the existing situation and possible new strategies are
identified, during formulation clear objectives, measurable results, assumptions and risks are
identified, whereas in implementation there is monitored what has been formulated and lastly
during evaluation , the log frame provides the summary as the basis for performance and impact
assessment.
Table 3 Log frame Matrix Source: (Commission, Aid Delivery Methods 58)

MASTER THESIS IRIS ENGHIS
4TH
SEM. MANAGEMENT IN THE BUILDING INDUSTRY (MSC)
44 AAU- Sofiendalsvej 11 9000 Aalborg
Autumn 2015
5.5.2.3. STAKEHOLDER ANALYSIS
Stakeholder analysis consists in identifying all the people and organizations that are impacted by the
project, both positively and negatively.
Moreover is necessary to document relevant information such as interests, involvement and
stakeholders influence on the success of the project. In regards to that, within stakeholder analysis
the following questions should be answered:
Who is the stakeholder by name?
Within Støring Bytorg the stakeholders have been defined in section 3.6 Project summary
where all partners are listed. The ones that have the most influence over the project
development is Nordjylland House Association and the municipality. More information
available on their website: www.bonord.dk
What is the nature of their interest in the project? Professional or personal?
Nordjylland Housing Association will benefit from 20 new apartments in Støvring.
The housing association will have therefore a greater supply of apartments to rent/sell.
Due to the fact that the municipality has subsidised this project they also have a great
interest in transforming Støvring as an attractive settlement of housing. It is a professional
requirement also to monitor and evaluate the construction throughout project cycle and
report kpi’s to the stakeholders.
What are the stakeholder’s expectations of the project manager?
The best way to determine this is for the project manager to have a meeting with the key
stakeholders, such as building owners (developer parties) or investors. As informed, it is
expected to deliver the construction in time, quality and within financial threshold.
What to expect from the stakeholders?
This is the opposite of the previous question. It is definitely needed to set expectations and
this is not telling the stakeholder what to do or how to act, but if done correctly it is
providing the stakeholder with a description of the support that the project manager needs.
What are the priorities of the stakeholders to be considered?
For Nordjylland Housing Association the most important is quality.
After gathering the above information, the stakeholders are classified according to their
roles as being part of external or internal groups of stakeholders. Internal stakeholders
usually refer to the people who are part of the organization they work for and have an
interest in the development of the project. Internal stakeholders refer to any kind of internal
investors or shareholders, CEO, core project teams, providers of functional resources and
different support groups.
External stakeholders refer on the other hand as the group of people that has an interest in the
development of the project but are not part of the organization. This group of people includes the
client as the developer, which in case of Støvring Bytorv is Nordjylland Housing Association. Other
parties are the end users, which are the ones who will rent/buy the apartments. Suppliers: Projects
require materials to be supplied from external companies. When analysing this category of external
stakeholders, the project manager should consider the list of major suppliers. Contractors and
consultants: As it is the case with the materials, which are procured from suppliers, the project

MASTER THESIS IRIS ENGHIS
4TH
SEM. MANAGEMENT IN THE BUILDING INDUSTRY (MSC)
45 AAU- Sofiendalsvej 11 9000 Aalborg
Autumn 2015
manager often collaborates with both contractors and consultants in order to perform certain tasks
or require some services.
In conclusion to stakeholder participation there will be established: a level of understanding
towards setting strategic goals, defining the result chain of expected results, identifying assumptions
and risks to be further used in analysis of this research.
5.5.2.4. PROBLEM ANALYSIS
The problem analysis aim is to identify the
negative aspects of an existing situation and
displaying a causality relationship between the
problems. After the main problem is identified
also called core problem, a problem tree can be
developed by starting with: causes of the
problems on the downside of the tree and the
effects of the problem on the upper side an
example is shown in figure. 2 Subsequently the
steps in developing a problem tree are:
1. Determine the scope of analysis
2. Identify stakeholders
3. List the problems
4. Identify the core problem
5. Identify causes and effects
6. Arrange the causes as roots
7. Arrange the effects as branches
According to the project in Støvring, the scope
of this analysis is to determine what is affecting the quality of work. Causes that could endanger
quality have been identified together with the project manager from TL Byg and his assistant Theis
Brønning Nørlem. See Appendix 2 Email discussion and questionnaires. The main causes have
been stated to be: lack of time, lack of funds and quality of work performed by labours. Based on
this a problem tree has been developed to understand what are the effects in order to diminish these
problems.
Each cause of the problem tree will be explained to understand the context in which is happening,
As seen in figure 27 Problem Tree, 3 main causes have been mentioned to be as the time factor,
finances and labour capabilities.
Not enough time: According to document Critical Path Time Schedule in Annex D, the critical path
shows the activities that cannot be delayed, otherwise it will delay the whole project leading to
performing less quality than expected. The activities that are most important are mounting of
elements, which can be also seen on the critical path and it has been mentioned that: to prevent
wasting time on delivery of elements, due to the fact that these were not available right on time
Figure 26 Problem tree Source: (Guide to the logical framework approach)

MASTER THESIS IRIS ENGHIS
4TH
SEM. MANAGEMENT IN THE BUILDING INDUSTRY (MSC)
46 AAU- Sofiendalsvej 11 9000 Aalborg
Autumn 2015
from one supplier, elements were ordered from four suppliers to make sure mounting will happen
on time.The consequence for not having enough time is due to insufficient planning. If activities
receive realistic time to be completed plus a buffer to make sure it won’t exceed the planned time
allocated for each of the activity then there will be enough time to make sure everything is going
accordingly to what has been planned. If activities consume the buffer and delay the next ones
leaving no other solution, the only possibility is to compromise quality, in order not to waste more
time.
Figure 27 Activity: Element Mounting Source: Tidsplan med Kritiskvej
It should be taken in consideration unforeseen conditions, such as governmental orders or weather
storm for example which could jeopardise the process flow. It must be therefore taken in
consideration a total buffer for the project to make sure unforeseen risks are covered.
Other Analysis, are not available, but another way to illustrate monitoring of time schedule is
through: Time versus completion curves; this will show how the project was planned according to
its Early Start and Late Start and what the current state is, according to percentage of work
completed. Moreover, future possibilities of early and late start can be also recalculated. This is
shown as seen in the figure below:
Figure 28 Illustration of Actual Percentage Completion versus Time Source: (pmbook)

MASTER THESIS IRIS ENGHIS
4TH
SEM. MANAGEMENT IN THE BUILDING INDUSTRY (MSC)
47 AAU- Sofiendalsvej 11 9000 Aalborg
Autumn 2015
Insufficient funds: As mentioned previously the total price is fixed and is the responsibility of the
project manager to manage funds for each contract. Not having sufficient funds to comply with
quality demands for certain activities is due to poor monitoring of budgets during construction.
Regarding budget there are no financial analyses available but as mentioned in 2.1 what is
Monitoring, and example of key performance to monitor budgets is Earned Value Management.
Qualified workers: This refers to workers which could be from other countries than Denmark. This
endangers quality due to Danish regulations that may not be known to other foreign workers. Also
workers may not have the process overview the project manager has in mind. Therefore
communication is essential between project manager and workers to make sure the work is
performed according to expectations.
Figure 29 Problem tree Source: (Guide to the logical framework approach)

MASTER THESIS IRIS ENGHIS
4TH
SEM. MANAGEMENT IN THE BUILDING INDUSTRY (MSC)
48 AAU- Sofiendalsvej 11 9000 Aalborg
Autumn 2015
5.5.2.5. OBJECTIVE ANALYSIS
Within objective analysis, the negative situations are
converted into solutions, also called “positive
achievements”. The formulation of positive
achievements must be desirable by the stakeholders
involved in the project and of course achievable. It
must be assessed how achievable the objectives are,
and generally if there are too many objectives there
must be made a prioritization of which are of high
importance and which are of less importance. Only
objectives of high importance should be considered
according to a preference ranking. Furthermore, the
objective tree will provide an idea of the desired
future situation that the company/project could
achieve. In figure 30 an example of Objective tree is
shown.
Objective tree analysis can be further used in contouring the idea for the result chain. It can be seen
in figure 31 that in order to perform activities, resources as the inputs such as: time, funds and
labour are needed. This means that planning efficiently resources there will be enough time, funds
and acknowledged workers. To do so, performance methods can be used. Some of them have been
already mentioned and in use, such as: the critical path methods, earned value management, but
also: risk analysis as mentioned in 6.1.3.2, milestone trend charts and buffer management chards.
Furthermore, regarding methods on using resources at their maximum capacity, the heuristic
methods can be suggested for resource constrained project scheduling. This method is very useful in
case activities require the same resources and cannot be scheduled in parallel. The result of a
heuristic method will provide the creation of a model on how resources can be best planned, based
on experience and practice of the project manager. It is relatively easy to implement and if activities
are prioritised right than an optimal schedule can be produced. Using this method, schedules can be
optimised as follow:
Figure 30 Objective tree Source: (Guide to the logical framework approach)
Figure 31 Resource constrained scheduling Source: (PM Knowledge Center)

MASTER THESIS IRIS ENGHIS
4TH
SEM. MANAGEMENT IN THE BUILDING INDUSTRY (MSC)
49 AAU- Sofiendalsvej 11 9000 Aalborg
Autumn 2015
Continuing with the objective tree at result level, assuming with the right methods resources will be
used efficiently then the project will be delivered on time. Furthermore, the construction will
receive the subsidised funds only if it complies with the demands and key performance indicators,
therefore the main purpose is to deliver within the quality agreed.
Assuming everything goes as planned, this will contribute to the overall goal to make Støvring
Bytorv an attractive place to live and to become a city centre as part of the agreement. Assuming
the project is successful it will contribute in making Støvring as the city a better settlement with a
great offer of housing.
Figure 32 Objective tree

MASTER THESIS IRIS ENGHIS
4TH
SEM. MANAGEMENT IN THE BUILDING INDUSTRY (MSC)
50 AAU- Sofiendalsvej 11 9000 Aalborg
Autumn 2015
5.5.3. STAGE 3 FORMULATION
Through formulation, the relevance and feasibility of the project should be confirmed and a detailed
plan should be prepared. Stakeholder’s involvement still needs to actively participate and further
prepare and approve the LFA Matrix (log frame).
In this stage, it is used the information gathered in stage 2 and a Logical Framework Matrix (log
frame) can be developed where objectives, assumptions, indicators and evidence are listed. From
activity schedule, activities can be then budgeted in Implementation Chapter.
As it can be seen in the figure below, all the information regarding to the SITUATION ANALYSIS
has been already discussed regarding: stakeholder analysis, problem analysis, lessons learned so
far and a strategy selection. Regarding the PROJEC DESCRIPTION overal objective, purpose,
target group, location and duration , results, activities, resources and costs will be described in
chapter 5.5.3.3 Formulating Objectives
Figure 33 Information elements produced by end of formulation Source: Project Cycle Management Guidelines, Volume 1, European Commission - Europe Aid Cooperation Office, 2004, p. 38

MASTER THESIS IRIS ENGHIS
4TH
SEM. MANAGEMENT IN THE BUILDING INDUSTRY (MSC)
51 AAU- Sofiendalsvej 11 9000 Aalborg
Autumn 2015
5.5.3.1. LFA MATRIX (LOGFRAME)
Log frames have been already mentioned by now, and represent the output of all the analysis
performed in this report by now. The log frame is basically a matrix where the summary of analysis
stage at activity level is presented and further analysed. Log frames can be used throughout project
life cycle to track progress and if necessary re adapted to the changing situations. This makes log
frames to be a planning and monitoring tool.
As seen in figure 34 the log frame consists of four columns summarizing the key elements of the
project: overall objective, purpose, results and activities; this is the vertical logic which represents
what the project intends to do through the causality relationship while the horizontal logic refers to
measuring effects and resources through indicators and sources of verification.
Each of these columns will be described and completed in the order presented:
1. Intervention logic (result chain)
2. The project environment and key external factors contributing to the project success:
Assumptions
3. How the project is going to be monitored and evaluated: Indicators and Sources of
verification
Intervention logic: Through the intervention logic the strategy of the project can be deducted as it
clarifies what are the means (preconditions) through which results are achieved. A description of
program logic (result chain) is needed in order to formulate the overall objectives, purpose, results
and what are the activities through which it will be achieved. As it can be seen in the figure above,
the intervention logic is the first column of the log frame.
Program logic in figure 35, is represented through a result chain of inputs, activities, outputs and
outcomes, shown either as a table or series of results with activities alongside. Alternatives to
program logic are as outcomes hierarchy, realist matrix and triple column.
Figure 34 Log frame Source: (Guide to the logical framework approach, 2011)

MASTER THESIS IRIS ENGHIS
4TH
SEM. MANAGEMENT IN THE BUILDING INDUSTRY (MSC)
52 AAU- Sofiendalsvej 11 9000 Aalborg
Autumn 2015
Inputs are referred to financial, human and material as the resources used for development.
Activities are the actions taken through which inputs are used to produce certain outputs.
Outputs are the products, capital and services that result from the development process.
These are the short term outcomes that are the result of the logical consequence of project
activities, as seen in figure x program logic.
Outcomes (objectives) are the medium term results that are the logical consequence of
achieving a combination of outputs.
Impact is the long term objectives as the overall objective of the project meant to contribute
in the long run. Long term objectives are expressed in verifiable terms, represent a sufficient
justification of the project and are clearly written. (Develop Programme Theory)
5.5.3.2. STEPS IN CREATING INTERVENTION LOGIC
The program logic should start with defining the overall
objective, as it can be seen in the figure below: “Income of
poor farmers increase”. The activities that contribute to the
overall objective are stated as: “Building capacity of
associations to advocate about farmer’s needs” and
“Training retailers to give quality information on cultivation
practice to farmers”. Activities contribute to the overall
objective but short, medium and intermediate objectives
must be defined as causality relation. After these are defined
as seen in figure below, it can be formulated objectives.
Finally, medium term objectives should bring value to the
overall goal, reflecting on overall goal achievement.
Inputs: If inputs are in the right time, quantity and quality
than what are the activities?
Activities: If activities are implemented within schedule and
budget than what are the outputs?
Outputs: If outputs are leading to the expected results than
what are the outcomes?
Figure 35 Result Chain Source (Spreckley, 2nd edition 2009, s. 3)
Figure 36 Result Chain example Source : (Kesler, 2015)

MASTER THESIS IRIS ENGHIS
4TH
SEM. MANAGEMENT IN THE BUILDING INDUSTRY (MSC)
53 AAU- Sofiendalsvej 11 9000 Aalborg
Autumn 2015
Outcomes: Are outcomes leading to achievement? How do beneficiaries feel about the work?
5.5.3.3. FORMULATING OBJECTIVES
According to RBM requirements, objectives must be result driven and are often referred to as
SMART. SMART is a criterion categorized by Peter Drucker’s and each letter means:
- S - Specific must describe a future condition
- M - Measurable indicators to assess if results have been achieved
- A - Achievable results must be in the capacity of the contributors to be achieved
- R - Relevant: must make a contribution within the development framework
- T - Time bound: results have an expected date of accomplishment
Objectives can be classified as short-term, intermediate, or long-term.
Short-term outcome objectives are the initial expected changes after implementing certain
activities or interventions (e.g., changes in knowledge, skills, and attitudes).
Intermediate outcome objectives are those interim results that provide a sense of progress
toward reaching the long-term objectives (e.g., changes in behaviour, norms, and policy).
Long-term objectives are achieved only after the program has been in place for some time
(e.g., changes in mortality, morbidity, quality of life).
(Developing Program Goals and Measurable objectives)
The difference between the outcome and impact is that the impact is about the long term
expectation of what should happen as a result of the program, while the outcome is the manner in
which it will be achieved as an intermediate effect.
Outcome objectives specify the intended effect of the program.
After describing and understanding the result chain, according to the project in Støvring suggestions
can be given. The most important part to look at is intended results. The logic starts by stating the
long term objective, intermediate and short term.
The long term goal can be identified from stakeholder’s analysis. When stating the overall goal is
important to have in mind that is should be used as main point of reference, it should be clearly
written and have sufficient justification for the project. Lastly the overall goal should be expressed
in verifiable terms. As a main point of reference is that the municipality has invested in this project,
Figure 37 Program logic Source: http://evaluationtoolbox.net.au

MASTER THESIS IRIS ENGHIS
4TH
SEM. MANAGEMENT IN THE BUILDING INDUSTRY (MSC)
54 AAU- Sofiendalsvej 11 9000 Aalborg
Autumn 2015
and their interest is to: creating Støvring an attractive place to live. The monitoring and evaluation
system is compulsory for subsidised buildings for this reason to make sure constructions are
delivered within the quality demanded. The method to verify this is by submitting the monitoring
and evaluation KPI’s at the end pf the project for assessment.
From the previous analysis, activities can be formulated according to the objective tree, as these are
the initiatives necessary to achieve the overall goal. These would be using resources at maximum
capacity by monitoring time and budgets closely. If time is monitored and budgets, there are enough
resources left to comply with the desired quality. Monitoring quality is also a necessary activity to
make sure there are no hidden mistakes. A list of activities is included in the Annex D. Documents
relevant to budgets have not been made available.
Having the activities and overall goal stated down, the logic of the result chain can be written down.
The purpose of the activities happening on the construction site for Støvring Bytorv is to deliver the
construction in time, therefore it can be formulated as a short term outcome that:
By 1st August 2016 Apartments will be ready for handing in to end users..
Nordjylland Housing Association benefits of
20 new homes creating Støvring as an
attractive place to live.
Deliver the construction within the quality
imposed by Norjylland Housing Association.
By 1st August 2016 Apartments will be ready
for handing in to end users.
See Master Time schedule Annex D.
Human resources time and finances
Figure 38 Result Chain Source: Invalid source specified.

MASTER THESIS IRIS ENGHIS
4TH
SEM. MANAGEMENT IN THE BUILDING INDUSTRY (MSC)
55 AAU- Sofiendalsvej 11 9000 Aalborg
Autumn 2015
5.5.3.4. FORMULATING ASSUMPTIONS
Assumptions are external factors that influence the success or failure of the project. External
factors need to be listed down in the assumptions column and have to be formulated in a way to
reflect how these impact the long term sustainability of benefits that are outside of control.
Assumptions can be crisis related, institutional, social, economic and technical nature. Assumptions
and risks mean the same but the way those terms are put in words describe different views;
assumptions are therefore a positive way to describe a risk, thus the conditions that need to be met if
the project has to go ahead and vice versa, a risk is a negative way of describing an assumption.
Assessing risks may lead to subjectivity but
there is no other way when deciding which is the
likelihood of these external factors to occurr.
Assumptions that do not constrain the project
with regard to its success can be categorized as
constraints for the overall strategy.
Assumptions must be probable and manageable.
Assumptions that can be solved should get a
solutions before any failure happens. To write
down assumptions, the starting point is at the
bottom of the matrix and going upwards.
Figure 39 Assessing risks Source: (Programme/project management: The results based approach)
Figure 40 The relationship between assumptions and objective hierarchy Source: (Guide to the logical framework approach, 2011)
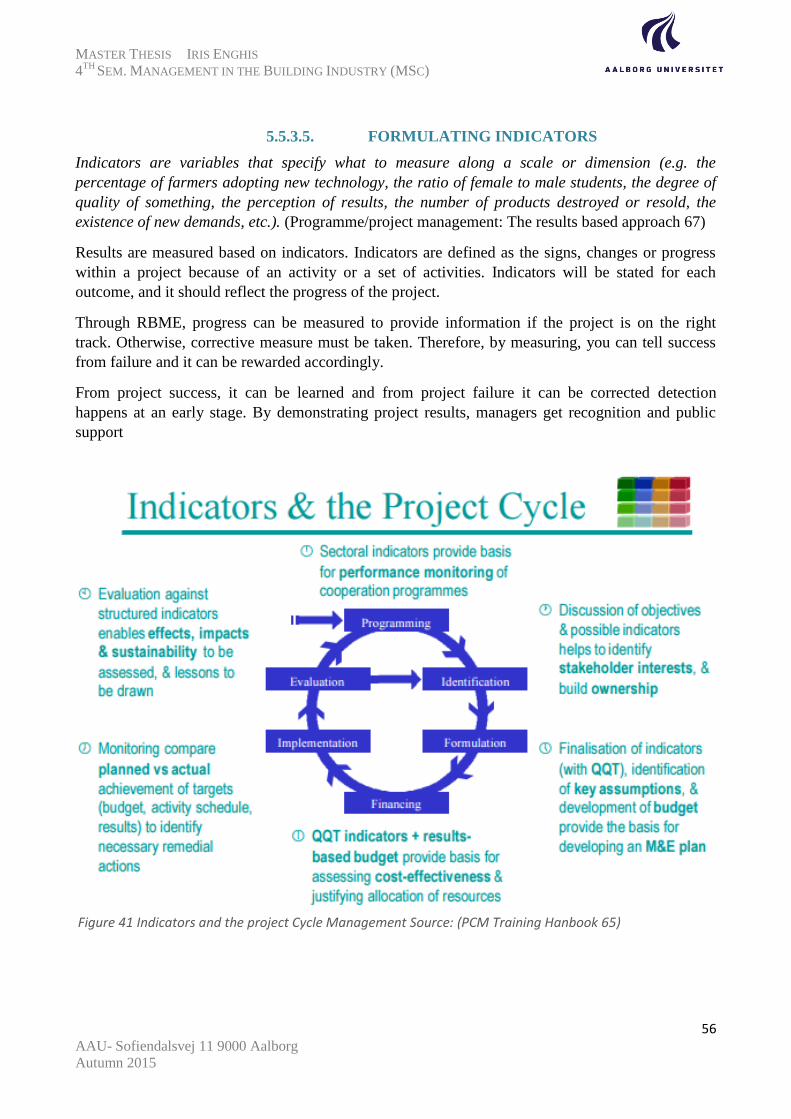
MASTER THESIS IRIS ENGHIS
4TH
SEM. MANAGEMENT IN THE BUILDING INDUSTRY (MSC)
56 AAU- Sofiendalsvej 11 9000 Aalborg
Autumn 2015
5.5.3.5. FORMULATING INDICATORS
Indicators are variables that specify what to measure along a scale or dimension (e.g. the
percentage of farmers adopting new technology, the ratio of female to male students, the degree of
quality of something, the perception of results, the number of products destroyed or resold, the
existence of new demands, etc.). (Programme/project management: The results based approach 67)
Results are measured based on indicators. Indicators are defined as the signs, changes or progress
within a project because of an activity or a set of activities. Indicators will be stated for each
outcome, and it should reflect the progress of the project.
Through RBME, progress can be measured to provide information if the project is on the right
track. Otherwise, corrective measure must be taken. Therefore, by measuring, you can tell success
from failure and it can be rewarded accordingly.
From project success, it can be learned and from project failure it can be corrected detection
happens at an early stage. By demonstrating project results, managers get recognition and public
support
Figure 41 Indicators and the project Cycle Management Source: (PCM Training Hanbook 65)

MASTER THESIS IRIS ENGHIS
4TH
SEM. MANAGEMENT IN THE BUILDING INDUSTRY (MSC)
57 AAU- Sofiendalsvej 11 9000 Aalborg
Autumn 2015
5.5.3.6. SOURCES OF VERIFICATION (SOV)
Together with indicators, sources of verification are specified at the same time. If any of the stated
indicators cannot be verified than it should be replaced in the matrix by other verifiable indicators.
Sources of verification should specify: what is the information available (for example surveys) also
where, or in what form the information can be collected (for example progress reports) who is
collecting the information and how regularly is this done.
5.5.3.7. ACTIVITY SCHEDULE
Activity Schedules are used to analyse and present graphically project activities. Through activity
schedules it can be allocated management responsibilities by dividing tasks into their logical
sequence with an expected duration and dependency relationship with other activities.
Activities can be inserted in the log frame after objectives, indicators and assumptions have been
defined so it is more logical to define activities that are only connected to the overall objective.
Scheduling of activities can be done by use of Gantt chart and there has to be specifies:
Who does what
When it will happen
What types of inputs are needed to achieve completion of activity
What contribution will it make to the outputs/outcomes/impact.
To bear in mind, activity schedules are a flexible document that can be changed according to
circumstances; therefore a continuous monitoring of the progress must be done according to the
activity list and if changes occur it must be updated. Together with the activity list, resource
schedule and budgets must be linked.
5.5.3.8. LFA MATRIX
After defining all the elements in the logical framework matrix and applying the theory to the case
study of this paperwork, a suggestion is given for Støvring Bytorv stakeholders.
LOGIC
INTERVENTION
PERFORMANCE
INDICATORS
SOURCES OF
VERIFICATION
RISKS AND
ASSUMPTIONS
OVERALL
OBJECTIVE:
Nordjylland Housing
Association benefits of
20 new homes creating
Støvring as an
attractive place to live.
Number of homes
increased on Støvring
Number of satisfied
end users
Assessment of surveys
PURPOSE:
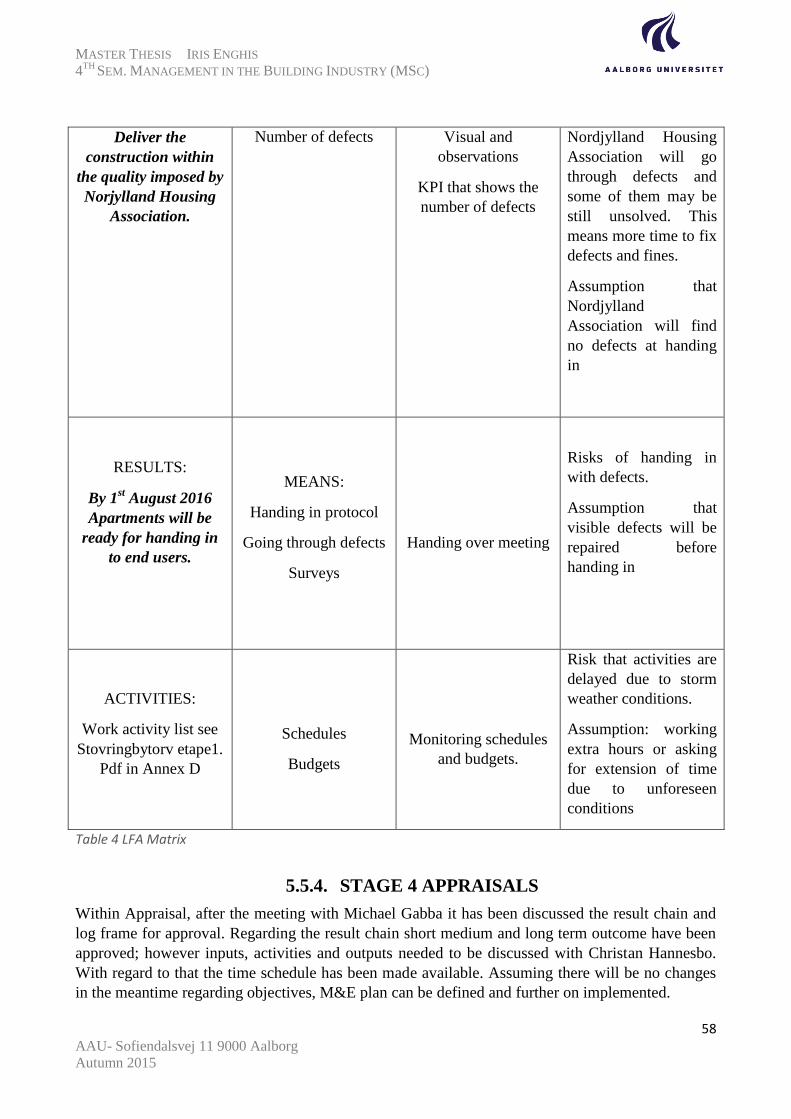
MASTER THESIS IRIS ENGHIS
4TH
SEM. MANAGEMENT IN THE BUILDING INDUSTRY (MSC)
58 AAU- Sofiendalsvej 11 9000 Aalborg
Autumn 2015
Deliver the
construction within
the quality imposed by
Norjylland Housing
Association.
Number of defects Visual and
observations
KPI that shows the
number of defects
Nordjylland Housing
Association will go
through defects and
some of them may be
still unsolved. This
means more time to fix
defects and fines.
Assumption that
Nordjylland
Association will find
no defects at handing
in
RESULTS:
By 1st August 2016
Apartments will be
ready for handing in
to end users.
MEANS:
Handing in protocol
Going through defects
Surveys
Handing over meeting
Risks of handing in
with defects.
Assumption that
visible defects will be
repaired before
handing in
ACTIVITIES:
Work activity list see
Stovringbytorv etape1.
Pdf in Annex D
Schedules
Budgets
Monitoring schedules
and budgets.
Risk that activities are
delayed due to storm
weather conditions.
Assumption: working
extra hours or asking
for extension of time
due to unforeseen
conditions
Table 4 LFA Matrix
5.5.4. STAGE 4 APPRAISALS
Within Appraisal, after the meeting with Michael Gabba it has been discussed the result chain and
log frame for approval. Regarding the result chain short medium and long term outcome have been
approved; however inputs, activities and outputs needed to be discussed with Christan Hannesbo.
With regard to that the time schedule has been made available. Assuming there will be no changes
in the meantime regarding objectives, M&E plan can be defined and further on implemented.
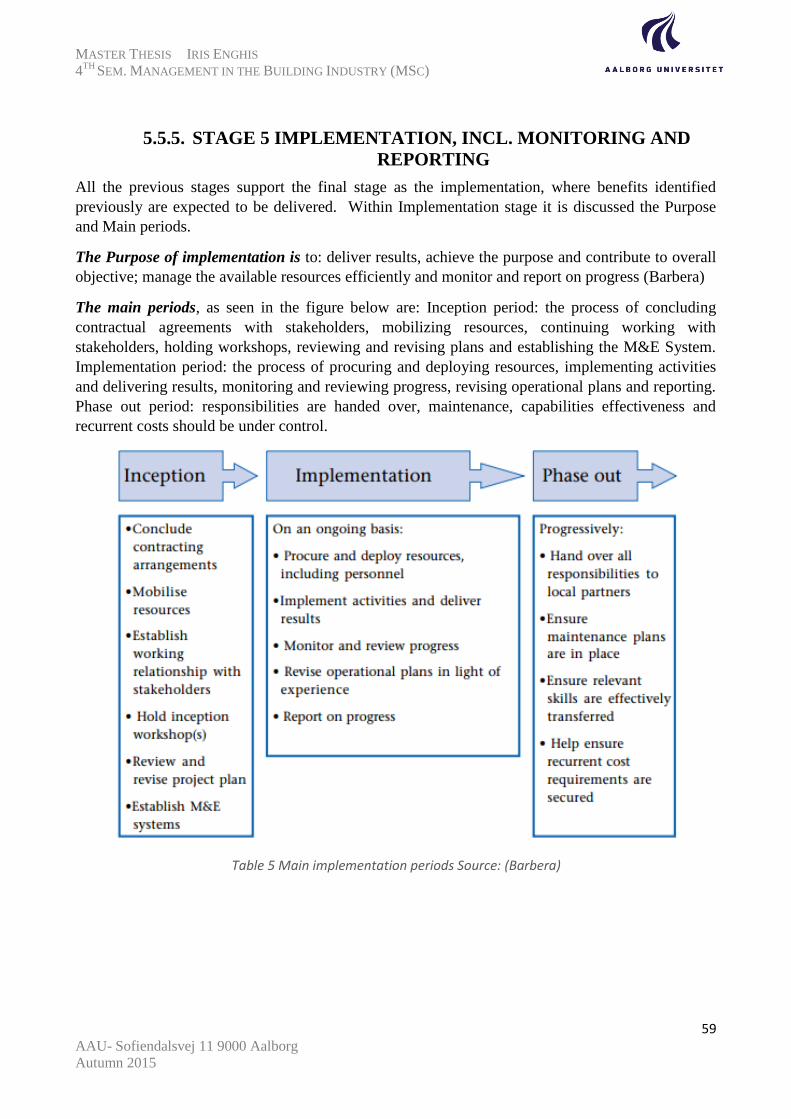
MASTER THESIS IRIS ENGHIS
4TH
SEM. MANAGEMENT IN THE BUILDING INDUSTRY (MSC)
59 AAU- Sofiendalsvej 11 9000 Aalborg
Autumn 2015
5.5.5. STAGE 5 IMPLEMENTATION, INCL. MONITORING AND
REPORTING
All the previous stages support the final stage as the implementation, where benefits identified
previously are expected to be delivered. Within Implementation stage it is discussed the Purpose
and Main periods.
The Purpose of implementation is to: deliver results, achieve the purpose and contribute to overall
objective; manage the available resources efficiently and monitor and report on progress (Barbera)
The main periods, as seen in the figure below are: Inception period: the process of concluding
contractual agreements with stakeholders, mobilizing resources, continuing working with
stakeholders, holding workshops, reviewing and revising plans and establishing the M&E System.
Implementation period: the process of procuring and deploying resources, implementing activities
and delivering results, monitoring and reviewing progress, revising operational plans and reporting.
Phase out period: responsibilities are handed over, maintenance, capabilities effectiveness and
recurrent costs should be under control.
Table 5 Main implementation periods Source: (Barbera)

MASTER THESIS IRIS ENGHIS
4TH
SEM. MANAGEMENT IN THE BUILDING INDUSTRY (MSC)
60 AAU- Sofiendalsvej 11 9000 Aalborg
Autumn 2015
6. IMPLEMENTATION
Monitoring and Evaluation is an
ongoing process, which functions as
basis for decision making by
monitoring: activities, budgets,
schedules, outputs and assumptions
stakeholder’s response and the
projects contribution towards long
term outcomes. It is therefore
important to manage the available
resources in order to deliver results,
achieve the purpose and contribute to
the overall objective of the project.
Monitoring and evaluation is done
periodically. Evaluation is done also at
the end of the project and mid-term
evaluation.
By implementing the Monitoring and Evaluation system, the project will achieve its intended
objectives formulated in 5.5.3.3 Chapter and resources will be used at their maximum capacity,
through the application of suggested performance methods. The Monitoring and Evaluation system
will assess the project impacts on target communities which is also part of the overall objective to
have a positive effect on the satisfaction of end users. There will be assessed also the effectiveness
of project outputs in producing short term and long term impacts and to which extent these impacts
can be attributed to the effects of the project.
The results obtained from the Monitoring and Evaluation system will help extract lessons and best
practices for the design of future project. It will also provide guidelines if necessary to modify the
project design and adequate data to evaluate program impact.
The criteria’s for assessing the quality of a Monitoring and evaluation system is its utility,
feasibility, propriety and accuracy.
Utility refers on how the practical information will serve its intended users.
Feasibility refers to how realistic are the methods, sequences, timing and procedures.
Propriety is about being legal, ethical and having the best intentions for those affected by
results.
Accuracy refers to how the outputs reveal and convey technically adequate information.
(Introduction to M&E using LFA)
As a next step within implementation, it is recommended to gather all the information in analysis
stage and develop a M&E Plan. The following chapter describes the content of M&E Plan.
Figure 42 Implementation a learning process Source: (PCM Training Hanbook)

MASTER THESIS IRIS ENGHIS
4TH
SEM. MANAGEMENT IN THE BUILDING INDUSTRY (MSC)
61 AAU- Sofiendalsvej 11 9000 Aalborg
Autumn 2015
6.1. DEVELOPING THE M&E PLAN
Monitoring and evaluation plan is made to contain all the information gathered in analysis stage.
This document is called either M&E Plan, M&E Procedures, M&E Standard operating Procedures
(SOP) or M&E System Documentation. The name used in this paperwork will be M&E Plan,
however no matter the name the content is mostly the same. The contents viewed as steps in the
M&E Plan are:
1. Purpose and scope
2. Planning for information gathering and organisation
3. Planning for critical process and data analysis
4. Planning for quality communication and reporting
5. Planning for necessary conditions and capacity
6. Prepare the M&E budget
It is important to understand the plan before applying it. Some of the key reminders for M&E steps
are that these are interconnected and even if in this paperwork are written as separate steps, in
practice these are inter related. Monitoring and evaluation are integral, as data collected depends on
data reporting and are planned at the same time.
Planning of M&E should begin immediately after the project design phase. By preparing it early in
the project phases, there will be time to allocate resources before project implementation.
The M&E system builds itself on the initial assessment, based upon the short, medium and long
term objectives also the indicators identified in the log frame, and expectations of the stakeholders
and practical considerations such as time and budget.
As already mentioned, stakeholder’s interests play a key role in determining the scope of M&E,
therefore particular attention should be directed to their expectations throughout the M&E process.
Another important aspect mentioned also in the beginning of this report is the dynamicity of the
M&E system. This means there needs to be a constant flexibility and adaptability, if necessary of
the M&E Plan throughout the project cycle. If major changes that affect the project occurs than
there will be a change also in the objectives which must be addressed. Arising problems and
concerns may disrupt the well-functioning of the project. Actually, not just the project is in need for
monitoring but also the M&E plan itself needs to be tracked for improvements.
As it has been stated in the delimitation, monitoring and evaluation should remain focused on the
quality aspect. Investigating several issues will end up in adding costs and waste of time, as it takes
resources to collect, manage and analyse data for recording. Extra information will only distract the
attention from the relevant data, which is also one of the challenges in the RBME, referring to
collecting irrelevant information.
MASTER THESIS IRIS ENGHIS
4TH
SEM. MANAGEMENT IN THE BUILDING INDUSTRY (MSC)
62 AAU- Sofiendalsvej 11 9000 Aalborg
Autumn 2015
6.1.1. PURPOSE AND SCOPE OF M&E PLAN
Within the purpose it should be described why Monitoring and evaluation is done, who prepares it
and which is the audience and why. It answers the question “Why do we need M&E and how
comprehensive should it be?” There will be discussed: the log frame review, the stakeholders
expectations, how information is gathered and organised, developing an M&E table, assessing
availability of secondary data, the balance between quantitative and qualitative data, triangulation,
sampling requirements, surveys, data collection tools, the feedback system and project review
mechanism.
Key steps in Identifying the purpose and scope of M&E System.
Review the project operational design (log frame)
Identify Key stakeholders Informational needs and expectations
Identify any M&E requirements
Scope of major M&E events and functions
There is the need to make a M&E Plan, because as already mentioned in Denmark it is a
governmental order to undertake Monitoring and Evaluation of construction projects and it is a
specified demand by the client in the tender documents to deliver the project within the agreed
quality. M&E Plan is prepared by an external party and needs to responds to the kpi’s imposed by
Byggeriets Evaluerings Center. Furthermore, the advisor and total contractor will be assessed based
on the performance of the project delivered.
6.1.1.1. REVIEW THE PROJECT OPERATIONAL DESIGN
(LOGFRAME)
M&E system is based upon the log frame. Again, the log frame serves as a summary of the project’s
operational design given by the problem analysis. The log frame should reflect the needs of the
project in the long term. For emergency situation there will be a different log frame.
Furthermore, log frames must be checked for logic and relevance. If an outside evaluator is
employed he/she might not be acquainted with the realities and changing circumstances on the
construction site. If there are rapid changes in a short time it is important to consult again
stakeholders to make also the necessary changes in the log frame.
It is important to use standard indicators in the log frames that are universally recognised, well
developed and tested. Industry recognised indicators contribute to credibility and legitimacy across
stakeholders and can be useful in combination with indicators specifically for the local context. The
types of industry standard indicators are exemplified by the IFRC as:
Industry indicators to be used for cross industries
Sector specific on thematic indicators
Cluster indicators, developed by UN Clusters to asses’ achievements of overall focus area of
the cluster. These are particularly useful where outcomes and impact achieved cannot be
attributed to the work of one organization, but rather to the collective efforts of multiple
organizations in a cluster or across clusters.

MASTER THESIS IRIS ENGHIS
4TH
SEM. MANAGEMENT IN THE BUILDING INDUSTRY (MSC)
63 AAU- Sofiendalsvej 11 9000 Aalborg
Autumn 2015
Organisation specific indicators which have been developed for use in specific operations or
for organizational reporting against its strategy.
See the 6.3.1.1 Construction Rating, where are indicated the indicators for contractor and advisor
assessment on quality of the work delivered.
6.1.1.2. IDENTIFY KEY STAKEHOLDERS INFORMATIONAL NEEDS
AND EXPECTATIONS
As mentioned identifying stakeholders needs and expectations are crucial, and start through a
stakeholder assessment during the planning stage of the project. See 5.5.2.3 Stakeholder Analysis.
6.1.1.3. IDENTIFY ANY M&E REQUIREMENTS
Requirements refer to guidelines, governmental laws and regulations and internationally agreed
standards. In Denmark it is stated:
“On 1 January 2004 it was introduced the requirements for key figures for the subsidised buildings
with Executive Order 1135. The Order has since been replaced by "Order no. 1469 of 16 December
2009 on key figures for government buildings, etc."
Here it appears that contractors and consultants, who participate in tenders within the country,
must submit data for previous construction projects to the client. The developer is obliged to impose
this requirement.
It also appears that the contractors and consultants through an evaluator must have calculated the
ratio of the precise construction. The developer is obliged to impose this requirement.
In addition, the developer via an evaluator needs also to calculate the ratio of the pecise
construction.”
6.1.1.4. SCOPE OF MAJOR M&E EVENTS AND FUNCTIONS
In connection to monitoring quality, the core purpose of the M&E system for Støvring Bytorv is to
provide transparency of quality procedures during construction process to document the
information needed for stakeholders to make sure quality is respected accordingly.
Audience: It will be also made a distinction between the client’s advisor responsibilities regarding
quality and the turnkey contractor responsibilities and their procedures. The M&E System will
provide regular reports on project progress and documentation with regard to quality for the client,
who is the external stakeholder with the greatest interest.

MASTER THESIS IRIS ENGHIS
4TH
SEM. MANAGEMENT IN THE BUILDING INDUSTRY (MSC)
64 AAU- Sofiendalsvej 11 9000 Aalborg
Autumn 2015
6.1.2. PLANNING INFORMATION GATHERING AND
ORGANISATION
Planning information gathering and the way it is organised - refers to collecting data. Collecting
data is essential as it will help gain an understanding of the problem which can be addressed
properly. Gathering data has been done from the beginning of the project until this stage,
throughout the life cycle of the project. Adjustments should be made most likely at the end of the
project cycle, when information can be assed and checked according to what is working and what is
not. Adjustments are made to improve results.
“Data is a term given to raw facts or figures before they have been processed and analysed.
Information refers to data that has been processed and analysed for reporting and use”. (UNDP)
Within planning information gathering and organisation it is included:
1. Develop an M&E plan table
2. Assess the availability of secondary data
3. Determine the balance of quantitative and qualitative data
4. Triangulate data collection sources and methods
5. Determine sampling requirements
6. Prepare for any surveys
7. Establish stakeholder complaints and feedback mechanisms
8. Establish project/programme staff/volunteer review mechanisms
9. Plan for data management
10. Use a risk log (table) (UNDP)
Data collection is one of the most expensive aspects of Monitoring and Evaluation plan. However,
by reducing the amount of collected data also costs can be reduced, according to Bamberger et
al.2006. It is important therefore to assess if the information is necessary and if the secondary data
is used it must be taken in account its reliability. If surveys are used, it is indicated to reduce the
amount of questions in order to reduce survey fatigue among respondents.
In 1.3 Research Methodology, more explanation is given on how data has been collected for this
investigations and what methods have been used to get the results regarding this research project.
6.1.2.1. DEVELOP AN M&E PLAN TABLE
The M&E Plan is a table where is included key indicators information about the data, sources,
methods and timing of data collection. An example of M&E Plan Table is offered by IFRC,
attached in Appendix 7. The plan is however completed before implementation as preliminary to
the log frame to ensure that indicators, scope of work, data collection, analysis and reporting are
realistic. Question that are raised are if Monitoring and evaluation plans worth the time and effort.
There are actually several studies reports that confirm developing M&E Plans have multiple
benefits due to the fact that data collected will be more efficient and reliable. Also, by making
evidence of what is measured, project managers have more control over the implementation of the

MASTER THESIS IRIS ENGHIS
4TH
SEM. MANAGEMENT IN THE BUILDING INDUSTRY (MSC)
65 AAU- Sofiendalsvej 11 9000 Aalborg
Autumn 2015
program. It is actually much more costly to manage poor quality data than making efforts to plan for
reliable collection.
6.1.2.2. ASSESS THE AVAILABILITY OF SECONDARY DATA
Secondary data, if available must be assessed if is really needed within monitoring and evaluation
of the project in cause. Secondary data must be relevant and reliable despite its availability. The
term of biased and unbiased refer to subjective and objective characteristics of the information.
6.1.2.3. DETERMINE THE BALANCE OF QUANTITATIVE AND
QUALITATIVE DATA
Credibility of qualitative data tends to be lower due to personal observations and judgements, but on
the other hand quantitative data may be costly and exclude explanations of why a certain situation
happened and how people feel about it. A mixed method of quantitative and qualitative data should
be used as both are prone to have subjective and objective based characteristics.
6.1.2.4. TRIANGULATE DATA COLLECTION SOURCES AND
METHODS
Different methods of verifying data such as: interviews, observations and examination refer to
triangulation to better ensure data is valid, reliable and complete. Triangulation does not refer to just
three sources of collecting data, it just emphasize the idea there needs to be more sources to collect
it for verification.
6.1.2.5. DETERMINE SAMPLING REQUIREMENTS
Through sampling generalizations can be made if the of collection data does not have the capability
to measure the whole system. Through sampling time and money are saved. However the scale of
this project is not that large in order for sampling methods to be used. The sampling method is
appropriate for example when making statistics about the population and analysing only a subgroup
to make generalisations. Sampling together with statistics is recommended to be performed by an
expert.
6.1.2.6. PREPARE FOR SURVEYS
Surveys are classified as semi- structured or structured. Semi structured refer to open question that
accept all kind of answers but using this kind of method supposes more work in extracting
information. The structured surveys, ask fixed questions such as answers with yes or no, false or
true and multiple choices.
The timing and functionality classify surveys as descriptive and comparative. Descriptive surveys
obtain data at a single point of time without making comparisons while comparative surveys takes
data at different points in time to compare it. Depending on the type of research performed, the right
type of survey must be used to obtain the right information.

MASTER THESIS IRIS ENGHIS
4TH
SEM. MANAGEMENT IN THE BUILDING INDUSTRY (MSC)
66 AAU- Sofiendalsvej 11 9000 Aalborg
Autumn 2015
6.1.2.7. PREPARE FOR SPECIFIC DATA COLLECTION
METHODS/TOOLS
The data collection tools must be testes before in order to detect inadequate questions; also the tools
must be linguistically accurate, compatible with the culture of the organisation and must address
ethical concerns.
6.1.2.8. ESTABLISH STAKEHOLDER COMPLAINT AND FEEDBACK
SYSTEM ANNEX 11
The purpose of establishing a stakeholder complaint and feedback system is to give the right for the
beneficiaries to express their opinion on the performance of the project/programme. The same is
with stakeholders, project/programme staff, partners and other parties involved in the project to file
complaints and provide feedback. It is recommended that feedback is inclined to be positive as a
result to give the chance to express opinions on lessons learned and reflections. Complaints and
feedback systems can written or oral, directly or through third parties, individual or through groups,
personally or anonymously.
IFRC Guide for Stakeholder Complaints and Feedback identifies six main steps for the feedback
and complaint mechanism:
“Agree on the purpose of the complaints and feedback mechanism – this helps to build
understanding and ownership among those who will use it.
Agree on what constitutes valid feedback, especially a complaint – this helps to give
stakeholders a sense of where and what kind of action is likely to be required in future
Agree on the stakeholders targeted by the complaints and feedback mechanism – this helps
to tailor that mechanism to its audience.
Agree on the most appropriate channel for communicating complaints and feedback – this
checks that the mechanism is culturally compatible and appropriate, so it is more likely to
get used if needed.
Agree on a standard process to handle complaints and feedback – in addition to
stakeholders providing complaints and feedback, it is important that those expected to
review and respond also understand and uphold the process.
Sensitize stakeholders about the complaints and feedback mechanism – this is a critical step
because how the mechanism is presented to intended users will largely shape how receptive
and likely they are to use it” (UNDP)
6.1.2.9. ESTABLISH PROJECT REVIEW MECHANISM
Assessing the project implementation and performance are the basis for monitoring and
management. There need to be periodic reviews. Tools must be established to track and review time
management and performance. Among the tools, individual time resourcing sheet is very useful to
track the time required for each individual to complete a task. Actual time is measured against
planned time enabling a better assessment of the project progress. An example is included in Annex

MASTER THESIS IRIS ENGHIS
4TH
SEM. MANAGEMENT IN THE BUILDING INDUSTRY (MSC)
67 AAU- Sofiendalsvej 11 9000 Aalborg
Autumn 2015
Moreover Project Team Time Sheet of key activities and deliverables is a visual tool for teams to
see in which activities they are engaged, when and how much time is required to complete the
activities.
6.1.3. PLAN FOR DATA MANAGEMENT
Data Management refers to how data is stored, managed and the access to M&E data. If not done
properly there is a waste of resources but will also affect the quality and reliability of data. Data
management should follow the organisations established policies and requirements. Data
management refers to the format on how is recorded stored and reported primarily as: numerical,
descriptive, visual and audio. Data is typically organised: chronologically, by location, by content
or focus area and by the format.
Moreover, data should be available for users and secured from other unauthorised users through
access (how permission is granted), searches (how data is searched and found) through archival
(how it is stored for future use) and dissemination (how it is shared with others). For the case of
Støvring Bytorv data accessibility is done through Byggeweb membership.
Data security and legalities refers to protection rights as well as legal requirements with
governments, donors and other parties.
IT, information technology refers to digital storing and use of data, especially in the construction
sector where is a condition due to large volume of data and the advantage of sharing the information
with others.
Data quality control is very important in order so there are no mistakes and old versions are
removed. Version control is a simple way to track documents changes over time. Furthermore,
there needs to be assigned data responsibility and accountability.
Within planning for data management it will be discussed: the use of a indicator tracking table and a
risk log table.
6.1.3.1. USE AN INDICATOR TRACKING TABLE
“An ITT is an important data management tool for recording and monitoring indicator
performance to inform project/programme implementation and management. It differs from an
M&E plan because while the M&E plan prepares the project/ programme for data collection on the
indicators, the ITT is where the ongoing measurement of the indicators is recorded.” (UNDP)
The ITT is composed of the project background information, project indicators and log frame
indicators. ITT most important characteristic is variance and targets.
“Variance is the difference between identified targets and actual results – the percentage of
target reached. Variance encourages critical analysis and reporting on project performance.”
(Guide)
Variance that is higher than 10% needs to be explained in the project report. The percentage of
targets reached determines the variance. Setting targets ensures the project has expected realistic

MASTER THESIS IRIS ENGHIS
4TH
SEM. MANAGEMENT IN THE BUILDING INDUSTRY (MSC)
68 AAU- Sofiendalsvej 11 9000 Aalborg
Autumn 2015
results, resources can be planned accordingly, progress can be tracked and reported against the
targets (variance) and decision can be based upon. Even though there is a challenge in setting
targets, due to the fact that targets are difficult to predict and project teams are afraid that they may
not accomplish them.
6.1.3.2. USE A RISK LOG TABLE
Risks are also an important factor in the development of the project. Collection of data needs to
collects also the risks in order to be tracked and see what threatens the project. The risks as already
defined in Analysis Chapter are identified together with assumptions in the project log frame.
Besides the already identified risks there can appear also unexpected ones.
Risks must be recorded and furthermore handled. Risks can be as well monitored for its prevention,
where besides tracking it is important to state when it was first reported, its impact and likelihood
and the corrective actions that need to be taken upon and by whom. Noting down that the risk is
closed refers that is no longer a risk.
An example of Risk table has been provided by Michael Gabba with regard to the project
Psychiatric Hospital in Slagelse. The document is attached in Annex A and describes the type of
risks such as: strategical, financial, juridical, organisational, political, environmental, technical or
regarding time. Regarding all these risks are related to different area of concern within the project,
and risks are graded also as their probability to happen, their consequence and level. Lastly what is
the impact of the risk and how it is managed.
6.1.3 PLANNING CRITICAL PROCESS AND DATA ANALYSIS
After collecting the necessary data the next step is, converting the raw data into usable information.
Data collection and analysis is a continuous process throughout the project cycle. Data analysis is
done to assess the performance against plans and targets, anticipate problems and identify solutions
and best practices for decision making and organisational learning.
Planning the process and reflection is crucial in order to make sure the information collected is
making sense and will be used as a reflection process to make improvements. In the critical
reflection stakeholders are very important, and engaging them in the critical process can be done
through: Quarterly progress review by staff, annual project review involving key stakeholders,
participatory review workshop with stakeholders. Critically reflections can be done also through on-
going discussions. Planning for data analysis is structured in two steps:
Developing a data analysis plans, identifying: purpose of data analysis, frequency of data
analysis, responsibility for data analysis, process for data analysis.
There should be a plan for data analysis as a separate document, or it can be included in the M&E
system. Within the purpose of analysis, data that is relevant to objectives must be taken in
consideration. Analysis of output indicators will be then used to determine activities that occur
according to the schedule and budget every week, month and quarterly. In this way variances and
deviations can be monitored as an ongoing process.

MASTER THESIS IRIS ENGHIS
4TH
SEM. MANAGEMENT IN THE BUILDING INDUSTRY (MSC)
69 AAU- Sofiendalsvej 11 9000 Aalborg
Autumn 2015
Furthermore, there can be performed also analyses for outcome indicators used to determine
intermediate and long term impacts, these are however not as frequent analysed and measured.
Moreover, outcome indicators refer to a wider audience.
There has to be a balance between data collection and data analysis. A common mistake is leaving
to much time for data collection which can lead to data overload and disregard data analysis. It is
important to note that data analysis is not an isolated event at the end of data collection but is an
ongoing process during monitoring and evaluation.
The person who is in charge of data collection should have the responsibility over data analysis,
which in this case is the contractor and client advisor. However, involving multiple stakeholders in
data analysis can result in benefits such as cross checking data accuracy and improving critical
reflection and having different perspectives on the same issue. This will make the M&E plan
accepted and regarded as credible.
Follow the key data analysis stages: Data preparation, data analysis, data validation, data
presentation, recommendations and action planning. Data preparation or data reduction
refers to cleaning, editing, coding and organising the raw quantitative and qualitative data,
and checking for its validity.
Steps in quantitative data preparation are suggested as followed:
Nominating a person and setting a procedure to ensure the quality of data entry
Entering numerical variables in spreadsheet or database
Entering continuous variable data on spreadsheets
Coding and labelling variables
Dealing with missing values
Data cleaning methods.
Regarding the qualitative data, preparation can be done through documentation such as photos,
questionnaires, maps, videos etc. Key points can be then subtracted from this data, and can be
further coded categorised and subcategorised with observations for further analysis. It is a good idea
to organise data already from collection phase.
Data analysis can be descriptive while describing key findings, conditions and circumstances,
focusing on what happened; and interpretive where conclusions can be drawn to provide meaning,
explanation or causal relationship from the findings, focusing on why it has occurred. Both
descriptive and interpreting data are useful in information reporting. Data analysis uses the
following comparisons: planned versus actual comparison, demographic comparison looking at
gender, age or ethnicity, geographical comparison looking at neighbourhood or urban versus rural
and thematic comparison using data to describe donor driven results versus owner driven
intervention. Next stage in data analysis is data validation. It refers to the fact that is necessary to
verify findings. This can be done through additional interviews or focus groups discussions to
clarify findings.
Data presentation is used to highlight key findings and conclusions. Data must be relevant, as to tell
why it is important, furthermore it must be sufficiently demonstrated, clear and simple in order to be

MASTER THESIS IRIS ENGHIS
4TH
SEM. MANAGEMENT IN THE BUILDING INDUSTRY (MSC)
70 AAU- Sofiendalsvej 11 9000 Aalborg
Autumn 2015
easily understood. Unnecessary detail must be avoided and data presentation must be directed
towards the targeted audience. Data can be presented in written description, by use of matrices,
graphs, tables, also mapping, diagrams , casual flow diagrams and many other options, no matter
the case it must be highlighted clearly.
Last stage in data analysis, the recommendations and action planning uses data as evidence for
justification within proposed actions. Recommendations should be specific using the SMART
criteria. Recommendation and action planning need to be used in connection to data analysis,
outputs, findings and conclusions.
Figure 43 Comparing data analysis terms: findings, conclusions, recommendation and action Source: (Societies 58)

MASTER THESIS IRIS ENGHIS
4TH
SEM. MANAGEMENT IN THE BUILDING INDUSTRY (MSC)
71 AAU- Sofiendalsvej 11 9000 Aalborg
Autumn 2015
6.1.4. PLANNING FOR NECESSARY CONDITIONS AND
CAPACITY
What is needed to ensure our M&E system actually works? The results of the Monitoring and
Evaluation system answers to the scope and purpose of this investigation, also formulated in
problem statement.
The answer for the question above regards the insufficient capacity. Capacity refers to human
ability, knowledge and skills but as stated in the problem formulation besides human capital, there
is also the time and financial factor. “An effective M&E system requires capable people to support
it.” (Guide)
For meeting the human capacity is required to:
Acquire the right people
Ensure capacity of good quality by being clear of what are the outcomes, keeping track of
staff performance through regular evaluations, finding a highly qualified person to
coordinate M&E.
For meeting the finances and resources to do the job it is required to:
Tracking Budget and Utilization of Research Funds
Tracking Research Process: The focus is to ensure that the research is carried out as planned
and that the intended milestones are attained along the way. This may require review of
progress reports on research and occasional field verification.
Within this section is important to plan for human resources and capacity. The following questions
that should be answered, are: how does the M&E expertise fulfils the M&E needs of the project?
Moreover, is there M&E support from the organization implementing the project? Is there a
technical unit or individual assigned with M&E responsibilities to advice and support the staff?
What is their availability concerning the project? Do other members and project partners have
experience in M&E?
Answering these questions, the expertise fulfils the M&E demands, as the total contractor was
selected in the tender based on his ability to conduct Monitoring and Evaluation for subsidised
buildings. Byggeriets Evaluering Center provides all the necessary templates that the contractor and
advisor are assessed after and there is a possibility to undertake a voluntary customer satisfaction
evaluation during the project to help improve the project before delivery. There is constantly quality
assurance of the work done by the contractors themselves and eventually checked by Christian
Hannesbo and his assistant. Quality control is documented in Ajour System Program, where the
project manager sets the criteria’s for quality that needs to be monitored, further on it specifies, how
much and how many times it should be checked; it has been further mentioned by the assistant that
the contractors have also their own quality procedures in order to make sure everything is done
accordingly.
Stakeholders must actively participate in all processes and decision making, participation timeline is
presented in the image below, where it can be seen participation is continuum.

MASTER THESIS IRIS ENGHIS
4TH
SEM. MANAGEMENT IN THE BUILDING INDUSTRY (MSC)
72 AAU- Sofiendalsvej 11 9000 Aalborg
Autumn 2015
M&E participation includes the assessment and involvement of local representatives in the
project and identification of indicators, participatory monitoring for electing of key
monitoring indicators, self-evaluations, sharing monitoring and evaluation findings and the
utilisation of feedback.
Among the advantages of participatory Monitoring and Evaluation is that it decentralises power and
empowers the rest of beneficiaries to be active rather than passive. Collaboration is strengthened
and there can be achieved a consensus level between beneficiaries, local staff, partners and senior
management. Accountability is reinforced as there are more perspectives proving the reliability of
the M&E process. Money and time in data collection is reduced compared to using an external
evaluator and relevant information is provided from the field for management decision making to
execute corrective actions.
Regarding potential disadvantages, there may be lack of experienced staff within M&E and training
could be costly. Moreover, the quality of collected data can be jeopardised due to local politics and
projects may not use traditional indicators for reporting findings.
Outside expertise can be requested, and this might be consultants with technical expertise,
objectivity and credibility. Other roles and responsibilities for M&E must be defined for each level
of the M&E system but most important is to decide who has the overall responsibility for
deployment of M&E.
It is important to adhere to a human resources codes and standards. A proposal of code ethics is
provided also in Evaluation steps subchapter. IFRC ME guide stated the following: “Managing
human resources effectively has been identified as a considerable challenge in the humanitarian
sector, where deployments of the right people with the right skills, to the right place at the right
time is critical for successful operations.
To facilitate this, the organization People in Aid’s Code of Good Practice seeks to “improve
agencies’ support and management of their staff and volunteers,” which is critical to the success of
delivering our work. The code has seven principles, around HR strategy, policies and practice;
Figure 44 Participatory continuum

MASTER THESIS IRIS ENGHIS
4TH
SEM. MANAGEMENT IN THE BUILDING INDUSTRY (MSC)
73 AAU- Sofiendalsvej 11 9000 Aalborg
Autumn 2015
monitoring progress against its application seeks to, “enable employers to become clearer about
their responsibilities and accountabilities, and help them become better managers of people, and
therefore better providers of quality assistance.”
The M&E capacity building requirements and opportunities, training could be an option after
responsibilities have been divided. Informal training could be performed at the work place, where
guidance is offered on-the-job for completing checklists and commenting on reports or guidance
and formal training through registration of courses and workshops regarding project design (log
frame), M&E planning, data collection, management, analysis and reporting etc.
6.1.5 PLANNING FOR COMMUNICATION AND REPORTING M&E
FINDINGS
Within communication is important to define who the evaluation audience is and to whom should
the evaluation findings be reported. Evaluation audience and reporting are defined by Valerie
Stetson as:
“Evaluation audience is those individuals who receive information about the evaluation and its
findings. Audiences include, but are not limited to stakeholders, (e.g., staff from other private
voluntary organizations [PVOs] who would benefit from information about a particular program).
Evaluation audience in this context is the client and municipality. The client required in the
tendering offer as quality to be the most important demand and it is also a governmental order to
report findings for subsidised constructions.
“Communicating/communication can be defined as “a linear transmission of information from a
sender, through a channel to a receiver” to “a process by which information is exchanged between
individuals.”
“Reporting is the presentation of information resulting from an evaluative activity. Evidence-based
reporting is an approach to report writing in which statements made about the progress of a project
are supported by verifiable information. Some reports have strong statements about progress made
but little supporting evidence to justify the claim.”
Timely and Frequent Contact From the start, plan for effective communicating and reporting
and assign a budget for these tasks. During the evaluation, report
and communicate on evaluation progress. Towards the end of the
evaluation, communicate and report preliminary evaluation
findings and negotiate recommendations. Frequent and ongoing
communication is one way of showing respect. Negative
evaluation findings are much harder to accept and to use
constructively if they come as a surprise.

MASTER THESIS IRIS ENGHIS
4TH
SEM. MANAGEMENT IN THE BUILDING INDUSTRY (MSC)
74 AAU- Sofiendalsvej 11 9000 Aalborg
Autumn 2015
It’s the Users! All reporting and communicating formats must be tailored to what
the audience needs to know. Evaluators need to understand how
different stakeholder individuals and groups learn and process
information. Avoid producing overly-long, academic-style reports
for busy decision makers or neglecting illiterate or less powerful
evaluation stakeholders.
Variety is the Spice of Life A variety of reporting formats helps ensure understanding. These
range from the final evaluation report and executive summary to
working sessions, and drama or poster sessions. Table 6, below,
provides a more complete list of reporting format options.
Keep Content Clear and
Simple
Written formats such as reports, executive summaries, and fact
sheets must use clear, jargon-free language and include visuals
such as graphs, charts, tables, and illustrations to quickly
communicate information and findings. Quantitative data should
be presented alongside qualitative data. Recommendations should
be prioritized, concrete, specific, and feasible
Table 6 Effective practices of communication Source (Stetson)
As the final stage of M&E system the findings must be shared, corrective measures must be taken
and lessons learned must be documented. The findings should be clear and concise, accurate and
logical and it should be appropriate to its purpose and audience. (Centre)

MASTER THESIS IRIS ENGHIS
4TH
SEM. MANAGEMENT IN THE BUILDING INDUSTRY (MSC)
75 AAU- Sofiendalsvej 11 9000 Aalborg
Autumn 2015
6.1.6 PREPARE M&E BUDGET
Monitoring and evaluation should be prepared early in the project design process to allocate
adequate funds for M&E Activities. The planning of the budget comprises: M&E budget needs;
M&E costs incorporated into the project, reviewing donor budget requirements and contributions
and planning for cost contingency.
Budget items usually include:
Human resources. Budget for staffing, including full-time staff, external consultants,
capacity building/training and other related expenses, e.g. translation, data entry for baseline
surveys, etc.
Capital expenses. Budget for facility costs, office equipment and supplies, any travel and
accommodation, computer hardware and software, printing, publishing and distributing
M&E documents.
Expenses should be documented to prevent unexpected costs there must be considered adding up
costs such as for surveys as an example, development and testing of questionnaires, translation,
training in data collection, data collectors and field supervisors rates, travel and accommodation
costs for administering the survey, data analysis and so on.
Monitor and evaluation costs must be incorporated into the project as, project related costs and
doing different by adding M&E costs as administrative or organisational costs can suggest
inefficiencies in the project. A separate budget fpr M&E may be appropriate.
Monitoring expenses include: support for information management system, field transportation and
vehicle, printing and publishing of M&E documents/tools. Costs should not be omitted even if they
appear before the M&E system such as baseline study or external evaluation, and must be included
in the project budget. A finance unit or officer should be consulted to ensure budget is prepared in
an appropriate way.
Contingency costs refer to unexpected costs that arise during the implementation of the M&E
System in this case. As mentioned before costs allocated to M&E Plan should be between 3 and 10
%of the project budget. These costs should not be too small to compromise the accuracy and
credibility of the results.
The table on the next page represents the cost assumption for M&E plan:

MASTER THESIS IRIS ENGHIS
4TH
SEM. MANAGEMENT IN THE BUILDING INDUSTRY (MSC)
76 AAU- Sofiendalsvej 11 9000 Aalborg
Autumn 2015
Activities
For 1st phase
Price for 1 qt Frequency Total estimated
budget
Monthly Monitoring 450 kr 12 5.400 kr
Quarterly Monitoring 600 kr 4 2.400 kr
Six Monthly Monitoring 700 kr 2 1.400 kr
Midterm Evaluation
(Process evaluation) 750 kr (BEC) 1 750 kr
Final Evaluation 900 kr 1 900
Post Evaluation 1000 kr 1 1000
Ajour Reports
Documentation & Data
collection
200kr/h
10 h /w for
documentation.
Total no of weeks:
44w
88. 000 kr
Risk Management 200kr/h 1h/w 44w 8.800 kr
Surveys 200 pcs 4 800
Support for information
management system
Company
licence/year - 6000 kr
Printing and publishing 1 800 kr
Contingency costs 8% 27.480.750
kr - 2.198,460
Stakeholder complaint
and feedback system 200/h 10 2000 kr
Reporting findings (BEC) 1 5000 kr
2 321 810 kr

MASTER THESIS IRIS ENGHIS
4TH
SEM. MANAGEMENT IN THE BUILDING INDUSTRY (MSC)
77 AAU- Sofiendalsvej 11 9000 Aalborg
Autumn 2015
6.3 STAGE 6 EVALUATIONS AND AUDIT
The purpose of the evaluation is to: “Make an assessment, as systematic and objective as possible,
of an ongoing or completed project, programme or policy, its design, implementation and results.
The aim is to determine the relevance and fulfilment of objectives, developmental efficiency,
effectiveness, impact and sustainability. An evaluation should provide information that is credible
and useful, enabling the incorporation of lessons learned into the decision-making process of both
recipients and donors.” (OCSE/DAC)
Due to the stage of the construction project, evaluation information has not been made available yet;
however a description of procedures will be given with regard to this topic and possible
suggestions. The structure of this chapter will explain evaluation stages, and guidelines offered by
Byggeriets Evaluerings Center (BEC) as it has been mentioned in the interviews with Michael
Gabba that they are following BEC guidelines. An explanation of Ajour System will follow, as this
is a program used by Christian Hannesbo to make the necessary documentation for evaluation
purposes. Evaluations steps are:
1. Describing the purpose of evaluation
2. Identifying end products
3. Considering budgets and timeline
4. Defining objectives
5. Establishing Evaluation purposes
6. Identifying the information required
7. Reviewing the evaluation plan
8. Identify or create the data sources
9. Overlay your timelines and budget
10. Consider Privacy and ethical issues
Utilising findings
Thinking: steps 1, 2, 3
The purpose of this evaluation is to report achievements and as mentioned in the begging of this
report using the summative evaluation to report results obtained at the end of the project to assess,
determine the overall impact and estimate the relative costs of the intervention.
The evaluation is relevant for the municipality to comply with the regulations for subsidized
construction and for the client deliver good KPI’s, also it has to be within the governmental order.
Planning: steps 4, 5, 6
Thinking: what do you want
to get out of the
evaluation?
Planning: by developing an
evaluation plan that guides all
evaluation activities
Collecting: all the information needed to
develop budget and timeline
Communicating to ensure
evaluation results are used

MASTER THESIS IRIS ENGHIS
4TH
SEM. MANAGEMENT IN THE BUILDING INDUSTRY (MSC)
78 AAU- Sofiendalsvej 11 9000 Aalborg
Autumn 2015
Evaluation Plan
Objectives Questions Information required Data
Source
Nordjylland
Housing
Association
benefits of 20
new homes
creating Støvring
as an attractive
place to live.
Are benefits likely to be
maintained for an
extended period after
assistance ends?
Were there any
unintended, unplanned
changes?
What changes did the
project bring?
End users satisfaction surveys
Interviews
Stakeholder
analysis
Deliver the
construction
within the quality
imposed by
Norjylland
Housing
Association.
Were the operation
objectives consistent
with customer
specifications?
No. of cosmetic defects
No. of serious defects
No. of serious critical defects
No of detects that need to be
looked more closely.
Economic value of defects
Accidents frequency Client’s
satisfaction regarding the
building process
Client’s loyalty
Interviews
By 1st August
2016 Apartments
will be ready for
handing in to end
users.
Were the operation
objectives achieved?
Budgets
Plans
Communication
Collaboration
Interviews
Step 7: Reviewing the plan
In the beginning of this report Evaluation has been presented from the relevance, efficiency,
effectiveness, impact and sustainability criteria’s. Each of these criteria’s can be connected to the
log frame (result chain) as shown in the figure above. It all starts with the current situation of the
project, namely in this case: how to make quality transparent for the beneficiaries; it could be a
problematic situation if quality is not monitored, reported and evaluated accordingly making the
delivery of the project not complying with what has been demanded. There will be a description of
each criteria in connection with the log frame, then questions will be formulated to assess the

MASTER THESIS IRIS ENGHIS
4TH
SEM. MANAGEMENT IN THE BUILDING INDUSTRY (MSC)
79 AAU- Sofiendalsvej 11 9000 Aalborg
Autumn 2015
project overall. The criteria’s are connected to each component of the result chain as in the figure
below:
Relevance will refer to how appropriate objectives (formulated in Analysis chapter,
Objective tree) are to the beneficiaries.
Efficiency will look at the means that objectives will reach results within the planned
resources. Put in other words using resources at their maximum capability such as: good
planning, good financing and qualified workers, will get the project to produce the expected
results delivering the construction as agreed.
Effectiveness will then measure how well results (objectives) have been fulfilled through
indicators and sources of verification, contributing to the project purpose.
Impact is seen in the wider context, as how the project purpose has contributed to the long
term objective, as already specified, the municipality would like to make Støvring an
attractive place to live. Støvring Bytorv will in this case contribute among other projects in
having an impact to make this city an attractive place to live.
Lastly, sustainability measures the ability of the project to continue producing benefits even
after the project is completed.
Figure 45 Link between Evaluation Criteria and Log frame Source: (EuropeAid, 2004, s. 49)

MASTER THESIS IRIS ENGHIS
4TH
SEM. MANAGEMENT IN THE BUILDING INDUSTRY (MSC)
80 AAU- Sofiendalsvej 11 9000 Aalborg
Autumn 2015
Evaluation Questions
Relevance: Was the original problem analysis comprehensive enough and it still is relevant?
Is the project purpose relevant and it will solve the problem? Are stakeholders relevant to
the problems, objectives and long term sustainability?
Efficiency: Is the project providing value for money and efficient use of other resources?
Effectiveness: Is the project able to achieve results on time and with the appropriate target
groups?
Feasibility: Is the project feasible in terms of skills, resources and operating systems to
achieve objectives? Are assumptions being achieved? Is the activity schedule feasible?Do
partners have the capacity to achieve the project?
Outcome evaluation: Are project outputs being utilized and what is the impact of this in
solving the original problem?
Impact evaluation: Is the data collected designed to measure impact? What is the effect of
the project and its contributions to wider policy or sector objectives?
Sustainability: Will the benefits of the project continue once the project completes? Can the
benefits of the project be mainstreamed by appropriate and permanent bodies during the
project implementation and afterwards? (Spreckley)
Collecting: Steps 8, 9, 10
As mentioned previously data collection was done through: interviews, literature Reviews, data
sources, Indicators, questionaries’ and case study. By overlaying timeline and budget, it can be
subtracted costs from data collection indicating when each evaluation activity occurs and the staff
involved. Cost to producing reports and workshops must be included too. By considering the
privacy and ethical issues, there is a legal obligation to ensure that evaluation is conducted in an
ethical way.
According to the National Statement on Ethical Conduct in Human Research there are five
important principles:
1. Respect for individuals and groups: As an ethical rule, this refers on the treatment towards
others. Autonomy to make decisions for themselves, respecting others beliefs, respecting
cultural practices, privacy and confidentiality are some of the most important traits towards
others. Documents such as Information Privacy Act, Common Wealth privacy act and
Health record acts if relevant must be applied.
2. Benefits must justify any risk : The research must be done in such a way that is improved
by maximizing benefits and minimizing risks. Risk include: physical or psychological harm,
devaluation in personal worth, social, economic, or legal harms, discomfort or
inconveniences.
3. Justice and equality: It is important to establish equal benefits for everyone. It is considered
injustice if for example a certain group is “over researched” due to its accessibility while
others are rarely researched because they are easy to access. Ensuring that everyone is
treated fairly is an ethical way of practice.
4. Integrity: The research must be legitimate and must follow principles of conduct, performed
by qualified and competent professionals.
MASTER THESIS IRIS ENGHIS
4TH
SEM. MANAGEMENT IN THE BUILDING INDUSTRY (MSC)
81 AAU- Sofiendalsvej 11 9000 Aalborg
Autumn 2015
5. Research Merit: The research should contribute to knowledge and there should be respect
for the wellbeing and dignity of people. (Development)
Communicating
Step 11: Utilising findings
Utilizing findings are important to be reported to the identified audience in thinking stage. The
following questions should be considered by the evaluator in this stage:
If there has been determined a process for examining results internally?
If there has been determined a process for promoting results externally?
If it has been considered ways results are held so others can use them into the future?

MASTER THESIS IRIS ENGHIS
4TH
SEM. MANAGEMENT IN THE BUILDING INDUSTRY (MSC)
82 AAU- Sofiendalsvej 11 9000 Aalborg
Autumn 2015
6.3.1 BYGGERIETS EVALUERINGS CENTERS FOND
(BENCHMARK CENTRE FOR DANISH CONSTRUCTION
SECTOR)
“The Benchmark Centre for the Danish Construction Sector (Byggeriets Evaluerings Centers Fond)
is a business foundation, established in 2002 by a wide range of the players within the Danish
construction sector in order to promote the quality and the efficiency within the sector.
The Benchmark System:
BECs benchmarking system is designed in such a way that the population can be evaluated for
cause/effect links using general statistical tests. The data structure is hierarchical and permits
analysis at contract level, project level and sector level.
Since 2004 the use of the benchmarking system has been mandatory in government construction
and social housing projects in Denmark. The system is used by Clients as a tool for selecting
contractors and consultants. Specialties: Benchmarking, KPIs,
Rating, Analysis. “ (Byggeriets Evaluerings Centers Fond)
The BEC for Client advisor includes services such as:
Construction Rating, Process evaluation, Access to BEC Database
(a service with access grant only for members) and the Building
Rating Report.
The consultant’s Building Rating is derived by calculating the
average grades for 15 questions in the customer satisfaction. The
questions from 1 to 13 represent 50% of grading while questions
14and 15 represent 25%. In the table, A represents: much better
than the average, B better than the average C as the average, D
worse than the average and E much worse than the average.
6.3.1.1 CONSTRUCTION RATING
Building rating is both for the company or individual cases. For the company average is calculated
for the last 3 years. Moreover, Building Rating reflects the company’s position on the market in
relation to the average, which is the level that the customer usually expects. Client advisors get
building ratings such as A, B, C, D and E, while contractors get the ratings as AAAA or ACCB,
depending on what they have scored in the four segments: Deadlines, Defects, Accidents and
Customer Satisfaction. The building rating for Kuben Management is A and for TL Byg in Annex
D, within the document Evaluering a catalogue with the company’s rating is attached for 3 previous
projects that have been evaluated.
AUB BIOTEK, has registered ABCA, where A stands for meeting deadlines, B stands for
what the company has missed to include in the work, C for accidents and A for customer
satisfaction.
Hasseris Gymnasium the rating is ABAA.
Musikken Hus the rating is ABAB.
Table 7 Building rating legend

MASTER THESIS IRIS ENGHIS
4TH
SEM. MANAGEMENT IN THE BUILDING INDUSTRY (MSC)
83 AAU- Sofiendalsvej 11 9000 Aalborg
Autumn 2015
An explanatory customer satisfaction table is included in the catalogue, where 8 questions are
graded and an average of the total grades is subtracted. The questions are as following:
- The contractor's ability to assist constructively in the review process or in the planning of
the initial phase.
- The contractor’s ability to find solutions regarding the tender material demands and
furthermore to meet the clients demands with regard to the agreed work.
- The contractor’s ability to meet time plans and deliver the project in time
- The contractor’s ability to engage in dialogue on additional services and prices.
- The contractor’s ability to maintain a constructive dialogue and to collaborate with
stakeholders.
- The contractor’s ability to take in consideration existing surroundings such as neighbours,
residents, other staff, and users of the construction.
- The contractor’s ability to help implement a satisfactory delivery
- The contractor’s ability to deliver information on activities and maintenance regarding the
tender material.
- The Building Rating is therefore a great way for the client to request a certain rating that
reflects the qualifications of the client/contractor. Furthermore a Building Rating for
contractor and client advisor project is included in Annex D.
- The Building Rating for the client advisor regarding a specific project, grades the following
subtasks:
- The client advisor ability to make realistic budgets
- The client advisor ability to make realistic time plans
- The client advisor ability to illustrate it’s proposals
- The client advisor ability to lead a constructive dialog
- The client advisor contribution to a constructive collaboration between stakeholders
- The client advisor contribution to achieve a satisfactory aesthetic solution
- The client advisor contribution to achieve a satisfactory functional solution.
- The client advisor contribution to achieve a good indoor climate
- The client advisor contribution to achieve an environmental reasonable solution
- The client advisor contribution to achieve a solution with reasonable operating costs
- The client advisor ability to deliver the agreed quality in the project material.
- The client advisor handling of processes with residents, tenants and neighbours
- The client advisor contribution to carry out a satisfactory implementation/delivery.
There is a grading also for the client satisfaction regarding the consultancy services and loyalty
meaning that the client advisor will not use the consultancy information to similar projects. After a
grade will be given to each subtask, loyalty and satisfaction an average is calculated corresponding
to one of the ratings A, B, C, D or E.
Using this system the developer has the opportunity to choose the most qualified organisation to
build the project. As mentioned for the project in Støvring the information is not yet available with
regard to evaluation as the evaluation status is displayed when the process is completed.
The Building Rating for the contractor regarding a specific project, grades the following indicators:
MASTER THESIS IRIS ENGHIS
4TH
SEM. MANAGEMENT IN THE BUILDING INDUSTRY (MSC)
84 AAU- Sofiendalsvej 11 9000 Aalborg
Autumn 2015
For deadlines: actual execution time compared to schedules execution time adjusted for
deadline extensions, the result in this case should be expressed in percentage.
Moreover for defects: cosmetic defects, less serious defects, serious and critical defects, and
conditions that should be investigated more closely, economic value of defects and if there
has been defects obstructing or actually prevented the intended use of significant parts of the
building? Defects are measures as 0.000 pr. Mio.kr
Within safety on the building site, it is evaluated if there were serious accidents measured
in a category from 1 to 3, where 3 is highest and also the frequency of accidents. These
indicators are measured financially as 0, 0 mia.kr
Client satisfaction is measured through a scale from 1 to 5, where 5 is the highest, and
satisfaction is measured during the construction process and client loyalty.
The following sheets must be submitted to BEC. These sheets report key figures, and are used in
connection with pre-qualifications: The following sheets are listed below and included in Appendix:
- Information corresponding to KPI
- Measuring for customer satisfaction/client advisor
- Measuring for customer satisfaction/contractor
- Defect list: Facilitates reporting. In this sheet defects are listed.
- Information regarding calculation of KPI: The developer should report this to BEC; however
he can complete it with help of the contractor so it is easier.
- The voluntary contractor’s evaluation
- The voluntary client’s advisor evaluation (Byggeriets Evaluerings Centers Fond)
6.3.1.2 PROCESS EVALUATION (INTERIM EVALUATION)
The Process Evaluation should be carried out during the construction. The client can be appointed
to fill out a customer satisfaction survey and provide marks for cooperation. There can be written
concrete suggestions for improvement, criticism and praising.
Through Process Evaluation it is possible to rectify problems before completing the project, and
these problems could be fixed before growing bigger. Process evaluation is however voluntary, but
helpful to give criticism or feedback whether the project is on the right track. It offers a basis for
communication with the client, and to improve areas if he/she is not satisfied.
The evaluation process is identical to the customer satisfaction survey that is used in the context of
the evaluation itself. The process evaluation is not included in the company's report card, as
mentioned is only a self-project assessment before problems buckle up.
In Appendix 6 two sheets with process evaluation are included, one for the contractor and one for
the client. Both comprise questions, around 10, where it is asked to answer by giving a mark from 1
to 5. Moreover, evaluation price list from BEC can be found in Appendix 6.
(Byggeriets Evaluerings Centers Fond)
MASTER THESIS IRIS ENGHIS
4TH
SEM. MANAGEMENT IN THE BUILDING INDUSTRY (MSC)
85 AAU- Sofiendalsvej 11 9000 Aalborg
Autumn 2015
6.3.1.3 AJOUR SYSTEM A/S
From the questionnaires with the project manager from TL Byg, it has been mentioned that the way
data is collected for evaluation purposes is done through Ajour System A/S. Unfortunately, the
information regarding the project inserted in Ajour, has not been made available as it is still being
processed. At the end of the project, reports will be subtracted. However, a description and
understanding of the program will follow as it is part of quality control and procedures.
Ajour is a Danish enterprise established in 2010 with its own system developers, support and
consultants. The system developed web based software solutions for companies in construction,
manufacturing and property management. The idea was to providing effective and efficient business
procedures and processes in the solutions offered. The system enables to keep track of quality
control, supervision and scope of work performed. The collection of data is done digitally with a
smartphone or tablet to make the documentation easier right on the building site rather than
standing in the office. In this way unnecessary paper work is eliminated, also wasting time is
minimised. A better structure overview is created and a higher quality
registration of work is done. Lean production is used within the
program in order to optimize the work process and bring value in terms
of time, money and quality. (System)
Ajour quality stamp is used to market the idea that quality assurance is
central to the way the company performs the work and that all
requirements are met. Ajour D&V (digital delivery) is a planning tool
to create the overview of the ongoing operations, management and
documentation of tasks. Through this option it is possible to process
control and quality of data with standard building components cards.
There can be seen also the status of ongoing, future or completed operations. The data inserted in
the D&V can be used to prepare activities and operational plans for the preparation of maintenance
necessary throughout the warranty period. Ajour works with: project and supervision notes,
technical queries, subcontractor notes, lists for documentation and management of defects, 1 to 5
years inspection while making photo documentation accessible in any of these segments.
Registration is done for documentation in connection with inspection of tender processes, also
building reports and for making improvements.
Pre-registration is used for documenting existing conditions before starting a task and by doing so
the project manager can precede with others tasks making sure everything is registered.
Project Memo is used for technical purposes before initiation or during construction in order to
obtain the necessary authorisations. In this way it is possible to document and answer ambiguities.
Supervision Memo is used to document technical supervision during implementation phase, in
connection to health and safety work.
Submission is used register documentation delivery and management of the processes regarding
defects and the 1 – 5 year inspection. Other processes that need to be handled are: the technical
delivery, the design review and end users review. Ajour allows categorizing dividing these
processes so that they can be managed together or separately.
Figure 46 Ajour Quality Stamp
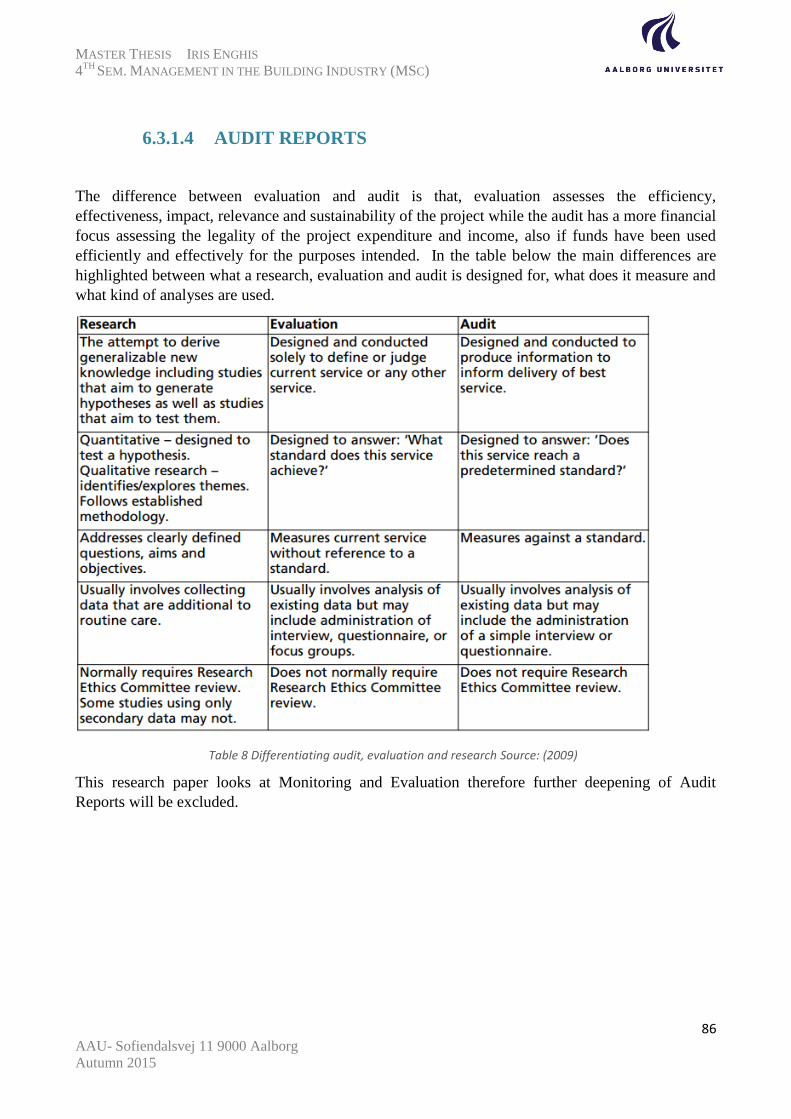
MASTER THESIS IRIS ENGHIS
4TH
SEM. MANAGEMENT IN THE BUILDING INDUSTRY (MSC)
86 AAU- Sofiendalsvej 11 9000 Aalborg
Autumn 2015
6.3.1.4 AUDIT REPORTS
The difference between evaluation and audit is that, evaluation assesses the efficiency,
effectiveness, impact, relevance and sustainability of the project while the audit has a more financial
focus assessing the legality of the project expenditure and income, also if funds have been used
efficiently and effectively for the purposes intended. In the table below the main differences are
highlighted between what a research, evaluation and audit is designed for, what does it measure and
what kind of analyses are used.
This research paper looks at Monitoring and Evaluation therefore further deepening of Audit
Reports will be excluded.
Table 8 Differentiating audit, evaluation and research Source: (2009)

MASTER THESIS IRIS ENGHIS
4TH
SEM. MANAGEMENT IN THE BUILDING INDUSTRY (MSC)
87 AAU- Sofiendalsvej 11 9000 Aalborg
Autumn 2015
6.3.1.5 DISSCUSSION
After conducting this research it can be stated that by making a Monitoring and Evaluation Plan to
manage time, budgets and human resources it is an appropriate way to ensure quality of work.
There has been calculated an approximate price of the Monitoring and Evaluation activities which
will not go over approximately 2.4 mil kr. Even though Monitoring and Evaluation can be costly,
mostly because of contingency costs and collection of data which is a complex process, detecting
failures too late in the process or making rectification can costs even more.
Regarding the project in Støvring at the final evaluation will be assessed if the quality of worked
performed has been achieved, meaning that it has achieved its intended purpose. If the project
manages to utilise its resources and convert them into activities objectives and goals as a benefit of
the M&E System, then it will contribute in improving other projects in the future through lessons
learned.
Besides the applicability of Monitoring and Evaluation within Construction projects, a major focus
has been directed towards managerial philosophies, techniques and approaches in order to
understand how these have evolved and management thinking has changed over time.
Moreover, conducting this research with two project managers from the client advisor side and from
the total contractor has been an interesting process to see what are the differences and what are the
interests.

MASTER THESIS IRIS ENGHIS
4TH
SEM. MANAGEMENT IN THE BUILDING INDUSTRY (MSC)
88 AAU- Sofiendalsvej 11 9000 Aalborg
Autumn 2015
6.3.1.6 CONCLUSION
This investigation is perceived from the client perspective, on how quality can be ensured during
project life cycle of a construction project. The context of Monitoring and Evaluation has been
studied for this purpose, as it gives the opportunity to make a transparent process for the client.
Transparency in Monitoring can be achieved through collection of data, which can be used later on
as documentation and performance is achieved through techniques where actual results versus
planned ones can be discussed for improvements with stakeholders in monthly, quarterly and six
monthly monitoring.
Furthermore stakeholders are involved in the process and decision making continuously where they
decide what to evaluate and how, involving them in data collection and analysis, consulting them
through interviews or asking for feedback. All these participatory actions help developing the
objectives of the project and ensure its achievement throughout the project cycle.. Moreover, there
is the possibility for certified customer surveys used to understand better the client perspective and
if necessary rectify problems before completing the project.
The core problem of this report has been formulated around the idea on how resources can be used
at their maximum capacity. The time factor, budgeting and human capabilities can be allocated and
managed always with the scope of improving the performance of the project. In this context
Monitoring and Evaluation helps identifying the most valuable and efficient use of resources and
provides the basis to plan, design and implement the project. As analysed, utilization of resources if
efficiently implemented contributes to the quality of activities. Monitoring and Evaluation can
demonstrate this if the project efforts had a measurable impact on the expected outcomes and have
been efficiently implemented.
For a successful implementation of M&E, the result based monitoring and evaluation cycle is
suggested that helps in defining project objectives and provides a basis for objective
implementation through monitoring of performance indicators. Involving stakeholders in analysis
phase of the project is very important to make sure project objectives are well defined. Through
methodologies such as Result Based Management it has been presented in the analysis how
objectives can be achieved through managerial techniques. The analysis have shown how important
it is to focus on project results that are relevant to the client and how monitoring and evaluation
must be ensured throughout project life cycle.
The contractual organisation form in this research paper had a strong impact in the Implementation
chapter, where there has been made a clarification on how advisor and total contractor are assessed
in the context of Monitoring and Evaluation. Based on this it has been found out about the
benchmark system which is mandatory in public subsidised projects. In this research paper is
investigated how the consultant and contractor are evaluated as two different performances. Both
the contractor and consultant will be evaluated on their performance providing a fair recognition of
their work. The benchmark system creates value for all parties and can be applied in pre-
qualification tenders where the client can select the best contractors and consultants based on their
performance.

MASTER THESIS IRIS ENGHIS
4TH
SEM. MANAGEMENT IN THE BUILDING INDUSTRY (MSC)
89 AAU- Sofiendalsvej 11 9000 Aalborg
Autumn 2015
BIBLIOGRAPHY
2009, National Research Ethics. n.d.
Architects, Danish Council of Practicing. Client Consultancy. 2003.
Barbera, Guido. “Project Cycle Management and Logical Framework.” n.d.
BEC. Byggerating. n.d. <http://www.byggerating.dk/bygge-rating/bygge-rating-for-
raadgivere.aspx>.
“Byggeriets Evaluerings Centers Fond.” n.d. Linkedin. <https://www.linkedin.com/company/the-
benchmark-centre-for-the-danish-construction-sector>.
C.Kubich, James P. Connell and Anne. “Applyng a Theory of Change Approach to the Evaluation
of Comprehensive Community Initiatives: Progress, Prospects and Proplems.” n.d.
CDC. “Developing an Effective Evaluation Report.” n.d.
Centre, IDRC International Development Research. “Monitoring, Evaluation and Dissemination of
Research Output.” n.d.
Comission, European. “ Project Cycle Management Training Handbook.” 1999.
Commission, European. Aid Delivery Methods. Volume 1, March 2004.
—. Project Cycle Management Handbook. Version 2, March 2002.
—. The logical framework approacg. n.d. <http://www.puntosud.org/helpdesk-
europeaid/preparing_a_project/the_project_approach/logical_framework_approach/start>.
“Develop Programme Theory.” http://betterevaluation.org/ website n.d.
“Developing Program Goals and Measurable objectives.” Available from:
http://http://www.cdc.gov/std/Program/pupestd/Developing%20Program%20Goals%20and
%20Objectives.pdf (n.d.).
Development, Department of Planning and Community. “Evaluation step by step guide.” n.d.
Dunn, Gage and. Frankel and Gage. 2009.
EuropeAid, European Commission -. Project Cycle Management Guidelines. Volume 1, 2004.
Evaluation, Community Engagement and Behaviour Change. “A short guide to M&E.” n.d.
Fund, European Commision Civil Society. Introduction to Monitoring and Evaluation using LFA
Approach. n.d.
funds, Sector for programming and management of EU. “Guide to the logical framework approach:
a key tool to project cycle management.” n.d.
Garbutt, Binnendijk in Bakewell &. 2005.
Global, VFS. n.d. <http://www.vfsglobal.com/our_expertise/quality.asp>.

MASTER THESIS IRIS ENGHIS
4TH
SEM. MANAGEMENT IN THE BUILDING INDUSTRY (MSC)
90 AAU- Sofiendalsvej 11 9000 Aalborg
Autumn 2015
Group, IEG Independent Evaluation. “Designing a results framework for achieving results: A how
to guide.” n.d.
“Grænsefladenotat.” July 2015.
Guide to the logical framework approach. Belgrade: Republic of Serbia Government European
Intergration Office, 2011.
Guide, IFRC ME. 2011.
http://www.danskenergi.dk/Aktuelt/Arkiv/2011/Marts/11_03_14A.aspx. 14 march 2011.
http://www.kubenman.dk/. n.d.
http://www.puntosud.org/helpdesk-
europeaid/preparing_a_project/the_project_approach/logical_framework_approach/start.
n.d.
Introduction to M&E using LFA. n.d.
Kansas, University of. “COMMUNITY TOOL BOX.” 2014. http://ctb.ku.edu/en/table-of-
contents/evaluate/evaluate-community-interventions/information-gathering-
synthesis/powerpoint.
Kesler, Adam. Guidelines to DCED standard for result management. 2015.
Khan, M.Adil. “A conceptual Framework of Result Based Monitoring and Evaluation and
Indicators.” (n.d.).
Logical Framework : Making it Results Oriented. n.d.
Management, Kuben. “Kvalitetsledelse i.” May 2014.
OCSE/DAC. Review of the DAC Principles for Evaluation of Development Assistance. 1998.
“PCM Training Hanbook.” March 2002.
PM Knowledge Center. n.d.
<http://www.pmknowledgecenter.be/dynamic_scheduling/baseline/heuristic-project-
scheduling-validating-quality-project-schedule>.
pmbook. n.d. <http://pmbook.ce.cmu.edu/10_Fundamental_Scheduling_Procedures.html>.
PMIS. n.d. <http://www.pmis-consulting.com/articles/earned-value-management/>.
Pomeroy . 2004.
professionals, Human Research Ethics and Health care. “National Health & Medical Research
Council: Advice to Institutions.” n.d.
Programme/project management: The results based approach. May 2008.
results, Measuring. The relationship between Monitoring and Evaluation: RBME. n.d.

MASTER THESIS IRIS ENGHIS
4TH
SEM. MANAGEMENT IN THE BUILDING INDUSTRY (MSC)
91 AAU- Sofiendalsvej 11 9000 Aalborg
Autumn 2015
RIB. “RIB.” n.d. <http://www.rib-software.co.uk/itwo>.
Societies, International Federation of Red Cross and Red Crescent. “Project/Programme monitoring
and evaluation (M&E) guide.” 2011.
Spreckley, Freer. Results Based Monitoring and Evaluation Toolkit. UK, 2nd edition 2009.
Stetson, Valerie. “Communicating and Reporting on an Evaluation.” n.d.
System, Ajour. n.d. <http://www.ajoursystem.dk>.
—. n.d. <http://www.ajoursystem.dk/produkter/ajour-byggeri.aspx>.
Turk, Ercan Sirakaya. Reseach Methods for Leisure Recreation and Tourism. n.d.
“Understanding program logic.” (n.d.).
UNDP. “Resuts-based management handbook.” 2011.
“Virksomhedspresentation.” 2015.
Weiss. Evaluation Research. New Jersey, 1972.
“What is Monitoring and Evaluation (M&E) .” Available
from:<http://http://www.sportanddev.org/en/toolkit/monitoring___evaluation/what_is_moni
toring___evaluation__m_e__/ (n.d.).

MASTER THESIS IRIS ENGHIS
4TH
SEM. MANAGEMENT IN THE BUILDING INDUSTRY (MSC)
92 AAU- Sofiendalsvej 11 9000 Aalborg
Autumn 2015
LIST OF FIGURES
Figure 1 Monitoring questions linked to result chain Source: (Societies 13) ...................................... 6
Figure 2 Earned value performance management Source: (PMIS) ..................................................... 7
Figure 3 Evaluation questions linked to result chain Source: (Societies, s. 16) .................................. 8
Figure 4 Kuben Management History Source: (Virksomhedspresentation) Annex A ...................... 13
Figure 5 Kuben Management Organization Source: (Virksomhedspresentation, 2015) Annex A ... 14
Figure 6 SWOT Analyses. Source: showeet.com ............................................................................. 16
Figure 7 Slagelse Psykiatriske Sygehus ............................................................................................. 17
Figure 8 Kanalforbindelse, Odense .................................................................................................... 17
Figure 9 Bispebjerg Hospital ............................................................................................................. 17
Figure 10 Ground floor plan of the apartments; 2 floors Source: (Grænsefladenotat, July 2015)
Annex C ............................................................................................................................................. 18
Figure 12 Project Organisation Source: (Architects, 2003) ............................................................... 19
Figure 11 Contractual organisation Source: (Architects) .................................................................. 19
Figure 13 From Quality Control → Quality Assurance → Quality Management to create the TQM
Culture Source: (Global) .................................................................................................................... 22
Fige 14 Facade elevations through the courtyard 1:300 Annex B Project Drawings ....................... 25
Figure 15 ey M&E Activities in the project cycle Source: (Societies, 2011, s. 12) .......................... 28
Figure 16 Quality Frame Source: (Barbera) EC* European Commission ...................... 29
Figure 17 Traditional Management approach vs. Results- Based Management Approach Source: . 30
Figure 18 RBM Approach Source (UNDP) ....................................................................................... 32
Figure 19 Result Based Monitoring and Evaluation Outline Source: (Spreckley) ............................ 34
Figure 20 The RBM Result Chain Source:. ....................................................................................... 35
Figure 21 Hierarchy of objectives and DAC Criteria Source: (Spreckley 21) .................................. 36
Figure 22 RBM Cycle Source: (Spreckley, 2nd edition 2009, s. 8) .................................................. 37
Figure 23 5 Merging PCM and Log frame approach Source: (Commission, Project Cycle
Management Handbook) .................................................................................................................... 39
Figure 24 Theory of change versus Program Logic Source: http://www.tools4dev.org/ .................. 41
Figure 25 LFA Analysis and Planning Phase Contents, Source: (Commission, The logical
framework approacg) ......................................................................................................................... 42
Figure 26 Problem tree Source: (Guide to the logical framework approach) .................................... 45
Figure 27 Activity: Element Mounting Source: Tidsplan med Kritiskvej ......................................... 46
Figure 28 Illustration of Actual Percentage Completion versus Time Source: (pmbook)................. 46
Figure 29 Problem tree Source: (Guide to the logical framework approach) .................................... 47
Figure 30 Objective tree Source: (Guide to the logical framework approach) .................................. 48
Figure 31 Resource constrained scheduling Source: (PM Knowledge Center) ................................. 48
Figure 32 Objective tree ..................................................................................................................... 49
Figure 33 Information elements produced by end of formulation Source: Project Cycle Management
Guidelines, Volume 1, European Commission - Europe Aid Cooperation Office, 2004, p. 38 ........ 50
Figure 34 Log frame Source: (Guide to the logical framework approach, 2011) ............................. 51
Figure 35 Result Chain Source (Spreckley, 2nd edition 2009, s. 3) .................................................. 52
Figure 36 Result Chain example Source : (Kesler, 2015) .................................................................. 52

MASTER THESIS IRIS ENGHIS
4TH
SEM. MANAGEMENT IN THE BUILDING INDUSTRY (MSC)
93 AAU- Sofiendalsvej 11 9000 Aalborg
Autumn 2015
Figure 37 Program logic Source: http://evaluationtoolbox.net.au ..................................................... 53
Figure 38 Result Chain Source: . ....................................................................................................... 54
Figure 39 Assessing risks Source: (Programme/project management: The results based approach) 55
Figure 40 The relationship between assumptions and objective hierarchy Source: (Guide to the
logical framework approach, 2011) ................................................................................................... 55
Figure 41 Indicators and the project Cycle Management Source: (PCM Training Hanbook 65) ..... 56
Figure 42 Implementation a learning process Source: (PCM Training Hanbook) ............................ 60
Figure 43 Comparing data analysis terms: findings, conclusions, recommendation and action
Source: (Societies 58) ........................................................................................................................ 70
Figure 44 Participatory continuum .................................................................................................... 72
Figure 45 Link between Evaluation Criteria and Log frame Source: (EuropeAid, 2004, s. 49) ....... 79
Figure 46 Ajour Quality Stamp .......................................................................................................... 85
LIST OF TABLES
Table 1 Kuben management economy Source:: (Virksomhedspresentation) .................................... 15
Table 2 Project Støvring Bytorv Summary ........................................................................................ 25
Table 3 Log frame Matrix Source: (Commission, Aid Delivery Methods 58) .................................. 43
Table 4 LFA Matrix ........................................................................................................................... 58
Table 5 Main implementation periods Source: (Barbera) .................................................................. 59
Table 6 Effective practices of communication Source (Stetson) ....................................................... 74
Table 7 Building rating legend........................................................................................................... 82
Table 8 Differentiating audit, evaluation and research Source: (2009) ............................................. 86

MASTER THESIS IRIS ENGHIS
4TH
SEM. MANAGEMENT IN THE BUILDING INDUSTRY (MSC)
94 AAU- Sofiendalsvej 11 9000 Aalborg
Autumn 2015