Embed Size (px)
Citation preview

Transfusion Practice in a Resource-poor Setting: Ugandan Experience
Aggrey Dhabangi (MD, M.MED) Makerere University College of Health Sciences, Kampala,
Uganda
2019-09-21

Aim
• Share experiences; Transfusion services and testing in a resource-poor setting
• Discussion: Suggestions of feasible, high impact Laboratory/testing approaches for improvement

Presentation outline • Uganda: The Geography, Population, Health and
Demography – Stats • Health System in Uganda; the structure and
organization • National Blood Services: History, Organization
and current stats • Transfusion practice: Clinical & Laboratory • Discussion: What, where & how to improve

Uganda - Location
Btw: 10 29’ S & 40 12’ N latitude, 290
34 E & 3500’ E longitude

Uganda; the Pearl of Africa

Key population, demographic and health data (National Population and Housing Census 2014)
Variable National Statistics
a) Basic Population data
Total Population (2018 estimate) 40 million persons
(grow rate: 3.03% )
Surface area (square kilometers) 241,550.7
Population density (persons per Sq Km) 173
Population of under 5 years 17.7 %
Population of under 18 years 55.1 %
Population of 60+ years 3.7 %
UDHS - 2016 Variable National Statistics
b) Health data
Maternal mortality rate (per 100,000 live birth) 336
Infant mortality rate (per 1,000 live births) 43
Under 5 mortality rate (per 1,000 live births) 64
Under 5 Prevalence of severe anemia (Hb<7.0 g/dL) 2.3%
Life expectance at birth (years) 63.3

The Health Structure • Total of 5,117 health facilities
• 2,932 (60 %) are public, including
• 2 national referral hospitals,
• 11 regional referrals, 3 city referral hospitals
• Several general hospitals, & H/centers (IV, III and II)
The Private Health sector (40% of H/facilities):
• 15-20 Private hospital in Kampala capital city
• Each of the 11 regions with 1-2 PNPF hospitals
• Several Medical centers and Clinics

HSD
District Health Services HQ
National Referral HOSP
Referral Facility (Public or NGO)
(HC IV or HOSPITAL)
HC II HC II
HOUSEHOLDS / COMMUNITIES / VILLAGES
Regional Referral
HOSPITALS
HC II HC II HC II
HC III HC III HC III
MOH Headquarters
District Health Services
Functional structure - Public
Target pop; 35,000,000
Target pop; 2,000,000
Target pop; 500,000
pop;20,000

Mulago National Referral Hospital, Kampala
Serves Kampala city (1.5 Million), Surrounding suburbs (2 million)
And referrals from Regional and Private Hospitals

History of Blood Transfusion in Uganda
First Blood grouping in Kampala = 1931

Year Kenya Uganda Tanganyika Nigeria
1949 323 720 140 --
1950 421 720 -- --
1951 500 648 -- --
1952 -- -- -- --
1953 550 558 268 1,168
1954 -- 556 162 250
1955 840 664 288 540
1956 -- 1,269 -- 1,603
1957 1884 1,409 652 6,057
1958 -- 2,726 664 7,361
1959 5,146 3,874 1,031 --
1960 -- 5,500 896 --
1961 -- 8,533 1,109 --
1962 11,282 9,000 -- --
Blood Transfusions Between W.W.2 and Independence
Schneider WH. History of blood transfusion in sub-Saharan Africa. Transfus Med Rev. 2013, 27(1):21-28.

Uganda Blood Transfusion Services (UBTS)
• Established In 1989
• Prior: Mix; Regional & Hospital based blood banks

UBTS: National Network
• 1 H/Quarter
(Blood Center)
• 6 Regional
(Blood Centers)
• 9 Regional
(Collection & Distributn)
• 25 Mobile teams
(Affiliated to all above)

Blood Policies and operation • Donors: Exclusively VNRBDs • Donor testing: Eligibility Screening ABO & Rh Serology: HIV, HBV, HCV, & Syphilis NAT; still unavailable
• Funding: Government of Uganda (PEPFAR, previous support) • Quality Management Department x 1 yr now • Accreditation: AfSBT

Blood Products
1. Whole blood (60%)
2. Red cell concentrates
(Largely for Pediatrics)
3. Platelets concentrates (single donor)
….All (WB, RCC & PLT); NOT Leukoreduced
4. FP
5. Cryoprecipitates (On order)

Trends in Blood Collection: 2003-2013
0
50,000
100,000
150,000
200,000
250,000
2003 2004 2005 2006 2007 2008 2009 2010 2011 2012 2013
Units of Blood Collected Per Year (2003 to 2013)
•100% VNRBDs
•Collection doubled since 2003
• Increased capacity over the years
•PEPFAR role
17
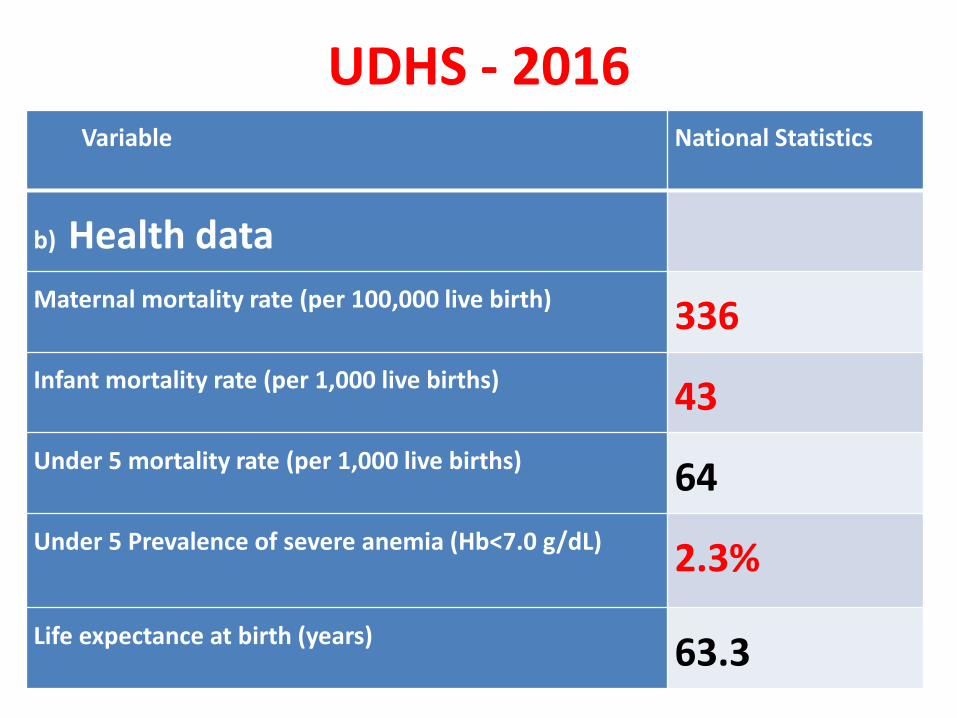
Current performance
Parameter FY: 2015Jul -
2016Jun
FY: 2016Jul-
2017Jun
No. of Sessions 9,071 8,607
Total Collections 247,711 239,260
TTIs (prevalence) (%) (%)
HBV 2.24 2.27
HCV 1.54 1.40
HIV 0.87 0.67
SYP 0.23 0.27
Average % issued 94%

Challenges

When the little is unsafe!

Transfusion Practice • Blood orders;

Blood Utilization 45% of blood treats children under 5,
most with severe anaemia from malaria
30% of blood treats women, during
childbirth
• 250 transfusing
healthcare facilities

Blood Utilization; Studies Item Assessed National Referral Hosp
(Butler EK et al 2015)
Regional Referral Hosp
(Natukunda B et al 2010)
Sample size, n (Patients) 3,662 1,674
Blood Products WB-69%, RCC-32%,
PLT-6%, FP-2%
WB-58%, RCC-41%,
PLT-0.2%, FP- ?
Blood units per patient ratio 1.7 1.7
Pre-Transfusion Hb, Median (IQR) 56 (40-72) ??
Disease Categories Transfused Proportion (%) Proportion (%)
a) Malaria 2 33
a) Sickle cell Anemia 7 1
a) Obstetric Hemorrhage 12 9 *(Other bleeding= 20)
a) Cancer 33 8
a) Trauma & Surgery 12 4
a) Anemia –Unknown, Other
infections
14 19

Pre-transfusion testing in Uganda
• Current practice is limited to:
ABO typing (forward only)
Rh (D) typing
Method = Tile (slide)
RT saline cross-match
Orders:
Type & cross-match - Majority
Patient sample kept for 7 days

Shortcomings - Laboratory
Donor cells (segments), NOT kept
Patient identification: Weak system
No screening for RBC allo-antibodies
No AHG cross-matches.
Do not detect clinically significant RBC antibodies
(of the IgG iso-type, reactive at 37˚C)
Puts allo-immunized blood recipients and pregnant women at risk of HTRs/STRs and HDFN respectively.
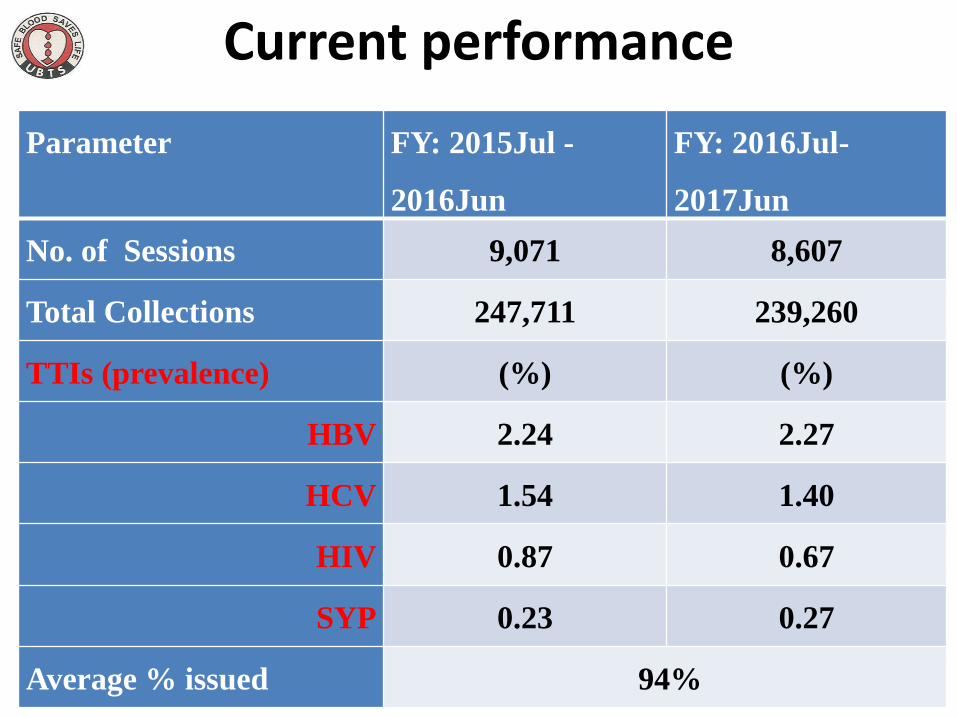
The Consequences
• Prev. of Alloimmunization in SCA; 6.1%
• 80% of immunized, had had >10 transfusions
• 67% of alloantibodies belong to Rh blood group.
(Natukunda B et al. 2010)

ATRs • Prevalence of ATRS; 9.6%
• FNHTR – 50% of all ATRs (Waiswa MK et al. 2014)
• Frequency BC in PLTs: 2% (Hume HA et al. 2016)

Discussions Areas that need urgent improvement
• Which tests? • The priorities • The resources • Quality systems • Blood safety • Training of staff • ? More evidence

Thank you