Embed Size (px)
Citation preview

Training and Development
Survey SPE Research, December 2012
Sponsored by

Table of Contents
Executive Summary 03
Objectives and Methodology 05
Skills and Preparation 06
Personal Experience 09
Formal Training 13
Training and Development Opportunities 19
Key Skills for the Future 22
Preferences by Age Group 25
Demographics 33
Executive Summary Overall, a wide range of skills are important for a successful career in the oil and gas industry; therefore employees place great
emphasis on training and development opportunities when choosing their employers.
Skills and Preparation
• Ability to learn, teamwork, communication skills, work ethic, and technical skills are some of the most important skills that are required for a career
in the industry.
• Universities play an important role in equipping graduates for the start of their career and are seen to be particularly good at providing computer
skills, knowledge, technical skills, and analytical skills.
Personal Experience
• Upon starting a career, the majority (86.8%) of employees require training, even if only a little. Most (82.4%) expect their employer to provide them
with some of this training, which tends to be a combination of formal and informal. Only a tenth (11.1%) expect the employer to provide all of their
training.
Formal Training
• Two-thirds (65.7%) of respondents have received formal training, which consisted of technical training (76.5%), soft skills training (57.8%), and
management and finance training (44.3%).
• Outside companies deliver the greatest share of this formal training.
• Formal technical training is mostly delivered by a mix of outside companies, workshops, on-the-job training, and internal training
programs.
• Soft-skills training is provided by either outside companies (28%) or internal training programs (24%).
Training and Development Opportunities
• It is important for companies to have good training and development programs, as three-quarters (74.6%) of employees state that it is important in
their choice of role, and over half (53.3%) say that a lack of opportunities would be enough for them to consider leaving.

Key Skills for the Future
• Unconventionals, Deepwater, EOR/IOR, and Heavy Oil are expected to be some of the major sources of upstream production growth over the next 5
years. Importantly, there is positive awareness of the skill gaps that the industry faces in these areas, which, if not rectified, could impact production
growth.
Preferences by Age Group
• When asked about the skills and attributes required to be successful in the petroleum industry, a few generational differences were noted regarding
what respondents’ valued most. Some of the differences in age groups were most apparent in motivation and non-technical skills.
• Respondents had different expectations of their need for training required to assume their present role. Expectedly, the amount of training needed
decreased with age and experience.
• A few of the noteworthy differences exist in preferences for the mode of training, with younger respondents expecting their employer to be the
primary facilitator, providing almost all training, whereas older, more experienced professionals were more self-reliant in procuring their training. Their
preferences could influence the types of training companies provide in the future, and how they deliver content.
Demographics
• More than half (56.4%) of those surveyed are responsible for some form of training and development with staff.
• The respondent profile consists of members with a lot of experience in the oil and gas industry (nearly half, 46.8%, working in the industry for 20
years or more). They have been with their current employer on average 8 years and 5 months and spent at least 4 years and 8 months in their
current role.
• The greatest proportion of respondents is currently based in the United States (34.5%), with the next largest based in Canada (7.5%), United
Kingdom (7.2%), and Australia (4.9%).
Objectives and Methodology
The objectives of this study were to build a current picture of the level of skills needed in the global engineering community and the
importance the oil and gas industry places on learning and skills development.
To address the objectives of the study, the first invitations to participate in the 2012 Training and Development Survey were sent to a
random selection of SPE members on 12 November 2012.
Screening criteria was applied, which excluded the following respondents:
• Self-employed/contract professional between placements
• Unemployed
• Student
• Retired
• Not working in the oil and gas industry
The survey was open for approximately 3 weeks.
The survey achieved a sample of 773 respondents.
The response rate produced a statistical margin of error of ± 3.45 at a 95% confidence level.

Skills and Preparation
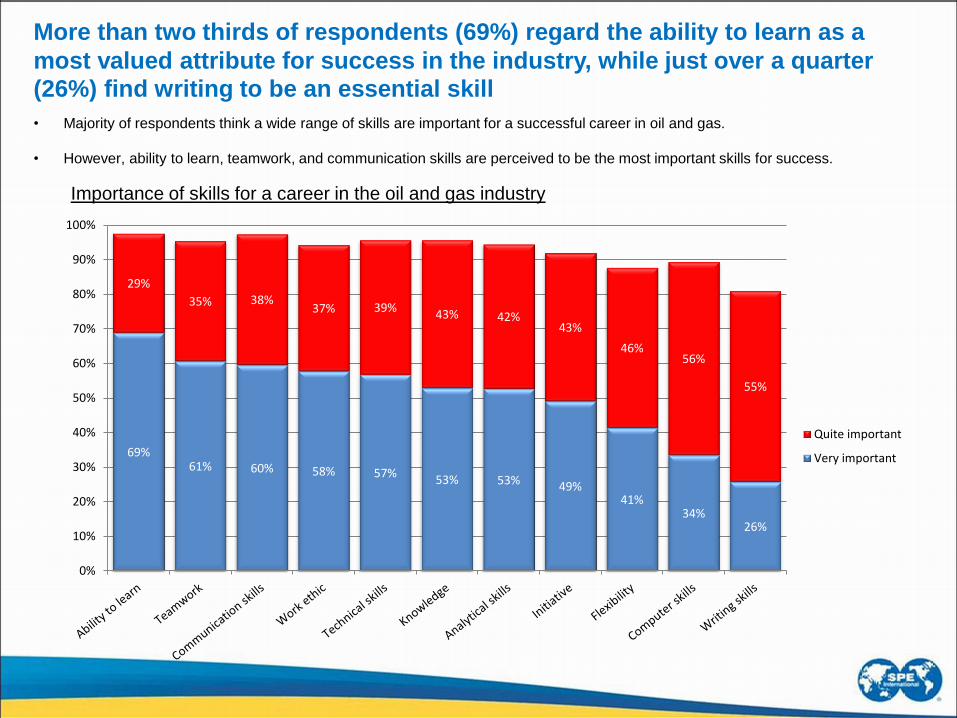
Importance of skills for a career in the oil and gas industry
More than two thirds of respondents (69%) regard the ability to learn as a
most valued attribute for success in the industry, while just over a quarter (26%) find writing to be an essential skill
69% 61% 60% 58% 57%
53% 53% 49% 41%
34% 26%
29%
35% 38% 37% 39%
43% 42% 43%
46% 56%
55%
0%
10%
20%
30%
40%
50%
60%
70%
80%
90%
100%
Quite important
Very important
• Majority of respondents think a wide range of skills are important for a successful career in oil and gas.
• However, ability to learn, teamwork, and communication skills are perceived to be the most important skills for success.

-23%
-23%
-21%
-22%
-19%
-19%
-13%
-8%
-8%
-8%
-6%
-3%
-7%
-4%
-5%
-4%
-4%
-2%
-1%
-1%
-1%
-1%
23%
24%
26%
29%
32%
34%
38%
52%
52%
54%
52%
3%
4%
3%
6%
6%
6%
8%
11%
13%
11%
20%
-40% -20% 0% 20% 40% 60% 80%
Flexibility
Work ethic
Initiative
Writing skills
Communication skills
Teamwork
Ability to learn
Analytical skills
Technical skills
Knowledge
Computer skills
Not very well Not at all well Quite well Very well
Performance of universities in equipping graduates for the start of their career in oil and gas
Respondents indicated that they are well prepared in technical knowledge to
enter the workforce, which they also regarded as more important overall than “soft skills” • Universities are perceived to be doing well at equipping graduates with computer skills, knowledge, technical skills, and analytical
skills to help them at the beginning of their oil and gas career.
• Areas where universities are seen to not be doing well include providing graduates with initiative, flexibility, writing skills, and a
work ethic – more than a quarter perceive universities as doing not well in these areas.

Personal Experience

12.8%
24.5%
43.1%
19.2%
0.5%
0%
5%
10%
15%
20%
25%
30%
35%
40%
45%
50%
No training Very little training Some training Extensive training Don't know
Level of training required when starting current role
Professionals required a moderate amount of training to assume their
current role in the industry
• Only a tenth (12.8%) of people say they required no training when they started their current role.
• Majority of people (86.8%) required training, if only a little.
• Nearly a fifth (19.2%) required extensive training.
Base: n=650 respondents

11.1%
44.5%
26.8%
12.9%
4.3%
0.5%
0%
5%
10%
15%
20%
25%
30%
35%
40%
45%
50%
Employer to provide allnecessary training
Employer to providesome training
Employer to providesome training but
expect to be primarilyresponsible for trainng
Did not expect employerto provide any training
No expectations Don't know
Expectations regarding training and development when starting current role
Most employees in the industry expect their employer to assume a large
portion of the responsibility of preparing them for a new position
• The majority (82.4%) of respondents expect their employer to provide some training when starting a new role.
• Only 11.1% expect their employer to provide them with all the necessary training.
• More than a quarter (26.8%) expects to be responsible for their training and development, with the employer providing some.
Base: n=650 respondents
13.3%
66.5%
17.1%
2.5% 0.6%
0%
10%
20%
30%
40%
50%
60%
70%
Formal Combination of formal andinformal
Informal No training and development Don't know
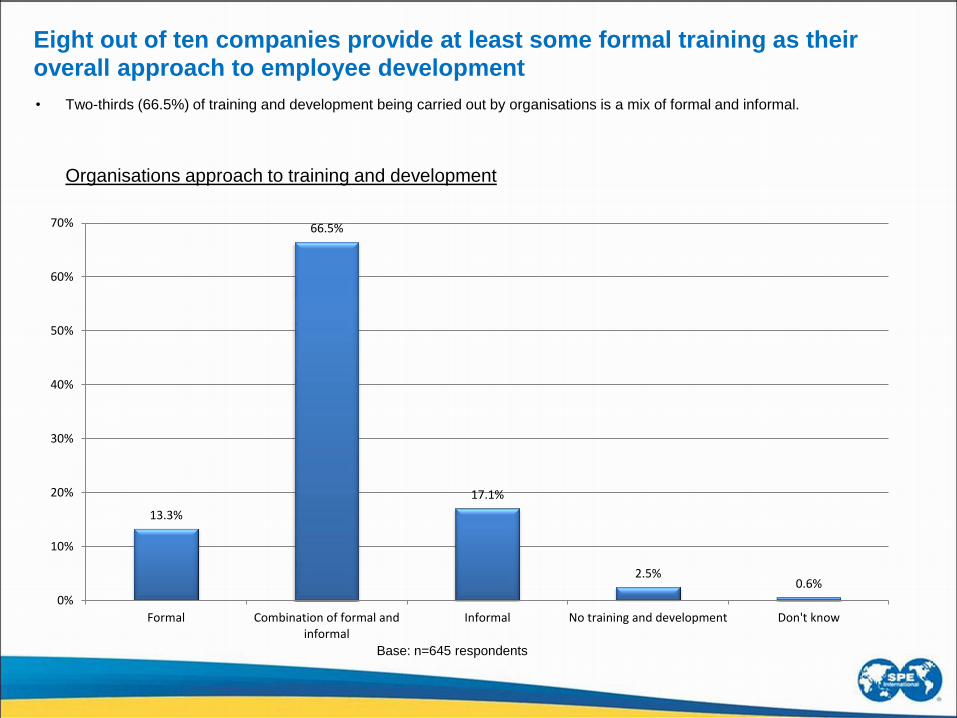
Organisations approach to training and development
Eight out of ten companies provide at least some formal training as their overall approach to employee development
• Two-thirds (66.5%) of training and development being carried out by organisations is a mix of formal and informal.
Base: n=645 respondents

Formal Training

76.5%
57.8%
44.3%
10.0%
0%
20%
40%
60%
80%
100%
Technical training Soft-skills development training Management and finance training Other
Technical training is the most common form of training provided by
employers, with almost a fifth having received software training • Two-thirds (65.7%) of respondents have received formal training in their current role.
• Of those having formal training, three quarters (76.5%) are receiving technical training, while a further 57.8% are getting soft-skills
training and 44.3% management and finance training.
• Software training (17.6%) and technical courses/programs (12.6%) are the main types of formal technical training being received in
their current role. Formal training received in Current Role
(Base n=645) 66%)
• Software training 17.6% (n=49)
• Attended technical courses/programs 12.6% (n=35)
• Management Skills 8.3% (n=23)
• Economics/Sales/Business 5.4% (n=15)
• HSE/Emergency 5.4% (n=15)
• Internal/Company-specific training 5.4% (n=15)
• Reservoir Engineering 4.3% (n=12)
• Training related to my job/position 4.0% (n=11)
• University training 4.0% (n=11)
Formal ‘technical’ training received in Current Role
(Base n=278)

38.7%
18.6%
27.5%
33.1%
10.5%
14.5%
33.1%
13.2%
16.4%
28.7%
16.7%
24.3%
19.4%
10.0%
15.0% 14.7%
4.4%
10.3%
8.1%
4.2% 2.9%
0%
5%
10%
15%
20%
25%
30%
35%
40%
45%
Technical training Management and Finance training Soft-skills development and non-technical training
Outside companies providingindustry training
Workshops and courses byprofessional industry associations
On-the-job training
Internal training program
Online training
Mentoring programs
University or technical collegetraining
Delivery of formal training in current role
Companies most often rely on firms that provide industry training to deliver their
technical training, with workshops and courses by industry associations and on-the-
job training each accounting for about a third of technical training • Outside companies are being used to provide the greatest proportion of formal technical training (39%), management and finance
training (19%), and soft-skills development training (28%) to employees.
• More than half of all soft-skills training is provided by either outside companies (28%) or internal training programs (24%).
• University or technical college training programs are the least used to provide employees with formal training.
Base: Varies by selection

60.8%
45.8% 41.3%
37.9%
45.8% 47.7%
0%
10%
20%
30%
40%
50%
60%
70%
80%
90%
100%
Technical training Management and finance training Soft-skills development
Somewhat useful
Very useful
Usefulness of formal training to meet the day to day responsibilities in current role
Technical training is valued most in preparing them for their job by those
who indicated that they have received formal training • All three types of formal training offered are seen to be useful in equipping respondents with skills required to meet the day to day
responsibilities of their current role.
• Formal technical training has been the most useful in equipping respondents to meet the day to day responsibilities of their current
role, with 60.8% saying it has been very useful to them in their current role.
Base: Varies by selection

1.0%
3.3%
12.2%
10.8%
9.2%
4.7%
4.7%
4.5%
22.4%
20.8%
20.9%
21.2%
16.5%
13.5%
48.5%
41.6%
47.9%
53.4%
59.1%
58.1%
15.9%
23.6%
20.4%
19.7%
19.5%
23.4%
0% 10% 20% 30% 40% 50% 60% 70% 80% 90% 100%
Amount of training received
Budget available for training
Time made availble for training
Met the identified training needs
Content of training received
Quality of training received
Not at all satisfied = 1 Not very satisfied Neither Quite satisfied Very satisfied = 5Top 2
Box Mean
81.5%
78.6%
73.1%
68.3%
65.2%
64.4%
4.0
3.9
3.9
3.8
3.7
3.7
Level of satisfaction with aspects of formal training received in current role
Training that professionals currently receive seems to meet or exceed their
perceived need for formal training
• Most people are satisfied with the formal training they have received in their current role.
• Quality (81.5%) and content (78.6%) of training are the areas that people were most satisfied with.
• Some improvement could be made to the amount of training provided, which received the lowest rating.
Base: Varies by selection
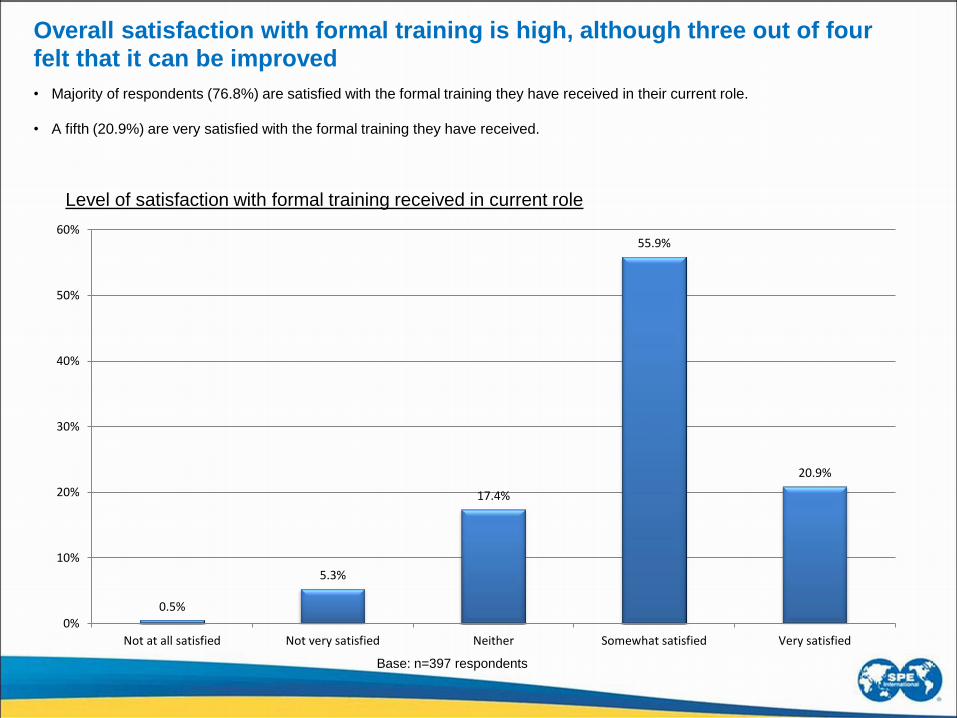
0.5%
5.3%
17.4%
55.9%
20.9%
0%
10%
20%
30%
40%
50%
60%
Not at all satisfied Not very satisfied Neither Somewhat satisfied Very satisfied
Level of satisfaction with formal training received in current role
Overall satisfaction with formal training is high, although three out of four
felt that it can be improved
• Majority of respondents (76.8%) are satisfied with the formal training they have received in their current role.
• A fifth (20.9%) are very satisfied with the formal training they have received.
Base: n=397 respondents
Training and Development
Opportunities

30.4%
22.2%
13.8%
10.7%
3.7%
20.4%
17.6%
17.5%
13.6%
5.2%
23.8%
23.3%
22.2%
22.5%
16.5%
18.1%
24.9%
29.3%
31.9%
35.1%
7.3%
12.0%
17.3%
21.4%
39.5%
0% 20% 40% 60% 80% 100%
Lack of training and development is currently holding me backin my career
In the past, a lack of training and development has held meback in my career
Areas of training that I believe I should have received by nowbut have not
Lack of training and development opportunities would beenough for me to consider leaving an employer
Training and development opportunities are important to me inmy choice of role
Disagree strongly = 1 Disagree Slightly Neither Agree slightly Agree strongly = 5
Top 2
Box Mean
74.6%
53.3%
46.6%
36.9%
25.4%
4.0
3.4
3.2
2.9
2.5
Level of agreement with statements made about training
Clearly training and development is an important consideration to most
employees in planning their career progression
• Training and development opportunities are one of the most important factors employees look for when choosing their role – three
quarters (75%) of respondents agree that these opportunities are important.
• Importantly, lack of opportunities would force some to consider leaving for an employer that provided opportunities in training and
development.
• However, a quarter (25%) believe that a lack of training and development holds them back in their career.
Base: Varies by selection

62.1%
46.4%
34.6%
0%
10%
20%
30%
40%
50%
60%
70%
Technical training Management and finance training Soft-skills development training
Types of training needed, but not received
Some employees expressed concern that there are gaps in their receiving the
appropriate training • The majority of respondents (62.1%) are waiting to receive technical training, which they feel they should have already received.
• A significant proportion feel that they should have received management and finance training (46.4%) and soft-skills training (34.6%).
• The main barriers to receiving this training are budget and time constraints.
• However, there is hope, as nearly three quarters (64.7%) anticipate that this training will eventually be provided by their employer.
Main barriers to receiving training Base: n=220
• Budget 29.6% (n=65)
• Time constraints 28.2% (n=62)
• Company lack of interest/not considered necessary 13.2% (n=29)
• Lack of organisation/plan 9.1% (n=20)
• Availability of classes 8.2% (n=18)
• Workload 5.9% (n=13)
• Job responsibilities 2.7% (n=6)
• Emphasis on new hires 2.7% (n=6)
Base: n=280 respondents

Key Skills for the Future

13%
9%
13%
18%
18%
20%
17%
22%
32%
42%
54%
20%
22%
22%
32%
33%
34%
35%
43%
52%
68%
79%
0% 10% 20% 30% 40% 50% 60% 70% 80% 90%
C02 Capture and Storage
Projects, Facilities and Construction
Arctic
Well Integrity
Intelligent Completions
Water Management
Production & Operations
Heavy Oil
EOR/IOR
Deepwater
Unconventionals
Predicted sources of upstream production growth next 5 years Awareness of skill gaps to impact production growth
Training in specific technical areas such as unconventional resources is a
highly valued area of development
• Unconventionals, Deepwater, and EOR/IOR are expected to be the major sources of upstream production growth over the next 5
years.
• Other areas expected to be major sources of upstream production growth are Shale Gas and extension of well use.
• Interestingly, awareness of skill gaps is high and is highest among those that predict unconventionals to be the main source of
upstream growth in the next 5 years, with a ratio of 1.46.
Base: n=612 respondents
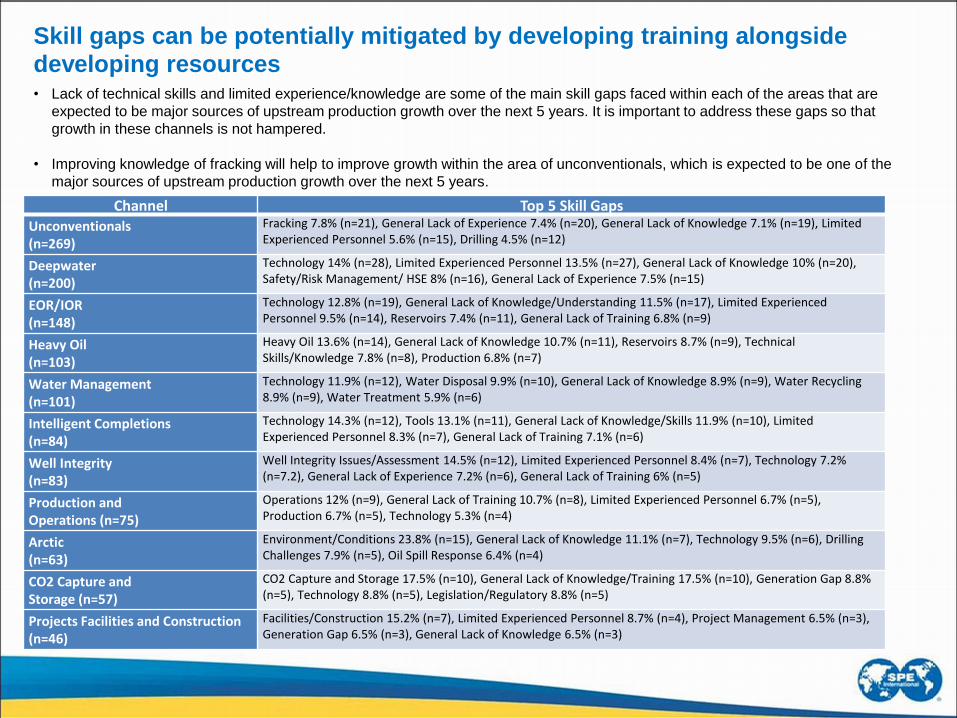
Channel Top 5 Skill Gaps
Unconventionals (n=269)
Fracking 7.8% (n=21), General Lack of Experience 7.4% (n=20), General Lack of Knowledge 7.1% (n=19), Limited Experienced Personnel 5.6% (n=15), Drilling 4.5% (n=12)
Deepwater (n=200)
Technology 14% (n=28), Limited Experienced Personnel 13.5% (n=27), General Lack of Knowledge 10% (n=20), Safety/Risk Management/ HSE 8% (n=16), General Lack of Experience 7.5% (n=15)
EOR/IOR (n=148)
Technology 12.8% (n=19), General Lack of Knowledge/Understanding 11.5% (n=17), Limited Experienced Personnel 9.5% (n=14), Reservoirs 7.4% (n=11), General Lack of Training 6.8% (n=9)
Heavy Oil (n=103)
Heavy Oil 13.6% (n=14), General Lack of Knowledge 10.7% (n=11), Reservoirs 8.7% (n=9), Technical Skills/Knowledge 7.8% (n=8), Production 6.8% (n=7)
Water Management (n=101)
Technology 11.9% (n=12), Water Disposal 9.9% (n=10), General Lack of Knowledge 8.9% (n=9), Water Recycling 8.9% (n=9), Water Treatment 5.9% (n=6)
Intelligent Completions (n=84)
Technology 14.3% (n=12), Tools 13.1% (n=11), General Lack of Knowledge/Skills 11.9% (n=10), Limited Experienced Personnel 8.3% (n=7), General Lack of Training 7.1% (n=6)
Well Integrity (n=83)
Well Integrity Issues/Assessment 14.5% (n=12), Limited Experienced Personnel 8.4% (n=7), Technology 7.2% (n=7.2), General Lack of Experience 7.2% (n=6), General Lack of Training 6% (n=5)
Production and Operations (n=75)
Operations 12% (n=9), General Lack of Training 10.7% (n=8), Limited Experienced Personnel 6.7% (n=5), Production 6.7% (n=5), Technology 5.3% (n=4)
Arctic (n=63)
Environment/Conditions 23.8% (n=15), General Lack of Knowledge 11.1% (n=7), Technology 9.5% (n=6), Drilling Challenges 7.9% (n=5), Oil Spill Response 6.4% (n=4)
CO2 Capture and Storage (n=57)
CO2 Capture and Storage 17.5% (n=10), General Lack of Knowledge/Training 17.5% (n=10), Generation Gap 8.8% (n=5), Technology 8.8% (n=5), Legislation/Regulatory 8.8% (n=5)
Projects Facilities and Construction (n=46)
Facilities/Construction 15.2% (n=7), Limited Experienced Personnel 8.7% (n=4), Project Management 6.5% (n=3), Generation Gap 6.5% (n=3), General Lack of Knowledge 6.5% (n=3)
Skill gaps can be potentially mitigated by developing training alongside
developing resources • Lack of technical skills and limited experience/knowledge are some of the main skill gaps faced within each of the areas that are
expected to be major sources of upstream production growth over the next 5 years. It is important to address these gaps so that
growth in these channels is not hampered.
• Improving knowledge of fracking will help to improve growth within the area of unconventionals, which is expected to be one of the
major sources of upstream production growth over the next 5 years.

Preferences by Age Group

Expectations and preferences for skills development and training vary by
audience • When asked about the skills and attributes required to be successful in the petroleum industry, a few generational differences were
noted regarding what respondents valued most. Some of the differences in age groups were most apparent in motivation and non-
technical skills.
Importance of Skills to Success in the Industry by Age
41.4%
46.4% 43.9%
59.2%
40.5%
79.2%
55.2% 55.6% 54.5%
59.4% 59.1%
70.8%
13.8%
25.0%
19.5%
27.1% 30.5%
41.7%
0%
10%
20%
30%
40%
50%
60%
70%
80%
90%
<26 26-35 36-45 46-55 56-65 66+
Skills they consider "Very Important"
Initiative
Work Ethic
Writing Skills
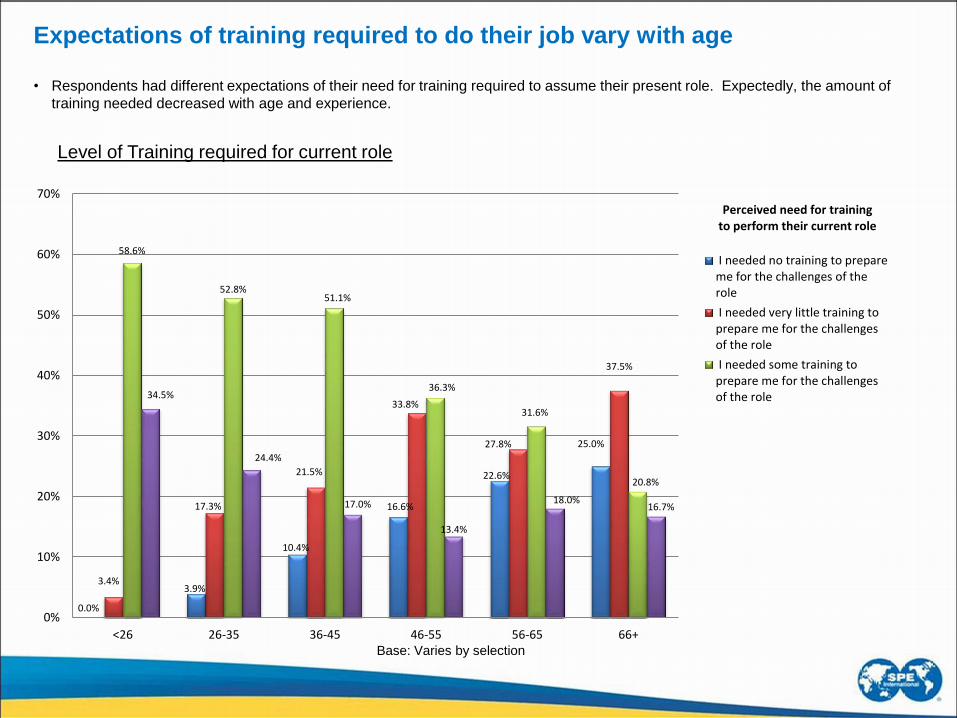
0.0%
3.9%
10.4%
16.6%
22.6%
25.0%
3.4%
17.3%
21.5%
33.8%
27.8%
37.5%
58.6%
52.8% 51.1%
36.3%
31.6%
20.8%
34.5%
24.4%
17.0%
13.4%
18.0% 16.7%
0%
10%
20%
30%
40%
50%
60%
70%
<26 26-35 36-45 46-55 56-65 66+
Perceived need for training to perform their current role
I needed no training to prepareme for the challenges of therole
I needed very little training toprepare me for the challengesof the role
I needed some training toprepare me for the challengesof the role
Expectations of training required to do their job vary with age
Level of Training required for current role
• Respondents had different expectations of their need for training required to assume their present role. Expectedly, the amount of
training needed decreased with age and experience.
Base: Varies by selection

0% 10% 20% 30% 40% 50% 60% 70%
Training workshops and training courses provided by professionalindustry associations (like SPE)
Outside companies that provide industry training
On-the-job training (formal program)
Internal training program (like corporate university)
Mentoring programs
University or technical college training
Online training
Other
Tech
nic
al t
rain
ing 66+
56-65
46-55
36-45
26-35
<26
The mode and method of delivery also varied by age and experience
• A few of the noteworthy differences exist in preferences for the mode of training, with younger respondents expecting their employer
to be the primary facilitator, providing almost all training, whereas older, more experienced professionals were more self-reliant in
procuring their training. Their preferences could influence the types of training companies provide in the future, and how they deliver
content.
Technical Training
• Most age groups prefer combined structured and on the job training, but older professionals still prefer traditional academics over
mentoring and online training, which younger professionals prefer.
Preferred type of training
Base: Varies by selection
0% 20% 40% 60% 80% 100% 120%
Training workshops and training courses provided byprofessional industry associations (like SPE)
Outside companies that provide industry training
On-the-job training (formal program)
Internal training program (like corporate university)
Mentoring programs
University or technical college training
Online training
Other
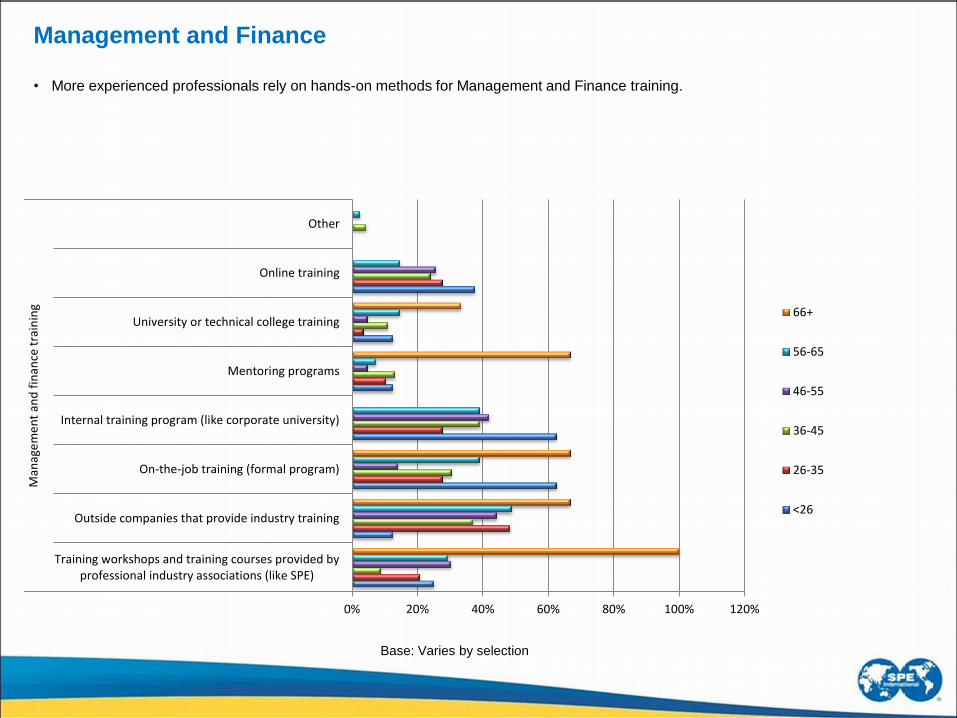
Man
age
me
nt
and
fin
ance
tra
inin
g 66+
56-65
46-55
36-45
26-35
<26
Management and Finance
• More experienced professionals rely on hands-on methods for Management and Finance training.
Base: Varies by selection

0% 20% 40% 60% 80%
Training workshops and training courses provided by professionalindustry associations (like SPE)
Outside companies that provide industry training
On-the-job training (formal program)
Internal training program (like corporate university)
Mentoring programs
University or technical college training
Online training
Other
Soft
-ski
lls d
eve
lop
me
nt
like
co
mm
un
icat
ion
, le
ader
ship
an
d o
the
r n
on
-te
chn
ical
tra
inin
g 66+
56-65
46-55
36-45
26-35
<26
Soft Skills
• While most age groups prefer soft-skills training internally, on-the-job, or by an outside company, older professionals are still more
likely to attend a professional association workshop or training course. Younger prefer online soft skills training.
Base: Varies by selection
0% 10% 20% 30% 40% 50% 60% 70% 80%
Training workshops and training courses provided by professionalindustry associations (like SPE)
Outside companies that provide industry training
On-the-job training (formal program)
Internal training program (like corporate university)
Mentoring programs
University or technical college training
Online training
Other
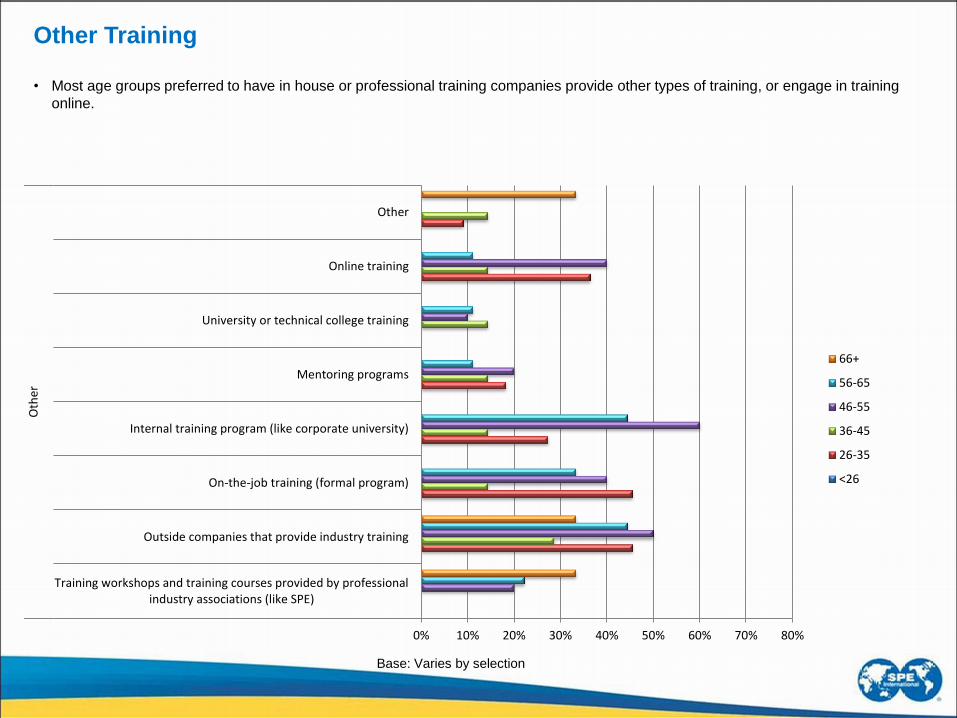
Oth
er
66+
56-65
46-55
36-45
26-35
<26
Other Training
• Most age groups preferred to have in house or professional training companies provide other types of training, or engage in training
online.
Base: Varies by selection
34.8%
24.0%
15.6%
23.9%
13.4%
16.7%
52.2%
19.8%
10.0%
23.9%
17.1% 16.7%
45.5%
19.6%
23.3%
33.0%
11.0%
33.3%
0%
10%
20%
30%
40%
50%
60%
<26 26-35 36-45 46-55 56-65 66+
Aspects of training they were "very satisfied"with
Time made availablefor training
Met the identifiedtraining needs
Quality of trainingreceived
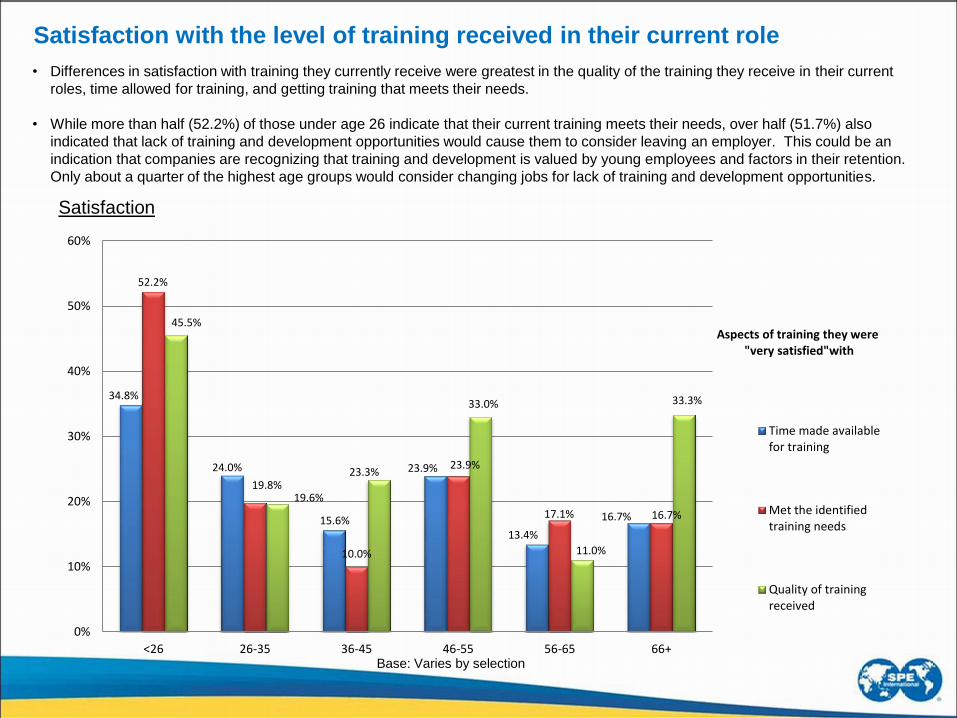
Satisfaction
Satisfaction with the level of training received in their current role
• Differences in satisfaction with training they currently receive were greatest in the quality of the training they receive in their current
roles, time allowed for training, and getting training that meets their needs.
• While more than half (52.2%) of those under age 26 indicate that their current training meets their needs, over half (51.7%) also
indicated that lack of training and development opportunities would cause them to consider leaving an employer. This could be an
indication that companies are recognizing that training and development is valued by young employees and factors in their retention.
Only about a quarter of the highest age groups would consider changing jobs for lack of training and development opportunities.
Base: Varies by selection

Demographics

Country Currently based Country of origin USA 34.5% 30.4%
Canada 7.5% 6.5%
United Kingdom 7.2% 7.5%
Australia 4.9% 3.5%
Nigeria 4.8% 7.0%
Norway 3.8% 3.2%
Malaysia 3.6% 2.3%
UAE 2.6% 0.3%
Russia 1.9% 1.8%
Brazil 1.8% 1.4%
Oman 1.6% 0.5%
Romania 1.4% 1.3%
Saudi Arabia 1.4% 0.5%
Columbia 1.3% 1.9%
Netherlands 1.2% 1.9%
India 1.2% 4.0%
Italy 1.2% 1.2%
China 1.0% 1.3%
Germany 1.0% 1.8%
Mexico 1.0% 0.9%
Argentina 0.9% 1.3%
France 0.9% 1.2%
Egypt 0.5% 1.3%
Venezuela 0.5% 1.9%
Country based and country of origin
The greatest proportion of respondents is currently based in the United
States (34.5%). The next largest representation comes from Canada (7.5%)
and the United Kingdom (7.2%)
Base: n=773 respondents

1.1% 1.0% 2.8%
8.7%
14.2% 14.7%
9.4%
46.8%
1.1%
0%
5%
10%
15%
20%
25%
30%
35%
40%
45%
50%
Less than 6months
6 months - lessthan 1 year
1 year to lessthan 2 years
2 years to lessthan 5 years
5 years to lessthan 10 years
10 years to lessthan 15 years
15 years to lessthan 20 years
20 years ormore
Not working inoil & gas
Length of time working in the Oil and Gas industry
Majority of respondents have a great deal of experience of working in the oil
and gas industry, with nearly half (46.8%) working in the industry for 20 years
or more
Base: n=709 respondents

6.9%
5.5%
14.3%
21.4% 20.7%
11.2%
6.2%
13.9%
0%
5%
10%
15%
20%
25%
Less than 6months
6 months - lessthan 1 year
1 year to less than2 years
2 years to lessthan 5 years
5 years to lessthan 10 years
10 years to lessthan 15 years
15 years to lessthan 20 years
20 years or more
Length of time working with current employer
On average, respondents have been with their current employer for 8 years
and 5 months
Base: n=697 respondents
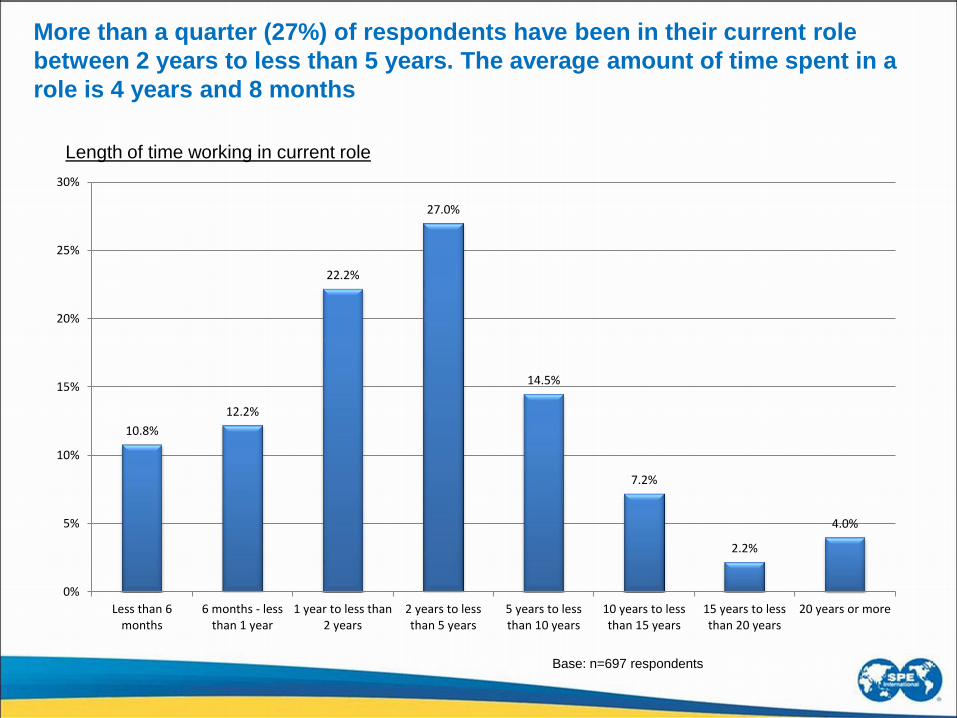
10.8%
12.2%
22.2%
27.0%
14.5%
7.2%
2.2%
4.0%
0%
5%
10%
15%
20%
25%
30%
Less than 6months
6 months - lessthan 1 year
1 year to less than2 years
2 years to lessthan 5 years
5 years to lessthan 10 years
10 years to lessthan 15 years
15 years to lessthan 20 years
20 years or more
Length of time working in current role
More than a quarter (27%) of respondents have been in their current role
between 2 years to less than 5 years. The average amount of time spent in a
role is 4 years and 8 months
Base: n=697 respondents
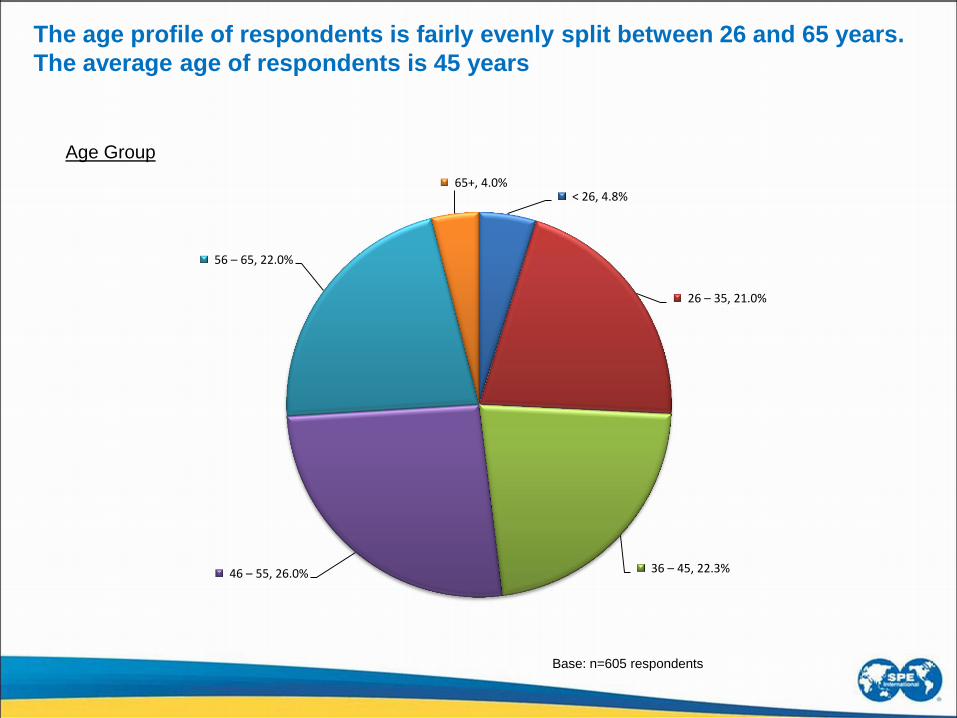
< 26, 4.8%
26 – 35, 21.0%
36 – 45, 22.3% 46 – 55, 26.0%
56 – 65, 22.0%
65+, 4.0%
Age Group
The age profile of respondents is fairly evenly split between 26 and 65 years.
The average age of respondents is 45 years
Base: n=605 respondents

13.4%
20.7% 19.8%
11.6%
34.5%
0%
5%
10%
15%
20%
25%
30%
35%
40%
Less than 2 years Between 2 and 5 years Between 6 and 10 years Between 11 and 15 years More than 15 years
Length of SPE membership
More than a third of respondents have been a member of SPE for more than
15 years. The average SPE membership length is 11 years
Base: n=605 respondents

3.8%
1.3%
2.8%
5.0%
7.6%
7.9%
24.5%
47.1%
0% 10% 20% 30% 40% 50%
Other
Foreman
Educator
Geologist
Executive
Consultant
Manager
Engineer
Job Classification
Majority of respondents are either Engineers (47.1%) or Managers (24.5%)
Base: n=605 respondents
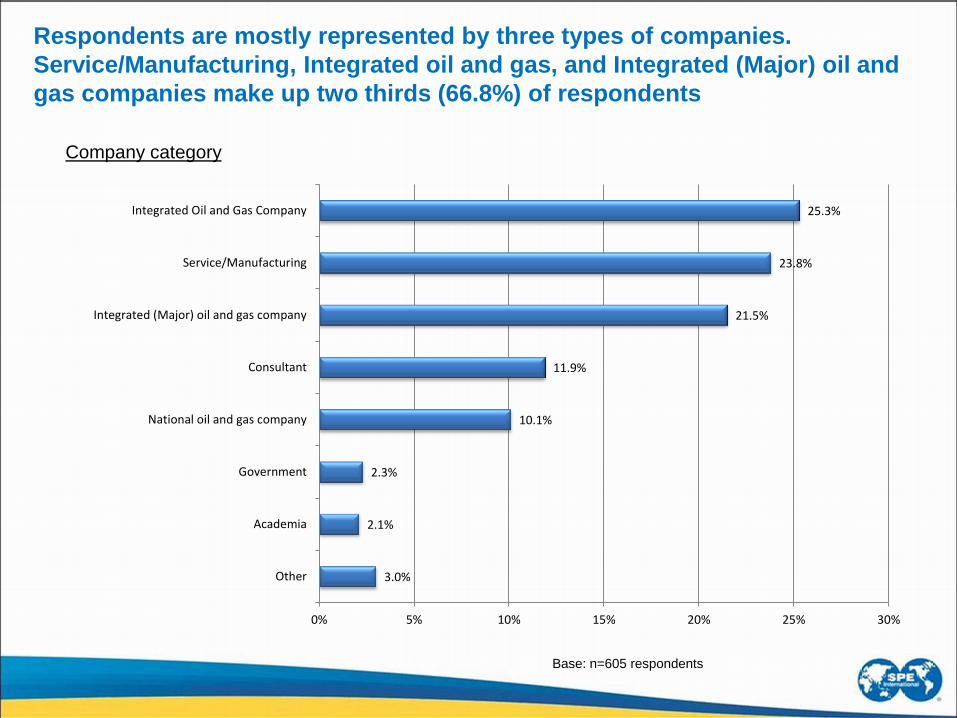
3.0%
2.1%
2.3%
10.1%
11.9%
21.5%
23.8%
25.3%
0% 5% 10% 15% 20% 25% 30%
Other
Academia
Government
National oil and gas company
Consultant
Integrated (Major) oil and gas company
Service/Manufacturing
Integrated Oil and Gas Company
Company category
Respondents are mostly represented by three types of companies.
Service/Manufacturing, Integrated oil and gas, and Integrated (Major) oil and
gas companies make up two thirds (66.8%) of respondents
Base: n=605 respondents

3.5%
7.4%
12.2%
20.5%
26.4%
29.9%
0% 5% 10% 15% 20% 25% 30% 35%
Health, Safety, Security Environment and SocialResponsibility
Management and Information
Projects, Facilities and Construction
Product and Operations
Reservoir Description and Dynamics
Drilling and Completions
Primary technical discipline
Drilling and Completions (29.9%), Reservoir Description and Dynamics
(26.4%), and Production and Operations make up the main primary technical
disciplines of respondents
Base: n=605 respondents
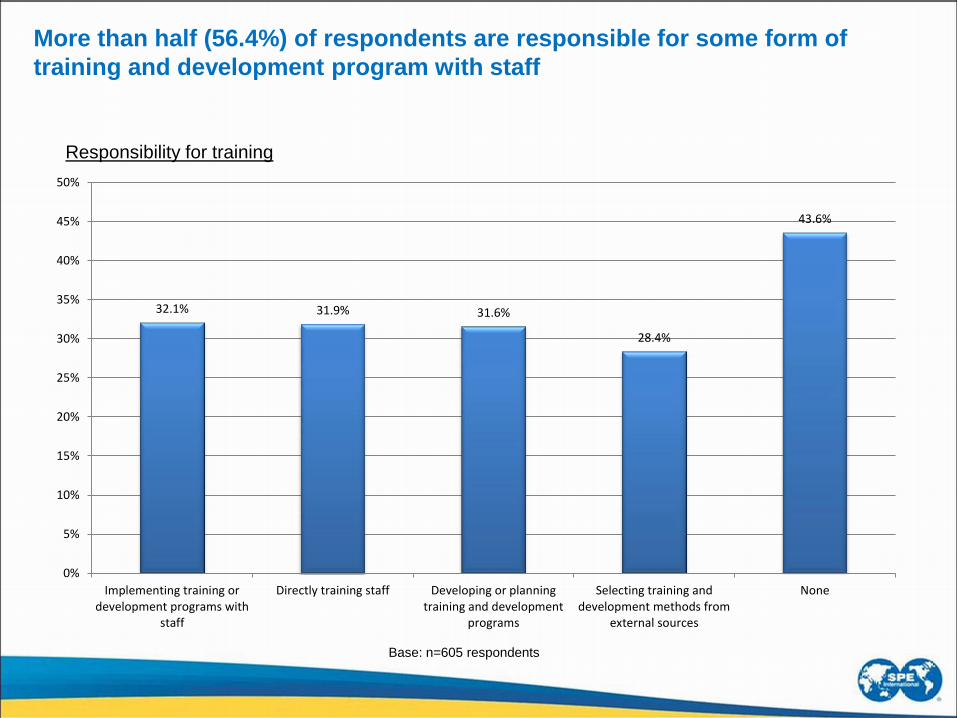
32.1% 31.9% 31.6%
28.4%
43.6%
0%
5%
10%
15%
20%
25%
30%
35%
40%
45%
50%
Implementing training ordevelopment programs with
staff
Directly training staff Developing or planningtraining and development
programs
Selecting training anddevelopment methods from
external sources
None
Responsibility for training
More than half (56.4%) of respondents are responsible for some form of
training and development program with staff
Base: n=605 respondents