Embed Size (px)
Citation preview

1
Trainee Pack 2015/16

2
Table of contents Section Page
Welcome
3
Overview
6
The Project What will I need to do? A working example
Other examples
7 9
10
Different QI methodologies that might help you get started putting your idea into action
Process mapping Driver diagrams Runcharts Why measure frequently?
Time planner Supervisor/trainee meeting template
Top tips for a successful project Quality Improvement one step at a time Forms
Project Plan template Quality Improvement Project Assessment Tool Project Report Powerpoint oral presentation template Powerpoint poster presentation template
Frequently asked questions
11 13 16 18
15 20
21 22
23 25 27 30
35 36
Useful websites 37

3
Welcome!
Learning To Make a Difference (LTMD) is an initiative for core medical trainees to learn, develop and embed new skills in quality improvement and put these new skills into practice. Introducing quality improvement methodology into training enables a trainee to make a real difference to the quality of their clinical practice, team work and most importantly to patient care. This initiative is led by The Royal College of Physicians of London (RCP (London)) and the Joint Royal Colleges of Physicians Training Board (JRCPTB) working together to develop training for core medical trainees. It is supported by Health Education England. There is a mandatory requirement to undertake an audit or a quality improvement project in a training year. Audit is quality improvement and if an audit is done, QI methodology for the implementation of change part of the cycle should be used. Learn more about the exciting developments over the last year by visiting the website: http://www.rcplondon.ac.uk/projects/learning-make-difference-ltmd In 2010/11, 61 CMT trainees completed 46 QI projects within a 4-6 month training post. In their evaluation trainees highlighted the valuable and meaningful role a junior doctor can play in quality improvement. Quality improvement was seen as a realtime, dynamic process by both the trainees and their consultant supervisors involved in the LTMD project. Making focused small scale change through a simple structured framework enabled visible effective change to happen within the timeframe of a training post. The value of involving frontline junior doctors in making a real difference to patient care cannot be underestimated. We have used the considerable learning from the LTMD pilot to help get the next steps and support right. Using this approach, provides a real means for trainees to respond to the theme of learned helplessness identified in the Francis Report and not accept mediocrity in their clinical practice. This pack provides the tools to get started and complete a quality improvement project, supported by a consultant supervisor, with further central support coming from the RCP/JRCPTB. We recommend identifying a specific aspect of clinical practice that you think could be done better. This might be your own idea (encouraged!) or it might be an idea identified by a previous peer from working in that environment, from the team you are working with or aligned to the Trust’s quality and safety agenda. You might wish to work on your own or as a group of trainees. A consultant supervisor can help you identify a suitable topic for your project. Over the training year that you have to complete your project, you would work with your supervisor to plan, implement and evaluate the success of your chosen quality improvement intervention. This pack is designed to give you some of the information that you need to get started with your chosen quality improvement project. We wish you the best of luck with your project, and hope that you find the process of completing it a worthwhile and enjoyable educational experience.

4
What does this mean in practice?
Aim How? Time-frame
All core medical trainees to do a QIP during the training year
Provided with resources and supported by a supervisor
2015-2016
Expectation set by TPDs Powerpoint presentation at August induction Aug 2015
Follow up presentation by QI leads
Face to face presentations by new QI leads and/or clinical lead
Sept/Oct 2015
Each trainee to think of a potential improvement idea (work on own, in small group)
Think about what frustrates you, what is bothersome, what is your department where you are working or the trust’s quality agenda Multi-disciplinary team approach
Sept/Oct 2015
Each trainee to start to develop an understanding of the framework
Read the LTMD tool kits, review the website and learn about QI projects already done
Sept/Oct 2015
Getting started Identify your supervisor Complete the project plan Submit project title to JRCPTB central database
Oct/Nov 2015
Complete project May 2016 Present regionally with potential national presentation June 2016
May/Jun 2016
Key features for 2015
E-portfolio changes o All documentation is now on the e-portfolio and should be completed in
conjunction with your supervisor. Go to 'assessment' then 'others' then 'add assessment'
o This includes the Trainee Project Plan at the start of your project and the Quality Improvement Project Assessment Tool (QIPAT) and the Project Report Template at the end of your project.
Curriculum changes o Clinical audit section heading changed to ‘QI (which may include audit)’
and knowledge , skills and behaviours changed to reflect this along with level descriptors
Consultant clinical leaders to support CMT trainees in English Deaneries
Each trainee submits QI project title and aim to JRCPTB central data base – [email protected]
Updated website with further resources
Monthly WebEx for trainees to dial into for support from the Clinical Leaders
Possible RCP Showcase event – all trainees have opportunity to be selected by their LETB and nominated to represent their LETB

5
Support Don’t wait to be asked to make an improvement – use this approach to make a real difference! Good luck and enjoy the experience! With best wishes
Dr Emma Vaux JRCPTB Associate Medical Director and LTMD Project Lead [email protected]
LTMD Lead: Dr Emma Vaux ([email protected]) LTMD Project Manager: Katharine Woodall ([email protected])
The Clinical Leaders in Quality Improvement and the LETBs they cover are:
Richard Berrisford [email protected] South West* and Wessex
Seema Srivastava Tricia Woodhead
[email protected] [email protected]
South West* and Kent, Surrey, and Sussex
Elizabeth Haxby [email protected] North West London, South London and North Central and East London
Ann Tweddel [email protected] North East and Yorkshire and the Humber
Stephen Webb [email protected] East of England and East Midlands
Emma Vaux [email protected] Thames Valley, North West, West Midlands, Mersey, Wales, Northern Ireland and Scotland
*Richard Berrisford, Tricia Woodhead and Seema Srivastava jointly cover the South West LETB area.

6
Overview
PLA
N
What is learning to make a difference?
An opportunity to learn about quality improvement methodology and put this new knowledge into practice…..learn by doing
An opportunity to do a quality improvement project as part of your training programme
Being part of making a difference at the frontline ie an opportunity to learn about QI in practice and how small scale change can make a difference to patient care
What are we asking you to do?
Each trainee, supervised by their clinical or educational supervisor, does a small scale quality improvement project to complete within their training year.
This may be done on your own, with a group of trainees and/or involving the multi-disciplinary team (encouraged).
The QI project may be done in place of the current clinical audit requirement. This is very new to most and we are providing guidance and support for this process. Ideally your idea would be tested using a simple structured framework. The following working examples should help illustrate this. The structure of Plan Do Study Act (PDSA) would be used as a framework to plan the project and focus the aim (see below) Register your project with the LTMD central database
DO
Implement your quality improvement project
The project would usually run over a period of 4 to 6 months
STU
DY
Evaluate the change(s) the quality improvement project has made
AC
T
Adopt, reject or modify the change plan
Reflect on your learning from your project and how you might use this to inform any further changes, broader application or a future project
Complete the QI project assessment tool on the e-portfolio
There is a QI project template to help you write your report up, and a Powerpoint template to aid presentation of your work

7
The Project: what will I need to do? Use the PDSA (Plan, Do, Study, Act) cycle to help structure your work
This simple cycle may be used to develop, test, or implement a change on a small scale in a real work setting. It is all about the preparation.
You will require support from your supervisor to test out your ideas before you start.
The 3 most important areas to get right are having a focussed aim, identifying what change(s) you plan to make and knowing what you are going to measure before you make any change and then as you go
PLA
N
Define the aim of your project:
Ask yourself ‘what do I want to accomplish’?
Make sure your aim is SMART – specific, measurable, achievable, realistic, timely (eg By the end of 4 months 100% of patients admitted on the clinical decision unit with neutropenic sepsis will have their antibiotics given within 1 hour of admission)
Plan to answer questions: Who, What, When, Where, Why?
What improvement ideas do I have?
Determine the change/concept to be implemented that might make an improvement? (eg Checklist)
Plan your time Plan for collection of data: Who, What, When, Where?
How am I going to measure the impact? What are the definitions for the measures I will be using?
How will I measure the baseline?
How will I set a target? It is very important to determine the measures needed to see how you will know the change has made a difference/improvement? There are 3 types of measures Process measures – the workings of the system eg time to an antibiotic being given Outcome measures – what difference was made eg number of patients with neutropenic sepsis treated with antibiotics within 1 hour Balancing measures – what is the risk? Are you disadvantaging another area?
Record your progress through the project on the progress template:
Predictions: What do you expect to see and why?
What consequences may there be?
Could the change make something worse?

8
DO
Carry out the change or test and record what happened
Use a run chart to record the pattern of data that you can observe as you make changes
Document problems and unexpected observations
Begin analysis of data
STU
DY
Complete analysis of data and record your results
Compare the data to your predictions
What did you learn?
AC
T
What modifications are needed? Are you ready to make another change?
Outline plan for the next cycle
Keep refining the change until it is ready for broader implementation and embed in everyday practice

9
The Project: a working example
PLA
N
What is the quality improvement being sought?
Objective: No unnecessary urinary catheter insertions Aim: I want to reduce the number of unnecessary urinary catheterisations in all acute admissions to the clinical decision unit over a three month period. The target is 100% appropriate urinary catheterisation.
Why do you want to look at this particular question? During my time on the CDU I was struck by how many catheters were inserted for no clear indication and very poor documentation. The commonest cause of HCAI is the urinary catheter. Catheter insertion is associated with a significant number of other complications such as local trauma.
Plan my time Refer to the Time Planner Tool
What am I going to measure to know any change I make is having an effect?
1. Number of clinically indicated and non-clinically indicated urinary catheter insertions (as per Trust policy) for all patients admitted to the CDU 2. Measure once a week for 4 weeks before implementing any change 3 Keep measuring weekly following the first change, and any subsequent modifications of any change I will know the planned change has made a difference/improvement if there are an increased proportion of clinically indicated insertions The balancing outcome would be the number of patients who do not get a urinary catheter inserted when clinically indicated.
Select change The proposed change is to implement a checklist (in the form of a sticker placed in the case notes) that must be completed PRIOR to the insertion of a catheter for every applicable patient to raise an awareness of what the clinical indications are for urinary catheter insertion.
DO
Implement the change
Implement the checklist with appropriate education for medical and nursing staff.
Project progress Meet with my supervisor at arranged meeting times
STU
DY
Evaluate the change Using the established measures
Process: Number of patients where checklist used Outcome: Number of appropriate vs. inappropriate catheters Balancing: Number of patients who should have had a catheter inserted but did not

10
AC
T Adopt, reject or modify the change plan
After the first PDSA cycle: Positive change seen on run chart with increasing numbers of appropriate catheter insertions but checklist only used in 66% of catheter insertions
2nd PDSA cycle: New change made: Checklist content modified 3rd PDSA cycle: New change made: Checklist attached to catheter pack
Other examples 1. Aim: To reduce number of inappropriate requests for D-Dimers in emergency
admissions to clinical decision unit over a 4 month period by 75% – there is a Trust protocol, why is it not used? (Test out completing a checklist prior to request in CDU).
2. Aim: To increase VTE prophylaxis prescription in emergency admission elderly care patients to Ward 12 to 100% over a three month period (test out possible solution eg put tinzaparin pre-printed sticker on drug chart).
3. Aim: To reduce number of cannulae inserted into inappropriate arm veins in patients with chronic kidney disease on Ward 5 by 80% over a 5 month period (test out wrist band for patients with CKD).
4. Aim: To improve communication at doctor handover over a 6 week period as measured by completion of new handover sheet at 10pm handover time for all surgical areas (test out new method of handover).
.
11
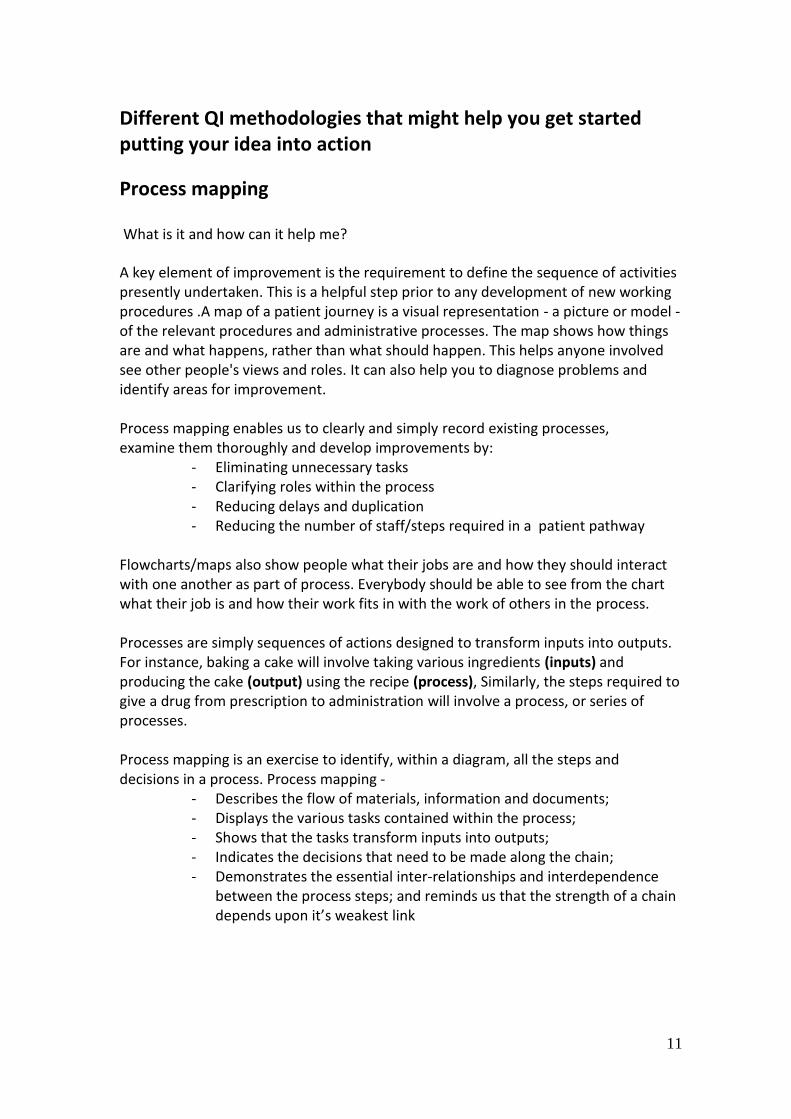
Different QI methodologies that might help you get started putting your idea into action
Process mapping
What is it and how can it help me?
A key element of improvement is the requirement to define the sequence of activities presently undertaken. This is a helpful step prior to any development of new working procedures .A map of a patient journey is a visual representation - a picture or model - of the relevant procedures and administrative processes. The map shows how things are and what happens, rather than what should happen. This helps anyone involved see other people's views and roles. It can also help you to diagnose problems and identify areas for improvement. Process mapping enables us to clearly and simply record existing processes, examine them thoroughly and develop improvements by:
- Eliminating unnecessary tasks - Clarifying roles within the process - Reducing delays and duplication - Reducing the number of staff/steps required in a patient pathway
Flowcharts/maps also show people what their jobs are and how they should interact with one another as part of process. Everybody should be able to see from the chart what their job is and how their work fits in with the work of others in the process. Processes are simply sequences of actions designed to transform inputs into outputs. For instance, baking a cake will involve taking various ingredients (inputs) and producing the cake (output) using the recipe (process), Similarly, the steps required to give a drug from prescription to administration will involve a process, or series of processes. Process mapping is an exercise to identify, within a diagram, all the steps and decisions in a process. Process mapping ‐
- Describes the flow of materials, information and documents; - Displays the various tasks contained within the process; - Shows that the tasks transform inputs into outputs; - Indicates the decisions that need to be made along the chain; - Demonstrates the essential inter‐relationships and interdependence
between the process steps; and reminds us that the strength of a chain depends upon it’s weakest link

12
Examples 1Insertion of long term peritoneal drains in patients with recurrent malignant ascites
Making Every Moment Count
Process mapping
Patient contacts
CNS/Ward
Bed has to be
found or patient
presents via A&E
Patient admitted
Drain
arranged
with
radiology
Intermittent drain
placed
Patient
discharged
Patient
develops
ascites
Management
of recurrent
ascites
2012
2. Improve to over 90% the proportion of nurses who can identify and contact the responsible doctor on a weekend
Quality Improvement Project Title:
Many not aware of list/new weekendworking arrangements and tried to usenight on call bleep
The process of identifying consultantand firm number hits several barriers (not recorded on WR entries, handoverof firms means this changes over time)
Nurses not regular on the wards didnot know of ‘firm numbers’
The initial bleep list featured firm numberonly and not consultant name
Learning To Make a Difference
Process mappingProcess mapping
Oxford University Hospitals

13
Driver diagrams
A driver diagram can be used to plan improvement project activities. They provide a way of systematically laying out aspects of an improvement project so they can be discussed and agreed on.
How to use it?
A driver diagram organises information on proposed activities so the relationships between the aim of the improvement project and the changes to be tested and implemented are made clear.
A driver diagram has three columns - Outcome, Primary drivers and Secondary Drivers.
Outcome: Can be derived from your SMART aim.
Primary Drivers: A set of factors or improvement areas that we believe must be addressed to achieve the desired outcome. They should be written as straightforward statements rather than as numeric targets.
Secondary Drivers: Specific areas where we plan changes or interventions. Each secondary driver will contribute to at least one primary driver. They should be process changes that we have reason to think will impact the outcome (should have an evidence base). They should be necessary and (collectively) sufficient to achieve the aim.
Ideas for consideration as drivers can be generated by in a number of different ways
A Driver Diagram helps us complete the framework contained in the Model for Improvement tool. It allows us allows us to link the first question - What are we trying to accomplish? and the third What change(s) can we make that will result in improvement?
By making the aim, and the changes we will test and implement, explicit it also allows us to determine what measures we will need to track to answer the Model for Improvement's second question - 'How will we know that a change is an improvement?'
14
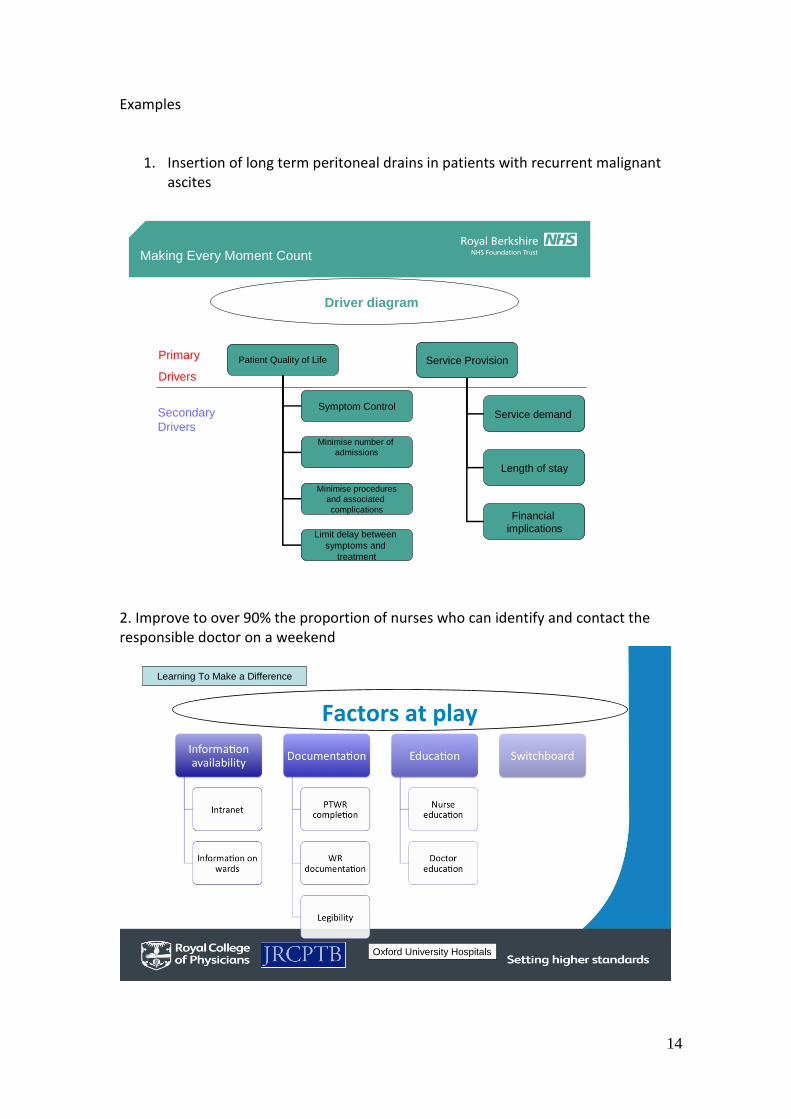
Examples
1. Insertion of long term peritoneal drains in patients with recurrent malignant ascites
Making Every Moment Count
Driver diagram
Patient Quality of Life
Symptom Control
Minimise number of
admissions
Minimise procedures
and associated
complications
Limit delay between
symptoms and
treatment
Service Provision
Service demand
Length of stay
Financial
implications
Primary
Drivers
Secondary
Drivers
2. Improve to over 90% the proportion of nurses who can identify and contact the responsible doctor on a weekend
Quality Improvement Project Title: Learning To Make a Difference
Factors at play
Oxford University Hospitals

15
3. Timely electronic discharge letter completion
Primary Drivers
•Junior doctor availability
•Opportunities for completion
•Time needed for completion
Secondary Drivers
Discharge
decision
•Ward round times
•Ward round structure
•Consultant-led decision making
•Elective admission- predictable
•Emergency admission
•TTO completion
•Opening times
•Ward pharmacist
•portering
•Information to GP
•Mandatory
•format
•coding
EDL
completion
Pharmacy
Content
AIM:
Increase
number of
EDLs
completed
within 24
hours of
discharge
to enable
effective
discharge
planning
This can then generate ideas for QI projects
Primary Drivers
•Junior doctor time
•Opportunities for completion
Secondary Drivers
Discharge decision
•Ward round times
•Ward round structure
•Consultant-led decision making
•Elective admission- predictable
•Emergency admission
•TTO completion
•Opening times
•Ward pharmacist
•portering •Information to GP
•Mandatory
•format
•coding
EDL completion
Pharmacy
Content
AIM: Increase number of EDLs completed within 24 hours of discharge to enable effective discharge planning
WR Structure: Sick, discharges, then rest
Pocket card guidance
Nurse-led discharge
7 day week working
Junior dr not to theatre until completed
Event driven discharge
Step down ward

16
What is a Run Chart? Improvement takes place over time. Determining if improvement has really happened and if it is lasting requires observing patterns over time. Run charts are graphs of data over time and are one of the single most important tools in performance improvement. Frequent measurements will be needed to determine impact of changes Run charts are a good visual way to show how much variation there is in your process over time. Plotting data over time is a simple and effective way to determine whether the changes you are making are leading to improvement.
Start building your run chart from the beginning as soon as you obtain data
Plot date on x axis
Plot data on y axis
Draw a median line
Place a goal line – Keeping the goal line on every graph ensures everyone viewing the graph can see at a glance where the work is at in relation to achieving the aim
Annotate any changes you make with each PDSA cycle
0
1
2
3
4
5
6
7
8
9
1 2 3 4 5 6 7 8 9 10 11 12 13
Introduction check list
check list modified check list attached
to urinary catheter packs
Median
Goal
Number of inappropriate urinary catheter insertions
Weeks
0
1
2
3
4
5
6
7
8
9
1 2 3 4 5 6 7 8 9 10 11 12 13
Introduction check list
check list modified check list attached
to urinary catheter packs
0
1
2
3
4
5
6
7
8
9
1 2 3 4 5 6 7 8 9 10 11 12 13
Introduction Check list
check list modified check list attached
to urinary catheter packs

17
How do I know whether changes are an improvement? There are 4 tests that you can apply to run charts to help you identify what’s happening after you’ve made a change and therefore determine whether it is really an improvement. Test 1: 6 or more consecutive points above or below the mean These runs indicate a shift in the process and if this is in the right direction, it is likely that the change you made is having a beneficial effect. Test 2: 5 or more consecutive points all increasing or decreasing This indicates a trend and suggests that the change you made is having an effect but you don’t know yet where performance will become stable again. You need to keep measuring to find out. This situation is more likely to occur if you are rolling out a change over a period of time. More measurement is needed in the example above to demonstrate if there has been a likely beneficial change. Test 3: Too many or too few runs Too many runs suggest the process has become less consistent and it is possible that your change has had a detrimental effect. Too few runs suggest a more consistent process. Test 4: An “astronomical” data point You should use your own judgement to assess whether the result in question really is ‘odd’.

18
Why measure frequently?
2 data points tell us very little and we make assumptions about the bit in between “When you have two data points, it is very likely that one will be different from the other.”
W. Edwards Deming
Below each unit has the same 24 data values ordered differently over time
Each unit has the same average before and after the change
For unit 1 the change has resulted in an improvement; for unit 2 there was an improvement already happening before the change made; for unit 3, there was an initial improvement which is now getting worse
Use of run charts to track changes
Perla R. BMJ Qual Saf 2011; 20: 46-51

19
PLAN YOUR TIME: The Project Time Planner
Week
Activity 1 2 3 4 5 6 7 8 9 10 11 12 13 14 15
Check-ins with supervisor to complete progress (see meeting template)
● ● ● ● ● ● ● ●
Determine initial aim with supervisor
●
Determine measurement approach
●
Set target ●
Identify those involved ●
Establish baseline ● ● ●
Introduce small scale tests of change
● ● ● ● ●
Analyse findings and refine next test
● ● ● ●
Report findings of next test ● ● ●
Supervisor to complete QIP assessment tool with trainee.
●
Complete Project report and send a copy to the LTMD team at the RCP
●

20
Supervisor/trainee project progress meeting template
Date of meeting: Project week no.
Comments Are you clear in what you trying to achieve?
Is the planned change SMART (specific, measurable, achievable, realistic, timely)?
What test cycles have you completed?
What is going well?
What obstacles are in the way?
What is the next step?
What is the run chart showing?
What were the surprises?
How do we address them?
Who should be taking the next steps and when should they happen?

21
The Project: TOP TIPS for a successful learning to make a difference project
Learning to make a difference is all about trying out small scale tests of change to demonstrate to doctors that they can reduce harm and improve the quality of patient care. Think about your objective: what is it that you want to accomplish?
Be clear and focussed in your aim – test it out with your supervisor and those working with you
Think of a change that you can make that might result in improvement
Think of something that you have come across that is of poor quality or affects patient safety or experience or is a waste of time
Be organised: Plan your time
You usually have 12-16 weeks
Use the progress template to help you chart your progress with your project and keep you on track
Who will you ask to help you?
You may wish to do this project as part of a group, often a good idea
Have regular check-ins with your supervisor
Think about what resources you might need – keep costs low while you prove whether your idea works or not
Think about what other support and who else you might need for the project in addition to your supervisor
Remember the wider multidisciplinary team such as pharmacists, AHPs, nurses, other doctors and how you might need to engage them
Has everyone been told who needs to be? Now try making a change and evaluate it: did it work?
Make sure you know what to measure to know that a change is an improvement
The measuring process should be straightforward so there is no doubting the improvements made
If it works build on the improvement – eg include other doctors, try it on more patients, do it for more that one day, use it on more than one ward
Document your project: what have you learned?
Use the PDSA cycle (Plan, Do, Study, Act) as the framework for your project
Be clear about what was learnt
Be clear about what worked and what didn’t
Incorporate suggestions from all those involved to avoid a feeling of the project being imposed on them
Record your results on a run chart so you can see the changes taking place over time

22

23
Learning To Make a Difference Trainee Project plan
(Please complete this on the e-portfolio. Go to 'assessment' then 'others' then 'add assessment')
1. Name:
2. Grade:
3. Current clinical area:
4. Contact telephone number:
5. Are you working with others on this/ If yes state who:
6. Consultant Supervisor:
7. Project Title:
8. Project Aim Make sure your aim is SMART – Specific, Measurable, Achievable, Realistic, Timely (eg By the end of 4 months 100% of patients admitted on the clinical decision unit with neutropenic sepsis will have their antibiotics given within 1 hour of admission)
9. What difference do you hope to achieve by doing this particular project? Why do you want to look at this particular question? ie why does it matter to you? What are you planning to do? ie what change(s) are you planning to make? What do predict might happen when you make this change? (it is always good to have a go at this before you start as helps keep you focussed)
10. What are you going to measure to know whether the changes you make are having the desired effect? What and how will I measure the baseline before I make the first change? What is my goal?
11. How frequently are you going to do this? Remember little and often
12. Have you identified balancing measures? ie what might the unintended consequences be by making the change you want to do? What is the risk? Are you disadvantaging another area?

24
13. What is your anticipated time frame for this project? Keep it realistic – most projects would be 4 to 6 months
14. When do you plan to start?
15. Have you identified all the relevant stakeholders to communicate your project with/ to? Always best to let as many people know as possible particularly the multi-disciplinary team

25
Quality Improvement Assessment Tool may now be accessed on the e-
portfolio. To complete at the end of your QI project with your supervisor. Go to
'assessment' then 'others' then 'add assessment'
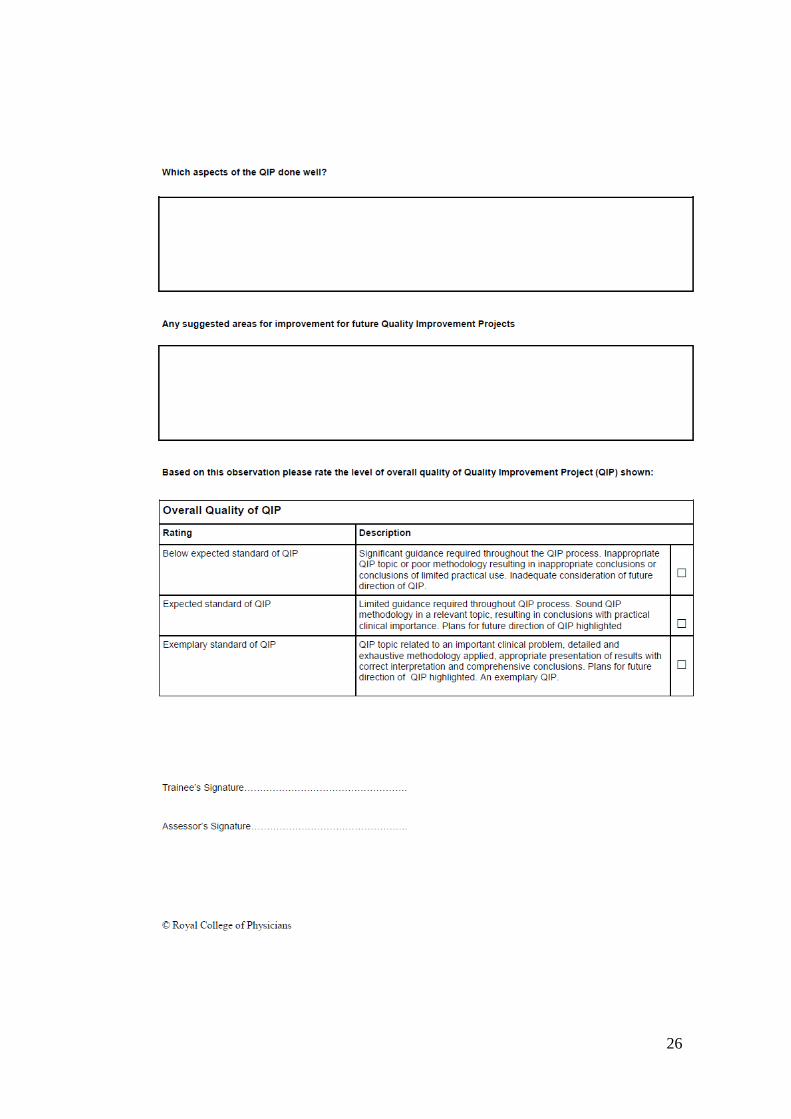
26
27
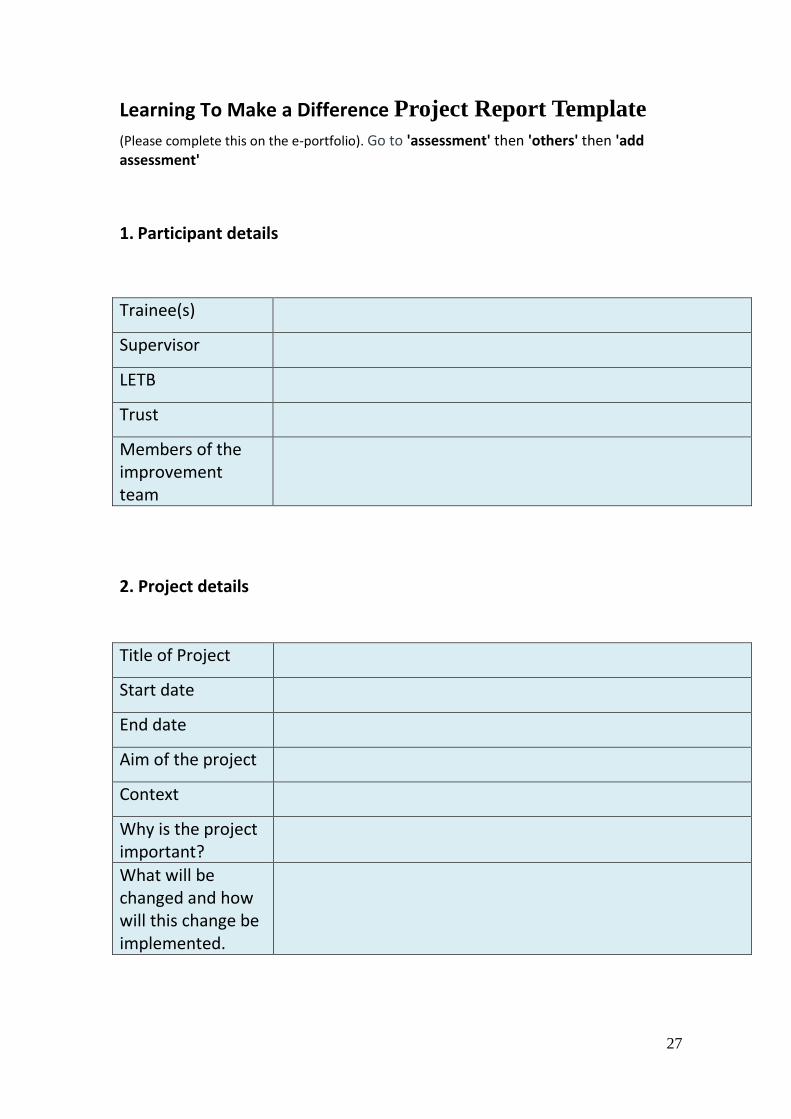
Learning To Make a Difference Project Report Template
(Please complete this on the e-portfolio). Go to 'assessment' then 'others' then 'add assessment'
1. Participant details
Trainee(s)
Supervisor
LETB
Trust
Members of the improvement team
2. Project details
Title of Project
Start date
End date
Aim of the project
Context
Why is the project important?
What will be changed and how will this change be implemented.

28
3. Measures Measures track progress towards your goals and should include outcome (directly related to goals), process and balancing measures (aimed to detect any adverse consequences of the implemented change).
Outcome measures
Process measures
Balancing measures
4. Results Record your results separately. You will need to include:
1. PDSA cycles 2. A run chart of improvement measure(s) 3. A summary of any difference(s) made.

29
5. Keys to Success, Barriers and Lessons Learned Major keys to your project’s success:
Barriers to your project’s success:
Lessons learned to date about the changes you have tested:
6. Next Steps What are the next steps for your quality improvement project?

30
POWERPOINT PRESENTATION TEMPLATES (available on website)
Oral presentation

31

32

33

34

35
Poster presentation (available on website)
Learning To Make a Difference
NAME OF TRUST
Type quality Improvement project title here
Type trainees name(s) here
Supervisor & team members:
Project Aims: specific project aims – SMART aim
Changes: What changes have you tested? PDSA 1
PDSA 2
Identify: what was proposed, what has been tested, what was successful and what has been implemented.
Graphs of Measures: Insert your run charts or other progress measure. Make fonts large, title, labels, dates and notes very simple on graphs prior to shrinking.
Next Steps: What do you plan to do next?
What do you need?
Recommendations:
What was your learning from this project?
The Difference Made and relevance to practice and patient safety:
Background: Include the reason for undertaking the project
Summary

36
Frequently asked questions
What support will I get?
You will get support from your supervisor (educational or clinical), your CMT TPD and local College Tutor. You may also have a quality improvement champions in your Trust or within your LETB. In addition, your medical director has been informed of this project. There may be further support from IHI and Health Foundation Fellows or a Clinical Leader in Quality Improvement (see page 5); your local lead will have more information. Where are the QI forms on the e-portfolio? The Trainee Project Plan, the Quality Improvement Project Assessment Tool (QIPAT) and the Project Report Template are found under 'assessment' then 'others' then 'add assessment'. Twitter Follow #LTMAD to find out when the Webex sessions are being held and to get updates on the Learning to Make a Difference programme. Trainees and supervisors can also submit project queries using this hashtag to the QI Leads for fast, expert advice.
Webex The Clinical Leaders in Quality Improvement who will be holding monthly Webex sessions. These sessions may have some presentations or teaching but are also for trainees to dial into for advice. If you want to know when the next Webex session is but are not a Twitter user then please contact Katharine Woodall. What if I need extra help?
You are always welcome to contact the Learning to Make a Difference team. You can e-mail the Project Manager, Katharine Woodall at [email protected] or call her on 020 3075 1210.
Can I do an audit instead of a quality improvement project?
From August 2012, there is an expectation that all Core Medical Trainees will undertake either a quality improvement project or an audit using quality improvement in the change part of the audit cycle. So you can do an audit, but you would use the quality improvement methodology when you come to implement and evaluate the changes you have made.
What do I need to keep in my e-portfolio?
You will need to keep a copy of the QIPAT project assessment tool in your e-portfolio.
What do I need to send to the RCP and how do I send it?
You need to register your project onto the LTMD central database. We would like to see your completed project report please. Please e-mail these to: [email protected] or send to:
Katharine Woodall Project Manager, Learning to Make a Difference

37
Royal College of Physicians 11 St Andrews Place Regent’s Park London NW1 4LE
Useful websites
The following websites contain pages on quality improvement that you may find helpful when completing you project. BMJ Quality http://quality.bmj.com/ Faculty of Medical Leadership and Management https://www.fmlm.ac.uk/ The Health Foundation http://www.health.org.uk/publication/quality-improvement-made-simple Guide to quality improvement Institute for Health Improvement www.ihi.org American site with useful (mainly free) resources. Access provided on registration. International Forum on Quality and Safety in Healthcare http://internationalforum.bmj.com/ NHS Improving Quality http://www.england.nhs.uk/ourwork/qual-clin-lead/nhsiq/ Junior doctors – Agents for Change(BMJ) http://blogs.bmj.com/agentsforchange/category/change-projects/