Embed Size (px)
Citation preview
TRACE ELEMENT ANALYSIS USING A BENCHTOP TXRF-SPECTROMETER
Hagen Stosnach
Röntec GmbH, Berlin, Germany
ABSTRACT Total Reflection X-Ray Fluorescence Analysis (TXRF) is an established technique for trace element analysis in various sample types. Restricted in the past to expensive large-scale systems, in this study the capability of a benchtop system for trace element analysis is reported. By analysing various heavy metals in raw and digested sewage as well as mercury in recycling glass, the suitability of the TXRF system for these kinds of applications could be proven. Based on this data, the benefits, disadvantages, and restrictions of the benchtop system in comparison to other trace element techniques like ICP-OES and AAS are evaluated. INTRODUCTION TXRF has been used for trace element analysis in various fields of application like wafer surface analysis [1,2], organic and inorganic chemistry [3] as well as environmental and aerosol analysis [4,5]. Many additional application fields for TXRF are reported [6,7]. The benefits of this analytical technique are, that it is non-destructive, requires only extremely minute sample amounts, and the analysis, including sample preparation and quantification, is easy to handle. In the past TXRF analysis was restricted to large scaled instruments, which demand the usage of cooling water and liquid nitrogen. In this study a benchtop spectrometer has been used. It is ensured, that with this instrument, similar sensitivities compared to laboratory systems can be achieved even when used for on-site field investigations [8]. To test the capability of this instrument for different types of trace element analysis two different applications have been investigated: analysis of several trace elements in raw and digested sewages, and the determination of mercury in recycling glass. INSTRUMENTATION For all investigations a benchtop TXRF spectrometer (PicoTAX, Röentec, Berlin, Germany) was used. The X-Ray source used in this instrument is an air-cooled low power metal ceramic tube with a Mo anode, operating at 50 keV and 1.0 mA. The Monochromator is a Ni/C multilayer. This excitation allows the determination of the elements from Al to Y (K series) and Pd to U (L series). The detector used in this instrument is a Peltier cooled drift chamber. A summary of the technical specifications of the PicoTAX spectrometer can be found in Table 1.
Copyright ©JCPDS - International Centre for Diffraction Data 2005, Advances in X-ray Analysis, Volume 48. 236 ISSN 1097-0002
This document was presented at the Denver X-ray Conference (DXC) on Applications of X-ray Analysis. Sponsored by the International Centre for Diffraction Data (ICDD). This document is provided by ICDD in cooperation with the authors and presenters of the DXC for the express purpose of educating the scientific community. All copyrights for the document are retained by ICDD. Usage is restricted for the purposes of education and scientific research. DXC Website – www.dxcicdd.com
ICDD Website - www.icdd.com
ISSN 1097-0002
Table 1. Technical specifications of the TXRF spectrometer PicoTAX. X-Ray tube 50 kV, 1 mA, Mo target Element range Al to Y, Pd to U Optics Multilayer Ni/C, 17.5 keV, 80 % reflectivity Detector Drift chamber, 10 mm2, <160 eV resolution Carrier Quartz or other materials, 30 mm diameter Sample station Type 1: Single disc changer Type 2: Sample station with cassette for 25 discs Control PC, data transfer via serial interface Size, weight 600 x 300 x 450 mm, 37 kg Power consumption 150 W SEWAGE ANALYSIS For the analysis of sewages, three different samples have been analysed: a control solution, a raw untreated sewage, and the same sample after aqua regia digestion. The control solution has been prepared by adding different elements from mono element standard solutions to ultrapure water. Digestion of the raw sewage has been done by applying microwave heating to a 1:4 mixture of sewage and aqua regia and subsequently filtration. For comparison purposes the digested sewage sample was analysed by means of ICP-OES. This was not possible for the raw sewage due to its high content of colloidal matter. The aim of the sewage analyses was to assess the possibilities for trace element determination in sewages according to legal regulations. The threshold values regarded in this study are listed in Table 2. With this it was of great importance to test, if a threshold screening of the raw sewage is possible.
Table 2. Treshold values for sewage samples. Element Treshold value (mg/L) As 0.1 Pb 0.5 Cd 0.1 Cr (complete) 2.0 Co 0.5 Cu 1.0 Mo 1.0 Ni 2.0 Zn 2.0 Quantification of TXRF measurements is generally based on internal standardization [7]. Analyzing liquid samples, a standard solution containing a defined quantity of an element not present in the sample is added. For the sewage samples internal standardization was made by adding 5 µL of internal standard solution (Merck Ga solution, 1 g/L) to 1 mL of undiluted sample solution. To test the influence of the colloidal matter in the raw sewage an additional sample was prepared by diluting 0.5 mL of sample solution with 0.5 mL of ultrapure water. After the addition of the internal standard all solutions were homogenized thoroughly. Sample preparation for TXRF analysis demands the sample to be prepared as a thin layer on a reflective media [7]. For the sewage samples this was done by transferring an aliquot of 10 µl sample solution onto a quartz glass carrier using a pipette. Thereafter these specimens were dried
Copyright ©JCPDS - International Centre for Diffraction Data 2005, Advances in X-ray Analysis, Volume 48. 237 ISSN 1097-0002
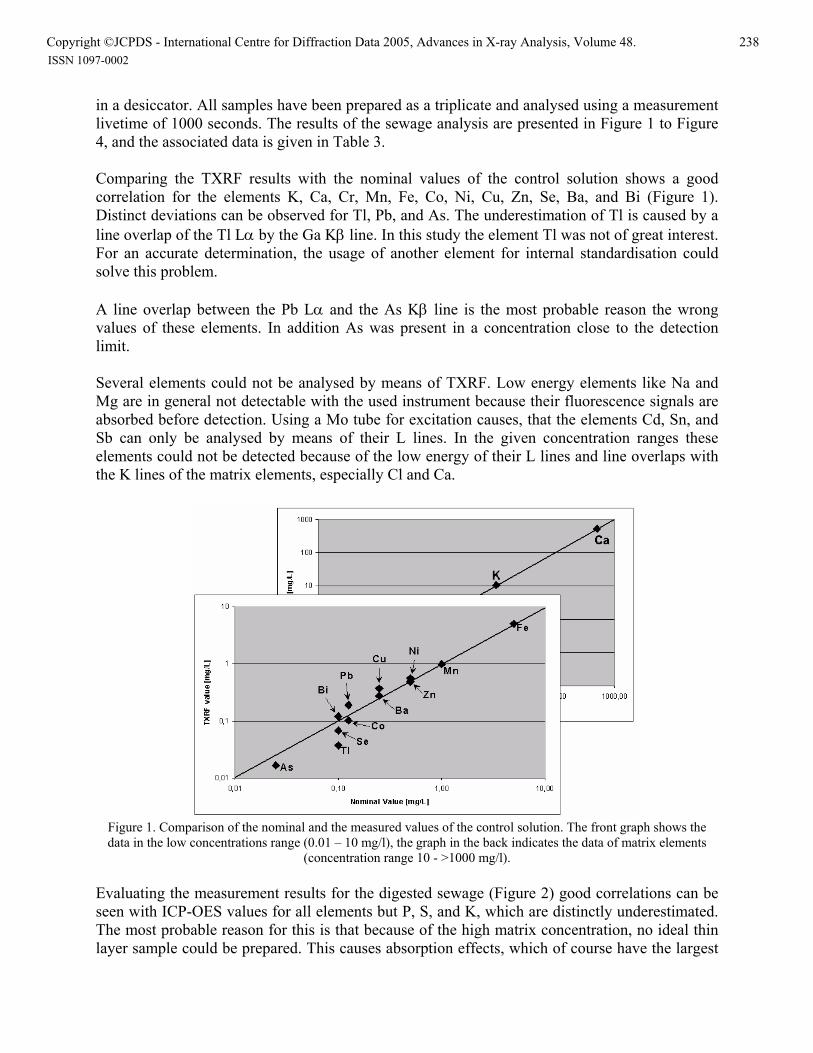
in a desiccator. All samples have been prepared as a triplicate and analysed using a measurement livetime of 1000 seconds. The results of the sewage analysis are presented in Figure 1 to Figure 4, and the associated data is given in Table 3. Comparing the TXRF results with the nominal values of the control solution shows a good correlation for the elements K, Ca, Cr, Mn, Fe, Co, Ni, Cu, Zn, Se, Ba, and Bi (Figure 1). Distinct deviations can be observed for Tl, Pb, and As. The underestimation of Tl is caused by a line overlap of the Tl Lα by the Ga Kβ line. In this study the element Tl was not of great interest. For an accurate determination, the usage of another element for internal standardisation could solve this problem. A line overlap between the Pb Lα and the As Kβ line is the most probable reason the wrong values of these elements. In addition As was present in a concentration close to the detection limit. Several elements could not be analysed by means of TXRF. Low energy elements like Na and Mg are in general not detectable with the used instrument because their fluorescence signals are absorbed before detection. Using a Mo tube for excitation causes, that the elements Cd, Sn, and Sb can only be analysed by means of their L lines. In the given concentration ranges these elements could not be detected because of the low energy of their L lines and line overlaps with the K lines of the matrix elements, especially Cl and Ca.
Figure 1. Comparison of the nominal and the measured values of the control solution. The front graph shows the data in the low concentrations range (0.01 – 10 mg/l), the graph in the back indicates the data of matrix elements
(concentration range 10 - >1000 mg/l). Evaluating the measurement results for the digested sewage (Figure 2) good correlations can be seen with ICP-OES values for all elements but P, S, and K, which are distinctly underestimated. The most probable reason for this is that because of the high matrix concentration, no ideal thin layer sample could be prepared. This causes absorption effects, which of course have the largest
Copyright ©JCPDS - International Centre for Diffraction Data 2005, Advances in X-ray Analysis, Volume 48. 238 ISSN 1097-0002
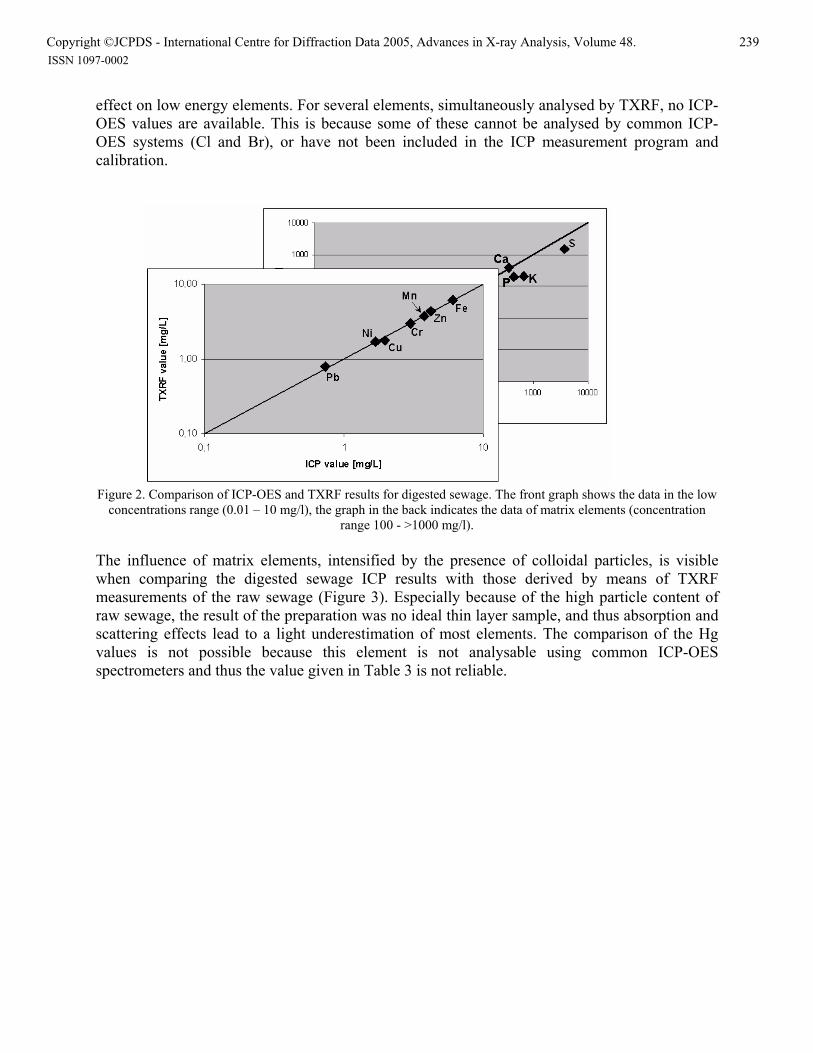
effect on low energy elements. For several elements, simultaneously analysed by TXRF, no ICP-OES values are available. This is because some of these cannot be analysed by common ICP-OES systems (Cl and Br), or have not been included in the ICP measurement program and calibration.
Figure 2. Comparison of ICP-OES and TXRF results for digested sewage. The front graph shows the data in the low concentrations range (0.01 – 10 mg/l), the graph in the back indicates the data of matrix elements (concentration
range 100 - >1000 mg/l). The influence of matrix elements, intensified by the presence of colloidal particles, is visible when comparing the digested sewage ICP results with those derived by means of TXRF measurements of the raw sewage (Figure 3). Especially because of the high particle content of raw sewage, the result of the preparation was no ideal thin layer sample, and thus absorption and scattering effects lead to a light underestimation of most elements. The comparison of the Hg values is not possible because this element is not analysable using common ICP-OES spectrometers and thus the value given in Table 3 is not reliable.
Copyright ©JCPDS - International Centre for Diffraction Data 2005, Advances in X-ray Analysis, Volume 48. 239 ISSN 1097-0002
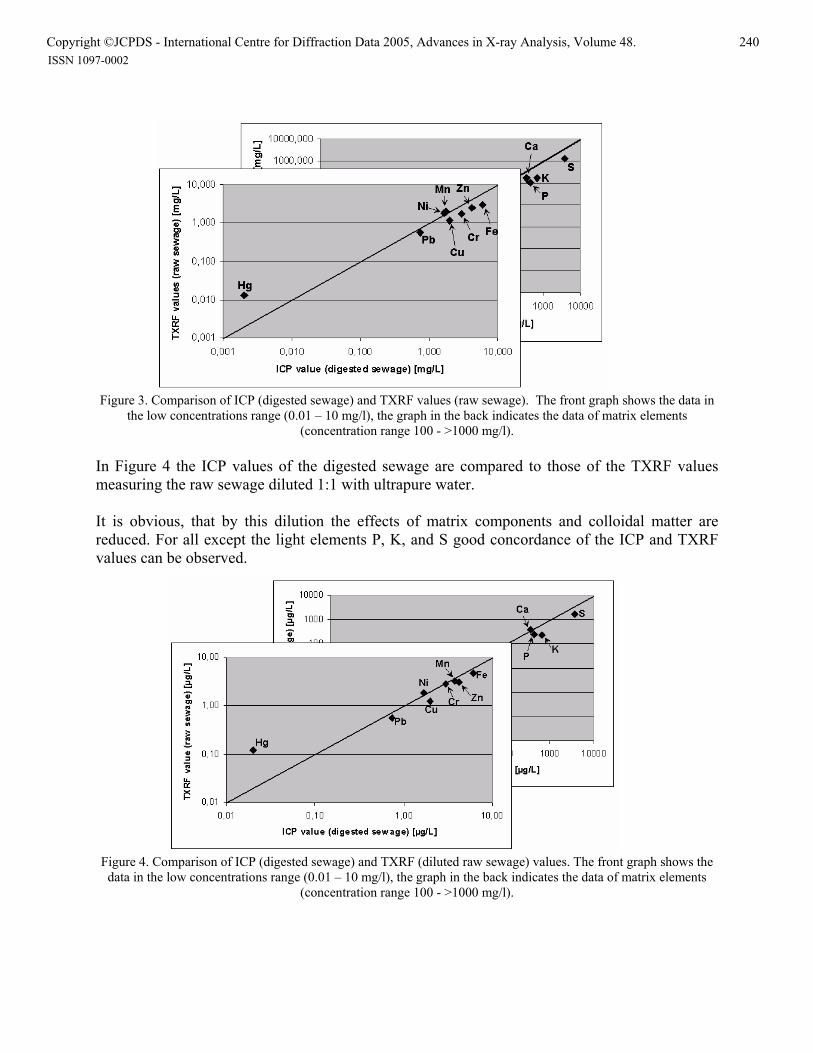
Figure 3. Comparison of ICP (digested sewage) and TXRF values (raw sewage). The front graph shows the data in the low concentrations range (0.01 – 10 mg/l), the graph in the back indicates the data of matrix elements
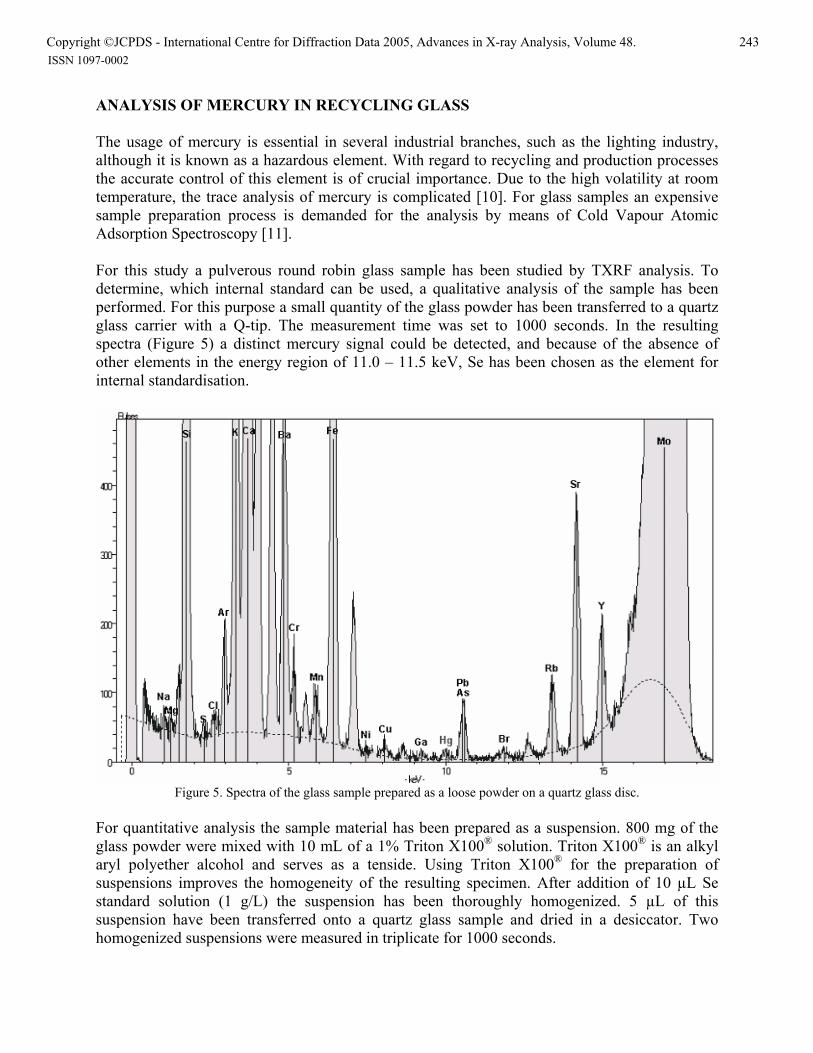
(concentration range 100 - >1000 mg/l). In Figure 4 the ICP values of the digested sewage are compared to those of the TXRF values measuring the raw sewage diluted 1:1 with ultrapure water. It is obvious, that by this dilution the effects of matrix components and colloidal matter are reduced. For all except the light elements P, K, and S good concordance of the ICP and TXRF values can be observed.
Figure 4. Comparison of ICP (digested sewage) and TXRF (diluted raw sewage) values. The front graph shows the data in the low concentrations range (0.01 – 10 mg/l), the graph in the back indicates the data of matrix elements
(concentration range 100 - >1000 mg/l).
Copyright ©JCPDS - International Centre for Diffraction Data 2005, Advances in X-ray Analysis, Volume 48. 240 ISSN 1097-0002

The results of the sewage analyses lead to the conclusion, that TXRF is in general a suitable method for this kind of application. In the analysed control solution all measured elements have been present in concentrations distinctly below the threshold values given in Table 1. Compared with ICP-OES analysis several benefits can be named. First, the sewage can be analysed without the need for digestion. Analysing the sewage without any further treatment, except for the addition of the internal standard, is possible for a “semiquantitative” element screening. By diluting the sample material, accurate results for most elements measurable can be achieved. To perform the analysis without digestion even allows a more accurate analysis of Hg, which is otherwise at least in parts lost during digestion. In addition TXRF is a simultaneous multi-element method and works without the need for external calibration routines. Disadvantages of this method are the comparably long measurement times and the element restrictions. Two of the elements listed in Table 1 could not be detected. Mo was not analysed because a Mo-tube was used. Cd can be detected with the used instrument just by means of the low-intensity L-lines, which are overlapped by the K-lines of the matrix elements, especially Ca and Cl.
Copyright ©JCPDS - International Centre for Diffraction Data 2005, Advances in X-ray Analysis, Volume 48. 241 ISSN 1097-0002

Table 3. Results of the control solution and sewage analysis using ICP-OES and TXRF. All concentrations are given in mg/L.
Control solution Digested sewage Raw sewage (undiluted) Raw sewage (diluted)
Element Nominal value TXRF ICP-OES TXRF TXRF TXRF Na 10 < LLD not analysed < LLD < LLD < LLD Mg 2.5 < LLD not analysed < LLD < LLD < LLD Al 5 < LLD P 25 17 440 202 103 252 S 60.2 35 3720 1515 1328 1719 Cl 212 not analysed 28 821 1110 K 10 10.6 668 207 174 231 Ca 500 541 361 394 167 384 Ti not analysed 5.72 10.70 V not analysed 0.24 Cr 0.5 0.49 3.00 2.95 1.77 2.92 Mn 1 0.98 3.76 3.72 1.96 3.29 Fe 5 5.1 6.07 6.09 2.96 4.70 Co 0.125 0.101 not analysed 0.08 0.05 Ni 0.50 0.55 1.69 1.70 1.85 1.83 Cu 0.25 0.26 1.98 1.76 1.17 1.24 Zn 0.5 0.56 4.20 4.32 2.53 3.11 As 0.025 0.017 Se 0,1 0.07 not analysed 0.03 Br not analysed 1.79 6.89 8.43 Sr not analysed 0.53 0.36 0.58 Mo 0.25 Ag 0.025 < LLD Cd 0.025 < LLD Sn 0.5 < LLD Sb 0.1 < LLD Cs not analysed 2.01 Ba 0.25 0.27 not analysed 0.44 2.36 0.15 Hg 0.025 < LLD 0.02 0.013 0.12 Tl 0.1 0.04 Pb 0.125 0.19 0.74 0.78 0.55 0.57
Bi 0.1 0.12
Copyright ©JCPDS - International Centre for Diffraction Data 2005, Advances in X-ray Analysis, Volume 48. 242 ISSN 1097-0002
ANALYSIS OF MERCURY IN RECYCLING GLASS The usage of mercury is essential in several industrial branches, such as the lighting industry, although it is known as a hazardous element. With regard to recycling and production processes the accurate control of this element is of crucial importance. Due to the high volatility at room temperature, the trace analysis of mercury is complicated [10]. For glass samples an expensive sample preparation process is demanded for the analysis by means of Cold Vapour Atomic Adsorption Spectroscopy [11]. For this study a pulverous round robin glass sample has been studied by TXRF analysis. To determine, which internal standard can be used, a qualitative analysis of the sample has been performed. For this purpose a small quantity of the glass powder has been transferred to a quartz glass carrier with a Q-tip. The measurement time was set to 1000 seconds. In the resulting spectra (Figure 5) a distinct mercury signal could be detected, and because of the absence of other elements in the energy region of 11.0 – 11.5 keV, Se has been chosen as the element for internal standardisation.
Figure 5. Spectra of the glass sample prepared as a loose powder on a quartz glass disc. For quantitative analysis the sample material has been prepared as a suspension. 800 mg of the glass powder were mixed with 10 mL of a 1% Triton X100® solution. Triton X100® is an alkyl aryl polyether alcohol and serves as a tenside. Using Triton X100® for the preparation of suspensions improves the homogeneity of the resulting specimen. After addition of 10 µL Se standard solution (1 g/L) the suspension has been thoroughly homogenized. 5 µL of this suspension have been transferred onto a quartz glass sample and dried in a desiccator. Two homogenized suspensions were measured in triplicate for 1000 seconds.
Copyright ©JCPDS - International Centre for Diffraction Data 2005, Advances in X-ray Analysis, Volume 48. 243 ISSN 1097-0002
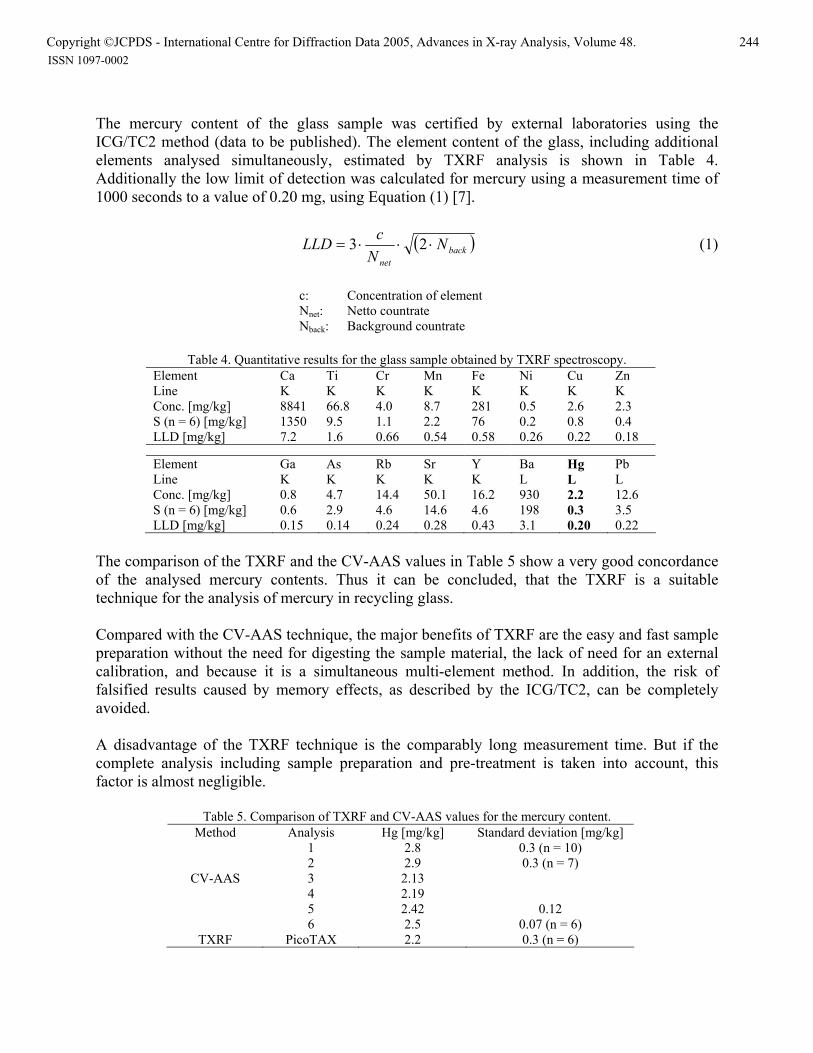
The mercury content of the glass sample was certified by external laboratories using the ICG/TC2 method (data to be published). The element content of the glass, including additional elements analysed simultaneously, estimated by TXRF analysis is shown in Table 4. Additionally the low limit of detection was calculated for mercury using a measurement time of 1000 seconds to a value of 0.20 mg, using Equation (1) [7].
( )backnet
NN
cLLD ⋅⋅⋅= 23 (1)
c: Concentration of element Nnet: Netto countrate Nback: Background countrate
Table 4. Quantitative results for the glass sample obtained by TXRF spectroscopy.
Element Ca Ti Cr Mn Fe Ni Cu Zn Line K K K K K K K K Conc. [mg/kg] 8841 66.8 4.0 8.7 281 0.5 2.6 2.3 S (n = 6) [mg/kg] 1350 9.5 1.1 2.2 76 0.2 0.8 0.4 LLD [mg/kg] 7.2 1.6 0.66 0.54 0.58 0.26 0.22 0.18
Element Ga As Rb Sr Y Ba Hg Pb Line K K K K K L L L Conc. [mg/kg] 0.8 4.7 14.4 50.1 16.2 930 2.2 12.6 S (n = 6) [mg/kg] 0.6 2.9 4.6 14.6 4.6 198 0.3 3.5 LLD [mg/kg] 0.15 0.14 0.24 0.28 0.43 3.1 0.20 0.22
The comparison of the TXRF and the CV-AAS values in Table 5 show a very good concordance of the analysed mercury contents. Thus it can be concluded, that the TXRF is a suitable technique for the analysis of mercury in recycling glass. Compared with the CV-AAS technique, the major benefits of TXRF are the easy and fast sample preparation without the need for digesting the sample material, the lack of need for an external calibration, and because it is a simultaneous multi-element method. In addition, the risk of falsified results caused by memory effects, as described by the ICG/TC2, can be completely avoided. A disadvantage of the TXRF technique is the comparably long measurement time. But if the complete analysis including sample preparation and pre-treatment is taken into account, this factor is almost negligible.
Table 5. Comparison of TXRF and CV-AAS values for the mercury content. Method Analysis Hg [mg/kg] Standard deviation [mg/kg]
1 2.8 0.3 (n = 10) 2 2.9 0.3 (n = 7) 3 2.13 4 2.19 5 2.42 0.12
CV-AAS
6 2.5 0.07 (n = 6) TXRF PicoTAX 2.2 0.3 (n = 6)
Copyright ©JCPDS - International Centre for Diffraction Data 2005, Advances in X-ray Analysis, Volume 48. 244 ISSN 1097-0002
SUMMARY This study has proven that TXRF using a benchtop system is suitable for trace metal analysis in various sample types like raw and digested sewage as well as mercury determination in glass samples. Compared to other trace element techniques like ICP-OES and AAS the following benefits can be named: The easy calibration routine by just using internal standardisation, a relatively easy sample preparation, the lack of needing external media like cooling water or liquid nitrogen, the possibility of simultaneous multi-element analysis, and the complete avoidance of memory effects. A general disadvantage of TXRF is the comparably long measurement time, which however must be evaluated together with the effort for sample preparation. In addition the instrument used in this study has some restrictions with regard to the detectable element range (tube-line elements, low-Z elements and elements just detectable by their L-lines). OUTLOOK The results of this study show that the used benchtop spectrometer has a strong capability for trace element analysis in various sample types. Further investigations of additional sample types will be performed in the future. One main focus will be the mobile usage of the system for on-site analysis, such as that of contaminated soil areas. For an improvement of the analytical capacity the implementation of a W-excitation source as well as of a He-purge system is planned. ACKNOWLEDGEMENTS The author would like to thank the following institutions for their support: Alab AG, Urdorf/Switzerland Germany Society of Glass Technology REFERENCES [1] Fabry, L. et al., Surface and Interface Analysis Vol. 24, 1996, 8, 511-516. [2] Streli, C. et al., X-Ray Spectrometry, 2001, 20, 24-29. [3] Exner, A. et al., Fresenius’ J. Anal. Chem., 2000, 366, 254-259. [4] Mages, M. et al., Adv. X-Ray Anal., 2002, 544-553. [5] Schmeling, H., Spectrochim. Acta, 2001, B56, 2127-2136. [6] Potts, J.P. et al., J. Analy. At. Spectrom., 2001, 16, 1217-1237. [7] Klockenkämper, R., “Total Reflection X-Ray Analysis”, John Wiley & Sons, 1997, 245. [8] Mages, M. et al., Spectrochim. Acta, 2003, B58, 2129-2138. [9] Water pollution control regulation, SR 814 201, Appendix 3.2., 18.12.2001 [10] Flanagan, F.J. et al., Geostandard Newsletter, 1982, 6, 25-46. [11] CV-AAS, Norm 2/99-1194, International Commission on Glass – ICG/TC2
Copyright ©JCPDS - International Centre for Diffraction Data 2005, Advances in X-ray Analysis, Volume 48. 245 ISSN 1097-0002