Embed Size (px)
Citation preview

Journal of Environmental Protection, 2016, 7, 689-698 Published Online April 2016 in SciRes. http://www.scirp.org/journal/jep http://dx.doi.org/10.4236/jep.2016.75061
How to cite this paper: Patel, K.S., Sahu, B.L., Ramteke, S. and Bontempi, E. (2016) Contamination of Paddy Soil and Rice with Arsenic. Journal of Environmental Protection, 7, 689-698. http://dx.doi.org/10.4236/jep.2016.75061
Contamination of Paddy Soil and Rice with Arsenic Khageshwar Singh Patel1, Bharat Lal Sahu1, Shobhana Ramteke1, Elza Bontempi2 1School of Studies in Chemistry/Environmental Science, Pt. Ravishankar Shukla University, Raipur, India 2INSTM and Chemistry for Technologies Laboratory, University of Brescia, Brescia, Italy
Received 22 January 2016; accepted 15 April 2016; published 18 April 2016
Copyright © 2016 by authors and Scientific Research Publishing Inc. This work is licensed under the Creative Commons Attribution International License (CC BY). http://creativecommons.org/licenses/by/4.0/
Abstract The drinking water and food are main pathway entry of the As in humans and animals. Their in-takes cause diseases i.e. skin cancer, vascular disorder, etc. A wide variety of the rice is cultivated in the central India. The field soil and rice cultivated in the summer season at Koudikasa village, central India were selected for the As contamination studies. The concentration (n = 20) of total- As (AsT) in the field soil, rice grain, husk, straw and root was ranged from 44 - 270, 0.17 - 0.72, 0.40 - 1.58, 2.5 - 5.9 and 204 - 354 mg/kg with mean value of 126 ± 28, 0.47 ± 0.07, 0.83 ± 0.15, 4.2 ± 0.5 and 276 ± 21 mg/kg, respectively. The total arsenic, monomethylarsenonate, dimethylarsi- nite and inorganic As in the rice grain are quantified.
Keywords Arsenic, Soil, Rice, Accumulation, Speciation
1. Introduction Arsenic is a toxic metalloid, and its long exposure causes diseases i.e. hypopigmentation, melanosis, keratosis, skin, bladder, lung, and prostate cancer, etc. [1]. Rice is a predominant staple food in many countries i.e. Asia, Pacific, America and Africa. The rice husk and straw are used as fodder for feeding cattle and fuel. The expo-sure of arsenic from rice has been reported a global health issue [2]-[4]. The elevated levels of As in the field soils in various regions of the World were reported [5]-[12]. Arsenic is a bioactive toxic element, accumulated in rice of several regions of the World [13]-[19]. In the present work, the contamination of As in the paddy soil, rice grain, husk, straw and root grown in the contaminated environment, Kaudikasa village, Ambagarh Chowki, central India is described. The speciation and translocation of As in various parts of the rice plants are discussed.

K. S. Patel et al.
690
2. Methods and Materials 2.1. Choice of Study Area The Ambagarh Chowki block, Rajnandgaon district, Chhattisgarh state, India is a hot spot for the As contamina-tion research due to the huge mineralization of As in the environment [20] [21]. The studied area falls in a tribal belt with population of ≈0.1 million over 155 villages. Among them, Koudikasa village (area ≈ 5 km2) was se-lected for the proposed studies due to As contamination of the environment at the hazardous levels.
2.2. Sampling of Soil and Rice Samples The sampling network for collection of field water, soil and rice is presented in Figure 1. The water samples were collected as prescribed in the literatures [22]. Twenty water samples (once in a month) in duplicate from August-November, 2012 were taken from 20 different rice fields. A total of 4 samples, from each field from the
Figure 1. Sampling net-work for collection of the field soil and rice samples in Koudikasa village.
K. S. Patel et al.
691
period: August-November, 2012 was taken for the investigation. They were collected directly from rice field in duplicate, and placed in 250-mL polypropylene plastic bottle. Bottles were first rinsed thrice with the water and then, completely filled with the same water. The first sample was acidified with concentrated nitric acid (0.1%, v/v) for analysis of the As. The second sample was left free for analysis of the ions. The physical parameters i.e. pH and electrical conductivity (EC) of the water were measured at the spot.
Twenty composite soil samples (0 - 10-cm depth) were collected after harvesting of rice paddy (December, 2009) from 20 fields of Koudikasa village as prescribed in the literature [23]. The samples were stored in polye-thylene bottles and dried in open air under diffused sunlight followed by drying in oven at 50˚C for 24 hr. Rice grains were separated from the plants by hand picking in December, 2012 from the field in the polyethylene bag. They were dried in the oven at 50˚C for 24 hr and their husk was separated manually. Similarly, the straw and root of the rice plant were collected. They were washed with the deionized water several times to remove the soil particles. The dried soil, rice grain, husk, straw and root samples were ground to a fine powder with mortar and passed through a mesh sieve of <1 mm.
2.3. Analysis The Bruker S2 Picofox TXRF portable spectrometer was used for the analysis of the elements in soil. A sus-pended solution was prepared by mixing 10 mg of soil sample with 10 ml of a water solution containing 1% (w/v) triton and 10 µg/mL Ga in ultrasonic bath for 15 min. For each measurement, 10 μL of sample solution was sprayed on the quartz filter with subsequent drying. The X-ray source was focused on the filter for quantifi-cation of the elements. The peak area of the signal was computed. The three replicate measurements for each sample were carried out. The content of 14 elements (i.e. P, K, Ca, As, Ti, V, Cr, Mn, Fe, Ni, Cu, Zn and Pb) in each soil was analyzed. The standard soil sample (NCS DC 73382 CRM) was used for the quality control.
The As content in the soil and rice samples were analysed by the ICP-MS and AFS techniques. The samples were digested with nitric acid and H2O2 in Perkin-Elmer microwave system. The total, inorganic and organic As species in the rice grain samples were quantified by using method proposed by Williams et al. [24]. The Rice flour SRM 1568 was used for the quality control.
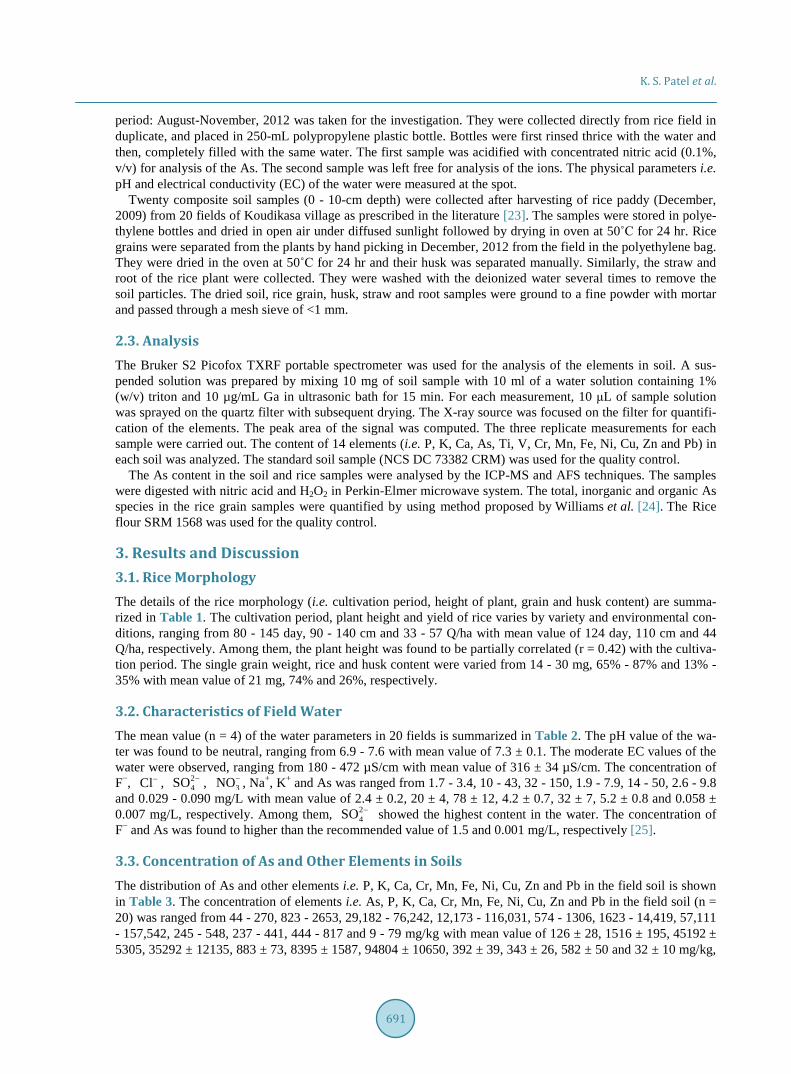
3. Results and Discussion 3.1. Rice Morphology The details of the rice morphology (i.e. cultivation period, height of plant, grain and husk content) are summa-rized in Table 1. The cultivation period, plant height and yield of rice varies by variety and environmental con-ditions, ranging from 80 - 145 day, 90 - 140 cm and 33 - 57 Q/ha with mean value of 124 day, 110 cm and 44 Q/ha, respectively. Among them, the plant height was found to be partially correlated (r = 0.42) with the cultiva-tion period. The single grain weight, rice and husk content were varied from 14 - 30 mg, 65% - 87% and 13% - 35% with mean value of 21 mg, 74% and 26%, respectively.
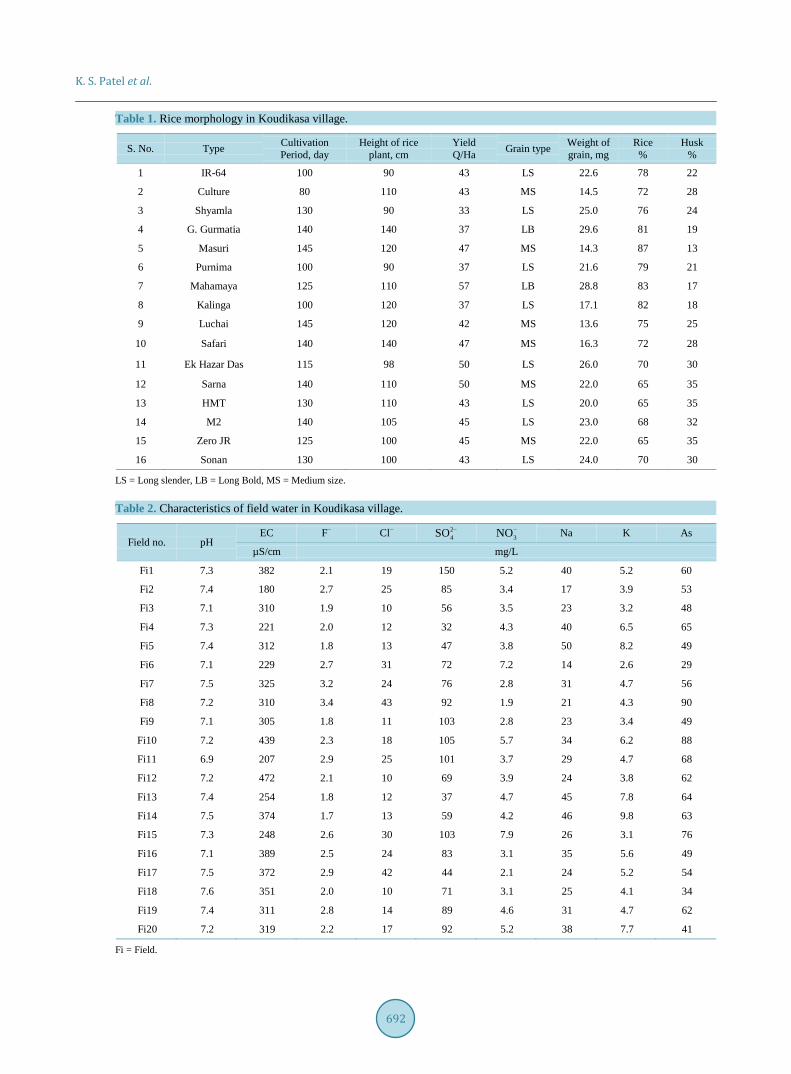
3.2. Characteristics of Field Water The mean value (n = 4) of the water parameters in 20 fields is summarized in Table 2. The pH value of the wa-ter was found to be neutral, ranging from 6.9 - 7.6 with mean value of 7.3 ± 0.1. The moderate EC values of the water were observed, ranging from 180 - 472 µS/cm with mean value of 316 ± 34 µS/cm. The concentration of F−, Cl− , 2
4SO − , 3NO− , Na+, K+ and As was ranged from 1.7 - 3.4, 10 - 43, 32 - 150, 1.9 - 7.9, 14 - 50, 2.6 - 9.8 and 0.029 - 0.090 mg/L with mean value of 2.4 ± 0.2, 20 ± 4, 78 ± 12, 4.2 ± 0.7, 32 ± 7, 5.2 ± 0.8 and 0.058 ± 0.007 mg/L, respectively. Among them, 2
4SO − showed the highest content in the water. The concentration of F− and As was found to higher than the recommended value of 1.5 and 0.001 mg/L, respectively [25].
3.3. Concentration of As and Other Elements in Soils The distribution of As and other elements i.e. P, K, Ca, Cr, Mn, Fe, Ni, Cu, Zn and Pb in the field soil is shown in Table 3. The concentration of elements i.e. As, P, K, Ca, Cr, Mn, Fe, Ni, Cu, Zn and Pb in the field soil (n = 20) was ranged from 44 - 270, 823 - 2653, 29,182 - 76,242, 12,173 - 116,031, 574 - 1306, 1623 - 14,419, 57,111 - 157,542, 245 - 548, 237 - 441, 444 - 817 and 9 - 79 mg/kg with mean value of 126 ± 28, 1516 ± 195, 45192 ± 5305, 35292 ± 12135, 883 ± 73, 8395 ± 1587, 94804 ± 10650, 392 ± 39, 343 ± 26, 582 ± 50 and 32 ± 10 mg/kg,
K. S. Patel et al.
692
Table 1. Rice morphology in Koudikasa village.
S. No. Type Cultivation Period, day
Height of rice plant, cm
Yield Q/Ha Grain type Weight of
grain, mg Rice %
Husk %
1 IR-64 100 90 43 LS 22.6 78 22
2 Culture 80 110 43 MS 14.5 72 28
3 Shyamla 130 90 33 LS 25.0 76 24
4 G. Gurmatia 140 140 37 LB 29.6 81 19
5 Masuri 145 120 47 MS 14.3 87 13
6 Purnima 100 90 37 LS 21.6 79 21
7 Mahamaya 125 110 57 LB 28.8 83 17
8 Kalinga 100 120 37 LS 17.1 82 18
9 Luchai 145 120 42 MS 13.6 75 25
10 Safari 140 140 47 MS 16.3 72 28
11 Ek Hazar Das 115 98 50 LS 26.0 70 30
12 Sarna 140 110 50 MS 22.0 65 35
13 HMT 130 110 43 LS 20.0 65 35
14 M2 140 105 45 LS 23.0 68 32
15 Zero JR 125 100 45 MS 22.0 65 35
16 Sonan 130 100 43 LS 24.0 70 30
LS = Long slender, LB = Long Bold, MS = Medium size.
Table 2. Characteristics of field water in Koudikasa village.
Field no. pH EC F− Cl− 2
4SO − 3NO− Na K As
µS/cm mg/L
Fi1 7.3 382 2.1 19 150 5.2 40 5.2 60
Fi2 7.4 180 2.7 25 85 3.4 17 3.9 53
Fi3 7.1 310 1.9 10 56 3.5 23 3.2 48
Fi4 7.3 221 2.0 12 32 4.3 40 6.5 65
Fi5 7.4 312 1.8 13 47 3.8 50 8.2 49
Fi6 7.1 229 2.7 31 72 7.2 14 2.6 29
Fi7 7.5 325 3.2 24 76 2.8 31 4.7 56
Fi8 7.2 310 3.4 43 92 1.9 21 4.3 90
Fi9 7.1 305 1.8 11 103 2.8 23 3.4 49
Fi10 7.2 439 2.3 18 105 5.7 34 6.2 88
Fi11 6.9 207 2.9 25 101 3.7 29 4.7 68
Fi12 7.2 472 2.1 10 69 3.9 24 3.8 62
Fi13 7.4 254 1.8 12 37 4.7 45 7.8 64
Fi14 7.5 374 1.7 13 59 4.2 46 9.8 63
Fi15 7.3 248 2.6 30 103 7.9 26 3.1 76
Fi16 7.1 389 2.5 24 83 3.1 35 5.6 49
Fi17 7.5 372 2.9 42 44 2.1 24 5.2 54
Fi18 7.6 351 2.0 10 71 3.1 25 4.1 34
Fi19 7.4 311 2.8 14 89 4.6 31 4.7 62
Fi20 7.2 319 2.2 17 92 5.2 38 7.7 41
Fi = Field.

K. S. Patel et al.
693
Table 3. Chemical characteristics of field soil in Koudikasa village, mg/kg.
S. No. As P K Ca Cr Mn Fe Ni Cu Zn Pb
1 148 1528 42,773 40,453 878 12,065 100,476 413 437 648 64
2 110 1425 36,673 38,177 811 14,292 104,938 436 418 606 79
3 90 1761 46,996 54,885 838 10,286 98,347 410 357 584 62
4 122 1560 35,543 37,082 922 9280 98,261 398 379 488 21
5 132 2113 49,238 97,179 961 11,212 157,542 475 441 817 64
6 44 1368 29,182 15,357 882 8077 90,405 320 279 455 46
7 186 914 60,933 15,381 673 3560 71,388 245 314 533 10
8 270 1133 76,242 13,477 963 1673 69,027 401 310 601 21
9 112 2653 56,127 116,031 1099 10,472 140,329 495 425 768 66
10 250 1235 65,635 12,173 879 2509 57,111 278 255 536 9
11 140 1219 51,707 12,236 717 3846 68,913 262 335 561 16
12 104 1318 48,651 14,209 640 5226 68,909 301 283 470 16
13 110 1268 41,638 53,294 782 14,419 95,301 466 377 526 46
14 104 1939 42,435 35,031 947 7287 87,998 355 300 491 10
15 234 1173 35,658 27,387 574 7925 72,626 256 237 444 20
16 70 1389 32,930 20,603 986 9676 107,638 425 365 547 28
17 74 1877 33,457 22,435 1306 11,632 111,356 497 359 768 25
18 56 1534 34,941 23,668 948 7722 96,383 548 283 526 12
19 91 823 42,334 31,345 836 8201 95,473 411 363 514 11
20 78 2093 40,740 25,427 1014 8534 103,649 439 341 761 14
respectively. Among them, the highest concentration of Fe was observed in all soil samples. They were found to occur in the following increasing order: Pb < As < Cu < Ni < Zn < Cr < P < Mn << Ca < K < Fe. Among them, a good correlation (r = 0.73) of the As with the K was observed, indicating their existence as K3AsO4 in the soil, Table 4. The Fe showed good correlation with the heavy metals i.e. Cr, Mn, Ni, Cu and Pb in the soil, indicating origin from similar sources, Table 4. The As concentration in the soil of studied area was found to be higher than reported in other regions of the country and World [5]-[12].
3.4. Distribution of As in Rice Grain, Husk, Straw and Root The distribution of As in rice grain, husk, straw and root is summarized in Table 5. The concentration of As in the rice grain, husk, straw and root (n = 20) was ranged from 0.17 - 0.72, 0.40 - 1.58, 2.5 - 5.9 and 204 - 354 mg/kg with mean value of 0.47 ± 0.07, 0.83 ± 0.15, 4.2 ± 0.5 and 276 ± 21 mg/kg, respectively. The As content in husk was found to be higher than the rice grain, may be due to external contamination from the environment. The high yield rice varieties i.e. Kalinga, IR-64, G. Gurmatia, Shyamla, Ek Hazar Das, M2, etc. were found to be more sensitive to the As-accumulation. The concentration of As in the rice of the studied area was found to be higher than reported in the other region of the country and World [13]-[19]. The As content in the straw and root was found to be comparable to the values reported in the Taiwanese rice plants [14].
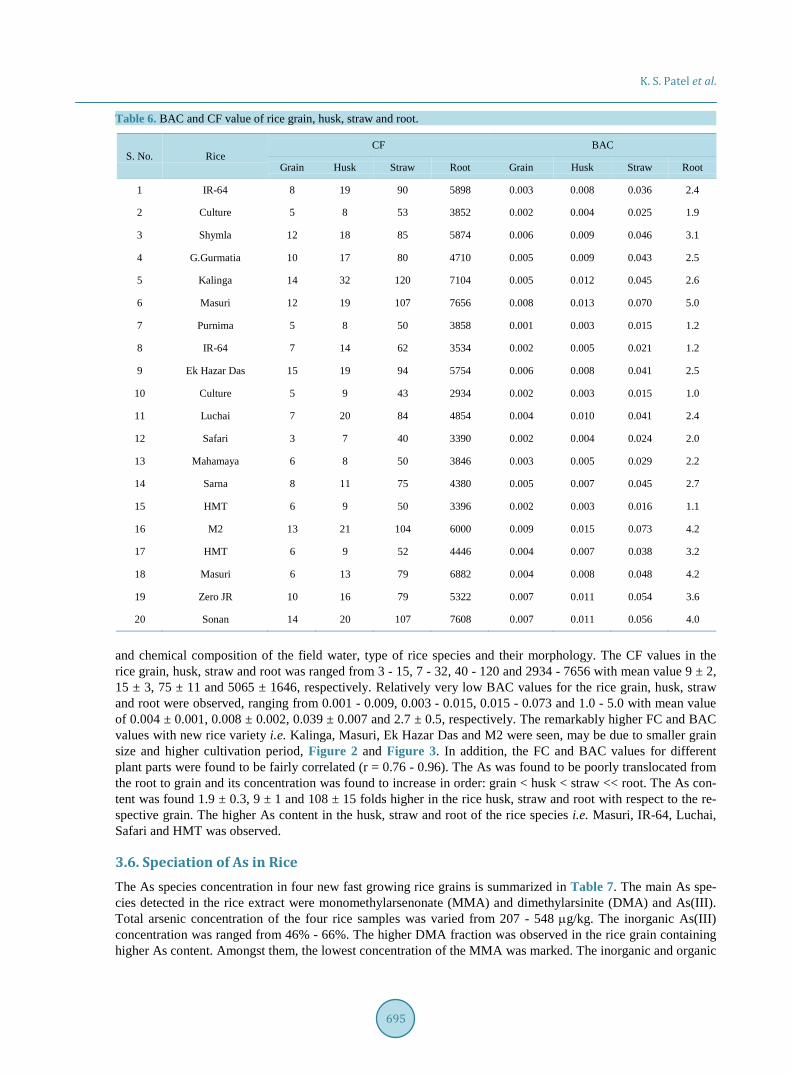
3.5. Biological Absorption Coefficient and Concentration Factor The biological absorption coefficient, BAC (i.e. plant to soil metal ratio) and concentration factor, CF (i.e. plant to water soluble metal ratio) of As are presented in Table 6. The CF and BAC values depend on the physical

K. S. Patel et al.
694
Table 4. Correlation matrix for elements in field soil.
P K Ca Cr Mn Fe Ni Cu Zn As Pb
P 1.00
K −0.12 1.00
Ca 0.71 0.04 1.00
Mn 0.41 −0.64 0.54 0.28 1.00
Fe 0.73 −0.30 0.82 0.57 0.69 1.00
Ni 0.55 −0.28 0.51 0.70 0.64 0.74 1.00
Cu 0.44 −0.09 0.68 0.37 0.69 0.77 0.58 1.00
Zn 0.70 0.15 0.57 0.66 0.34 0.72 0.58 0.64 1.00
As −0.36 0.73 −0.14 −0.35 −0.54 −0.48 −0.50 −0.29 −0.12 1.00
Pb 0.42 −0.14 0.67 0.13 0.71 0.63 0.40 0.71 0.43 −0.19 1.00
Table 5. Distribution of As in various parts of rice in Koudikasa village, mg/kg.
S. No. Rice type Grain Husk Straw Root
1 IR-64 0.46 1.13 5.4 354
2 Culture 0.25 0.40 2.8 204
3 Shymla 0.56 0.84 4.1 282
4 G.Gurmatia 0.62 1.11 5.2 306
5 Kalinga 0.68 1.58 5.9 348
6 Masuri 0.35 0.55 3.1 222
7 Purnima 0.27 0.47 2.8 216
8 IR-64 0.62 1.29 5.6 318
9 Ek Hazar Das 0.72 0.94 4.6 282
10 Culture 0.48 0.76 3.8 258
11 Luchai 0.50 1.36 5.7 330
12 Safari 0.17 0.46 2.5 210
13 Mahamaya 0.38 0.51 3.2 246
14 Sarna 0.51 0.72 4.7 276
15 HMT 0.48 0.68 3.8 258
16 M2 0.64 1.02 5.1 294
17 HMT 0.32 0.51 2.8 240
18 Masuri 0.22 0.44 2.7 234
19 Zero JR 0.62 0.98 4.9 330
20 Sonan 0.57 0.83 4.4 312
K. S. Patel et al.
695
Table 6. BAC and CF value of rice grain, husk, straw and root.
S. No. Rice CF BAC
Grain Husk Straw Root Grain Husk Straw Root
1 IR-64 8 19 90 5898 0.003 0.008 0.036 2.4
2 Culture 5 8 53 3852 0.002 0.004 0.025 1.9
3 Shymla 12 18 85 5874 0.006 0.009 0.046 3.1
4 G.Gurmatia 10 17 80 4710 0.005 0.009 0.043 2.5
5 Kalinga 14 32 120 7104 0.005 0.012 0.045 2.6
6 Masuri 12 19 107 7656 0.008 0.013 0.070 5.0
7 Purnima 5 8 50 3858 0.001 0.003 0.015 1.2
8 IR-64 7 14 62 3534 0.002 0.005 0.021 1.2
9 Ek Hazar Das 15 19 94 5754 0.006 0.008 0.041 2.5
10 Culture 5 9 43 2934 0.002 0.003 0.015 1.0
11 Luchai 7 20 84 4854 0.004 0.010 0.041 2.4
12 Safari 3 7 40 3390 0.002 0.004 0.024 2.0
13 Mahamaya 6 8 50 3846 0.003 0.005 0.029 2.2
14 Sarna 8 11 75 4380 0.005 0.007 0.045 2.7
15 HMT 6 9 50 3396 0.002 0.003 0.016 1.1
16 M2 13 21 104 6000 0.009 0.015 0.073 4.2
17 HMT 6 9 52 4446 0.004 0.007 0.038 3.2
18 Masuri 6 13 79 6882 0.004 0.008 0.048 4.2
19 Zero JR 10 16 79 5322 0.007 0.011 0.054 3.6
20 Sonan 14 20 107 7608 0.007 0.011 0.056 4.0
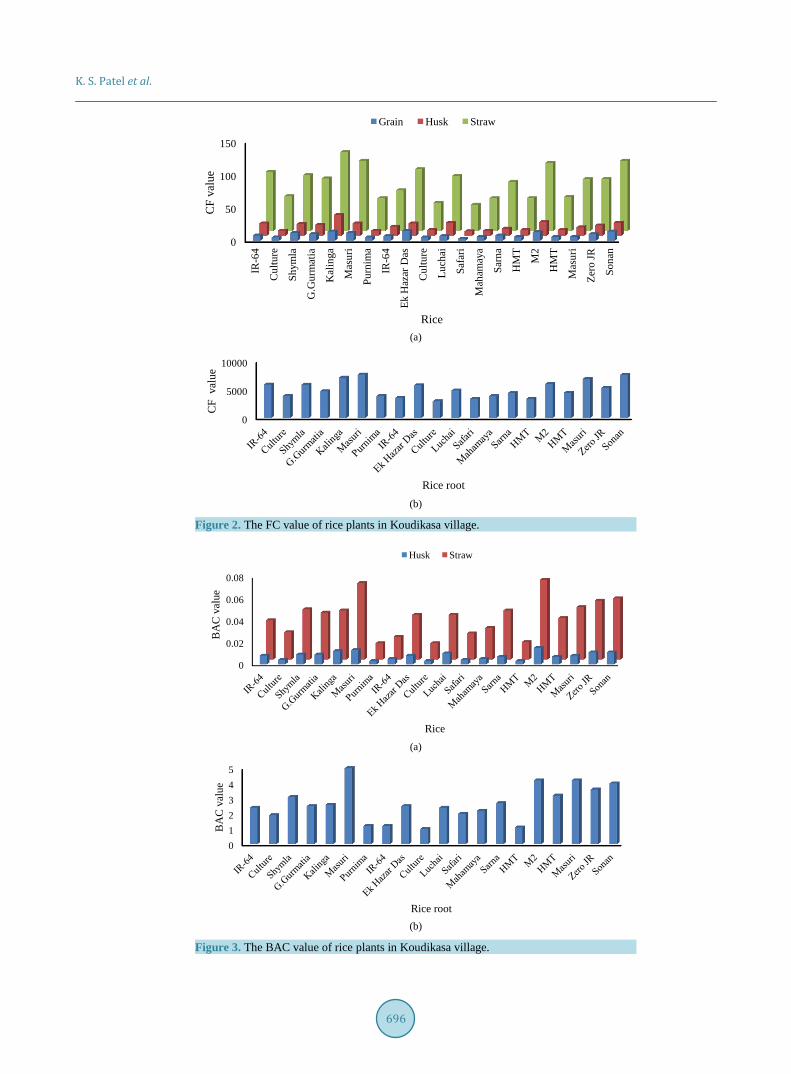
and chemical composition of the field water, type of rice species and their morphology. The CF values in the rice grain, husk, straw and root was ranged from 3 - 15, 7 - 32, 40 - 120 and 2934 - 7656 with mean value 9 ± 2, 15 ± 3, 75 ± 11 and 5065 ± 1646, respectively. Relatively very low BAC values for the rice grain, husk, straw and root were observed, ranging from 0.001 - 0.009, 0.003 - 0.015, 0.015 - 0.073 and 1.0 - 5.0 with mean value of 0.004 ± 0.001, 0.008 ± 0.002, 0.039 ± 0.007 and 2.7 ± 0.5, respectively. The remarkably higher FC and BAC values with new rice variety i.e. Kalinga, Masuri, Ek Hazar Das and M2 were seen, may be due to smaller grain size and higher cultivation period, Figure 2 and Figure 3. In addition, the FC and BAC values for different plant parts were found to be fairly correlated (r = 0.76 - 0.96). The As was found to be poorly translocated from the root to grain and its concentration was found to increase in order: grain < husk < straw << root. The As con-tent was found 1.9 ± 0.3, 9 ± 1 and 108 ± 15 folds higher in the rice husk, straw and root with respect to the re-spective grain. The higher As content in the husk, straw and root of the rice species i.e. Masuri, IR-64, Luchai, Safari and HMT was observed.
3.6. Speciation of As in Rice The As species concentration in four new fast growing rice grains is summarized in Table 7. The main As spe-cies detected in the rice extract were monomethylarsenonate (MMA) and dimethylarsinite (DMA) and As(III). Total arsenic concentration of the four rice samples was varied from 207 - 548 µg/kg. The inorganic As(III) concentration was ranged from 46% - 66%. The higher DMA fraction was observed in the rice grain containing higher As content. Amongst them, the lowest concentration of the MMA was marked. The inorganic and organic
K. S. Patel et al.
696
(a)
(b)
Figure 2. The FC value of rice plants in Koudikasa village.
(a)
(b)
Figure 3. The BAC value of rice plants in Koudikasa village.
0
50
100
150
IR-6
4
Cul
ture
Shym
la
G.G
urm
atia
Kal
inga
Mas
uri
Purn
ima
IR-6
4
Ek H
azar
Das
Cul
ture
Luch
ai
Safa
ri
Mah
amay
a
Sarn
a
HM
T
M2
HM
T
Mas
uri
Zero
JR
Sona
n
CF
valu
e
Rice
Grain Husk Straw
0
5000
10000
CF
val
ue
Rice root
0
0.02
0.04
0.06
0.08
BA
C v
alue
Rice
Husk Straw
012345
BA
C v
alue
Rice root

K. S. Patel et al.
697
Table 7. Arsenic speciation in rice grain, µg/kg.
S. No. Sample AsT DMA MMA As(III)
1 CMR rice 296 ± 21 165 ± 3 10 ± 1 97 ± 5
2 Masuri 207 ± 39 65 <3 115
3 Sonan 548 ± 14 207 16 253
4 HMT 309 ± 34 92 5 204
5 Zero JR 509 ± 29 95 ± 3 15 ± 5 270 ± 5
Certified value of As in the CMR = 290 ± 30 µg/kg.
As content was found to be fairly correlated with the AsT content in the grain. The distribution pattern of As- species in the rice grain of this region is observed similar to Bangladeshi rice [24].
4. Conclusion The field water and soil were found to be contaminated with As at dangerous levels, may be due to geogenic origins. The high yield rice variety i.e. IR-64, Kalinga, Ek Hazar Das, M2, Zero JR, etc. was found to be more sensitive to the As accumulation. Several folds higher As contamination of the straw and root of the rice plants than the grain was marked. The feeding of straw to the domestic animals seems to be a potential pathway entry of As. The rice root was marked as hyper phytoextractants for accumulating As from the surface soil.
Acknowledgements We are thankful to the Alexander von Humboldt Foundation for award of fellowship to KSP. The sincere thanks is extended to Prof. J. Feldmann, College of Physical Sciences—Chemistry, Trace Element Speciation Labora-tory Aberdeen, Scotland for As speciation studies of the rice grain.
References [1] Naujokas, M.F., Anderson, B., Ahsan, H., Aposhian, H.V., Graziano, J.H., Thompson, C. and Suk, W.A. (2013) The
Broad Scope of Health Effects from Chronic Arsenic Exposure: Update on a Worldwide Public Health Problem. Envi-ronmental Health Perspectives, 121, 295-302. http://dx.doi.org/10.1289/ehp.1205875
[2] Sohn, E. (2014) Contamination: The Toxic Side of Rice. Nature, 514, S62-S63. http://dx.doi.org/10.1038/514s62a [3] Meharg, A.A. (2004) Arsenic in Rice—Understanding a New Disaster for South-East Asia. Trends in Plant Science, 9,
415-417. [4] Zhu, Y.G., Williams, P.N. and Meharg, A.A. (2008) Exposure to Inorganic Arsenic from Rice: A Global Health Issue?
Environmental Pollution, 154, 169-171. http://dx.doi.org/10.1016/j.envpol.2008.03.015 [5] Meharg, A.A. and Rahman, M.M. (2003) Arsenic Contamination of Bangladesh Paddy Field Soils: Implications for
Rice Contribution to Arsenic Consumption. Environmental Science and Technology, 37, 229-234. http://dx.doi.org/10.1021/es0259842
[6] Brammer, H. (2009) Mitigation of Arsenic Contamination in Irrigated Paddy Soils in South and South-East Asia. En-vironment International, 35, 856-863. http://dx.doi.org/10.1016/j.envint.2009.02.008
[7] Dittmar, J., Voegelin, A., Roberts, L.C., Hug, S.J., Saha, G.C., Ali, M.A., Badruzzaman, A.B. and Kretzschmar, R. (2007) Spatial Distribution and Temporal Variability of Arsenic in Irrigated Rice Fields in Bangladesh. 2. Paddy Soil. Environmental Science and Technology, 41, 5967-5972. http://dx.doi.org/10.1021/es0702972
[8] Stroud, J.L., Norton, G.J., Islam, M.R., Dasgupta, T., White, R.P., Price, A.H., Meharg, A.A., McGrath, S.P. and Zhao, F.J. (2011) The Dynamics of Arsenic in Four Paddy Fields in the Bengal Delta. Environmental Pollution, 159, 947-953. http://dx.doi.org/10.1016/j.envpol.2010.12.016
[9] Seyfferth, A.L., McCurdy, S., Schaefer, M.V. and Fendorf, S. (2014) Arsenic Concentrations in Paddy Soil and Rice and Health Implications for Major Rice-Growing Regions of Cambodia. Environmental Science and Technology, 48, 4699-4706. http://dx.doi.org/10.1021/es405016t
[10] Dahal, B.M., Fuerhacker, M., Mentler, A., Karki, K.B., Shrestha, R.R. and Blum, W.E. (2008) Arsenic Contamination of Soils and Agricultural Plants through Irrigation Water in Nepal. Environmental Pollution, 155, 157-163.
K. S. Patel et al.
698
http://dx.doi.org/10.1016/j.envpol.2007.10.024 [11] Smith, E., Smith, J., Smith, L., Biswas, T., Correll, R. and Naidu, R. (2003) Arsenic in Australian Environment: An
Overview. Journal of Environmental Science and Health: Part A—Toxic/Hazardous Substances & Environmental En-gineering, 38, 223-239. http://dx.doi.org/10.1081/ESE-120016891
[12] Liao, X.Y., Chen, T.B., Xie, H. and Liu, Y.R. (2005) Soil As Contamination and Its Risk Assessment in Areas near the Industrial Districts of Chenzhou City, Southern China. Environment International, 31, 791-798. http://dx.doi.org/10.1016/j.envint.2005.05.030
[13] Bhattacharya, P., Samal, A.C., Majumdar, J. and Santra, S.C. (2010) Accumulation of Arsenic and Its Distribution in Rice Plant (Oryza sativa L.) in Gangetic West Bengal, India. Paddy and Water Environment, 8, 63-70. http://dx.doi.org/10.1007/s10333-009-0180-z
[14] Lin, S.C., Chang, T.K., Huang, W.D., Lur, H.S. and Shyu, G.S. (2015) Accumulation of Arsenic in Rice Plant: A Study of An Arsenic-Contaminated site in Taiwan. Paddy and Water Environment, 13, 11-18. http://dx.doi.org/10.1007/s10333-013-0401-3
[15] Rahman, M.A., Hasegawa, H., Mahfuzur Rahman, M., Nazrul Islam, M., Miah, M.A.M. and Tasmin, M.A. (2007) Ar-senic Accumulation in Rice (Oryza sativa L.) Varieties of Bangladesh: A Glass House Study. Water, Air, and Soil Pollution, 185, 53-61. http://dx.doi.org/10.1007/s11270-007-9425-x
[16] Jayasumana, C., Paranagama, P., Fonseka, S., Amarasinghe, M., Gunatilake, S. and Siribaddana, S. (2015) Presence of Arsenic in Sri Lankan Rice. International Journal of Food Contamination, 2, 1. http://dx.doi.org/10.1186/s40550-015-0007-1
[17] Azizur Rahman, M. and Hasegawa, H. (2011) High Levels of Inorganic Arsenic in Rice in Areas Where Arsenic- Contaminated Water Is Used for Irrigation and Cooking. Science of the Total Environment, 409, 4645-4655. http://dx.doi.org/10.1016/j.scitotenv.2011.07.068
[18] Sommella, A., Deacon, C., Norton, G., Pigna, M., Violante, A. and Meharg, A.A. (2013) Total Arsenic, Inorganic Ar-senic, and Other Elements Concentrations in Italian Rice Grain Varies with Origin and type. Environmental Pollution, 181, 38-43. http://dx.doi.org/10.1016/j.envpol.2013.05.045
[19] Adomako, E.E., Williams, P.N., Deacon, C. and Meharg, A.A. (2011) Inorganic Arsenic and Trace Elements in Gha-naian Grain Staples. Environmental Pollution, 159, 2435-2442. http://dx.doi.org/10.1016/j.envpol.2011.06.031
[20] Patel, K.S., Shrivas, K., Brandt, R., Jakubowski, N., Corns, W. and Hoffmann, P. (2005) Arsenic Contamination in Water, Soil, Sediment and Rice of Central India. Environmental Geochemistry and Health, 27, 131-145. http://dx.doi.org/10.1007/s10653-005-0120-9
[21] Sahu, B.L., Ramteke, S., Rajhans, K.P., Patel, K.S., Wysocka, I. and Jaron, I. (2016) Contamination of Pond with Fluoride and Heavy Metals in Central India. Water Resources, Submitted.
[22] APHA (2005) Standard Methods for the Examination of Water and Wastewater. 21st Edition, APHA, AWWA and WEF, Washington DC.
[23] Tan, K.H. (2005) Soil Sampling, Preparation and Analysis. 2nd Edition, CRC Press, Boca Raton. [24] Williams, P.N., Price, A.H., Raab, A., Hossain, S.A., Feldmann, J. and Meharg, A.A. (2005) Variation in Arsenic
Speciation and Concentration in Paddy Rice Related to Dietary Exposure. Environmental Science and Technology, 39, 5531-5540. http://dx.doi.org/10.1021/es0502324
[25] WHO (2011) Guidelines for Drinking-Water Quality. 4th Edition, World Health Organization, Geneva. http://www.haceclick.com.uy/documentos/GuIa_OMS%202011_4aEd.pdf