Embed Size (px)
Citation preview

Town of LongmeadowRoute 5 Signal Study
Prepared by:Pioneer Valley Planning Commission
26 Central StreetWest Springfield, MA 01089
January 2005
Final Report
Prepared in cooperation with th Executive Office of Transportation, the Massachusetts Highway Departmentand the U.S. Department of Transportation–Federal Highway Administration and the
Federal Transit Administration.
Route 5 Signal Study

Longmeadow Route 5 Signal Study
Final Report
February 2005
Prepared for:
Town of Longmeadow
Prepared by:
Pioneer Valley Planning Commission
26 Central Street
West Springfield, MA 01089
Prepared in cooperation with the Executive Office of Transportation and the U.S. Department ofTransportation - Federal Highway Administration and the Federal Transit Administration.

TABLE OF CONTENTS
I. INTRODUCTION........................................................................................................... 1
A. STUDY AREA.................................................................................................................... 3
II. EXISTING TRANSPORTATION CONDITIONS.............................................................. 5
A. DATA COLLECTION....................................................................................................... 51. Daily Vehicle Volume..................................................................................................... 62. Hourly Vehicle Volume................................................................................................... 7
B. CRASH EXPERIENCE........................................................................................................... 8C. ANALYSIS PROCEDURES ............................................................................................ 13
1. Intersection Analysis.................................................................................................... 132. Capacity Analysis Summary.......................................................................................... 14
III. FUTURE BUILD-OUT.............................................................................................. 16
A. TRAVEL DEMAND MODEL................................................................................................. 16B. FUTURE VOLUMES........................................................................................................... 16C. FUTURE LEVEL OF SERVICE............................................................................................... 17
IV. IMPROVEMENT ALTERNATIVES .............................................................................. 19
A. ALTERNATIVE 1 .............................................................................................................. 19B. ALTERNATIVE 2 .............................................................................................................. 20
V. SUMMARY OF RECOMMENDANONS ......................................................................... 27
A. SHORT TERM RECOMMENDATIONS ..................................................................................... 27B. LONG TERM RECOMMENDATIONS....................................................................................... 28
VI. PUBLIC PARTICIPATION....................................................................................... 31
VII. APPENDIX………………………………………………………………………………………...32
SUMMARY OF TABLES
TABLE II-1 - AVERAGE ANNUAL DAILY TRAFFIC ...............................................................................5TABLE II-2 - CRASH HISTORY SUMMARY..........................................................................................8TABLE II-3- LEVEL OF SERVICE (LOS) DESIGNATIONS - SIGNALIZED INTERSECTIONS ............................ 13TABLE II-4- LEVEL OF SERVICE (LOS) DESIGNATIONS - UNSIGNALIZED INTERSECTIONS ....................... 13TABLE II-5- LEVEL OF SERVICE OF SIGNALIZED INTERSECTIONS ......................................................... 15TABLE III-1- 2010, 2020 AND 2025 AVERAGE WEEKDAY TRAFFIC VOLUMES........................................ 16TABLE III-2 - FUTURE LEVEL OF SERVICE COMPARISON .................................................................... 18TABLE IV-1- FUTURE PM PEAK HOUR LEVEL OF SERVICE COMPARSION............................................. 25
SUMMARY OF FIGURES
FIGURE I-1 – LONGMEADOW ROUTE 5 CORRIDOR STUDY AREA WITH ADT .........................................3FIGURE II-1 – AM PEAK HOUR......................................................................................................9FIGURE II-2 – PM PEAK HOUR .................................................................................................... 11FIGURE IV-1- AM PEAK HOUR LOS TWO LANE ANALAYSIS............................................................. 21FIGURE IV-2- PM PEAK HOUR LOS TWO LANE ANALAYSIS ............................................................. 23.

I. INTRODUCTION
The goal of the Longmeadow Route 5 Signal Study is to provide a detailed analysis of the
effects of the existing traffic conditions and patterns on the current traffic signal system
along Longmeadow Street – Route 5 and Laurel Street. The study utilizes the existing
traffic signal timing plans and future traffic projects the impacts of alternative signal plans
and possible infrastructure improvements along the Route - 5 Longmeadow Street corridor.
A high volume of commuter traffic as well as requests from local residents prompted the
Longmeadow Board of Selectmen to request this study from the Pioneer Valley Planning
Commission (PVPC). The PVPC conducted this study as a part of their Unified Planning
Work Program for the Pioneer Valley Metropolitan Planning Organization. This section of
Longmeadow Street - Route 5 currently appears as one of the top 30 congested locations
in the Pioneer Valley Region.
The focal points of this study include: overall traffic operations, congestion related
concerns, safety issues and pedestrian and bicycle concerns throughout the study area.
This study is designed to identify current and future deficiencies and to present a wide
range of conceptual solutions that could be implemented by the Town of Longmeadow.
A. Study Area
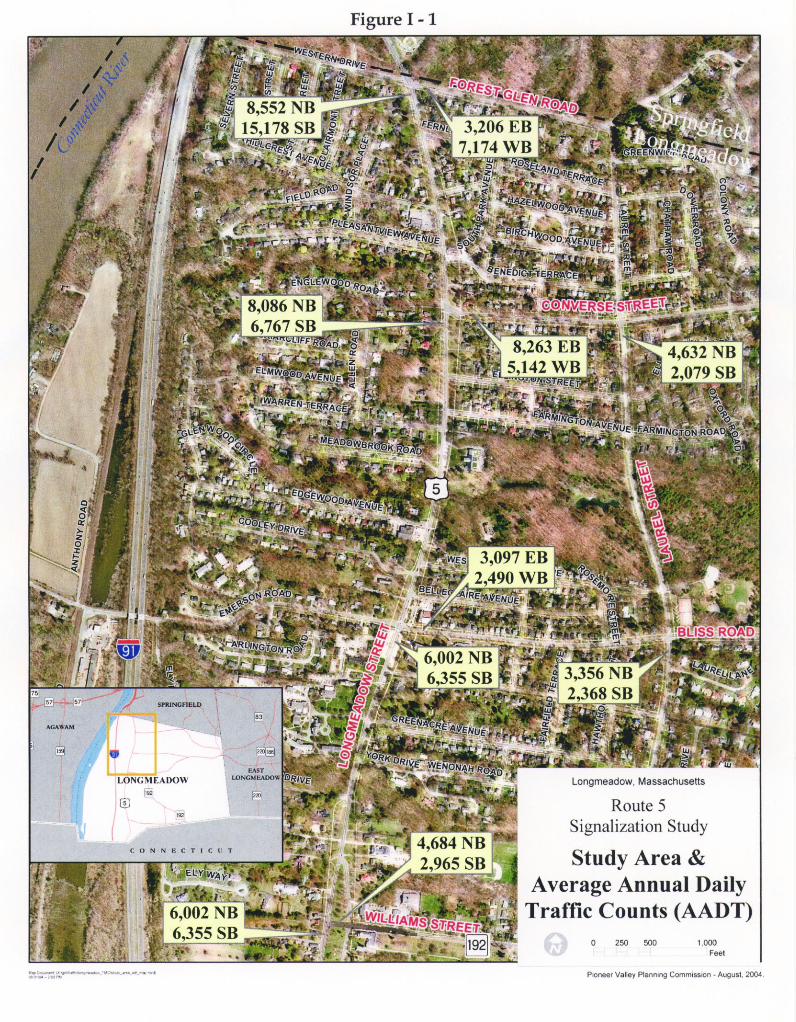
The proposed study area encompasses the area bounded by the Springfield/Longmeadow
Town Line to the south, Williams Road to the north, Laurel Street to the east, and Route 5
– Longmeadow Street to the west. Other major roadways included in the analysis are
Forest Glen Road, Converse Street and Bliss Road. The complete study area is shown in
Figure I-1.

II. EXISTING TRANSPORTATION CONDITIONS
This section provides a technical evaluation of the transportation components throughout
the Longmeadow Route 5 study area. It includes a presentation of the data collected,
analysis of traffic operations, and a series of short term recommendations to the overall
performance and safety of the corridor.
The Town of Longmeadow has the maintenance authority over this section of
Longmeadow Street – Route 5.
A. DATA COLLECTION
A comprehensive data collection activity was conducted for this study to identify existing
deficiencies. This activity consisted of obtaining traffic volumes, crash data, signal timing
and phasing information and information on existing signs, travel lanes, pavement markings
and pedestrian facilities. PVPC staff collected a large portion of the data used in this
report. Additional data was obtained from the Massachusetts Highway Department
(MassHighway), the City of Springfield and the Town of Longmeadow.
1. Daily Vehicle Volume
Vehicle volume data was collected for use in the transportation analysis of the Route 5
area in order to measure the travel demands on an average weekday. Average Daily Traffic
(ADT) volumes were compiled for typical weekday 48-hour periods at various mid-block
locations within the study area using Automatic Traffic Recorders (ATRs). All ADT
volumes were factored to represent Average Annual Daily Traffic (AADT) levels. Table
II-l presents a summary of the weekday AADT volumes in the study area.
The traffic volume along Longmeadow Street- Route 5 increases and decreases dramatically
at the intersections of Forest Glen, Converse Street and Bliss Road indicating the traffic
patterns as vehicles cut through these side streets to access Laurel Street and points east of
Longmeadow. The largest decrease occurs after Forest Glen Road at the intersection of
Longmeadow Street – Route 5 and Converse Street decreasing by 55%. Forest Glen Road
and Converse Street carry the majority of the cut through traffic in the westbound
direction and eastbound direction respectively.
Table II-1 - Average Annual Daily Traffic
Weekday
Location NB/EB SB/WB Total
Route 5 – Longmeadow Street south of Forest GlenRd.
8,552 15,178 23,730
Route 5 – Longmeadow Street south of Converse St.Route 5 – Longmeadow Street south of Bliss Rd.
8,0866,002
6,7676,355
14,85312,357
Route 5 – Longmeadow Street south of Williams St.Forest Glen Rd. east of Route 5
6,7233,206
4,5797,174
11,30210,380
Converse Street east of Route 5Bliss Road east of Route 5
8,2633,097
5,1422,490
13,4055,587
Williams Street east of Route 5 4,684 2,965 7,649

Laurel Street south of Converse St.Laurel Street south of Bliss Rd.
4,6323,356
2,0792,368
6,7115,724
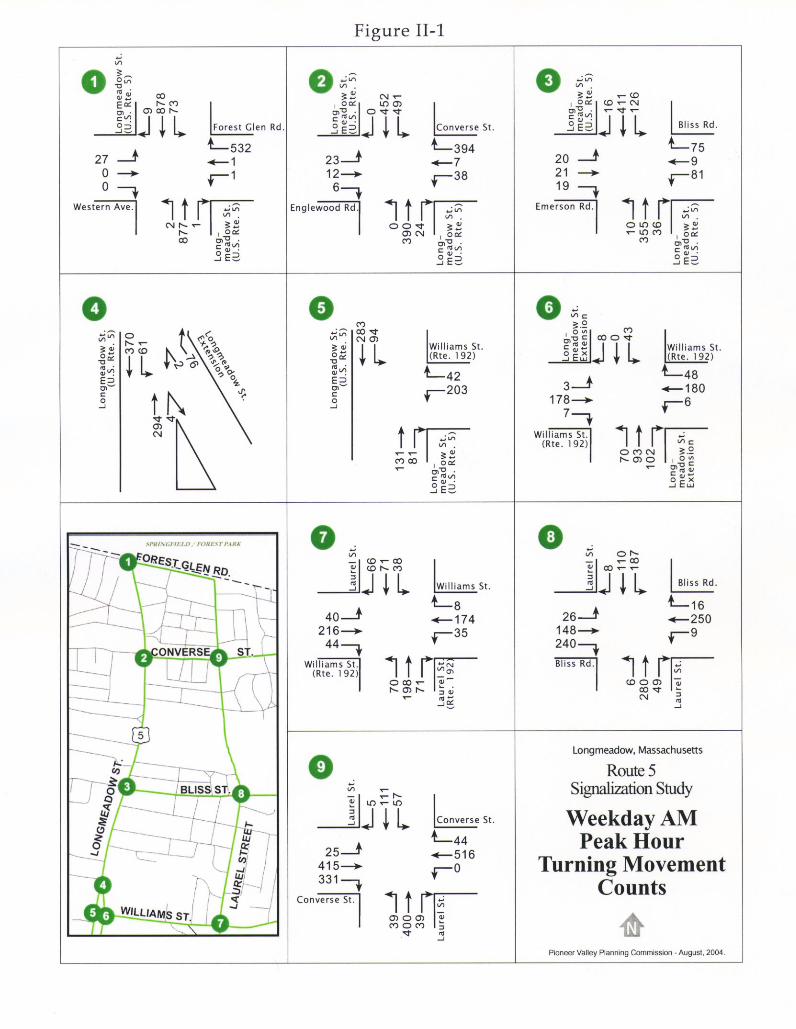
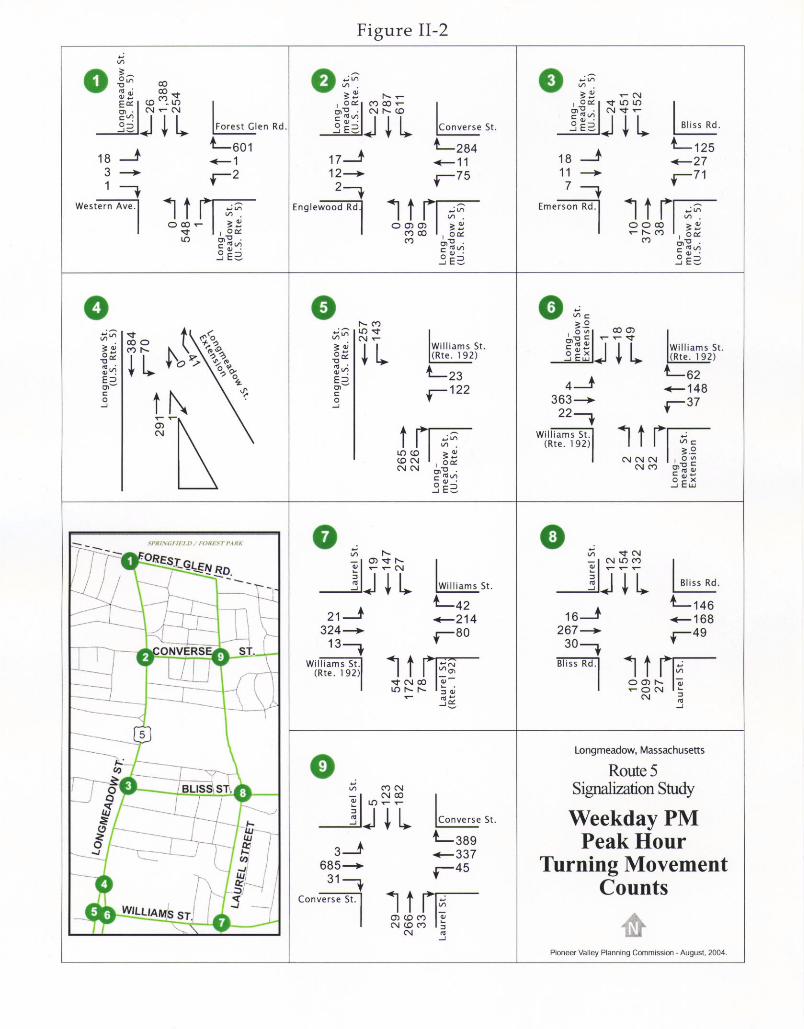
2. Hourly Vehicle Volume
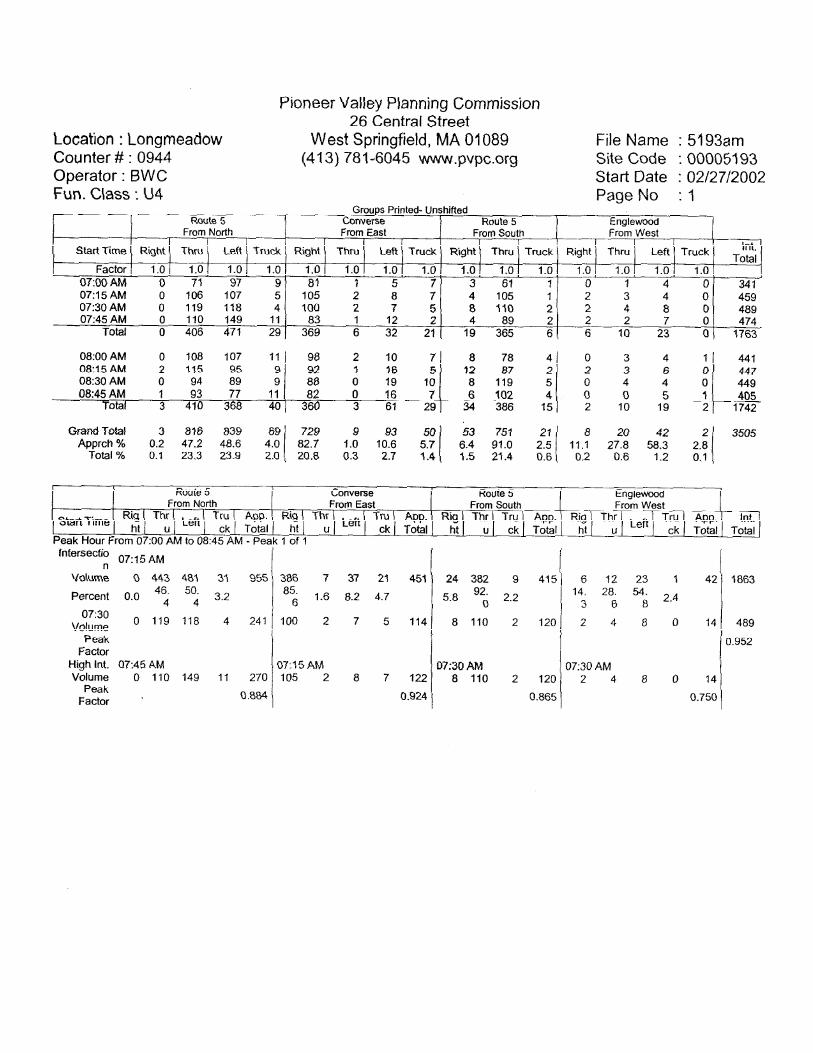
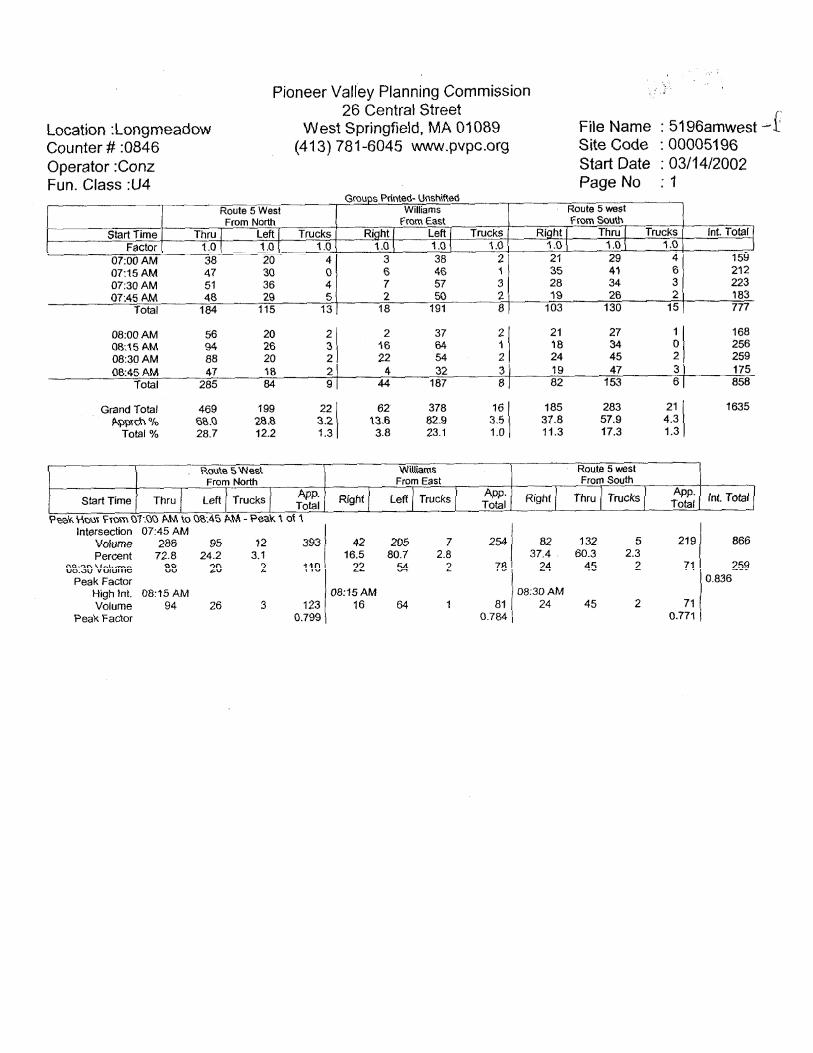
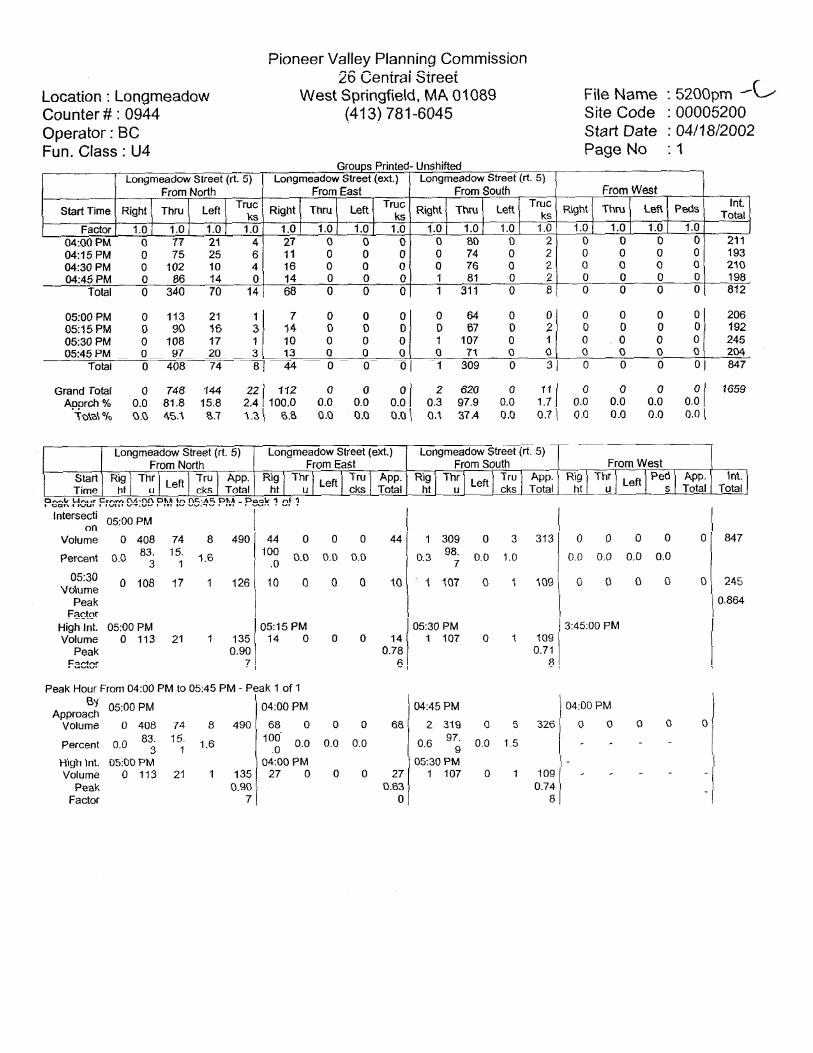
Manual Turning Movement Counts (TMC) were conducted at several intersections withinthe study area. The TMCs were conducted during the peak commuter periods. Theweekday commuter period occurs during the morning hours of 7:00 AM to 9:00 AM andthe afternoon hours of 4:00 PM to 6:00 PM. At each location two-hour TMCs wereconducted to identify the peak four consecutive 15-minute periods of traffic through theintersection. These consecutive peak 15-minute periods constitute a location's "Peak HourVolume". The peak hour of traffic volume represents the most critical period foroperations and will be the focus for some of the analyses conducted in this Study.
The locations of all 10 turning movement counts conducted by the PVPC are shownbelow.
• Route 5 – Longmeadow Street south of Forest Glen Road
• Route 5 – Longmeadow Street south of Converse Street
• Route 5 – Longmeadow Street south of Bliss Road
• Route 5 – Longmeadow Street south of Williams Street
• Forest Glen Road east of Route 5
• Converse Street east of Route 5
• Bliss Road east of Route 5
• Williams Street east of Route 5
• Laurel Street south of Converse Street
• Laurel Street south of Bliss Road
The TMC data also identifies the peak hour factor and vehicle classification at eachintersection. The peak hour factor (PHF) accounts for variations in demand during thepeak hour. The PHF is defined as the ratio of the volume occurring during the peak hour tothe maximum rate of flow during a given time period within the peak hour.1 For trafficengineering analysis the flow rate in the peak 15 minutes of the peak hour is used todetermine the operational characteristics of traffic facilities. The flow rate is obtained fromthe peak hour volume by using the peak hour factor.
Vehicle classification identifies the percentage of heavy vehicles and passenger cars on theroadway. Heavy vehicles include trucks, recreational vehicles and buses. The percent ofheavy vehicles in the traffic flow is an important component in calculating theserviceability of a corridor or intersection. Trucks impact traffic flow because they occupymore roadway space than passenger cars and have poorer operating capabilities withrespect to acceleration, deceleration and maneuverability.
1 Institute of Transportation Engineers, Transportation and Traffic Engineering Handbook,

As traffic volumes tend to fluctuate over the course of the year, the MassachusettsHighway Department (MassHighway) develops traffic volume adjustment factors toreflect monthly variations. These factors were examined to determine how trafficconditions along the Route 5 Corridor in November - January compare to average monthconditions.
Based on the MassHighway data, traffic volumes during the month of November andDecember are estimated to be slightly higher than the annual average. Conversely, trafficduring the month of January is on average slightly lower than the annual average.Therefore, the traffic count data was adjusted accordingly to reflect average monthconditions. Turning movement count data for the AM and PM peak hours are summarizedon Figures II-1 - II-2.
B. Crash Experience
The intersection crash history was used to estimate the safety conditions throughout thestudy area. Crash information was gathered for the four major intersections alongLongmeadow Street as well as other key intersections along Laurel Street. Table II-2summarizes the number of crashes by location and type for a period of five years (1997-2002) to identify any common conditions and possiblecauses.
The number of crashes experienced throughout the study area, remain relatively constantfrom year to year and by location. The intersection of Laurel Street with Bliss Road has aspike of reported crashes in the 2000 calendar year. This is unusual, given the previousand future years total number of crashes. It is unclear why this irregularity occurred butthe intersection seems to have returned to a normal range.
It is also important to note that the key intersections of Forest Glen Road, ConverseStreet and Bliss Road with Longmeadow Street – Route 5 and Laurel Street with ConverseStreet, experience the highest number of crashes within the study area. This section withinthe study area experiences the highest traffic volumes which also contribute to significantdelay and congestion. These intersections also have a significant number of Rear End typeaccidents. Nearly 91% of the accidents occurring at the intersection of Longmeadow Streetwith Forest Glen Road are Rear End type crashes which can be common in congestedareas.
It should be noted that local crash records could identify a much higher level of crashes inthe study area. This is possible because crashes with less than $1000 of damage are notrequired to be reported to the state. In addition, many crashes that occur in the immediatevicinity of an intersection may be incorrectly identified. ie. a crash that occurs at a privatedriveway immediately adjacent to the intersection.

Table II-2 - Crash History Summary
Location Year Number ofCrashes
Type Number ofCrashes
Severity
Longmeadow Streetwith Forest GlenRoad
199719981999200020012002
252743
AngleRear EndSideswipeHead onPed/BikeFixed Object
1210100
PDPIF
12110
Longmeadow Streetwith ConverseStreet
199719981999200020012002
584311
AngleRear EndSideswipeHead onPed/BikeFixed Object
8110201
PDPIF
11110
Longmeadow Streetwith Bliss Road
199719981999200020012002
436302
AngleRear EndSideswipeHead onPed/BikeFixed Object
1260000
PDPIF
1250
Longmeadow Streetwith Williams Street
199719981999200020012002
563311
AngleRear EndSideswipeHead onPed/BikeFixed Object
1440100
PDPIF
1260
Laurel Street withConverse Street
199719981999200020012002
467147
AngleRear EndSideswipeHead onPed/BikeFixed Object
15110201
PDPIF
18110
Laurel Street withBliss Road
199719981999200020012002
224
1021
AngleRear EndSideswipeHead onPed/BikeFixed Object
1080102
PDPIF
9120
Note: PD = Property damage, PI = Personal injury, F = FatalitySource: MassHighway Crash History

C. ANALYSIS PROCEDURES
1. Intersection Analysis
The Route 5 Longmeadow Street Signal study examined the operations at six signalizedand two unsignalized intersections in the study area. The efficiency of traffic operations ata signalized location is based on the stopped delay per vehicle for a 15-minute analysisperiod. These conditions are measured using the nationally accepted standard methodologyoutlined in the 2000 Highway Capacity Manual (HCM). The HCM's measure ofefficiency is quantified in terms of "Level Of Service" (LOS). The LOS refers to thequality of traffic flow along roadways and intersections. It is described in terms of Athrough F, where A represents the best possible conditions and F represents forced-flowof failing conditions. A basic assumption in assigning a value for LOS at an intersection isthat vehicles stopped at a signalized intersection are willing to accept longer delays. TableII-3 describes the level of service designations for signalized intersections.
Table II-3- Level Of Service (LOS) Designations - Signalized Intersections
Category Description Delay
(in seconds)
LOS A Describes a condition of free flow, with low volumes and relatively high speeds.
There is little or no reduction in maneuverability due to the presence of other
vehicles, and drivers can maintain their desired speeds. Little or no delays result
for side street motorists.
< 10.0
LOS B Describes a condition of stable flow, with desired operating speeds relatively
unaffected, but with a slight deterioration of maneuverability within the traffic
stream. Side street motorists experience short delays.
>10.0 to 20.0
LOS C Describes a condition still representing stable flow, but speeds and
maneuverability begin to be restricted. Motorists entering from side streets
experience average delays.
>20.0 to 35.0
LOS D Describes a high-density traffic condition approaching unstable flow. Speeds and
maneuverability become more restricted. Side street motorists may experience
longer delays.
>35.0 to 55.0
LOS E Represents conditions at or near the capacity of the facility. Flow is usually
unstable, and freedom to maneuver within the traffic stream becomes extremely
difficult. Very long delays may result for side street motorists.
>55.0 to 80.0
LOS F Describes forced flow or breakdown conditions with significant queuing along
critical approaches. Operating conditions are highly unstable as characterized by
erratic vehicle movements along each approach.
> 80.0
At an unsignalized intersection, LOS is determined by the average total delay which isdefined as the total elapsed time from when a vehicle stops at the end of a queue to whenthe same vehicle departs from the stop line. The basic assumption at an unsignalized

intersection is that through moving traffic on the major street is not hindered by othermovements. In reality, as minor street delays increase, vehicles are more likely to acceptsmaller gaps in the traffic stream causing through moving vehicles to reduce speed andsuffer some delay. The left turn movement off the minor street approach is the mostheavily opposed movement and typically suffers the greatest delay. Therefore thismovement is used as a gauge to determine the overall operations at an unsignalizedintersection. Table II-4 lists the level of service criteria for unsignalized intersections.
Table II-4- Level Of Service (LOS) Designations - Unsignalized Intersections
Average Control Delay(s/veh)
LOS
Expected Delay ToMinor Street
0.0 to 10.0>10.0 to 15.0>15.0 to 25.0>25.0 to 35.0>35.0 to 50.0
>50.0
ABCDEF
Little or no delayShort traffic delays
Average traffic delaysLong traffic delays
Very long delaysExtreme delays
2. Capacity Analysis Summary
Intersection capacity analyses were conducted for the key locations along the Route 5Longmeadow Street corridor. Field observations were conducted to determine the signaltiming phase sequence and length. The analysis presents information identifying theoperational condition of intersections, both signalized and unsignalized. Acceptableconditions are those measured with Level Of Service (LOS) assignments of A through D,while unacceptable conditions are assigned E or F. The LOS for individual intersectionapproaches was calculated as well as for overall intersection operation.
Overall the LOS during the AM peak period at most intersections, operate at acceptableconditions with LOS “C” or above. The travel pattern throughout this area in the AMpeak period indicates traffic moving in the direction of I-91 access and neighborhoodschools. The most significant delays are experienced on the westbound approach ofForest Glen Road and along the southbound approach of Longmeadow Street – Route 5 toConverse Street and Bliss Road. The longest delays in the AM peak hour occur at theintersection of Laurel Street with Bliss Road. Southbound traffic operates at LOS “F”,decreasing the LOS for the entire intersection to a LOS “E”.
The reverse travel pattern is evident in the PM peak hour as traffic patterns shift to returnfrom I-91. Long delays are experienced along Longmeadow Street- Route 5 at itsintersection with Forest Glen Road, Converse Street and Bliss Road. Similar increases inthe delay are evident in the southbound direction along Laurel Street. Due to the increasein traffic volume and congestion, the LOS in the PM peak decreases to LOS “E” for theselocations along Longmeadow Street – Route 5, while Laurel Street and Converse decreaseto a LOS “D”. Table II-5 presents a summary of the calculated Level of Service (LOS) forthe signalized intersections during the weekday AM and PM peak hours.

Table II-5- Level of Service of Signalized Intersections
Existing ConditionAM Peak PM Peak
LOS* Delay LOS* Delay Longmeadow Street at Forest Park Entrance
Longmeadow Street NB Approach B 12.5 A 3.6
Longmeadow Street SB Approach A 0.8 A 1.3
Forest Park WB Approach D 54.5 D 54.5
King Phillips Stockade EB Approach D 54.5 D 54.5
Overall A 8.1 A 2.5
Longmeadow Street at Forest Glen Road
Longmeadow Street NB Approach C 24.7 C 33.7
Longmeadow Street SB Approach B 12.5 E 72.8
Forest Glen Road WB Approach D 42.7 D 53.8
Western Avenue EB Approach C 28.9 C 30.4
Overall C 23.6 E 61.6
Longmeadow Street at Converse Street
Longmeadow Street NB Approach B 16.4 B 17.6
Longmeadow Street SB Approach D 36.0 E 78.2
Converse Street WB Approach B 14.8 B 15.7
Englewood Road EB Approach B 14.0 B 14.0
Overall C 26.1 E 55.6
Longmeadow Street at Bliss Road
Longmeadow Street NB Approach B 15.2 B 15.7
Longmeadow Street SB Approach B 18.1 C 25.7
Bliss Road WB Approach B 13.4 B 14.0
Ely Road EB Approach B 11.8 B 11.6
Overall B 16.0 B 19.7
Longmeadow Street at Longmeadow Ext.
Longmeadow Street NB Approach B 11.6 B 11.4
Longmeadow Street SB Approach B 16.8 B 18.7
Longmeadow Street Extension WB Approach A 8.1 A 77
Overall B 13.9 B 15.2
Laurel Street at Converse Street
Laurel Street NB Approach D 43.8 C 25.4
Laurel Street SB Approach C 28.5 F 215.2
Converse Street WB Approach A 8.8 B 14.6
Englewood Road EB Approach B 13.0 B 11.0
Overall C 20.8 D 47.2
Laurel Street at Bliss Road
Laurel Street NB Approach C 22.6 B 19.0
Laurel Street SB Approach F 215.0 E 56.5
Bliss Street WB Approach A 7.9 A 8.7
Bliss Street EB Approach A 8.7 A 8.2
Overall E 63.5 C 23.3
Laurel Street at Williams Street
Laurel Street NB Approach B 11.0 B 13.8
Laurel Street SB Approach A 8.1 B 13.3
Williams Street WB Approach B 14.1 C 27.4
Williams Street EB Approach B 15.7 B 14.6
Overall B 12.7 B 18.0
* Level of Service** In Seconds

III. FUTURE BUILD-OUT
It is important to consider the impact of future growth in employment, population andresidential development on the existing transportation system. Zoning regulations maypermit large developments with high trip generation rates in primarily residential areas.Site specific developments can be expected to impact the existing flow of traffic and add todelay throughout the study area. Growth in surrounding communities can also result in anincrease in commuter traffic through the Route 5 Corridor neighborhood. Many potentialfuture deficiencies and problem areas can be eliminated by identifying the problem beforeit happens.
A. Travel Demand Model
Travel demand models are developed to simulate actual travel patterns and existingtransportation conditions. Roadway networks are constructed using current informationfor the higher classified roads. Most local streets are not included in the travel demandmodel. Traffic is generated using socioeconomic data such as household size, automobileavailability and employment data. Once the existing conditions are evaluated and adjustedto satisfactorily replicate actual travel patterns and vehicle roadway volumes, the model isthen altered to project future year conditions. The preparation of a future yearsocioeconomic database is the last step in the travel demand forecast process. Forecasts ofpopulation and socioeconomic data are used to determine the number of trips that will bemade in the future
Travel demand forecasting is a major step in the transportation planning process. Bysimulating the current roadway conditions and the travel demand on those roadways,deficiencies in the system are identified. This is an important tool in planning futurenetwork enhancements and analyzing currently proposed projects. The Pioneer ValleyPlanning Commission (PVPC) uses the TransCAD software to perform transportationforecasts for the 2003, 2010, 2020, and 2025 analysis years. All 43 communities withinthe boundaries of Hampden and Hampshire Counties are included in the PVPC regionaltransportation model.
B. Future Volumes
Estimates of the 2010, 2020 and 2025 average weekday traffic volumes were obtained fromthe PVPC regional transportation model. The results are presented in Table III- 1.
Table III-1- 2010, 2020 and 2025 Average Weekday Traffic Volumes
Location 2001 2010 2020 2025
Route 5 Longmeadow Street South of Forest Glen Rd. 23,730 26,869 28,040 29,483Route 5 Longmeadow Street South of Williams St. 11,302 14,358 14,094 13,932Converse Street East of Route 5 13,405 12,589 14,747 17,411Laurel Street South of Converse St. 6,711 6,342 7,931 9,067
As traffic volumes continue to increase on the major roadways more vehicles will begin toseek alternate routes.
Traffic growth is projected to be very modest and in some cases decreases between the
2010 Build-out and 2020 Build-out Scenarios due to projected decreases in employment
throughout the Pioneer Valley region. The projected decrease in employment in the region
has a negative impact on the number of vehicle trips generated by the model.
Traffic volumes increase along Longmeadow Street – Route 5 with Converse Street by
24%. While the southern intersection of Longmeadow Street – Route 5 with Williams
Street increased 23%. Both Converse Street and Laurel Street south of Converse
experienced the largest increase in forecasted traffic volumes, with increases of 30% and
35% respectively. These future forecasted traffic volume increases will significantly affect
the LOS of the study area, given the current signal timing plans and street geometry.
C. Future Level of Service
The traffic volumes for 2008 were estimated using growth rates derived from the RegionalTransportation Model and were used to estimate the AM and PM peak hour turningmovement counts. The future Level of Service was calculated for the 2008 forecast year ateach of the seven signalized intersections in the study area.
For the purpose of this analysis no changes were assumed for the existing traffic signalcontrol equipment and lane geometry. No future estimates or calculations were conductedfor the unsignalized intersections because these locations cannot be accurately replicatedusing the regional transportation model. In theory, the operating characteristics of thesignalized intersections are an accurate gauge of how well a roadway as a whole operates inan urbanized area. A summary of the future Level of Service for the PM peak hour isshown on Table III-2.
Future forecasted increases in traffic volumes decrease the LOS for Longmeadow Street –Route 5 from “E” to “F” at its intersections with Converse Street and Bliss Road. AlongLaurel Street the most significant decrease in LOS occurred at the intersection withConverse Street causing a shift in LOS from a “D” to an “E”. It is important to note thatthe delay for the southbound approach of Laurel Street at its intersection with ConverseStreet and Bliss Road dramatically increased as a result of the buildout. Clearly, acombination of changes in the existing traffic signal equipment and changes in the existingland geometry will be required to reduce delays in the study area.

Table III-2 - Future Level of Service Comparison
ExistingCondition
2008 LOS
PM Peak PM Peak
LOS* Delay LOS* Delay Longmeadow Street at Forest Park Entrance
Longmeadow Street NB Approach A 3.6 A 7.0
Longmeadow Street SB Approach A 1.3 A 1.8
Forest Park WB Approach D 54.5 D 52.5
King Phillips Stockade EB Approach D 54.5 D 52.5
Overall A 2.5 A 4.2
Longmeadow Street at Forest Glen Road
Longmeadow Street NB Approach C 33.7 C 33.3
Longmeadow Street SB Approach E 72.8 F 157.9
Forest Glen Road WB Approach D 53.8 E 79.2
Western Avenue EB Approach C 30.4 C 28.8
Overall E 61.6 F 118.6
Longmeadow Street at Converse Street
Longmeadow Street NB Approach B 17.6 C 21.2
Longmeadow Street SB Approach E 78.2 F 130.6
Converse Street WB Approach B 15.7 B 18.7
Englewood Road EB Approach B 14.0 B 15.4
Overall E 55.6 F 90.0
Longmeadow Street at Bliss Road
Longmeadow Street NB Approach B 16.4 B 17.4
Longmeadow Street SB Approach F 112.1 E 64.8
Bliss Road WB Approach B 14.0 B 14.7
Ely Road EB Approach B 11.6 B 11.6
Overall E 58.2 D 37.8
Longmeadow Street at Longmeadow Ext.
Longmeadow Street NB Approach B 11.4 B 12.4
Longmeadow Street SB Approach B 18.7 C 31.2
Longmeadow Street Extension WB Approach A 7.0 A 7.4
Overall B 15.2 C 22.4
Laurel Street at Converse Street
Laurel Street NB Approach C 25.4 C 28.4
Laurel Street SB Approach F 215.2 F 374.1
Converse Street WB Approach B 14.6 C 22.8
Englewood Road EB Approach B 11.0 B 13.2
Overall D 47.2 E 76.7
Laurel Street at Bliss Road
Laurel Street NB Approach B 19.0 C 20.2
Laurel Street SB Approach E 56.5 F 117.5
Bliss Street WB Approach A 8.7 A 9.3
Bliss Street EB Approach A 8.2 A 8.5
Overall C 23.3 D 39.9
Laurel Street at Williams Street
Laurel Street NB Approach B 13.8 B 17.1
Laurel Street SB Approach B 13.3 B 13.2
Williams Street WB Approach C 27.4 D 37.7
Williams Street EB Approach B 14.6 B 14.8
Overall B 18.0 C 22.6

IV. IMPROVEMENT ALTERNATIVES
The following section presents an analysis of the different alternative scenarios that wereconsidered as possible solutions for the Route 5 Longmeadow Street Signal Study. Avariety of methods were used to analyze the alternatives including the TRANSCAD trafficsimulation model for the region, "Synchro" traffic operation analysis software, and theManual on Uniform Traffic Control Devices.
A. Alternative 1 – Updating the Existing Signal Timing Plans
All traffic signals are operated by a signal controller which controls the red, green and
yellow time during a cycle. There are two types of controllers, pre-timed and actuated. A
pre-timed controller dictates the length of time for each cycle but maintains a pre-
determined cycle length regardless of traffic conditions. Virtually every signal located
throughout the study area is operated by a pre-timed controller. These controllers are
antiquated and cannot adjust the timing plan to compensate for changes travel flow.
The Longmeadow Street- Route 5 signal at Forest Park is an actuated signal. This type of
signal allows shifts in the cycle length determined by traffic flow and demand. Turning
movements are given adjustable time periods based on the amount of vehicles flowing
through the intersection. A loop detector is placed a fixed length away from the
intersection and is “tripped” by approaching vehicles. This type of controller also has the
ability to run different timing plans over the course of the day.
Using the Synchro software, timing plan changes under the existing geometry, were studied
and altered in order to see the benefits signal coordination and timing changes could have
on the study area. Traffic coordination can improve traffic flow in areas with closely
spaced signals. The problem with optimizing and coordinating the network along
Longmeadow St-Route 5, is that side-street, or minor approach traffic, begin to experience
increases in delay as green time is shifted to the major street.
As seen in Table IV-1 by optimizing the timing plans for the intersections that are
signalized, the LOS was improved, except at the intersection of Longmeadow Street-
Route 5 with Forest Glen Road. While updating the signals and controllers in order to alter
timing plans may be a solution to allow traffic to flow through this area and decrease delay
during peak hours, additional capacity is required to accommodate the traffic flow
throughout this area.
Based on the results of Alternative 1, the timing and phasing plans for the PM peak hour
analysis for each signalized intersection in the network were optimized allowing more time
for right and left turning movements reflected in well traveled patterns along the
intersections of Longmeadow Street- Route 5 and Forest Glen Road, Converse Street and
Laurel Street. Vehicles heading southbound along Longmeadow Street – Route 5 during the
PM peak hour, have significant delays turning left at Forest Glen, Converse and Bliss

Road. A longer cycle length for this movement while allowing a protected right turn from
the intersecting side street would allow these non-opposing turns to occur simultaneously,
reducing delays for these movements and for the intersection as a whole. Although this did
reduce the delay experienced from this approach, the overall efficiency of the network did
not improve significantly.
Installing new signals and controllers would also enable signal timing and phasing to be
adjusted for AM and seasonal shifts in traffic patterns. These adjustments could be made
to the intersections by the Town of Longmeadow.
B. Alternative 2 – Additional Lanes – Route 5 – Longmeadow Street
Updating traffic signal control equipment to allow alternating cycle lengths and timing
plans could move traffic along with less delay, however the volume of traffic traveling
through this area will continue to be problematic given the amount of capacity these
signals and intersections were originally designed for. Updating the signals will alleve
some delays experienced by travelers, but continued growth and demographic shifts will
begin to affect the volume of vehicles, thereby affecting the LOS by increasing congestion.
In order to analyze the impacts of additional capacity on the study area, the Synchro
software was used to estimate the effects of new travel lanes in the following areas:
• Longmeadow Street – Route 5 southbound from Forest Glen Rd. half way to ConverseSt.
• Forest Glen Road, additional dedicated right turning lane• Converse Street, additional dedicated right turning lane
Additional lanes were added to points along Longmeadow Street – Route 5, Converse
Street and Forest Glen Road, in order to increase capacity and analyze the affects of
additional lanes on LOS. An additional lane was added in the southbound direction of
Longmeadow Street- Route 5 from the intersection of Forest Glen Road through to
Converse Street. An additional lane was added to Forest Glen Road and Converse Street in
the westbound direction with a dedicated right turning lane and a shared left and through
movement lane.
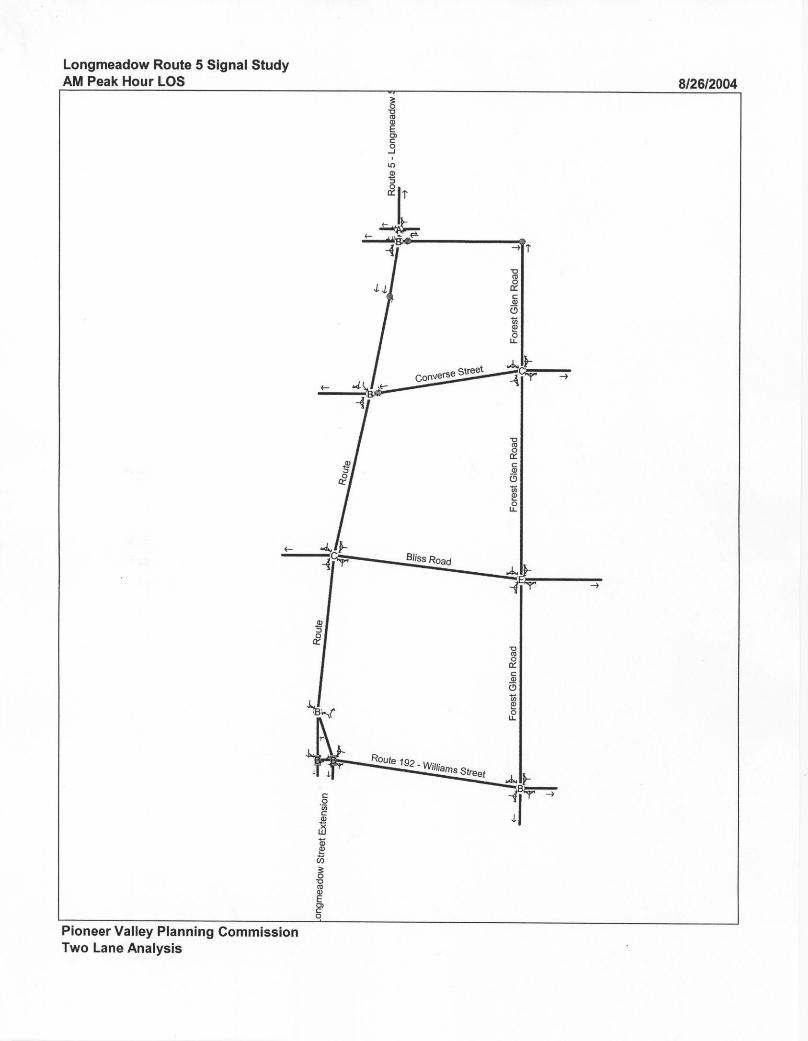
Both the AM and PM networks were analyzed under this geometry and the LOS was
dramatically increased in the area of Longmeadow Street – Route 5, Converse Street and
Laurel Street. Figure IV- 1 and Figure IV- 2 display the Synchro network and the LOS for
both the AM and PM peak hour analysis. The addition of an extra through lane and
dedicated turning lanes bring the LOS at the intersection of Longmeadow Street- Route 5
with Forest Glen Road from an “F” in the AM and PM peak analysis to a LOS “B” and
“A” respectively. Also the intersection of Longmeadow Street – Route 5 with Converse
Street increases from a LOS “D” to “B” in both the AM and PM analysis.

While intersection, roadway and signal improvements may improve the LOS and delay
experienced by travelers, further along Longmeadow Street-Route 5 at the intersection of
Bliss Road, LOS improved only slightly in the AM, improving from an “F” to a “E”. The
traffic patterns throughout the study area will shift as delays decrease at key locations,
however, the same volume or increasing volume will continue to travel through this area
and will seek alternating paths possibly shifting the delay to intersections operating at
poor


or adequate LOS. While the capacity may be increased in certain key locations or
intersections, these shifts in the traffic flow demand should be considered throughout the
entire network. The connectivity of Longmeadow Street – Route 5 to I-91 will continue to
be in demand and will continue to increase as demographics shift and traffic improvements
to this area should be considered as whole.
Table IV-1 – Future PM Peak Hour Level of Service Comparison
Existing
Conditions
Optimized
Network
Additional
Lanes
LOS* Delay LOS* Delay LOS* Delay
Longmeadow Street at Forest Park Entrance
Longmeadow Street NB Approach A 3.6 B 10.6 A 3.6
Longmeadow Street SB Approach A 1.3 A 1.4 A 1.3
Forest Park WB Approach D 54.5 D 76.0 D 54.5
King Phillips Stockade EB Approach D 54.5 D 76.0 D 54.5
Overall A 2.5 A 5.5 A 2.5
Longmeadow Street at Forest Glen Road
Longmeadow Street NB Approach C 33.7 F 84.5 B 18.4
Longmeadow Street SB Approach E 72.8 E 61.6 A 4.1
Forest Glen Road WB Approach D 53.8 F 131.3 B 16.5
Western Avenue EB Approach C 30.4 E 60.7 C 27.8
Overall E 61.6 E 79.9 A 9.4
Longmeadow Street at Converse Street
Longmeadow Street NB Approach B 17.6 D 35.2 C 29.4
Longmeadow Street SB Approach E 78.2 C 21.1 B 11.5
Converse Street WB Approach B 15.7 D 43.9 B 14.4
Englewood Road EB Approach B 14.0 C 21.7 C 25.6
Overall E 55.6 C 27.5 B 15.6
Longmeadow Street at Bliss Road
Longmeadow Street NB Approach B 16.4 B 12.4 B 15.7
Longmeadow Street SB Approach F 112.1 C 30.1 C 25.7
Bliss Road WB Approach B 14.0 C 22.8 B 14.0
Ely Road EB Approach B 11.6 B 18.3 B 11.6
Overall E 58.2 C 22.1 B 19.7
Longmeadow Street at Longmeadow Ext.
Longmeadow Street NB Approach B 11.4 B 11.4 B 11.4
Longmeadow Street SB Approach B 18.7 B 11.8 B 18.7
Longmeadow Street Extension WB Approach A 7.0 A 8.4 A 7.0
Overall B 15.2 B 10.1 B 15.2
Laurel Street at Converse Street
Laurel Street NB Approach C 25.4 C 20.7 C 25.4
Laurel Street SB Approach F 215.2 E 64.2 F 215.2
Converse Street WB Approach B 14.6 C 25.6 B 14.6
Englewood Road EB Approach B 11.0 B 17.0 B 11.0
Overall D 47.2 C 28.2 D 47.2
Laurel Street at Bliss Road
Laurel Street NB Approach B 19.0 B 17.2 B 19.0
Laurel Street SB Approach E 56.5 C 33.5 E 56.5
Bliss Street WB Approach A 8.7 B 10.7 A 8.7
Bliss Street EB Approach A 8.2 B 10.1 A 8.2
Overall C 23.3 B 17.9 C 23.2
Laurel Street at Williams Street
Laurel Street NB Approach B 13.8 B 14.7 B 13.3
Laurel Street SB Approach B 13.3 B 11.2 B 10.9
Williams Street WB Approach C 27.4 B 14.8 C 27.4
Williams Street EB Approach B 14.6 A 10.0 B 14.6
Overall B 18.0 B 12.8 B 18.0

V. SUMMARY OF RECOMMENDATIONS
As a result of the alternatives analysis, the following long range recommendations areproposed for the study area. Long range recommendations are typically higher-costimprovements that should be considered for the future as the characteristics of the studyarea continue to change. A summary of the long term transportation needs is shown inFigure V-1.
A. Short Term Recommendations
Based on the results of the existing transportation conditions analysis, a series of shortterm recommendations were developed to address existing traffic deficiencies. Short termrecommendations are meant to be low-cost, "quick-fix" solutions that can be implementedover a 2 -3 year timeframe. No recommendations were developed for areas in whichtransportation improvements are currently planned, as these improvements can beexpected to correct the existing deficiencies at these locations.
a.) Pavement markings should be installed in the westbound direction of ConverseStreet identifying the number of lanes at the approach. A dedicated right turn laneshould be marked. The Right Turn Only sign, on the Converse Street approachcould be made more visible if the approach was marked with the dedicated lane.
b.) Pavement markings should also be re-stripped along Longmeadow Street – Route 5from the intersection of Forest Glen Road through to Williams Street. Shoulderdemarcation has been worn away.
c.) Lane widths varied throughout the study area. The width of the roadway alongLongmeadow Street – Route 5 ranges from 52 feet at the intersection of ForestGlen Road tapering to 31 feet at the intersection of Williams Street. Considerationshould be given to including a dedicated, signed bike lane with any roadwayimprovements. A dedicated bike lane would require 4-5 feet, however a stripedshoulder might provide the same benefit. PVPC can provide “Share the Road”signs upon request. By implementing these improvements while routinemaintenance is being done on roadways, low cost improvements can beimplemented encouraging alternative modes to be used in congested areas.
d.) The Town of Longmeadow should consider enhancing the pedestrian crossing areasat the intersections of Longmeadow Street – Route 5 with Converse Street andBliss Road. The sidewalk is a considerable distance from the intersection and is noteasily noticeable. Additional signs and alternative pavement markings such as acrosswalk with transverse markings or yellow painted interior, would alertmotorists to pedestrian or bicycle crossing, from a greater distance.
e.) Removal of overgrown vegetation at the intersection of Longmeadow Street –Route 5 with Converse Street is recommended. The post style signal is not as

visible until you are approaching the intersection. Any obstructions or closeovergrown vegetation cause confusion to motorists unfamiliar with the area.
f.) The Town of Longmeadow should consider re-striping the lane designationsapproaching the intersection of Longmeadow Street Route – 5 and Forest GlenRoad. In addition a W4-2 sign should be installed on Longmeadow Street- Route 5to indicate the merge to one lane of traffic and reduce driver confusion in this area.
g.) Traffic flow and congestion issues occur along Laurel Street. A safety study shouldbe conducted along Laurel Street in order to analyze the high number of crashes,particularly angle type collisions at the intersection of Laurel Street with BlissRoad. Traffic calming solutions may be recommended to aid in reducing travelspeeds and limiting passing zones along the roadway.
B. Long Term Recommendations
The following long range recommendations are proposed for the study area. Long rangerecommendations consist of higher-cost improvements that may be needed immediatelybut are not currently feasible, improvements that may be required as a result of futuregrowth, and measures to assist in the management of future growth.
1. Traffic Signal Improvements
The existing traffic signals in the study area are displayed primarily on posts. This can
result in the traffic signal being obscured by larger vehicles such as trucks or buses. An
upgrade of the traffic signal equipment to mast arm or span wire mounted traffic signal
head would increase the visibility of the traffic signals and reduce the possibility of the
signals being obscured by larger vehicles. In addition, a variety of ornamental mastarms
and poles are available that could be more aesthetically pleasing in the Town’s Historic
District.
An upgrade of existing traffic signal control equipment would also allow more flexibility in
the development of signal timings and phasing plans. New traffic signal controllers could
be programmed to run different timing plans based on the time of day and in response to
peak travel demands. This would assist in reducing congestion and allow greater flexibility
in making future timing changes in response to changes in the flow of traffic.
Additional benefits of updating the existing traffic signal control equipment include:
• The ability to provided exclusive pedestrian phases and timing plans to increase
the safety of pedestrians attempting to cross Route 5.
• Incorporation of traffic signal pre-emption equipment to allow emergency vehicles
to pre-empt the signal and receiving priority phasing to increase emergency
response time.

• The development of a traffic signal coordination plan to minimize the need for
through moving traffic on Longmeadow Street and Laurel Street to stop at every
traffic signal.
2. Additional Capacity
The results of this study show the need for additional capacity at the intersections of
Longmeadow Street with Converse Street and Longmeadow Street with Forest Glen Road.
The addition of a second through travel lane is required at both intersections to assist in
processing traffic safely and efficiently through both intersections. This would likely
require land takings to provide sufficient right of way for the additional travel lanes. This
widening could be restricted to the immediate vicinity of the intersection to reduce the
impact on private property. It is recommended that the Town of Longmeadow work with
a licensed professional engineer to develop conceptual plans to assess the amount of right
of way that would be necessary to realize this improvement.
3. Engineering Study
Prior to the installation of new traffic signal control equipment, it is recommended that the
Town of Longmeadow employ the services of a registered professional engineer. A
functional design report must be prepared for the study area and conceptual design plans
developed for the project. This study will develop a preliminary cost estimate to
construct the project and assist the Town in developing an approach to fund and
implement the traffic signal improvements.
4. Transportation Improvement Program
The Transportation Improvement Program (TIP) is the central program management tool
for structuring transportation improvement projects. The current TIP identifies a five
year listing of projects for implementation. The TIP must be fiscally constrained, and
programmed according to a regional target (estimate of federal funds) which is provided by
the Executive Office of Transportation (EOT).
Projects funded as part of the TIP are prioritized based on a set of evaluation criteria
developed by EOT. The Pioneer Valley Metropolitan Planning Organization reviews and
endorses the TIP annually.
A project can be considered for funding as part of the TIP at the written request of the
chief locally elected official of the PVPC member community. This request should include
a brief description of the project, its estimated construction cost and its current design
status (i.e. 25%, 75%, 100%). Each community is strongly encouraged to meet with the
Massachusetts Highway Department district office prior to the start of a transportation
improvement project to determine the eligibility of the project for federal funds. It is
typically the responsibility of the community to fund the cost to design the project.
Inclusion as part of the TIP is not a guarantee of future federal construction funds as each
project is re-evaluated on an annual basis. It is very important to work closely with the

design engineering firm and the Massachusetts Highway Department to advance the
project towards construction. Regular project updates will also need to be provided to the
PVPC to assist in assigning project into the appropriate construction year.

VI. PUBLIC PARTICIPATIONThe Pioneer Valley Planning Commission attended the Town of Longmeadow, Traffic
Safety Committee meeting on July 21, 2004 at the Police Station Community meeting
room to discuss the traffic findings in the draft version of this report. The Draft report
was issued for a 30 day public comment period in September 2004. The following
comments were received from The Massachusetts Highway Department:
• The report should include additional description of the study area including
roadway geometry, posted speed limits and roadway classification.
• Additional data should be included for pedestrian and bicycle traffic.
• MassHighway practice does not include transverse marking or yellow painted
interior lines within crosswalks.
• The study should include heavy vehicle traffic through the corridor.
The Pioneer Valley Planning Commission has included all data collected throughout the
study area, which includes truck traffic, pedestrian and bicycle counts, truck volume and
intersection diagrams of the study area.

VII. APPENDIX