Embed Size (px)
Citation preview
2013 edition
Tourism Satellite Accounts (TSAs)
in Europe
Statistical working papers
ISSN 2315-0807
2013 edition
Tourism Satellite Accounts (TSAs)in Europe
Statistical working papers
2013 edition
Europe Direct is a service to help you find answers to your questions about the European Union.
Freephone number (*):00 800 6 7 8 9 10 11
0H(*) The information given is free, as are most calls (though some operators, phone boxes or hotels may charge you).
More information on the European Union is available on the Internet (http://europa.eu).
Cataloguing data can be found at the end of this publication.
Luxembourg: Publications Office of the European Union, 2013
ISBN 978-92-79-33271-5 ISSN 2315-0807 doi:10.2785/47554Cat. No: KS-TC-13-006-EN-N
Theme: Industry, trade and services Collection: Statistical working papers
© European Union, 2013 Reproduction is authorised provided the source is acknowledged.
3Tourism Satellite Accounts (TSAs) in Europe
Table of Contents Introduction .................................................................................................................................... 4
Main findings ................................................................................................................................. 5
Background and introductory comments on the data ................................................................... 6
The demand side: how much do visitors spend? ........................................................................ 10
The supply side: how much does tourism contribute to the national economy? ......................... 18
Tourism gross fixed capital formation and collective consumption ............................................. 21
Non-monetary data ...................................................................................................................... 22
Annex — List of indicators in the questionnaire .......................................................................... 23
Methodological notes .................................................................................................................. 25
4Tourism Satellite Accounts (TSAs) in Europe
IntroductionIt is generally acknowledged that tourism plays an important role in many countries’ economies. This is certainly true in the European Union, which is the world’s number one tourist destination. For a large number of EU Member States, tourism has been a significant driver of the national economy and labour market during the recent recession. It contributes not only to countries’ and regions’ economic development, but also their social and cultural development and general well-being.
Most European countries have a well-established system of statistics to track ‘tourism demand’ in terms of domestic and outbound trips, the use of tourist accommodation and how much tourists spend. Such statistics are useful, but they do not quantify the overall contribution that tourism makes to the economy. For that purpose, the World Tourism Organisation (UNWTO), the United Nations Statistics Division (UNSD), the Organisation for Economic Cooperation and Development (OECD) and the Statistical Office of the European Union (Eurostat) have developed a harmonised system of ‘tourism satellite accounts’ (TSAs). This uses the same concepts, definitions and classifications as national accounts and is the internationally recognised framework for measuring tourist activity and the importance of tourism to national or regional economies. While traditional tourism statistics focus primarily on ‘flows’ (number of visitors, number of overnight stays, etc.), TSAs tell us how much tourism contributes to an economy and how many jobs it creates.
The Commission has taken a series of initiatives in the past ten years to encourage Member States to compile TSAs. The Directorate-General for Enterprise and Industry ran a system of grants, of which there were three rounds, Eurostat coordinated a two-year project (1) in 2008-09 and in 2010 and 2013 the Member States and EFTA countries were invited to voluntarily submit all their available TSA data. This report presents an analysis of this second set of data and is thus a follow-up to the 2010 edition of Tourism Satellite Accounts (TSA) in Europe(2). The data are not always comparable across countries, but their usefulness for policy-makers will be clear, as will the importance of tourism to European economies.
Eurostat would like to thank all national authorities which contributed to this publication by submitting data and in particular Pavel Van ura and Zden k Lejsek (Czech Statistical Office), Peter Laimer (Statistics Austria) and Sean White (UK Office for National Statistics), who kindly agreed to assess and analyse the data.
Sophie Limpach
Head of Unit
Short-term Statistics; Tourism
(1) For more info, see http://epp.eurostat.ec.europa.eu/portal/page/portal/tourism/methodology .
(2) http://epp.eurostat.ec.europa.eu/cache/ITY_OFFPUB/KS-RA-10-031/EN/KS-RA-10-031-EN.PDF.
5Tourism Satellite Accounts (TSAs) in Europe
Main findings The objective of this exercise was twofold: to establish the take-up of the TSA approach across Europe and to collect a limited set of TSA indicators so as to be able to analyse European tourism in a macroeconomic framework.
Coverage and methodology
TSA indicators were voluntarily submitted by 22 countries: 17 Member States, 3 EFTA countries and 2 candidate countries. The 17 Member States account for close to 90 % of tourism activity in Europe (in terms of trips made by residents or overnight stays in tourist accommodation) and are thus likely to be representative of the EU as a whole.
The TSA framework consists of ten tables, but the scope of input to these varied widely across the countries in question. The tables relating to the demand side were relatively complete, but less than half the requested information was available for the table on employment. The indicators on gross fixed capital formation and collective consumption were only sparsely covered. Possible future action should focus on broadening TSA coverage by including more countries and deepening it by introducing more tables and variables from the 2008 Tourism Satellite Account: Recommended Methodological Framework (TSA:RMF 2008) (3).
The comparability of the indicators was affected by different degrees of adherence to the TSA:RMF 2008. Due to a lack of sources, a significant number of indicators differed slightly from the recommendations or were not available. A second factor affecting comparability was the range of reference years used, but given that TSAs are a tool for structural rather than short-term analysis, it was still meaningful to compare indicators for the participating countries in terms of order of magnitude.
Analysis
The analysis on the demand side showed that domestic tourism accounted on average for 70 % of internal tourism expenditure in the countries for which data were available and ‘inbound expenditure’ for 30 %. The importance of domestic tourism in internal tourism expenditure ranged from 83 % in Germany to only 8 % in Montenegro.
More than half of domestic tourism expenditure was by same-day visitors (52 %), while inbound tourism expenditure was dominated by overnight visitors (90 %).
The analysis of supply is based on macroeconomic variables such as gross value added, gross domestic product and internal consumption relating to tourism and how they compare with totals for the overall economy. These variables are useful for gauging the importance of tourism to the economy as a whole and as compared with other economic activities.
The contribution of tourism to an economy can be expressed as a ‘tourism ratio’, i.e. the proportion of total domestic supply accounted for by internal tourism consumption. The average tourism ratio in the countries for which data were available was 3.9 %, i.e. domestic and inbound visitors consumed 3.9 % of the total output of tourism and non-tourism industries. The ratio ranged from 1.6 % in Czech Republic and Romania to over 5 % in Spain (5.7 %) and Switzerland (7.7 %).
Tourism generated more than 10 million jobs in the 12 countries for which data were available. The highest figures were recorded in the UK (3.2 million), Germany (2.9 million) and Spain (2.6 million). Extrapolating from these data, Eurostat would tentatively estimate that tourism provides around 17 million jobs in the EU.
(3) 2008 Tourism Satellite Account: Recommended Methodological Framework (TSA:RMF 2008); United Nations Statistics Division (UNSD),
Statistical Office of the European Communities (Eurostat), Organisation for Economic Cooperation and Development (OECD) and WorldTourism Organisation (UNWTO). The document is available on the Eurostat website (see footnote 1).
6Tourism Satellite Accounts (TSAs) in Europe
Background and introductory comments on the data This report presents conclusions from the second round of data collection on TSA in Europe (EU, EFTA and candidate countries), despite the different reference years for the data (see Table 2). Data were transmitted voluntarily (4) to Eurostat between December 2012 and March 2013, the EU’s 2008-09 Tourism Satellite Accounts project (5) having shown that work on TSA was sufficiently advanced in many countries. The first TSA exercise, involving 23 countries, took place in 2010. Eurostat’s intention was to collect readily available and voluntarily submitted TSA data from Member States, EFTA and candidate countries every two or three years. The second exercise, which is the subject of this report, builds largely on the success of the first.
The indicators requested (see Annex) were a subset — focusing on headline indicators and totals — of the tables in the TSA:RMF 2008. An indicator on the number of persons employed, which is not covered by the TSA:RMF 2008 tables, was added to the Eurostat TSA questionnaire, as this was considered important to complete the picture of employment in tourism.
It needs to be borne in mind — especially when comparing and interpreting them — that the comparability of the results may be affected by methodological differences between national TSAs and the TSA:RMF 2008, different degrees of completeness, different levels of statistical ‘maturity’ (some figures are preliminary, others come from pilot projects) and different reference years. To give data users a clearer idea of data quality, explanatory notes on the tables and graphs are included where possible. It is highly recommended that these metadata be taken into account when results are analysed, compared or interpreted.
For this second TSA exercise at EU level, 22 countries provided data: − 17 Member States (Czech Republic, Germany, Estonia, Spain, France, Italy, Latvia, Lithuania, the
Netherlands, Austria, Poland, Portugal, Romania, Slovenia, Slovakia, Sweden and the United Kingdom);
− 3 EFTA countries (Iceland, Norway and Switzerland); and − 2 candidate countries (Montenegro and Turkey).
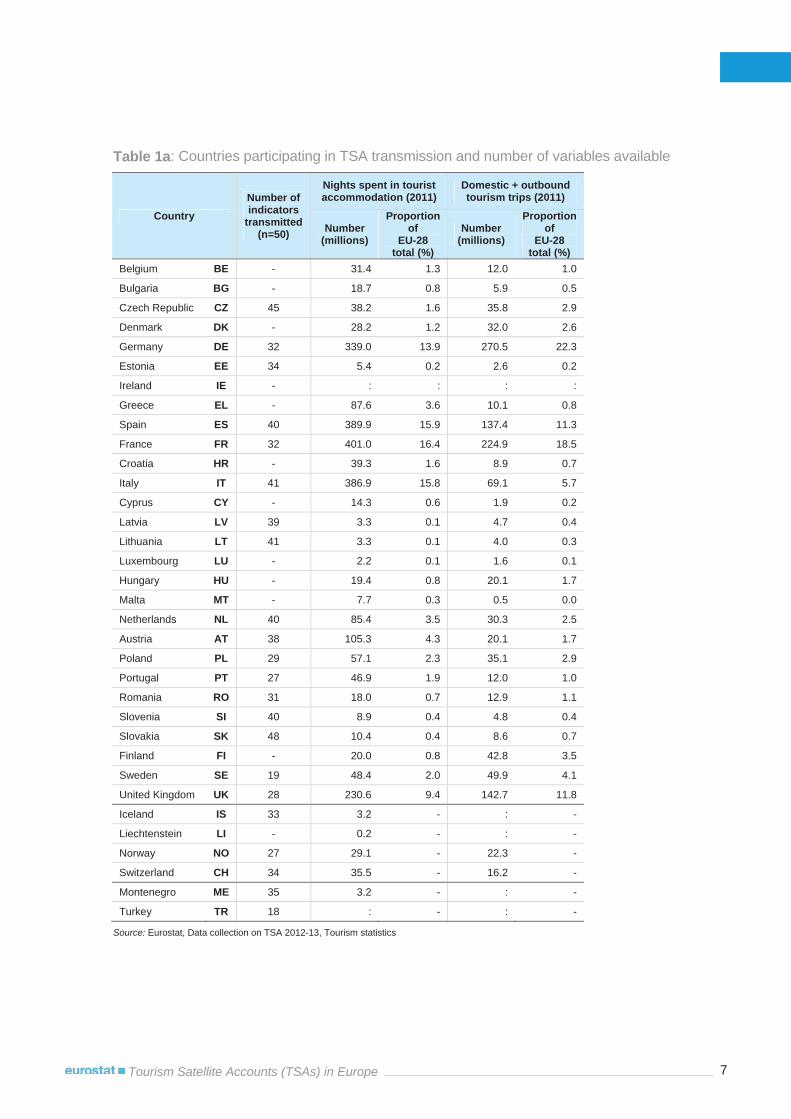
Table 1a indicates how many of the 50 indicators were transmitted by each of the countries (see Annex for full set of indicators). Coverage, which was partial in all cases (ranging from 18 to 48 indicators), also gives an indication of how complete the national TSAs are. For information, Table 1a also includes some core tourism statistics to show the representativeness of the participating countries: the 17 Member States account for 89 % of all nights spent in tourist accommodation establishments across the Union and 88 % of all tourism trips made by EU residents. In other words, the fact that most big Member States and the most important tourist destinations are covered means that the data are fairly representative of the EU as a whole.
(4) The compilation and transmission of TSA data go beyond the legal requirements for tourism statistics, as laid down in Regulation (EU)
No 692/2011 concerning European statistics on tourism, hence the voluntary nature of this data transmission.
(5) The project deliverables are available on the Eurostat website: http://epp.eurostat.ec.europa.eu/portal/page/portal/tourism/methodology.
7Tourism Satellite Accounts (TSAs) in Europe
Table 1a: Countries participating in TSA transmission and number of variables available
Country Number of indicators
transmitted (n=50)
Nights spent in tourist accommodation (2011)
Domestic + outbound tourism trips (2011)
Number (millions)
Proportion of
EU-28total (%)
Number (millions)
Proportion of
EU-28total (%)
Belgium BE - 31.4 1.3 12.0 1.0
Bulgaria BG - 18.7 0.8 5.9 0.5
Czech Republic CZ 45 38.2 1.6 35.8 2.9
Denmark DK - 28.2 1.2 32.0 2.6
Germany DE 32 339.0 13.9 270.5 22.3
Estonia EE 34 5.4 0.2 2.6 0.2
Ireland IE - : : : :
Greece EL - 87.6 3.6 10.1 0.8
Spain ES 40 389.9 15.9 137.4 11.3
France FR 32 401.0 16.4 224.9 18.5
Croatia HR - 39.3 1.6 8.9 0.7
Italy IT 41 386.9 15.8 69.1 5.7
Cyprus CY - 14.3 0.6 1.9 0.2
Latvia LV 39 3.3 0.1 4.7 0.4
Lithuania LT 41 3.3 0.1 4.0 0.3
Luxembourg LU - 2.2 0.1 1.6 0.1
Hungary HU - 19.4 0.8 20.1 1.7
Malta MT - 7.7 0.3 0.5 0.0
Netherlands NL 40 85.4 3.5 30.3 2.5
Austria AT 38 105.3 4.3 20.1 1.7
Poland PL 29 57.1 2.3 35.1 2.9
Portugal PT 27 46.9 1.9 12.0 1.0
Romania RO 31 18.0 0.7 12.9 1.1
Slovenia SI 40 8.9 0.4 4.8 0.4
Slovakia SK 48 10.4 0.4 8.6 0.7
Finland FI - 20.0 0.8 42.8 3.5
Sweden SE 19 48.4 2.0 49.9 4.1
United Kingdom UK 28 230.6 9.4 142.7 11.8
Iceland IS 33 3.2 - : -
Liechtenstein LI - 0.2 - : -
Norway NO 27 29.1 - 22.3 -
Switzerland CH 34 35.5 - 16.2 -
Montenegro ME 35 3.2 - : -
Turkey TR 18 : - : -
Source: Eurostat, Data collection on TSA 2012-13, Tourism statistics
8Tourism Satellite Accounts (TSAs) in Europe
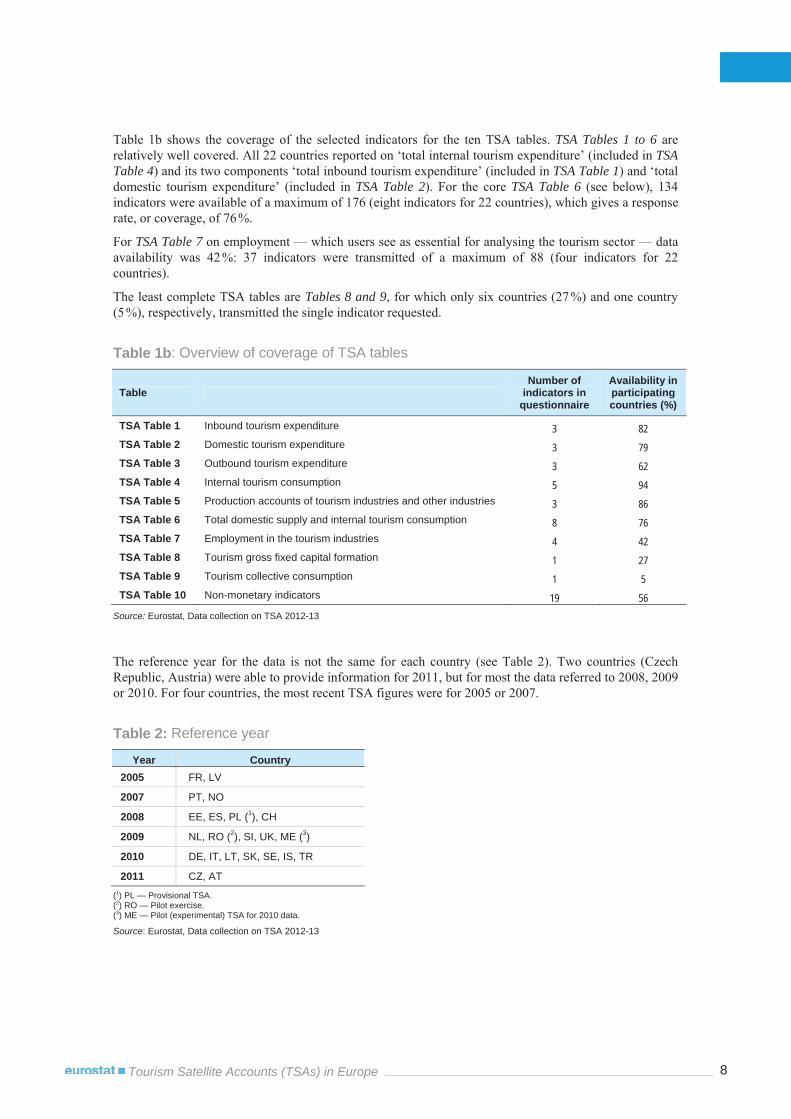
Table 1b shows the coverage of the selected indicators for the ten TSA tables. TSA Tables 1 to 6 are relatively well covered. All 22 countries reported on ‘total internal tourism expenditure’ (included in TSATable 4) and its two components ‘total inbound tourism expenditure’ (included in TSA Table 1) and ‘total domestic tourism expenditure’ (included in TSA Table 2). For the core TSA Table 6 (see below), 134 indicators were available of a maximum of 176 (eight indicators for 22 countries), which gives a response rate, or coverage, of 76 %.
For TSA Table 7 on employment — which users see as essential for analysing the tourism sector — data availability was 42 %: 37 indicators were transmitted of a maximum of 88 (four indicators for 22 countries).
The least complete TSA tables are Tables 8 and 9, for which only six countries (27 %) and one country (5 %), respectively, transmitted the single indicator requested.
Table 1b: Overview of coverage of TSA tables
Table Number of
indicators in questionnaire
Availability in participating countries (%)
TSA Table 1 Inbound tourism expenditure 3 82 TSA Table 2 Domestic tourism expenditure 3 79 TSA Table 3 Outbound tourism expenditure 3 62 TSA Table 4 Internal tourism consumption 5 94 TSA Table 5 Production accounts of tourism industries and other industries 3 86 TSA Table 6 Total domestic supply and internal tourism consumption 8 76 TSA Table 7 Employment in the tourism industries 4 42 TSA Table 8 Tourism gross fixed capital formation 1 27 TSA Table 9 Tourism collective consumption 1 5 TSA Table 10 Non-monetary indicators 19 56
Source: Eurostat, Data collection on TSA 2012-13
The reference year for the data is not the same for each country (see Table 2). Two countries (Czech Republic, Austria) were able to provide information for 2011, but for most the data referred to 2008, 2009 or 2010. For four countries, the most recent TSA figures were for 2005 or 2007.
Table 2: Reference year
Year Country 2005 FR, LV
2007 PT, NO
2008 EE, ES, PL (1), CH
2009 NL, RO (2), SI, UK, ME (3)
2010 DE, IT, LT, SK, SE, IS, TR
2011 CZ, AT
(1) PL — Provisional TSA. (2) RO — Pilot exercise. (3) ME — Pilot (experimental) TSA for 2010 data.
Source: Eurostat, Data collection on TSA 2012-13
9Tourism Satellite Accounts (TSAs) in Europe
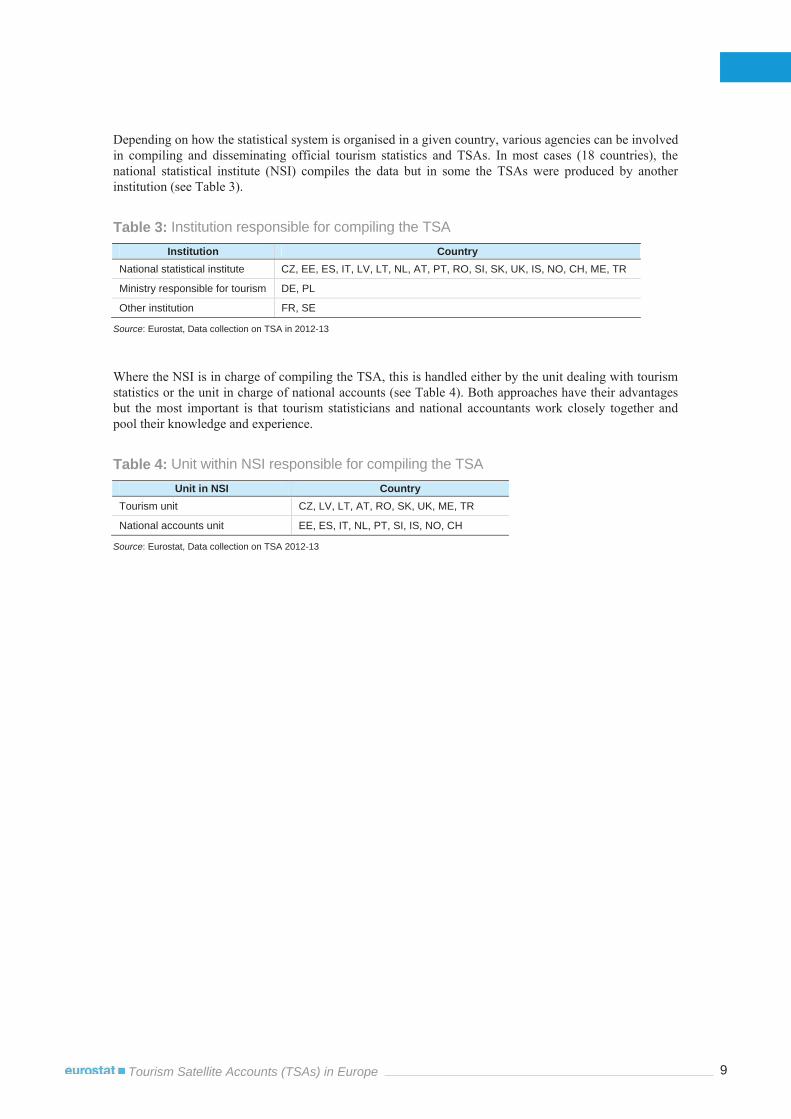
Depending on how the statistical system is organised in a given country, various agencies can be involved in compiling and disseminating official tourism statistics and TSAs. In most cases (18 countries), the national statistical institute (NSI) compiles the data but in some the TSAs were produced by another institution (see Table 3).
Table 3: Institution responsible for compiling the TSA Institution Country
National statistical institute CZ, EE, ES, IT, LV, LT, NL, AT, PT, RO, SI, SK, UK, IS, NO, CH, ME, TR
Ministry responsible for tourism DE, PL
Other institution FR, SE
Source: Eurostat, Data collection on TSA in 2012-13
Where the NSI is in charge of compiling the TSA, this is handled either by the unit dealing with tourism statistics or the unit in charge of national accounts (see Table 4). Both approaches have their advantages but the most important is that tourism statisticians and national accountants work closely together and pool their knowledge and experience.
Table 4: Unit within NSI responsible for compiling the TSA Unit in NSI Country
Tourism unit CZ, LV, LT, AT, RO, SK, UK, ME, TR
National accounts unit EE, ES, IT, NL, PT, SI, IS, NO, CH
Source: Eurostat, Data collection on TSA 2012-13
10Tourism Satellite Accounts (TSAs) in Europe
The demand side: how much do visitors spend? The first four TSA tables contain demand-side data on expenditure by visitors (before and during their trip) and tourism consumption. Tourism expenditure is subdivided into inbound, domestic and outbound tourism in TSA Tables 1, 2 and 3, whereas TSA Table 4 focuses on internal tourism consumption,summarising inbound and domestic tourism expenditure, but also covering other components of consumption. ‘Tourism consumption’ is more or less the same as ‘tourism expenditure’, but a little broader in scope. Apart from expenditure, consumption also covers inter alia services such as the imputed rent of holiday homes and services paid by non-profit institutions for trips made by special groups (e.g. disabled people).
Overnight visitors (tourists) accounted for 90 % of inbound tourism expenditure
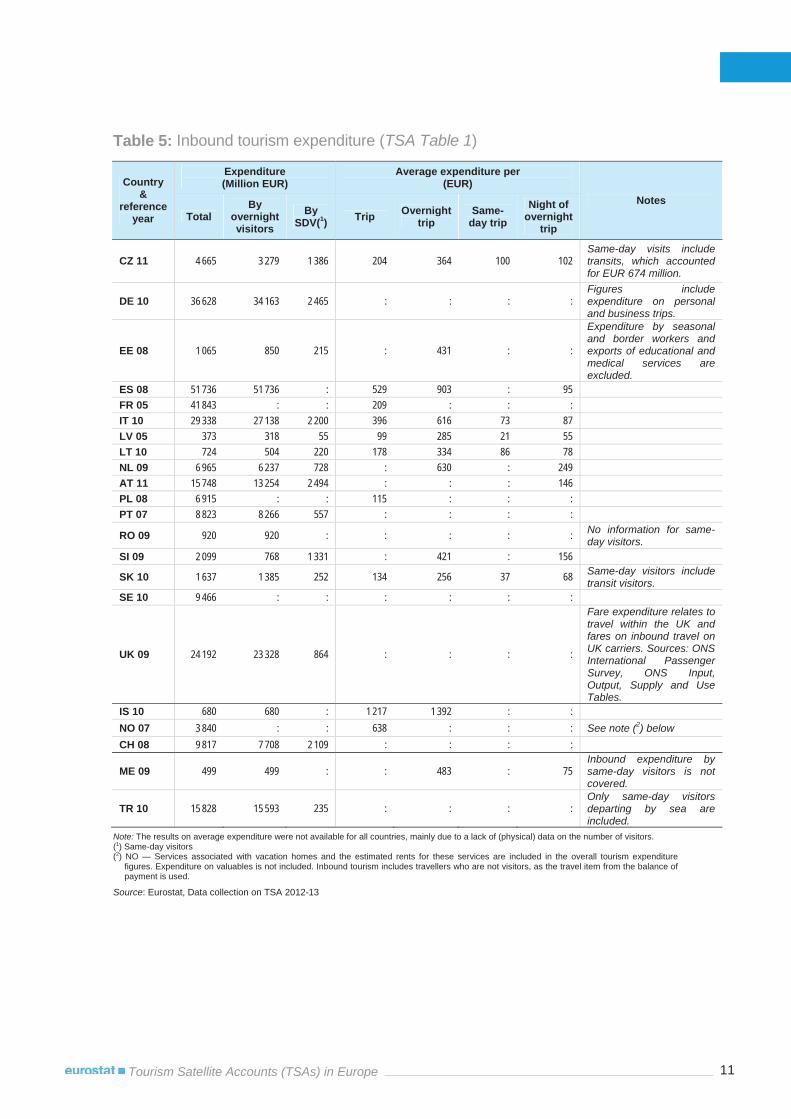
Table 5 shows inbound tourism expenditure in the country visited. These results were available for all 22 countries.
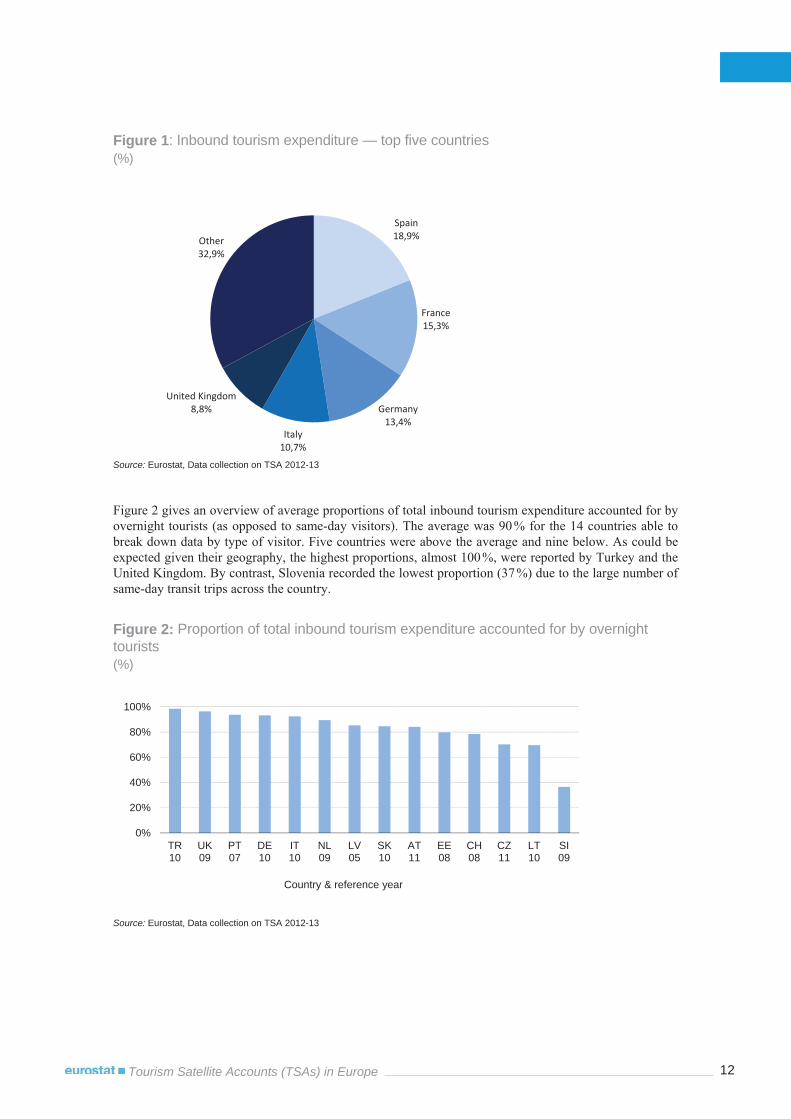
Spain recorded the highest value: EUR 51 736 million in 2008, or 19 % of the total for all 22 countries. France came second (EUR 41 843 million in 2005), followed by Germany (EUR 36 628 million in 2010), Italy (EUR 29 338 million in 2010) and the United Kingdom (EUR 24 194 million in 2009). These five countries accounted for 67 % of inbound tourism expenditure in all the countries participating. A breakdown is shown in Figure 1.
Where possible, average inbound expenditure (6) per trip and per night of a trip has been calculated to improve the comparability of the results. Calculations (7) show that visitors to Iceland spent the most, averaging nearly EUR 1 217 per (same-day or overnight) trip in 2010. Visitors to Norway spent EUR 638 (in 2007) and visitors to Spain EUR 529 (in 2008). Average expenditure per trip for all countries for which data are available was EUR 294.
Expenditure per same-day trip was lower than expenditure per night of overnight trip for obvious reasons (for the latter tourists generally (8) have to pay for accommodation). Looking at expenditure per night largely filters out the effect of the length of the trip; the highest values were recorded in the Netherlands (EUR 249 in 2009) and Slovenia (EUR 156 in 2009) and the lowest in Latvia (EUR 55 in 2005), with the average at EUR 100. For expenditure per same-day trip (available for five countries only), the highest value was recorded in the Czech Republic (EUR 100 in 2011) and the lowest again in Latvia (EUR 21 in 2005), with an average of EUR 74.
(6) Since inbound expenditure covers only spending at destinations abroad (not the part of visitors’ expenditure incurred at home), there is a
difference between ‘average inbound expenditure per trip’ and ‘average expenditure per inbound trip’ (which generally includes all spending connected with inbound tourism trips, whether in the country of residence or abroad).
(7) Calculations were based on monetary (expenditure) and non-monetary data (see Table 12) and were available for ten countries (see Table 5).
(8) In some cases (e.g. visits to relatives or friends), accommodation is free of charge.
11Tourism Satellite Accounts (TSAs) in Europe
Table 5: Inbound tourism expenditure (TSA Table 1)
Country &
referenceyear
Expenditure (Million EUR)
Average expenditure per (EUR)
Notes Total
By overnight visitors
By SDV(1) Trip Overnight
trip Same-
day trip Night of
overnight trip
CZ 11 4 665 3 279 1 386 204 364 100 102 Same-day visits include transits, which accounted for EUR 674 million.
DE 10 36 628 34 163 2 465 : : : : Figures include expenditure on personal and business trips.
EE 08 1 065 850 215 : 431 : :
Expenditure by seasonal and border workers and exports of educational and medical services are excluded.
ES 08 51 736 51 736 : 529 903 : 95 FR 05 41 843 : : 209 : : : IT 10 29 338 27 138 2 200 396 616 73 87 LV 05 373 318 55 99 285 21 55 LT 10 724 504 220 178 334 86 78 NL 09 6 965 6 237 728 : 630 : 249 AT 11 15 748 13 254 2 494 : : : 146 PL 08 6 915 : : 115 : : : PT 07 8 823 8 266 557 : : : :
RO 09 920 920 : : : : : No information for same-day visitors.
SI 09 2 099 768 1 331 : 421 : 156
SK 10 1 637 1 385 252 134 256 37 68 Same-day visitors include transit visitors.
SE 10 9 466 : : : : : :
UK 09 24 192 23 328 864 : : : :
Fare expenditure relates to travel within the UK and fares on inbound travel on UK carriers. Sources: ONS International Passenger Survey, ONS Input, Output, Supply and Use Tables.
IS 10 680 680 : 1 217 1 392 : : NO 07 3 840 : : 638 : : : See note (2) below CH 08 9 817 7 708 2 109 : : : :
ME 09 499 499 : : 483 : 75 Inbound expenditure by same-day visitors is not covered.
TR 10 15 828 15 593 235 : : : : Only same-day visitors departing by sea are included.
Note: The results on average expenditure were not available for all countries, mainly due to a lack of (physical) data on the number of visitors. (1) Same-day visitors (2) NO — Services associated with vacation homes and the estimated rents for these services are included in the overall tourism expenditure
figures. Expenditure on valuables is not included. Inbound tourism includes travellers who are not visitors, as the travel item from the balance of payment is used.
Source: Eurostat, Data collection on TSA 2012-13
12Tourism Satellite Accounts (TSAs) in Europe
Figure 1: Inbound tourism expenditure — top five countries (%)
Source: Eurostat, Data collection on TSA 2012-13
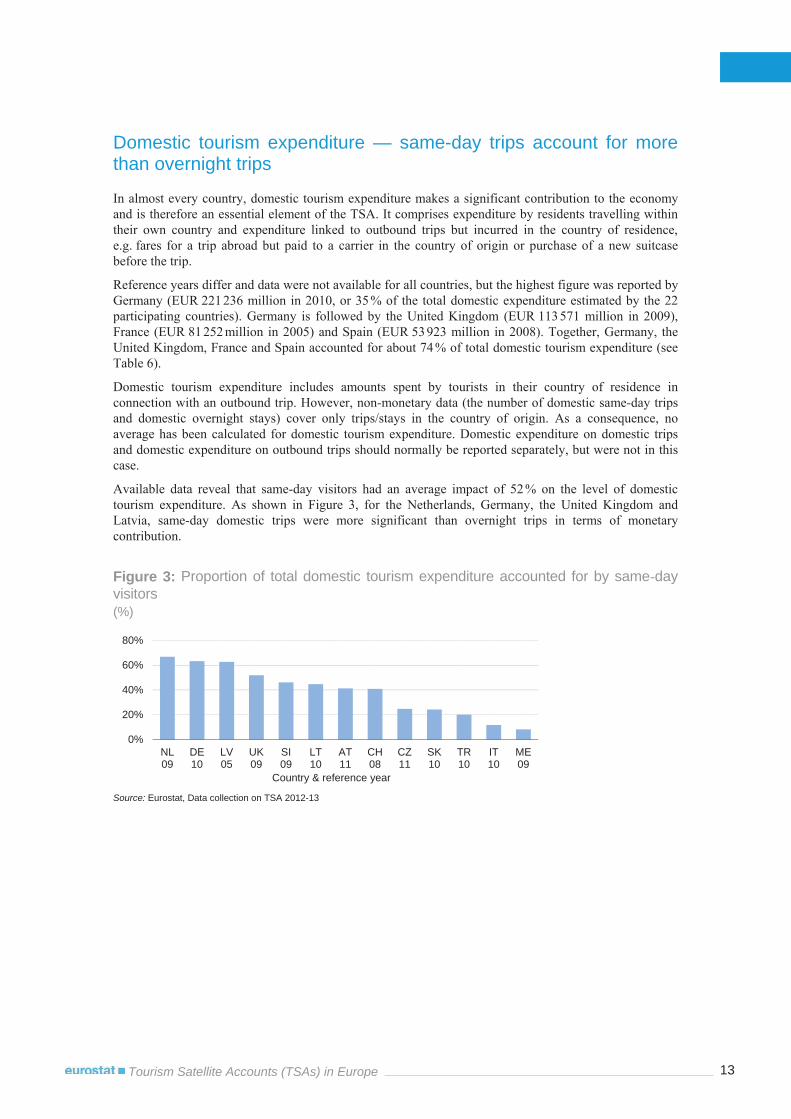
Figure 2 gives an overview of average proportions of total inbound tourism expenditure accounted for by overnight tourists (as opposed to same-day visitors). The average was 90 % for the 14 countries able to break down data by type of visitor. Five countries were above the average and nine below. As could be expected given their geography, the highest proportions, almost 100 %, were reported by Turkey and the United Kingdom. By contrast, Slovenia recorded the lowest proportion (37 %) due to the large number of same-day transit trips across the country.
Figure 2: Proportion of total inbound tourism expenditure accounted for by overnight tourists (%)
Source: Eurostat, Data collection on TSA 2012-13
Spain18,9%
France15,3%
Germany13,4%
Italy10,7%
United Kingdom8,8%
Other32,9%
0%
20%
40%
60%
80%
100%
TR10
UK09
PT07
DE10
IT10
NL09
LV05
SK10
AT11
EE08
CH08
CZ11
LT10
SI09
Country & reference year
13Tourism Satellite Accounts (TSAs) in Europe
Domestic tourism expenditure — same-day trips account for more than overnight trips
In almost every country, domestic tourism expenditure makes a significant contribution to the economy and is therefore an essential element of the TSA. It comprises expenditure by residents travelling within their own country and expenditure linked to outbound trips but incurred in the country of residence, e.g. fares for a trip abroad but paid to a carrier in the country of origin or purchase of a new suitcase before the trip.
Reference years differ and data were not available for all countries, but the highest figure was reported by Germany (EUR 221 236 million in 2010, or 35 % of the total domestic expenditure estimated by the 22 participating countries). Germany is followed by the United Kingdom (EUR 113 571 million in 2009), France (EUR 81 252 million in 2005) and Spain (EUR 53 923 million in 2008). Together, Germany, the United Kingdom, France and Spain accounted for about 74 % of total domestic tourism expenditure (see Table 6).
Domestic tourism expenditure includes amounts spent by tourists in their country of residence in connection with an outbound trip. However, non-monetary data (the number of domestic same-day trips and domestic overnight stays) cover only trips/stays in the country of origin. As a consequence, no average has been calculated for domestic tourism expenditure. Domestic expenditure on domestic trips and domestic expenditure on outbound trips should normally be reported separately, but were not in this case.
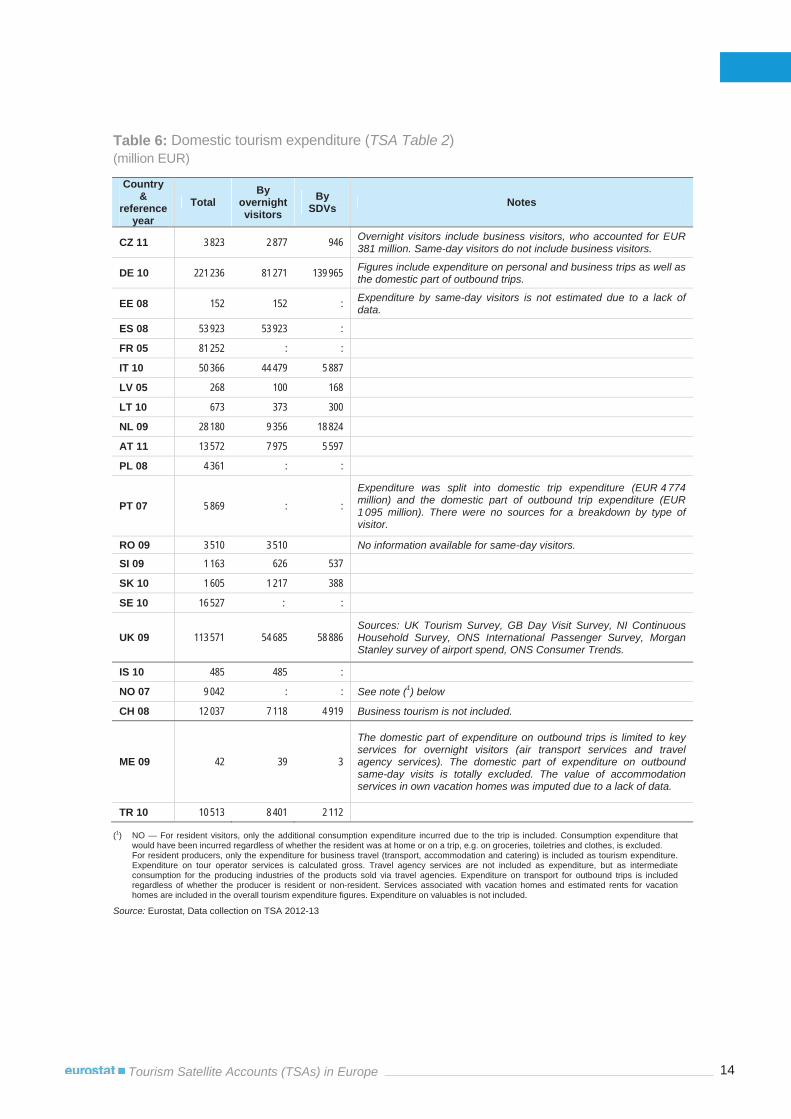
Available data reveal that same-day visitors had an average impact of 52 % on the level of domestic tourism expenditure. As shown in Figure 3, for the Netherlands, Germany, the United Kingdom and Latvia, same-day domestic trips were more significant than overnight trips in terms of monetary contribution.
Figure 3: Proportion of total domestic tourism expenditure accounted for by same-day visitors (%)
Source: Eurostat, Data collection on TSA 2012-13
0%
20%
40%
60%
80%
NL09
DE10
LV05
UK09
SI09
LT10
AT11
CH08
CZ11
SK10
TR10
IT10
ME09
Country & reference year
14Tourism Satellite Accounts (TSAs) in Europe
Table 6: Domestic tourism expenditure (TSA Table 2)(million EUR)
Country &
referenceyear
Total By
overnight visitors
By SDVs Notes
CZ 11 3 823 2 877 946 Overnight visitors include business visitors, who accounted for EUR 381 million. Same-day visitors do not include business visitors.
DE 10 221 236 81 271 139 965 Figures include expenditure on personal and business trips as well as the domestic part of outbound trips.
EE 08 152 152 : Expenditure by same-day visitors is not estimated due to a lack of data.
ES 08 53 923 53 923 :
FR 05 81 252 : :
IT 10 50 366 44 479 5 887
LV 05 268 100 168
LT 10 673 373 300
NL 09 28 180 9 356 18 824
AT 11 13 572 7 975 5 597
PL 08 4 361 : :
PT 07 5 869 : : Expenditure was split into domestic trip expenditure (EUR 4 774 million) and the domestic part of outbound trip expenditure (EUR 1095 million). There were no sources for a breakdown by type of visitor.
RO 09 3 510 3 510 No information available for same-day visitors.
SI 09 1 163 626 537
SK 10 1 605 1 217 388
SE 10 16 527 : :
UK 09 113 571 54 685 58 886Sources: UK Tourism Survey, GB Day Visit Survey, NI Continuous Household Survey, ONS International Passenger Survey, Morgan Stanley survey of airport spend, ONS Consumer Trends.
IS 10 485 485 :
NO 07 9 042 : : See note (1) below
CH 08 12 037 7 118 4 919 Business tourism is not included.
ME 09 42 39 3
The domestic part of expenditure on outbound trips is limited to key services for overnight visitors (air transport services and travel agency services). The domestic part of expenditure on outbound same-day visits is totally excluded. The value of accommodation services in own vacation homes was imputed due to a lack of data.
TR 10 10 513 8 401 2 112
(1) NO — For resident visitors, only the additional consumption expenditure incurred due to the trip is included. Consumption expenditure that would have been incurred regardless of whether the resident was at home or on a trip, e.g. on groceries, toiletries and clothes, is excluded. For resident producers, only the expenditure for business travel (transport, accommodation and catering) is included as tourism expenditure. Expenditure on tour operator services is calculated gross. Travel agency services are not included as expenditure, but as intermediate consumption for the producing industries of the products sold via travel agencies. Expenditure on transport for outbound trips is included regardless of whether the producer is resident or non-resident. Services associated with vacation homes and estimated rents for vacation homes are included in the overall tourism expenditure figures. Expenditure on valuables is not included.
Source: Eurostat, Data collection on TSA 2012-13
15Tourism Satellite Accounts (TSAs) in Europe
Domestic tourism expenditure was twice as high as inbound tourism expenditure
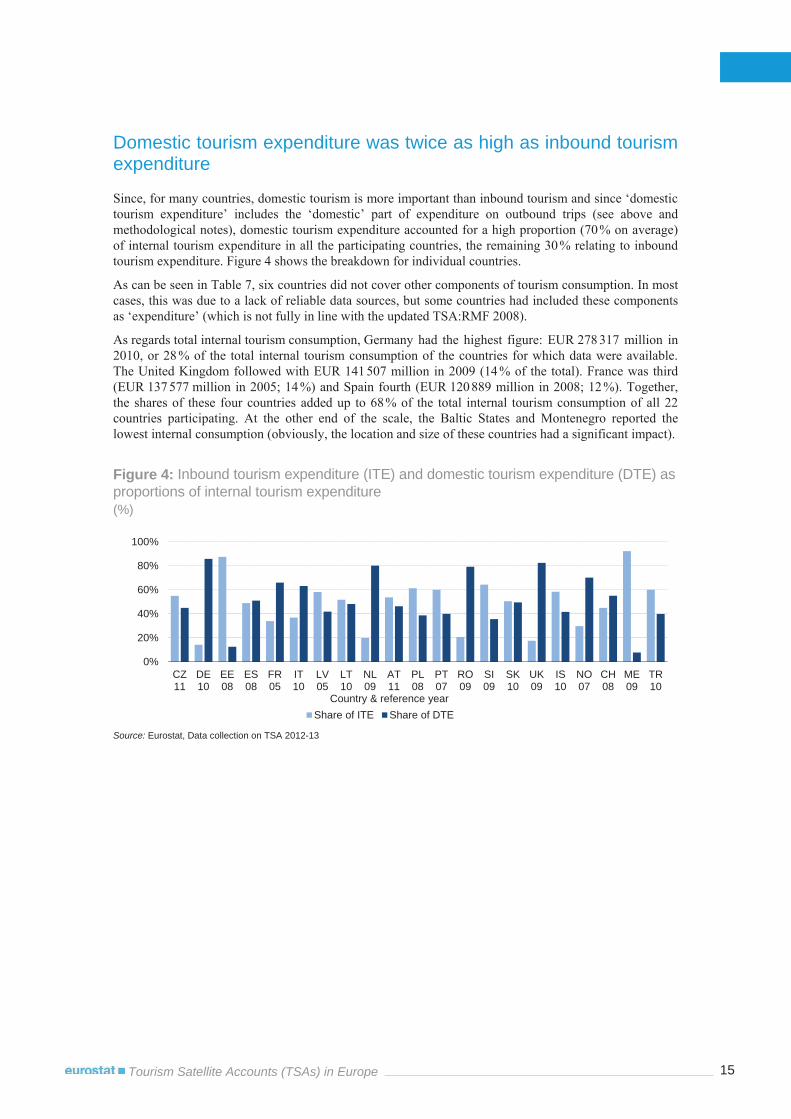
Since, for many countries, domestic tourism is more important than inbound tourism and since ‘domestic tourism expenditure’ includes the ‘domestic’ part of expenditure on outbound trips (see above and methodological notes), domestic tourism expenditure accounted for a high proportion (70 % on average) of internal tourism expenditure in all the participating countries, the remaining 30 % relating to inbound tourism expenditure. Figure 4 shows the breakdown for individual countries.
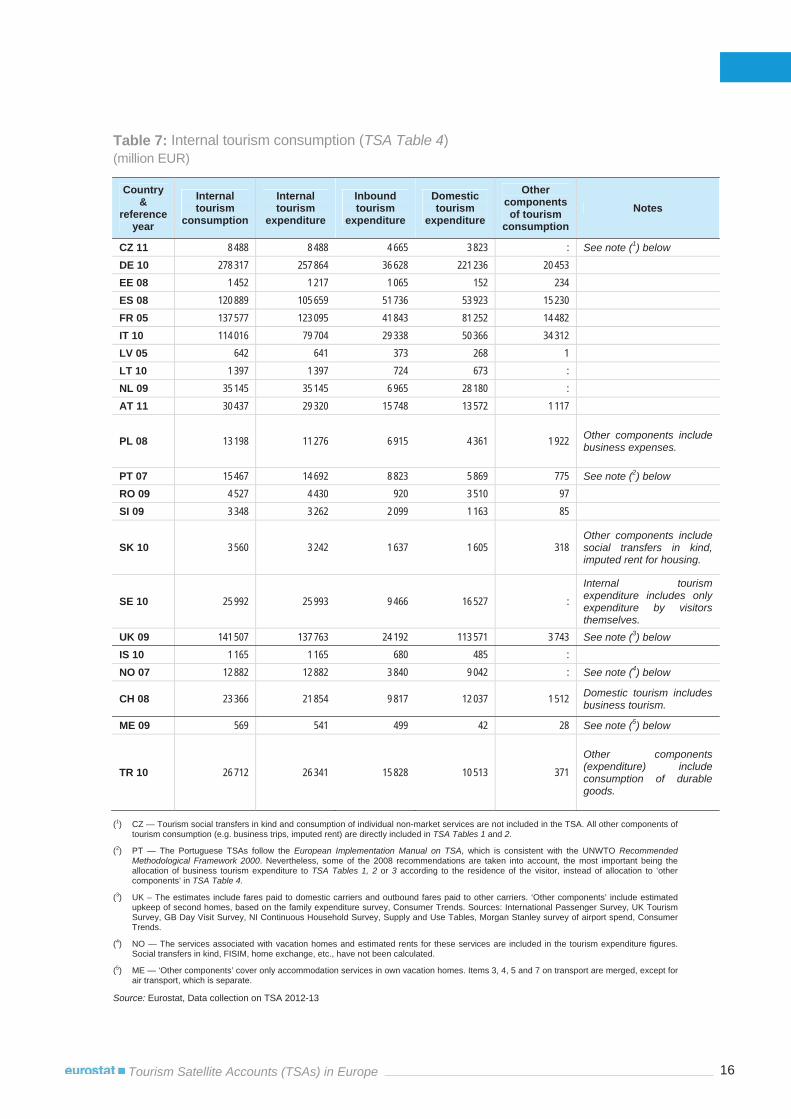
As can be seen in Table 7, six countries did not cover other components of tourism consumption. In most cases, this was due to a lack of reliable data sources, but some countries had included these components as ‘expenditure’ (which is not fully in line with the updated TSA:RMF 2008).
As regards total internal tourism consumption, Germany had the highest figure: EUR 278 317 million in 2010, or 28 % of the total internal tourism consumption of the countries for which data were available. The United Kingdom followed with EUR 141 507 million in 2009 (14 % of the total). France was third (EUR 137 577 million in 2005; 14 %) and Spain fourth (EUR 120 889 million in 2008; 12 %). Together, the shares of these four countries added up to 68 % of the total internal tourism consumption of all 22 countries participating. At the other end of the scale, the Baltic States and Montenegro reported the lowest internal consumption (obviously, the location and size of these countries had a significant impact).
Figure 4: Inbound tourism expenditure (ITE) and domestic tourism expenditure (DTE) as proportions of internal tourism expenditure (%)
Source: Eurostat, Data collection on TSA 2012-13
0%
20%
40%
60%
80%
100%
CZ11
DE10
EE08
ES08
FR05
IT10
LV05
LT10
NL09
AT11
PL08
PT07
RO09
SI09
SK10
UK09
IS10
NO07
CH08
ME09
TR10
Country & reference yearShare of ITE Share of DTE
16Tourism Satellite Accounts (TSAs) in Europe
Table 7: Internal tourism consumption (TSA Table 4)(million EUR)
Country &
referenceyear
Internal tourism
consumption
Internal tourism
expenditure
Inbound tourism
expenditure
Domestic tourism
expenditure
Other components of tourism
consumption Notes
CZ 11 8 488 8 488 4 665 3 823 : See note (1) below
DE 10 278 317 257 864 36 628 221 236 20 453EE 08 1 452 1 217 1 065 152 234 ES 08 120 889 105 659 51 736 53 923 15 230FR 05 137 577 123 095 41 843 81 252 14 482IT 10 114 016 79 704 29 338 50 366 34 312LV 05 642 641 373 268 1 LT 10 1 397 1 397 724 673 : NL 09 35 145 35 145 6 965 28 180 : AT 11 30 437 29 320 15 748 13 572 1 117
PL 08 13 198 11 276 6 915 4 361 1 922 Other components include business expenses.
PT 07 15 467 14 692 8 823 5 869 775 See note (2) below
RO 09 4 527 4 430 920 3 510 97SI 09 3 348 3 262 2 099 1 163 85
SK 10 3 560 3 242 1 637 1 605 318Other components include social transfers in kind, imputed rent for housing.
SE 10 25 992 25 993 9 466 16 527 :Internal tourism expenditure includes only expenditure by visitors themselves.
UK 09 141 507 137 763 24 192 113 571 3 743 See note (3) below
IS 10 1 165 1 165 680 485 : NO 07 12 882 12 882 3 840 9 042 : See note (4) below
CH 08 23 366 21 854 9 817 12 037 1 512 Domestic tourism includes business tourism.
ME 09 569 541 499 42 28 See note (5) below
TR 10 26 712 26 341 15 828 10 513 371Other components (expenditure) include consumption of durable goods.
(1) CZ — Tourism social transfers in kind and consumption of individual non-market services are not included in the TSA. All other components of tourism consumption (e.g. business trips, imputed rent) are directly included in TSA Tables 1 and 2.
(2) PT — The Portuguese TSAs follow the European Implementation Manual on TSA, which is consistent with the UNWTO Recommended Methodological Framework 2000. Nevertheless, some of the 2008 recommendations are taken into account, the most important being the allocation of business tourism expenditure to TSA Tables 1, 2 or 3 according to the residence of the visitor, instead of allocation to ‘other components’ in TSA Table 4.
(3) UK – The estimates include fares paid to domestic carriers and outbound fares paid to other carriers. ‘Other components’ include estimated upkeep of second homes, based on the family expenditure survey, Consumer Trends. Sources: International Passenger Survey, UK Tourism Survey, GB Day Visit Survey, NI Continuous Household Survey, Supply and Use Tables, Morgan Stanley survey of airport spend, Consumer Trends.
(4) NO — The services associated with vacation homes and estimated rents for these services are included in the tourism expenditure figures. Social transfers in kind, FISIM, home exchange, etc., have not been calculated.
(5) ME — ‘Other components’ cover only accommodation services in own vacation homes. Items 3, 4, 5 and 7 on transport are merged, except for air transport, which is separate.
Source: Eurostat, Data collection on TSA 2012-13
17Tourism Satellite Accounts (TSAs) in Europe
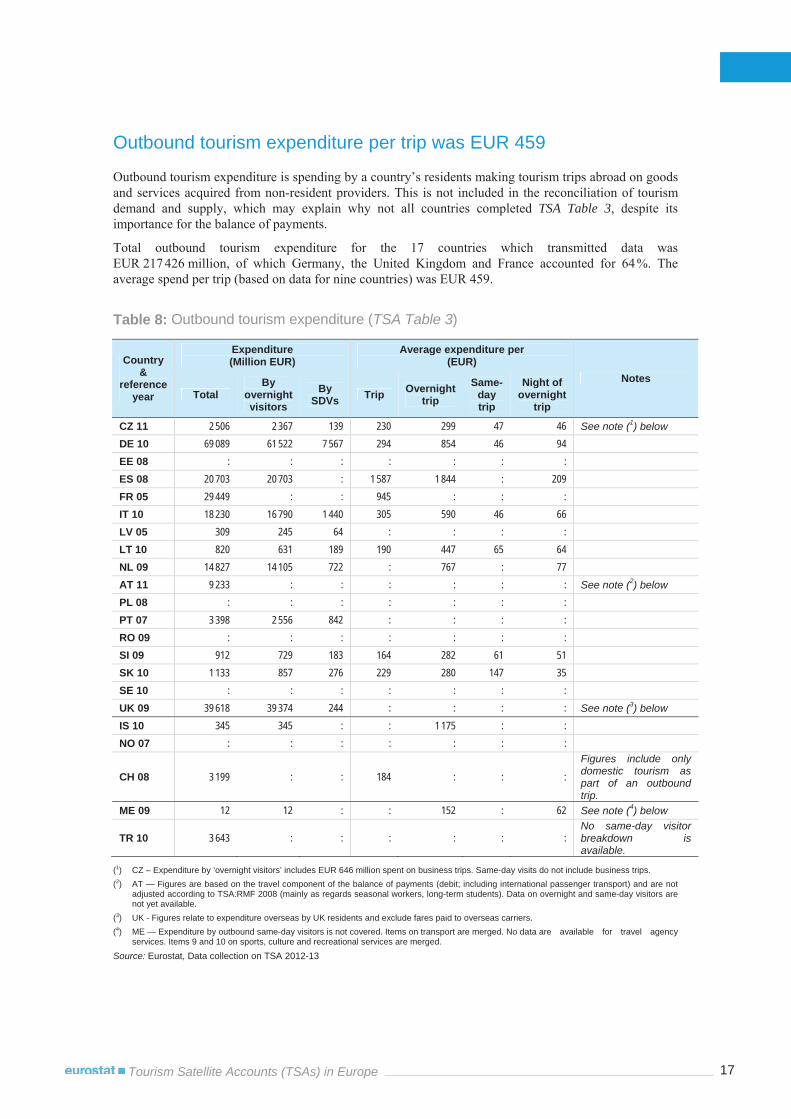
Outbound tourism expenditure per trip was EUR 459
Outbound tourism expenditure is spending by a country’s residents making tourism trips abroad on goods and services acquired from non-resident providers. This is not included in the reconciliation of tourism demand and supply, which may explain why not all countries completed TSA Table 3, despite its importance for the balance of payments.
Total outbound tourism expenditure for the 17 countries which transmitted data was EUR 217 426 million, of which Germany, the United Kingdom and France accounted for 64 %. The average spend per trip (based on data for nine countries) was EUR 459.
Table 8: Outbound tourism expenditure (TSA Table 3)
Country &
referenceyear
Expenditure (Million EUR)
Average expenditure per (EUR)
Notes Total
By overnight visitors
By SDVs Trip Overnight
trip Same-
day trip
Night of overnight
trip
CZ 11 2 506 2 367 139 230 299 47 46 See note (1) below DE 10 69 089 61 522 7 567 294 854 46 94 EE 08 : : : : : : : ES 08 20 703 20 703 : 1 587 1 844 : 209 FR 05 29 449 : : 945 : : : IT 10 18 230 16 790 1 440 305 590 46 66 LV 05 309 245 64 : : : : LT 10 820 631 189 190 447 65 64 NL 09 14 827 14 105 722 : 767 : 77 AT 11 9 233 : : : : : : See note (2) below
PL 08 : : : : : : : PT 07 3 398 2 556 842 : : : : RO 09 : : : : : : : SI 09 912 729 183 164 282 61 51 SK 10 1 133 857 276 229 280 147 35 SE 10 : : : : : : : UK 09 39 618 39 374 244 : : : : See note (3) below
IS 10 345 345 : : 1 175 : : NO 07 : : : : : : :
CH 08 3 199 : : 184 : : : Figures include only domestic tourism as part of an outbound trip.
ME 09 12 12 : : 152 : 62 See note (4) below
TR 10 3 643 : : : : : : No same-day visitor breakdown is available.
(1) CZ – Expenditure by ‘overnight visitors’ includes EUR 646 million spent on business trips. Same-day visits do not include business trips. (2) AT — Figures are based on the travel component of the balance of payments (debit; including international passenger transport) and are not
adjusted according to TSA:RMF 2008 (mainly as regards seasonal workers, long-term students). Data on overnight and same-day visitors are not yet available.
(3) UK - Figures relate to expenditure overseas by UK residents and exclude fares paid to overseas carriers. (4) ME — Expenditure by outbound same-day visitors is not covered. Items on transport are merged. No data are available for travel agency
services. Items 9 and 10 on sports, culture and recreational services are merged.
Source: Eurostat, Data collection on TSA 2012-13
18Tourism Satellite Accounts (TSAs) in Europe
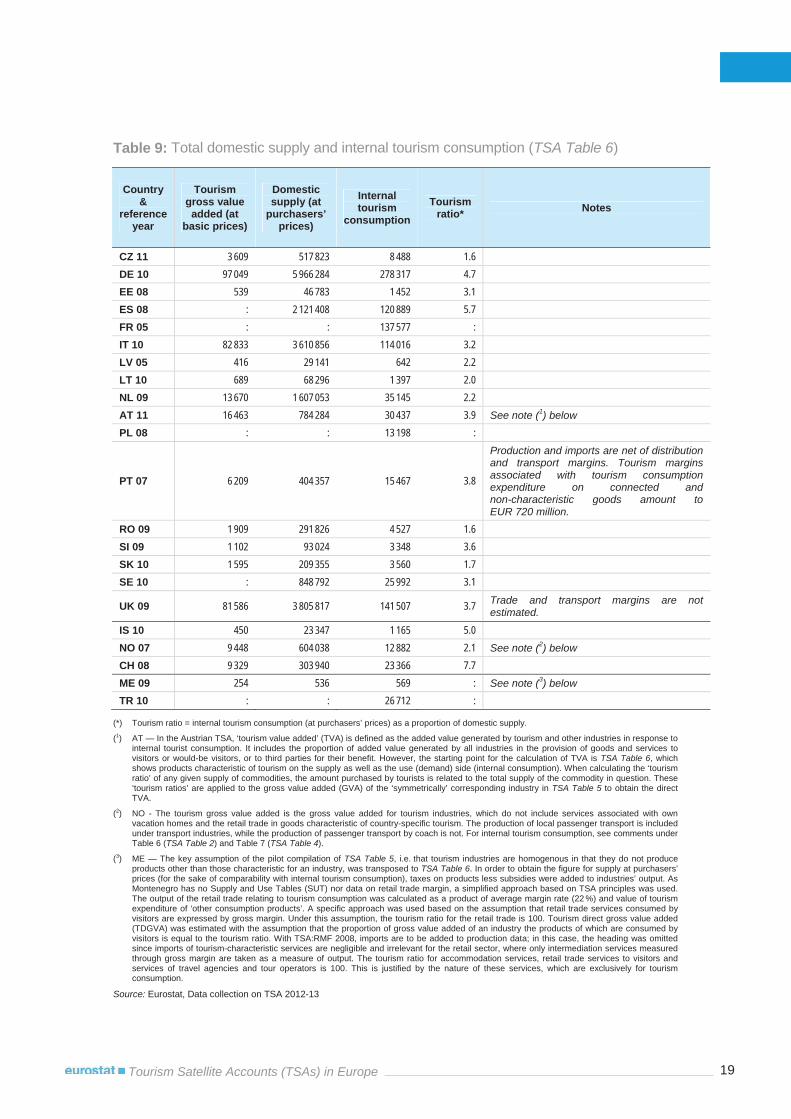
The supply side: how much does tourism contribute to the national economy? Because the TSA is an extension of the System of National Accounts (SNA), it compiles information on both the supply side and the demand side of tourism. This means that it highlights economic activity in tourism-related industries and portrays tourism in the context of the overall economy and alongside other sectors. Putting tourism in economic context in this way is a key reason for compiling TSAs.
TSA Table 6 provides a synthesis of TSA Table 4 (demand side — internal tourism consumption) and TSA Table 5 (supply side — production accounts of tourism industries and other industries). It enables us to calculate the product-specific ‘tourism ratio in supply’ and the aggregates ‘tourism value added’ and ‘tourism gross domestic product’. It forms the core of the TSA system.
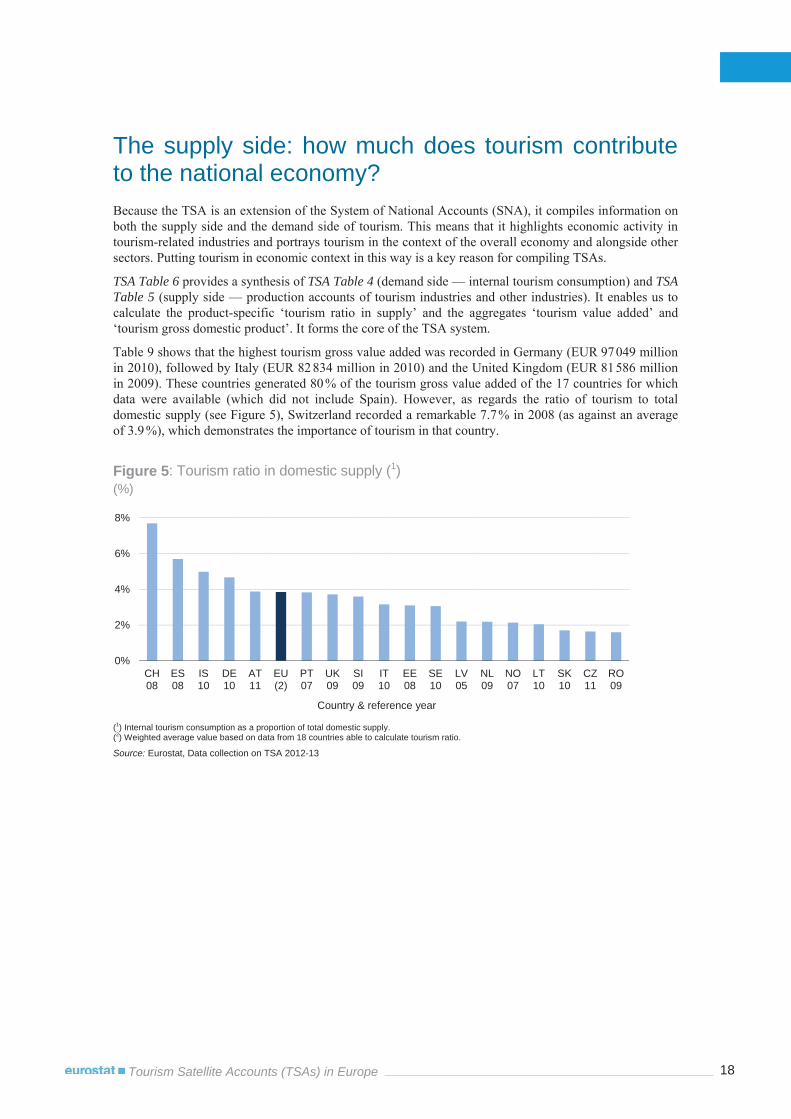
Table 9 shows that the highest tourism gross value added was recorded in Germany (EUR 97 049 million in 2010), followed by Italy (EUR 82 834 million in 2010) and the United Kingdom (EUR 81 586 million in 2009). These countries generated 80 % of the tourism gross value added of the 17 countries for which data were available (which did not include Spain). However, as regards the ratio of tourism to total domestic supply (see Figure 5), Switzerland recorded a remarkable 7.7 % in 2008 (as against an average of 3.9 %), which demonstrates the importance of tourism in that country.
Figure 5: Tourism ratio in domestic supply (1)(%)
(1) Internal tourism consumption as a proportion of total domestic supply. (2) Weighted average value based on data from 18 countries able to calculate tourism ratio.
Source: Eurostat, Data collection on TSA 2012-13
0%
2%
4%
6%
8%
CH08
ES08
IS10
DE10
AT11
EU(2)
PT07
UK09
SI09
IT10
EE08
SE10
LV05
NL09
NO07
LT10
SK10
CZ11
RO09
Country & reference year
19Tourism Satellite Accounts (TSAs) in Europe
Table 9: Total domestic supply and internal tourism consumption (TSA Table 6)
Country &
referenceyear
Tourism gross value
added (at basic prices)
Domestic supply (at
purchasers’ prices)
Internal tourism
consumption Tourism
ratio* Notes
CZ 11 3 609 517 823 8 488 1.6 DE 10 97 049 5 966 284 278 317 4.7 EE 08 539 46 783 1 452 3.1 ES 08 : 2 121 408 120 889 5.7 FR 05 : : 137 577 :IT 10 82 833 3 610 856 114 016 3.2 LV 05 416 29 141 642 2.2 LT 10 689 68 296 1 397 2.0 NL 09 13 670 1 607 053 35 145 2.2 AT 11 16 463 784 284 30 437 3.9 See note (1) below
PL 08 : : 13 198 :
PT 07 6 209 404 357 15 467 3.8
Production and imports are net of distribution and transport margins. Tourism margins associated with tourism consumption expenditure on connected and non-characteristic goods amount to EUR 720 million.
RO 09 1 909 291 826 4 527 1.6 SI 09 1 102 93 024 3 348 3.6 SK 10 1 595 209 355 3 560 1.7 SE 10 : 848 792 25 992 3.1
UK 09 81 586 3 805 817 141 507 3.7 Trade and transport margins are not estimated.
IS 10 450 23 347 1 165 5.0 NO 07 9 448 604 038 12 882 2.1 See note (2) below
CH 08 9 329 303 940 23 366 7.7 ME 09 254 536 569 : See note (3) below TR 10 : : 26 712 :
(*) Tourism ratio = internal tourism consumption (at purchasers’ prices) as a proportion of domestic supply.
(1) AT — In the Austrian TSA, ‘tourism value added’ (TVA) is defined as the added value generated by tourism and other industries in response to internal tourist consumption. It includes the proportion of added value generated by all industries in the provision of goods and services to visitors or would-be visitors, or to third parties for their benefit. However, the starting point for the calculation of TVA is TSA Table 6, which shows products characteristic of tourism on the supply as well as the use (demand) side (internal consumption). When calculating the ‘tourism ratio’ of any given supply of commodities, the amount purchased by tourists is related to the total supply of the commodity in question. These ‘tourism ratios’ are applied to the gross value added (GVA) of the ‘symmetrically’ corresponding industry in TSA Table 5 to obtain the direct TVA.
(2) NO - The tourism gross value added is the gross value added for tourism industries, which do not include services associated with own vacation homes and the retail trade in goods characteristic of country-specific tourism. The production of local passenger transport is included under transport industries, while the production of passenger transport by coach is not. For internal tourism consumption, see comments under Table 6 (TSA Table 2) and Table 7 (TSA Table 4).
(3) ME — The key assumption of the pilot compilation of TSA Table 5, i.e. that tourism industries are homogenous in that they do not produce products other than those characteristic for an industry, was transposed to TSA Table 6. In order to obtain the figure for supply at purchasers’ prices (for the sake of comparability with internal tourism consumption), taxes on products less subsidies were added to industries’ output. As Montenegro has no Supply and Use Tables (SUT) nor data on retail trade margin, a simplified approach based on TSA principles was used. The output of the retail trade relating to tourism consumption was calculated as a product of average margin rate (22 %) and value of tourism expenditure of ‘other consumption products’. A specific approach was used based on the assumption that retail trade services consumed by visitors are expressed by gross margin. Under this assumption, the tourism ratio for the retail trade is 100. Tourism direct gross value added (TDGVA) was estimated with the assumption that the proportion of gross value added of an industry the products of which are consumed by visitors is equal to the tourism ratio. With TSA:RMF 2008, imports are to be added to production data; in this case, the heading was omitted since imports of tourism-characteristic services are negligible and irrelevant for the retail sector, where only intermediation services measured through gross margin are taken as a measure of output. The tourism ratio for accommodation services, retail trade services to visitors and services of travel agencies and tour operators is 100. This is justified by the nature of these services, which are exclusively for tourism consumption.
Source: Eurostat, Data collection on TSA 2012-13
20Tourism Satellite Accounts (TSAs) in Europe
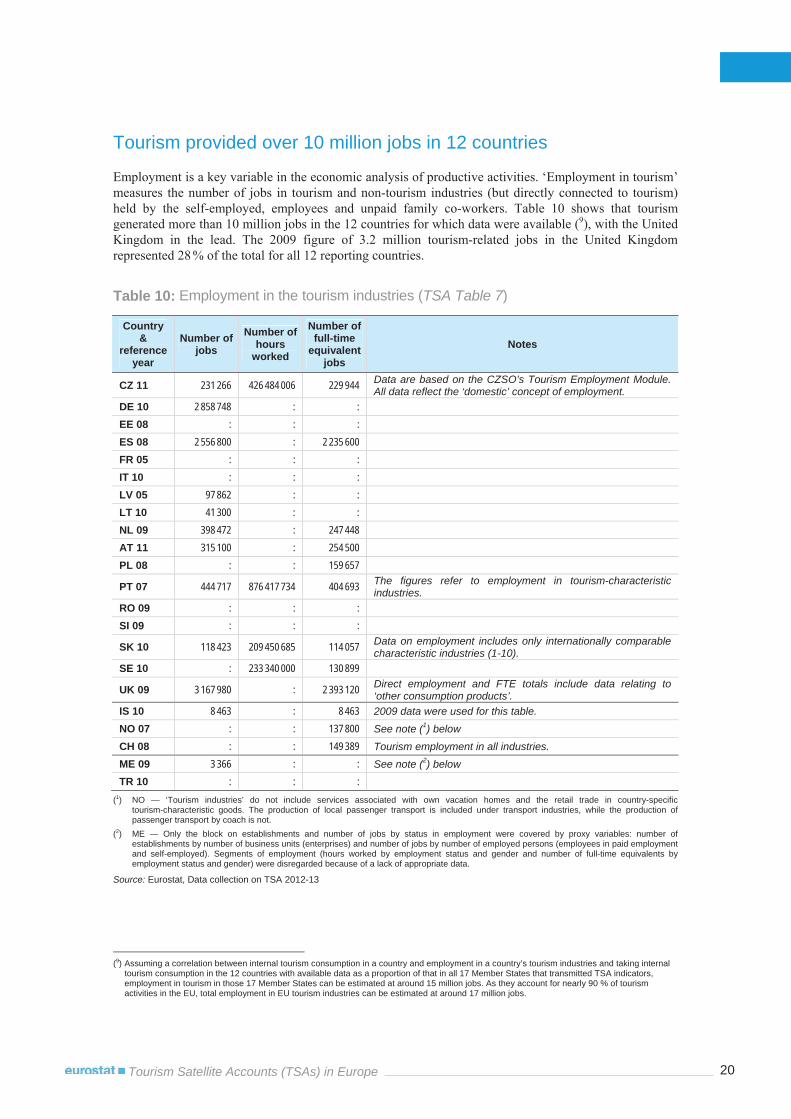
Tourism provided over 10 million jobs in 12 countries
Employment is a key variable in the economic analysis of productive activities. ‘Employment in tourism’ measures the number of jobs in tourism and non-tourism industries (but directly connected to tourism) held by the self-employed, employees and unpaid family co-workers. Table 10 shows that tourism generated more than 10 million jobs in the 12 countries for which data were available (9), with the United Kingdom in the lead. The 2009 figure of 3.2 million tourism-related jobs in the United Kingdom represented 28 % of the total for all 12 reporting countries.
Table 10: Employment in the tourism industries (TSA Table 7)
Country &
referenceyear
Number of jobs
Number of hours
worked
Number of full-time
equivalent jobs
Notes
CZ 11 231 266 426 484 006 229 944 Data are based on the CZSO’s Tourism Employment Module. All data reflect the ‘domestic’ concept of employment.
DE 10 2 858 748 : : EE 08 : : : ES 08 2 556 800 : 2 235 600FR 05 : : : IT 10 : : : LV 05 97 862 : : LT 10 41 300 : : NL 09 398 472 : 247 448AT 11 315 100 : 254 500PL 08 : : 159 657
PT 07 444 717 876 417 734 404 693 The figures refer to employment in tourism-characteristic industries.
RO 09 : : : SI 09 : : :
SK 10 118 423 209 450 685 114 057 Data on employment includes only internationally comparable characteristic industries (1-10).
SE 10 : 233 340 000 130 899
UK 09 3 167 980 : 2 393 120 Direct employment and FTE totals include data relating to ‘other consumption products’.
IS 10 8 463 : 8 463 2009 data were used for this table.
NO 07 : : 137 800 See note (1) below
CH 08 : : 149 389 Tourism employment in all industries.
ME 09 3 366 : : See note (2) below TR 10 : : :
(1) NO — ‘Tourism industries’ do not include services associated with own vacation homes and the retail trade in country-specifictourism-characteristic goods. The production of local passenger transport is included under transport industries, while the production of passenger transport by coach is not.
(2) ME — Only the block on establishments and number of jobs by status in employment were covered by proxy variables: number of establishments by number of business units (enterprises) and number of jobs by number of employed persons (employees in paid employment and self-employed). Segments of employment (hours worked by employment status and gender and number of full-time equivalents byemployment status and gender) were disregarded because of a lack of appropriate data.
Source: Eurostat, Data collection on TSA 2012-13
(9) Assuming a correlation between internal tourism consumption in a country and employment in a country’s tourism industries and taking internal
tourism consumption in the 12 countries with available data as a proportion of that in all 17 Member States that transmitted TSA indicators, employment in tourism in those 17 Member States can be estimated at around 15 million jobs. As they account for nearly 90 % of tourism activities in the EU, total employment in EU tourism industries can be estimated at around 17 million jobs.
21Tourism Satellite Accounts (TSAs) in Europe
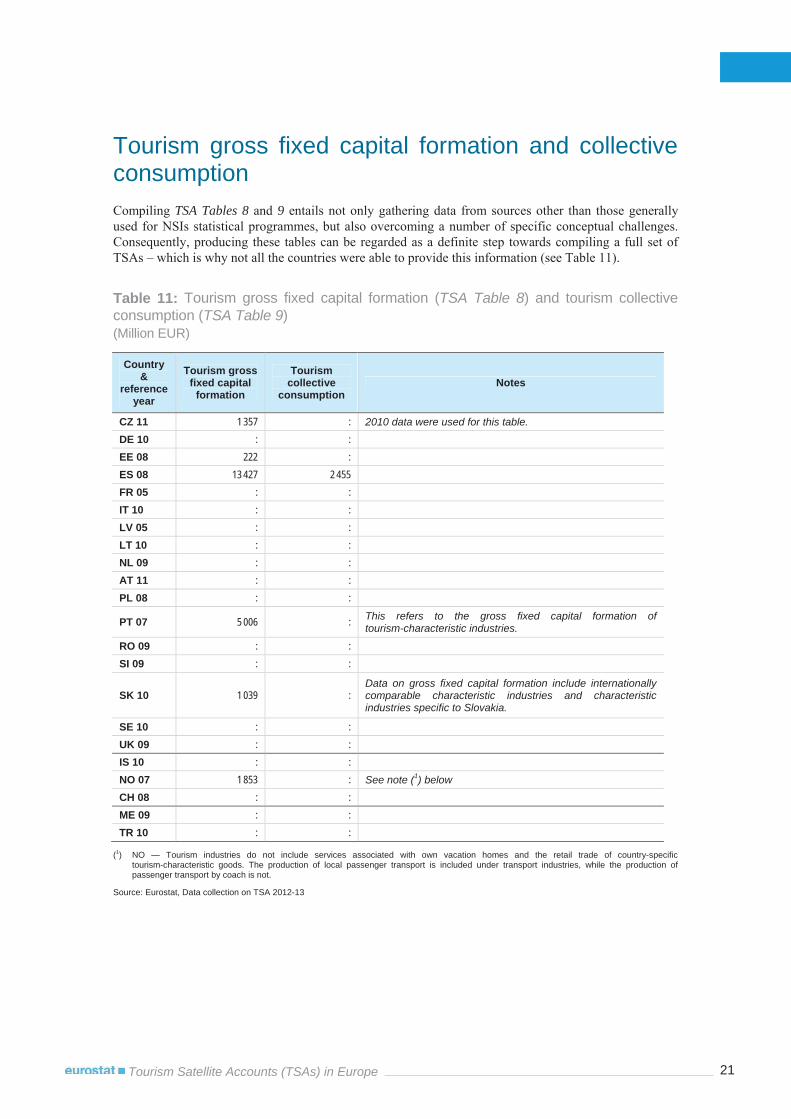
Tourism gross fixed capital formation and collective consumptionCompiling TSA Tables 8 and 9 entails not only gathering data from sources other than those generally used for NSIs statistical programmes, but also overcoming a number of specific conceptual challenges. Consequently, producing these tables can be regarded as a definite step towards compiling a full set of TSAs – which is why not all the countries were able to provide this information (see Table 11).
Table 11: Tourism gross fixed capital formation (TSA Table 8) and tourism collective consumption (TSA Table 9)(Million EUR)
Country &
referenceyear
Tourism gross fixed capital
formation
Tourism collective
consumption Notes
CZ 11 1 357 : 2010 data were used for this table.
DE 10 : : EE 08 222 : ES 08 13 427 2 455FR 05 : : IT 10 : : LV 05 : : LT 10 : : NL 09 : : AT 11 : : PL 08 : :
PT 07 5 006 : This refers to the gross fixed capital formation of tourism-characteristic industries.
RO 09 : : SI 09 : :
SK 10 1 039 :Data on gross fixed capital formation include internationally comparable characteristic industries and characteristic industries specific to Slovakia.
SE 10 : : UK 09 : : IS 10 : : NO 07 1 853 : See note (1) below
CH 08 : : ME 09 : : TR 10 : :
(1) NO — Tourism industries do not include services associated with own vacation homes and the retail trade of country-specific tourism-characteristic goods. The production of local passenger transport is included under transport industries, while the production of passenger transport by coach is not.
Source: Eurostat, Data collection on TSA 2012-13
22Tourism Satellite Accounts (TSAs) in Europe
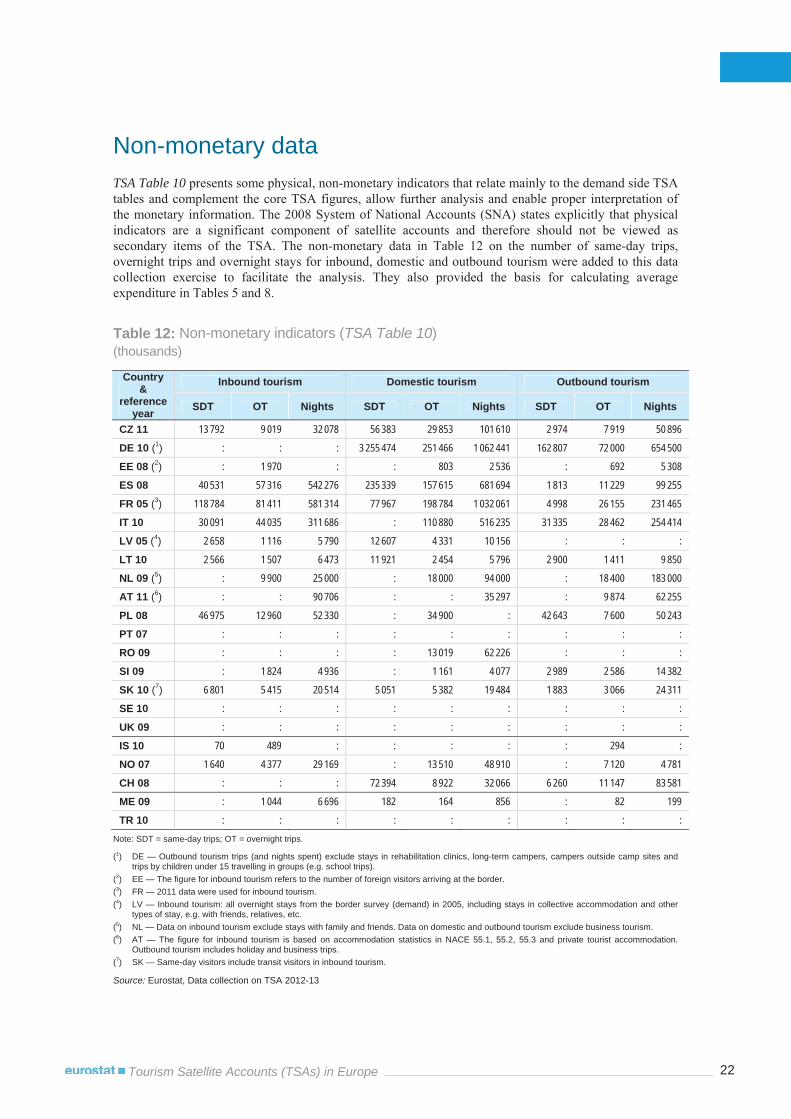
Non-monetary data TSA Table 10 presents some physical, non-monetary indicators that relate mainly to the demand side TSA tables and complement the core TSA figures, allow further analysis and enable proper interpretation of the monetary information. The 2008 System of National Accounts (SNA) states explicitly that physical indicators are a significant component of satellite accounts and therefore should not be viewed as secondary items of the TSA. The non-monetary data in Table 12 on the number of same-day trips, overnight trips and overnight stays for inbound, domestic and outbound tourism were added to this data collection exercise to facilitate the analysis. They also provided the basis for calculating average expenditure in Tables 5 and 8.
Table 12: Non-monetary indicators (TSA Table 10)(thousands)
Country &
referenceyear
Inbound tourism Domestic tourism Outbound tourism
SDT OT Nights SDT OT Nights SDT OT Nights
CZ 11 13 792 9 019 32 078 56 383 29 853 101 610 2 974 7 919 50 896
DE 10 (1) : : : 3 255 474 251 466 1 062 441 162 807 72 000 654 500
EE 08 (2) : 1 970 : : 803 2 536 : 692 5 308
ES 08 40 531 57 316 542 276 235 339 157 615 681 694 1 813 11 229 99 255
FR 05 (3) 118 784 81 411 581 314 77 967 198 784 1 032 061 4 998 26 155 231 465
IT 10 30 091 44 035 311 686 : 110 880 516 235 31 335 28 462 254 414
LV 05 (4) 2 658 1 116 5 790 12 607 4 331 10 156 : : :
LT 10 2 566 1 507 6 473 11 921 2 454 5 796 2 900 1 411 9 850
NL 09 (5) : 9 900 25 000 : 18 000 94 000 : 18 400 183 000
AT 11 (6) : : 90 706 : : 35 297 : 9 874 62 255
PL 08 46 975 12 960 52 330 : 34 900 : 42 643 7 600 50 243
PT 07 : : : : : : : : :
RO 09 : : : : 13 019 62 226 : : :
SI 09 : 1 824 4 936 : 1 161 4 077 2 989 2 586 14 382
SK 10 (7) 6 801 5 415 20 514 5 051 5 382 19 484 1 883 3 066 24 311
SE 10 : : : : : : : : :
UK 09 : : : : : : : : :
IS 10 70 489 : : : : : 294 :
NO 07 1 640 4 377 29 169 : 13 510 48 910 : 7 120 4 781
CH 08 : : : 72 394 8 922 32 066 6 260 11 147 83 581
ME 09 : 1 044 6 696 182 164 856 : 82 199
TR 10 : : : : : : : : : Note: SDT = same-day trips; OT = overnight trips.
(1) DE — Outbound tourism trips (and nights spent) exclude stays in rehabilitation clinics, long-term campers, campers outside camp sites and trips by children under 15 travelling in groups (e.g. school trips).
(2) EE — The figure for inbound tourism refers to the number of foreign visitors arriving at the border. (3) FR — 2011 data were used for inbound tourism. (4) LV — Inbound tourism: all overnight stays from the border survey (demand) in 2005, including stays in collective accommodation and other
types of stay, e.g. with friends, relatives, etc. (5) NL — Data on inbound tourism exclude stays with family and friends. Data on domestic and outbound tourism exclude business tourism. (6) AT — The figure for inbound tourism is based on accommodation statistics in NACE 55.1, 55.2, 55.3 and private tourist accommodation.
Outbound tourism includes holiday and business trips. (7) SK — Same-day visitors include transit visitors in inbound tourism.
Source: Eurostat, Data collection on TSA 2012-13
23Tourism Satellite Accounts (TSAs) in Europe
Annex — List of indicators in the questionnaire TSA Table 1 Inbound tourism expenditure [three indicators]
Total inbound tourism expenditure Inbound tourism expenditure by tourists/overnight visitors Inbound tourism expenditure by same-day visitors/excursionists
TSA Table 2 Domestic tourism expenditure [three indicators]
Total domestic tourism expenditure Domestic tourism expenditure by tourists/overnight visitors Domestic tourism expenditure by same-day visitors/excursionists
TSA Table 3 Outbound tourism expenditure [three indicators]
Total outbound tourism expenditure Outbound tourism expenditure by tourists/overnight visitors Outbound tourism expenditure by same-day visitors/excursionists
TSA Table 4 Internal tourism consumption [five indicators]
Total internal tourism consumption Internal tourism expenditure
o Inbound tourism expenditure o Domestic tourism expenditure
Other components of tourism consumption
TSA Table 5 Production accounts of tourism industries and other industries [three indicators]
Total output of domestic producers (at basic prices) Total intermediate consumption of domestic producers (at purchasers’ prices) Total gross value added (at basic prices)
TSA Table 6 Total domestic supply and internal tourism consumption [eight indicators]
Tourism gross value added (at basic prices) Total output of domestic producers (at basic prices) Total imports Taxes less subsidies on products nationally produced and imported Trade and transport margins Domestic supply (at purchasers’ prices) Internal tourism consumption Tourism ratio (%)
TSA Table 7 Employment in the tourism industries [four indicators]
Number of jobs Number of hours worked Number of full-time equivalent jobs Number of people employed
24Tourism Satellite Accounts (TSAs) in Europe
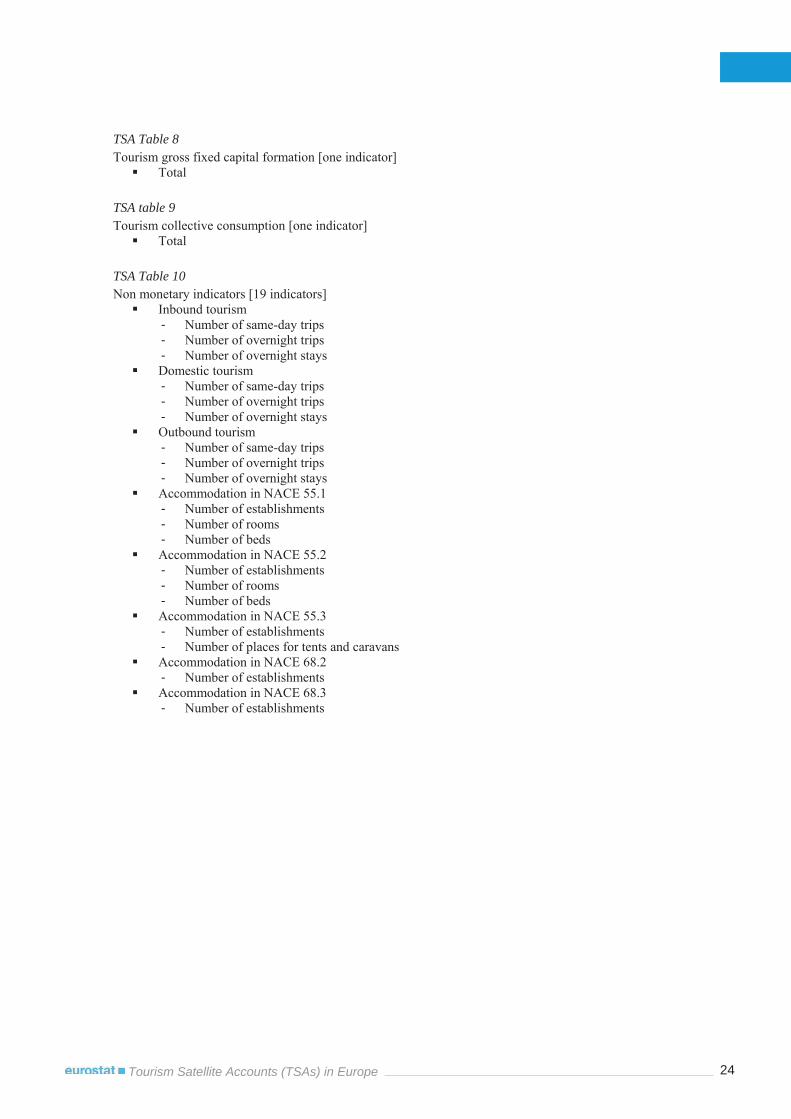
TSA Table 8 Tourism gross fixed capital formation [one indicator]
Total
TSA table 9 Tourism collective consumption [one indicator]
Total
TSA Table 10 Non monetary indicators [19 indicators]
Inbound tourism - Number of same-day trips - Number of overnight trips - Number of overnight stays Domestic tourism - Number of same-day trips - Number of overnight trips - Number of overnight stays Outbound tourism - Number of same-day trips - Number of overnight trips - Number of overnight stays Accommodation in NACE 55.1 - Number of establishments - Number of rooms - Number of beds Accommodation in NACE 55.2 - Number of establishments - Number of rooms - Number of beds Accommodation in NACE 55.3 - Number of establishments - Number of places for tents and caravans Accommodation in NACE 68.2 - Number of establishments Accommodation in NACE 68.3 - Number of establishments
25Tourism Satellite Accounts (TSAs) in Europe
Methodological notes The methodology for the TSA is based on the 2008 Tourism Satellite Account: Recommended Methodological Framework (TSA:RMF 2008) and, for tourism statistics in general, on the 2008 International Recommendations for Tourism Statistics (IRTS 2008).
Tourism Satellite Accounts The purposes of tourism satellite accounts are threefold: to analyse in detail all aspects of demand for goods and services associated with the activity of visitors, to observe the operational interface with the supply of such goods and services within the economy and to describe how this supply interacts with other economic activities.
VisitorA visitor is a traveller taking a trip to a main destination outside his/her usual environment for less than a year for any main purpose (business, leisure or other personal purpose) other than to be employed by a resident entity in the country or place visited. These trips taken by visitors qualify as tourism trips.
Tourist and same-day visitor A visitor (domestic inbound or outbound) is classified as a tourist (or overnight visitor) if his/her trip includes an overnight stay or as a same-day visitor (or excursionist) otherwise.
Inbound tourism Inbound tourism comprises the activities of a non-resident visitor within the country of reference on an inbound trip.
Domestic tourism Domestic tourism comprises the activities of a resident visitor within the country of reference either as part of a domestic trip or part of an outbound trip.
Internal tourism Internal tourism comprises domestic tourism and inbound tourism, i.e. the activities of resident and non-resident visitors in the country of reference as part of domestic or international trips.
Outbound tourism Outbound tourism comprises the activities of a resident visitor outside the country of reference either as part of an outbound trip or as part of a domestic trip.
Tourism expenditure Tourism expenditure refers to the amount paid for the acquisition of consumption goods and services as well as valuables for own use or to give away for and during tourism trips. It includes expenditure by visitors themselves as well as expenses paid for or reimbursed by others.
Tourism (direct) gross value added Tourism gross value added adds the parts of gross value added generated by tourism industries and other industries of the economy that directly serve visitors in responding to internal tourism consumption. The use of the term ‘direct’ in this aggregate refers to the fact that the TSA measures only that part of value added (by tourism industries and other industries) due to consumption by visitors and leaves aside the indirect and induced effects that such consumption might generate.
26Tourism Satellite Accounts (TSAs) in Europe
Domestic tourism expenditure Domestic tourism expenditure includes not only the expenditure of visitors on domestic trips, but also expenditure in their country of origin by visitors undertaking outbound trips. The economy benefiting from tourism expenditure is not always identical with the places visited during the trip. There is not always a strict relationship between the places visited and the economy(ies) affected. For instance, not all expenditure associated with international trips occurs outside the visitor’s economy of origin; in particular, some services might be acquired from producers in the country of origin or another country (international transport in particular, or any expenditure en route).
Tourism consumption According to formal definitions, ‘tourism consumption’ is the same as ‘tourism expenditure’. However, the concept of tourism consumption as used in the TSA goes beyond that of tourism expenditure. In addition to ‘the amount paid for the acquisition of consumption goods and services as well as valuables for own use or to give away for and during tourism trips’, which corresponds to monetary transactions (the focus of tourism expenditure), it includes services associated with holiday accommodation on own account, tourism social transfers in kind and other imputed consumption.
Gross fixed capital formation Gross fixed capital formation is an important component of the description and analysis of the tourism industries. It should be noted that, from an industry perspective, not only is gross fixed capital formation an important variable but transactions in non-produced non-financial assets (such as land) and in non-produced intangible assets (such as landing rights or trade mark rights) may also be important in a broader perspective.
Tourism collective consumption Although collective non-market services have been excluded from tourism consumption, this does not mean that the measurement of expenditure by public administrations in the tourism-related fields of market promotion, information, planning, etc. is not relevant and that it does not have its place in the aggregate measurement of the economic importance of tourism.
TripA trip refers to travel by a person from the time of departure from his usual residence until he/she returns, i.e. a round trip. A trip can be made up of visits to different places. A same-day trip is a trip without an overnight stay; an overnight or tourism trip is one which includes at least one overnight stay.

European Commission
Tourism Satellite Accounts (TSAs) in Europe
Luxembourg: Publications Office of the European Union
2013 — 26 pp. — 21 x 29.7 cm
Theme: Industry, trade and services Collection: Statistical working papers
ISBN 978-92-79-33271-5 ISSN 2315-0807 doi:10.2785/47554Cat. No: KS-TC-13-006-EN-N

HOW TO OBTAIN EU PUBLICATIONS
Free publications: • one copy:
via EU Bookshop (http://bookshop.europa.eu);
• more than one copy or posters/maps: from the European Union’s representations (http://ec.europa.eu/represent_en.htm);from the delegations in non-EU countries (http://eeas.europa.eu/delegations/index_en.htm);by contacting the Europe Direct service (http://europa.eu/europedirect/index_en.htm) or calling 00 800 6 7 8 9 10 11 (freephone number from anywhere in the EU) (*).
1H(*) The information given is free, as are most calls (though some operators, phone boxes or hotels may charge you).
Priced publications: • via EU Bookshop (http://bookshop.europa.eu).
Priced subscriptions: • via one of the sales agents of the Publications Office of the European Union
(http://publications.europa.eu/others/agents/index_en.htm).

doi: 0. /


![TSAS.600.004 - Royal Commission into Institutional ...€¦ · TSAS.600.004.1984 Chap. XVII] Difficulties in the Corps Re-instate ment. 5. Names may only be removed from in harmony](https://img.dokumen.tips/doc/110x75/5b0e5d547f8b9a3a0d8ba049/tsas600004-royal-commission-into-institutional-chap-xvii-difficulties.jpg)