Embed Size (px)
Citation preview

April
Integrated Economic and EnvironmentalSatellite Accounts
The existing systems of national economic accounts—including national incomeand product accounts, input-output accounts, and balance sheets—are without ques-tion premier tools for analysis and decisionmaking. Since their origins over yearsago, they have been refined, extended, and updated to reflect changes in the economyand to respond to changing analytical and policy concerns. Continuing this evolution,this article and its companion “Accounting for Mineral Resources: Issues and ’sInitial Estimates,” beginning on page , present new work by on an accountingframework that covers the interactions of the economy and the environment. To doso, this framework provides new breakdowns that are relevant to the analysis of theseinteractions and extends the existing accounts’ definition of capital to cover naturaland environmental resources. The framework takes the form of a satellite account—anaccount that supplements, rather than replaces, the existing accounts.
This article presents the analytical and economic accounting background for thenew work, an overview of the satellite accounting framework, and a long-term plan toimplement the framework. Because it introduces a topic that has both economic andenvironmental dimensions, some parts of the article may appear elementary—perhapseven oversimplified—to readers familiar with the economic (and economic account-ing) dimensions, while other parts may appear elementary to those familiar with theenvironmental dimensions.
The second article discusses the conceptual and methodological issues in mineralresource accounting and presents estimates of mineral stocks and changes in thosestocks for the past several decades. It is a technically oriented article that describesin some detail the alternative valuation methods and the source data and estimatingprocedures used to prepare the new estimates.
Over the years, the national economic accounts have benefited from discussionand critique of concepts, source data, and estimating methods. The same is to beexpected for the ’s, as ’s new integrated economic and environmental satelliteaccounts are being called. I invite your comments.
Carol S. CarsonDirector, Bureau of Economic Analysis
of natural resources in production has beenoffset by these additions?
• Households, governments, and business allmake expenditures to maintain or restore theenvironment. What share of their spendingis for the environment?
• The economy disposes of wastes into the airand water, and the resulting degradation ofthe environment imposes costs, such as lowertimber yields and fish harvests and highercleaning costs. What are these costs? Whichsectors bear them?
The answers to questions such as these aboutthe interaction of the economy and the environ-ment are often based on partial and sometimeseven inconsistent information, suggesting the
T and the natural environ-ment interact at many points, and these
interactions raise analytical questions.
• The Nation’s wealth includes natural re-sources, such as oil and gas reserves andtimber, that are used in production. At whatrate are these resources being used?
• The income of producers in the mineral in-dustries includes a return to the drilling rigs,mining equipment, and other structures andequipment engaged in them and a return tothe mineral. What share is attributable tothe mineral?
• Economic activity adds to the proved stockof natural resources by exploration and tech-nological innovation. How much of the use

• April
need to identify and quantify the interactionswithin a systematic framework as a basis for moreinformed analysis and decisionmaking. Thisarticle introduces the integrated economic andenvironmental satellite accounts (’s), whichare meant to help fill that need. The ’s are asupplementary set of accounts structured to showthe interactions of the economy and the envi-ronment more fully than the existing economicaccounts. While the ’s build on the exist-ing economic accounts, they do not replace them;likewise, measures do not replace measures,such as gross domestic product (), from theexisting accounts.
The Bureau of Economic Analysis () beganwork leading to this article—and to the com-panion article about mineral resources, whichbegins on page —in . At that time, as partof a long-term program to modernize its eco-nomic accounts, began research on two setsof accounts to supplement the existing nationalaccounts. One of these sets of supplementary ac-counts, called satellite accounts, focused on thestock, and changes in the stock, of natural re-sources. (The roles that satellite accounts canserve and their general structure are introduced
. The other set, on research and development, will be introduced in anupcoming issue of the S C B.
Satellite Accounts:
Satellite accounts are frameworks designed to expandthe analytical capacity of the national accounts withoutoverburdening them or interfering with their general-purpose orientation. In this role, satellite accountsorganize information in an internally consistent way thatsuits the particular analytical focus at hand, yet theymaintain links to the existing national accounts. Fur-ther, because they supplement, rather than replace, theexisting accounts, they can be a laboratory for economicaccounting in that they provide room for conceptualdevelopment and methodological refinement.
In their most flexible applications, satellite accountsmay use definitions and concepts that differ from theexisting accounts. For example, a satellite account maybe built around a broader concept of capital formationthan the existing accounts. This flexibility is being usedin ’s work on integrated economic and environmen-tal accounts and on research and development accounts.Satellite accounts such as these use different conceptsand definitions by design; in other respects, they retainconsistency with the existing accounts.
Satellite accounts can add detail or other infor-mation about a particular aspect of the economy tothat in the existing accounts; for instance, they canintegrate monetary and physical data. They can ar-
in the accompanying box.) Work on the natu-ral resources satellite accounts was given addedimpetus and extended in scope in whenPresident Clinton, as part of his April EarthDay address, gave high priority to the devel-opment of “Green measures [that] wouldincorporate changes in the natural environmentinto the calculations of national income andwealth.” At that time, committed to produc-ing initial estimates of natural resource depletionwithin a year.
The first section of this article discusses theanalytical and economic accounting backgroundof the ’s and concludes with a summaryof a United Nations system of satellite accountsfor the environment, after which ’s accountsare fashioned. The second section introduces themain features of the ’s, presents an inven-tory of available data sources, and considers usesof the new accounts. The final section describes’s long-term work plan for developing thesatellite accounts, the first phase of which is com-pleted with the presentation of the two articles inthis issue of the S C B.Bibliographic references for both articles beginon page .
What Are They?
range information differently, perhaps by cutting acrosssectors to assemble information on both intermedi-ate and final consumption. For example, a satel-lite account can assemble business expenditures ontraining—treated as intermediate consumption in theexisting accounts—and education-related expendituresby households and government to analyze the role ofeducation in the economy. They can use a classi-fication other than the primary one. For example,they can identify expenditures on “research in educa-tion” as part of research expenditures even though theyare included in education expenditures in the existingaccounts.
The terminology and concepts associated with satel-lite accounts reflect the experiences of several countriesthat have constructed them, largely on an ad hoc basis,for fields such as health, education, agriculture, researchand development, and the environment. The System ofNational Accounts , the newly revised internationalguidelines, includes a chapter that provides a generalframework for satellite accounts and demonstrates howthat framework can be used for some of the fields inwhich such accounts would be most useful. This chapterrepresents, in a real sense, the coming of age of satelliteaccounts as an analytical tool.
April •
. Materials balance and energy accounting, developed in the late ’s,is based on the first law of thermodynamics—that matter can neither becreated nor destroyed. The accounts therefore describe a circular flow process:A raw material input is transformed by the processes of the economy, thistransformation results in a new product and in residuals, and those residualsare transformed in the natural environment into raw materials.
Acknowledgments
This article and its companion are the initial prod-ucts of ’s natural resource accounting project. J.Steven Landefeld, ’s Deputy Director, directed theproject. He and Carol S. Carson, ’s Director, werethe principal authors of the two articles. Gerald F.Donahoe, Chief of the National Income and WealthDivision, coordinated and supervised the preparationof the estimates for this project. The other authorsand their areas of responsibility were as follows: BruceT. Grimm, accounting issues, present discountedvalue minerals estimates, and rates of return; StephanieL. Howell, framework and estimates other thanminerals; Arnold J. Katz, conceptual issues, miner-als methods, and oil and gas transactions estimates;Gary L. Rutledge, pollution abatement and controlestimates; Timothy F. Slaper, minerals concepts andmethods, current-rent minerals estimates, and oil andgas replacement-cost estimates; Eric J. Troyer, miner-als methods and estimates. also acknowledges themany outside experts who provided advice on sourcedata and methods. In particular, Richard W. Haynes,of the U.S. Department of Agriculture Forest Service,provided data and essential assistance with the issuesand methods involved in the valuation of standingtimber.
The Background for Integrated Economicand Environmental Accounting
The analytical background
It is, of course, a simplification to speak of theeconomy and the environment as two distinctrealms. It can be argued, for example, that theeconomy is part of nature because the economicactivity of human beings in producing food andshelter parallels the similar activity of animals.In this simplification, the economy is definedas the human activities relating to income, pro-duction, consumption, accumulation, and wealth(although there is a continuing discussion aboutthe scope to be given, for example, to the term“production”). The term “environment” refers tothe environment of human beings, which is madeup of the biological resources, subsoil resources,land and related ecosystem resources, water, andair. From the standpoint of the economy, theenvironment can be thought of as consisting ofa range of natural resource and environmentalassets that provide an identifiable and significantflow of goods and services to the economy.
The economy uses these productive natural as-sets in a wide range of ways. Crude oil pumpedfrom proved reserves, for example, is used in theproduction of petroleum products, while cleanwater in lakes and oceans is used in the produc-tion of fish, paper products, and electric power.The economy’s uses of the goods and servicesprovided by these environmental assets can begrouped into two general classes. When use ofthe natural asset permanently or temporarily re-duces its quantity, the use is viewed as involvinga flow of a good or service, and the quantitativereduction in the asset is called depletion. In thatclass of uses, biological resources, for example,are used as food, as raw materials for clothing,and as building materials and fuel. Water is usedfor drinking, cooling, processing, and irrigation.
When use of the natural asset reduces its qual-ity, the qualitative reduction in the asset is calleddegradation. These qualitative uses include theconversion of land from one use to another, suchas the partial development of forestland. Thedevelopment of forestland results in a reductionin the economic value of the land as forestlandbecause of the reduction in the flow of recre-ational services associated with its degradation asa wildlife area and tourist destination. In anotherkind of qualitative use, natural assets are used asa sink for the disposal of residual pollutants thatare byproducts of production.
The use of natural assets describes only partof the interaction between the economy and theenvironment. There are also feedback effects.Materials balance and energy accounting high-light both the use of the natural assets and thefeedback effects from the use; thus, they cap-ture the full interaction between the economyand the environment. In the case of natural re-sources, oil pumped from reserves today reducesthe quantities that can be extracted from existingfields in the future; similarly, overharvesting offish stocks today reduces yields in the future.
In the case of environmental assets, the feed-back is more complicated, with effects that oftenfall on other industries and consumers. For ex-ample, when businesses use environmental goodsand services along with labor and capital in pro-duction, residuals—such as lead and cadmium,or carbon monoxide and sulfur oxides—are alsoproduced and are then disposed of into the envi-ronment. Up to a point, the environment is ableto assimilate these residuals; beyond that point,however, significant environmental degradationaffects the ability of the environment to provide

• April
raw materials to the economy (and to assimilateresiduals). Degradation of air and water quality,for example, may lead to economic feedback—forexample, lower timber yields and fish harvests,higher rates of depreciation in plant and equip-ment, additional cleaning costs, and increasedhealth expenditures. In addition, either becauseof governmental regulations or the need to dis-pose of residuals that the environment can nolonger handle, businesses and others may need tomake expenditures for pollution abatement andcontrol.
Integrated economic and environmental ac-counting aims to provide a picture of theseinteractions between the economy and the en-vironment. Although this picture, as alreadynoted, has numerous elements and is complex,by definition it does not cover many of thetransformations and interactions within the en-vironment itself—for example, the disposal ofwaste products from wild fish and mammals orthe conversion of natural carbon dioxide intooxygen by plant matter on land and in theoceans. The accounts highlight the fact thateconomic sustainability depends on environmen-tal sustainability, and they provide data to helpanalyze the costs and benefits for the carefulstewardship of our economic and environmen-tal assets. Consistent and detailed accounting ofthe interactions between the economy and theenvironment provides a common framework forintegrating the work of environmental specialists,economists, and other analysts from a wide rangeof disciplines.
The economic accounting background
Economic accountants have long been aware ofthe issues that arise with respect to natural re-sources and the environment. One of the issues,which is also reviewed in the companion arti-cle, is whether the economic accounts shouldreflect the parallelism that is apparent in busi-ness accounting between depreciation, a chargefor the using up of plant and equipment in pro-duction, and depletion, a charge for the usingup of natural resources in production. In par-ticular, because depletion of mineral resourceshas long been chargeable against profits in theU.S. tax code and because tax return tabula-tions have been used as source data for profitsand other property income components of thenational income and product accounts (’s),explicit decisions were required on the treatmentof depletion in the accounts. Initially, depletionwas treated symmetrically with depreciation, but
no entry was made for additions to the stockof mineral resources parallel to the treatment ofinvestments in structures and equipment. Asa result of dissatisfaction with this asymmetrictreatment, the entry for depletion was removedbeginning in .
In the late ’s and early ’s, environmen-tal accounting issues came up as part of a broaderinterest in social accounting. Work by JamesTobin and William Nordhaus, among others,on adjusting traditional economic accounts forchanges in leisure time, disamenities of urbaniza-tion, exhaustion of natural resources, populationgrowth, and other aspects of welfare producedindicators of economic well-being. However, theseemingly limitless scope, the range of uncer-tainty, and the degree of subjectivity involvedin such measures of nonmarket activities limitedthe usefulness of, and interest in, these socialindicators. It was felt that inclusion of suchmeasures would sharply diminish the usefulnessof traditional economic accounts for analyzingmarket activities. Attention subsequently focusedon more readily identifiable and directly rele-vant market issues, such as the extent to whichexpenditures that relate to the protection andrestoration of the environment (and other so-called defensive expenditures) are identifiable inthe economic accounts.
In response to this interest in environmentalprotection, in the mid-’s, was a pio-neer in the development of estimates of pollutionabatement and control () expenditures in anational accounting framework. Further, presag-ing what was to come, the framework for theseestimates can be viewed as an early form of asatellite account. The estimates focus on anarea of interest and provide detail that would haveburdened presentation of the more general estimates.
The steps in the evolution of natural resourceand environmental accounting since the early’s can be summarized in terms of interna-tional efforts, in which there was active U.S.participation, and the literature related to theseeffects. For this purpose, is a reasonableplace to start. In that year, the United Na-tions Environment Program () was giventhe mandate to develop methodological guide-lines on environmental accounting. In its earlierwork, had tried to clarify the linkagesbetween economic development and the environ-ment to help integrate issues of environmentaland resource management into the frameworkof economic decisionmaking. To follow up on

April •
the mandate, and the World Bank spon-sored a series of workshops in – to explorethe current state of environmental and naturalresource accounting. The general thinking wasthat although economists had long considered the“external effects” of production and consump-tion, they had not taken into account the effectson the resource system as a whole and the con-sequence that eventually someone was going tohave to bear the “external costs.” A broaderview would internalize environmental costs in theproduction process, for which it would be es-sential to calculate costs and benefits properlyand to distinguish clearly between true incomeand the drawing down of assets by depletion ordegradation. Accordingly, the workshops focusedon the shortcomings of traditional economic ac-counting: does not adequately represent trueincome because environmental protection costsare treated as generating income and because de-pletion and degradation of natural resources arenot charged against current income. A numberof remedies for these shortcomings were pro-posed, but workable methodologies and gooddata were lacking, and some of the proposals wereconflicting.
Although the empirical foundations for inte-grating environmental and economic accountingestimates were lacking in the mid-’s, a grow-ing body of research and information was accu-mulating. France, Norway, and the Netherlandswere working toward physical accounting matri-ces, which they have integrated into cost-benefitand cost-effectiveness work in the environmentalpolicy field. Subsequently, Canada, the UnitedKingdom, Japan, and Australia all did prelimi-nary work toward supplementing their traditionalaccounts. The United Nations and the WorldBank jointly sponsored pilot studies with statisti-cians in Mexico and Papua New Guinea. In addi-tion to these country efforts, researchers—such asHenry Peskin, working with the EnvironmentalProtection Agency in a study of the ChesapeakeBay region, and Robert Repetto and his associatesat the World Resources Institute, in their studiesof China, Costa Rica, and the Philippines—haveadded significantly to the growing literature onenvironmental accounting.
In the meantime, a revision of the System ofNational Accounts (), the international guide-lines followed by most countries in preparingtheir economic accounts, was undertaken. A ma-
. See Salah El Serafy and Ernst Lutz [].
. See, for example, Henry M. Peskin and Ernst Lutz [].
jor issue was the extent to which the revised would remedy the perceived shortcomings oftraditional national accounts.
The discussion stimulated by the reportof the World Commission on Environment andDevelopment, Our Common Future, gave addedreason to explore statistical measures that wouldprovide appropriate tools to guide policy anddecisionmaking.[] This report focused on sus-tainable development—that is, development thatmeets the needs of the present without com-promising the ability to meet the needs of thefuture. According to the report, the Commissionhad been established by the United Nations Gen-eral Assembly because of the growing realizationthat it is impossible to separate economic de-velopment issues from environmental issues—therealization, in other words, that many forms ofdevelopment erode the environmental resourcesupon which they are based, and that such envi-ronmental degradation can undermine economicdevelopment.
By , it became clear that, given the di-vergent views on a number of conceptual andpractical issues in natural resource and environ-mental accounting, international consensus intime for a fundamental change in the aspart of the ongoing revision was not possible.Therefore, it was agreed that the revised would address links to environmental concerns,such as the definition and boundary for assets,and that a satellite account for integrated eco-nomic and environmental accounting would bepursued. The United Nations undertook thepreparation of a handbook to provide guidanceon the construction of the satellite account.
Subsequently, this approach found support inseveral forums. In May , a Special Conferenceof the International Association for Research inIncome and Wealth brought together economicaccountants and environmental specialists to dis-cuss a preliminary version of the United Nationshandbook. In June , the United NationsConference on Environment and Development(the “Earth Summit”) in Rio de Janeiro includeda program for establishing systems of integratedaccounts as a complement to the existing systemin its Agenda .[] Agenda urged nationaloffices that prepare economic accounts to under-take the work and urged the United Nations todistribute widely, and then refine, its handbook.In October , economic accountants, in a sem-inar held to review the revised , generallywelcomed the features that link to the environ-ment and the section of the revised ’s chapter

• April
on satellite accounts that discusses integrated eco-nomic and environmental accounts based on theUnited Nations handbook. In February ,the Statistical Commission of the United Nationsendorsed the revised . The Commission, inhighlighting the important features of the revised, noted that it laid the groundwork for dealingwith the interaction between the economy andthe environment.
The United Nations System of Environmentaland Economic Accounting
The United Nations System of Environmentaland Economic Accounting (), as describedin the handbook, is a flexible, expandable satel-lite system.[] It draws on the materials balanceapproach to present the full range of interactionsbetween the economy and the environment. The builds on, and is designed to be used with,the System of National Accounts (hereafter ) []. Like the , the is primarilyconcerned with the implications of the environ-ment for production, income, consumption, andwealth.
The has four stages, each successivelyproviding a more comprehensive accounting forthe interaction between the economy and theenvironment. The four-stage presentation recog-nizes the need to develop concepts, to inventoryand augment source data, and to adapt the im-plementation to differing analytical needs. Thestarting point is the , which incorporatedseveral features that anticipated the needs of en-vironmental accounting. Stage A disaggregates,or provides additional detail on, environmentallyrelated economic activities and assets. This stage,for example, focuses on actual expenditures in-tended to prevent or repair the degradation ofthe environment. It includes a detailed break-down of the stocks of natural resource assets andchanges in these stocks. Finally, it includes sectorlinks to show the supply and uses of natural re-
. For a summary of the , the revision process, and the new features,see [].
. The two main features that anticipated the needs of environmentalaccounting dealt with the coverage of assets and the recording of changes inthem. First, the includes within the boundary of economic assetsall assets over which ownership rights can be established and enforced andthat provide economic benefits to their owners. This boundary explicitlyincludes natural assets, both those whose growth is the result of humancultivation (for example, vineyards and livestock) and those that, althoughnot cultivated, are under control of an owner (for example, land, subsoilassets, and water resources). Second, it records all changes in the value ofassets from one balance sheet to another. As part of doing this, there is anaccount to record certain changes in assets not recorded as production or ascosts of production; this account records, for example, the additions to, anddepletion of, subsoil assets and the natural growth of uncultivated forests.Another account records changes in the value of assets due to price change.Further, the describes how to use these and other features as a pointof departure for an environmental satellite account.
sources. The use of natural resources—depletionand degradation—can be broken down into in-termediate inputs by industry, investment, finalconsumption by households and government,and imports and exports.
Stage B begins with the physical counterpart ofstage A. It maps, in physical terms, the interac-tion between the environment and the economy.It provides the physical quantities to which pricesare applied to derive the economic values in-cluded in the economic accounts. These physicalaccounts also provide a bridge to natural re-source accounting and to materials and energybalances accounting. Stage B then links thephysical quantities to monetary values.
Stage C provides far more comprehensive andexplicit measures of the interaction between theeconomy and the environment. It does so, first,by the use of alternative valuation techniques—that is, alternatives to the use of values tied to themarket, the valuation used in the andin traditional accounting systems. The alterna-tive valuation techniques include estimates basedon maintenance costs, or the costs necessary tomaintain at least the present level of environ-mental assets, and estimates based on contingentvaluation, or the willingness to pay for reductionsin depletion or degradation of natural assets.Second, it does so by the more explicit intro-duction of environmental effects on the measuresof national production, investment, income, andwealth. Stages A and B of the (as well asthe ) record environmental effects eitheras changes in the value of assets or as changesin the distribution of income among the factorsof production; these changes do not explicitly af-fect gross domestic product, final demand, or netdomestic product.
Stage D consists of further extensions of the. These extensions are provided for thepurpose of “opening a window on further ana-lytical applications,” and they will require furtherresearch. They include household productionand the use of recreational and other unpricedenvironmental services in household production.
Framework for the ’s
’s ’s build on the accumulating experi-ence represented in the . This experience isconsistent with two lessons from social account-ing in the ’s. First, such accounts should befocused on a specific set of issues. Second, giventhe kind of uses to which the estimates wouldbe put, the early stage of conceptual develop-

April •
ment, and the statistical uncertainties (even if theestimates are limited to the effect on market ac-tivities), such estimates should be developed in asupplemental, or satellite, framework.
Structural features
The ’s are structured to focus on the inter-action of the economy and the environment. Theinteractions covered are those that can be tied tomarket activities and thus valued in market pricesor proxies thereof. They are shown as effects onproduction, income, consumption and wealth.
The accounts have two main structural fea-tures. First, natural resources and environmentalresources are treated like productive assets. Theseresources, along with structures and equipment,are treated as part of the Nation’s wealth, andthe flow of goods and services from them areidentified and their contribution to productionmeasured. Second, the accounts provide sub-stantial detail on expenditures and assets thatare relevant to understanding and analyzing theinteraction. Fully implemented ’s wouldpermit identification of the economic contribu-tion of natural and environmental resources byindustry, by type of income, and by product.Ultimately, accounts by region would add animportant analytical dimension.
Natural and environmental resources as productiveassets.—An example helps to explain the reason-ing behind treating natural and environmentalresources like productive assets in the economicaccounts. This example is much simplified, no-tably in that it shows only one side of an account,focuses on aggregates, and uses descriptive ratherthan technically precise terminology. In this ex-ample, all income from production goes to either“wages” or “profits.” Wages are recorded asearned; however, profits—that is, total revenuesless labor and other operating expenditures—arereduced by an entry for “depreciation,” wheredepreciation is the amount that must be set asideto cover the using up of capital in production.Thus, for an industry and for all industries com-bined, wages plus profits and depreciation equalsgross domestic product ().
In the traditional accounts, the economy wouldbe pictured as follows:
Wages . . . . . . . . . . . . . . . . . . . . . . . . . . . . . . . . . . . . . . . . . . . . . . . . . ,Plus: Profits . . . . . . . . . . . . . . . . . . . . . . . . . . . . . . . . . . . . . . . . . . . ,
Depreciation . . . . . . . . . . . . . . . . . . . . . . . . . . . . . . . . . . . . . ,Gross domestic product . . . . . . . . . . . . . . . . . . . . . . . . . . . . . . . ,
Because depreciation is included in , is not a measure of sustainable income; that is,if a nation consumed all of its , it would re-duce the productive capacity available to futuregenerations because it had consumed the amountit should have set aside to cover the using up ofcapital. In fact, the “gross” in the name, grossdomestic product, refers to that feature. As a bet-ter measure of sustainable income, the traditionalaccounts provide net domestic product (),which is calculated as less depreciation.
Gross domestic product . . . . . . . . . . . . . . . . . . . . . . . . . . . . . . . ,Less: Depreciation. . . . . . . . . . . . . . . . . . . . . . . . . . . . . . . . . . . . . . ,Net domestic product . . . . . . . . . . . . . . . . . . . . . . . . . . . . . . . . . . ,
Capital in the traditional accounts is limitedto structures and equipment. In the ’s,natural and environmental resources are viewedas having characteristics similar to structuresand equipment: Labor and materials are de-voted to producing them, and they then yielda flow of services over time. For that reason,the ’s include these resources, along withstructures and equipment, as part of the Na-tion’s wealth and give them the same treatmentas structures and equipment in the traditionalaccounts. The ’s deal with three pointsof asymmetry between the treatment of naturalresources—for example, mineral reserves—andof structures and equipment encountered in tra-ditional accounts. In traditional accounts: ()depreciation is subtracted from profits to deter-mine true, or sustainable, profits, but depletionis not; () depreciation is subtracted from toestimate , but depletion is not; and () ad-ditions to the stock of plant and equipment areadded to as capital formation, but additionsto mineral reserves are not.
The depletion of mineral reserves is like thedepreciation of plant and equipment: It is theamount that must be set aside to cover the cost ofusing up mineral resources in production. If anoil company earns , in profits but depletesits mineral reserves by , then its true eco-nomic profits are only ,, the amount overand above its depletion of assets. In the ’s,therefore, an estimate is made of the amount ofprofits that should be recognized as depletion.This amount is subtracted from profits and en-tered, like depreciation, as a separate component,thereby dealing with the first point of asymme-try. Further, depletion, like depreciation, must

• April
be subtracted from to arrive at . Doingso deals with the second point of asymmetry.
Wages . . . . . . . . . . . . . . . . . . . . . . . . . . . . . . . . . . . . . . . . . . . . . . . . . . ,Plus: Profits () . . . . . . . . . . . . . . . . . . . . . . . . . . . . . . . . . . . . ,
Depreciation . . . . . . . . . . . . . . . . . . . . . . . . . . . . . . . . . . . . . ,Depletion . . . . . . . . . . . . . . . . . . . . . . . . . . . . . . . . . . . . . . . .
Gross domestic product () . . . . . . . . . . . . . . . . . . . . . . . ,Less: Depreciation. . . . . . . . . . . . . . . . . . . . . . . . . . . . . . . . . . . . . . ,
Depletion . . . . . . . . . . . . . . . . . . . . . . . . . . . . . . . . . . . . . . . . Net domestic product () . . . . . . . . . . . . . . . . . . . . . . . . . ,
Note that recognizing depletion lowers profitsand changes the composition of , but the levelof itself is not reduced; recognizing depletionreduces in comparison with the traditionalaccounts’ .
In the ’s, additions to mineral reserves(for example, extensions as a result of invest-ments in improved technology or additions as aresult of exploration) are treated like additionsto the stock of structures and equipment—thatis, as capital formation. Additions to reserves donot appear in the traditional accounts; therefore,to treat them as capital formation, they are addedto . In the ’s, additions to reserves raisecapital formation, profits, , and . Recog-nizing the additions to reserves thus deals withthe third point of asymmetry. If the additionsamounted to , the economy would be picturedas follows:
Wages . . . . . . . . . . . . . . . . . . . . . . . . . . . . . . . . . . . . . . . . . . . . . . . . . . ,Plus: Profits () . . . . . . . . . . . . . . . . . . . . . . . . . . . . . . . . . . . . ,
Of which: Capital formation in mineralreserves. . . . . . . . . . . . . . . . . . . . . . . . . . . . . . . . . . . . . . .
Depreciation . . . . . . . . . . . . . . . . . . . . . . . . . . . . . . . . . . . . ,Depletion . . . . . . . . . . . . . . . . . . . . . . . . . . . . . . . . . . . . . . .
Gross domestic product () . . . . . . . . . . . . . . . . . . . . . . . ,Less: Depreciation. . . . . . . . . . . . . . . . . . . . . . . . . . . . . . . . . . . . . . ,
Depletion . . . . . . . . . . . . . . . . . . . . . . . . . . . . . . . . . . . . . . . Net domestic product () . . . . . . . . . . . . . . . . . . . . . . . . . ,
Compared with the traditional accounts, boththe composition and level of differ. Thus,the ’s give a view of an industry’s produc-tion that reflects changes in its resource base.The ’s measure of , therefore, is a bettermeasure of sustainable income than the tradi-tional accounts’ measure because it incorporateschanges in mineral wealth as well as structuresand equipment. Whether the ’s measure of is higher or lower than in the traditionalaccounts depends on whether depletion or addi-tions is larger, and this will vary from resourceto resource and from period to period. Estimatesof this kind for all natural and environmentalresources would help gauge whether the currentlevel of can be maintained by the Nation’snatural resource base.
Detail that highlights the interaction.—In the’s, the standard economic accounting cat-egories are disaggregated to show detail thathighlights the interaction of the economy andthe environment. For example, the expendituresdetail shows spending by households, govern-ment, and business to maintain or restore theenvironment. The asset detail shows environ-mental management (conservation and develop-ment, and water supply) and waste-managementprojects (sanitary services, air and water pollu-tion abatement and control) within the standardcategory of nonresidential fixed capital.
The estimating requirements underlying thesetwo main structural features of the ’s are ap-parent in the tables, even when, as shownin this article, they are in skeleton form. Table ,an asset account, and table , a production ac-count, use modified forms of tables presented inthe .
Asset accounts
Integrated economic and environmental account-ing requires the measurement of stocks and flowsrelated to assets, which are presented in an assetaccount. An asset account is like a balance sheetin that it presents stocks, or holdings, at a pointin time. (Because an asset account is limited tononfinancial assets, it does not include liabilitiesand net worth, as would a balance sheet.) How-ever, an asset account also presents flows relatedto the assets during a period of time.
The ’s provide a complete accounting forthe relevant assets—that is, they show both stocksand flows associated with changes in those stocks.Column in table provides for estimates ofopening stocks. Columns – provide for esti-mates of the flows that represent different kindsof changes in the stock: First, a net total andthen three flows: The decrease in stocks dueto depreciation (or more formally, in economicaccounting terms, consumption of fixed capi-tal), depletion, or degradation; the increase instocks due to capital formation in the form ofnew structures and equipment, additions to in-ventories, additions to the stock of natural andenvironmental assets; and changes in value dueto price changes and to changes in the volumeof assets other than those due to economic ac-tivity (for example, natural disasters). Column provides for estimates of closing stocks.
Table presents the nonfinancial assets that would try to include in asset accounts.The table’s rows generally follow the subcate-gories of the and the , but some of

April •
the subcategories are regrouped to broaden boththe production boundary and the definition ofassets. Nonfinancial assets are divided into madeassets, developed natural assets, and environmen-
Table 1.—
This table can serve as an inventory of the estimates currently availabas follows: For made assets, estimates of fixed reproducible tangibland pollution abatement stock, from BEA estimates (rows 1–21); for the companion article (rows 36–41); and best-available, or rough-orde47) and some environmental assets (selected rows 48–55) prepared byentries represent a research agenda.
PRODUCED ASSETS
Made assets ..........................................................................................................................
Fixed assets ......................................................................................................................Residential structures and equipment, private and government .................................Fixed nonresidential structures and equipment, private and government ..................
Natural resource related ...........................................................................................Environmental management ................................................................................
Conservation and development .......................................................................Water supply facilities ......................................................................................
Pollution abatement and control ..........................................................................Sanitary services ..............................................................................................Air pollution abatement and control ................................................................Water pollution abatement and control ...........................................................
Other .........................................................................................................................
Inventories 1 .......................................................................................................................Government ...................................................................................................................Nonfarm .........................................................................................................................Farm (harvested crops, and livestock other than cattle and calves) ..........................
Corn ...........................................................................................................................Soybeans ..................................................................................................................All wheat ...................................................................................................................Other .........................................................................................................................
Developed natural assets ...................................................................................................
Cultivated biological resources .........................................................................................Cultivated fixed natural growth assets .........................................................................
Livestock for breeding, dairy, draught, etc ..............................................................Cattle .....................................................................................................................Fish stock .............................................................................................................
Vineyards, orchards ..................................................................................................Trees on timberland .................................................................................................
Work-in-progress on natural growth products ..............................................................Livestock raised for slaughter ..................................................................................
Cattle .....................................................................................................................Fish stock .............................................................................................................
Calves .......................................................................................................................Crops and other produced plants, not yet harvested .............................................
Proved subsoil assets 2 .....................................................................................................Oil (including natural gas liquids) .................................................................................Gas (including natural gas liquids) ...............................................................................Coal ...............................................................................................................................Metals ............................................................................................................................Other minerals ...............................................................................................................
Developed land ..................................................................................................................Land underlying structures (private) .............................................................................Agricultural land (excluding vineyards, orchards) ........................................................
Soil ............................................................................................................................Recreational land and water (public) ...........................................................................Forests and other wooded land ...................................................................................
NONPRODUCED/ENVIRONMENTAL ASSETS
Uncultivated biological resources ..........................................................................................Wild fish .............................................................................................................................Timber and other plants of uncultivated forests ..............................................................Other uncultivated biological resources ............................................................................
Unproved subsoil assets .......................................................................................................Undeveloped land ..................................................................................................................Water (economic effects of changes in the stock) ...............................................................Air (economic effects of changes in the stock) ....................................................................
n.a. Not available.* The calculated value of the entry was negative.1. The estimate for inventories differs from the NIPA estimate by the amount of government inv
and cattle and calves shown separately. In full implementation of the IEESA account, farm inventories
tal assets. Made assets, which largely replicate thescope of nonfinancial assets in traditional incomeand wealth accounts, are subdivided into fixed as-sets and inventories. Developed natural assets are
IEESA Asset Account, 1987[Billions of dollars]
le for the IEESA’s. In decreasing order of quality, the estimates that have been filled in aree stock and inventories, from BEA’s national income and product accounts or based on them,
subsoil assets, the highs and lows of the range based on alternative valuation methods, fromr-of-magnitude, estimates for some other developed natural assets (selected rows 23–35 and 42– BEA based on a wide range of source data described in this article. The ‘‘n.a.’’—not available—
Row Opening stocks
Change
Closing stocks(1+2)Total, net
(3+4+5)
Depreciation,depletion,
degradation
Capitalformation
Revaluation andother changes
(1) (2) (3) (4) (5) (6)
...... 1 11,565.9 667.4 −607.9 905.8 369.4 12,233.3
...... 2 10,535.2 608.2 −607.9 875.8 340.2 11,143.4
...... 3 4,001.6 318.1 −109.8 230.5 197.4 4,319.7
...... 4 6,533.6 290.1 −498.1 645.3 142.9 6,823.7
...... 5 503.7 23.1 −19.2 30.3 12.0 526.8
...... 6 241.3 8.4 −7.0 10.6 4.7 249.6
...... 7 152.7 3.6 −4.4 5.3 2.7 156.4
...... 8 88.5 4.8 −2.5 5.3 2.0 93.3
...... 9 262.4 14.7 −12.2 19.7 7.3 277.1
...... 10 172.9 12.8 −5.6 13.7 4.8 185.8
...... 11 45.3 .6 −4.1 3.5 1.3 45.9
...... 12 44.2 1.3 −2.5 2.6 1.2 45.5
...... 13 6,029.9 267.0 −478.9 615.0 130.9 6,296.9
...... 14 1,030.7 59.3 .......................... 30.1 29.2 1,090.0
...... 15 184.9 6.8 .......................... 2.9 3.8 191.7
...... 16 797.3 62.4 .......................... 32.7 29.7 859.7
...... 17 48.5 −9.9 .......................... −5.5 −4.4 38.6
...... 18 10.2 .3 .......................... −1.1 1.4 10.5
...... 19 5.0 −.1 .......................... −1.0 .9 4.9
...... 20 2.6 0 .......................... −.2 .2 2.6
...... 21 30.7 −10.1 .......................... −3.2 −6.9 20.6
...... 22 n.a. n.a. n.a. n.a. n.a. n.a.
...... 23 n.a. n.a. n.a. n.a. n.a. n.a.
...... 24 n.a. n.a. n.a. n.a. n.a. n.a.
...... 25 n.a. n.a. n.a. n.a. n.a. n.a.
...... 26 12.9 2.0 n.a. −.3 2.3 14.9
...... 27 n.a. n.a. n.a. n.a. n.a. n.a.
...... 28 2.0 .2 n.a. 0 .2 2.2
...... 29 288.8 47.0 −6.9 9.0 44.9 335.7
...... 30 n.a. n.a. .......................... n.a. n.a. n.a.
...... 31 n.a. n.a. .......................... n.a. n.a. n.a.
...... 32 24.1 7.5 .......................... 0 7.5 31.6
...... 33 n.a. n.a. .......................... n.a. n.a. n.a.
...... 34 5.0 .9 .......................... −.5 1.4 5.9
...... 35 1.8 .3 .......................... .1 .2 2.1
...... 36 270.0 ↔ 1066.9 57.8 ↔ −116.6 −16.7 ↔ −61.6 16.6 ↔ 64.6 58 ↔ −119.6 299.4 ↔ 950.3
...... 37 58.2 ↔ 325.9 −22.5 ↔ −84.7 −5.1 ↔ −30.6 5.8 ↔ 34.2 −23.1 ↔ −88.3 35.7 ↔ 241.2
...... 38 42.7 ↔ 259.3 6.6 ↔ −57.2 −5.6 ↔ −20.3 4.1 ↔ 14.9 8.1 ↔ −51.8 49.4 ↔ 202.2
...... 39 140.7 ↔ 207.7 2.2 ↔ −3.4 −5.4 ↔ −7.6 4.4 ↔ 6.3 3.2 ↔ −2.1 143.0 ↔ 204.2
...... 40 (*) ↔ 215.3 67.2 ↔ 29.5 −.2 ↔ −2.2 2.2 ↔ 9.2 65.2 ↔ 22.5 38.5 ↔ 244.8
...... 41 28.4 ↔ 58.7 4.3 ↔ −.8 −.4 ↔ −.9 .1 ↔ 0 4.6 ↔ .1 32.8 ↔ 57.9
...... 42 n.a. n.a. n.a. n.a. n.a. n.a.
...... 43 4,053.3 253.0 n.a. n.a. n.a. 4,306.3
...... 44 441.3 42.4 n.a. −2.8 45.2 483.7
...... 45 n.a. n.a. −.5 n.a. n.a. n.a.
...... 46 n.a. n.a. −.9 .9 n.a. n.a.
...... 47 285.8 28.8 n.a. −.6 29.4 314.6
...... 48 n.a. n.a. n.a. n.a. n.a. n.a.
...... 49 n.a. n.a. n.a. n.a. n.a. n.a.
...... 50 n.a. n.a. n.a. n.a. n.a. n.a.
...... 51 n.a. n.a. n.a. n.a. n.a. n.a.
...... 52 n.a. n.a. n.a. n.a. n.a. n.a.
...... 53 n.a. n.a. −19.9 19.9 n.a. n.a.
...... 54 ............................ n.a. −38.7 38.7 n.a. ........................
...... 55 ............................ n.a. −27.1 27.1 n.a. ........................
entories added would include
only harvested crops.2. The estimates in all columns result from the valuation method (see text for further discussion of the alternative
methods) that produces the low and high estimates of opening stocks.NOTE.—Leaders indicate an entry is not applicable.

• April
subdivided into cultivated biological resources,proved subsoil assets, and developed land. Envi-ronmental assets are subdivided into uncultivatedbiological resources, unproved subsoil assets, un-developed land, water, and air (the last two interms of the economic effects of changes in thestock).
Made and developed natural assets.—To betterhighlight the interaction of the economy andthe environment, table provides more detailon natural resource and environmentally relatedproduced assets than the traditional income andwealth accounts. Within made assets, nonresi-dential fixed capital is disaggregated into environ-mental management (conservation and develop-ment, and water supply) and waste-managementprojects (sanitary services, air and water pollutionabatement and control). Detail is also providedon farm inventories of finished goods.
Within cultivated biological resources, table provides detail beyond that contained in the tra-ditional accounts, such as cultivated fixed naturalgrowth assets (for example, livestock), and cat-egories not included in the traditional accounts(for example, trees on timberland).
The treatment of proved subsoil assets andcultivated land in table differs from the treatment. Proved reserves are generally definedas those reserves that are proved to a high degreeof certainty—by test wells or other test data—andare recoverable under current economic condi-tions and with current technology. In the ,they are classified as nonproduced assets. In ta-ble , these assets, along with cultivated naturalgrowth assets, are included in the category “de-veloped natural assets.” As will be illustratedin the production accounts, capital formationthat adds to the stock of these assets—both bybringing undeveloped or uncultivated assets intothe category of developed natural assets and byadding to their value within that category—istreated in a manner similar to capital forma-tion that adds to the stock of structures andequipment.
This treatment was adopted because it is dif-ficult to rationalize describing proved reservesand cultivated land as “nonproduced” natural as-sets when expenditures are required to prove ordevelop them. Agricultural land, for example,must be “produced” in that expenditures mustbe undertaken to convert uncultivated land ar-eas into commercially valuable farmland, whichyields a return over a number of years. Wet-land areas, if they are to become farmland, mustbe drained and graded and vegetation cleared.
Unproved mineral reserves also require expendi-tures for test wells, engineering studies, and otherexploration and development investments beforethey are recorded as proved reserves.
Similar treatments of these developed natu-ral assets and made assets facilitate consistenttreatment of capital formation of natural as-sets and more conventional capital formation,such as investment in structures and equipment.Under this treatment, as mineral reserves, forexample, are proved, the total value of the pro-duced assets—structures and equipment as wellas the proved reserve’s value—is included as cap-ital formation. Similarly, as oilfield machinery isdepreciated, proved reserves associated with themachinery are depleted.
The other major difference between developedassets in table and in the comparable presentation is in the treatment of soil. In the, soil—that is, productive soil on agriculturalland—is treated as separate from agriculturalland. In table , soil is a subcategory of agricul-tural land because the value of agricultural land isinseparable from the value of the soil. Availableestimates suggest that the effect of soil erosion, ordepletion, on agricultural productivity and landvalues in the United States is quite small. Nev-ertheless, though soil is not treated separately, itis shown separately because its erosion has a sig-nificant effect on environmental quality throughits effect on water quality.
Environmental assets.—This grouping includesnatural assets with significant economic valuethat differ from developed natural assets in thatthey are generally used as raw inputs into pro-duction in their natural state, either as interme-diate products or as investments. For example,uncultivated biological resources, such as tunaharvested from the ocean, are included as en-vironmental assets, whereas cultivated biologicalresources, such as rockfish raised on a fish farm,are included in developed assets. Other cate-gories in environmental assets are uncultivatedland, unproved subsoil assets, water, and air.
The inclusion of unproved subsoil assets broad-ens the definition of subsoil assets to include re-serves that, though unproved, have an economicvalue over and above that of other undevelopedland because of their location or geologic char-acteristics. As capital expenditures are made to“prove” these properties, they move from non-produced to produced assets. This broader def-inition of subsoil resources will facilitate longerterm planning and analysis of the use of mineralresources. The stock of proved reserves—like the
April •
stock of drill presses—can be expanded by addi-tional investment; hence, firms will keep on handthe stock of reserves dictated by current marketprices, finding costs, and interest rates. Thus,complete analysis of mineral resources requiresconsideration of unproved, as well as of proved,reserves.
In a distinction similar to that between provedand unproved subsoil assets, cultivated land—such as agricultural land, parkland, and landunderlying buildings—is included in developednatural assets, whereas uncultivated land—-suchas wetlands and forestland (not included astimberland)—is included in environmental as-sets. The agricultural land must be developedbefore it can be used as farmland, whereas wet-lands are used—for example, for their disposalservices—in their natural state by the economy.Water, which is subdivided by type, and air alsoprovide services to the economy in the form ofrecreational and waste disposal services.
Although these environmental assets differfrom made and developed natural assets, in-vestments that add to the stock of these assets,as noted below in the production accounts, aretreated symmetrically with investments that addto the stock of structures and equipment and ofdeveloped assets. These investments, for exam-ple, include pollution abatement and control toimprove the quality and waste disposal capac-ity of the air and water, or at least to offset thedegradation/depletion (which is also recorded inthe production account) occurring in the currentperiod. These investments represent a decisionby the economy to devote its resources to invest-ments that improve air and water quality, ratherthan investments in structures and equipment,and investments that add to the stock of clean airand water should be counted just as investmentsthat add to the stock of made and developedassets are counted.
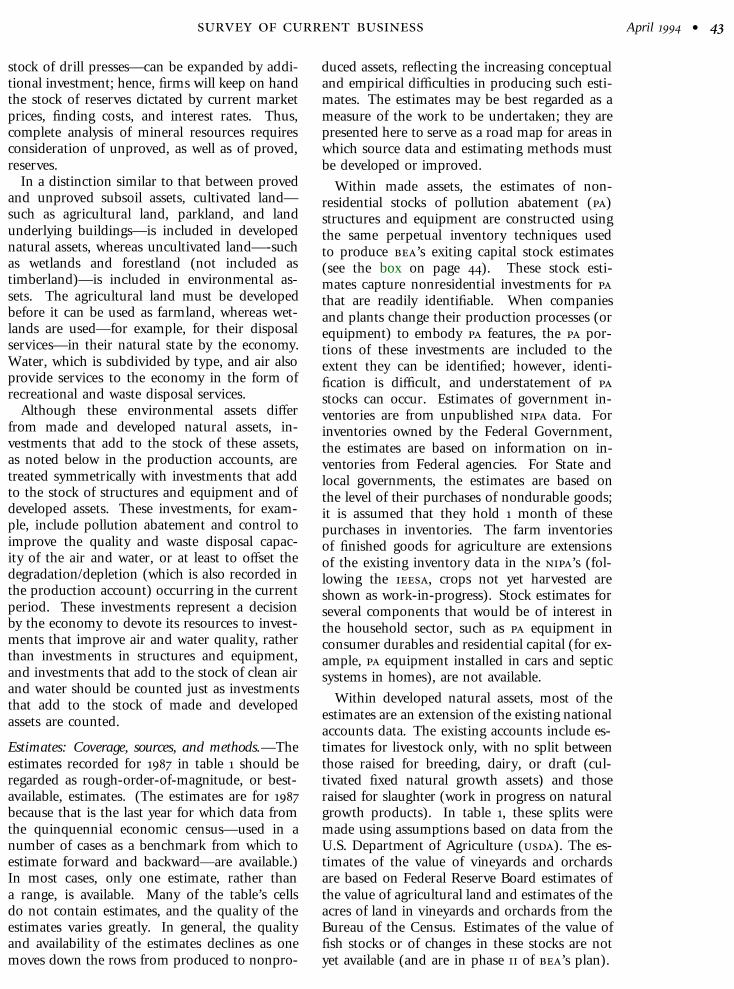
Estimates: Coverage, sources, and methods.—Theestimates recorded for in table should beregarded as rough-order-of-magnitude, or best-available, estimates. (The estimates are for because that is the last year for which data fromthe quinquennial economic census—used in anumber of cases as a benchmark from which toestimate forward and backward—are available.)In most cases, only one estimate, rather thana range, is available. Many of the table’s cellsdo not contain estimates, and the quality of theestimates varies greatly. In general, the qualityand availability of the estimates declines as onemoves down the rows from produced to nonpro-
duced assets, reflecting the increasing conceptualand empirical difficulties in producing such esti-mates. The estimates may be best regarded as ameasure of the work to be undertaken; they arepresented here to serve as a road map for areas inwhich source data and estimating methods mustbe developed or improved.
Within made assets, the estimates of non-residential stocks of pollution abatement ()structures and equipment are constructed usingthe same perpetual inventory techniques usedto produce ’s exiting capital stock estimates(see the box on page ). These stock esti-mates capture nonresidential investments for that are readily identifiable. When companiesand plants change their production processes (orequipment) to embody features, the por-tions of these investments are included to theextent they can be identified; however, identi-fication is difficult, and understatement of stocks can occur. Estimates of government in-ventories are from unpublished data. Forinventories owned by the Federal Government,the estimates are based on information on in-ventories from Federal agencies. For State andlocal governments, the estimates are based onthe level of their purchases of nondurable goods;it is assumed that they hold month of thesepurchases in inventories. The farm inventoriesof finished goods for agriculture are extensionsof the existing inventory data in the ’s (fol-lowing the , crops not yet harvested areshown as work-in-progress). Stock estimates forseveral components that would be of interest inthe household sector, such as equipment inconsumer durables and residential capital (for ex-ample, equipment installed in cars and septicsystems in homes), are not available.
Within developed natural assets, most of theestimates are an extension of the existing nationalaccounts data. The existing accounts include es-timates for livestock only, with no split betweenthose raised for breeding, dairy, or draft (cul-tivated fixed natural growth assets) and thoseraised for slaughter (work in progress on naturalgrowth products). In table , these splits weremade using assumptions based on data from theU.S. Department of Agriculture (). The es-timates of the value of vineyards and orchardsare based on Federal Reserve Board estimates ofthe value of agricultural land and estimates of theacres of land in vineyards and orchards from theBureau of the Census. Estimates of the value offish stocks or of changes in these stocks are notyet available (and are in phase of ’s plan).

• April
Stock of
This box presentand equipment (the United States dhelp to protect airpoint industrial so
In , the grosbillion (table A).
. billion in
all fixed nonresiden, the real grossrate of . percentthat in manufacturelectric utilities. Tis, after subtracting. billion in
The stockduction and econohow pollution abatand the profitabilitrough measures oquality that has be
The – inventory method:lated and discardsgoods, to arrive atby subtracting accand net stock estimcurrent cost—thatplacement or curre
Data on an estabare mainly from th() Survey by t
. For air , the Cexample, automobiles)eral Water Pollution Cofactories) or nonpoint (
. The stock estima forward. is pyear to present such
related capital flows throcompany (or enterprise)
. Stocks other thanof devices and systempollutant sources (for exfeatures of solid waste mavailable.
exact definition of “cultivated timber tracts.”
The values of trees on timberland were esti-mated based on stumpage value estimates pro-vided by the U.S. Forest Service’s Pacific North-west Research Station. The stumpage value esti-mates are based on the concept of net rent to thetimber stand—as distinct from the land the forestsits upon—and are derived mainly from privatemarket data on payments for logging rights. Assuch, they should correspond to the present dis-counted value of the timber sales from the tractless the costs of logging, access, transportation,and processing. All timber on timberland in the
Plant and Equipment for Air and Water Pollution A
s estimates of the gross and net stocks of plant) for air and water pollution abatement () inuring –. Gross and net stocks of
and water from degradation by stationary andurces of pollutant emissions.
s stock of air and water was about .In constant () dollars, the gross stock was, about . percent of the real gross stock oftial nonfarm business capital. Between andstock of air and water grew at an annual. Growth in nonmanufacturing stocks outpaceding stocks, mainly reflecting spending byhe real net stock of air and water —that
depreciation—was . billion in , up from.
estimates are useful when studying market pro-mic well-being. They are helpful in determiningement spending affects prices, total capital costs,y of capital. They are also helpful in constructingf the value of the degradation in air and wateren avoided through pollution abatement.
estimates were prepared by the perpetualPast flows (capital spending) were cumu-
deducted, in accordance with lifespans of capitalgross stocks of . Net stocks were calculatedumulated depreciation from gross stocks. Gross
ates for – are valued at constant and atis, using prices (for constant cost) and re-nt-year prices (for current cost).lishment basis for manufacturing spendinge Pollution Abatement Costs and Expenditures
he Bureau of the Census. Data for electric util-
lean Air Act classifies the sources of pollutants as mobile (foror stationary (for example, factories). For water , the Fed-ntrol Act classifies sources of pollutants as point (for example,for example, highway construction projects).tes in table A are part of a new establishment-based series forlanning a S C B article for later this stock estimates for selected industries and to present theirugh . The new stock series replaces a series prepared on abasis.for also protect air and water. Examples include stockss on mobile (for example, motor vehicles) and nonindustrial
ample, public sewer systems and septic systems), as well as
anagement systems. Estimates for these kinds of stocks are not
ities are mthe Censusspending fing. The for electricapproximafor miningutilities areare used, inexpenditurCensus of M
Table A.—AbatemeMajor Ind1980–91
Allfa
int
1980 ....... 101981 ....... 111982 ....... 121983 ....... 131984 ....... 141985 ....... 141986 ....... 151987 ....... 151988 ....... 161989 ....... 171990 ....... 171991 ....... 18
1980 ....... 121981 ....... 131982 ....... 131983 ....... 141984 ....... 141985 ....... 141986 ....... 151987 ....... 151988 ....... 151989 ....... 151990 ....... 161991 ....... 16
United States—public and private—is includedin this category. Timber on other forestlandis included in nonproduced/environmental as-sets. This somewhat arbitrary distinction is madepartly on conceptual grounds and partly on theavailability of source data. All timber in the na-tional forests is in a sense managed, althoughdepending on the forest, management rangesfrom active, such as planting, to relatively passive,such as self-seeding, fire control, and rotationalharvests. Practically, no data are available for the
batement in the United States, –
ainly from the Pollution Abatement () Supplement toBureau’s survey; the Supplement reports
or three industries—electric utilities, petroleum, and min- Supplement reports on a company basis, bututilities (unlike for petroleum and mining), such data
te an establishment basis. The spending estimatesand for nonmanufacturing except mining and electricprepared by indirect methods; a variety of data sourcescluding the Supplement, an environmental protection
es survey by the American Petroleum Institute, and theineral Industries.
Gross and Net Stocks of Air and Water Pollutionnt Plant and Equipment in Nonfarm Business, byustry Group, Current-Cost and Constant-Cost Valuations,
Gross stocks Net stocks
non-rm
dus-ries
Manufacturing Non-manu-factur-
ing
All non-farm
indus-tries
Manufacturing Non-manu-factur-
ingTotal Dura-bles
Non-dura-bles
Total Dura-bles
Non-dura-bles
Billions of current dollars
3.43 58.78 24.55 34.24 44.65 71.14 37.65 15.94 21.71 33.498.66 66.31 28.04 38.27 52.35 79.54 40.94 17.56 23.39 38.609.00 70.16 29.72 40.43 58.84 84.46 41.76 17.80 23.95 42.705.72 71.37 30.25 41.12 64.35 86.43 40.67 17.20 23.48 45.752.68 72.85 31.05 41.80 69.83 88.47 39.81 16.86 22.95 48.667.25 73.83 31.70 42.14 73.41 89.05 39.07 16.60 22.47 49.971.04 74.05 31.96 42.08 77.00 89.49 38.24 16.26 21.99 51.247.59 75.59 32.56 43.03 82.00 91.38 38.15 16.07 22.08 53.235.04 77.73 33.26 44.48 87.30 93.86 38.65 15.97 22.68 55.210.82 79.69 33.83 45.86 91.13 95.67 39.54 16.07 23.47 56.136.91 82.83 34.28 48.55 94.07 98.19 41.75 16.25 25.49 56.443.50 87.02 34.84 52.18 96.48 101.58 45.17 16.71 28.46 56.40
Billions of constant (1987) dollars
4.67 71.13 29.55 41.57 53.54 85.79 45.64 19.22 26.42 40.162.26 73.56 30.91 42.66 58.70 88.84 45.54 19.38 26.15 43.318.61 74.96 31.59 43.36 63.66 90.92 44.71 18.95 25.76 46.222.56 74.97 31.67 43.30 67.58 90.85 42.79 18.03 24.76 48.066.66 74.94 31.86 43.08 71.72 90.98 41.00 17.32 23.68 49.989.58 74.81 32.07 42.74 74.77 90.52 39.62 16.81 22.81 50.912.08 74.53 32.16 42.37 77.55 90.12 38.50 16.36 22.14 51.614.47 74.36 32.04 42.32 80.11 89.52 37.53 15.81 21.71 52.005.86 73.93 31.62 42.31 81.93 88.55 36.76 15.19 21.57 51.807.52 74.05 31.42 42.63 83.48 88.16 36.75 14.93 21.82 51.401.03 75.76 31.31 44.45 85.27 89.36 38.20 14.86 23.35 51.154.97 78.36 31.37 47.00 86.60 91.31 40.69 15.05 25.64 50.63

April •
For proved subsoil assets, the estimates shownare the highs and lows of ranges presented, alongwith a description of the sources and methodsused to prepare them, in the companion articlebeginning on page . The estimates representthe range of differences associated with com-mon methods for valuing nonrenewable naturalresources.
The estimates within the category “developedland” are of uneven quality. The estimates ofthe value of agricultural land are relatively goodand are based on estimates of farm realestate values less estimates of the value offarm structures. Soil estimates, from the ,reflect the annual effect of soil depletion in termsof extra fertilizer costs and reduced productiv-ity. The estimates of residential land, includedin table as part of land underlying structures,also are of reasonable quality. The estimates ofthe other private land underlying structures areof more uncertain quality. The Federal ReserveBoard produces these estimates of land values bytaking estimates of real estate values from a va-riety of sources and subtracting ’s estimatesof the value of nonresidential structures. TheFederal Reserve’s estimates of real estate valuesare based, in part, on less than comprehensiveprice indexes; they do not, for example, appearto cover adequately the value of mineral tracts,timberland, or industrial buildings and land.’s estimates of nonresidential structures arebased on perpetual inventory methods—with as-sumed depreciation schedules and replacement-cost indexes—and may therefore differ from thecurrent market value of the structures includedin the real estate estimates. Although over longerperiods of time the perpetual inventory estimatesare of good quality, during periods of decliningor rapidly increasing real estate values, they mayproduce unreasonable results. Also, to the ex-tent that the value of natural resource assets arenot included in the real estate price indexes, theoverall value of developed land will be over- orunder-stated according to the path of natural re-source prices relative to commercial and otherland values.
The recommends that national parks beclassified as uncultivated land because their pro-tection, and not their use, is the main functionof governmental regulation. However, becausethese parks are extensively maintained, improvedupon, and used by consumers for recreation,they are included in recreational land in table .The estimate of capital formation in recreationalland is based on Federal Government mainte-
nance and repair expenditures for parks; Stateand local expenditures are not available. It isassumed that these expenditures exactly offsetthe degradation/depletion of recreational land;in the case of recreational land, the only esti-mates available were of maintenance and repairexpenditures. This assumption is made only sothat both investment and degradation/depletionestimates are illustrated by the table and notto imply any judgment about the true value ofdegradation/depletion. (Phase and of ’swork plan, described in the next section, includeswork to build on the damage assessment andrecreational valuation literature to construct es-timates of the market value of recreational andenvironmental amenities.)
For environmental assets, the estimates aremore uncertain than even the most uncertain es-timates for developed land and proved reservesof subsoil assets. Indeed, most of this section ofthe table, especially that for renewable natural re-sources, is shown with “n.a.” for “not available.”No value is available for the stock of unde-veloped land and its associated ecosystems, forunproved subsoil assets, and for uncultivated bi-ological resources (wild animals and fish, plants,and forests).
Compared with the accounting for provedreserves of nonrenewable resources, where theeconomic literature extends back over years,valuation methods and concepts for many of therenewable resources are less well developed. Re-newable natural resources are inherently moredifficult to value than nonrenewable natural re-sources for several reasons: Renewable resources,such as stocks or schools of wild fish, often havea commercial or production value as well as anamenity or a recreational value; often, ownershiprights cannot be established, and they cannot besold; and they are able to regenerate, so their usedoes not necessarily result in a net reduction ineither their yield or the value of their stock.
These difficulties notwithstanding, there hasbeen rapid progress in environmental-benefit val-uation for renewable natural resources in recentyears as economists have tried to keep pace withregulatory, legal, and policy needs for environ-mental damage and impact measures. Furtherwork by to translate these new concepts andmeasures into a consistent national frameworkwould need to rely heavily on the expertise ofother units within the U.S. Government—for ex-ample, the National Oceanic and AtmosphericAdministration, the Environmental ProtectionAgency, , and the Department of Interior.

• April
The does not recommend that the stock ofair—which is truly a global common—or waterbe valued; instead, it recommends that valuationbe limited to changes in these assets—their degra-dation and investments in their restoration. Forthese assets, table includes only aggregate val-ues for the degradation of air and water and forexpenditures to restore them or to prevent theirdegradation.
The estimates in table for degradation of airand water quality—as well as for undevelopedland—are simply place markers that assume thatmaintenance exactly offsets degradation: Theyare aggregate estimates of the total costs of pollu-tion of these media. The estimates for air, water,and undeveloped land pollution are estimates,from the Environmental Protection Agency, ofthe direct costs of public and private pollutioncontrol activities in the United States. Estimatesof air pollution include the annualized costs ofair pollution and radiation. Water pollution es-timates are the annualized costs of maintainingwater quality, including drinking water. Es-timates of undeveloped land pollution are theannualized costs associated with Superfund, toxicchemicals, and pesticides. The estimates of coststo restore or prevent the degradation of the en-vironment (which, as noted earlier, are treatedas capital formation in that they offset degrada-tion and depletion of air, water, and undevelopedland) are based on current expenditures andthe flow of services from the stock of equip-ment and structures (the estimated return onthe net stock plus depreciation). (Note thatthese direct costs differ from the environmentcleanup and waste disposal service costs discussedlater in the article. These costs are indirect costsimposed by pollution in the form of health costs,higher maintenance and repair expenditures, orlonger trips to reach clean recreational sites.)
Production accounts
The next step in integrating economic and envi-ronmental accounting is to combine the appro-priate flows from the asset account with the flowsin a production account. With this integration,the production account explicitly includes the useof natural resources and environmental servicesin production through entries for depletion anddegradation, and it explicitly includes the addi-tions to the stock of natural and environmentalassets through entries for investments that addto stocks of developed natural resources or thatrestore stocks of environmental assets.
Table combines features of the supply anduse tables in the . The table has fourquadrants (one empty, except for a total), whichare separated by double lines; a total column atthe far right; and a total row at the bottom. Theleft and right upper quadrants show the use ofgoods and services (commodities) named at thebeginning of the rows, summing to total uses asmeasured by total commodity output. The left-hand upper and lower quadrants show the use ofintermediate inputs and factors of production bythe industries named at the top of each column,summing to total supply as measured by totaloutput.
A more typical supply and use table wouldshow substantial industry and commoditydetail—often a hundred of more industries andcommodities. For the purposes at hand, this de-tail has been collapsed into an “other industries”column (column ) and “Other” rows (rows and ). Detail is provided where it is especiallyrelevant to the analysis of the environment. Sucha table provides a bird’s-eye view of production,income, and consumption, as highlighted in theparagraphs that follow.
Columns – in the upper left quadrant recordthe use of commodities by domestic industriesin the production of other commodities—thatis, intermediate use. Columns – record theuse of commodities across the final demand cat-egories that make up gross domestic product,including final consumption by households andgovernment. Column records the estimatesin the “capital formation” column from table .(The made assets are recorded in rows –, thedeveloped natural and environmental assets inrows –.)
In the left quadrants, rows – show the use ofother commodities (that is, other than assets) asintermediate inputs. These commodities consistof expenditures for environmental cleanup andwaste disposal services (row ) and “other” (row). Total intermediate inputs used by industriesare in row . Rows – record value added,or income. Rows – record the value added inthe form of compensation of employees, indirectbusiness taxes, and corporate profits and otherproperty income. Rows – record, from ta-ble , the use of made fixed assets, including thedepreciation of structures and equipment usedin environmental management (row ) and in (row ). Rows – record the use of fixednatural and environmental assets, with depletionand degradation of each of the eight categoriesof assets shown separately.

April •
The estimates presented in table are takenfrom table . As is indicated by the “n.a.”—not available—in the table, many valuation andmeasurement issues remain before an pro-duction account can be completed. Further,work toward filling in the estimates would pro-ceed in tandem with work on modernizing ’snational accounts in line with the (see thenext section). For example, treating expendi-tures on government structures, equipment, and
Table 2.—IE
RowAgricul-ture, for-
estry,and fish-
eries
Miniutilitwat
and sita
servi
(1) (2
COMMODITIES
Made ........................................................................................... 1 .............. ........Assets ..................................................................................... 2 .............. ........
Fixed assets ....................................................................... 3 .............. ........Environmental management .......................................... 4 .............. ........Pollution abatement and control ................................... 5 .............. .......Other .............................................................................. 6 .............. ........
Inventories .......................................................................... 7 .............. ........Government ................................................................... 8 .............. ........Nonfarm ......................................................................... 9 .............. ........Farm ............................................................................... 10 .............. ........
Other ....................................................................................... 11 (#)Environmental cleanup and waste disposal services ....... 12 n.a.Other ................................................................................... 13 n.a.
Natural and environmental assets ......................................... 14 .............. .......Fixed ....................................................................................... 15 .............. ........
Cultivated biological resources: Natural growth ................ 16 .............. .......Proved subsoil assets ........................................................ 17 .............. ........Developed land .................................................................. 18 .............. ........Uncultivated biological resources: Natural growth ............ 19 .............. .......Unproved subsoil assets .................................................... 20 .............. ........Undeveloped land .............................................................. 21 .............. ........Water .................................................................................. 22 .............. ........Air ....................................................................................... 23 .............. ........
Work-in-progress inventories (natural growth products) ....... 24 .............. .......
Total intermediate inputs ......................................................... 25 (#)
VALUE ADDED
Compensation of employees ...................................................... 26 (#)Indirect business taxes, etc ........................................................ 27 (#)Corporate profits and other property income ............................ 28 (#)
Depreciation of fixed made assets: Structures andequipment .............................................................................. 29 n.a.Environmental management ................................................... 30 n.a.Pollution abatement and control ............................................ 31 n.a.Other ....................................................................................... 32 n.a.
Depletion and degradation of fixed natural andenvironmental assets ........................................................... 33 n.a.Growth products: Fixed .......................................................... 34 n.a.Proved subsoil assets ............................................................ 35 n.a.Developed land ....................................................................... 36 n.a.Uncultivated biological resources .......................................... 37 n.a.Unproved subsoil assets ........................................................ 38 n.a.Undeveloped land ................................................................... 39 n.a.Water ...................................................................................... 40 n.a.Air ............................................................................................ 41 n.a.
Gross value added (GDP) (rows 26+27+28+29+33) ................ 42 n.a.Depreciation, depletion, and degradation (rows 29+33) ........... 43 n.a.Net value added (NDP) (rows 42–43) ....................................... 44 n.a.
TOTAL INDUSTRY OUTPUT ................................................ 45 (#)
n.a. Not available.# These estimates will depend on the integration of the System of National Accounts and the Syst
mental and Economic Accounting as part of the overall modernization of BEA’s economic accounts.
inventories as capital formation implements afeature of the . In the table, a “Z” indicatesthe estimates that would reflect both work towardthe ’s and -related changes.
In addition to a production account such astable , the calls for parallel quantity ta-bles. Further, because many environmental issueshave their primary impact on specific regions orindustries, the extension of the integrated na-tional accounts aggregates within ’s regional
ESA Production Account, 1987[Billions of dollars]
Industries Final uses (GDP)
Totalcom-
modityoutput(4+10)
ng,ies,er,an-
ryces
Otherindustries Total
Final consumption
Gross domesticcapital
formationExports Imports
GDP(5+6+7+
8−9)House-hold
Govern-ment
) (3) (4) (5) (6) (7) (8) (9) (10) (11)
...... ................ .......................... .............. .............. 905.8 .............. .............. (#) (#)
...... ................ .......................... .............. .............. 905.8 .............. .............. (#) (#)
...... ................ .......................... .............. .............. 875.8 .............. .............. (#) (#)
...... ................ .......................... .............. .............. 10.6 .............. .............. (#) (#)....... ................ .......................... .............. .............. 19.7 .............. .............. (#) (#)...... ................ .......................... .............. .............. 845.5 .............. .............. (#) (#)...... ................ .......................... .............. .............. 30.1 .............. .............. (#) (#)...... ................ .......................... .............. .............. 2.9 .............. .............. (#) (#)...... ................ .......................... .............. .............. 32.7 .............. .............. (#) (#)...... ................ .......................... .............. .............. −5.5 .............. .............. (#) (#)(#) (#) (#) (#) (#) .......................... (#) (#) (#) (#)
n.a. n.a. n.a. n.a. n.a. .......................... n.a. n.a. (#) (#)n.a. n.a. n.a. n.a. n.a. .......................... n.a. n.a. (#) (#)
....... ................ .......................... .............. .............. n.a. .............. .............. (#) (#)...... ................ .......................... .............. .............. n.a. .............. .............. (#) (#)....... ................ .......................... .............. .............. n.a. .............. .............. (#) (#)...... ................ .......................... .............. .............. 16.6 ↔ 64.6 .............. .............. (#) (#)...... ................ .......................... .............. .............. n.a. .............. .............. (#) (#)....... ................ .......................... .............. .............. n.a. .............. .............. (#) (#)...... ................ .......................... .............. .............. n.a. .............. .............. (#) (#)...... ................ .......................... .............. .............. 19.9 .............. .............. (#) (#)...... ................ .......................... .............. .............. 38.7 .............. .............. (#) (#)...... ................ .......................... .............. .............. 27.1 .............. .............. (#) (#)....... ................ .......................... .............. .............. n.a. .............. .............. (#) (#)
(#) (#) (#) .............. .............. .......................... .............. .............. .............. ..............
(#) (#) (#) .............. .............. .......................... .............. .............. .............. (#)(#) (#) (#) .............. .............. .......................... .............. .............. .............. (#)(#) (#) (#) .............. .............. .......................... .............. .............. .............. (#)
n.a. n.a. −607.9 .............. .............. .......................... .............. .............. .............. (#)n.a. n.a. −7.0 .............. .............. .......................... .............. .............. .............. (#)n.a. n.a. −12.2 .............. .............. .......................... .............. .............. .............. (#)n.a. n.a. −588.7 .............. .............. .......................... .............. .............. .............. (#)
n.a. n.a. n.a. .............. .............. .......................... .............. .............. .............. (#)n.a. n.a. n.a. .............. .............. .......................... .............. .............. .............. (#)n.a. n.a. −16.7 ↔ −61.6 .............. .............. .......................... .............. .............. .............. (#)n.a. n.a. n.a. .............. .............. .......................... .............. .............. .............. (#)n.a. n.a. n.a. .............. .............. .......................... .............. .............. .............. (#)n.a. n.a. n.a. .............. .............. .......................... .............. .............. .............. (#)n.a. n.a. −19.9 .............. .............. .......................... .............. .............. .............. (#)n.a. n.a. −38.7 .............. .............. .......................... .............. .............. .............. (#)n.a. n.a. −27.1 .............. .............. .......................... .............. .............. .............. (#)
n.a. n.a. n.a. .............. .............. .......................... .............. .............. (#) (#)n.a. n.a. n.a. .............. .............. .......................... .............. .............. .............. (#)n.a. n.a. n.a. .............. .............. .......................... .............. .............. .............. (#)
(#) (#) (#) (#) (#) (#) (#) (#) (#) (#)
em of Environ-NOTE.—Leaders indicate that an entry is not applicable.GDP Gross domestic productNDP Net domestic product
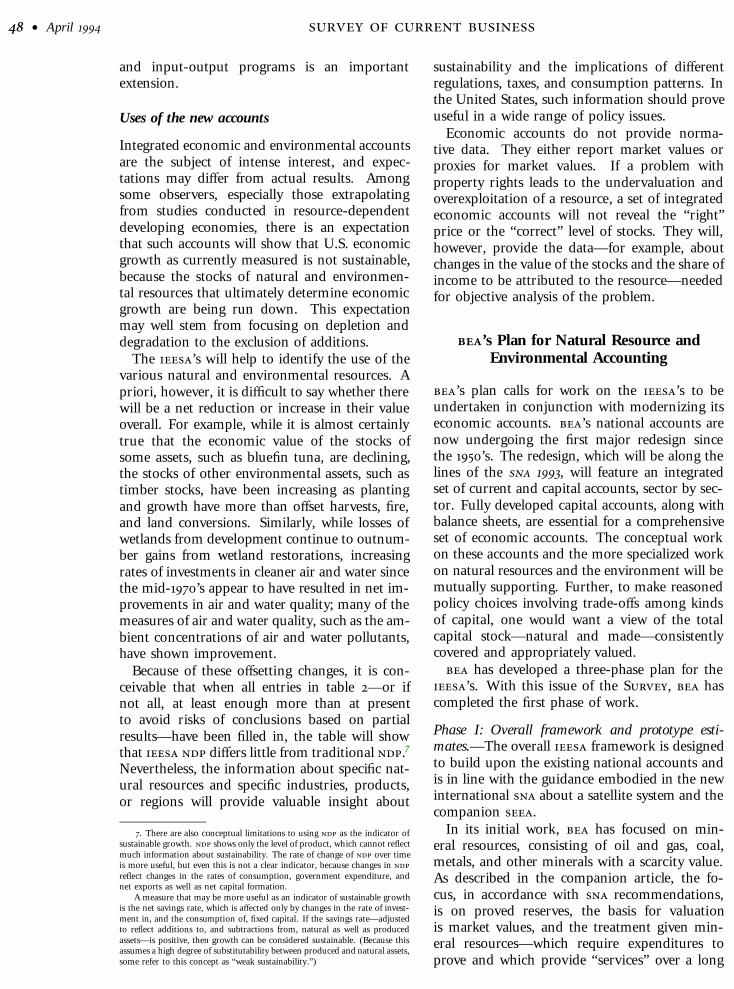
• April
and input-output programs is an importantextension.
Uses of the new accounts
Integrated economic and environmental accountsare the subject of intense interest, and expec-tations may differ from actual results. Amongsome observers, especially those extrapolatingfrom studies conducted in resource-dependentdeveloping economies, there is an expectationthat such accounts will show that U.S. economicgrowth as currently measured is not sustainable,because the stocks of natural and environmen-tal resources that ultimately determine economicgrowth are being run down. This expectationmay well stem from focusing on depletion anddegradation to the exclusion of additions.
The ’s will help to identify the use of thevarious natural and environmental resources. Apriori, however, it is difficult to say whether therewill be a net reduction or increase in their valueoverall. For example, while it is almost certainlytrue that the economic value of the stocks ofsome assets, such as bluefin tuna, are declining,the stocks of other environmental assets, such astimber stocks, have been increasing as plantingand growth have more than offset harvests, fire,and land conversions. Similarly, while losses ofwetlands from development continue to outnum-ber gains from wetland restorations, increasingrates of investments in cleaner air and water sincethe mid-’s appear to have resulted in net im-provements in air and water quality; many of themeasures of air and water quality, such as the am-bient concentrations of air and water pollutants,have shown improvement.
Because of these offsetting changes, it is con-ceivable that when all entries in table —or ifnot all, at least enough more than at presentto avoid risks of conclusions based on partialresults—have been filled in, the table will showthat differs little from traditional .
Nevertheless, the information about specific nat-ural resources and specific industries, products,or regions will provide valuable insight about
. There are also conceptual limitations to using as the indicator ofsustainable growth. shows only the level of product, which cannot reflectmuch information about sustainability. The rate of change of over timeis more useful, but even this is not a clear indicator, because changes in reflect changes in the rates of consumption, government expenditure, andnet exports as well as net capital formation.
A measure that may be more useful as an indicator of sustainable growthis the net savings rate, which is affected only by changes in the rate of invest-ment in, and the consumption of, fixed capital. If the savings rate—adjustedto reflect additions to, and subtractions from, natural as well as producedassets—is positive, then growth can be considered sustainable. (Because thisassumes a high degree of substitutability between produced and natural assets,some refer to this concept as “weak sustainability.”)
sustainability and the implications of differentregulations, taxes, and consumption patterns. Inthe United States, such information should proveuseful in a wide range of policy issues.
Economic accounts do not provide norma-tive data. They either report market values orproxies for market values. If a problem withproperty rights leads to the undervaluation andoverexploitation of a resource, a set of integratedeconomic accounts will not reveal the “right”price or the “correct” level of stocks. They will,however, provide the data—for example, aboutchanges in the value of the stocks and the share ofincome to be attributed to the resource—neededfor objective analysis of the problem.
’s Plan for Natural Resource andEnvironmental Accounting
’s plan calls for work on the ’s to beundertaken in conjunction with modernizing itseconomic accounts. ’s national accounts arenow undergoing the first major redesign sincethe ’s. The redesign, which will be along thelines of the , will feature an integratedset of current and capital accounts, sector by sec-tor. Fully developed capital accounts, along withbalance sheets, are essential for a comprehensiveset of economic accounts. The conceptual workon these accounts and the more specialized workon natural resources and the environment will bemutually supporting. Further, to make reasonedpolicy choices involving trade-offs among kindsof capital, one would want a view of the totalcapital stock—natural and made—consistentlycovered and appropriately valued.
has developed a three-phase plan for the’s. With this issue of the S, hascompleted the first phase of work.
Phase I: Overall framework and prototype esti-mates.—The overall framework is designedto build upon the existing national accounts andis in line with the guidance embodied in the newinternational about a satellite system and thecompanion .
In its initial work, has focused on min-eral resources, consisting of oil and gas, coal,metals, and other minerals with a scarcity value.As described in the companion article, the fo-cus, in accordance with recommendations,is on proved reserves, the basis for valuationis market values, and the treatment given min-eral resources—which require expenditures toprove and which provide “services” over a long
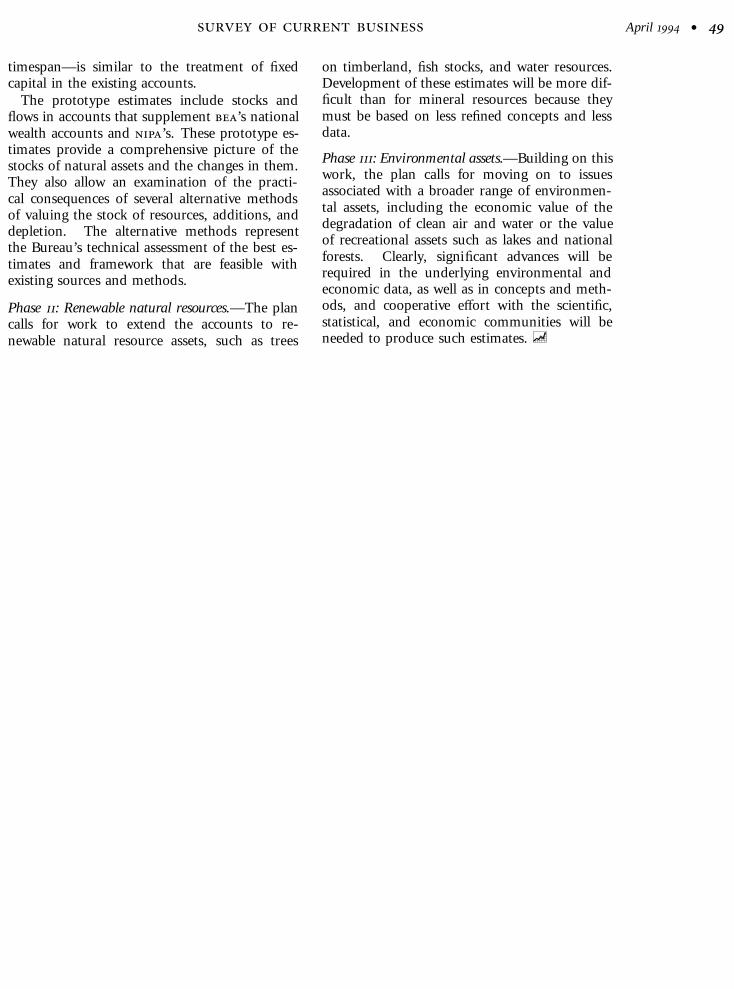
April •
timespan—is similar to the treatment of fixedcapital in the existing accounts.
The prototype estimates include stocks andflows in accounts that supplement ’s nationalwealth accounts and ’s. These prototype es-timates provide a comprehensive picture of thestocks of natural assets and the changes in them.They also allow an examination of the practi-cal consequences of several alternative methodsof valuing the stock of resources, additions, anddepletion. The alternative methods representthe Bureau’s technical assessment of the best es-timates and framework that are feasible withexisting sources and methods.
Phase : Renewable natural resources.—The plancalls for work to extend the accounts to re-newable natural resource assets, such as trees
on timberland, fish stocks, and water resources.Development of these estimates will be more dif-ficult than for mineral resources because theymust be based on less refined concepts and lessdata.
Phase : Environmental assets.—Building on thiswork, the plan calls for moving on to issuesassociated with a broader range of environmen-tal assets, including the economic value of thedegradation of clean air and water or the valueof recreational assets such as lakes and nationalforests. Clearly, significant advances will berequired in the underlying environmental andeconomic data, as well as in concepts and meth-ods, and cooperative effort with the scientific,statistical, and economic communities will beneeded to produce such estimates.