Embed Size (px)
Citation preview

2020 Annual Report
1 / 246
Company Code:600438 Abbreviation: Tongwei Co., Ltd.
Tongwei Co., Ltd.
2020 Annual Report
April 13, 2021

2020 Annual Report
2 / 246
Important Notes
I. The Board of Directors and Board of Supervisors, as well as directors and the management of
the Company guarantee that the present Annual Report is true, accurate and complete in
contents without false record, misleading statement or major omission, and undertake the
individual and joint legal responsibilities therefore.
II. All directors of the Company attended the board meeting.
III. Sichuan Huaxin (Group) CPA Firm (Special General Partnership) has provided a standard and
unqualified audit report.
IV. Xie Yi, head of the Company, Zhou Bin, the person in charge of accounting work, and Lei
Jiaowen, the person in charge of the accounting firm (accountant in charge) announce to
guarantee the truth, accuracy and integrity of financial reports in the Annual Report.
V. Profit Distribution Plan or Capital Reserves Share Capitalization Plan for the reporting period,
reviewed by the Board of Directors
According to the capital and investment situation of the Company in 2021, based on the current
general capital 4,501,548,184 shares of the Company, a cash dividend of RMB 2.41 for every 10 shares
(including tax) is distributed to all shareholders of the Company, and the total cash dividend is RMB
1,084,873,112.34 yuan. The plan has been reviewed and approved at the eighteenth meeting of the seventh
board of directors of the Company, and needs to be submitted to the shareholders meeting of the Company
for review and approval.
VI. Risk statement of forward-looking statements
√Applicable □Inapplicable
The forward-looking statements of the Company regarding its future development strategies and
business plans do not constitute any substantial commitment of the Company to investors; and the
investors should pay attention to risks.
VII. Is any capital occupied by a controlled shareholder or its related parties for non-operating
purpose?
No
VIII. Is there any external guarantee that violates the prescribed decision-making procedures?
No
IX. Whether more than half of the directors cannot guarantee the authenticity, accuracy and
completeness of the annual report disclosed by the Company?
No X. Major risk warning
The Company had already elaborated possible risks in this Report. Please refer to the contents about
the possible risks and countermeasures included in the discussion and analysis of the Company's future
development in Section IV Discussion and Analysis on Operation.
XI. Others
□Applicable √Inapplicable
*The 2020 Annual Report of Tongwei Co., Ltd. was published both in Chinese and English. Where any discrepancy arises between the English translation and the
original Chinese version, the Chinese version shall prevail. The English version here was only used for investors’ reference.

2020 Annual Report
3 / 246
Table of Contents
Section I Definition ............................................................................................................................ 4
Section II Company Profile and Major Financial Indexes.............................................................. 5
Section III Summany on Company Business ..................................................................................... 9
Section IV Discussion and Analysis on Operation........................................................................... 14
Section V Important Matters .......................................................................................................... 40
SectionVI Changes in Common Stock Equity and Shareholders ................................................. 70
SectionVII Preferred Shares .............................................................................................................. 82
SectionVIII Conditions on Directors, Supervisors and Senior Management and Staff ................. 83
Section IX Company Governance .................................................................................................... 90
Section X Information on Company Bonds ................................................................................... 92
Section XI Financial Report .............................................................................................................. 93
Section XII List of Documents Available for Inspection……………………………………….…246

2020 Annual Report
4 / 246
Section I Definition
I. Definition
Unless otherwise required, the following terms shall have the following meanings in this report:
Definition of common terms
Tongwei Co., Ltd.,
Company, the Company refers to Tongwei Co., Ltd.
Tongwei Co., Ltd. refers to Tongwei Co., Ltd.
Yongxiang refers to Sichuan Yongxiang Co., Ltd.
Yongxiang Polysilicon refers to Sichuan Yongxiang Polysilicon Co., Ltd.
Yongxiang New Energy refers to Sichuan Yongxiang New Energy Co., Ltd.
Inner Mongolia Tongwei refers to Inner Mongolia Tongwei High-purity Crystalline Silicon
Co., Ltd.
Yunnan Tongwei refers to Yunnan Tongwei High- purity Crystalline Silicon Co., Ltd.
Tongwei New Energy refers to Tongwei New Energy Co., Ltd.
Tongwei Solar (Hefei) refers to Tongwei Solar (Hefei) Co., Ltd.
Tongwei Solar (Anhui) refers to Tongwei Solar (Anhui) Co., Ltd.
Tongwei Solar (Chengdu) refers to Tongwei Solar (Chengdu) Co., Ltd.
Tongwei Solar (Meishan) refers to Tongwei Solar (Meishan) Co., Ltd.
Tongyu Property refers to Chengdu Tongyu Property Co., Ltd.
Leshan Phase-II
50,000MT High-purity
Polysilicon Project
refers to Technical improvement project for PV silicon material
(Phase-II high-purity polysilicon project)
Baoshan Phase-I
50,000MT High-purity
Polysilicon Project
refers to High-purity polysilicon green energy project (Phase-I
50,000MT high-purity polysilicon project)
Baotou Phase-II
50,000MT High-purity
Polysilicon Project
refers to Manufacturing project of PV silicon material (Phase-II
50,000MT high-purity polysilicon project)
Meishan Phase-I 7.5GW
High-efficiency Solar
Cell Project
refers to The Phase-I application project of domestic intelligent
equipment (system) with an annual capacity of 7.5GW high-
efficiency crystalline silicon solar cells
Meishan Phase-II 7.5GW
High-efficiency Solar
Cell Project
refers to Smart factory project with an annual capacity of 7.5GW
high-efficiency crystalline silicon solar cells (Meishan
Phase-II)
Jintang Phase-I 7.5GW
High-efficiency Solar
Cell Project
refers to Smart interconnected factory project with an annual capacity
of 7.5GW high-efficiency crystalline silicon solar cells
((Jintang Phase-I)
Leshan Monocrystalline
Ingots Cutting Project
refers to 15GW monocrystalline ingots cutting project
Tongwei Media refers to Chengdu Tongwei Culture Media Co., Ltd.
China Securities
Regulatory
Commission/CSRC
refers to
China Securities Regulatory Commission
Shanghai Stock
Exchange
refers to Shanghai Stock Exchange
Designated information
disclosure media
refers to China Securities Journal, Shanghai Securities Journal,
Securities Daily, Securities Times
LONGi refers to Xi'an Longi Green Energy Technology Co., Ltd.
Zhonghuan refers to Tianjin Zhonghuan Semiconductor Co., Ltd.
Trina Solar refers to Trina Solar Co., Ltd.
Jinko Solar refers to Jinko Solar Co., Ltd.
Sichuan Jinko refers to Sichuan Jinko Solar Co., Ltd.
Metco Silicon Energy refers to Baotou Metco Silicon Energy Co., Ltd.
Sichuan Huaxin refers to Sichuan Huaxin (Group) CPA Firm (Special General

2020 Annual Report
5 / 246
Partnership)
Conversion efficiency refers to Measure the ability of solar cells to convert light energy into
electrical energy
Convertible bond refers to Convertible corporate bond
W refers to Watt, the unit of power
KW, MW, GW refers to Power unit, 1KW=1000W, 1MW=1000KW,
1GW=1000MW
High-purity polysilicon refers to High-purity metal silicon with purity greater than
99.9999999%.
166mm cell
refers to The cell produced with M6 silicon wafer (with a length of
166mm) with area 12.21% larger than that of conventional
M2 silicon wafer (with a length of 156.75mm).
210mm cell
refers to The cell produced with M12 silicon wafer (with a length of
210mm) with area 80.5% larger than that of conventional M2
silicon wafer (with a length of 156.75mm).
PERC cell
refers to Passivated Emitter and Rear Contact, a high-efficiency
crystalline silicon solar cell structure, where a passivation
layer forms on the back surface of AL2O3 film or SiNX to
deal with the high carrier recombination on the back surface
of all aluminum back surface field solar cell, and then the
film will be opened to make the aluminum back surface field
effectively contact with the silicon substrate.
TOPCON cell technology
refers to Tunnel Oxide Passivated Contact, where an ultra-thin tunnel oxide and a heavily doped polysilicon thin film are prepared on the surface of the cell to form a passivation contact structure, thus increasing the open-circuit voltage and short-circuit current of the cell and then improving the photoelectric conversion efficiency rate of the cell.
HJT cell technology
refers to Hetero-junction with Intrinsic Thin-layer, a high-efficiency
crystalline silicon solar cell structure, a hybrid solar cell
made of crystalline silicon substrate and amorphous silicon
thin film, i.e. adding a non-doped (intrinsic) hydrogenated
amorphous silicon thin film between P-type hydrogenated
amorphous silicon and N-type hydrogenated amorphous
silicon and N-type silicon substrate. HJT cell has the
advantages of low process temperature, good passivation
effect, high open-circuit voltage, double-sided power
generation, etc.
CTM value
refers to The percentage of the total output power of the module to the
cell power shows the degree of module power loss. The
higher CTM value shows the smaller degree of module
package power loss.
Reporting period refers to From January 1, 2020 to December 31, 2020
CPIA refers to China Photovoltaic Industry Association
IRENA refers to International Renewable Energy Agency
Section II Company Profile and Major Financial Indexes
I. Company Information
Chinese name 通威股份有限公司
Abbreviation of Chinese name 通威股份
English name TONGWEI CO., LTD.
Abbreviation of English name TONGWEI CO., LTD.
Legal representative Xie Yi

2020 Annual Report
6 / 246
II. Contact and Contact Information
Secretary of the Board of Directors Representative of Securities Affairs
Name Yan Ke Li Huayu
Address
Tongwei International Center (TIC), No.
588, Middle Section Tianfu Avenue,
High-Tech Zone, Chengdu
Tongwei International Center (TIC), No.
588, Middle Section Tianfu Avenue, High-
Tech Zone, Chengdu
Tel: 028-86168552 028-86168553
Fax 028-85199999 028-85199999
Email [email protected] [email protected]
III. Basic Information
Registered address No. 588, Middle Section Tianfu Avenue, High-Tech Zone, Chengdu
Postal code 610041
Business address No. 588, Middle Section Tianfu Avenue, High-Tech Zone, Chengdu
Postal code 610041
Website http://www.tongwei.com.cn
Email [email protected]
IV. Information Disclosure and Location
Information disclosure media designated by the
Company
China Securities Journal, Shanghai Securities News,
Securities Daily, Securities Times
Website designated by CSRC for publishing
annual report www.sse.com.cn
Place of preparing annual report Securities Department of the Company
V. Stock Information
Stock information
Type Stock exchange Stock abbreviation Stock code Stock abbreviation
before change
A-shares Shanghai Stock
Exchange
Tongwei Co., Ltd.
600438
VI. Other information
Accounting Firm
engaged by the
Company (domestic)
Name Sichuan Huaxin (Group) CPA Firm (Special General
Partnership)
Business address 28th Floor, Jinmao Lidu South, No. 18, Ximianqiao
Street, Chengdu
Name of the
accountants with
signature
Feng Yuan, He Shoufu, Gou Jing
Sponsor institutions
that perform
continuous
supervision duties
during the reporting
period
Name China Securities Co., Ltd.
Business address Building B and E, Kaiheng Center, No. 2 Chaonei
Street, Dongcheng District, Beijing
Name of sponsor
representatives with
signature
Pu Fei, Liu Bo
Period of continuous
supervision
Continuous supervision period of convertible bonds:
from March 18, 2019 to December 31, 2020
Sponsor institutions that perform
continuous
Name China Securities Co., Ltd.
Business address Building B and E, Kaiheng Center, No. 2 Chaonei
Street, Dongcheng District, Beijing

2020 Annual Report
7 / 246
supervision duties
during the reporting
period
Name of sponsor
representatives with
signature
Li Puhai, Pu Fei
Period of continuous
supervision
Continuous supervision period of non-public offering:
from December 10, 2020 to December 31, 2021
VII. Major Accounting Data and Financial Indexes in the Recent Three Years
(I) Major accounting data
Unit: Yuan Currency: RMB
Major accounting
data 2020 2019
Increase/decrease
in this period
over last year
(%)
2018
Operating
revenue 44,200,270,334.23 37,555,118,255.70 17.69 27,535,170,274.25
Net profit
attributable to
shareholders of
the listed
company
3,607,923,359.56 2,634,568,828.17 36.95 2,018,746,008.65
Net profit net of
non-recurring
gains and losses
attributable to
shareholders of
the listed
company
2,408,554,229.37 2,314,484,711.22 4.06 1,909,390,964.39
Net cash flow
from operation
activities
3,024,927,931.94 2,357,465,207.68 28.31 3,099,620,044.15
At the end of 2020 End of 2019
Increase/
decrease at the
end of this period
over last year
(%)
At the end of 2018
Net assets
attributable to
shareholders of
the listed
company
30,541,405,029.73 17,577,046,993.09 73.76 14,737,718,118.23
Total assets 64,251,948,070.91 46,820,950,745.60 37.23 38,483,631,552.68
(II) Major financial indexes
Major financial indicators 2020 2019
Increase/decrease in
this period over last
year (%)
2018
Basic earnings per share
(yuan/share) 0.8581 0.6786 26.45 0.5200
Diluted earnings per share
(yuan/share) 0.8466 0.6558 29.09 0.5200
Basic earnings per share net of
non-recurring gains and
losses(yuan/share)
0.5729 0.5961 -3.89 0.4918

2020 Annual Report
8 / 246
Weighted average return on equity
(%) 16.13 16.14 reduce by 0.01ppt 14.43
Weighted average return on equity
net of non-recurring gains and
losses(%)
10.77 14.18 reduce by 3.41 ppt 13.65
Explanation on major accounting data and financial indexes in the last three years at the end of reporting
period
□ Applicable √Inapplicable
VIII. Differences in accounting data under the accounting standards both at home and abroad
(I) Difference in net profit and the net assets attributable to shareholders of the listed company
in the Financial Reports disclosed simultaneously according to the International Accounting
Standard and China Accounting Standard
□ Applicable √Inapplicable
(II) Difference in net profit and the net assets attributable to shareholders of the listed company
in the Financial Reports disclosed simultaneously according to foreign accounting standard
and China Accounting Standard
□ Applicable √Inapplicable
(III) Explanation of differences between foreign and domestic accounting standards:
□ Applicable √Inapplicable
IX. 2020 Major Financial Data in Quarters
Unit: Yuan Currency: RMB
1st Quarter (January -
March) 2nd Quarter (April - June)
3rd Quarter (July - September)
4th Quarter (October - December)
Operating revenue 7,825,137,178.03 10,913,464,753.53 12,939,507,273.67
12,522,161,129.0
0
Net profit attributable to shareholders of the listed company
344,466,430.76 665,992,893.50 2,322,106,738.43 275,357,296.87
Net profit net of non-recurring profit and loss attributable to shareholders of the listed company
316,119,847.57 642,933,054.92 953,578,016.12 495,923,310.76
Net cash flow from operating activities
434,113,263.66 582,042,704.85 1,022,333,994.49 986,437,968.94
Explanation on differences between quarterly data and previously disclosed accounting period data
□Applicable √Inpplicable
X. Item and Amount of Non-Recurring Profit and Loss
√Applicable □ Inapplicable
Unit: Yuan Currency: RMB
Non-recurring profit and loss items Amount in 2020 Note (if
applicable)
Amount in
2019
Amount in
2018
Profit and loss on disposal of non-
current assets 1,541,869,733.03 149,118,467.74 47,863,656.09
Government subsidies included in
current profit and loss, but except the
government subsidies closely related
to the normal operating businesses of
the Company, complying with
stipulations of national policies and
continuously enjoyed rationally or
296,657,874.92 204,753,562.81 79,650,132.05

2020 Annual Report
9 / 246
quantitatively based on a certain
standard
Profit or loss from debt restructuring -1,162,174.00
Net current profit and loss of the
subsidiaries acquired in business
combination involving entities under
common control from the beginning of
the period to the combination date
-1,555,296.53
In addition to the effective hedging
business related to the normal business
operations of the Company, the fair
value gains and losses arising from
holding transactional financial assets,
derivative financial assets,
transactional financial liabilities, and
derivative financial liabilities, as well
as the investment income from the
disposal of transactional financial
assets, derivative financial from assets,
transactional financial liabilities,
derivative financial liabilities and
other debt investments;
14,385,110.27
Non-operating income and expenses
other than aforementioned items -439,396,332.17 29,661,420.53 5,130,754.97
Affected amount of minority equity -4,655,892.34 -1,687,142.53 -1,470,212.96
Affected amount of the income tax -209,491,363.52 -60,600,017.60 -20,263,989.36
Total 1,199,369,130.19 320,084,116.95 109,355,044.26
XI. Items measured by fair values
□ Applicable √Inapplicable
XII. Others
□ Applicable √Inapplicable
Section III Summary on Company Business
I. Explanation of the main business, business model and industry situation that the Company is
engaged in during the reporting period
Adhering to the corporate vision of "For Better Life" and the corporate purpose of "Striving for
Excellence, Contributing to Society", the Company mainly focuses on agriculture and new energy, thus
forming a business model of "Agriculture (fishery) + PV" integration and collaborative development. Its
main business and position in the industrial chain are shown in the figure below:

2020 Annual Report
10 / 246
Note: Core businesses of the Company are in the dashed boxes
In agriculture segment, the major business of the Company is the research and development,
production and sales of aquatic feed, livestock feed and other products. Among them, aquatic feed has
always been the core product of the Company and the main profit source of the Company in agriculture
and animal husbandry segment. As of the end of the reporting period, the Company owns more than 70
subsidiaries involved in feed business with a business model of adopting on-site production and
establishing a peripheral sales coverage, while providing effective technical, financial and other
supporting services to farmers. The production and sales network of the Company has covered the most
parts of China and Southeast Asian countries such as Vietnam, Bangladesh, and Indonesia.
In new energy segment, the Company focuses on the research, production, and sales of high-purity
polysilicon and solar cells, and is committed to the investment, construction and operation and
maintenance of the "Fishery& PV Integration" powerplant. As of the end of the reporting period, the
Company has formed an annual capacity of 80,000MT of high-purity polysilicon, and an annual capacity
of 27.5GW of solar cells, of which the annual capacity of monocrystalline cells is 24.5GW.
On the comprehensive application, the Company focuses on the development and construction of
large-scale "Fishery& PV Integration" bases, and strives to create a model with core competitive
advantages of ecological farming + green energy, strengthens the coordinated development of industries,
explores new aquaculture models by selecting high-quality water resources and on the premise of ensuring
power consumption conditions, continuously promotes the large-scale, professional and intelligent
development of the "Fishery& PV Integration ", and brings new profit for companies, farmers and other
partners.
II. Explanation of Major Changes in the Company’s Principal Assets in the Reporting Period
√Applicable □Inapplicable
Item name December 31, 2020 December 31, 2019 Year-on-year
change amount
Change
proportion
(%)
Cash at bank and
on hand 6,264,168,242.03 2,692,681,748.77 3,571,486,493.26 132.64
Receivables
financing 9,711,898,567.92 4,392,541,416.88 5,319,357,151.04 121.10
Prepayments 1,113,458,878.37 389,875,898.15 723,582,980.22 185.59
Long-term prepaid
expenses 835,269,963.57 607,333,082.04 227,936,881.53 37.53
Aquatic seedlings
Livestock babies
Agricultural industrial chain
Aquatic feed
Livestock feed
Aquatic husbandry
Livestock husbandry
Aquatic processing
Livestock processing
Aquatic husbandry
PV new energy industrial chain
Polysilicon
Monocrystalline
silicon rods
Multicrystalline
silicon ingots
Monocrystalline
silicon wafer
Multicrystalline
silicon wafer
Monocrystalline
cell
Multicrystalline cell
Monocrystalline
module
Multicrystalline
module
PV powerplant
PV power
generation
Fishery& PV Integration

2020 Annual Report
11 / 246
Deferred tax assets 415,550,864.14 244,903,723.68 170,647,140.46 69.68
Other non-current
assets 1,547,022,743.45 1,056,166,007.39 490,856,736.06 46.48
The increased cash at bank and on hand is mainly due to the non-public offering of the Company and
the received raised funds;
The increased receivables financing is mainly due to the bill pool business of the Company, and the
increased bank acceptance bills into the pool with the expansion of the business scale;
The increased prepayments are mainly due to the expansion of the business scale of the Company,
and the increased prepayments for electricity and raw material purchase;
The increased long-term prepaid expenses are mainly due to the expansion of the business scale of
the Company and the increased water surface lease fees;
The increased prepaid income tax assets are mainly due to the provision of asset impairment loss,
and the prepaid income tax assets confirmed by the corresponding tax difference;
Other increased non-current assets are mainly due to the increased new projects of the Company and
the increased prepayments for engineering equipment.
Among them: overseas assets 1,173,166,229.60 (unit: yuan currency: RMB), accounting for 1.83%
of total assets.
III. Core Competitiveness Analysis in the Reporting Period
√Applicable □Inapplicable
(I) Clear strategic planning and positioning
The Company, on the one hand, focuses on technological innovation and intelligent manufacturing
in the main components of the PV industry, and promotes the large-scale application of clean energy, and
on the other hand, is committed to creating a green healthy aquatic product industrial chain to meet
people’s consumption demands for safe food, and makes every effort to provide the public with high-
quality products in all industries closely related to human life and continuously improve the quality of
human life.
Based on the above strategic positioning, the long-term development goal of the Company is "a
world-class safe food supplier and a world-class clean energy operator", and the short-medium-term
development plan is "to build and consolidate the leading position of global high-purity polysilicon, solar
cells and aquatic feed."
(II) Leading technical research and development capabilities
Regarding science and technology as the primary productive force, the Company attaches great
importance to technology research and development. For each business segment, it has built a scientific
research team led by experts, and has increased the investment in technology research and development.
As a result, the Company has achieved great achievements in scientific research over the years, which has
created value for the Company.
(1) Agriculture and animal husbandry segment
The technology center of the Company is a national-level enterprise technology center jointly
affirmed by five ministries and commissions including the National Development and Reform
Commission and the Ministry of Science and Technology. After years of construction and operation, the
technical center has established a complete organizational structure and operating mechanism of scientific
research and innovation, which specializes in animal nutrition and feed, animal breeding and cultivation,
animal health, automated breeding facility project, aquatic and livestock products processing, and other
research and technology integration related to the biotechnology; and the important technical support is
provided for the Company's development by transforming innovative research results into actual
productivity. The aquatic product research institute, special aquatic product research institute, livestock
research institute, animal health research institute, facility fishery engineering research institute, aquatic
product engineering center, testing center and other scientific research institutions are set under the
technology center; the innovative research is guided effectively, the innovation goals are clarified, the
innovation tasks are refined to ensure innovation results.
During the reporting period, the technology center increased R&D investment in the quality control
and quality improvement of intelligent breeding, used advanced domestic and foreign equipment,
promoted the construction of bases, and enhanced the core competitiveness of the Company in the field
of aquaculture and intelligent breeding; and an open experimental research and service platform is provided in the industry. As of the end of the reporting period, the Company had applied for 699 patents

2020 Annual Report
12 / 246
and obtained 506 authorized patents. The Company is approved to establish a testing method
standardization working group of the National Feed Industry Standardization Technical Committee, and
it indicates that the Company has taken an important step on the road to participate in the national
standardization work actively. At the same time, the Company presided over the revision of Determination of Isothiocyanate in Feed, Determination of Oxazolidine Thione in Feed and the two industry standards
Turbot Formula Feed, Determination of Unsaponifiable Matter in Feed Ingredients- n-hexane Extraction
Method has been officially released and implemented, and the two industry standards of Procambarus Clarkii Formula Feed and Tanghead Bream Formula Feed have passed preliminary review; and other
nine national standards and five industry standards that the Company presided over or participated in the
formulation and revision are under study and formulation. In addition, the group standard of General Technical Specification for the Integration of Fishery and PV, which was initiated by the China Fishery
Association and formulated by the Company, has been formally implemented in January 2021.
For a long time, the Company has established a young, high-quality scientific and technological
innovation team, which continuously consolidates the Company's scientific research capabilities and
continuously improves product competitiveness under the lead of the experts with special government
allowances from the State Council.
(2) PV new energy segment
To further strengthen independent research and development capabilities, grasp future development
opportunities in core technologies, products and application fields, continue to strengthen the Company's
core competitiveness, and ensure the sustainable and healthy development, the Company has established
a PV technology center based on the original scientific research system of various PV business segments,
and set up a scientific research and technical team mainly composed of well-known experts in the industry,
promoted the technology research and development and technology integration in all links of the PV
industrial chain, and focused on the cross-segment link and integration work of new technologies and new
products (such as TOPCON, HJT) during the mass production process, deepened the university-industry
cooperation with domestic and foreign universities, research institutes and other scientific research
institutions, and strengthened the follow-up, research and development of cross-generation technology
and cutting-edge technology of the industry (including HBC, perovskite, laminated cell/module, PV +
storage Technology).
In terms of high-purity polysilicon, after years of development, the Company has formed a number
of achievements with independent intellectual property rights in the core technology fields of cold
hydrogenation, large-scale energy-saving rectification, high-efficiency reduction, tail gas recovery,
trichlorosilane synthesis and anti-disproportionation. It is at an advanced level in the industry, the
proportion of mono-grade in the current products has reached more than 98%, and the batch supply of N-
type materials can be realized, and the situation that domestic high-quality silicon materials still need to
be partly imported is effectively alleviated. As of the end of the reporting period, Yongxiang has applied
for 365 patents and obtained 222 authorized patents.
In terms of solar cells, the Company has formed a number of technological achievements with
independent intellectual property rights in the core technology fields of atomic layer deposition back
passivation, selective emitter technology, double-sided cells, multi-grid, HJT cells, and high-efficiency
modules. On the one hand, the Company focuses on the current mainstream PERC technology, and
improves and optimizes the technology by superimposing other process technologies (such as multi-grid,
high-resistance dense grid, alkali polishing, TOPCON, etc.) to improve conversion efficiency and reduce
production cost. On the other hand, the Company continues to increase the investment in tracking and
research and development of new cell technologies. The HJT cell R&D production line of the Company
was officially put into operation in June 2019. After continuous R&D and improvement, the current
maximum conversion efficiency of HJT cell has reached 25.18%. At the same time, the Company will
build a 1GW HJT pilot line to further improve equipment selection, optimize process technology and
improve product cost-effectiveness based on the research and development production lines.
(III) Scale and cost advantage
(1) Agriculture and animal husbandry segment
The Company is a national key leading enterprise in the industrialization of agriculture. At present,
the business covers China and Southeast Asia with the annual feed capacity is more than 10 million tons.
It is the leading aquatic feed and important livestock feed manufacturer in the world. It has intensive
advantages in raw material purchasing, production organization and market expansion.
(2) PV new energy segment

2020 Annual Report
13 / 246
The Company has formed an annual capacity of 80,000MT of high-purity polysilicon, and the annual
capacity under construction exceeds 150,000MT. Various consumption indicators and costs have been
continuously reduced. The average cost of Leshan Phase-I and Baotou Phase-I was reduced to
36,300yuan/MT in 2020. With the continuous improvement of technical processes and the continuous
expansion of capacity, the cost level will be further optimized after the projects under construction of the
Company reach the target capacity.
In terms of solar cells, with the production of the 7.5GW 21X large-size cell project of Meishan
Phase-I in 2020, as of the end of the reporting period, the annual solar cell capacity of the Company has
reached 27.5GW, and the non-silicon cost of monocrystalline PERC cell products has reached within 0.2
yuan/w. As the large-scale projects in Meishan and Jintang are put into production one after another, it is
estimated that the annual solar cell capacity of the Company will exceed 55GW by the end of 2021, the
size structure will be further optimized, and the cost advantage will be further improved.
(IV) Quality and brand advantages
(1) Agriculture and animal husbandry segment
Since the establishment in 1992, the Company has formed a series of formula feeds that can meet the
needs of various aquatic animals through continuous R&D and improvement. After years of market
verification, the feed quality and market services of the Company have been highly recognized by farmers
and have become one of the iconic brands in the domestic aquatic feed industry. At the same time, the
Company has made great efforts to build a well-known fresh fish brand "Tongwei Fish", the aquatic and
livestock food processing bases were built in Sichuan and Hainan, processed and produced strictly
pursuant to the requirements of the HACCP quality management system, realized the quality monitoring
and traceability “from source to table”, and effectively enhanced the value and competitiveness of the
industrial chain.
(2) PV new energy segment
Relying on the Sichuan Polysilicon Engineering Technology Research Centre, the Company
researches automatic reduction process technology, multiphase flow technology, reduction heat cascade
utilization, boron/phosphorus/carbon and other impurity removal technologies to ensure that the high-
purity polysilicon quality of the Company is at the industry’s leading level, the product structure is
continuously optimized and the proportion of mono-grade products is increased greatly, and a long-term
cooperative relationship with major downstream monocrystalline silicon wafer manufacturers is formed,
and the quality has been highly recognized by customers. The high-purity polysilicon segment of the
Company won the "Third National Petrochemical Advanced Group", "Safety Production Standardization
Second-level Enterprise", "Sichuan Quality Benchmark and Advanced Quality Management Enterprise",
and "Sichuan High-purity Crystalline Silicon Preparation Technology Engineering Laboratory", "Sichuan
Province Postdoctoral Innovation Practice Base", "Sichuan Province Patent Innovation and
Entrepreneurship Award", "Energy Saving and Emission Reduction Pioneer Enterprise", "Excellent
Photovoltaic Material Supplier", "2020 Environmental and Social Responsibility Enterprise", "Practicing
Corporate Responsibility, Promoting Green Development Award" and "OFweek Cup 2020 Excellent
Photovoltaic Material Supplier" and other honors issued by the national, provincial and industry
associations; and the brand value and social recognition of the Company are reflected completely.
The solar cell conversion efficiency rate, yield rate, fragmentation rate, CTM value and many other
indicators of the Company are at the leading level in the industry, and the quality is widely recognized by
customers, and it has obtained a number of professional certifications at home and abroad. The cell
segment of the Company has won many honorary titles including "Excellent Quality Supplier" awarded
by Jinko Solar Co., Ltd., "Best Quality Supplier" awarded by GCL System Integration Technology Co.,
Ltd., "Excellent Supplier" and "Product Quality Inspection-Exempt Supplier" awarded by Canadian Solar
Inc., "Excellent Supplier" awarded by Trina Solar Co., Ltd. and "Strategic Supplier" awarded by Risen
New Energy Co., Ltd. In 2020, the Company also won the "National Smart Photovoltaic Pilot
Demonstration Enterprise", "National Enterprise Technology Center", "National Green Supply Chain",
"National Model Workers Home", "Sichuan Science and Technology Progress Award", "Sichuan
Engineering Technology Research Center", "Sichuan Technological Innovation Demonstration
Enterprise", "Top 100 Sichuan Enterprises", "Sichuan Province Worker’s Home Demonstration Site",
"Anhui Province Manufacturing and Internet Integration Pilot Demonstration Enterprise", "Anhui
Province 100 Excellent Private Enterprise", "Anhui Province Harmonious Labor Relations Demonstration
Enterprise", "China Photovoltaic Top Ten Suppliers of Cells/Modules in 2020" and many other national,
provincial and industry awards.
(V) Unique development model of Fishery& PV Integration

2020 Annual Report
14 / 246
The Company has the unique advantages of resource integration in the terminal, and has formed an
innovative development model of "Fishery &PV Integration" with "power generation on the top and fish
farming in the bottom" to realize the green integration of smart farming and clean energy. In terms of
fishery, the Company guides the intensive, intelligent and efficient development of aquaculture through
effective water surface modification, rational application of fishery facilities, and optimization and
innovation of aquaculture models. In terms of PV power generation, the Company adheres to the
implementation of cost strategic planning, and continuously reduces the installed cost of PV systems
through design optimization and technological innovation.
The "Fishery& PV Integration" development model can promote the coordinated development of
primary, secondary and tertiary industries, integrate and create a "three-new" modern industrial park
integrating new fishery, new energy, and new rural area, promote industrial transformation and upgrading,
provide an effective way for the construction of new rural areas, and form the unique competitive model
of the Company.
(VI) Enriched corporate culture
An effective corporate culture is the key to strengthen cohesion and creativity and an important part
of the core competitiveness of the Company. “Striving for Excellence Contributing to Society” is the
corporate purpose, and “For Better Life” is the corporate vision, which indicates the value and goals of
existence for the Company; “Honesty, Trust, Fairness and Excellence” is the management philosophy,
that is, being sincere and candid, winning trust by credibility, running business with fairness and
legitimacy, taking the lead with guaranteed excellence; "three decides" is the important management
principle of the Company, that is, efficiency decides profit, detail decides success, speed decides life and
death; "work hard, work with intelligence, work with the spirit of seizing the day" is the code of conduct
for employees. After years of development, the elemental spirit advocated by the Company’s corporate
culture is closely integrated with our business targets and daily work, guiding the benchmarking operations
of all business segments, branch companies and subsidiaries of the Company, continuously and deeply
advancing the fine-tuning of management and constantly boosting the high-quality development of various
business activities.
Section IV Discussion and Analysis on Operation
I. Discussion and Analysis on Operation
In 2020, the raging COVID-19, the turbulent international situation and the global economic
recession affected the feed and PV industries seriously. Faced with multiple pressures such as hindered
resumption of work, delayed terminal demand, sharp rise in raw material prices, and rising operating costs,
the Company has firmly implemented the business policy of "gathering and focusing, implementing in
place, and efficient operation". On the one hand, the Company coordinated and promoted the Company's
epidemic prevention and control work to ensure the safety of employees, without one confirmed or
suspected case of "COVID-19" throughout the year. On the other hand, it took the lead in the industry to
resume work and production, which ensuring the smooth development of the Company's business
operations throughout the year and the effective implementation of various business plans. During the
reporting period, the Company achieved operating revenue of 44.20 billion yuan, with a year-on-year
increase of 17.69%; net profit attributable to shareholders of the listed company was 3.608 billion yuan,
with a year-on-year increase of 36.95%, and net profit net of non-recurring gains and losses attributable
to shareholders of the listed company was 2.409 billion yuan, with a year-on-year increase of 4.06%.
(I) Feed and industrial chain business
After the outbreak of the COVID-19, downstream aquaculture and terminal consumer demands were
affected. In order to ensure sufficient supply and price stability of residents’ meat products, governments
at all levels accelerated the implementation of residents’ "vegetable basket" projects, such as supporting
the expansion of live pig production and expanding the farming scale of poultry meat. With the strong
support of the policy, driven by factors such as the continuous recovery of live pig production, high poultry
stocks, and booming production and sales of cattle and sheep products, the national feed output achieved
rapid growth, but there were obvious differences between different feed varieties. According to statistics
from the National Feed Industry Association, the total domestic feed output in the year was 252.761
million tons, with a year-on-year increase of 10.4%. Among them, the output of pig feed was 89.225
million tons, with a year-on-year increase of 16.4%; the output of egg and poultry feed was 33.519 million tons, with a year-on-year increase of 7.5%; the output of meat and poultry feed was 91.758 million tons,
with a year-on-year increase of 8.4%; the output of ruminant animal feed was 13.188 million tons, with a

2020 Annual Report
15 / 246
year-on-year increase of 18.9 %; and the output of aquatic feed was 21.236 million tons, with a year-on-
year decrease of 3.6%. While the feed industry is welcoming production growth, competition has also
continued to intensify and polarization has increased. Among them, large-scale enterprises have rapidly
expanded the scale of intensive aquaculture by virtue of their advantages in capital, management and the
construction of the epidemic prevention system. Small-scale aquaculture and free-range breeding have
gradually withdrawn from the market, the concentration of aquaculture has accelerated, and the scale of
the vertically integrated industrial chain of large-scale enterprises has continued to expand. The market
share has further increased, and the industry competition pattern has shifted from competition in the feed
processing industry to comprehensive competition in the entire industrial chain of agriculture and animal
husbandry.
During the reporting period, the Company standardized the awareness and behavior of all employees
with the goal of "maximizing farming benefits", strictly controlled the entire process of product quality
formation, design, manufacturing, and use at the level of specialization, standardization, scale, and
continued to improve the quality management system, provided customers with safe and stable products
and achieve win-win development between the Company and customers. In 2020, the feed, food and
related businesses of the Company achieved operating revenue of 20.851 billion yuan, with a year-on-year
increase of 12.14%, and the sales volume of feed was 5,249,200 tons, with a year-on-year increase of
7.12%. Under the situation of the year-on-year decline in the output of the aquatic feed industry, the sales
volume of aquatic feed continued to grow. The proportion of high value-added products continued to
increase. The expanded feed increased 11.37% year-on-year, and specialty materials increased 18.81%
year-on-year.
The Company focused on the following tasks throughout the year:
1. In-depth practice of the "quality policy" and comprehensive implementation of "standardized"
management. During the reporting period, the Company comprehensively upgraded the "Quality Policy",
carried out publicity and implementation activities, in-depth interpretation, comprehensive
implementation and strict implementation, and a normative awareness and corporate culture with the
"Quality Policy" everywhere was formed. Based on the "quality policy", the Company promoted the
construction of "standardization" firstly in the industry, created on-site standardization and operation
standardization, improved product quality, reduced production costs, and formed a Standardization Work
Manual and operation mode, and employees' thinking was changed fundamentally, "internalized in heart,
externalized in industry" was realized, and a standardized management model in the feed industry was
established. With the help of on-site standardization, the Company vigorously carried out "home
marketing", allowing customers to intuitively feel the standardization and normalization of company
management, personally experience how a good feed was produced, and enhanced customers' recognition
of the Company's brand and product quality.
2. Broke through the concept and innovatively introduced the business philosophy of "full production
and full sales". It was a common phenomenon in the industry that the capacity utilization rate of feed
enterprises fluctuates with the seasons. During the reporting period, the Company broke the conventional
thinking of producing according to sales in the feed industry, changed the concepts, and introduced the
business philosophy of "full production and full sales", formulated corresponding implementation plans,
and quickly promoted and implemented the plans in various subsidiaries. After several months of pilot
promotion, the capacity utilization rate and per capita efficiency of many companies were effectively
improved. The full production and full sales model became an effective way for the Company to increase
the level of scale further.
3. Two-wheel drive of technology and market, consolidate product competitive advantage
During the reporting period, the Company focused on building a leading product terminal expressive
force, promoting the transformation of technical system functions, allowing technology to deeply
participate in operations, relying on technical solutions, solidifying the scientific breeding model, and
vigorously promoting the three-in-one breeding and profit model of "product + model + service", realizing
the two-wheel drive of technology and market, and gradually transformed from a product provider to a
comprehensive solution provider. At the same time, the integrated product development model (IPD) was
implemented; starting from customer needs, the precise positioning and rapid development of products
were achieved, a full-process control of the product line was formed, the product terminal competitive
advantages were consolidated, and more value was created for the Company and customers.
4. Strengthened strategic supplier cooperation and optimized purchasing costs
During the reporting period, the Company continued to optimize the supplier catalog, strengthen
cooperation with strategic suppliers, change the traditional business cooperation model, and improve

2020 Annual Report
16 / 246
business efficiency and strategic supplier viscosity. Affected by the epidemic, the prices of raw materials
raised sharply. The Company used a professional purchasing team and a centralized purchasing platform
to accurately grasp the purchasing nodes, so it can ensure that the purchasing costs of main raw materials
were better than the average market.
In terms of food and processing business, through business focus, optimizing the business model and
deepening the management reforms, the annual sales revenue was 1.982 billion yuan, with a year-on-year
increase of 4.03%. The Company strictly adhered to the red line of food safety, established a whole-
process traceability system of the product, and strived to provide terminal consumers with safe, healthy
and delicious aquatic and livestock food. Among them, Tongwei brand fresh fish gradually realized "one
fish, one yard, scanning code for traceability", which formed a clear difference from other fresh fish
products, and won the recognition and praise of consumers. In 2020, the "Tongwei Fish" brand won awards
such as "Leading Brand in China's Food Industry", "Trusted Brand by Chinese Consumers", "Top 100
Iconic Brands of China's Agricultural Products" and "Most Influential Brands in China's Agriculture".
And the brand recognition and reputation were further improved.
(II) PV new energy business
At present, climate warming has become a common survival problem faced by all humankind, and
energy transition and green development have become a global consensus. In order to cope with climate
change and implement climate governance, many countries around the world have successively announced
carbon neutrality targets in recent years. On September 22, 2020, China solemnly promised at the UN
General Assembly that China would aim to achieve peak CO2 emissions before 2030 and carbon neutrality
before 2060. On December 12, 2020, President Xi Jinping emphasized at the Climate Ambition Summit
that the non-fossil energy in China will account for about 25% of primary energy consumption in 2030,
of which the total installed capacity of wind power and solar power will reach more than 1.2 billion KW.
Japan and South Korea announced that they would achieve carbon neutrality by 2050. The European
Union plans to improve the greenhouse gas emission reductions (compared to 1990) from 40% to 60% in
2030. On February 19, 2021, the United States rejoined the Paris Agreement. According to incomplete
statistics, more than 40 countries and economic entities around the world have announced carbon
neutrality targets and are actively formulating corresponding targets and measures to guide energy
conservation, emission reduction, and energy consumption transformation by the end of 2020. Under this
background, the renewable clean energy focusing on wind power and PV is developed quickly, the
installed capacity is steadily increased year by year, and the global green transformation has entered a new
stage. Among them, PV will become the main form of clean energy in the world due to the high conversion
efficiency, simplicity, reliability, economy and environmental protection, so as to contribute to global
climate governance and green sustainable development.
Affected by the spread of the epidemic in the first half of 2020, global demand for PV installations
was delayed, the operating rate of the industrial chain was generally insufficient, and product prices fell
sharply. In the second half of the year, the epidemic was gradually brought under control, demand for
installed capacity resumed, and the volume and price of PV products rebounded. According to CPIA
statistics, global PV installed capacity was expected to be 130GW in 2020, hitting a new high. Among
them, domestic PV installed capacity was 48.2GW, with a year-on-year increase of 60.1%. The newly
installed capacity has ranked first in the world for 8 consecutive years. At the same time, the global leading
advantage of PV manufacturing industry in China was further enhanced. In 2020, domestic polysilicon
output was 392,000MT, with a year-on-year increase of 14.6%; the silicon wafer output was 161.3GW,
with a year-on-year increase of 19.7%; the cell output was 134.8GW, with a year-on-year increase of
22.2%; and the module output was 124.6GW, with a year-on-year increase of 26.4%. Although the severe
overseas epidemic, the module export volume of our country in 2020 was about 78.8GW, with a year-on-
year increase of 18.3%. With the continuous advancement of technology, the levelized cost of energy
(LCOE) of PV power generation continued to decrease. At present, most countries and regions in the
world have achieved parity, and some are even lower than the cost of thermal power. PV power generation
will welcome a broader development space.
Based on the strategic development positioning of "building a world-class clean energy operator" and
the comprehensive advantages of technology, cost, and management accumulated in the PV industrial
chain, and actively seizing industry development opportunities, the Company has formulated the
Development Plan of High-purity Polysilicon and Solar Cell Business in 2020-2023 (see the relevant
announcement on February 12, 2020 for details), to accelerate the promotion of the capacity expansion
and technological progress of the two core business links of high-purity polysilicon and solar cells,
continuously consolidate the leading advantages of the Company in the above fields, and maintain the

2020 Annual Report
17 / 246
rapid and steady development of the Company in the industry. During the reporting period, the Company
initiated the project construction with a total annual capacity of 150,000MT, including high-purity silicon
Leshan Phase-II, Baoshan Phase-I, and Baotou Phase-II. It is expected that the Leshan Phase II and
Baoshan Phase I projects with a total annual capacity of 100,000MT will be put into operation before the
end of 2021. At that time, the Company will form a high-purity polysilicon capacity exceeding 180,000MT.
The 50,000MT Baotou Phase- II project is expected to be completed and put into operation in 2022. In
terms of solar cells, the Company closely followed the market’s large-size development trend. During the
reporting period, the Company invested the Meishan Phase-I 7.5GW 21X large-size cell project, started
the Meishan Phase-II 7.5GW, Jintang Phase- I 7.5GW, and Jintang 15GW 21X large-size cell project
cooperating with Trina Solar, which will be put into production in 2021. At that time, the capacity will
exceed 55GW, of which 166 and above will account for more than 90%, and the product structure will be
further optimized. On the other hand, the monocrystalline ingots and wafers project cooperating with Trina
Solar has been started in 2020. The project is divided into two phases, each phase is 7.5GW. It is expected
to be put into production in 2021 and 2022 respectively, to further guarantee the supply of the large size
silicon wafers.
In order to give full play to the professional advantages of the Company, strengthen upstream and
downstream cooperation in the industrial chain, and promote the industry's professional division of labor,
complementary advantages, and win-win cooperation, the Company has established strategic partnerships
with LONGi, Trina Solar, Jinko Solar, etc. to carry out industrial chain project investment cooperation
and long-term order purchasing and sales cooperation, and sign long-term supply chain orders with a
number of industry companies.
(1) High-purity polysilicon business
During the reporting period, the Company focused on the implementation of safe production and
operation responsibilities, strengthened team performance and due diligence work style, and ensured the
safe, stable and efficient operation of the production facilities in Leshan and Baotou bases while effectively
fighting the epidemic and responding to sudden natural disaster. Focusing on optimizing the core
competitiveness goals of high-purity polysilicon quality, cost, efficiency, on the one hand, the Company
strengthened technological innovation and research and carried out a number of technical research projects
throughout the year; the monocrystalline rate, density rate, reduction power consumption, steam
consumption and other core technologies indicators achieved phased results; on the other hand, the
Company further promoted "Amoeba management" and "team building" to build an intelligent and smart
factory, improved the level of refined management, and achieved efficient operation and continuous cost
reduction and efficiency enhancement.
During the reporting period, the high-purity polysilicon capacity of the Company was operating at
full load, and various indicators continued to be optimized. The annual sales volume of high-purity
polysilicon was 86,600MT, with a year-on-year increase of 35.79%, and the gross profit margin was
36.78%. The product production costs continued to decrease, with an annual average production cost of
38,700 yuan/MT, of which new capacity was 36,300 yuan/MT.
Based on the development trend of further improving the quality and efficiency of products in the
PV industry, the Company has continuously improved the quality of high-purity polysilicon products
while taking into account the advantages of production costs. At present, the proportion of mono-grade in
the products has reached more than 98%, and the batch supply of N-type material can be achieved. At the
same time, the Company is promoting the construction of new projects orderly. The newly-built capacity
has a larger single-line scale and a more complete production process technology, and the cost will be
further reduced.
(2) Solar cell business
During the reporting period, the Company closely mastered the market changes, optimized product
structure, increased the proportion of products with sizes of 166 and above, and met the needs of different
customers; strengthened internal and external benchmarking to guide the Company to continuously
improve quality and reduce costs; focused on technology research and development, carried out the pilot
test and transformation of new technologies such as HJT and TOPCON based on the further improvement
and optimization of product conversion efficiency and reliability of the mainstream PERC technology, so
as to help the Company maintain its leading technology advantage. Due to the terminal demand impact
caused by the epidemic, the solar cell market fluctuated greatly throughout the year. In the first half of the
year, solar cell market prices fell by 30% year-on-year. In the second half of the year, as demand gradually
picked up, solar cell prices stabilized and rebounded. During the reporting period, the Company continued
to maintain full production and full sales, the cell and module shipments was 22.16GW, with a year-on-

2020 Annual Report
18 / 246
year increase of 66.23%, and the gross profit margin of monocrystalline cells was 16.78%. According to
data released by PVInfoLink, the solar cell shipments of the Company continued to rank first in the world
in 2020.
During the reporting period, the Company continued to improve the production process through
technology research and development, intelligent manufacturing, and delicacy management and control.
The key production indicators such as product A-level rate, fragmentation rate, and CTM value continued
to maintain the leading advantage in the industry. The new project gradually carried out the application of
5G in the industrial Internet field, creating a smart park and 5G standard unmanned workshop. At the same
time, process equipment and production processes were automated, intelligent, and informationized to
further optimize production indicators and reduce non-silicon costs. In terms of marketing, it adhered to
value marketing, continue to promote the brand value of “Tongwei cells inside”, actively promoted the
market process of large-size products, and use product quality as the backing and market changes as an
opportunity to strengthen in-depth cooperation with downstream leading component manufacturers and
sign multiple long-term supply order to ensure the stable shipments of the Company. In terms of
comprehensive management, the Company actively promoted the "cost reduction benchmark line",
"efficiency golden line", "process baseline", "TQM improvement star", and "TQM excellent team" within
the Company, and rewarded "innovative proposals" and "reasonable suggestions" timely, a large number
of outstanding employees and valuable proposals emerged to promote the further improvement of multiple
production indicators and enhance the operating performance of the Company.
(3) PV power generation business
During the reporting period, the Company continued to focus on the development, construction,
operation and maintenance of the "Fishery & PV Integration", and achieved cost reduction and efficiency
enhancement of the powerplant through system optimization in the overall project design, centralized
purchasing, engineering construction, and operation management, created a compound efficiency model
of “generating clean energy on water and high-quality aquatic products underwater” to enhance the
differentiated competitiveness of the Company. As of the end of the reporting period, the Company built
45 main PV powerplants with “Fishery& PV Integration”, with a cumulative installed capacity of more
than 2GW and a total of 2,164,980,000 kWh of power generation throughout the year. At present, PV
power generation has fully entered the era of parity. The Company will continue to focus on cost targets
and the development and operation of "scaled", "clustered", and "beneficial" projects, and gradually
realize the large-scale layout of "Fishery& PV Integration".
II. Major Operation Conditions in the Reporting Period
Refer to "Discussion and Analysis on Business Conditions" in this Section for details.
(I) Major business analysis
1. Analysis of changes in the related items of the income statement and cash flow statement
Unit: Yuan Currency: RMB
Item Amount in the
current period
Amount in the
same period of
last year
Change proportion
(%)
Operating revenue 44,200,270,334.23 37,555,118,255.70 17.69
Operating cost 36,648,405,064.38 30,536,001,116.46 20.02
Sales expense 778,030,640.18 975,270,497.07 -20.22
Management cost 1,808,578,103.39 1,513,809,599.62 19.47
R&D expense 1,035,331,434.68 1,000,694,593.85 3.46
Financial expense 676,326,528.79 707,805,824.00 -4.45
Net cash flow from operation
activities 3,024,927,931.94 2,357,465,207.68 28.31
Net cash flow from investment
activities -4,740,250,322.93 -4,290,774,336.48 -10.48
Net cash flow from financing
activities 5,795,372,325.96 1,441,084,051.50 302.15
2. Revenue and cost analysis
√Applicable □Inapplicable

2020 Annual Report
19 / 246
1) Due to the expansion of the production and sales of high-purity polysilicon and solar cells of the
Company, operating revenue increased year-on-year.
2) The Company has implemented the Accounting Standards for Business Enterprises No. 14-
Revenue revised by the Ministry of Finance from January 1, 2020, and the transportation costs, export
costs and other expenses (originally reported as sales expenses) related to the contract performance will
be directly changed to the operating costs. If retrospectively adjusted according to the same caliber, the
operating costs were increased by 19.32% year-on-year, and sales expense was decreased by 2.37% year-
on-year.
(1). Major business by industry, product, and region
Unit: Yuan Currency: RMB Main business by industry
Industry Operating revenue Operating cost
Gross
profit
rate
(%)
Increase/
decrease in
the
operating
revenue
over last
year (%)
Increase/
decrease in
the
operating
cost over
last year (%)
Increase/
decrease in the
gross profit
rate over last
year (%)
Agriculture and
animal
husbandry
business
20,935,749,897.11 18,699,941,643.52 10.68 11.96 14.38 Reduce by
1.89ppt
PV business 22,502,320,432.61 17,284,675,795.86 23.19 26.41 31.01 Reduce by
2.70 ppt
Large
consolidation
offset
-4,426,670.69 -3,298,026.69
Total 43,433,643,659.03 35,981,319,412.69 17.16 19.23 22.10 Reduce by
1.95 ppt
Main business by product
Product Operating revenue Operating cost
Gross
profit
rate
(%)
Increase/
decrease in
the
operating
revenue
over last
year (%)
Increase/
decrease in
the
operating
cost over
last year (%)
Increase/
decrease in the
gross profit
rate over last
year (%)
Feed, food and
related
businesses
20,850,972,852.84 18,660,128,240.51 10.51 12.14 14.73 Reduce by
2.02 ppt
Solar cells,
modules and
related
businesses
15,499,928,428.90 13,246,395,326.61 14.54 26.31 35.30 Reduce by
5.67 ppt
High-purity
polysilicon and
chemical
industry
6,539,457,937.14 4,270,468,575.07 34.70 26.28 15.16 Increase by
6.30 ppt
PV power 1,171,071,981.74 472,672,272.89 59.64 7.16 18.48 Reduce by
3.86 ppt
Other 84,777,044.27 39,813,403.01 53.04 -19.56 -48.10 Increase by
25.82 ppt
Deductions for
internal
transactions in
the PV segment
-708,137,915.17 -704,860,378.71

2020 Annual Report
20 / 246
Large
consolidation
offset
-4,426,670.69 -3,298,026.69
Total 43,433,643,659.03 35,981,319,412.69 17.16 19.23 22.10 Reduce by
1.95 ppt
Main business by region
Region Operating revenue Operating cost
Gross
profit
rate
(%)
Increase/
decrease in
the
operating
revenue
over last
year (%)
Increase/
decrease in
the
operating
cost over
last year (%)
Increase/
decrease in the
gross profit
rate over last
year (%)
East China 14,904,725,487.35 12,478,872,316.68 16.28 24.64 28.43 Reduce by
2.47 ppt
South China 7,057,865,445.24 6,228,633,808.18 11.75 4.37 6.38 Reduce by
1.66 ppt
West China 11,624,549,361.89 9,509,249,873.68 18.20 11.15 12.74 Reduce by
1.16 ppt
North China 5,809,998,538.34 4,703,482,998.62 19.05 34.27 37.89 Reduce by
2.12 ppt
Central China 3,543,478,254.07 3,319,364,796.44 6.32 -11.30 -9.49 Reduce by
1.87 ppt
Overseas 5,559,881,381.34 4,736,916,306.73 14.80 47.93 51.76 Reduce by
2.15 ppt
Total 48,500,498,468.23 40,976,520,100.33 15.51 17.55 19.80 Reduce by
1.58 ppt
Internal offset -5,066,854,809.20 -4,995,200,687.64
Total after offset 43,433,643,659.03 35,981,319,412.69 17.16 19.23 22.10 Reduce by
1.95 ppt
(2). Production and sales analysis table
√Applicable □ Inapplicable
Main products Unit Production
volume
Sales
volume Inventory
Increase /
decrease of
the output
over last
year (%)
Increase /
decrease of
the sales
revenue over
last year (%)
Increase/
decrease of
inventory over
last year (%)
Feed 10,000
tons 525.03 524.92 7.78 4.74 7.12 -14.03
High-purity
polysilicon MT 86,195.09 86,643.09 504.20 33.92 35.79 -42.38
Solar cells and
modules MW 22,592.92 22,162.63 726.70 67.72 66.23 524.69
PV power
generation
10,000
kWh 222,763.00 216,498.00 / 29.32 29.65
Explanation of production and sales
During the reporting period, the production and sales of high-purity polysilicon and solar cells
increased significantly year-on-year, mainly due to the increased capacity of high-purity polysilicon and
solar cell projects. At the same time, with the further optimization of various indicators, the production
and management efficiency continued to improve, and the product quality and comprehensive cost
performance were highly recognized by the market.
(3). Cost analysis
Unit:Yuan

2020 Annual Report
21 / 246
Condition (by industry)
Industry Cost items Amount of the current
period
Proportion
of the
amount in
the current
period out
of the total
cost (%)
Amount of the same
period in the previous
year
Proportion
of the
amount in
the same
period of the
previous
year out of
the total cost (%)
Proportion
of change in
the amount
of the
current
period
compared
with the
same period
in the
previous
year (%)
Information
notes
Agriculture and
animal
husbandry
industry
Raw
materials 17,512,872,870.27 93.65 15,258,325,641.58 93.33 14.78
Agriculture and
animal
husbandry
industry
Labor
wages 335,736,535.67 1.80 407,066,309.69 2.49 17.52
Agriculture and
animal
husbandry
industry
Manufacturi
ng costs 851,332,237.58 4.55 683,945,651.61 4.18 24.47
PV industry Raw
materials 12,463,938,323.90 72.11 9,295,574,129.53 70.46 34.08
PV industry Labor
wages 649,514,991.13 3.76 633,261,168.60 4.80 2.57
PV industry Manufacturi
ng costs 4,171,222,480.84 24.13 3,264,615,743.68 24.74 27.77
Condition (by products)
Product Cost items Amount of the current
period
Proportion
of the
amount in
the current
period out
of the total
cost (%)
Amount of the same
period in the previous
year
Proportion
of the
amount in
the same
period of the
previous
year out of
the total cost
(%)
Proportion
of change in
the amount
of the
current
period
compared
with the
same period
in the
previous
year (%)
Information
notes
Feed, and
related
businesses
Raw
materials 17,475,257,167.10 93.65 15,258,325,641.58 93.82 14.53
Labor
wages 335,282,662.87 1.80 321,598,735.95 1.98 4.25
Manufacturi
ng costs 849,588,410.53 4.55 683,945,651.61 4.21 24.22
High-purity
polysilicon and
chemical
industry
Raw
materials 1,601,517,823.84 37.50 1,460,607,874.62 39.39 9.65
Labor
wages 188,287,616.75 4.41 173,129,473.47 4.67 8.76
Manufacturi
ng costs 2,480,663,134.48 58.09 2,074,436,168.28 55.94 19.58
Solar cells,
modules and
related
businesses
Raw
materials 11,466,767,788.76 86.57 8,234,966,254.90 84.11 39.24
Labor
wages 487,871,096.69 3.68 464,431,583.53 4.74 5.05
Manufacturi
ng costs 1,291,756,441.16 9.75 1,091,249,276.04 11.15 18.37
PV power Manufacturi
ng costs 472,672,272.89 100.00 398,930,299.37 100.00 18.48

2020 Annual Report
22 / 246
(4). Information on major sales customers and suppliers
√Applicable □Inapplicable
The top five customers had sales of RMB 10,312,816,300, accounting for 23.33% of the total annual
sales; in the sales of the top five customers, the sales of related parties were RMB 0, which accounted for
0% of the total annual sales.
The purchasing amount of the top five suppliers was RMB 9,859,830,400, accounting for 25.53% of
the total annual purchase; in the purchasing amount of the top five suppliers, the purchasing amount of
related parties was RMB 0, which accounted for 0% of the total annual purchase.
3. Expense
□ Applicable √Inapplicable
4. R&D investment
(1).R&D investment situation table
√Applicable □Inapplicable
Unit: Yuan
Current expensing R&D investment 1,035,331,434.68 Current capitalized R&D investment 0
Total R&D investment 1,035,331,434.68 Proportion of total R&D investment to the operating revenue (%)
2.34
Number of the R&D personnel of the Company 2,578 Proportion of the number of R&D personnel to the headcount of the Company (%)
10.09
Proportion of the capitalized R&D investment (%) 0
(2).Explanation of the situation
□Applicable √Inapplicable
5. Cash flow
√Applicable □Inapplicable
The net cash flow from operating activities was 3.025 billion yuan, with a year-on-year increase of
667 million yuan, an increase of 28.31%, mainly due to the expansion of the operation scale of high-purity
polysilicon and solar cells, and the corresponding increase in the generated net cash flow.
The net cash flow from investment activities was -4.74 billion yuan, with a year-on-year decrease of
449 million yuan, a decrease of 10.48%, mainly due to the increased cash paid for new production lines
and fixed assets purchases during the current period.
The net cash flow from financing activities was 5.795 billion yuan, with a year-on-year increase of
4.354 billion yuan and a year-on-year increase of 302.15%, mainly due to the increased proceeds received
from the non-public offering during the current period.
(II) Explanation of major changes in profit caused by non-main business
√Applicable □Inapplicable
1. In 2020, due to the transfer of 98% equity of Chengdu Tongwei Industrial Co., Ltd., the Company
confirmed investment income of RMB 1,521,815,100, increasing net profit of RMB 1,293,542,800.
2. Asset impairment of PV powerplants
By the end of 2020, among the completed grid-connected PV power generation projects of the
Company, 138.79MW has not yet obtained the subsidy indicator in full, and the possibility of obtaining
additional subsidy indicators in the future is small, and there are signs of impairment. The situation is as
follows:
1) Two PV power generation projects (Phase-I and Phase-II) in Maanshan, Anhui
According to the regulations of WNYXN [2016] No.13 “Notice on Improving Construction and
Management of "First Building and First Getting" Distributed PV Powerplants” issued by Anhui Energy
Administration, National Energy Administration East China Regulatory Bureau, Anhui Price Bureau, and
State Grid Anhui Electric Power Company issued on February 17, 2016, the ground distributed PV

2020 Annual Report
23 / 246
powerplants were built firstly and got firstly. After the project was completed, it would be included in the
annual construction scale of our province in accordance with the order of grid connection. The Company
has built the first and second phases of Fishery& PV Integration PV powerplants, with a grid-connected
scale of 64.59MW, which were connected to the grid for power generation at the end of July 2017 and
January 2018 respectively, and received a subsidy indicator of 3.9MW in March 2020. It was expected
that the possibility of subsidizing the target was small by the end of 2020.
2) PV Power Project in Fengnan, Tangshan of Hebei
Fishery & PV Integration PV Powerplant in Fengnan Tangshan Hebei obtained record with the
JFGNYBZ No. [2017] No. 107 of Hebei Provincial Development and Reform Commission on May 31,
2017, and was connected to the grid in December 2018, with a grid size of 74.2MW. The subsidy indicator
of 24MW has been obtained. By the end of 2020, it was expected that the possibility of obtaining the
subsidy indicator in the future was small.
The above PV power generation projects were expected to have future cash inflows lower than the
investment and construction expectations, and there were signs of impairment. For this reason, in
accordance with the principle of prudence, impairment tests were conducted based on the existing subsidy
indicators, and impairment reserves of RMB 221,877,000 were accrued.
3. In 2020, there was a loss of 399,711,800 yuan from scrapped fixed assets, mainly including:
1) Sichuan Yongxiang Polysilicon Co., Ltd. dismantled assets and lost 288.4797 million yuan
The Company upgraded the distillation and reduction sections of the original 20,000MT high-purity
polysilicon project, and dismantled part of the equipment. In the fourth quarter of 2020, after on-site survey
and appraisal by engineering technology and equipment management personnel, the corresponding assets
were no longer used, and it was scrapped. The original book value of the scrapped assets was 573,125,100
yuan, the book value was 293,318,500 yuan, and the net loss after deducting the estimated residual value
was 288,479,700 yuan.
2) Tongwei Solar (Hefei) Co., Ltd. lost RMB 60,521,800 from dismantling assets
According to data from PVInfolink, the market share of multicrystalline cells in 2020 was about 10%,
and it was expected that the market share of multicrystalline cells would further reduce to 2% in 2022.
However, due to the price advantage of multicrystalline modules, there is still a certain market demand in
the market of Southeast Asia, India, etc.; in order to reduce production costs, the Company optimized and
upgraded the polycrystalline production line in the fourth quarter of 2020 to extend the life cycle of
polycrystalline products and scrap the dismounted equipment; the original book value of the scrapped
assets was 201,261,800 yuan, the book value was 68,568,500 yuan, and the net loss after deducting the
estimated residual value was 60,521,800 yuan.
3) Tongwei Solar (Chengdu) Co., Ltd. lost 27,562,600 yuan from dismantling assets
With the development trend of large-size products in the market, after full demonstration, the original
small-size R&D equipment has no further R&D value, and the Company dismantled and scrapped the
equipment. At the same time, in order to extend the life cycle of the 156-size production line as much as
possible, the Company carried out technical innovation to the 156-size production line in the fourth quarter
of 2020, and part of the equipment was dismantled in the process. The original book value of the above
assets was RMB 46,827,300, the book value was RMB 29,382,600, and the net loss after deducting the
estimated residual value was RMB 27,562,600.
(III) Analysis of assets and liabilities
√Applicable □Inapplicable
1. Assets and liabilities
Unit: Yuan
Item name Amount at the
end of the current period
Proportion of the amount at the end of the current period out of the total assets (%)
Amount at the end of the
previous period
Proportion of the
amount at the end of
the previous
period out of the total
assets (%)
Proportion of
changes in the
amount at the end of
current period
compared to the
amount at the end of
Information notes

2020 Annual Report
24 / 246
previous period
(%)
Cash at bank
and on hand 6,264,168,242.03 9.75 2,692,681,748.77 5.75 132.64
Mainly due to the
non-public offering
and receipt of raised
funds of the
Company
Receivables
financing 9,711,898,567.92 15.12 4,392,541,416.88 9.38 121.10
Mainly due to the bill
pool business of the
Company, and the
increased number of
bank acceptance bills
entering the pool with
the expansion of its
business scale
Prepayments 1,113,458,878.37 1.73 389,875,898.15 0.83 185.59
Mainly due to the
expansion of the
Company's business
scale, the increased
prepaid electricity
bills, raw material
purchases, etc.
Long-term
prepaid
expenses 835,269,963.57 1.30 607,333,082.04 1.30 37.53
Mainly due to the
expansion of the
Company's business
scale and the
increased water
surface leasing fees,
etc.
Deferred tax
assets 415,550,864.14 0.65 244,903,723.68 0.52 69.68
Mainly due to the
provision of asset
impairment loss, and
deferred income tax
assets confirmed by
the corresponding tax
difference
Other non-
current
assets
1,547,022,743.45 2.41 1,056,166,007.39 2.26 46.48
Mainly due to the
Company's new
projects, the
increased advance
payment for
engineering
equipment
Bill payable 9,411,924,434.78 14.65 5,294,623,239.24 11.31 77.76
Mainly due to the bill
pool business of the
Company, and the
increased number of
the issued bank
acceptance bills with
the expansion of its
business scale
Non-current
liability due
within one year
2,533,702,158.71 3.94 1,142,185,072.84 2.44 121.83
Mainly due to the
increased long-term
loans and long-term
payables due within
one year

2020 Annual Report
25 / 246
Other
current
liabilities
130,204,120.53 0.20 1,123,805,086.92 2.40 -88.41
Mainly due to the
repayment of short-
term financing bonds
at the beginning of
the period
Long-term
loan 6,296,585,539.34 9.80 4,088,988,505.70 8.73 53.99
Mainly due to the
expansion of the
Company's
investment scale and
the corresponding
increase in financing
through long-term
bank loans
Bonds
payable 410,096,446.33 0.64 4,212,346,552.36 9.00 -90.26
The convertible
bonds issued by the
Company at the end
of the same period of
last year have
decreased due to the
conversion of
convertible bonds
into equity in the
current period.
Long-term
payables 2,526,572,275.65 3.93 1,901,507,753.72 4.06 32.87
Mainly due to the
increased financial
lease payments
Deferred
income 782,273,717.14 1.22 544,324,456.73 1.16 43.71
Mainly due to the
increased
government subsidies
received in the
current period
Deferred
income tax
liabilities
311,949,837.40 0.49 142,204,473.38 0.30 119.37
Mainly due to the
increased temporary
differences in
taxation of fixed asset
depreciation
Other notes:
The Company's PV industry generally used bill settlement. With the growth of business scale and the
development of the "bill pool" business, the Company used unexpired bills as pledge to issue bills payable
for payment to suppliers, etc., so the bills receivable and payable increased significantly. At the end of
2020, the balance of bills receivable (listed as financing receivables) and bills payable reached 9.712
billion yuan and 9.364 billion yuan, accounting for 15.12% and 28.63% of total assets and total liabilities
respectively, and it had an impact of 8.38 percent points on the debt-to-asset ratios, see the following table
for details (amount unit: RMB 10,000):
Item Number of
consolidated
statements
Influence number Number of influence
deduction
Current assets 2,559,155.20 936,391.47 1,622,763.74
Non-current assets 3,866,039.60 3,866,039.60
Total assets 6,425,194.81 936,391.47 5,488,803.34
Current liabilities 2,238,052.39 936,391.47 1,301,660.92
Non-current liabilities 1,032,747.78 1,032,747.78
Total liabilities 3,270,800.18 936,391.47 2,334,408.71
Debt-to-asset ratio 50.91% 42.53%

2020 Annual Report
26 / 246
2. Restrictions on major assets by the end of the reporting period
√Applicable □Inapplicable
Item Book value at the end
of the period
Restricted reason
Cash at bank and on hand 278,125,622.57 Provide guarantee for Company financing
and operation
Receivables financing 9,511,995,347.19 Provide pledge for the company to issue
bank acceptance bills
Accounts receivable 472,806,633.48 Provide pledge for Company financing
Contract assets 916,383,442.93 Provide pledge for Company financing
Fixed assets 7,509,245,190.86 Provide guarantees, financial leases, etc.
for Company financing
Construction in progress 10,805,572.28 Provide pledge for Company financing
Intangible assets 218,700,255.76 Provide pledge for Company financing
Investment real estate 64,302,088.13 Provide pledge for Company financing
Total 18,982,364,153.20
3. Other notes:
□Applicable √Inapplicable
(IV) Industry operational information analysis
√Applicable □Inapplicable
The Company involves PV industry, agriculture, forestry, livestock husbandry and fishery industry.

2020 Annual Report
27 / 246
Analysis of Operational Information in the PV Industry
1. PV equipment manufacturing business
□Applicable √Inapplicable
2. Key technical indicators of PV products
√Applicable □Inapplicable
Product type Technical indicator
Solar grade silicon: Output ratio of products at
all levels Proportion of electricity cost in
product cost
Solar grade polysilicon 100% 39.54%
Solar cell:
Average conversion
efficiency rate of mass
production
Maximum conversion efficiency rate
of R&D
Monocrystalline silicon cell 23.44% 25.18%
Cell module: Average module power of
mass production Maximum module power of R&D
Crystalline silicon cell 390W 485W
Indicator meaning, discussion and analysis: (1) Average conversion efficiency rate of mass production of solar cell: The ratio of the maximum output power of solar cell when it is illuminated to the input optical power on the cell is an important parameter to measure the quality and technical level of the cell. The higher the conversion efficiency rate, the higher the output power of the single wafer of the cell, and the single wafer of the cell with high power can be packaged into high power PV modules. (2) The maximum conversion efficiency rate of R&D of solar cell refers to the highest average conversion efficiency rate of the tested cells in the R&D experiment. The Company strictly follows the primary standard solar cell of Fraunhofer standard in Germany and focuses on the R&D of high-efficiency cells. It further improves the conversion efficiency rate of cells and modules by adopting multi-grid, back passivation, SE process, high-resistance dense grid, alkali polishing, imbrication HJT and other technologies,so that the product quality and various indicators are taking the lead of the industry.
3. PV powerplant information
√Applicable □Inapplicable
Unit: 10,000Yuan Currency:RMB The development of PV powerplant:
Number of existing
powerplants and total installed capacity at the
beginning of the period
Number of powerplants sold and total
installed capacity in the
reporting period
Number of existing
powerplants and total installed
capacity at the end of the
period
The existing
total installed capacity approved
Total volume of
sold powerplant
project Amount
Impact of current sale of powerplant
on current operating performance of the
Company
44 powerplants
with grid
connected
installed capacity
of 1.5GW
0
45 powerplants
with grid connected
installed
capacity of
2.1GW
About
2GW 0
Powerplants not
sold in the current
period
√Applicable □Inapplicable
Unit: 10,000Yuan Currency: RMB
Cumulative operation of PV powerplant in this year:
Region
Installed
capacity
(MW)
Power
generation
(10,000
kWh)
Online power
(10,000 kWh)
Settlement
power (10,000
kWh)
Online
electricity
price
(yuan/kwh)
Electricity
revenue Subsidy
Centralized:

2020 Annual Report
28 / 246
East China 917.11 87,685.96 85,954.07 85,135.51 0.51 29,579.62 14,038.68
South
China 145.00 16,701.75 16,516.42 16,330.96 0.67 6,242.81 4,669.73
West China 154.91 16,353.47 16,013.99 15,914.05 0.70 5,269.42 5,926.50
North
China 602.31 85,353.16 83,605.22 82,691.44 0.50 24,695.24 16,653.46
Central
China 221.66 8,494.19 8,379.74 8,448.38 0.49 3,218.16 962.78
Total 2,040.99 214,588.53 210,469.44 208,520.34 2.87 69,005.25 42,251.15
Distributed:
East China 22.20 2,930.50 2,891.63 2,961.39 0.86 1,058.70 1,502.63
West China 20.57 3,270.19 3,180.23 3,143.38 0.53 1,115.82 561.86
Central
China 15.04 1,973.70 1,880.65 1,873.21 0.86 638.53 973.27
Total 57.81 8,174.39 7,952.51 7,977.98 2.25 2,813.05 3,037.76
Note: online electricity prices, electricity fee revenue, and subsidies exclude taxes.
□Applicable √Inapplicable

2020 Annual Report
29 / 246
4. Recommended tables
(1). Capacity of PV products completed and under construction
√Applicable □Inapplicable
Unit:10,000Yuan Currency:RMB
Product type Yield
Capacity
utilization
rate
Production
process route
Total
investment
in
production
line under
construction
Current
investment
of
production
line under
construction
Design
capacity
(Expected)
Time of
going into
production
Process route
under
construction
Solar grade polysilicon 86,195.09 MT 107.74%
Modified
Siemens
process
6,524.68 6,524.68 150,000MT
100,000MT
will be put
into
production
in 2021
50,000MT
will be put
into
production
in 2022
Modified
Siemens
process
Solar cell:
Multicrystalline silicon cell 3,045.26MW 101.51% / / / / / /
Monocrystalline silicon cell 18,321.82MW 98.15% PERC/
TOPCON 100,781.37 100,781.37 15 GW 2021
PERC/
TOPCON
Cell module
Crystalline silicon cell module 1225.84MW 71.22%
High-
efficiency
modules
Analysis of the cause and impact of major changes in capacity utilization rate: Inapplicable
(2). Major financial indicators of PV products
√Applicable □Inapplicable
Unit:10,000Yuan Currency: RMB
Product type Production and sales rate (%) Sales revenue Gross profit margin (%)

2020 Annual Report
30 / 246
Domestic Overseas Domestic Overseas
Solar grade polysilicon 100.52 533,923.90 36.78
Solar cell:
Multicrystalline silicon cell 99.06 84,565.12 52,531.59 6.56 10.83
Monocrystalline silicon cell 98.66 1,071,606.78 184,921.15 16.38 19.05
Cell module
Crystalline silicon cell 87.21 86,537.12 64,404.15 -2.61 11.58
If the PV products are sold overseas, they should be listed by country or region
√Applicable □Inapplicable
Unit:10,000Yuan Currency:RMB
Overseas sales of multicrystalline cell products
Country or region Sales revenue Gross profit margin (%)
India 20,556.02 16.06
Korea 16,658.00 4.67
Turkey 7,883.62 6.83
Brazil 1,957.16 17.54
Germany 1,603.80 3.82
Philippines 1,479.90 16.71
Hong Kong, China 1,450.43 11.59
Other 942.66 26.94
Unit:10,000Yuan Currency:RMB
Overseas sales of monocrystalline cell products
Country or region Sales revenue Gross profit margin (%)
Turkey 53,053.44 17.58
Korea 42,841.27 16.54
Hong Kong, China 19,732.67 18.83
Germany 17,014.69 20.35
Vietnam 16,118.96 25.11
France 10,683.35 31.96
Taiwan, China 6,127.86 11.89

2020 Annual Report
31 / 246
Canada 4,611.78 18.87
Japan 3,963.39 15.90
India 2,834.74 21.29
Other 7,939.00 16.81
Unit:10,000Yuan Currency:RMB
Overseas sales of cell module products
Country or region Sales revenue Gross profit margin (%)
Korea 28,654.65 10.15
Germany 11,782.68 19.18
Italy 6,497.94 10.94
Poland 5,370.58 13.10
Netherlands 5,004.98 6.29
Hong Kong Special Administrative Region 4,313.52 14.21
France 1,301.87 -10.24
Ukraine 1,053.61 4.87
Others 424.31 7.26
(3). Project information of PV powerplant project contracting or development
□Applicable √Inapplicable
5. Other notes:
□Applicable √Inapplicable

2020 Annual Report
32 / 246
(V) Investment status analysis
1. Overall analysis on external equity investment
√Applicable □Inapplicable
According to the development strategy plan, the Company is committed to the coordinated integration
of the two major industries of “agriculture (fishery) + PV” and the further development and expansion of
their respective segments, makes full use of the Company's existing technology and cost advantages,
accelerates the scale layout, expands the competition gap, and strives to consolidate and builds the leading
position of the Company in the core link of the industrial chain.
(1) Significant equity investment
□Applicable √Inapplicable
(2) Significant non-equity investment
√Applicable □Inapplicable
Unit: 10,000 Yuan
Project name Project
budget
Amount
invested in
the
reporting
period
Cumulative
investment
amount
Project
progress
Benefits
realized
during
the
reporting
period
Sources of
funds
Leshan Phase-II 50,000MT High-
purity Polysilicon Project 401,020.00 4,574.63 4,574.63
Under
construction / Self-raised
Baoshan Phase-I 50,000MT High-
purity Polysilicon Project 408,042.00 1,892.25 1,892.25
Under
construction / Self-raised
Baotou Phase-II 50,000MT High-
purity Polysilicon Project 413,753.00 57.80 57.80
Under
construction / Self-raised
Meishan Phase-II 7.5GW High-
efficiency Solar Cell Project 240,000.00 52,313.27 52,313.27
Under
construction /
Raised funds +
self-raised
Jintang Phase-I 7.5GW High-
efficiency Solar Cell Project 270,061.39 48,468.10 48,468.10
Under
construction /
Raised funds +
self-raised
(3) Financial assets measured at fair value
□Applicable √Inapplicable
(VI) Major assets and equity sales
√Applicable □Inapplicable
During the reporting period, the Company sold 98% of the equity of Chengdu Tongwei Industrial
Co., Ltd. and 100% of creditor's rights held by Tongwei based on maximizing the interests of the Company
and investors in accordance with the resolutions and authorizations of the general meeting of shareholders;
Chengdu Yihua Real Estate Co., Ltd. (hereinafter referred to as "Yihua Real Estate"), a wholly-owned
subsidiary of Guangdong Aoyuan Commercial Real Estate Group Co., Ltd., won the equity and creditor's
rights of the above bidding at a price of RMB 1,936,265,300. The Company signed an agreement on equity
transfer with Yihua Real Estate and related parties on July 10, 2020. This matter was reviewed and
approved by the ninth meeting of the seventh board of directors held on July 14, 2020 and the second
extraordinary general meeting of shareholders held on July 30, 2020. For details, please refer to the
Company’s relevant announcements disclosed on the designated information disclosure media and the
Shanghai Stock Exchange website (http://www.sse.com.cn) on July 31, 2020. During the reporting period,
the Company received all transaction payments and capital occupation fees paid by the counterparty Yihua
Real Estate, and completed the transfer of the equity, industrial and commercial change registration, and
the transfer of various assets and data.

2020 Annual Report
33 / 246
(VII) Analysis of major holding companies and joint-stock companies
√Applicable □Inapplicable
Unit: 10,000 Yuan
Full name of subsidiaries Business
nature
Registered
capital Total assets Net assets Net profit
Tongwei Solar (Hefei) Co., Ltd.
(consolidated) PV industry 215,000.00 2,229,164.89 310,849.00 100,555.24
Sichuan Yongxiang Co., Ltd. (consolidated) PV industry 125,550.54 1,402,122.07 595,713.19 78,663.53
(VIII) Situation of the structured entities controlled by the Company
□Applicable √Inapplicable
III. Discussion and Analysis of the Company about Further Development
(I) Industry pattern and trends
√Applicable □Inapplicable
1. Feed industry
(1) The total quantity of the feed industry maintains a growing trend
Due to the effective control of "African Swine fever" and the support of governments at all levels to
encourage the expansion of livestock and other meat breeding, the feed production in our country achieved
a restorative growth in 2020. According to the statistics of the National Feed Industry Association, the
total output of industrial feed in our country was about 253 million tons, with a year-on-year increase of
10.4%. The goal of total industrial feed output reaching 220 million tons in the "Thirteenth Five-Year
Development Plan for the National Feed Industry" has been successfully completed; and it increased by
26.3% compared with 2015. On February 25, 2021, the Ministry of Agriculture and Rural Affairs issued
the Implementation Opinions on the Implementation Key Agricultural and Rural Work Deployments of the Party Central Committee and the State Council in 2021. The document requires that each province must
promote the stable development of pig and other livestock production, stabilize the pig farm, brood sow
and realize the production of large provinces, large counties and large enterprises. At the same time, the
document requires to strengthen the guidance to small farms to ensure that the annual pig capacity is
restored to the normal level. Meanwhile, the circulating water, deep sea and geoidal ecological fishery
were greatly developed so as to promote the saline-alkali aquaculture, standardized development of
integrated rice-fishing cultivation, and promote the quality and efficiency increasing in fishery. With the
recovery and continuous development of related breeding activities, total feed output in our country will
maintain a growing trend.
(2) Feed safety and environmental protection requirements are continuously upgraded
In recent years, feed regulatory agencies have intensified random inspections of feed companies and
penalties for companies that violate regulations, which have promoted the steady improvement of product
quality in the feed industry. According to the Notification on the National Feed Quality and Safety Supervision and Sampling Results in 2020 issued by the Animal Husbandry and Veterinary Bureau of the
Ministry of Agriculture and Rural Affairs, the national feed quality and safety sampling inspection pass
rate reached 98.1% in 2020, which was higher than the goal of sampling inspection pass rate above 96%
in Thirteenth Five-Year Development Plan for the National Feed Industry. In 2020, the feed industry in
our country entered an era of comprehensive “antibiotic-free", which indicated that the feed industry in
our country started a process of high-quality development. At present, feed companies must not only meet
the requirements of ensuring the safety of animal products, but also take into account new requirements
such as consumption upgrades and environmental safety. This poses challenges to small and medium-
sized feed companies with weak financial strength, low technical level, and poor production control
capabilities. With stronger comprehensive strength, leading feed companies can meet the requirements of
feed safety and environmental protection well, and promote the green development and transformation of
the industry.
(3) Accelerate the process of large-scale, intensive and integrated feed industry
According to data released by the National Feed Industry Association, from the perspective of
production methods, there were 749 feed production plants with a scale of more than 100,000 tons in our
country in 2020, with an increase of 128 over the previous year and a total production of 134 million tons,
which account for 52.8% of the total national feed output, with an increase of 6.2 percent points over the
previous year. There are 33 feed enterprise groups with an annual output of more than one million tons,

2020 Annual Report
34 / 246
accounting for 54.6% of the total national feed output, and with increase of 4.1 percent points over the
previous year. In terms of sales methods, the total amount of bulk feed (for large-scale breeding farms)
was 58.976 million tons, with a year-on-year increase of 33.6%, accounting for 25.6% of the total
compound feed output, and it increased by 4.6 percent points over the previous year. With the continuous
acceleration of the concentration and intensification of the feed processing industry, the advantages of
leading companies in efficiency, technology, management, capital, and talent have been strengthened, the
differentiation of the industry echelon is obvious, and the clearance of small-scale feed output has
accelerated. At the same time, leading companies continue to increase investment in breeding, food
processing and trade links, the integrated scale of industrial chain continues to expand, and the competitive
landscape has begun to transform into a comprehensive strength competition in the entire industrial chain
of agriculture and animal husbandry.
(4) Accelerate the promotion of green and healthy aquaculture
On April 1, 2020, the General Office of the Ministry of Agriculture and Rural Affairs issued the Notice on Implementing the "Five Actions" for Green and Healthy Aquaculture in 2020; all places were
required to focus on the promotion action plan of ecological and healthy aquaculture model, the promotion
action plan of farming tail water treatment model, medicine reduction action plan for aquaculture, the
action plan for replacing juvenile trash fish with formula feed, and the "five-action" of action plan for
improving the quality of aquaculture to ensure the stable supply of aquatic products in our country
throughout the year and the green development of the aquaculture. Affected by this, new aquaculture
modes such as integrated rice farming, factory-based circulating aquaculture, and container-type
circulating aquaculture have emerged in various places, and the demand for high-quality feed that meets
the requirements of the new aquaculture model is increased. At the same time, 12 provinces (regions)
including Liaoning and Jiangsu have successively carried out the test of replacing juvenile trash fish with
formula feed, which will further increase the demand for aquatic feed. Leading feed companies actively
participate in the development and promotion of new aquaculture models by virtue of their strong technical
research and development capabilities and promotion service capabilities, launch supporting feeds and
animal protection products in a targeted manner, and expand their brand influence and product market
share.
2. PV new energy industry
(1) "Carbon neutrality" has become a global consensus, and PV new energy is ushering in major
development opportunities
On December 12, 2015, the 196 parties to the United Nations Framework Convention on Climate Change passed the Paris Agreement at the Paris Climate Change Conference, with the purpose of making
arrangements for the global response to climate change after 2020. According to the Paris Agreement, countries need to control the global average temperature rise within 2 degrees Celsius above the pre-
industrial level in this century, and strive to control it within 1.5 degrees Celsius. This means that the
world needs to achieve "carbon neutrality" before 2050. In 2020, the COVID-19 seriously dragged the
global economy. In order to restore economic vitality and revitalize climate governance, many countries
have successively implemented energy-saving emission reduction and renewable energy development
plans. As more countries participate in the ranks of "carbon reduction" and "carbon neutrality", the global
green transformation has entered a new stage, and as the main force of renewable energy, PV will usher
in major development opportunities.
(2) The continuous improvement of PV technology and processes will help continuously reduce the
cost of PV power generation
Cost reduction is the forever theme of the development of the PV industry. According to IRENA
statistics, it has found that the cost of solar PV power generation dropped by 82% from 2010 to 2019. The
sharp drop in cost was mainly due to technological progress, economies of scale, supply chain competition
and the increase in developer experience. According to CPIA statistics, the global minimum bid-winning
electricity price for PV power generation was 0.0112 Euro/kWh in 2020, which was equivalent to
approximately RMB 0.091/kWh, and reduced by 19.7% than the lowest bid-winning electricity price in
2019; the domestic lowest bid-winning electricity price in 2020 was RMB 0.2427/kWh, which was
reduced by 6.7% than the lowest bid-winning electricity price in 2019. In addition, the initial full
investment cost of the ground PV system in our country in 2020 was about 3.99 yuan/W, which was
decreased by 0.56 yuan/W than 2019, the decrease was12.3%. It was expected that the initial full
investment cost of PV systems in 2021 would be reduced to 3.81 yuan/W, so that most areas in our country can achieve PV parity online, and promote our country to accelerate the realization of energy
transformation and power structure transformation. With the increased proportion of large-size and

2020 Annual Report
35 / 246
double-sided modules, the large-scale mass production of cutting-edge technologies such as HJT and
TOPCON, and the wide application of tracking brackets, the cost of PV power generation will continue
to decline, and the advantage as the main force of renewable energy will be consolidated.
(3) The scale of newly installed PV capacity continues to grow, and the industrial chain develops
steadily
In the face of the raging COVID-19, the global PV market kept growing in 2020, showing strong
trend. According to CPIA, the newly installed PV capacity in the next five years will maintain an average
annual compound growth rate of 15-20%. In 2025, the global newly installed PV capacity is expected to
reach 270-330GW, of which domestic new installed capacity will reach 90-110GW. At present, the PV
industrial chain in our country has the leading advantages of scale, cost, and technology in the world. Up
to now, the cumulative installed capacity, newly installed capacity, polysilicon output, and PV module
output in our country have ranked first in the world for 6 consecutive years, 8 years, 10 years, and 14 years
respectively. With the continuous expansion of PV installations, the PV industry in our country will
continue to maintain high growth.
Data source: CPIA Review of 2020 and Outlook of 2021 of China's PV Industry
Data source: CPIA Review of 2020 and Outlook of 2021 of China's PV Industry
Predication of newly added installation of global PV from 2011 to 2025
Conservative situation Optimistic situation
Predication of newly added installation of domestic PV from 2011 to 2025
Conservative situation Optimistic situation

2020 Annual Report
36 / 246
(4) The concentration of the PV industry continues to increase and the Matthew effect continues to
strengthen
At present, leading companies continue to increase their market share by virtue of their leading
advantages in technology, cost, management, and scale. The backward output is gradually withdrawn from
the market after multiple rounds of reshuffle, and the industry concentration continues to increase.
According to statistics, the output of the top five polysilicon companies accounted for 87.5% of the total
domestic polysilicon output in 2020; the output of the top five silicon wafer companies accounted for 88.1%
of the total domestic silicon wafer output; the output of the top five crystalline silicon cell companies
accounted for 53.2% of total domestic cell output, the output of the top five crystalline silicon module
companies accounted for 55.1% of the total domestic module output, all of which achieved substantial
growth over the same period. The scale of leading enterprises continues to expand, their profitability is
effectively improved, and their comprehensive competitive advantages continue to increase.
(II) Development strategy of the Company
√Applicable □Inapplicable
The Company's development strategy is to build a world-class safe food supplier and clean energy
operator. Utilizing the comprehensive strength and large-scale advantages accumulated for a long time in
scientific research, branding, comprehensive operations, etc., it adapts to industry development trends,
adheres to the specialization, large-scale, and industrialization process of the PV new energy segment and
agriculture and animal husbandry segments, and optimizes and improves their respective industrial chain,
strives to promote the Company's sustainable and stable development by both endogenous and extensional
investment methods, promotes the continuous and stable development and realizes the Company's vision
of "For Better Life".
1. Agriculture and animal husbandry segment: to build a world-class safe food supplier
Feed industry: consolidate the Company's leading position in the global aquatic feed industry, and
adhere to the parallel of specialization and large-scale in accordance with the development trend of the
industry. Improve and optimize the industrial chain, and realize the stable development of the industry
through extensional development and endogenous growth such as overseas plant construction, domestic
and foreign mergers and acquisitions.
Aquaculture: based on the Company's leading resource advantages (aquaculture resources, channel
resources) in the industry, expand aquaculture to the downstream, and increase output under the premise
of ensuring quality. Improve the automation, intelligence and environmental protection standards of
aquaculture, promote the transformation and upgrading of traditional fishery to modern fishery, and build
a leading production base for safe aquatic products with full traceability.
Aquatic product trade and processing: accelerate the promotion of aquatic product trade and deep
processing business, and open up the industrial chain from the breeding end to the consumer end. The
Company's green and safe food benchmark "Tongwei Fish" has been highly recognized in the regional
market, and the successful model will be replicated in many places in the future. At the same time, it is
actively deploying big data for aquatic product sales, combining e-commerce platforms with offline
aquatic product wholesale markets to create a fresh and live aquatic product circulation system. Give full
play to the advantages of the "Tongwei Fish" brand, and strive to expand along the path of breeding-
wholesale-retail-consumer end, to achieve full coverage of breeding, production, processing, and trade.
2. PV new energy segment: build a world-class clean energy operator
The Company has become one of the leading product manufacturers in the PV industry. In the future,
it will continue to expand its scale advantages in key aspects of PV manufacturing, accelerate the
promotion of the "Fishery& PV Integration" coordinated development model, and move towards a world-
class clean energy operator.
In the field of PV manufacturing, give full play to the Company's leading technology research and
development and cost control capabilities to consolidate the Company's leading position in the product
manufacturing field. Accelerate the expansion of high-purity polysilicon capacity, grasp the time window
for import substitution and elimination of backward output; in the solar cell link, grasp the opportunity of
increasing industry concentration, and continue to expand scale and cost leading advantages.
In the field of PV power generation, unswervingly promote the development model of "Fishery&
PV Integration". The Company's advantageous agricultural resources are combined with the resources of
the PV industry to form a three-dimensional "Fishery& PV symbiosis" economy, build a business model
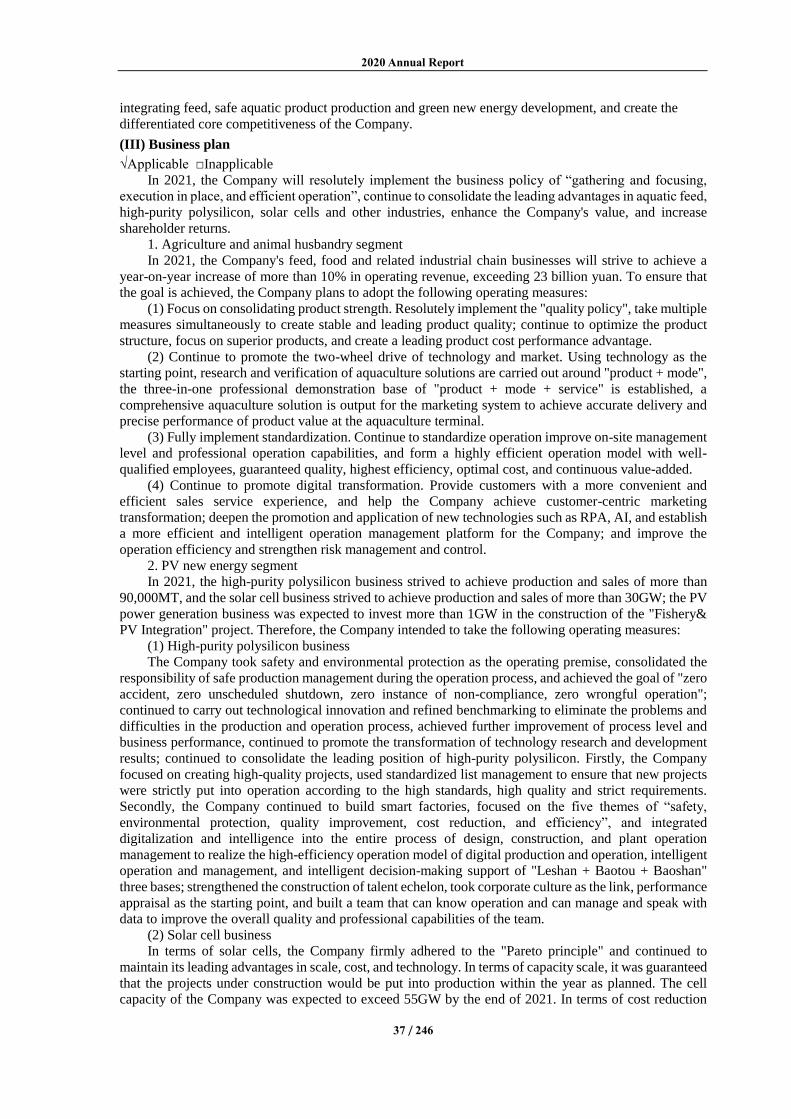
2020 Annual Report
37 / 246
integrating feed, safe aquatic product production and green new energy development, and create the
differentiated core competitiveness of the Company.
(III) Business plan
√Applicable □Inapplicable
In 2021, the Company will resolutely implement the business policy of “gathering and focusing,
execution in place, and efficient operation”, continue to consolidate the leading advantages in aquatic feed,
high-purity polysilicon, solar cells and other industries, enhance the Company's value, and increase
shareholder returns.
1. Agriculture and animal husbandry segment
In 2021, the Company's feed, food and related industrial chain businesses will strive to achieve a
year-on-year increase of more than 10% in operating revenue, exceeding 23 billion yuan. To ensure that
the goal is achieved, the Company plans to adopt the following operating measures:
(1) Focus on consolidating product strength. Resolutely implement the "quality policy", take multiple
measures simultaneously to create stable and leading product quality; continue to optimize the product
structure, focus on superior products, and create a leading product cost performance advantage.
(2) Continue to promote the two-wheel drive of technology and market. Using technology as the
starting point, research and verification of aquaculture solutions are carried out around "product + mode",
the three-in-one professional demonstration base of "product + mode + service" is established, a
comprehensive aquaculture solution is output for the marketing system to achieve accurate delivery and
precise performance of product value at the aquaculture terminal.
(3) Fully implement standardization. Continue to standardize operation improve on-site management
level and professional operation capabilities, and form a highly efficient operation model with well-
qualified employees, guaranteed quality, highest efficiency, optimal cost, and continuous value-added.
(4) Continue to promote digital transformation. Provide customers with a more convenient and
efficient sales service experience, and help the Company achieve customer-centric marketing
transformation; deepen the promotion and application of new technologies such as RPA, AI, and establish
a more efficient and intelligent operation management platform for the Company; and improve the
operation efficiency and strengthen risk management and control.
2. PV new energy segment
In 2021, the high-purity polysilicon business strived to achieve production and sales of more than
90,000MT, and the solar cell business strived to achieve production and sales of more than 30GW; the PV
power generation business was expected to invest more than 1GW in the construction of the "Fishery&
PV Integration" project. Therefore, the Company intended to take the following operating measures:
(1) High-purity polysilicon business
The Company took safety and environmental protection as the operating premise, consolidated the
responsibility of safe production management during the operation process, and achieved the goal of "zero
accident, zero unscheduled shutdown, zero instance of non-compliance, zero wrongful operation";
continued to carry out technological innovation and refined benchmarking to eliminate the problems and
difficulties in the production and operation process, achieved further improvement of process level and
business performance, continued to promote the transformation of technology research and development
results; continued to consolidate the leading position of high-purity polysilicon. Firstly, the Company
focused on creating high-quality projects, used standardized list management to ensure that new projects
were strictly put into operation according to the high standards, high quality and strict requirements.
Secondly, the Company continued to build smart factories, focused on the five themes of “safety,
environmental protection, quality improvement, cost reduction, and efficiency”, and integrated
digitalization and intelligence into the entire process of design, construction, and plant operation
management to realize the high-efficiency operation model of digital production and operation, intelligent
operation and management, and intelligent decision-making support of "Leshan + Baotou + Baoshan"
three bases; strengthened the construction of talent echelon, took corporate culture as the link, performance
appraisal as the starting point, and built a team that can know operation and can manage and speak with
data to improve the overall quality and professional capabilities of the team.
(2) Solar cell business
In terms of solar cells, the Company firmly adhered to the "Pareto principle" and continued to
maintain its leading advantages in scale, cost, and technology. In terms of capacity scale, it was guaranteed
that the projects under construction would be put into production within the year as planned. The cell
capacity of the Company was expected to exceed 55GW by the end of 2021. In terms of cost reduction

2020 Annual Report
38 / 246
and efficiency enhancement, the Company continued to promote delicacy management and manufacturing
to achieve cost reductions in procurement, production, and management. In terms of technology research
and development, the Company closely followed cutting-edge processes and technologies. On the one
hand, it continued to optimize and improve the multi-grid, back passivation, SE technology, high
resistance dense grid, alkali polishing of the existing technology; on the other hand, it accelerated the
promotion of the research and development process of TOPCON, HJT and other new technologies. The
smooth operation of the 1GW scale HJT pilot line will be realized in 2021, which will provide sufficient
verification for the mass production introduction of later research and development results. In terms of
market development, it focused on improving product cost performance, meeting the high-cost
performance needs of downstream customers, using the synergistic advantage of the silicon material to
cell industrial chain, strengthening cooperation with strategic suppliers and strategic customers, and
achieving mutual trust and win-win results. The Company actively explored domestic and overseas
markets to cover more customer groups.
(3) PV power generation business
The Company continued to promote the development of the "Fishery& PV Integration" project, in
order to ensure the quality of development, give priority to selecting large-scale bases with good water
surface resources and good consumption conditions, the Company continued to promote the cost reduction
process of "Fishery& PV Integration", participated in market competition, and continued to make use of
the unique land efficient use in this model and competitive advantage of multi-industry integration.
(IV)Possible risks
√Applicable □Inapplicable
1. Feed industry
(1) The impact of raw material price fluctuations. The major component of feed cost is the cost of
raw materials. The current raw material prices are very susceptible to many factors such as the
international political and economic situation, changes in the output of the main producing areas, national
collection and storage and subsidies, exchange rate fluctuations, and changes in logistics costs. Large
fluctuations of the raw material price may affect the product gross profit level of the Company.
Risk response measures: the Company strengthened team business ability training, closely tracked
changes in disturbance factors, predicted the price trend of raw materials through systematic research and
analysis; combined supply, production, and sales requirements, rationally arranged purchasing plans, and
implemented optimal inventory management; participated in the operation and management of the IPD
product line together with formula product managers and quality control; ensured the continuous follow-
up of research and development, and met the needs of raw material substitution under extreme conditions.
(2) The impact of market fluctuations. Feed sales are directly affected by downstream aquaculture.
Natural disasters, abnormal temperature and the spread of diseases will adversely affect aquaculture,
leading to fluctuations in feed demand.
Risk response measures: the Company paid close attention to the climate, natural disasters, and
diseases, with prevention first and remedy as the supplement, quickly formulated response measures, and
actively helped farmers to resume breeding activities; increased investment in disease prevention and
control research, promoted scientific aquaculture model according to the needs of aquaculture species and
helped farmers maximize their benefits; the rich feed varieties of the Company and reasonable regional
layout of branch companies can effectively cope with systemic market fluctuation risks.
(3) Policy impact. With the implementation of the new Environmental Protection Law, green
aquaculture norms and policy subsidies, the aquaculture industry is towards antibiotic-free, green, large-
scale, and intelligent development, and scattering raising-households are facing greater challenges.
Risk response measures: according to the development trend of aquaculture, the Company rationally
adjusted the Company's business strategy and increased the development of large-scale farms; resolutely
implemented antibiotic-free feeds, made reasonable formulas according to the nutritional needs of
different aquaculture species at each growth stage, and launched high-quality feed products, enhanced the
level of product profitability; guided the transformation and upgrading of scattering raising-households
with strong operating capabilities, and actively strived for relevant subsidy support policies to achieve
large-scale development.
(4) The risk of exchange rate fluctuations. With the increased international raw material trade demand and the expanded overseas feed business of the Company, frequent two-way fluctuations in the RMB
exchange rate will have a more obvious impact on business operations.

2020 Annual Report
39 / 246
Measures taken: the Company paid close attention to and studied the development trends of the
international foreign exchange market, and selected favorable payment settlement currencies and
settlement methods accordingly; improved the research and forecast capabilities of the foreign exchange
market, strengthened the management of import and export business, and used financial instruments such
as future foreign exchange settlement, change over and foreign exchange options business to lock the
exchange rate risks. The Company made full use of the advantages of the Company in scale, technology,
and brand, and actively strived for the initiative in the negotiation and negotiation mechanism for prices,
currencies, and settlement cycles.
(5) The risk of force majeure. At present, the domestic COVID-19 has been effectively controlled,
and social and economic activities have returned to normal. However, there have been repeated epidemics
overseas. Due to the continuous international trade and exchanges, the country is still facing potential
threats of COVID-19.
Measures taken: the Company strengthened the analysis and prediction of force majeure risks such
as the epidemic, and actively took corresponding measures to respond to changes in the market
environment.
2. PV industry
(1) The imbalance of supply and demand in the industrial chain and the impact of product price
fluctuations. In 2020, the PV supply chain was affected by the uneven supply and demand, and the overall
price fluctuated greatly. Considering that the COVID-19situation is still uncertain, and the supply of raw
materials such as polysilicon and glass continues to be tight, there may be large price fluctuations in the
industrial chain, which will have an adverse impact on the construction of PV projects.
Measures taken: the Company strengthened industrial chain tracking and prediction, strict
benchmarking management, continued to promote refined management, continued to consolidate the
competitive advantages of the Company in quality, scale, technology, and cost, and further increased its
market share in the field of high-purity polysilicon and high-efficiency market rate.
(2) Impact risks of industry policies. The cost of PV power generation in most countries and regions
in the world is lower than the cost of traditional fossil energy power generation, so the PV power
generation has become the main form of energy for most countries to achieve carbon emission reduction,
and various countries have successively issued relevant incentive policies to promote the continuous
increase of PV power generation scale. If the policies of various countries are greatly adjusted, the installed
capacity of PV is expected to be significantly affected.
Measures taken: the Company closely followed the changes in related policies, combined its own
strategic development, and formulated a reasonable business development plan for PV powerplants.
(3) Technology iteration risk. The PV industry is undergoing rapid technology upgrades, and the
pressure to reduce costs is forcing companies to continue to develop new technologies. With the
continuous improvement of cell and module efficiency and further reduction of costs, companies will face
survival of the fittest. In recent years, PV companies have made breakthroughs in the production of
crystalline silicon cells such as TOPCON, HJT, and IBC, and have continuously set new records. At the
same time, crystalline silicon cells are also facing competition from thin film, perovskite and other
amorphous silicon technology routes.
Measures taken: the Company actively carried out pilot trials and transformations, including HJT and
TOPCON, which may become the mainstream technology routes for next-generation mass production,
while maintaining the tracking and R&D demonstration of forward-looking technologies to ensure the
technological leading of the Company.
(4) The risk of force majeure
The World Health Organization pointed out that humans may continue to coexist with the COVID-
19 for a long time. At present, overseas markets account for about 2/3 of the global PV market demand.
Combined with the emergence of the mutated COVID-19, if the overseas epidemic cannot be effectively
controlled, the weakening of PV terminal demand cannot be ruled out.
Measures taken: the Company strengthened the analysis and prediction of force majeure risks such
as the epidemic, actively took corresponding measures to respond to changes in the market environment,
increased the development of strategic customers, enhanced product market competitiveness, and reduced
the adverse effects of force majeure risks.
(V) Others
□Applicable √Inapplicable

2020 Annual Report
40 / 246
IV. Explanation of the situation and reason that the Company does not disclose in accordance
with the Code due to special reasons such as inapplicability of the Code, state secrets, trade
secrets and so on
□Applicable √Inapplicable
Section V Important Matters
I. Common Stock Profit Distribution Plan or Capital Reserves Share Capitalization Plan
(I) Formulation, implementation or adjustment of cash dividend policy
√Applicable □Inapplicable
In accordance with the requirements of the Guidelines for the Supervision of Listed Company No. 3-Cash Dividend for the Listed Company issued by the China Securities Regulatory Commission, combined
with the actual situation of the Company, the Company has revised and improved the profit distribution
clauses in the Articles of Association for many times; and effective system guarantee is provided for cash
dividend and the minimum dividend ratio, and it will be implemented strictly. In 2012, 2015, and 2018,
the Company held a general meeting of shareholders to review and approve the Company Dividend Plan for the Next Three Years (2012-2014), Company Dividend Plan for the Next Three Years (2015-2017),
Company Dividend Plan for the Next Three Years (2018-2020), which further clarify the implementation
rules for cash dividend.
During the reporting period, the Company implemented profit distribution in strict accordance with
the above relevant policies. After deliberation at the eighth meeting of the seventh board of directors of
the Company on April 17, 2020, the Profit Distribution Plan and Capital Reverses Share Capitalization Plan in 2019 was approved at 2019 general meeting of shareholders of the Company on May 12, 2019;
based on the total capital stock of 4,287,855,684 shares, the Company paid a cash dividend of RMB 1.86
(tax included) for every 10 shares to all shareholders; 797,541,157.22 yuan of cash dividend were
distributed, and the plan was completed on May 26, 2020.
During the reporting period, the profit distribution policy and plan implementation of the Company
were based on the premise of fully protecting the legitimate rights and interests of small and medium
investors, conform to the Articles of Association; the corresponding review procedures were performed,
and independent directors issued clear opinions.
The distribution plan of the Company in 2020 is: based on the total share capital of 4,501,548,184
shares, a cash dividend of 2.41 yuan (tax included) will be distributed to all shareholders for every 10
shares, and the total cash dividend will be 1,084,873,112.34 yuan. The plan will be submitted to the 2020
annual general meeting of shareholders for deliberation.
On April 9, 2021, the Company held the eighteenth meeting of the seventh board of directors, and
reviewed and approved the Shareholder Dividend Plan for the Next Three Years (2021-2023). The plan
still needs to be submitted to the 2020 general meeting for deliberation.
(II) The Common Stock Dividend Distribution Plan of the Company for the past three years
(including the reporting period), and the Capital Reserves Share Capitalization Plan
Unit:Yuan Currency:RMB
Dividend
year
Number of bonus shares per 10 shares
(shares)
Number of dividends
per 10 shares (RMB)
(tax included)
Number of
transfer per 10 shares
(shares)
Amount of cash bonus
(tax included)
Net profit attributable to
common shareholders of
the listed company in consolidated statements in
dividend-receiving year
Proportion (%)
accounting for net profit
attributable to common
shareholders of the listed company in consolidated statements
2020 0 2.41 0 1,084,873,112.34 3,607,923,359.56 30.07
2019 0 1.86 0 797,541,157.22 2,634,568,828.17 30.27
2018 0 1.60 0 621,179,555.20 2,018,746,008.65 30.77

2020 Annual Report
41 / 246
(III) Situation of repurchasing shares in cash and being included in cash dividend
□Applicable √Inapplicable
(IV) In the reporting period, if the parent Company is profitable and the profit available for
distribution to ordinary shareholders is positive, but does not propose a plan for the
distribution of cash profit on common shares, the Company shall disclose the reasons and
the use and use plan of the undistributed profit in detail
□Applicable √Inapplicable
II. Implementation of commitments
(I) The actual controllers, shareholders, related parties, acquirers, and the Company promised
the commitments of related parties during the reporting period or continuing into the
reporting period
√Applicable □Inapplicable

2020 Annual Report
42 / 246
Commitment background
Commitments
type
Commitment
party
Commitments
content
Commitment time and duration
Whether the duration for performance is provided
Whether the commitment is performed timely and
strictly
Reasons of failure in
timely performance
Next plan in case of
failure in timely
performance
Commitments
related to
major asset
restructuring
Solve competition
in the same
industry
Liu
Hanyuan,
Tongwei
Group
As of the date of issuing this letter of commitment,
apart from the target company, I and Tongwei Group
have not invested in any company, enterprise or other
business entity that has the same or similar business as
the target company; apart from the target company, I
and Tongwei Group have not operated the same or
similar business as the target company. There is no
horizontal competition between I, Tongwei Group and
other companies under its control and the target
company. I, Tongwei Group and other companies
under control will not engage in business activities that
are the same, similar or competing with the target
company’s existing business or products in any form,
including not establishing, investing, acquiring, or
merging the companies with the same or similar
business with the existing business in domestic and
overseas or the any form of horizontal competition
with economic organizations with the target company.
I and Tongwei Group promise to strictly fulfill the
above commitments. If the rights and interests of
Tongwei Co., Ltd. or the target company are damaged
due to violation of the above commitments by I,
Tongwei Group and other companies under its control,
Tongwei Group and I will bear the responsibility in
accordance with the law.
This
commitment
remains valid
and is being
implemented.
No Yes
Inapplicable
Inapplicable
Resolve related
transactions
Liu
Hanyuan,
Tongwei Group
There is no apparently unfair related transaction
between the promiser and other enterprises under its
control and the target company. After completing this
transaction, the promiser and other companies under its control will try to avoid or reduce related transactions
with the target company; for related transactions that
This
commitment
remains valid
and is being
implemented.
No Yes
Inapplicable
Inapplicable

2020 Annual Report
43 / 246
cannot be avoided or exist for reasonable reasons, they
will sign a standardized related transaction agreement
with the target company in accordance with the law;
the approval procedures are performed in accordance
with relevant laws, regulations, rules, listing rules and
other regulatory documents, as well as Tongwei Co.,
Ltd.’s Articles of Association; it will conduct
transactions with Tongwei Co., Ltd. and its
subsidiaries at a fair market price, and will not use such
transactions to engage in any actions that damage the
interests of Tongwei Co., Ltd. and its subsidiaries;
guarantee to perform the information disclosure
obligations of related transactions in accordance with
relevant laws, regulations, listing rules and Tongwei
Co., Ltd.'s Articles of Association. The promiser
guarantees to strictly fulfill the above commitments. If
the rights and interests of Tongwei Co., Ltd. or the
target company are damaged due to the violation of the
above promises by the promiser and other enterprises
under its control, the promiser will bear the
corresponding compensation liabilities in accordance
with the law.
Others
Liu
Hanyuan,
Tongwei
Group
The promiser will not damage the independence of
Tongwei Co., Ltd. due to this reorganization, maintain
independence from Tongwei Co., Ltd. in terms of
assets, personnel, finance, organization and business,
and strictly abide by the relevant regulations of the
China Securities Regulatory Commission on the
independence of the listed company, and does not
violate regulations or use Tongwei Co., Ltd.to provide
guarantees, not to illegally occupy the funds of
Tongwei Co., Ltd., and maintains the independence of
Tongwei Co., Ltd.. This commitment remains valid for the legal and effective existence of Tongwei Co., Ltd.
and during the period when Liu Hanyuan is the actual
This
commitment
remains valid
and is being
implemented.
No Yes
Inapplicable
Inapplicable

2020 Annual Report
44 / 246
controller of Tongwei Co., Ltd. and Tongwei Group is
the controlling shareholder of Tongwei Co., Ltd. If the
promiser violates the above commitment and causes
loss to Tongwei Co., Ltd. and other shareholders, the
promiser shall bear the corresponding compensation
liability.
Others Tongwei
Group
Secretly appropriate and/or paid use of assets, funds,
and other resources of Tongwei Co., Ltd.; if the group
company and Tongwei Co., Ltd. have normal capital
exchanges, they will strictly abide by relevant laws,
regulations, administrative rules, and Articles of
Association (including but not limited to regulations on
related party transactions).
This
commitment
remains valid
and is being
implemented.
No Yes
Inapplicable
Inapplicable
Commitments
relating to the
initial public
offering
Solve the
horizontal
competition
Tongwei
Group
It will not and cause its affiliates not to develop,
operate or assist in the operation, participation, or
engagement of the main business of Tongwei Co.,
Ltd. alone or together on behalf of any person, firm or
company (enterprise, unit) that directly or indirectly
generates competition. Agree to compensate for all
loss, damages and expenses suffered by Tongwei Co.,
Ltd. due to the violation of the letter of commitment.
This
commitment
remains valid
and is being
implemented.
No Yes
Inapplicable
Inapplicable
Solve the
horizontal
competition
Liu
Hanyuan,
Guan Yamei
No longer invest in new shares in companies that are
related or similar to the company's business.
This
commitment
remains valid
and is being
implemented.
No Yes
Inapplicable
Inapplicable
Other Tongwei
Group
Secretly appropriate and/or paid use of assets, funds,
and other resources of Tongwei Co., Ltd.; if the group
company and Tongwei Co., Ltd. have normal capital
exchanges, they will strictly abide by relevant laws,
regulations, administrative rules, and Articles of
Association (including but not limited to regulations on
related party transactions).
This
commitment
remains valid
and is being
implemented.
No Yes
Inapplicable
Inapplicable

2020 Annual Report
45 / 246
Commitments
related to
refinancing
Restricted shares Non-public
offering
object
Qamdo Tongrui Industrial Partnership (Limited
Partnership), Shanghai Yusheng Investment
Management Co., Ltd., Shanghai Yingshui Investment
Management Co., Ltd.-Yingshui Yueyi No. 19 Private
Securities Investment Fund, Shanghai Xinghan Asset
Management Co., Ltd. (Xinghan Asset Management-
Xingyuan No. 5 Single Asset Management Plan),
Taikang Life Insurance Co., Ltd. Investment Link
Innovation Power Investment Account, E Fund
Management Co., Ltd., Yunnan Energy Investment
Capital Investment Co., Ltd., Hongde Fund
Management Co., Ltd., Dajia Asset Management Co.,
Ltd. -Blue Chip Selected No. 5 Collective Asset
Management Product, Dacheng Fund Management
Co., Ltd., Jiutai Fund Management Co., Ltd.,
Hillhouse Capital Management Co., Ltd.-China Value
Fund (Exchange), Caitong Fund Management Co.,
Ltd., Zhuque Fund Management Co., Ltd., Chengdu
Fusenmei Home Furnishing Co., Ltd., and Ruiyuan
Fund Management Co., Ltd. obtained the shares
through this non-public offering, which shall not be
transferred within 6 months from the end of the
issuance.
6 months
from
December 8,
2020.
Yes Yes
Inapplicable
Inapplicable
Commitments
related to
refinancing
Other Tongwei
Co., Ltd.
Before using raised funds or within 36 months after
the raised funds are in place, capital investment in
similar financial services or new capital investment in
Tongwei Agricultural Finance Guarantee Co., Ltd.
(including capital increase, borrowing, guarantee and
other forms of capital investment) shall not be
allowed.
Before all
raised funds
are used up or
within 36
months after
the funds
raised are in
place.
Yes Yes
Inapplicable
Inapplicable

2020 Annual Report
46 / 246
(II) The assets or projects of the Company have profit forecasts, and the reporting period is still
in the profit forecast period, the Company explains the reasons whether the assets and items
reach original profit forecast;
□Realized □Unrealized √Inapplicable
(III) Completion of performance commitments and its impact on goodwill impairment test
□Applicable √Inapplicable
III. Occupation of funds during the reporting period and progress in clearing debt
□Applicable √Inapplicable
IV. Explanation of the Company about the "non-standard opinion audit report" of the
accounting firm
□Applicable √Inapplicable
V. The analysis and explanation of the Company about the reasons and impact of changes in
accounting policies, accounting estimates or corrections of major accounting errors
(I) The analysis and explanation of the Company about the reasons and impact of changes in
accounting policies and accounting estimates
√Applicable □Inapplicable
The Ministry of Finance revised the Accounting Standards for Business Enterprises No. 14-Revenue
in 2017. The revised standard stipulates that for the first implementation of the standard, the amount of
retained earnings and other related items in the financial statements at the beginning of the year should be
adjusted according to the cumulative impact, and the information during the comparable period should not
be adjusted.
The Company has implemented the new revenue standard from January 1, 2020. According to the
standards, the Company only adjusts the retained earnings at the beginning of 2020 and the amount of
other related items in the financial statements for the cumulative impact of contracts that have not been
completed on the date of the first implementation, and the comparative financial statements are not
adjusted.
The Company adjusted the receivable electricity price subsidies corresponding to powerplants not
included in the national subsidy catalog from the original "accounts receivable" item to the "contract
assets" item for presentation. The tax-exclusive amount of advance receipts related to sales of goods was
adjusted from the original “advance receipts” item to “contract liabilities” and the corresponding added-
value tax and output tax were adjusted from the original “advance receipts” item to “other current liabilities”
"or "other non-current liabilities" presentation according to the liquidity, this change only affects the
presentation of financial statements, and does not affect total assets, net assets and net profit.
The impact of the above accounting policy changes on the financial statements is as follows:
① Consolidated balance sheet
Unit: Yuan Currency: RMB
Report item December 31, 2019 Adjustment number 2020/1/1
Accounts receivable 1,672,241,936.75 -998,603,103.27 673,638,833.48
Contract assets 998,603,103.27 998,603,103.27
Advance receipt 1,571,445,278.97 -1,521,138,014.69 50,307,264.28
Contract liabilities 1,484,683,326.76 1,484,683,326.76
Other current liabilities 1,123,805,086.92 36,454,687.93 1,160,259,774.85
② The balance sheet of the parent company
Unit: Yuan Currency: RMB
Report item December 31, 2019 Adjustment number 2020/1/1
Advance receipt 142,278,536.45 -137,760,053.55 4,518,482.90
Contract liabilities 137,648,472.21 137,648,472.21
Other current liabilities 1,099,583,333.30 111,581.34 1,099,694,914.64
Except for the above changes, other important accounting policy changes did not occur during the
reporting period.

2020 Annual Report
47 / 246
(II) Analysis and explanation of the Company about the reasons and impact of the correction of
major accounting errors
□Applicable √Inapplicable
(III) Communication with the former accounting firm
□Applicable √Inapplicable
(IV) Other notes
□Applicable √Inapplicable
VI. Appointment and dismissal of accounting firms
Unit: 10,000Yuan Currency: RMB
Now engaged
Name of domestic accounting
firm Sichuan Huaxin (Group) CPA Firm (Special General Partnership)
Remuneration of domestic
accounting firm 381
Audit period of domestic
accounting firm 20 years
Name Remuneration
Internal control auditing
accounting firm
Sichuan Huaxin (Group) CPA Firm (Special
General Partnership)
119
Financial consultant China Securities Co., Ltd. 0
Sponsor China Securities Co., Ltd. 400
Explanation of appointment and dismissal of accounting firms
√Applicable □Inapplicable
Approved by the company shareholders meeting of 2019, the Company renewed the appointment of
Sichuan Huaxin to provide services such as 2020 audit and internal control audit on May 12, 2020.
Explanation of reappointing an accounting firm during the audit
□Applicable √Inapplicable
VII. Face with the risk of listing suspension
(I) Reasons for the suspension of listing
□Applicable √Inapplicable
(II) Response measures to be taken by the Company
□Applicable √Inapplicable
VIII. Situation and reason for the termination of listing
□Applicable √Inapplicable
IX. Bankruptcy and reorganization related matters
□Applicable √Inapplicable
X. Major litigation and arbitration matters
□Have annually major litigation and arbitration matters √No annually major litigation and arbitration matters

2020 Annual Report
48 / 246
XI. Punishment and rectification of the listed company and their directors, supervisors, senior
managers, controlling shareholders, actual controllers, and acquirers
□Applicable √Inapplicable
XII. Explanation of the integrity status of the Company and its controlling shareholders and
actual controllers during the reporting period
□Applicable √Inapplicable
XIII. The situation and impact of the Company’s equity incentive plan, employee stock ownership
plan or other employee incentive measures
(I) Relevant incentive matters have been disclosed in the temporary announcement and there
is no progress or change in subsequent implementation
□Applicable √Inapplicable
(II) The temporary announcement is not disclosed or has follow-up progress incentives
Equity incentive situation
□Applicable √Inapplicable
Other notes
□Applicable √Inapplicable
Employee stock ownership plan
√Applicable □Inapplicable
The Company held the 20th meeting of the sixth board of directors on December 15, 2017, and
reviewed and approved the Employee Stock Ownership Plan (Draft) and its Summary of Tongwei Co., Ltd.
in 2017. It was reviewed on the first extraordinary general meeting of shareholders of 2018 held on January
5, 2018; please refer to the related announcements of the employee stock ownership plan of the Company
in 2017 published on the designated information disclosure media and the Shanghai Stock Exchange
website (www.sse.com.cn) on December 16, 2017 (Hereinafter referred to the "Employee Stock
Ownership Plan"). On May 7, 2018, the Company’s employee stock ownership plan "Yunxin-Hongrui No.
28 Collective Capital Trust Plan" bought 77,703,944 shares of the Company through the trading system
of the Shanghai Stock Exchange, accounting for 2.00% of the Company’s total equity; the total transaction
amount was 897,979,400 yuan, the average transaction price was 11.56 yuan/share, the lock-up period
was from May 8, 2018 to May 7, 2019, and the duration was 36 months, that is, until to January 5, 2021,
the Company has sold all company stocks held by the employee stock ownership plan before the expiration,
and the employee stock ownership plan has been implemented and terminated.
Other incentive measures
□Applicable √Inapplicable
XIV. Significant related transactions
(I) Related transactions related to daily operations
1. Matters that have been disclosed in the temporary announcement and have no progress or
changes in subsequent implementation
□Applicable √Inapplicable
2. Matters that have been disclosed in the temporary announcement, but there are progress or
changes in subsequent implementation
□Applicable √Inapplicable
3. Matters not disclosed in the temporary announcement
□Applicable √Inapplicable

2020 Annual Report
49 / 246
(II) Related transactions in the acquisition or sale of assets or equity
1. Matters that have been disclosed in the temporary announcement and have no progress or
changes in subsequent implementation
□Applicable √Inapplicable
2. Matters that have been disclosed in the temporary announcement, but there are progress or
changes in subsequent implementation
□Applicable √Inapplicable
3. Matters not disclosed in the temporary announcement
□Applicable √Inapplicable
4. If the performance agreements are involved, the performance achieved during the reporting
period shall be disclosed.
□Applicable √Inapplicable
(III) Significant related transactions for joint foreign investment
1. Matters that have been disclosed in the temporary announcement and have no progress or
changes in subsequent implementation
□Applicable √Inapplicable
2. Matters that have been disclosed in the temporary announcement, but there are progress or
changes in subsequent implementation
□Applicable √Inapplicable
3. Matters not disclosed in the temporary announcement
□Applicable √Inapplicable
(IV) Related credit and debt transactions
1. Matters that have been disclosed in the temporary announcement and have no progress or
changes in subsequent implementation
√Applicable □Inapplicable Summary of matters Query index
According to the needs of business management and investment
development, the Company intended to apply for the circulating
liquidity loans with a monthly balance not exceeding RMB 2
billion (conversion does not exceed RMB 1 billion based on the
actual occupation for the whole year) from Tongwei Group. The
one-year benchmark loan interest rate of People's Bank of China is
determined as the borrowing interest rate, and the expected interest
to be paid is about RMB 50 million (the borrowing interest rate will
be adjusted accordingly with the adjustment of the national one-
year benchmark loan interest rate). By the end of the reporting
period, the balance of this loan was 0 yuan.
On April 21, 2020, the Company
announced Announcement of
Tongwei Co., Ltd. on Related Transactions of Borrowing from
Tongwei Group Co., Ltd. in 2020
on the Shanghai Stock Exchange
website (www.sse.com.cn) and
designated information
disclosure media (Announcement
No.: 2020-050).
2. Matters that have been disclosed in the temporary announcement, but there are progress or
changes in subsequent implementation
□Applicable √Inapplicable
3. Matters not disclosed in the temporary announcement
□Applicable √Inapplicable
(V) Others
□Applicable √Inapplicable

2020 Annual Report
50 / 246
XV. Major contracts and their performance
(I) Custody, contracting and leasing matters
1. Custody situation
□Applicable √Inapplicable
2. Contracting situation
□Applicable √Inapplicable
3. Leasing situation
□Applicable √Inapplicable
(II) Guarantee situation
√Applicable □Inapplicable

2020 Annual Report
51 / 246
Unit:10,000Yuan Currency:RMB
External guarantee (excluding the guarantee to subsidiaries)
Guarantor
Relation
between guarantor and
listed
company
Guaranteed
party
Guaranteed
amount
Guarantee
date (agreement
signing
date)
Guarantee
Starting
date
Guarantee
expiration
date
Guarantee
type
Whether
the guarantee
has been
fulfilled
Whether
the guarantee
is
overdue
Amount overdue
Whether there is counter
guarantee
Whether it
is related party
guarantee
Association
relationship
Tongwei
Agricultural
Finance
Guarantee
Co., Ltd.
Wholly-
owned
subsidiaries
Farmers and
distributors 45,193.48 - 2020/1/3 2021/12/31
Joint and
several
liability
guarantee
No Yes 2,188.62 Yes No
Tongwei
Agricultural
Finance
Guarantee
Co., Ltd.
Wholly-
owned
subsidiaries
Farmers
(building a
rooftop
powerplant)
2,343.01 - 2017/9/15 2028/5/31
Joint and
several
liability
guarantee
No No - Yes No
Total amount of guarantees during the reporting period (excluding
guarantees to subsidiaries) 82,955.16
Total guarantee balance at the end of the reporting period (A)
(excluding guarantees to subsidiaries) 47,536.49
The guarantees of the Company and its subsidiaries to its subsidiaries
Total amount of guarantees to subsidiaries during the reporting period 930,660.32
Total balance of guarantees to subsidiaries at the end of the reporting
period (B) 755,700.83
The total guarantee amount of the Company (including guarantees to subsidiaries)
Total guarantee (A+B) 803,237.32
The proportion of total guarantees accounting for the net assets of the
Company (%) 25.46
Of which:
Amount of guarantee provided for shareholders, actual controllers and
their related parties (C)
The amount of debt guarantee provided directly or indirectly for the
guaranteed object whose debt-to-asset ratio exceeds 70% (D) 359,204.79
The amount of the total guarantee exceeding 50% of the net assets (E)

2020 Annual Report
52 / 246
The total amount of the above three guarantees (C+D+E) 359,204.79
Explanation of unexpired guarantees that may bear joint liability for
repayment
Explanation of guarantee The above overdue guarantee amount refers to the unrecovered guarantee compensation
balance at the end of the reporting period

2020 Annual Report
53 / 246
(III) Situation entrusting others to manage cash assets
1. Situation entrusting financial management
(1) The overall situation of entrusted financial management
√Applicable □Inapplicable
Unit:10,000Yuan Currency:RMB
Type Fund source Amount incurred Outstanding
balance Overdue irrecoverable
amount Floating income Own funds 33,500.00 - -
Floating income Raise funds 150,000.00 150,000.00 -
Other information
□Applicable √Inapplicable
(2) Situation of individual entrusted financial management
√Applicable □Inapplicable

2020 Annual Report
54 / 246
Unit:10,000Yuan Currency:RMB
Trustee Type of entrusted
financial
management
Entrusted
financial
managemen
t amount
Start date of
entrusted financial
management
End date of
entrusted financial
management
Fund
source Fund
direction
Remuneration
determination
method
Annual
yield
Expected
earnings
(if any)
Actual
gains
or
losses
Actual
recovery
Has
it
gone
through
legal
procedu
res?
Has it gone
through
legal
procedures?
Amount
of
provisio
n for
impairm
ent (if
any)
Chengdu Xindu
branch of Bank
of
Communication
s Co., Ltd.
Structured
deposit type S 3,000.00 2020/1/20 2020/2/10 Own
funds
Structured
deposit products
Floating income 2.70% / 4.66 3,000.00 Yes
Business
Department,
Chengdu
Branch of
Industrial Bank
3-
month USD de
posit product 500.00 2020/2/28 2020/5/29
Own
funds
Large dollar
deposit
certificate Floating
income 3.26% / 2.26 500.00 Yes
Harvest Fund
Management
Co., Ltd.
Harvest Money
Fund-Harvest
Express
Currency A 5,000.00 2020/3/3 2020/3/12
Own
funds Monetary
fund Floating income 2.27% / 2.83 5,000.00 Yes
Beijing
Hengtian
Mingze Fund
Sales Co., Ltd.
Nord Currency
B 5,000.00 2020/3/3 2020/3/12 Own
funds Monetary
fund Floating
income 2.06% / 2.58 5,000.00 Yes
Harvest Fund
Management
Co., Ltd.
Harvest Money
Fund-Harvest
Express
Currency A 10,000.00 2020/3/19 2020/5/7
Own
funds Monetary
fund Floating
income 2.44% / 28.19 10,000.00 Yes
Beijing
Hengtian
Mingze Fund
Sales Co., Ltd.
Cash
Management of
central banking
institution 10,000.00 2020/3/19 2020/5/7
Own
funds Monetary
fund Floating income 2.44% / 24.04 10,000.00 Yes
Chongqing
Branch of Ping
An Bank
Public
structured
deposits of Ping
An Bank (100%
guaranteed-
linked exchange
rate) RMB
18353 products
in 2020
25,000.00 2020/12/14 2021/3/15 Raise
funds Structured
deposit
products Floating
income 1.65%/
4.55% Yes
Chongqing
Branch of Ping
An Bank
Public
structured
deposits of Ping
An Bank (100%
guaranteed-
linked exchange
rate) RMB
18354 products
in 2020
25,000.00 2020/12/14 2021/3/15 Raise
funds Structured
deposit
products Floating income
1.65%/
4.55% Yes
Chengdu
Branch of
Shanghai
Pudong
Development
Bank
The company's
stable profit
fixed holding
period JG9014
period (90-day
network
exclusive)
50,000.00 2020/12/14 2021/3/15 Raise
funds Structured
deposit
products Floating
income 1.4%/
3.05%/
3.25%
Yes
Xindu branch of
Bank of
Communication
s
Yuntong
Wealth fixed-
term structured
deposits for 90
days of Bank of
Communication
s (gold-linked
bearish)
50,000.00 2020/12/16 2021/3/18 Raise
funds Structured
deposit
products Floating income
1.59%/
3.00% Yes
Total / 183,500.0
0
/ / / / / 64.57 33,500.00
Other situations
□Applicable √Inapplicable
(3) Impairment provision of entrusted financial management
□Applicable √Inapplicable
2. Entrusted loan situation
(1) General situation of entrusted loans
□Applicable √Inapplicable
Other situations □Applicable √Inapplicable
(2) Individual entrusted loans
□Applicable √Inapplicable

2020 Annual Report
55 / 246
Other situations
□Applicable √Inapplicable
(3) Entrusted loan impairment provision
□Applicable √Inapplicable
3. Other situations
□Applicable √Inapplicable
(IV) Other major contracts
√Applicable □Inapplicable
Overview of major contract matters Query index
The 24th meeting of the sixth board of directors of the
Company reviewed and approved the signing of a
major sales contract with Xi'an Longi Green Energy
Technology Co., Ltd. During the reporting period, the
major contract of the Company with Longi was being
actively implemented.
The Company announced the Announcement of
Tongwei Co., Ltd. about Signing Major Sales Contracts on the Shanghai Stock Exchange
website (www.sse.com.cn) and designated
information disclosure media on May 23, 2018,
(Announcement No.: 2018- 048).
The 25th meeting of the sixth board of directors of the
Company reviewed and approved the signing of a
major sales and procurement framework contract
with Tianjin Zhonghuan Semiconductor Co., Ltd.
During the reporting period, the major contract of the
Company with Zhonghuan was being actively
implemented.
The Company announced the Announcement of Tongwei Co., Ltd. about Signing Major Sales
Contracts and Purchasing Framework
Contracts on the Shanghai Stock Exchange
website (www.sse.com.cn) and designated
information disclosure media on May 28, 2018,
(Announcement No.: 2018- 051).
The 14th meeting of the seventh board of directors of
the Company deliberated and approved the major
sales framework contract signed by subsidiaries
Yongxiang Polysilicon, Yongxiang New Energy,
Inner Mongolia Tongwei, Yunnan Tongwei and
Jinko Solar and its subsidiary Sichuan Jinko. During
the reporting period, the major contract of the
Company with Jinko Solar shares was being actively
implemented.
The Company announced the Announcement of
Tongwei Co., Ltd. about Signing Major Sales Contracts on the Shanghai Stock Exchange
website (www.sse.com.cn) and designated
information disclosure media on November 7,
2020, (Announcement No.: 2020-115).
The 15th meeting of the seventh board of directors of
the Company deliberated and approved the major
sales framework contract signed by subsidiaries
Yongxiang Polysilicon, Yongxiang New Energy,
Inner Mongolia Tongwei, Yunnan Tongwei and
Trina Solar. During the reporting period, the major
contract of the Company with Trina Solar shares was
being actively implemented.
The Company announced the Announcement of
Tongwei Co., Ltd. about Signing Major Sales
Contracts with Trina Solar Co., Ltd. on the
Shanghai Stock Exchange website
(www.sse.com.cn) and designated information
disclosure media on November 18, 2020,
(Announcement No.: 2020-123).
The 15th meeting of the seventh board of directors of
the Company deliberated and approved the major
sales framework contract signed by subsidiaries
Yongxiang Polysilicon, Yongxiang New Energy,
Inner Mongolia Tongwei, Yunnan Tongwei and
Meike Silicon Energy. During the reporting period,
the major contract of the Company with Meike
Silicon Energy shares was being actively
implemented.
The Company announced the Announcement of
Tongwei Co., Ltd. about Signing Major Sales
Contracts with Baotou Meike Silicone Energy
Co., Ltd. on the Shanghai Stock Exchange
website (www.sse.com.cn) and designated
information disclosure media on November 18,
2020 (Announcement No.: 2020-124).
XVI. Explanation of other important matters
√Applicable □Inapplicable

2020 Annual Report
56 / 246
On April 17, 2020, the eighth meeting of the Company’s seventh board of directors deliberated and
approved the Proposal on the Company’s Non-public Offering of Stocks and other related proposals. For
details, please refer to the related announcements disclosed on the designated information disclosure
media and the Shanghai Stock Exchange of the Company on April 21, 2020 (www.sse.com.cn). This
matter has been reviewed and approved by the General Meeting of Shareholders in 2019. On October 14,
2020, the Company obtained the China Securities Regulatory Commission’s Reply of Approving Non-
public Offering of Shares of Tongwei Co., Ltd. (ZJXK [2020] No. 2492). For details, please refer to the
related announcements disclosed on the designated information disclosure media and the Shanghai Stock
Exchange website (http://www.sse.com.cn). According to the reply document, the Company issued
213,692,500 RMB common shares (A-shares) to 16 targets, the face value of each share is RMB 1.00, and
the issue price is RMB 28.00/share. The total amount of funds raised is RMB 5,983,390,000.00, and the
actual net amount of funds raised after deducting issuance costs is RMB 5,942,711,270.11. Sichuan
Huaxin has issued the "CHXY [2020] No.0084 Capital Verification Report" for the matter of the receipt
of the raised funds. The net raise funds from the non-public offering of shares will be used for 7.5GW
high-efficiency crystalline silicon solar cell projects in Meishan and Jintang and supplementing working
capital. On December 8, 2020, the non-public offering of shares was completed in the Shanghai Branch
of China Securities Depository and Clearing Co., Ltd., and the total share capital of the Company was
changed from 4,287,855,684 shares to 4,501,548,184 shares. The shares subscribed in this non-public
offering shall not be transferred within six months from the end of the issuance.
XVII. Actively fulfill social responsibilities
(I) Poverty alleviation work of the listed company
√Applicable □Inapplicable
1. Targeted poverty alleviation planning
√Applicable □Inapplicable
As an energy poverty alleviation model, PV poverty alleviation is also a kind of targeted poverty
alleviation. While protecting the ecological environment, it has effectively promoted the steady increase
of per capita income in poverty-stricken areas, and achieved the transformation of poverty alleviation
development from "help- the -poor " to " thoroughgoing ". In 2016, National Energy Administration and
National Development and Reform Commission promulgated the Opinions on the Implementation of PV
Power Generation to Alleviate Poverty and Management Measures of PV Powerplants for Poverty
Alleviation, which made proposals for the healthy development of PV industry for poverty alleviation and
called on enterprises to the PV poverty alleviation put into practice.
2. Summary of annual targeted poverty alleviation
√Applicable □Inapplicable
In order to promote the sustainable and healthy development of PV poverty alleviation and actively
practice corporate social responsibility, the Company has constructed a number of PV poverty alleviation
powerplant projects in Jilin, Shandong, Ningxia, Inner Mongolia, Sichuan and other regions. This model
not only effectively changes the extreme lack of electricity in local production and life, but also provides
monthly income and annual economic sources to poor households. It can solve the problem of economic
development for the next 10 years, 20 years or even a longer period, and take a new road of industrial
poverty alleviation, ecological development for poverty alleviation, and construction of clean energy
resources for poverty alleviation. Hence, The Company carries out important exploration and makes
positive contribution to China’s PV poverty alleviation, and poverty-stricken groups may get rid of poverty
and become rich and prosperous. It sets a complete “Tongwei example” for the poverty alleviation of
China. During the reporting period, the Company invested RMB 9,586,300 in poverty alleviation.
3. Achievements of targeted poverty alleviation
√Applicable □Inapplicable
Unit:10,000Yuan Currency:RMB
Index Quantity and development
1. Overall situation
Of which: 1. Funds 958.63

2020 Annual Report
57 / 246
2. Sub-item investment
1. Poverty alleviation by industrial development
Of which: 1.1 Types of industrial poverty alleviation
projects
□ Poverty alleviation in agriculture and
forestry industry
□Poverty alleviation through tourism
□Poverty alleviation through e-commerce
√Poverty alleviation through assets income
□Poverty alleviation through technology
□Other
1.2 Number of industrial poverty alleviation
projects (number) 6
1.3 Amount of investment in industrial
poverty alleviation projects 958.63
4. Follow-up targeted poverty alleviation plan
√Applicable □Inapplicable
On March 26, 2020, the Poverty Relief Office of State Council released the Recent Progress of Key
Poverty Alleviation Work in Recent Years, which summarized the poverty alleviation work until March
20. As one of the top ten targeted poverty alleviation projects, PV poverty alleviation has been affirmed
due to the contribution to poverty alleviation. The Company will continue to fulfill the corporate social
responsibility, actively respond to the country’s call for targeted poverty alleviation, and continue the “PV
poverty alleviation” work in combination with the industrial advantages. The project not only promotes
the development of local green new energy industry, but also drives the local industrial development,
improves the ecological environment, helps people to get rid of poverty and achieves the goal of lucid
water and green mountain and common prosperity.
(II) Social responsibility work
√Applicable □Inapplicable
Since the establishment, the Company has always been centered on the corporate vision of "For Better
Life", is committed to becoming a safe food supplier and clean energy operator, and realizes a high degree
of unification of corporate development and social value through the in-depth integration of the dual-green
main business. In terms of agriculture, while maintaining its own healthy development, the Company
continues to lead the sustainable development of aquaculture industry in our country, especially in the
aquaculture field, the original "Fishery& PV Integration" model of the Company has led the
transformation and upgrading from the traditional aquaculture model to automation, intelligence, and
large-scale modern aquaculture model, realized the efficient and compound utilization of the harvests of
“fish, electricity and environment”; in terms of PV new energy, under the urgent needs of global carbon
emission reduction and energy consumption transformation, the Company has continuously promoted the
cost reduction and efficiency enhancement of PV products by long-term scientific research and innovation
and the application of technological achievements, and has made contributions to accelerating the progress
of China and the global carbon-neutral process and jointly achieving the carbon neutrality goal. The
Company will continue to implement the "craftsmanship spirit" to deeply cultivate agriculture and clean
energy industries that are closely related to human life, and make efforts to continuously improve the
quality of human life. In the development process, the Company attaches great importance to the
construction of social responsibility, and constantly fulfills the corporate social responsibility:
1. Protection of shareholders' rights and interests
The Company attaches great importance to safeguarding the interests of shareholders, especially
small and medium shareholders. In accordance with the Company Law of the People’s Republic of China,
the Securities Law of the People’s Republic of China, the Code of Corporate Governance of Listed Company, the Stock Listing Rules of Shanghai Stock Exchange and other requirements, the Company has
established and improved the corporate governance structure, promoted standardized operations, and
ensured the legitimate rights and interests of shareholders, especially small and medium shareholders
through the authenticity, accuracy and completeness of information disclosure. During the reporting
period, the Company held three shareholder meetings, twelve meetings of the board of directors and eleven meetings of supervisors. The Company attaches great importance to communication with investors, and
strengthens communication with investors through methods such as telephone, e-mail, investor relations

2020 Annual Report
58 / 246
interactive platforms, and on-site research. The Company is committed to giving back to shareholders. It
has revised and improved the relevant articles on profit distribution in the "Regulations" for many times,
and formulated the Company Dividend Plan for the Next Three Years (2012-2014), Company Dividend Plan for the Next Three Years (2015-2017) and Company Dividend Plan for the Next Three Years (2018-
2020) in accordance with the provisions of the Articles of Association and relevant laws and regulations.
The Company strictly follows the plan and maintains a relatively high proportion of dividends, which is
really creating value for shareholders. The Company has always resolutely implemented the maintenance
of the legitimate rights and interests of shareholders and the return to shareholders as the established tasks
of the Company. Therefore, the Company has been recognized by the regulatory authorities for many
years.
2. Protection of the creditor's rights and interests
The Company attaches great importance to the protection of the rights and interests of creditors and
has established a complete creditor protection mechanism. The Company has a sound internal control
management system. Through using advanced information management methods, it has achieved efficient
and centralized management of funds and financing. Strict graded approval and review management can
ensure the safety of funds. The Company has a good reputation and maintains long-term cooperation with
policy banks, state-owned banks, joint-stock banks, and foreign banks. The Company uses credit funds in
strict accordance with the relevant regulations of the national regulatory authorities and bank management
requirements, and conducts complete life-cycle management of loans. During the reporting period, the
Company repaid the principal and interest of various loans in a timely manner and had no bad credit
records. The Company has a complete purchasing management process system to ensure the unification
of logistics, capital flow, and information flow. During the reporting period, the Company strengthened
its cooperation with strategic suppliers. The Company strictly implemented the purchasing agreement with
suppliers, paid for goods in time, and effectively maintained the interests of the company and creditors,
and obtained the good evaluation from the supplier.
3. Protection of the rights and interests of employees
The Company pays attention to protecting employees' rights, caring about the physical and mental
health of employees, and is committed to providing employees with a broad development platform. The
Company strictly abides by the Labor Law, Labor Contract Law, Social Insurance Law, Trade Union Law
and other laws and regulations to fully protect the legitimate rights and interests of employees. In terms of
employee care, the Company established the “Employee Care Mutual Fund” and established and improved
the corresponding management system. The fund is mainly used as medical expenses for employees and
their families, expenses for serious natural disasters, scholarship expenses for college entrance of
employees’ children, and expenses for employees’ marriage and childbirth. Until now, the funds have
been widely supported by the employees. The Company has established channels for employees to provide
suggestions and complaints, so that they can listen to their voices and build a better working atmosphere
together with them. In terms of employee growth, the Company continues to optimize the two promotion
channels, the management channel and the professional channel, to encourage employees to continuously
improve.
4. Supplier management and quality management
The Company has formulated a supplier management system and standardized the full life cycle
management of suppliers. Regular evaluations on supplier product qualification rate, customer complaints,
return rate and other product performance, delivery time, service quality, product control standards, etc.
are carried out, to ensure the product quality of the Company from the source. At the same time, through
close cooperation with suppliers, the Company promotes the exchange of advanced technology and
management concepts, promotes green supplier management, calls on suppliers to save energy, protect
the environment, and promote the coordinated development of industrial economic, environmental and
social benefits. The Company has established a full-process quality management system and management
system to fully ensure product quality, protect the rights and interests of customers and consumers, and
improve customer and consumer satisfaction.
5. Safe production and environmental protection
Safe production is the basic prerequisite for ensuring the steady development of the Company. The
Company complies with the requirements of relevant national laws and regulations, and has established
and improved a safety production management system. The Company introduced the Dupont safety
management concept earlier. In recent years, the Company has continued to promote the construction of Amoeba + Team and is committed to making safety production awareness be implemented in every team
and every employee. The Company attaches great importance to environmental protection, and is

2020 Annual Report
59 / 246
committed to strengthening environmental pollution control and developing a circular economy industrial
chain. In addition to strictly implementing various environmental protection laws and regulations and
national environmental protection standards and emission standards, the Company also continuously
strengthens resource recycling, material closed operation, and by-product recycling in the production
process, and promotes the implementation of various energy-saving and emission-reduction measures, and
actively practices the concept of harmonious development of enterprise development and ecological
environment.
6. Community construction and public welfare undertakings
The Company actively participates in community construction and public welfare activities to
promote the harmonious development of the Company and the community. Since its establishment, the
Company always regards the provision of social welfare as its responsibility, insists on the corporate
objective of “Striving for Excellence, Contributing to Society”, gives back to the society with love, widely
participates in the public welfare undertakings of construction of education and science popularization
bases, community donations, education donations and PV poverty alleviation, provides the local
employment post.
(III) Environmental information situation
1. Explanation of the environmental protection situation of companies and their important
subsidiaries that are key pollutant discharge units announced by the environmental protection
department
√Applicable □Inapplicable
(1) Emission information
√Applicable □Inapplicable
During the reporting period, the Company strictly implemented related laws and regulations of
environmental protection, and the construction and operation of environmental protection facilities can
meet the requirements of environmental protection management. The emission of wastewater, waste gas,
and solid waste in the production process of the Company can meet the requirements of relevant emission
standards, and clean production was realized. The relevant environmental information is as follows:
1) Production of Sichuan Yongxiang Polysilicon
① The main pollutants in wastewater: COD, ammonia nitrogen, and PH;
Emission method: continuous and stable emission.
Number of emission ports: 1 main emission port.
Emission standard: standard value Integrated Wastewater Discharge Standard (GB8978-1996) Table
4 First Level Standard); COD≤100mg/l; ammonia nitrogen≤15mg/l; 6≤PH≤9;
Emission concentration: COD: 11.77mg/l; ammonia nitrogen: 0.57mg/l; PH: 7.5; all meet
environmental protection emission standards.
Approved annual emissions: no limit on COD; and no limit on ammonia nitrogen;
Total emissions in 2020: COD: 3.703 tons; ammonia nitrogen: 0.205 tons.
②The main pollutants in boiler flue gas: sulfur dioxide, nitrogen oxides, and particulate matter.
Emission method: continuous and stable emission.
Number of emission ports: 2 emission ports.
Emission standard: standard value: special emission limit value in Table 3 of Emission Standard of
Air Pollutants for Boiler (GB13271-2014), sulfur dioxide ≤50mg/m3; nitrogen oxides ≤150mg/m3
(80mg/m3 according to EIA requirements); particulate matter ≤20 mg/ m3;
Emission concentration: sulfur dioxide: 1.04mg/m3; nitrogen oxides: 43.34mg/ m3; particulate matter:
1.05mg/ m3, all meet environmental protection emission standards.
Approved annual emissions: no limit on sulfur dioxide; no limit on nitrogen oxides ≤53.1 tons/year;
and no limit on particulate matter;
Total emissions in 2020: sulfur dioxide: 0.247 tons; particulate matter: 0.249 tons; nitrogen oxides:
10.329 tons, which are less than the approved annual emissions.
2) Production of Yongxiang New Energy High-purity Polysilicon
① The main pollutants in wastewater are: COD, ammonia nitrogen, and PH;
Emission method: continuous and stable emission.
Number of emission ports: 1 main emission port.
Emission standard: standard value Integrated Wastewater Discharge Standard (GB8978-1996) Table

2020 Annual Report
60 / 246
4 First Level Standard); COD≤100mg/l; ammonia nitrogen≤15mg/l; 6≤PH≤9;
Emission concentration: COD: 12.189mg/l; ammonia nitrogen: 1.895mg/l; PH: 7.718, all meet
environmental protection emission standards.
Approved annual emissions: no limit on COD; and no limit on ammonia nitrogen;
Total emissions in 2020: COD: 7.34 tons; ammonia nitrogen: 1.14 tons, all meet the emission
standards.
②The main pollutants in boiler flue gas are: sulfur dioxide, nitrogen oxides, and particulate matter.
Emission method: continuous and stable emission.
Number of emission ports: 2 emission ports.
Emission standard: standard value: special emission limit value in Table 3 of Emission Standard of Air Pollutants for Boiler (GB13271-2014); sulfur dioxide ≤50mg/ m3; nitrogen oxides ≤150mg/m3 (80
mg/m3 according to EIA requirements); particulate matter ≤20mg/ m3.
Emission concentration: sulfur dioxide: 0.1585mg/ m3; nitrogen oxide: 49.99mg/ m3; particulate
matter: 5.76mg/ m3, all meet environmental protection emission standards.
Approved annual emissions: no limit on sulfur dioxide, nitrogen oxides ≤59.904 tons/year; and no
limit on particulate matter;
Total emissions in 2020: sulfur dioxide: 0.025 tons; nitrogen oxides: 8.01 tons; particulate matter:
0.924 tons, all meet emission standards.
3) Production of Inner Mongolia Tongwei High-purity Crystalline Silicon
The main pollutants in boiler flue gas are: sulfur dioxide, nitrogen oxides, and particulate matter.
Emission method: continuous and stable emission.
Number of emission ports: 2 emission ports.
Emission standard: Standard value: newly-built boiler emission limits in Table 2 of Emission Standard of Air Pollutants for Boiler (GB13271-2014); sulfur dioxide ≤50mg/m3; nitrogen oxide
≤200mg/m3; particulate matter ≤20mg/m3.
Emission concentration: sulfur dioxide: 1.35mg/ m3; nitrogen oxide: 56.2mg/ m3; particulate matter:
9.83mg/ m3, all meet environmental protection emission standards.
Approved annual emissions: sulfur dioxide ≤1.36 tons/year; nitrogen oxides ≤67.36 tons/year;
Total emissions in 2020: sulfur dioxide: 0.338 tons; nitrogen oxides: 13.027 tons, both of which are
less than the approved annual emissions.
4) Production of Yongxiang PVC and Sodium hydroxide:
① The main pollutants in wastewater are: COD, ammonia nitrogen, and PH;
Emission method: continuous and stable emission.
Number of emission ports: 1 main emission port.
Emission standard: standard value: Emission Standard of Pollutants for Caustic Alkali and Polyvinyl
Chloride Industry (GB15581-2016); COD≤60mg/l; ammonia nitrogen≤15mg/l; 6≤PH≤9.
Emission concentration COD: 20.99mg/l; ammonia nitrogen: 5.19mg/l; PH: 6~9, all meet
environmental protection emission standards.
Approved annual emissions: COD≤39 tons/year; ammonia nitrogen≤9.75 tons/year;
Total emissions in 2020: COD: 4.89 tons; ammonia nitrogen: 1.21 tons, both of which are less than
the approved annual emissions.
②Heavy metals: mercury chloride, which is mainly used as the vinyl chloride synthesis catalyst. The
annual output of waste mercury-containing catalysts is 183.49 tons. It is in the Catalogue of National
Hazardous Wastes, the code is HW29, and it will be uniformly sent to qualified manufacturers for
recycling.
5) Production of Yongxiang cement:
The main pollutants in the waste gas: smoke (powder) dust, SO2 and NOX.
Emission method: continuous and stable emission.
Number of emission ports: 2 emission ports.
Emission standards: air pollutants: standards in Emission Standards of Air Pollutants for Cement
Industry (GB4915-2013).
Emission concentration: smoke (dust) dust: kiln concentration: 3.85 mg/m3, kiln tail concentration:
1.39 mg/m3; kiln emission: 5.55 tons, kiln tail emission: 2.24 tons; SO2: 6.18mg/m3; NOX: 121.32mg/m3;
all meet environmental protection emission standards. Approved annual emissions: SO2: 140 tons/year; NOX: 450.3 tons/year.
Total emissions in 2020: SO2: 10.89 tons; NOX: 216.16 tons, both of which are less than the approved
emissions.

2020 Annual Report
61 / 246
6) Production of Chengdu solar cell:
①The main pollutants in wastewater:
General pollutants: COD, ammonia nitrogen, pH;
Particular pollutants: fluoride.
Emission method: continuous and stable emission.
Number of emission ports: 2 emission ports.
Emission standard: indirect emission standards for solar cells in Table 2 of the Emission Standard of
Pollutants for Battery Industry (GB30484-2013); COD≤150mg/l; ammonia nitrogen≤30mg/l; 6≤pH≤9;
fluoride≤8mg/l. Emission concentration: COD: 27.16mg/l; ammonia nitrogen: 5.1 mg/l; pH: 7.51; fluoride:
4.84 mg/l. All meet environmental protection emission standards.
Approved annual emissions: COD≤1109.8 tons/year; ammonia nitrogen≤221.9 tons/year;
Total emissions in 2020: COD: 115.64 tons; ammonia nitrogen: 27.5 tons, both of which are less than
the approved annual emissions.
The main pollutants in the waste gas: fluoride, hydrogen chloride, chlorine, sulfuric acid mist,
ammonia, particulate matter, and volatile organic compounds;
Particular pollutants: fluoride.
Emission method: continuous and stable emission.
Number of emission ports: 30.
Emission standards: ammonia implements the standard limits in Table 2 of the Emission Standards
for Odor Pollutants (GB14554-1993); volatile organic compound implements the manufacturing standard
of electronic product industry in Table 3 of Sichuan Emission Control Standard for Volatile Organic Compound (DB51/2377-2017); and the remaining waste gas implements the standard values of solar cells
in Table 5 of the Emission Standard of Pollutants for Battery Industry (GB30484-2013). Ammonia
≤14kg/h; volatile organic compounds ≤60 mg/m³; fluoride ≤3 mg/m³; chlorine ≤5 mg/m³; particulate
matter ≤30 mg/m³; hydrogen chloride ≤5mg/m³; nitrogen oxides ≤30 mg /m³.
Emission concentration: fluoride 0.45mg/m3; chlorine 1.61mg/m³; particulate matter 8.09 mg/m³;
nitrogen oxides 8.98mg/m³; volatile organic compounds 1.62 mg/m³; hydrogen chloride 0.68mg/m³;
ammonia 0.37kg/h; and all meet environmental protection emission standards.
Approved annual emissions: nitrogen oxides ≤107.05 tons/year, volatile organic compounds ≤34.72
tons/year;
Total emissions in 2020: nitrogen oxides: 52.29 tons; volatile organic compounds: 7.3 tons, both of
which are less than the approved annual emissions.
② Environmental protection facilities and operation conditions:
According to the different natures of the waste gas emitted by the workshop, the Company selects
the matching treatment process:
Phase-I project
Acid and alkali waste gas: alkali texturing and pickling acid and alkali waste gas, diffusion acid and
alkali waste gas are discharged through a 25-meter high exhaust cylinder after being respectively collected
by 2 sets of negative pressure exhaust systems and treated by lye spray tower; PSG cleaning acid and
alkali waste gas is discharged through a 25-meter high exhaust cylinder after being treated by a set of four-
stage acid and alkali redox scrubbing tower.
Coating waste gas: after burned through 8 combustion chambers, the coating waste gas is collected
by one set of negative pressure exhaust system, and the coating waste gas is discharged through a 25-meter
high exhaust cylinder after being treated by an acid scrubbing tower.
Organic waste gas: the organic waste gas is discharged through a 15-meter high exhaust cylinder after
being treated by 2 sets of activated carbon + low temperature plasma treatment system.
Phase-II project
Acid and alkali waste gas: a set of four-stage acid and alkali scrubbing tower is respectively installed
on the first and second floors of the alkali texturing, pickling, and diffusion acid and alkali waste gas
workshops for treatment, and then the waste gas is discharged through a 25-meter high exhaust cylinder;
the first and second floors of PSG cleaning acid and alkali waste gas workshop share a set of four-stage
acid alkali rebox scrubbing tower for treatment and then is discharged through a 25-meter high exhaust
cylinder.
Coating waste gas: after burned through 14 combustion chambers, the two floors of the coating waste
gas are collected by one set of negative pressure exhaust system, and the coating waste gas is discharged
through a 25-meter high exhaust cylinder after being treated by an acid scrubbing tower.
Organic waste gas: the first and second floors of the organic waste gas are discharged through two

2020 Annual Report
62 / 246
25-meter high exhaust cylinders after being treated by 1 set of activated carbon + low temperature plasma
treatment system.
Phase-III project
Acid and alkali waste gas: a set of first-stage acid and alkali scrubbing tower is respectively installed
on the alkali texturing, pickling, and diffusion acid and alkali waste gas workshops in south and north
areas for treatment, and then the waste gas is discharged through a 25-meter high exhaust cylinder; a set
of four-stage acid alkali rebox scrubbing tower is respectively set in the PSG cleaning acid and alkali waste
gas workshop for treatment, and then the waste gas is discharged through a 25-meter high exhaust cylinder.
Coating waste gas: after burned through 12 combustion chambers, the coating waste gas in south and
north areas is collected by one set of negative pressure exhaust system, and the coating waste gas is
discharged through a 25-meter high exhaust cylinder after being treated by an acid scrubbing tower.
Organic waste gas: the organic waste gas in the north and south areas is discharged through a 25-
meter high exhaust cylinder after being treated by a set of activated carbon + low-temperature plasma
treatment system.
Phase-IV project
Acid and alkali waste gas: a set of first-stage acid and alkali scrubbing tower is set in the south and
north areas of alkali texturing, pickling, diffusion, and PSG cleaning acid alkali waste gas for treatment,
and then the waste gas is discharged by 25-meter high exhaust cylinder.
Coating waste gas: after burned through 11 combustion chambers, the coating waste gas in south and
north areas is collected by one set of negative pressure exhaust system, and the coating waste gas is
discharged through a 25-meter high exhaust cylinder after being treated by an acid scrubbing tower.
Organic waste gas: the organic waste gas in the north and south areas is discharged through the 25-
meter high exhaust cylinder after being treated by the front-end combustion chamber + the end activated
carbon treatment system.
Waste gas in wastewater treatment station: a small amount of waste gas will be produced during the
waste water treatment process. The main pollutants are fluoride, hydrogen chloride, hydrogen sulfide, and
ammonia. The project will cover and seal the waste liquid collection pool, emergency pool and dosing
tank system structures of the waste water treatment station, collect and treat the waste gas pollutants
generated by each structure, and use the H2SO4/NaOH/NaClO three-stage spray method for treatment, and
the treated waste gas is discharged through a 25m exhaust cylinder.
Production wastewater and domestic wastewater are equipped with different treatment facilities due
to different natures and treatment processes:
Phase-I and phase-II projects: the production wastewater is treated by the self-built sewage treatment
station through three-stage physical and chemical + two-stage A/O biochemical treatment, with a
maximum daily treatment capacity of 4200m³; the domestic wastewater is treated by a set of buried
domestic sewage treatment equipment; after reaching the standard through treatment, the domestic sewage
and production wastewater are discharged to the downstream Maojiawan Sewage Treatment Plant through
a total sewage treatment emission port of the Company.
Phase-III and phase-IV projects: the production wastewater is treated by the self-built sewage
treatment station through the three-stage physical and chemical + two-stage A/O biochemical treatment,
with a maximum daily treatment capacity of 11,600m³. Domestic wastewater is drained to the sewage
treatment station for treatment. After reaching the standard, the wastewater will be discharged to the
downstream Maojiawan Sewage Treatment Plant through a total sewage treatment emission port of the
Company, and the environmental protection treatment facilities are operating normally.
Solid waste: general industrial solid waste is mainly sludge generated in wastewater stations,
ammonium sulfate waste liquid, and packaging material waste generated in production; hazardous waste
mainly includes acid and alkali hazardous waste, waste activated carbon, waste engine oil, etc.
In 2020, 44473.4 tons of industrial solid waste was generated and 44473.4 tons were treated
reasonably. 77.44 tons of hazardous waste was generated and 67.613 tons were treated reasonably. Up to
now, the industrial solid waste and hazardous waste have been treated in accordance with the requirements
of relevant environmental protection regulations.
7) Production of Meishan solar cell:
① The main pollutants in wastewater: general pollutants: COD, ammonia nitrogen, pH, total nitrogen;
particular pollutants: fluoride.
Emission method: continuous and stable emission. Number of emission port: there are 3 total wastewater emission ports, namely production wastewater
emission port, general wastewater emission port and domestic sewage emission port; the general

2020 Annual Report
63 / 246
wastewater emission port and the production wastewater emission port are located on the west side of the
plant, and domestic sewage emission port is located on the south side of the plant.
Emission standard: the production wastewater implements the indirect emission standard in Table 2
of the Emission Standard of Pollutants for Battery Industry (GB30484-2013), and the pollution factors
and chlorides meet the design influent water quality standards for the first zone of Xiuwen Town Sewage
Treatment Plant in Ganmei Industrial Park; the general wastewater implements the design the influent
water quality standards for the auxiliary constructed wetland in the second zone of Xiuwen Town Sewage
Treatment Plant in Ganmei Industrial Park; the domestic wastewater implements the three-stage standard
in Table 4 of the Integrated Wastewater Discharge Standard (GB 8978-1996), and B-level standard limits
in Table 1 of Wastewater Quality Standards for Discharge to Municipal Sewers (GB/T 31962-2015) Table
1, and meets the designed water quality standards for the second zone of Xiuwen Town Sewage Treatment
Plant in Ganmei Industrial Park;
Wastewater emission concentration: COD: 85mg/l; ammonia nitrogen: 20.5mg/l; pH: 7.5; total
nitrogen: 18.4mg/l; fluoride: 4.64mg/l, all meet environmental protection emission standards.
Total emissions in 2020: COD: 87.22 tons; ammonia nitrogen: 16.93 tons
②The main pollutants in the waste gas: fluoride, chlorine, particulate matter, hydrogen chloride and
volatile organic compounds; particular pollutants: fluoride.
Emission method: continuous and stable emission.
Number of emission ports: 8 waste gas emission ports.
Emission standard: the emission standard value of solar cell waste gas in Table 5 of Emission
Standard of Pollutants for Battery Industry (GB30484-2013): nitrogen oxide ≤ 30mg/m³; fluoride ≤
3mg/m³; chlorine ≤ 5mg/m³; particulate matter ≤ 30mg/m³; hydrogen chloride ≤5mg/m³; in Emission
Standard for Odor Pollutants (GB14554-93): ammonia ≤14mg/m³ (process waste gas); ammonia
≤20mg/m³ (wastewater station waste gas); hydrogen sulfide ≤0.9kg/ h; odor concentration: in 6000
Sichuan Emission Control Standard for Volatile Organic Compound (DB 51/2377-2017) standard: volatile
organic compound ≤60mg/m³.
Emission concentration of waste gas: fluoride: 1.66mg/m3; chlorine: 1.56mg/m3; particulate matter:
20.113mg/m3; hydrogen chloride: 0.49mg/m3, VOCs: 2.34mg/m3, all meet environmental emission
standards.
Total emissions in 2020: particulate matter: 0.622 tons, VOCs: 3.44 tons.
Construction and operation of pollution prevention facilities:
Wastewater treatment facilities: a wastewater treatment station is built in the plant, with a daily
treatment capacity of 5,800 tons, and the "three-stage physical and chemical (coagulation and
sedimentation) + two-stage biochemical (A/O)" treatment process is adopted.
Waste gas treatment facilities: the Company selects matching treatment processes according to the
different natures of the waste gas emitted by the workshop.
Acid and alkali waste gas: the acid and alkali waste gas produced by texturing, diffusion, and PSG
cleaning is discharged through two 30m high exhaust cylinders after being treated by 2 sets of alkaline
scrubbing towers. One set of waste gas treatment system is respectively installed on the east and west sides
of the workshop.
Coating waste gas: the coating waste gas comes from the PECVD process, and is discharged by two
30m exhaust cylinders after being treated by 20 sets of process end burners + 2 sets of two-stage water
and sulfuric acid scrubbing towers.
Organic waste gas: the organic waste gas mainly comes from the printing, drying and sintering
processes. The organic waste gas of each workshop is discharged by two 20m exhaust cylinders after being
treated by 2 parallel combustion towers + three-use and one-standby activated carbon adsorption device.
Boiler waste gas: the powerplant is equipped with two 3.5MW/h gas boilers, the fuel is natural gas,
and a low-nitrogen combustion device is installed. The boiler flue gas emission volume is 36050 N m³/h.
The main pollutants in the flue gas are NOx, soot and SO2, which are discharged through a 15m chimney.
Waste gas in wastewater treatment station: a small amount of waste gas will be produced during the
waste water treatment process. The main pollutants are fluoride, hydrogen chloride, hydrogen sulfide, and
ammonia. The project will cover and seal the waste liquid collection pool, emergency pool and dosing
tank system structures of the waste water treatment station, collect and treat the waste gas pollutants
generated by each structure, and use the H2SO4/NaOH/NaClO three-stage spray method for treatment, and
the treated waste gas is discharged through a 25m exhaust cylinder. Solid waste: general industrial solid waste is mainly sludge generated in wastewater stations,
ammonium sulfate waste liquid, and packaging material waste generated in production; hazardous waste

2020 Annual Report
64 / 246
mainly includes acid and alkali hazardous waste, waste activated carbon, waste engine oil, etc.
In 2020, 6,156 tons of industrial solid waste was generated and 6,156 tons were treated reasonably.
0.788 tons of hazardous waste was generated. Up to now, the industrial solid waste and hazardous waste
have been processed in accordance with the requirements of relevant environmental protection regulations.
8) Production of Hefei solar cell:
① The main pollutants in wastewater: general pollutants: COD, ammonia nitrogen, pH, total nitrogen;
particular pollutants: fluoride.
Emission method: continuous and stable emission.
Number of emission ports: 1 main wastewater emission port.
Emission standard: the indirect emission limit of solar cells in Emission Standard of Pollutants for Battery Industry (GB30484-2013) and the takeover standard of Hefei Western Group Wastewater
Treatment Plant; COD≤150mg/l; ammonia nitrogen≤30mg/l; 6≤pH≤9, total nitrogen≤40mg/l;
fluoride≤8mg/l.
Wastewater emission concentration: COD: 24.75mg/l; ammonia nitrogen: 12.30mg/l; pH: 6.73; total
nitrogen: 16.95mg/l; fluoride: 4.43mg/l, all meet environmental protection emission standards.
Total emissions in 2020: COD: 44.129 tons; ammonia nitrogen: 21.386 tons
②The main pollutants in the waste gas: fluoride, chlorine, particulate matter, nitrogen oxides,
hydrogen chloride and volatile organic compounds; Particular pollutants: fluoride.
Emission method: continuous and stable emission.
Number of emission ports: 31 waste gas emission ports of Hefei Company.
Emission standard: the emission standard value of solar cell waste gas in Table 5 of Emission
Standard of Pollutants for Battery Industry (GB30484-2013): nitrogen oxide ≤ 30mg/m³; fluoride ≤
3mg/m³; chlorine ≤ 5mg/m³; particulate matter ≤ 30mg/m³; hydrogen chloride ≤5mg/m³; volatile organic
compounds refer to the Tianjin Industrial Enterprise Volatile Organic Compound Emission Control
Standard (DB16297-2014): volatile organic compounds ≤50mg/m³.
Emission concentration of waste gas: nitrogen oxide: 9.75mg/m3; fluoride: 0.07mg/m3; chlorine:
2.36mg/m3; particulate matter: 4.56mg/m3; hydrogen chloride: 1.0mg/m3, VOCs: 1.65mg/m3, all meet
environmental protection emission standards.
Total emissions in 2020: nitrogen oxides: 12.84 tons, VOCs: 3.183 tons.
In 2020, 9003.73 industrial solid wastes and 64.64 tons of hazardous wastes were generated, 8247.9
tons of solid wastes and 64.64 tons of hazardous wastes were treated reasonably. Up to now, the industrial
solid waste and hazardous waste have been processed in accordance with the requirements of relevant
environmental protection regulations.
Construction and operation of pollution prevention facilities:
Wastewater treatment facilities: there is a set of three-stage physical and chemical + biochemical
pretreatment + two-stage A/O wastewater treatment system, with a designed daily treatment capacity of
4,320 tons and normal operation;
Waste gas treatment facilities: the Company selects matching treatment processes according to the
different natures of the waste gas emitted by the workshop.
Acid and alkali waste gas: the waste gas generated in the cleaning and texturing process is processed
by the oxidation spray tower + reduction spray tower, the waste gas generated in the diffusion process is
processed by the first-stage NaOH solution sieve packing tower, and the waste gas generated by the etching
is discharged by a 25-meter exhaust cylinder after being treated by the three-stage SDG chemical catalytic
adsorption tower.
Coating waste gas: the waste gas generated in the PECVD process is treated by an incinerator + water
spray, and the waste gas from the above process is discharged through a 25-meter exhaust cylinder after
the treatment.
Organic waste gas: the waste gas generated in the printing and sintering processes is discharged
through a 15-meter exhaust cylinder after on-line combustion + activated carbon adsorption treatment; the
waste gas generated in the module M1 workshop is discharged through a 15-meter exhaust cylinder after
activated carbon adsorption treatment, and the waste gas generated in module M2 workshop is discharged
through a 25-meter high exhaust cylinder after low-temperature plasma + activated carbon adsorption
treatment, and the waste gas generated in the M3 workshop is discharged through a 25-meter high exhaust
cylinder after low-temperature plasma + activated carbon adsorption treatment.
9) Production of Anhui solar cell:
① The main pollutants in wastewater: general pollutants: COD, ammonia nitrogen, pH, total
nitrogen; Particular pollutants: fluorine.

2020 Annual Report
65 / 246
Emission method: continuous and stable emission.
Number of emission ports: 1 main wastewater emission port.
Emission standard: the indirect emission limit of solar cells in Emission Standard of Pollutants for Battery Industry (GB30484-2013) and the takeover standard of Hefei Western Group Wastewater
Treatment Plant; COD≤150mg/l; ammonia nitrogen≤30mg/l; 6≤pH≤9, total nitrogen≤40mg/l;
fluoride≤8mg/l.
Wastewater emission concentration: COD: 48.55mg/l; ammonia nitrogen: 7.10mg/l; pH: 7.15; total
nitrogen: 17.56mg/l; fluoride: 4.015mg/l. All meet environmental protection emission standards.
Total emissions in 2020: COD: 139.23 tons; ammonia nitrogen: 14.106 tons
②The main pollutants in the waste gas: fluoride, chlorine, particulate matter, nitrogen oxides,
hydrogen chloride and volatile organic compounds; particular pollutants: fluoride.
Emission method: continuous and stable emission.
Number of emission ports: 10 waste gas emission ports of the Anhui Company.
Emission standard: the emission standard value of solar cell waste gas in Table 5 of Emission
Standard of Pollutants for Battery Industry (GB30484-2013): nitrogen oxide ≤ 30mg/m³; fluoride ≤
3mg/m³; chlorine ≤ 5mg/m³; particulate matter ≤ 30mg/m³; hydrogen chloride ≤5mg/m³; volatile organic
compounds refer to the Tianjin Industrial Enterprise Volatile Organic Compound Emission Control
Standard (DB16297-2014): volatile organic compounds ≤50mg/m³.
Emission concentration of waste gas: nitrogen oxide: 13mg/m3; fluoride: 0.89mg/m3; chlorine:
1.99mg/m3; particulate matter: 9.31mg/m3; hydrogen chloride: 0.58mg/m3, VOCs: 5.67mg/m3, all meet
environmental protection emission standards.
Total emissions in 2020: nitrogen oxides: 8.141 tons, VOCs: 11.461 tons.
In 2020, 10235.6 industrial solid wastes and 46.31 tons of hazardous wastes were generated,
10189.31 tons of solid wastes and 44.11 tons of hazardous wastes were treated reasonably. Up to now, the
industrial solid waste and hazardous waste have been treated in accordance with the requirements of
relevant environmental protection regulations.
Construction and operation of pollution prevention facilities:
Wastewater treatment facilities: there is a set of two-stage physical and chemical + biochemical
pretreatment + two-stage A/O wastewater treatment system, with a designed daily treatment capacity of
8,000 tons and normal operation.
Waste gas treatment facilities: the Company selects matching treatment processes according to the
different natures of the waste gas emitted by the workshop.
Acid and alkali waste gas: the waste gas generated in the cleaning and texturing process is treated by
the alkali spray tower, the waste gas generated in the diffusion process is treated by the NaOH solution
sieve packing tower, and the waste gas generated by etching is treated by the oxidation spray tower +
reduction spray tower, and then discharged at high altitude through a 30-meter exhaust cylinder.
Coating waste gas: the waste gas generated in the PECVD process is treated by incineration tower +
water spray, and the waste gas generated in the printing and sintering process is treated by on-line
combustion + low temperature plasma + activated carbon adsorption and discharged by a 30-meter exhaust
cylinder.
(2) Construction and operation of pollution prevention facilities
√Applicable □Inapplicable
In accordance with the requirements of the environmental assessment report, various pollution control
facilities have been constructed:
1) Wastewater treatment facilities mainly include: domestic sewage treatment devices, sewage treatment
stations, and high-salt wastewater concentration devices, all operate normally;
2) Waste gas treatment facilities mainly include: process waste gas leaching devices, dust removal systems,
etc., all operate normally;
3) The solid waste related facilities mainly include: waste slag shed, hazardous waste temporary storage
room, etc., which are managed in strict accordance with environmental protection requirements;
4) Noise control facilities mainly include: noise reduction and vibration reduction measures are taken for
the noise equipment, and silencers are installed at the vents, and they are operating normally.

2020 Annual Report
66 / 246
(3) Environmental impact assessment of construction projects and other environmental protection
administrative permits
√Applicable □Inapplicable
Tongwei Solar: 1) Annual capacity of 3.8GW high-efficiency solar cell project of Chengdu Solar passed independent
acceptance and online registration on August 26, 2020. At present, the output of the workshop is stable,
and various environmental protection facilities and equipment are operating normally. Chengdu Solar
strictly follows the emission permit for major pollutants in Shuangliu District, Chengdu. The permit
number is: 915101225722584966001Q.
2) On January 10, 2020, Meishan Solar obtained the Approve of the Environmental Impact Report on
the Application Project of Tongwei Solar (Meishan) Co., Ltd. with an Annual Capacity of 3.8GW High-efficiency Crystalline Silicon Solar Cell Domestic Intelligent Equipment (System) from the Meishan
Municipal Bureau of Ecology and Environment. (MSHJH [2020] No. 8). In April 2020, the Company
changed the cell size used in the first phase of the project. Before and after the change, the cell size was
changed from 156mm*156mm to 210mm*210mm; after the change, the power generation of the cell is
increased, and the power generation of the product has changed from the original annual capacity of
3.8GW to the annual capacity of 7.5GW, but the number of purchased silicon wafers and the total number
of cells will not change. The project does not involve major changes, after being approved by Meishan
Ecological Environment Bureau, 3.8GW project of our Company was renamed as "application project of
domestic intelligent equipment (system) with an annual capacity of 7.5GW high-efficiency crystalline
silicon solar cells". The original environmental assessment approve is still valid. On April 16, 2020, it
obtained the "Explanation on the Relevant Situation of the Tongwei High-efficiency Crystalline Silicon
Solar Cell Project" from the Meishan City Ecological Environment Bureau. On July 17, 2020, the project
obtained the "emission permits" issued by the Leshan Ecological Environment Bureau, with the pollutant
discharge permit number: 91511400MA686MWR2C001Q. Project acceptance and online registration
were completed on October 28, 2020.
3) The Meishan Phase-II 7.5GW high-efficiency solar cell project was put on record at the Meishan
Development and Reform Commission on February 27, 2020 (CTZB [2020-511400-38-03-426415]
FGQB-0019 No.), the project obtained the Approve of the Environmental Impact Report of Tongwei Solar
(Meishan) Co., Ltd. with Annual Capacity of 7.5GW High-efficiency Crystalline Silicon Solar Cell
Domestic Intelligent Factory Project On June 15, 2020 from Meishan City Ecological and Environment
Bureau (MSHJH [2020] No. 37).
4) Hefei solar high-efficiency module project: the project obtained Approval Opinions on High-
efficiency Module Project Environmental Impact Report Form about Tongwei solar (Hefei) Co., Ltd. from
high-tech branch of Hefei Environmental Protection Bureau on October 16, 2019 (HGS [2019] No.088).
The project carried out the design and construction of environmental protection facilities in accordance
with environmental protection laws and regulations and environmental assessment requirements. The
Company strictly implements pollution emission in accordance with the emission permit, the permit
number is 91340100560687779D001V.
5) Anhui Solar high-efficiency solar cell project with annual capacity of 250MW: the project obtained
the Approve of Environmental Impact Assessment Report for 250MW Annual Output High-efficiency Solar
Cell Project about Tongwei Solar (Anhui) Co., Ltd. from Hefei Environmental Protection Bureau on
August 5, 2020 (HJS [2020] No. 34). The project carried out the design and construction of environmental
protection facilities in accordance with environmental protection laws and regulations and environmental
assessment requirements. The Company strictly implements pollution emission in accordance with the
emission permit, the permit number is 91340100083692631N001V. On June 3, 2020, a letter that the
cleaning production audit report of Tongwei Solar (Anhui) Co., Ltd. is passed from the Ecological
Environment Branch of Hefei High-tech Industrial Development Zone (HGHQS [2020] No. 4) was
obtained.
Yongxiang:
1) Leshan Phase-II 50,000MT High-purity Polysilicon Project
On December 31, 2020, the approval opinion of Leshan Ecological Environment Bureau was
obtained (LSHS [2020] No. 56). The project was designed in accordance with relevant laws and
regulations, environmental assessment and environmental assessment approval requirements, and is
currently under construction.
2) Baoshan Phase-I 50,000MT High-purity Polysilicon Project

2020 Annual Report
67 / 246
On December 14, 2020, the approval opinions of Baoshan Ecological Environment Bureau (BHZ
[2020] No. 29) and the project environmental impact report were obtained. The project was designed in
accordance with relevant laws and regulations, environmental assessment and environmental assessment
approval requirements, and is currently under construction.
(4) Emergency plans for environmental emergencies
√Applicable □Inapplicable
In order to prevent and reduce environmental pollution accidents, standardize the emergency
management and emergency response procedures of the Company for environmental emergencies,
establish a unified command, hierarchical responsibility, and rapid response emergency work mechanism,
carry out emergency rescue work in a timely and effective manner, and form a strong prevention, order
command, fast, efficient and coordinated environmental pollution emergency response system, Tongwei
Solar and Yongxiang have formulated emergency plans for environmental emergencies and reported them
to the local ecological environment bureau. The record numbers are as follows:
1) Emergency Plan for Environmental emergencies in east plan of Tongwei Solar (Chengdu) Co.,
Ltd. (record number: 510122-2020-875-M).
2) Emergency Plan for Environmental emergencies of application project of Tongwei Solar (Meishan)
Co., Ltd. with annual output of 7.5GW high-efficiency crystalline silicon solar cell domestic intelligent
equipment (system), record number: 51140020200031-L.
3) Emergency Plan for Environmental emergencies of Tongwei Solar (Hefei) Co., Ltd., record
number: 340105-2019-013-M.
4) Emergency Plan for Environmental emergencies of Tongwei Solar (Anhui) Co., Ltd., record
number: 340105-2019-026-M.
5) Emergency Plan for Environmental emergencies of Sichuan Yongxiang Co., Ltd., record number:
511112-2018-025-H.
(5) Environmental self-monitoring plan
√Applicable □Inapplicable
1) Tongwei Solar: It has a safety environment department, complete safety and environmental
protection technicians and advanced environmental testing instruments. The main emission port of the
Company is equipped with online detection equipment to monitor wastewater COD, NH3-N, pH, fluoride
ion and other items online in real time, and regularly transmit the detection data to the environmental
protection information platform. At the same time, the wastewater station of the Company is equipped
with a wastewater testing laboratory, and laboratory technicians regularly test all links of wastewater
treatment to ensure that the wastewater emission reaches the standards. In addition, the Company has
formulated an annual environmental testing plan, entrusted a third-party testing unit to conduct monthly
testing on the waste gas, wastewater, noise, plant boundary waste gas, and groundwater.
2) Yongxiang: It has a safety environment department, complete safety and environmental protection
technicians and advanced environmental monitoring instruments. At the same time, the emission ports are
equipped with online monitoring equipment for wastewater and waste gas according to the specifications,
which can monitor the wastewater flow, COD, ammonia nitrogen, total nitrogen, pH and other items, and
the waste gas SO2, NOX, particulate matter and other items in real time, and transmit them to the pollution
source monitoring platform in real time. Environmental protection staff conducts daily inspections on the
online equipment of the emission port. The quality control department of the Company conducts manual
analysis of various indicators of the wastewater emission port and compares with the online monitoring
data to ensure the accuracy of the online equipment analysis data and the standard emission of all
indicators. In accordance with the environmental impact assessment report and the technical specifications
of the industry’s pollutant emission permit, the self-monitoring plan has been compiled, and qualified units
are entrusted to carry out the monitoring according to the plan.
(6) Other environmental information that should be disclosed
□Applicable √Inapplicable

2020 Annual Report
68 / 246
2. Explanation of the environmental protection situation of companies other than the key
pollutant discharging units
√Applicable □Inapplicable
The waste gas of the feed industry has the characteristics of high temperature, high humidity, high
dust, and large air volume. The Company has developed a "water spray + biological treatment" process
based on the research and analysis of the pollutant composition and its physical and chemical properties
by the professional environmental protection team for a long time. The environmental treatment process
standards of the Company are determined according to the difference in odor during the production.
During the reporting period, after a comprehensive assessment of the environmental protection
engineering effects in recent years, and combining with industry waste gas treatment processes and
parameters, the existing environmental protection standards of the Company have been revised, especially
the waste gas treatment process and parameters produced during the production of special water materials
are designed again; the complex composition of special water waste gas and large peculiar smell are fully
considered; the design safety factor is increased, and the effective treatment effects are ensured. At the
same time, the operation guidelines for environmental protection equipment have been formulated to
ensure the effective operation of on-site equipment and ensure that operators have the ability to basically
identify and deal with common equipment faults. At present, the waste gas emission indicators of the
Company are far below the emission standards for odor pollutants (GB14554). The Company still spares
no effort to promote environmental protection innovation and technological research. On the basis of the
"zero waste gas emission process technology" proposed in 2019, the technology has been fully replicated
and promoted through continuous optimization, adjustment, and verification. Now, it has been promoted
and applied in a number of feed subsidiaries.
3. Explanation of the reasons why companies other than key pollutant discharging units did not
disclose environmental information
□Applicable √Inapplicable
4. Explanation of the follow-up progress or changes of the environmental information content
disclosed during the reporting period
□Applicable √Inapplicable
(IV) Other notes
□Applicable √Inapplicable
XVIII Convertible corporate bonds
√Applicable □Inapplicable
(I) Issuance of convertible bonds
√Applicable □Inapplicable
Approved by the China Securities Regulatory Commission on Approve of the Public Issuance of
Convertible Bonds by Tongwei Co., Ltd. (ZJXU [2018] No.1730), the Company publicly issued 50 million
convertible bonds on March 18, 2019 (bond abbreviation: Tongwei Convertible Bonds, bond code:
110054), the issue price is 100 yuan/piece, the total amount of raised funds is 5 billion yuan, and the actual
net amount of raised funds is 4,937,801,000 yuan. The conversion period is from September 23, 2019 to
March 17, 2025. The convertible bonds issued on April 10, 2019 can be listed on the Shanghai Stock
Exchange.
(II) Status of convertible bond holders and guarantors during the reporting period
√Applicable □Inapplicable
Name of convertible corporate bond Tongwei Convertible Bonds
Number of convertible bond holders
at the end of the period
0
Convertible bond guarantor of the
Company
None

2020 Annual Report
69 / 246
The top ten holders of convertible bonds are as follows:
Name of the holder of the convertible
corporate bond
Amount of debt held at the end of the
period (Yuan) Holding ratio (%)
Inapplicable Inapplicable Inapplicable
Note: during the reporting period, the Company exercised the early redemption rights of the convertible
bonds, and the "Tongwei Convertible Bonds" completed the conversion and was delisted on the Shanghai
Stock Exchange. There were no bond holders at the end of the reporting period.
(III) Changes in convertible bonds during the reporting period
□Applicable √Inapplicable
Unit:Yuan Currency:RMB Name of
convertible
corporate bond
Before this change
Increase /decrease of this change After this
change Conversion Redemption Sell back
Tongwei
Convertible
Bonds
4,997,269,000 4,976,622,000 20,647,000
-
0
Cumulative conversion of convertible bonds during the reporting period
√Applicable □Inapplicable
Name of convertible corporate bond Tongwei Convertible Bonds
Conversion amount during the reporting period (Yuan) 4,976,622,000
Number of conversion during the reporting period (shares) 405,261,088
Cumulative number of conversion (shares) 405,483,464
The cumulative number of conversion accounted for the total
number of issued shares of the Company before the conversion
(%)
10.44
Amount not yet conversion (Yuan) 0
Proportion of non-converted convertible bonds in total issuance of
convertible bonds (%) 0.41
(IV) Previous adjustments to the conversion price
√Applicable □Inapplicable
Unit:Yuan Currency:RMB
Name of convertible corporate bond Tongwei Convertible Bonds
Conversion price
adjustment date
Adjusted
conversion
price
Disclosure time Disclosure
media
Conversion price adjustment
explanation
May 23, 2019 12.28 May 24, 2019
Shanghai Stock
Exchange
website and
China Securities
Journal,
Shanghai
Securities
Journal,
Securities Daily
and Securities
Times.
The 2018 profit distribution plan of
the Company: to distribute cash
dividend of 1.60 yuan (tax
included) to all shareholders for
every 10 shares. According to the
relevant provisions of the
Prospectus for the Public Issuance
of A-Shares Convertible Corporate
Bonds by Tongwei Co., Ltd., the
conversion price of convertible
bonds needs to be adjusted, and the
conversion price before the
adjustment is 12.44 yuan/share.
The latest conversion price by the
end of the reporting period Inapplicable
(V) The liabilities, credit changes, and cash arrangements for debt repayment in future years
√Applicable □Inapplicable
At the end of the reporting period, the total assets of the Company were 64.252 billion, total liabilities
were 32.708 billion yuan, and the debt-to-asset ratio was 50.91%. On June 17, 2019, CCXR issued the Tracking Rating Report of Public Issuance of A-Shares Convertible Corporate Bonds of Tongwei Co., Ltd.

2020 Annual Report
70 / 246
(2019), the entity credit rating of the Company was maintained as "AA+", and the rating outlook is stable;
the credit rating of this bond is maintained as "AA+". During the reporting period, neither the company's
rating nor the current convertible bond rating changed. During the reporting period, the Company
exercised the early redemption right of "Tongwei Convertible Bonds". As of the redemption registration
date, a total of 4,979,353,000 yuan of "Tongwei Convertible Bonds" has been converted into company
stocks, and the Company implemented compulsory redemption for the remaining 20,647,000 yuan of
"Tongwei Convertible Bonds". By the end of the reporting period, the Company had no convertible bonds
in circulation, and there was no cash arrangement for subsequent redemption of convertible bonds.
(VI) Explanation of other circumstances of convertible bonds
√Applicable □Inapplicable
According to the Prospectus for the Company’s Public Issuance of A-Shares Convertible Corporate Bonds: “during the conversion period of this issue of convertible bonds, if the closing price of A-shares of
the Company is not lower than 130% (including 130%) of the current conversion price for at least 15
trading days in 30 consecutive trading days, or the non-converted balance of the convertible bonds issued
this time is less than RMB 30 million, the Company has the right to redeem all or part of the convertible
bonds that have not been converted according to the bond face value and the current accrued interest price".
From January 14, 2020 to March 3, 2020, the closing price of 15 trading days within 30 consecutive
trading days of the Company is not less than 130% of the current conversion price of "Tongwei
Convertible Bonds" (namely, 15.96 yuan/share), the redemption clause of "Tongwei Convertible Bonds"
has been triggered.
On March 3, 2020, the Company held the sixth meeting of the seventh board of directors, at which
the Proposal on Early Redemption of "Tongwei Convertible Bonds" was reviewed and approved, and the
Company was approved to exercise the early redemption right of "Tongwei Convertible Bonds", and
redeem all "Tongwei Convertible Bonds" registered on the "Redemption Registration Date".
By the market close on the redemption registration date (March 16, 2020), the face value balance of
the "Tongwei Convertible Bonds" was RMB 20,647,000, accounting for 0.41% of the total amount of
RMB 5,000,000,000 of the "Tongwei Convertible Bonds". On March 17, 2020, the Company redeemed
all balance of the above "Tongwei Convertible Bonds". By the market close on the redemption registration
date, the cumulative face value of RMB 4,979,353,000 "Tongwei Convertible Bonds" was converted into
company shares, accounting for 99.59% of the total amount of “Tongwei Convertible Bonds”; the
cumulative conversion number was 405,483,464 shares, accounting for 10.44% of the total number of
issued shares of the Company before the "Tongwei Convertible Bonds". After completing the conversion,
the total number of shares of the Company has changed from 3,882,372,220 shares to 4,287,855,684 shares.
From March 17, 2020, "Tongwei Convertible Bonds" and "Tongwei Convertible Shares" will be delisted
on the Shanghai Stock Exchange.
Section VI Changes in Common Stock Equity and Shareholders
I. Changes in common capital shares
(I) List of changes in common shares
1. List of changes in common shares
Unit: share Before this change Increase / decrease of this change (+, -) After this change
Quantity Proporti
on (%) Issue new shares
Share
donation
Capital
reserves Other Subtotal Quantity
Proportion
(%)
I.Restricted shares 213,692,500 213,692,500 213,692,500 4.75
1. State shareholding
2. State-owned legal
person shareholding
3. Other domestic
shareholding
213,692,500 213,692,500 213,692,500 4.75
Of which: domestic
non-state-owned legal
persons shareholding
Domestic
natural person
shareholding
4. Foreign
shareholding

2020 Annual Report
71 / 246
Of which: foreign legal person
shareholding
Foreign
natural person
shareholding
II. Unrestricted
tradable shares 3,882,594,596 100 405,261,088 405,261,088 4,287,855,684 95.25
1. RMB common
shares 3,882,594,596 100 405,261,088 405,261,088 4,287,855,684 95.25
2. Domestically listed foreign shares
3. Foreign shares listed overseas
4. Other
III.Total number of
common shares 3,882,594,596 100 213,692,500 405,261,088 618,953,588 4,501,548,184 100
2. Explanation of changes in common shares
√Applicable □Inapplicable
On March 3, 2020, the Company held the sixth meeting of the seventh board of directors, at which
the Proposal on Early Redemption of "Tongwei Convertible Bonds" was reviewed and approved, and the
Company was approved to exercise the early redemption right of "Tongwei Convertible Bonds", and
redeem all "Tongwei Convertible Bonds" registered on the "Redemption Registration Date" on March 17.
By the market close on the redemption registration date (March 16, 2021), the cumulative face value of
RMB 4,979,353,000 "Tongwei Convertible Bonds" has been converted into company shares, and the
cumulative number of shares converted was 405,483,464 shares. After completing the conversion, the
total number of shares of the Company was changed from 3,882,594,596 shares to 4,287,855,684 shares
at the beginning of the reporting period.
After the Reply of Approving Non-public Offering of Shares of Tongwei Co., Ltd. (ZJXK [2020] No.
2492) of China Securities Regulatory Commission, the Company issued 213,692,500 RMB common
shares (A-shares) with a face value of 1.00 each to 16 subjects, the issue price is RMB 28.00/share, the
shares issued this time shall not be transferred within 6 months from the end of the issuance. On December
8, 2020, the non-public offering of shares was completed in the Shanghai Branch of China Securities
Depository and Clearing Co., Ltd., and the total share capital of the Company was changed from
4,287,855,684 shares to 4,501,548,184 shares.
3. The impact of changes in common shares on financial indicators such as earnings per share and
net assets per share in the most recent year and the most recent period (if any)
√Applicable □Inapplicable
During the reporting period, the total share capital of the Company increased from 3,882,594,596
shares to 4,501,548,184 shares due to the company’s conversion of convertible bonds and non-public
offering of shares. The above matters will have a dilution effect on the 2020 earnings per share, net assets
per share and other financial indicators of the Company. In 2020, the basic earnings per share of the
Company were RMB 0.8581 and net assets per share were RMB 6.78.
4. Other content that the Company deems necessary or required by the securities regulatory
agency to disclose
□Applicable √Inapplicable
(II) Changes in restricted shares
√Applicable □Inapplicable
Unit: Share
Shareholder name
Number
of
restricted
shares at
the
beginning
of the
year
Number
of
restricted
shares
lifted
this year
Number of
restricted
shares
increased
this year
Number of
restricted
shares at the
end of the
year
Reasons for
restricted sale
Release of
restricted date
Qamdo Tongrui Industrial 0 0 7,142,857 7,142,857 Non-public offering June 7, 2021

2020 Annual Report
72 / 246
Partnership (Limited Partnership) of shares locked up
Shanghai Yusheng Investment
Management Co., Ltd. 0 0 14,300,000 14,300,000
Non-public offering
of shares locked up June 7, 2021
Shanghai Yingshui Investment
Management Co., Ltd.-Yingshui
Yueyi No. 19 Private Securities
Investment Fund
0 0 7,142,857 7,142,857 Non-public offering
of shares locked up June 7, 2021
Xinghan Asset Management-CIB
"Xingye Golden Snowball-
Priority No.3 RMB financial plan
-Xinghan Asset Management-
Xingyuan No. 5 Single Asset
Management Plan
0 0 7,142,857 7,142,857 Non-public offering
of shares locked up June 7, 2021
Taikang Life Insurance Co., Ltd.-
Ltd.-Investment-Innovation 0 0 7,142,857 7,142,857
Non-public offering
of shares locked up June 7, 2021
Combination of Basic Pension
Insurance Fund 1205 0 0 1,428,572 1,428,572
Non-public offering
of shares locked up June 7, 2021
Industrial and Commercial Bank
of China Co., Ltd.-E Fund New
Economy Flexible Configuration
Hybrid Securities Investment
Fund
0 0 714,285 714,285 Non-public offering
of shares locked up June 7, 2021
Bank of China Limited-E Fund
Balanced Growth Equity
Securities Investment Fund
0 0 4,285,714 4,285,714 Non-public offering
of shares locked up June 7, 2021
Bank of China-E Fund Stable
Growth Securities Investment
Fund
0 0 714,285 714,285 Non-public offering
of shares locked up June 7, 2021
Industrial and Commercial Bank
of China Co., Ltd.-E Fund
Kexiang Hybrid Securities
Investment Fund
0 0 1,428,572 1,428,572 Non-public offering
of shares locked up June 7, 2021
Bank of Communications Co.,
Ltd.-E Fund Kexun Hybrid
Securities Investment Fund
0 0 1,428,572 1,428,572 Non-public offering
of shares locked up June 7, 2021
Yunnan Energy Investment
Capital Investment Co., Ltd. 0 0 7,142,857 7,142,857
Non-public offering
of shares locked up June 7, 2021
Industrial and Commercial Bank
of China Co., Ltd.-Hongde
Yuxiang Bond Securities
Investment Fund
0 0 232,143 232,143 Non-public offering
of shares locked up June 7, 2021
China Construction Bank
Corporation-Hongde Hongye
Flexible Configuration Hybrid
Securities Investment Fund
0 0 357,143 357,143 Non-public offering
of shares locked up June 7, 2021
Industrial and Commercial Bank
of China Co. Ltd.-Hongde Hongye
Flexible Configuration Hybrid
Securities Investment Fund
0 0 214,286 214,286 Non-public offering
of shares locked up June 7, 2021
China Construction Bank
Corporation-Hongde Strategic
Transformation Equity Securities
Investment Fund
0 0 1,071,428 1,071,428 Non-public offering
of shares locked up June 7, 2021
China Merchants Bank Co., Ltd.-
Hongde Ruize Hybrid Securities
Investment Fund
0 0 2,500,000 2,500,000 Non-public offering
of shares locked up June 7, 2021
Industrial and Commercial Bank
of China Co. Ltd.-Hongde Hongye
Flexible Configuration Hybrid
Securities Investment Fund
0 0 571,428 571,428 Non-public offering
of shares locked up June 7, 2021
Industrial and Commercial Bank
of China Co. Ltd.-Hongde
Quantitative Selection Hybrid
Securities Investment Fund
0 0 357,143 357,143 Non-public offering
of shares locked up June 7, 2021
Industrial and Commercial Bank
of China Co., Ltd.-Hongde 0 0 714,286 714,286
Non-public offering
of shares locked up June 7, 2021

2020 Annual Report
73 / 246
Yukang Bond Securities
Investment Fund
China Everbright Bank Co., Ltd.-
Hongde Optimal Growth Hybrid
Securities Investment Fund
0 0 535,714 535,714 Non-public offering
of shares locked up June 7, 2021
Bank of Communications Co.,
Ltd.-Hongde Youshi Linghang
Flexible Configuration Hybrid
Securities Investment Funds
0 0 107,143 107,143 Non-public offering
of shares locked up June 7, 2021
Industrial and Commercial Bank
of China Co. Ltd.-Hongde
Research Selection Hybrid
Securities Investment Fund
0 0 214,286 214,286 Non-public offering
of shares locked up June 7, 2021
China Merchants Bank Co., Ltd.-
Hongde Ruixing Three-year
Holding Period Hybrid Securities
Investment Fund
0 0 892,857 892,857 Non-public offering
of shares locked up June 7, 2021
China Postal Savings Bank Co.,
Ltd.-Hongde Ruixiang One-year
holding Hybrid Securities
Investment Fund
0 0 100,000 100,000 Non-public offering
of shares locked up June 7, 2021
Dajia Assets-Industrial and
Commercial Bank of China-Dajia
Assets-Blue Chip Featured No. 5
Collective Asset Management
Product
0 0 7,142,857 7,142,857 Non-public offering
of shares locked up June 7, 2021
Dacheng Fund-Huaneng
Trust·Jiayue No. 4 Single Fund
Trust-Dacheng Fund Excellence
No. 1 Single Asset Management
Plan
0 0 7,142,857 7,142,857 Non-public offering
of shares locked up June 7, 2021
Dacheng Fund-Huaneng
Trust·Jiayue No. 7 Single Fund
Trust-Dacheng Fund Excellence
No. 2 Single Asset Management
Plan
0 0 24,285,715 24,285,715 Non-public offering
of shares locked up June 7, 2021
Dacheng Fund-Huaneng
Trust·Yueying No. 13 Single
Fund Trust-Dacheng Fund
Excellence No. 9 Single Asset
Management Plan
0 0 21,071,428 21,071,428 Non-public offering
of shares locked up June 7, 2021
China CITIC Bank Co., Ltd.-Jiutai
Ruiyi Fixed Increased Flexible
Configuration Hybrid Securities
Investment Fund
0 0 3,571,429 3,571,429 Non-public offering
of shares locked up June 7, 2021
China Merchants Securities Co.,
Ltd.-Jiutai Taifu Fixed Increase
Theme Flexible Configuration
Hybrid Securities Investment
Fund
0 0 285,714 285,714 Non-public offering
of shares locked up June 7, 2021
Jiutai Fund-China Guangfa Bank-
Sichuan Jinduo Investment Co.,
Ltd.
0 0 4,285,714 4,285,714 Non-public offering
of shares locked up June 7, 2021
Jiutai Fund-China Guangfa Bank-
Orient Securities Co., Ltd. 0 0 500,000 500,000
Non-public offering
of shares locked up June 7, 2021
Hillhouse Capital Management
Co., Ltd.-China Value Fund
(Exchange)
0 0 17,857,142 17,857,142 Non-public offering
of shares locked up June 7, 2021
Caitong Fund-Huaneng Trust •
Yueying No. 15 Single Fund
Trust-Caitong Fund Excellence
No. 2 Single Asset Management
Plan
0 0 9,368,328 9,368,328 Non-public offering
of shares locked up June 7, 2021
Caitong Fund-Huaneng
Trust·Jiayue No. 5 Single Fund
Trust-Caitong Fund Excellence
0 0 20,674,931 20,674,931 Non-public offering
of shares locked up June 7, 2021

2020 Annual Report
74 / 246
No. 3 Single Asset Management
Plan
Caitong Fund-Pan Xuhong-
Caitong Fund Shaoxia No. 1
Single Asset Management Plan
0 0 96,914 96,914 Non-public offering
of shares locked up June 7, 2021
Caitong Fund-Gao Xueqing-
Caitong Fund Haohai Fixed
Increase No. 1 Single Asset
Management Plan
0 0 35,535 35,535 Non-public offering
of shares locked up June 7, 2021
Caitong Fund-Qingdao Haisi
Qingyun Equity Investment Fund
Enterprise (Limited Partnership)-
Caitong Fund Haisi Qingyun
Single Asset Management Plan
0 0 484,569 484,569 Non-public offering
of shares locked up June 7, 2021
Industrial and Commercial Bank
of China Co., Ltd.-Caitong
domestic demand growth for 12
months to regularly open hybrid
securities investment funds
0 0 648,353 648,353 Non-public offering
of shares locked up June 7, 2021
Caitong Fund-China Construction
Bank-China Life-China Life
Insurance (Group) Company
entrust Caitong Fund
Management Co., Ltd. for fixed
increase and combination
0 0 807,614 807,614 Non-public offering
of shares locked up June 7, 2021
Caitong Fund-Liang Dekang-
Caitong Fund Hengneng New
Energy No. 1 Single Asset
Management Plan
0 0 321,431 321,431 Non-public offering
of shares locked up June 7, 2021
Caitong Fund-Chen Yanru-
Caitong Fund Hengneng New
Energy No. 2 Single Asset
Management Plan
0 0 321,431 321,431 Non-public offering
of shares locked up June 7, 2021
Caitong Fund-Chengdu Maxis
Online Technology Co., Ltd.-
Caitong Fund Hengneng New
Energy No. 3 Single Asset
Management Plan
0 0 642,861 642,861 Non-public offering
of shares locked up June 7, 2021
Caitong Fund-Sichuan Debord
Pharmaceutical Co., Ltd.-Caitong
Fund Hengneng New Energy No.
4 Single Asset Management Plan
0 0 321,431 321,431 Non-public offering
of shares locked up June 7, 2021
Caitong Fund-Liu Fangbai-
Caitong Fund Hengneng New
Energy No. 5 Single Asset
Management Plan
0 0 482,953 482,953 Non-public offering
of shares locked up June 7, 2021
Caitong Fund-Suzhou Industrial
Park Zhongxin Energy
Development Co., Ltd.-Caitong
Fund Zhongxin No. 1 Single Asset
Management Plan
0 0 1,611,352 1,611,352 Non-public offering
of shares locked up June 7, 2021
Caitong Fund-Jiang Yong-
Caitong Fund Yuquan No. 892
Single Asset Management Plan
0 0 263,282 263,282 Non-public offering
of shares locked up June 7, 2021
Caitong Fund-Shaanxi Investment
Fund Management Co., Ltd.-
Caitong Fund Yuquan No. 838
Single Asset Management Plan
0 0 962,676 962,676 Non-public offering
of shares locked up June 7, 2021
Caitong Fund-Luzhou Puxin
Equity Investment Fund
Partnership (Limited Partnership)-
Caitong Fund Puxin No. 3 Single
Asset Management Plan
0 0 646,092 646,092 Non-public offering
of shares locked up June 7, 2021
Caitong Fund-Zhongyuan
Securities Co., Ltd.-Caitong Fund
Tianxi Dingzeng No. 66 Single
0 0 323,046 323,046 Non-public offering
of shares locked up June 7, 2021

2020 Annual Report
75 / 246
Asset Management Plan
Caitong Fund-Capital Securities
Co., Ltd.-Caitong Fund Huitong
No. 1 Single Asset Management
Plan
0 0 32,304 32,304 Non-public offering
of shares locked up June 7, 2021
Caitong Fund-Shanghai Lu'an
Investment Co., Ltd.-Caitong
Fund Lutou Fixed Increased
Optimal Single Asset
Management Plan
0 0 96,914 96,914 Non-public offering
of shares locked up June 7, 2021
Caitong Fund-Huang Zheng-
Caitong Fund Dongxian No. 1
Single Asset Management Plan
0 0 96,914 96,914 Non-public offering
of shares locked up June 7, 2021
Zhuque Fund-Shaanxi Coal
Industry Co., Ltd.-Shaanxi Coal
Zhuque New Energy Industry
Single Asset Management Plan
0 0 6,785,714 6,785,714 Non-public offering
of shares locked up June 7, 2021
China Merchants Bank Co., Ltd.-
Zhuque Industry Selected Hybrid
Securities Investment Fund
0 0 214,286 214,286 Non-public offering
of shares locked up June 7, 2021
Industrial and Commercial Bank
of China Co., Ltd.-Zhuque
Industrial Intelligent Selection
Hybrid Securities Investment
Fund
0 0 39,286 39,286 Non-public offering
of shares locked up June 7, 2021
Ping An Bank Co., Ltd.-Zhuque
Enterprise Winning Stock
Securities Investment Fund
0 0 103,571 103,571 Non-public offering
of shares locked up June 7, 2021
Chengdu Fusenmei Home
Furnishing Co., Ltd. 0 0 7,142,857 7,142,857
Non-public offering
of shares locked up June 7, 2021
China Merchants Bank Co., Ltd.-
Ruiyuan Growth Value Hybrid
Securities Investment Fund
0 0 7,142,857 7,142,857 Non-public offering
of shares locked up June 7, 2021
Total 0 0 213,692,500 213,692,500 / /
II. Securities issuance and listing
(I) The issuance of securities by the reporting period
√Applicable □Inapplicable
Unit:Share Currency RMB Type of
Stocks and
their
derivatives
Issuing date Issuing price (or
interest rate)
Issuing
number Listing date
Number of
approved
listing
transactions
Transaction
termination
date
Common share
Non-public
offering of
shares
November 17, 2020 28yuan/share 213,692,500 December 8, 2021 213,692,500
Inapplicable
Explanation of the issuance of securities as of the reporting period (for bonds with different interest rates
during the duration, please explain separately):
□Applicable √Inapplicable
(II) The total number of common shares of the Company, changes in the shareholder structure,
and changes in the assets and liabilities structure of the Company
√Applicable □Inapplicable
On March 3, 2020, the Company held the sixth meeting of the seventh board of directors, at which
the Proposal on Early Redemption of "Tongwei Convertible Bonds" was reviewed and approved, and the
Company was approved to exercise the early redemption right of "Tongwei Convertible Bonds", and redeem all "Tongwei Convertible Bonds" registered on the "Redemption Registration Date" on March 17.
By the market close on the redemption registration date (March 16, 2021), the cumulative face value of

2020 Annual Report
76 / 246
RMB 4,979,353,000 "Tongwei Convertible Bonds" has been converted into company shares, and the
cumulative number of shares converted was 405,483,464 shares. After completing the conversion, the
total number of shares of the Company was changed from 3,882,594,596 shares to 4,287,855,684 shares
at the beginning of the reporting period.
After the Reply of Approving Non-public Offering of Shares of Tongwei Co., Ltd. (ZJXK [2020] No.
2492) of China Securities Regulatory Commission, the Company issued 213,692,500 RMB common
shares (A-shares) with a face value of 1.00 each to 16 subjects, the issue price is RMB 28.00/share. On
December 8, 2020, the non-public offering of shares was completed in the Shanghai Branch of China
Securities Depository and Clearing Co., Ltd., and the total share capital of the Company was changed from
4,287,855,684 shares to 4,501,548,184 shares.
In view of the above equity changes, as the controlling shareholder, the shareholding ratio of Tongwei
Group has changed from 51.47% to 44.39%, and it is still the controlling shareholder of the Company. At
the end of the reporting period, the total assets of the Company were 64.252 billion, total liabilities were
32.708 billion yuan, and the debt-to-asset ratio was 50.91%.
(III) Existing internal employee shares
□Applicable √Inapplicable
III. Actual controller situation
(I) Total number of shareholders
Total number of common shareholders as of the end of the reporting period (Nr.) 184,897
Total number of common shareholders at the end of the previous month before
disclosure of the annual report (Nr.)
355,999
Total number of preferred shareholders with restored voting rights up to the end of the
reporting period (Nr.)
0
Total number of preferred shareholders with restored voting rights at the end of the
month before the disclosure date of the annual report (Nr.)
0
(II) Shareholding situation of top ten shareholders and top ten shareholders of tradable shares (or
shareholders without trading limited condition) as of the end of the reporting period

2020 Annual Report
77 / 246
Unit:Share Shareholding of the top ten shareholders
Name of shareholder (full name)
Increase/decrease
during reporting
period
Number of shares
held at the end of the
period
Proportion
(%)
Number of holding
shares with trading
limited condition
Pledged or frozen status
Shareholder nature
Shares
status
Quantity
Tongwei Group Co., Ltd. 0 1,998,422,515 44.39 0 Pledge 738,900,000 Domestic non-state-
owned legal persons
Hong Kong Securities Clearing
Company Ltd. 125,715,166 184,492,222 4.10 0 None 0 Unknown
China Life Insurance Company
Limited-dividends-individual
dividends-—005L —FH002
Shanghai
-32,207,411 87,930,989 1.95 0
None
0
Unknown
China Construction Bank
Corporation-Guangfa Kexian
Hybrid Securities Investment Fund
51,898,803 51,898,803 1.15 0
None
0
Unknown
Huaneng Guixin Trust Co., Ltd.-
Huaneng Trust·Danhua Growth
Accumulative Capital Trust Plan
49,656,515 49,656,515 1.10 0
None
0
Unknown
Industrial and Commercial Bank of
China Co., Ltd.-Guangfa
Shuangqing Upgraded Hybrid
Securities Investment Fund
43,127,208 43,127,208 0.96 0
None
0
Unknown
Shanghai Pudong Development
Bank Co., Ltd.-Guangfa Xiaopan
Growth Hybrid Securities
Investment Fund (LOF)
37,546,507 37,546,507 0.83 0
None
0
Unknown
Industrial and Commercial Bank of
China Co., Ltd.-Guangfa Innovation
and Upgrade Flexible Configuration
Hybrid Securities Investment Fund
29,950,085 29,950,085 0.67 0
None
0
Unknown
Bank of China Limited-Huatai Bai
Rui CSI Photovoltaic Industry
Trading Open Index Securities
Investment Fund
27,996,400 27,996,400 0.62 0
None
0
Unknown
Dacheng Fund-Huaneng
Trust·Jiayue No. 7 Single Fund
Trust-Dacheng Fund Excellence No.
2 Single Asset Management Plan
24,285,715 24,285,715 0.54 24,285,715 None 0 Unknown
Shareholdings of top ten shareholders without trading limited condition

2020 Annual Report
78 / 246
Name of shareholder (full name)
Number of tradable
shares without trading
limited condition
Share type and number
Category Quantity
Tongwei Group Co., Ltd. 1,998,422,515 RMB common stock 1,998,422,515
Hong Kong Securities Clearing Company Ltd. 184,492,222 RMB common stock 184,492,222
China Life Insurance Company Limited-dividends-
individual dividends-—005L —FH002 Shanghai 87,930,989
RMB common stock 87,930,989
China Construction Bank Corporation-Guangfa Kexian
Hybrid Securities Investment Fund 51,898,803
RMB common stock 51,898,803
Huaneng Guixin Trust Co., Ltd.-Huaneng Trust·Danhua
Growth Accumulative Capital Trust Plan 49,656,515
RMB common stock 49,656,515
Industrial and Commercial Bank of China Co., Ltd.-Guangfa
Shuangqing Upgraded Hybrid Securities Investment Fund 43,127,208
RMB common stock 43,127,208
Shanghai Pudong Development Bank Co., Ltd.-Guangfa
Xiaopan Growth Hybrid Securities Investment Fund (LOF) 37,546,507
RMB common stock 37,546,507
Industrial and Commercial Bank of China Co., Ltd.-Guangfa
Innovation and Upgrade Flexible Configuration Hybrid
Securities Investment Fund
29,950,085
RMB common stock
29,950,085
Bank of China Limited-Huatai Bai Rui CSI Photovoltaic
Industry Trading Open Index Securities Investment Fund 27,996,400
RMB common stock 27,996,400
Industrial and Commercial Bank of China Co., Ltd.-
agricultural bank Huili New Energy Theme Flexible
Configuration Hybrid Securities Investment Fund
23,828,895
RMB common stock
23,828,895
Explanations of relationships between or concerted actions
of the aforementioned shareholders
Tongwei Group Co., Ltd. has no relationship with the other shareholders mentioned above. In addition, it is not known whether other
shareholders have any relationship.
Explanation of preferred shareholders with restored voting
rights and shareholdings Inapplicable

2020 Annual Report
79 / 246
Shares held by the top ten shareholders with trading conditions and the detailed information about the trading conditions
√Applicable □Inapplicable
Unit: Share
S/N Name of shareholders with trading
conditions
Number of
holding shares
with trading
limited
condition
Conditions of listing shares with trading
conditions
Restricted conditions
Available trading time
The number of
newly listed
shares
1
Dacheng Fund-Huaneng
Trust·Jiayue No. 7 Single Fund
Trust-Dacheng Fund Excellence
No. 2 Single Asset Management
Plan
24,285,715 June 7, 2021 -
The Company privately
issues shares to it, and the
subscribed shares shall
not be transferred within
6 months from the end of
the issuance.
2
Dacheng Fund-Huaneng
Trust·Yueying No. 13 Single Fund
Trust-Dacheng Fund Excellence
No. 9 Single Asset Management
Plan
21,071,428 June 7, 2021 -
The Company privately
issues shares to it, and the
subscribed shares shall
not be transferred within
6 months from the end of
the issuance.
3
Caitong Fund-Huaneng
Trust·Jiayue No. 5 Single Fund
Trust-Caitong Fund Excellence No.
3 Single Asset Management Plan
20,674,931 June 7, 2021 -
The Company privately
issues shares to it, and the
subscribed shares shall
not be transferred within
6 months from the end of
the issuance.
4 Hillhouse Capital Management Co.,
Ltd.-China Value Fund (Exchange) 17,857,142 June 7, 2021 -
The Company privately
issues shares to it, and the
subscribed shares shall
not be transferred within
6 months from the end of
the issuance.
5 Shanghai Yusheng Investment
Management Co., Ltd. 14,300,000 June 7, 2021 -
The Company privately
issues shares to it, and the
subscribed shares shall
not be transferred within
6 months from the end of
the issuance.
6
Caitong Fund-Huaneng Trust •
Yueying No. 15 Single Fund Trust-
Caitong Fund Excellence No. 2
Single Asset Management Plan
9,368,328 June 7, 2021 -
The Company privately
issues shares to it, and the
subscribed shares shall
not be transferred within
6 months from the end of
the issuance.
7 Taikang Life Insurance Co., Ltd.-
Ltd.-Investment-Innovation 7,142,857 June 7, 2021 -
The Company privately
issues shares to it, and the
subscribed shares shall
not be transferred within
6 months from the end of
the issuance.
7
Dajia Assets-Industrial and
Commercial Bank of China-Dajia
Assets-Blue Chip Featured No. 5
Collective Asset Management
Product
7,142,857 June 7, 2021 -
The Company privately
issues shares to it, and the
subscribed shares shall
not be transferred within
6 months from the end of
the issuance.
7 Qamdo Tongrui Industrial
Partnership (Limited Partnership) 7,142,857 June 7, 2021 -
The Company privately
issues shares to it, and the
subscribed shares shall
not be transferred within
6 months from the end of
the issuance.

2020 Annual Report
80 / 246
7
Shanghai Yingshui Investment
Management Co., Ltd.-Yingshui
Yueyi No. 19 Private Securities
Investment Fund
7,142,857 June 7, 2021 -
The Company privately
issues shares to it, and the
subscribed shares shall
not be transferred within
6 months from the end of
the issuance.
7
Xinghan Asset Management-CIB
"Xingye Golden Snowball-Priority
No.3 RMB financial plan -Xinghan
Asset Management- Xingyuan No.
5 Single Asset Management Plan
7,142,857 June 7, 2021 -
The Company privately
issues shares to it, and the
subscribed shares shall
not be transferred within
6 months from the end of
the issuance.
7 Yunnan Energy Investment Capital
Investment Co., Ltd. 7,142,857 June 7, 2021 -
The Company privately
issues shares to it, and the
subscribed shares shall
not be transferred within
6 months from the end of
the issuance.
7
Dacheng Fund-Huaneng
Trust·Jiayue No. 7 Single Fund
Trust-Dacheng Fund Excellence
No. 1 Single Asset Management
Plan
7,142,857 June 7, 2021 -
The Company privately
issues shares to it, and the
subscribed shares shall
not be transferred within
6 months from the end of
the issuance.
7 Chengdu Fusenmei Home
Furnishing Co., Ltd. 7,142,857 June 7, 2021 -
The Company privately
issues shares to it, and the
subscribed shares shall
not be transferred within
6 months from the end of
the issuance.
7
China Merchants Bank Co., Ltd.-
Ruiyuan Growth Value Hybrid
Securities Investment Fund
7,142,857 June 7, 2021 -
The Company privately
issues shares to it, and the
subscribed shares shall
not be transferred within
6 months from the end of
the issuance.
8
Zhuque Fund-Shaanxi Coal
Industry Co., Ltd.-Shaanxi Coal
Zhuque New Energy Industry
Single Asset Management Plan
6,785,714 June 7, 2021 -
The Company privately
issues shares to it, and the
subscribed shares shall
not be transferred within
6 months from the end of
the issuance.
9
Bank of China Limited-E Fund
Balanced Growth Equity Securities
Investment Fund
4,285,714 June 7, 2021 -
The Company privately
issues shares to it, and the
subscribed shares shall
not be transferred within
6 months from the end of
the issuance.
9
Jiutai Fund-China Guangfa Bank-
Sichuan Jinduo Investment Co.,
Ltd.
4,285,714 June 7, 2021 -
The Company privately
issues shares to it, and the
subscribed shares shall
not be transferred within
6 months from the end of
the issuance.
10
China CITIC Bank Co., Ltd.-Jiutai
Ruiyi Fixed Increased Flexible
Configuration Hybrid Securities
Investment Fund
3,571,429 June 7, 2021 -
The Company privately
issues shares to it, and the
subscribed shares shall
not be transferred within
6 months from the end of
the issuance.
Explanations of relationships between or
concerted actions of the aforementioned
shareholders
In addition, it is not known whether other shareholders have any relationship.

2020 Annual Report
81 / 246
(III) Strategic investor or general legal entity becoming top ten shareholders due to rights issue
□Applicable √Inapplicable
IV. Controlling Shareholders and Actual Controllers
(I) Controlling shareholders
1 Legal person
√Applicable □Inapplicable Name Tongwei Group Co., Ltd.
Head of unit or legal representative Guan Yamei
Date of establishment October 14, 1996
Main businesses
Wholesale and retail of commodities; livestock husbandry; science and
technology promotion and application service industry; software and
information technology services; import and export service; real estate
development and management; property management; rental service; solar
power generation (the above excludes items requiring prior approval, and items
subject to ex-post approval are operated with license or approval documents)
Equity situation of other domestic and
foreign listed company of share
controlling or participation during the
reporting period
None
Explanation of other conditions None
2 Natural person
□Applicable √Inapplicable
3 Special notes on the absence of controlling shareholders in the Company
□Applicable √Inapplicable
4 Index and date of the changes in controlling shareholders during the reporting period
□Applicable √Inapplicable
5 Block diagram of property rights and control relationships between the Company and the
controlling shareholders
√Applicable □Inapplicable
(II) Information on the actual controllers
1 Legal person
□Applicable √Inapplicable
2 Natural person
√Applicable □Inapplicable Name Liu Hanyuan
Nationality China
Whether the actual controller has right of residence in
other countries and regions No
Major position and title
Chairman of Tongwei Group Board of Directors, Director of
the 7th Board of Directors of the Company, Member of the
Standing Committee of the 11th National Committee of the
Chinese People's Political Consultative Conference,
Representative of the National People's Congress, Standing
Committee Member of the All-China Federation of Industry
and Commerce, Executive Chairman of CNECC, Executive
Tongwei Group Co., Ltd.
Shareholding
proportion 44.39%
Tongwei Co., Ltd.

2020 Annual Report
82 / 246
Vice-chairman of China Feed Industry Association
Domestic and foreign listed company controlled in
past 10 years None
3 Special statement for the condition that the Company has no actual controller
□Applicable √Inapplicable
4 Index and date of change of actual controllers during the reporting period
□Applicable √Inapplicable
5 Block diagram of property right and control relationship between the Company and the actual
controllers
√Applicable □Inapplicable
6 Actual controllers control the Company by trust or other asset management methods
□Applicable √Inapplicable
(III) Other information about controlling shareholders and actual controllers
□Applicable √Inapplicable
V. Other Institutional Shareholders Holding Shares more than 10%
□Applicable √Inapplicable
VI. Explanation on the Restriction in Reduction of Holding-Shares
□Applicable √Inapplicable
Section VII Preferred Shares
□Applicable √Inapplicable
Liu Hanyuan
Shareholding
proportion 80%
Tongwei Group Co., Ltd.
Shareholding
proportion 44.39%
Tongwei Co., Ltd.

2020 Annual Report
83 / 246
Section VIII Conditions on Directors, Supervisors, Senior Management and Staff
I. Changes in Shareholding and Compensation
(I) Changes in shareholding and compensations of directors, supervisors and senior management currently in office and leaving posts during reporting
period
√Applicable □Inapplicable
Unit:Share
Name Position
(note) Sex Age
Starting date
of tenure
Ending date
of tenure
Number of
shares held at
the beginning
of year
Number of
shares held at
the end of
year
Share changes
within the year
Causes
for
changes
Total pre-tax compensation
acquired from the
Company during
reporting period
(RMB 0,000)
Whether receiving
compensation
from related
parties of the
Company
Liu Hanyuan Director Male 56 2019-05-08 2022-05-07 0 0 0 496.33 No
Xie Yi Chairman Male 37 2019-05-08 2022-05-07 377,448 290,122 -87,336 Note 503.76 No
Yan Hu Vice chairman Male 57 2011-05-10 2022-05-07 836,650 836,650 0 257.35 No
Duan Yong Director Male 47 2016-05-03 2022-05-07 1,290,090 1,061,628 -228,822 Note 416.31 No
Wang
Xiaohui
Director Male 44 2019-05-08 2022-05-07 0 0 0 0
No
Ding Yi Director Female 56 2020-05-12 2022-05-07 0 0 0 3.33 No
Du Kunlun Independent
director
Male 52 2016-01-15 2022-01-14 0 0 0 10.00
No
Wang Jin Independent
director
Male 54 2016-05-03 2022-05-02 0 0 0 10.00
No
Fu Daiguo Independent
director
Male 56 2019-05-08 2022-05-07 0 0 0 10.00
No
Deng San
Chairman of the
Board of
Suoervisors
Female 36 2017-05-05 2022-05-07 279,600 225,880 -53,720
Note
104.68
No
Yang Shixian Supervisor Male 48 2007-04-30 2022-05-07 281,000 210,800 -70,200 Note 55.98 No
Chen
Xiaohua
Supervisor Male 51 2016-05-03 2022-05-07 0 0 0 3.00
No
Guo Yizhong General
Manager
Male 50 2016-03-03 2022-05-07 500,450 500,450 -166,150
Note 268.88
No
Chen Pingfu Deputy General
Manager
Male 55 2010-04-27 2022-05-07 498,450 444,730 -53,720
Note 266.98
No
Wang
Shangwen
Deputy General
Manager
Male 57 2013-05-07 2022-05-07 659,050 659,050 0 283.69
No

2020 Annual Report
84 / 246
Song Gangjie Deputy General
Manager
Male 57 2013-05-07 2022-05-07 550,100 425,075 -125,025
Note 112.47
No
Shen Jinzhu Deputy General
Manager
Male 55 2016-05-09 2022-05-07 373,800 280,400 -93,400
Note 230.08
No
Zhang Lu Deputy General
Manager
Male 42 2017-03-12 2022-05-07 375,400 281,600 -93,800
Note 123.93
No
Zhou Bin Chief Financial
Officer
Male 52 2019-05-08 2022-05-07 55,211 55,211 0
144.29
No
Yan Ke Secretary of the
Board of
Directors
Male 36 2019-05-08 2022-05-07 0 0 0
115.31 No
Total / / / / / 6,077,249 5,271,596 -972,173 / 3,416.37 /
Note: In 2015, the A-shares market experienced a continuous irrational decline, leading to the great fluctuation of Company's share price and serious deviation of the Company's market value from the Company's value. Based on confidence in China's economy, China's capital market and the Company's development prospects, management increased holding-shares to stabilize the Company's share price and promote the value return of the Company's market value. During reporting period, due to individual demand, part of management members reduced holding-shares with behavior and amount conforming to the requirements of laws and regulations as well as SSEfs Rules for Implementation of the Several Provisions on the Shareholding Reduction by the Principal Shareholders, Directors, Supervisors, and Senior Management of Listed Company.
Name Main work experiences
Liu Hanyuan
Male, born in 1964, EMBA of Guanghua School of Management, Peking University, senior engineer, former chairman of the board of directors of Tongwei Group (from 1st to 6th board), and currently the board chairman of Tongwei Group and a director of the 7th board of directors. Other social positions include the 11th Standing Committee of the CPPCC National Committee, deputy to the NPC (National People's Congress), member of Standing Committee of All-China Federation of Industry and Commerce, executive chairman of CNECC, executive vice chairman of China Feed Industry Association.
Xie Yi
Male, born in 1984, MIM from Imperial College London, UK, member of the CPC, deputy to the 13th CPC Chengdu Congress, vice chairman of the 14th Committee of Sichuan Youth Federation, member of the 15th CPPCC Chengdu Committee, member of the 11th CPPCC Standing Committee of Shuangliu District, Chengdu; vice chairman of the second council of CPIA; secretary of the Party Committee of Tongwei Group, chairman of the 7th board of directors of Tongwei Co., Ltd., chairman of Tongwei Solar (Hefei) Co., Ltd., chairman of Tongwei Solar (Chengdu) Co., Ltd., and chairman of Tongwei Solar (Meishan) Co., Ltd.
Yan Hu
Male, born in 1964, MBA of Guanghua School of Management, Peking University, senior accountant. He was the director and the chief financial officer of New Hope Group, and the director of New Hope Liuhe Co., Ltd. After joining Tongwei, he has served as the chief accountant of Tongwei Co., Ltd., the president of Tongwei Co., Ltd., the director (1st, 2nd, 4th, 5th, 6th board of directors) of the Company and the vice chairman of the 6th board of directors. He is currently a director and vice-chairman of the 7th board of directors of the Company. At present, he is vice-chairman of Sichuan Enterprise Confederation, vice-chairman of Sichuan Association of Feed Industry, vice-chairman of Sichuan Society for Fishery, vice-chairman of The Listed Company Association of Sichuan, etc.
Duan
Yong
Male, born in 1974, MBA and Master from Lingnan University, Hong Kong. He once served as deputy chief financial officer and secretary of the
board of directors of Shanghai Topslane Medical Devices Co., Ltd.; chief financial officer, assistant to president, executive president and president of
East Hope Group (Baotou). He is currently chairman of Yongxiang Co., Ltd. and a director of the 7th board of directors of the Company.
Wang
Xiaohui Male, born in 1976, master's degree. He was the former auditor of Beijing KPMG Huazhen Accounting Firm, industry analyst of CITIC Securities
Research Department, senior manager and director of energy industry group of Investment Banking Committee of CITIC Securities, executive general

2020 Annual Report
85 / 246
manager of M&A Department of Investment Banking Committee of CITIC Securities. Now, he is the executive director of China Life Asset
Management Co., Ltd. and director of Beijing Jingneng Power Co., Ltd. and director of the 7th board of directors of the Company.
Ding Yi
Female, born in 1964, member of the Communist Party of China, doctoral degree in economics, Renmin University of China. She worked in Huaneng
Power International Co., Ltd., and successively served as the chairman of Huaneng Capital Services Co., Ltd., Great Wall Securities and other
companies. She is currently a director of the Seventh Board of Directors of the Company and also serves as an independent director of Huaxia Bank
Co., Ltd and Huatai Asset Management Co., Ltd.
Du
Kunlun
Male, born in 1969, doctor of economics, CPA (Certified Public Accountant), CPV (Certified Public Valuer), researcher, master supervisor of Institute
of Finance of Sichuan Academy of Social Sciences; and he served as a member of the 12th and 13th Main Board Issuance Examination Commission
of China Securities Regulatory Commission. He is currently an independent director of the 5th and 6th board of directors of the Company. In addition,
he is the independent director of Luzhou Laojiao Co., Ltd., Cscec Scimee Sci.&Tech. Co., Ltd.
Fu Daiguo
Male, born in 1964, dean of the Western Business School of Southwestern University of Finance and Economics, professor of accounting, doctoral
supervisor, and vice president of Chengdu Accounting Society. He has served as an independent director of several companies such as Sichuan Crun
Co., Ltd., Lier Chemical Co., Ltd., Ingenic Semiconductor Inc. Currently, he is an independent director of the 7th board of directors of the Company,
and also an independent director of Maccura Biotechnology Co., Ltd. and Sichuan Langjiu Group Co., Ltd.
Wang Jin
Male, born in 1966, doctor of economics and professor from Emory University, USA. He once worked in Emory University, Georgian College,
Georgia Public Affairs, Federal Reserve Bank and other institutions and served as a teacher at Renmin University of China and Shanghai University.
Since March 2012, he has been the director of the International Energy Research Institute. At present, he is an independent director of the 7th board
of directors of the Company and an independent director of CECEP Solar Energy Co., Ltd. and Shuangdeng Cable Co., Ltd.
Deng San Female, born in 1984, CPC member, MBA of Sichuan University. She serves as head of the secretary department of Tongwei Co., Ltd. and assistant
to the chairman of the board of directors, chairman of the 6th and 7th supervisory boards of the Company.
Yang Shixian
Male, born in 1972, master of market economics. He serves as finance manager of Fuling Tongwei Feed Co., Ltd., project manager of the Company's
development department, manager of finance department and assistant to the general manager of He'nan Tongwei Feed Co., Ltd. He is currently the
supervisor of supervisory board (from 3rd to 6th boards) of the Company.
Chen
Xiaohua
Male, born in 1969, CPA (Certified Public Accountant). He worked at Chengdu Zhongda Accounting Firm, Sichuan Branch of Beijing Jingdu Public
Accounting Firm and Sichuan Shenghe Public Accounting Firm. Now, he is the director of Sichuan Branch of Beijing Xinghua Public Accounting
Firm (Special General Partnership) and the supervisor of the 6th and 7th supervisory boards of the Company.
Guo Yizhong
Male, born in 1970, college degree. He served as general manager of Jieyang Tongwei Feed Co., Ltd., general manager of Guangdong Tongwei Feed
Co., Ltd. and general manager of Guangdong Area. Since March 2016, he has been as the general manager of the Company.
Chen Pingfu
Male, born in 1965, EMBA, CPA (Certified Public Accountant). He successively served as manager, deputy general manager and general manager of
Finance Department of Sichuan Tongwei Feed Co., Ltd.; member of the 4th and the 5th boards of directors of the Company. He is currently the deputy
general manager of the Company and the general manager of Vietnam Area I. Wang Shangwen
Male, born in 1963, MBA, doctor's degree. He successively served as assistant to the president, director of human resources, marketing director and
technical director of the Company. He is currently the deputy general manager of the Company.
Song
Gangjie
Male, born in 1964, aquaculture engineer, EMBA in Agriculture from School of Continuing Education, Tsinghua University (2002-2003). He
successively served as assistant to the president of the Company, general manager of Chongqing Area, general manager of Jiangsu and Zhejiang Area, general manager of Yangze River and Huai River Area, general manager of Suzhou Tongwei Feed Co., Ltd., general manager of Nanjing Tongwei

2020 Annual Report
86 / 246
Aquatic Products Technology Co., Ltd., etc. Now, he is the deputy general manager of the Company.
Shen
Jinzhu
Male, born in 1966, bachelor degree, aquaculture engineer. He successively served as the general manager of Shashi Tongwei Feed Co., Ltd., assistant
general manager of Guangdong Tongwei Feed Co., Ltd., general manager of Vietnam Area and general manager of Vietnam Tongwei. He is now the
deputy general manager of the Company and general manager of Central China Area I.
Zhang Lu
Male, born in 1979, doctor's degree, researcher. He was the technical director of fish feed in Guangdong Yuehai Feeds Group. He successively served
as the Company's technical deputy director and aquaculture technical director. Currently, he is vice president, technical director and deputy general
manager of the Company's research institute.
Zhou Bin
Male, born in 1968, bachelor degree in accounting from Shanghai University of Finance and Economics, master degree from Southwest Jiaotong
University, MBA from University of South Australia, CPA (Certified Public Accountant) and CPV (Certified Public Valuer). He was the legal
representative and executive director of Sichuan Beite Certified Public Accounting Firm, the general manager of Sichuan Zhongfa Certified Tax
Accountant Firm and the chief financial officer of Sichuan Yongxiang Co., Ltd. and now, he is the chief financial officer of the Company.
Yan Ke Male, born in 1985, bachelor degree, accounting major of Southwest University of Finance and Economics. He served as the Company's securities
affairs representative. Now, he is the secretary of the 7th board of directors of the Company.
Explanation of other information
□Applicable √Inapplicable
(II) Equity incentive awarded to directors and senior management during reporting period
□Applicable √Inapplicable
II. Service status of directors, supervisors and senior management currently in office and leaving posts during reporting period
(I) Conditions on service in shareholder unit
√Applicable □Inapplicable
Name of employees Name of the firm of shareholders Post held in the firm of shareholders Starting date of tenure Ending date of tenure
Liu Hanyuan Tongwei Group Co., Ltd. Chairman of Board of Directors 2008-03-24
Conditions on service in shareholder unit None
(II) Conditions on service in other units
√Applicable □Inapplicable Name of employees Name of other organizations Position held in other
organizations
Starting date of tenure Ending date of tenure
Du Kunlun Sichuan Academy of Social Sciences Master supervisor 2012-12-01
Du Kunlun Luzhou Laojiao Co., Ltd Independent Director 2015-06-30
Du Kunlun Tianqi Lithium Corporation. Independent Director 2017-02-10 2020-09-09
Du Kunlun Sichuan Jule Food Co., Ltd. (To be listed) Independent Director 2017-05-14 2020-09-09

2020 Annual Report
87 / 246
Du Kunlun Cscec Scimee Sci.&Tech. Co., Ltd. Independent Director 2019-01-28
Wang Jin International Energy Research Institute Director 2012-06-01
Wang Jin Chongqing Zongshen Power Independent Director 2016-04-01 2019-10-31
Wang Jin CECEP Solar Energy Co., Ltd. Independent Director 2014-03-01
Wang Jin Shuangdeng Cable Co., Ltd. Independent Director 2020-08-01
Fu Daiguo Southwestern University of Finance and Economics Professor 2002-12-01
Fu Daiguo Maccura Biotechnology Co., Ltd. Independent Director 2019-01-22
Fu Daiguo Sichuan Langjiu Group Co., Ltd. Independent Director 2019-07-31
Ding Yi Huaxia Bank Co., Ltd.
Independent Director 2020-09-09
Ding Yi Huatai Asset Management Co., Ltd. Independent Director 2020-09-04
Chen Xiaohua Beijing Xinghua Public Accounting Firm (Special
General Partnership) Director of Sichuan Branch 2012-09-01
Wang Xiaohui China Life Asset Management Co., Ltd. Executive director 2017-03-08
Wang Xiaohui Beijing Jingneng Power Co., Ltd. Director 2017-12-28
Conditions on service in other units None
III. Compensation of directors, supervisors and senior management
√Applicable □Inapplicable
Compensation decision-making process of directors, supervisors and senior
management
According to the Company's Management Rules for Performance Appraisal, decisions shall be made by
the shareholders meeting and the board of directors.
Compensation decision basis of directors, supervisors and senior management
The basis shall be determined according to the requirements of the salary level of the industry, the
Company's operating performance and job responsibilities, and the qualitative and quantitative indicators
such as the work plan formulated by the board of directors at the beginning of the year and the completion
of individual work performance.
Compensation actually paid to directors, supervisors and senior management
The compensation of the Company's directors, supervisors and senior management shall be reasonably
paid according to their performance of duties, annual performance appraisal results, post-performance appraisal results and the Company's Management Rules for Performance Appraisal.
Total compensation paid to all the directors, supervisors and senior management
at the end of the reporting period RMB 34.164 million yuan
IV. Changes in the Company’s directors, supervisors and senior management √Applicable □Inapplicable
Name Post Status of change Reasons for change
Ding Yi Director Elected On May 12, 2020, the 2019 annual general meeting of shareholders of the Company deliberated and passed the proposal on the election of
Ms. Ding Yi as the director of the seventh board of directors of the Company.

2020 Annual Report
88 / 246
V. Explanation on the Punishment from the Securities Regulatory Commission in Last Three Years
□Applicable √Inapplicable

2020 Annual Report
89 / 246
VI. Employee Status of Parent Company and Major Subsidiaries
(I) Employee status
Number of employees on active duty in the parent company 2,797
Number of employees on active duty in the main subsidiaries 22,752
Number of employees on active duty in total 25,549
Number of the retired staff with expenses borne by the parent company
and main subsidiaries 19
Type of professions Professions Number of professional persons
Production personnel 14,617
Sales personnel 3,724
Technician 3,653
Financial personnel 616
Administrative personnel 2,939
Total 25,549 Education background
Education level Quantity (Nr.)
Master or above 497
Bachelor 4,829
College degree 5,396
Below college degree 14,827
Total 25,549
(II) Compensation policy
√Applicable □Inapplicable
The Company has been adhering to the principle of "external competition and internal fairness" to
formulate the Company's compensation incentive policy. In order to ensure the sustainable development
of the Company and the effective absorption and retention of talents, the Company continuously improves
and optimizes the salary performance management system, and through the leverage of salary performance,
it strives to effectively mobilize employees' work enthusiasm, enhance the Company's profitability, and
increase employee income. In order to ensure the appropriate competitiveness of the Company's salary,
the Company regularly adjusts its salary incentive policies through market research and salary cost
analysis. At the same time, it has formulated matching salary according to factors such as job value and
work intensity to maximize the internal fairness of the salary incentive system.
(III) Training plan
√Applicable □Inapplicable
As the most important source of the sustainable development of the Company, talent is an important
strategic resource for the Company's development. The Company continuously strengthens the work of
talent selection, employment, education and retention, and guarantees the retention of talents and personal
development through effective incentive policies and growth training plans. The Company relies on the
internal training mechanism of Tongwei University as the core, effectively integrates internal and external
high-quality educational resources, effectively refines excellent business models and management
methods internally, absorbs high-quality educational resources externally, and learns from advanced
management experience and advanced technology. In order to meet the development needs of employees
of different levels, different professions, and different types of work, the Company has built a complete
training system with Tongwei University as the core and linkages between various business lines and
various subsidiaries. At the same time, in order to encourage employees to actively improve their work
skills and business level, the Company encourages employees to improve their academic qualifications,
participate in professional skills training, and provide certain economic encouragement and support.
(IV) Labor outsourcing
□Applicable √Inapplicable
VII. Others
□Applicable √Inapplicable

2020 Annual Report
90 / 246
Section IX Company Governance
I. Explanation on the Company Governance
√Applicable □Inapplicable
During the reporting period, the Company further improved its company governance structure and
various internal systems based on the actual situation of the Company in strict accordance with the
Company Law, Code of Corporate Governance for Listed Company and other laws requirements. The
shareholders meeting, the board of directors, the board of supervisors and the management of the Company
have clear powers and responsibilities. The decision-making power, the supervision power and the
management power perform respective functions, check and balance and operate in coordination; and a
standardized corporate governance structure is formed. The board of directors of the Company believes
that the actual status of the corporate governance structure of the Company complies with the requirements
of the Code of Corporate Governance for Listed Company, and there is no difference.
(I) Organization of three meetings
During the reporting period, the Company held one annual and two interim shareholders meeting.
The procedures of the Company's shareholders meeting comply with the relevant provisions of Rules
Governing the Listing of Stocks on the Shanghai Stock Exchange, Company Articles of Association and
Rules of Procedure for Shareholders Meeting, safeguarding the legitimate rights and interests of the
Company and the majority of shareholders. A total of 12 meetings of the Board of Directors were held
during the reporting period. The directors of the Company attended the board meeting in accordance with
the Articles of Association and the Rules of Procedures for the Board of Directors and other systems. They
discussed deeply on various proposals submitted for deliberation, provided suggestions for the Company's
operation and development and fully considered the interests and demands of small and medium
shareholders when making decisions, which has improved the scientificity of their decisions and promoted
the stable and healthy development of the Company's production and operation. During the reporting
period, a total of 11 meetings of the board of supervisors were held. Supervisors of the Company attended
the meetings of the board of supervisors in accordance with the regimes such as Articles of Association
and the Rules of Procedure for the Board of supervisors. The supervisors of the Company have performed
their supervisory duties earnestly.
(II) Implementation of information disclosure
The Company has always attached great importance to information disclosure. In accordance with
the Shanghai Stock Exchange's requirements for implementing the relevant regulations on information
disclosure of listed company in the new Securities Law, the directors, supervisors and senior executives
of the Company signed written confirmation opinions on the company’s periodic reports to ensure that the
information disclosure is true, accurate and complete. At the same time, the Company strictly abides by
the principle of "openness, fairness and justice" to ensure that all shareholders have equal opportunities to
obtain the disclosed information.
(III) Registration system for insiders of inside information
Regarding the registration of insider information, in accordance with the refinancing requirements of
the new Securities Law, the chairman of the Company and secretary of the board of directors have issued
relevant written commitments in strict accordance with the requirements. In the daily work of the
Company, the Company has also done a good job of keeping inside information confidential in strict
accordance with the requirements of the system, maintaining the principle of fairness in the company's
information disclosure, and effectively protecting the legitimate rights and interests of the Company's
shareholders.
(IV) Investor relations management
In the process of daily operation and management, the Company strictly abides by relevant laws and
regulations, answers investors’ calls, mails, visits, and Shanghai Stock Exchange E-interaction questions
carefully and patiently, and continuously strengthens communication with investors, which enhances
investors’ understanding and trust to the Company; and the Company's image in the capital market is
maintained well.
(V) Return to shareholders
During the reporting period, the Company continued to perform its due social responsibility obligations and actively shared the Company's operating results with investors. The Company
implemented the profit distribution for 2019 in strict accordance with the Dividend Plan for the Next Three

2020 Annual Report
91 / 246
Years (2018-2020). By implementing dividends strictly according to the plan, the Company has created
value for shareholders while also enhancing social reputation and social image.
The Company has a complete governance structure, a sound internal control system, and a stable
operation. Through the strengthening of corporate governance from top to bottom, the level of corporate
governance continues to improve, and all links and tasks are carried out legally and orderly.
Is there any significant difference between the Company governance and the requirements of the
China Securities Regulatory Commission (CSRC)? If any, the reasons shall be given.
□Applicable √Inapplicable
II. Introduction to Shareholders Meeting
Session Holding date
Query indexes on specified
website for published
resolutions
Date for disclosure of
published resolutions
The 1st Interim Shareholders
Meeting in 2021 February 27, 2020 http://www.sse.com.cn February 28, 2020
Stockholders meeting in 2019 May 12, 2020 http://www.sse.com.cn May 13, 2020
The 2nd Interim Shareholders
Meeting in 2021 July 30, 2020 http://www.sse.com.cn July 31, 2020
Explanation of Shareholders Meeting
□Applicable √Inapplicable
III. Directors' Performance of Duties
(I) Directors’ Attendance at the Board of Directors and Shareholders Meeting
Director
name
Independent
director or
not
Attendance at the board of directors
Attendance at
shareholders
meeting
Time(s) of
supposed
annual
attendance
at the board
of directors
Time(s) of
attendance
in person
Time(s) of
attendance via
telecommunication
Time(s) of
entrusted
attendance
Time(s)
of
absence
Does
he/she fail
to attend in
person for
two
successive
times?
Time(s) of
attendance at
shareholders
meeting
Liu
Hanyuan No 12 12 10 0 0
No 2
Xie Yi No 12 12 10 0 0 No 2
Yan Hu No 12 12 10 0 0 No 3
Duan Yong No 12 12 10 0 0 No 2
Wang
Xiaohui
No 12 12 10 0 0
No 1
Ding Yi No 8 8 8 0 0 No 0
Du Kunlun Yes 12 12 10 0 0 No 3
Wang Jin Yes 12 12 10 0 0 No 1
Fu Daiguo Yes 12 12 10 0 0 No 3
Explanation on failure to attend in person at the meeting of board of directors for two successive times
□Applicable √Inapplicable
Annual meeting(s) of board of directors 12
Wherein: on-site meeting(s) 1
Number of meetings held by communication 10
Meeting(s) convened in on-site and telecommunication mode 1
(II) Objection to the Company's related issues raised by independent director
□Applicable √Inapplicable
(III) Others
□Applicable √Inapplicable

2020 Annual Report
92 / 246
IV. The specific information should be disclosed in case of any objections to the important opinions
and suggestions raised by the Special Committee under the Board of Directors during its
performance of duties in the reporting period.
√Applicable □Inapplicable
Under the Company's board of directors, there are four special committees: Audit Committee,
Remuneration and Evaluation Committee, Strategic Decision Committee, and Nomination Committee.
During the reporting period, the four special committees carried out relevant work in strict accordance
with the regulations and requirements of the working rules formulated by the Company, and effectively
performed the duties of the members of the special committees. During the reporting period, the four
special committees raised no objections to any of the proposals.
V. Explanation by the Board of Supervisors on the Company’s risks
□Applicable √Inapplicable
VI. The Company’s Explanation on Failure of the Company and Its Controlling Shareholders to
Remain Independent and Autonomous Management Capacity in Respect of Business, Personnel,
Assets, Institution and Financial Affairs
□Applicable √Inapplicable
The Company should prepare the solution measures, job schedule and follow-up work plan to cope with
horizontal competition.
□Applicable √Inapplicable
VII. About the Establishment and Implementation of the Evaluation System and Incentive
Mechanism for Senior Management in the Reporting Period
√Applicable □Inapplicable
The remuneration of the Company's senior management is based on the Company's Remuneration
Management System and linked to the Company's operating performance and personal performance.
VIII. Whether the Report on Internal Control Self-evaluation should be disclosed?
√Applicable □Inapplicable
The Company's Report on Internal Control Self-evaluation in 2020 was disclosed on the Shanghai
Stock Exchange's website (www.sse.com.cn) on April 13, 2021.
Explanation of great defects in internal control during reporting period
□Applicable √Inapplicable
IX. Information on Internal Control Audit Report
√Applicable □Inapplicable
Sichuan Huaxin employed by the Company has audited the Company's internal control in 2020 and
issued a standard and unqualified auditor's report on internal control. For details, please refer to the
"Internal Control Audit Report of Tongwei Co., Ltd. in 2020" disclosed on April 13, 2021 by the Company
on the website of Shanghai Stock Exchange (www.sse.com.cn).
Whether internal control audit reports are disclosed:Yes
Type of opinion of internal control audit report: standard and unqualified opinion
X. Others
□Applicable √Inapplicable
Section X Information on Company Bonds
□Applicable √Inapplicable

2020 Annual Report
93 / 246
Section XI Financial Report
I. Auditor’s Report
√Applicable □Inapplicable
The Company's annual financial report has been audited by Feng Yuan, He Shoufu and Gou Jing,
certified public accountants of Sichuan Huaxin, and an unqualified auditor's report has been issued.
Auditor’s Report
CHXS (2021) No.0014
All shareholders of Tongwei Co., Ltd.:
I. Audit Opinion
We have audited the financial statements of Tongwei Co., Ltd. (hereinafter referred to as “Tongwei
Co., Ltd.”), including Consolidated and Parent Company’s Balance Sheets dated on December 31, 2020,
as well as 2020 Consolidated and Parent Company’s Income Statements, Consolidated and Parent
Company’s Cash Flow Statements, Consolidated and Parent Company’s Statements of Changes in
Owner’s Equity, and Notes to Financial Statements.
In our opinion, the attached financial statements were compiled as per the provisions of Accounting
Standards for Business Enterprises in all major aspects and can fairly present the merger of Tongwei Co.,
Ltd. on December 31, 2020 and parent company’s financial position as well as the merger in 2020 and
business performance and cash flows of parent company.
II. Basis Forming Audit Opinions
We have performed the audit work in accordance with the provisions of the auditing rules of Chinese
Certified Public Accountant. The "Responsibility of Certified Public Accountants for Auditing Financial
Statements" in the audit report further explains our responsibilities under these guidelines. In accordance
with the Code of Professional Ethics of Chinese Certified Public Accountant, we are independent of
Tongwei Co., Ltd. and have fulfilled other responsibilities in aspect of professional ethics. We believe that
the audit evidence we have obtained is sufficient and appropriate to provide a basis for our audit opinion.
III. Key Audit Matters Key audit matters are those matters that, in our professional judgment, were of most significance in
our audit of the financial statements of current year. These matters were addressed in the context of our
audit for the entire financial statements and the formation of our opinions thereon. We do not declare a
separate opinion on these matters.
(I) Revenue recognition
1. Matter explanation
As shown in Note V. 45 "Operating Revenue and Operating Cost" of Financial Statements and Note
XIV. 2 "Segment Information" of Financial Statements, in 2020, Tongwei Co., Ltd.'s consolidated
operating revenue was RMB 44.20 billion, of which: PV business was the main business revenue of 22.502
billion yuan, and the main business revenue of agriculture and animal husbandry business was 20.936
billion yuan. Operating revenue is a key performance indicator of Tongwei Co, Ltd.. There is an inherent
risk of management manipulating revenue recognition in order to achieve specific goals or expectations.
Therefore, we identify revenue recognition as a key audit matter.
2. Audit response
(1) Understand whether the design and operation of internal control related to test sales and
collection are effective, and evaluate the rationality of the basis and timing of revenue recognition.
(2) Implement analysis procedures on sales revenue, including comparison with the same period,
comparison by product category, etc., to evaluate the rationality of related changes.
(3) Select major customers, check contracts, orders, invoices, customer signatures, etc., and verify
the transaction amount and balance of the end of the period to confirm the authenticity, completeness and
accuracy of the transaction; for other customers, randomly check sales contracts, customer purchasing
orders, shipping documents, transportation documents, payment receipts, customer receipt records and
other materials to verify the authenticity, completeness and accuracy of the sales revenue amount.

2020 Annual Report
94 / 246
(4) Recalculate and verify PV power generation revenue according to the unit price and settlement
power confirmed in the electricity purchase and sale agreement and related documents of power generation
subsidies; send a letter to the State Grid Electric Power Company for the settlement of power and the
settlement of desulfurization electricity fees.
(5) Check export sales and shipments and customs declaration data, combined with the
implementation of letter verification procedures for export sales customers’ advance payment balances to
verify the authenticity, completeness and accuracy of export sales revenue.
(6) Query the industrial and commercial information of important customers and ask the relevant
personnel of Tongwei Co., Ltd. to confirm whether these customers have an associated relationship with
Tongwei Co., Ltd.
(7) Select the cut-off test for sales revenue recognition before and after the balance sheet date, pay
attention to the date when the customer signs the receipt, and also pay attention to whether there is a large
return after the period to verify whether the corresponding revenue is included in the appropriate
accounting period.
(II) The existence of bank acceptance bills receivable and the integrity of bank acceptance
bills payable
1. Matter explanation
As shown in Note V. 5 "Financing of Accounts Receivable" and Note V. 25 "Notes Payable-Bank
Acceptance Draft" of the financial statements, as of December 31, 2020, accounts receivable financing,
bills payable-bank acceptance balances were respectively 9.712 billion yuan and 9.364 billion yuan, which
accounted for 15.12% of total assets and 28.63% of total liabilities respectively, affecting 8.38 percent
points of the debt-to-asset ratio. The PV industry of Tongwei Co., Ltd. generally uses bill settlement. With
the growth of business scale and the development of its "bill pool" business with banks, Tongwei Co., Ltd.
has a relatively large balance of bank acceptance bills receivable and payable, and the bills receivable has
the situation of pledged restricted. The amount of bank acceptance bills receivable and payable is
significant. Therefore, we consider the existence of bank acceptance bills receivable and the integrity of
bank acceptance bills payable as key audit matters.
2. Audit response
(1) Understand and test the design and operation of key internal controls related to the management
bills, and evaluate whether they are effective.
(2) Obtain the reference book of Tongwei Co., Ltd., check the consistency of the record of the
reference book and the amount of the book, and take a sample from the receipt and payment records of
the bill for inspection, check the bill information, etc.
(3) Check the bill discount agreement and bill pool agreement, check whether the discount interest
and accounting treatments are correct, and check the bill margin, pledged bills receivable and the bills
payable that are restricted due to the issuance of bills payable.
(4) Information on bills payable, pledged bills receivable and discounted bills issued at the end of
bank confirmation;
(5) Obtain the corporate credit report and check whether the information on the notes payable and
discounted notes issued at the end of the period is consistent with the book records.
(6) At the end of the period, the bills receivable shall be monitored to confirm whether the bills
receivable at the end of the period actually exist and the accuracy of the bill information, and at the same
time check the restrictions on the pledge of the bills receivable.
(7) Review whether the consideration of bill settlement in the cash flow statement prepared by the
management of Tongwei Co., Ltd. is appropriate and whether the relevant presentation is correct.
IV. Other Information
The Management of Tongwei Co., Ltd. shall be responsible for other information. Other information
comprises the information included in the 2020 Annual Report, but does not include the financial
statements and our audit report thereon.
Our opinion on the financial statements does not cover the other information and we do not express
any form of assurance conclusion thereon.
In connection with our audit of the financial statements, our responsibility is to read the other
information and, in doing so, consider whether the other information is materially inconsistent with the
financial statements or our knowledge obtained in the audit or otherwise appears to be materially misstated.
If we conclude that there is a material misstatement in such other information based on the work we have performed, we are required to report that fact. We have nothing to report in this regard.
V. Responsibilities of Management and Governance for the Financial Statements

2020 Annual Report
95 / 246
The Management of Tongwei Co., Ltd. shall be responsible for preparing Financial Statements that
give a true and fair presentation in accordance with Accounting Standards for Business Enterprises, and
designing, implementing and maintaining necessary internal control to prevent material misstatement
caused by fraud or error in Financial Statements.
When preparing the financial statements, the management is responsible for assessing the sustainable
operation ability of Tongwei Co., Ltd., disclosing matters related to the sustainable operation (if
applicable), and applying the sustainable operation assumption, unless the management plans to liquidate
Tongwei Co., Ltd., terminate operations or has no other realistic choice.
The Governance shall be responsible for supervising the financial reporting process of Tongwei Co.,
Ltd.
VI. CPA's Responsibilities for Auditing the Financial Statements Our objective is to obtain reasonable assurance that the financial statements as a whole are free from
material misstatement, whether due to fraud or error, and to issue an auditor’s report that includes our
opinion. Reasonable assurance is a high level of assurance, but is not a guarantee to detect a material
misstatement in an audit conducted in accordance with Auditing Standards. Misstatement can arise from
fraud or error is considered material if, individually or in aggregate, they could reasonably be expected to
influence the economic decisions users would take on the basis of these financial statements.
As part of an audit in accordance with Auditing Standards, we exercise professional judgment and
maintain professional skepticism throughout the audit. Meanwhile, we also:
(1) Identify and assess the risks of material misstatement of the financial statements, whether due to
fraud or error, design and perform audit procedures responsive to those risks, and obtain audit evidence
that is sufficient and appropriate to provide a basis for our opinions. The risk of failing to detect a material
misstatement due to fraud is higher than that of failing to detect a material misstatement resulting from
error, as fraud may involve collusion, forgery, intentional omissions, misrepresentations, or overriding of
internal control.
(2) Understand the audit-related internal control to design appropriate audit procedures.
(3) Assess the appropriateness of adopted accounting policies and the reasonableness of accounting
estimates and relevant disclosures made by the Management.
(4) Conclude the appropriateness of the going-concern assumption made by the Management. Besides,
based on the audit evidence obtained, whether a material uncertainty exists related to events or conditions
that may cast a significant doubt on the Tongwei Co., Ltd.’s ability to continue as a going concern; if we
conclude that the material uncertainty does exist, according to the Auditing Standards, we shall bring the
users’ attention in our auditor’s report to the relevant disclosures in the financial statements; if the
disclosures are inadequate, we shall modify our opinion. Our conclusions are based on the information
that has been available till the date of our auditor’s report. However, future events or conditions may cause
Tongwei Co., Ltd. to cease to continue as a going concern.
(5) Evaluate the overall presentation, structure and content of the financial statements, and whether
the Financial Statements provide a fair representation of the underlying transactions and events.
(6) Obtain sufficient and appropriate audit evidence regarding the financial information of the entities
or business activities within Tongwei Co., Ltd. to express an opinion on the Financial Statements. We are
responsible for the direction, supervision and performance of the audit on the Group, and we remain solely
responsible for our audit opinion.
We communicate with those charged with Governance regarding, among other matters, the planned
scope and timing of the audit and significant audit findings etc., including any significant deficiencies in
internal control that we identify during our audit.
We also provide those charged with Governance with a statement that we have complied with those
relevant ethical requirements regarding independence, and to communicate with them all relationships and
other matters that may reasonably be thought to bear on our independence and related safeguards, where
applicable.
From the matters communicated with the Governance, we determine those matters that were of most
significance in the audit of the financial statements of the current period and are therefore the key audit
matters. We describe these matters in our auditor’s report unless the laws or regulations preclude public
disclosure about the matter or when, in extremely rare circumstances, we determine that a matter shall not
be communicated in our report because the adverse consequences of doing so will reasonably be expected
to outweigh the public interest benefits of such communication.

2020 Annual Report
96 / 246
Sichuan Huaxin (Group) CPA Firm China Certified Public Accountants: Feng Yuan
(Project partner)
(Special General Partnership) China Certified Public Accountant: He Shoufu
Chengdu, China China Certified Public Accountant: Gou Jing
April 9, 2021

2020 Annual Report
97 / 246
II. Financial Statement
Consolidated Balance Sheet
December 31, 2020
Prepared by: Tongwei Co., Ltd.
Unit:Yuan Currency: RMB Item Note December 31, 2020 December 31, 2019
Current assets:
Cash at bank and on hand 6,264,168,242.03 2,692,681,748.77
Settlement reserves
Lending funds
Trading financial assets 1,531,863,068.12
Derivative financial assets
Notes receivable 530,962,356.27 457,074,006.31
Accounts receivable 1,069,352,776.17 1,672,241,936.75
Receivables financing 9,711,898,567.92 4,392,541,416.88
Advance payment 1,113,458,878.37 389,875,898.15
Premiums receivable
Reinsurance premium receivable
Reinsurance contract reserves receivable
Other receivables 797,517,755.34 805,398,204.90
Including: Interest receivable
Dividend receivable
Redemptory cash at bank and on hand for sale
Inventories 2,773,077,527.98 2,415,680,873.20
Contract assets 988,680,196.66
Held-for-sale assets
Non-current assets due within one year
Other current assets 810,572,652.99 917,830,014.66
Total current assets 25,591,552,021.85 13,743,324,099.62
Non-current assets:
Loans and advances
Debt investment
Other debt investments
Long-term receivables
Long-term equity investments 477,736,082.22 439,741,224.58
Other equity instrument investments 153,445,100.85 153,385,357.94
Other non-current financial assets 1,258,097.00
Investment real estate 102,993,048.15 107,112,223.47
Fixed assets 29,829,602,625.00 24,533,684,430.23
Construction in progress 2,997,901,620.59 3,587,311,808.76
Productive biological assets 91,397.35 2,417,050.59
Oil and gas assets
Right-of-use assets
Intangible assets 1,663,705,788.75 1,709,753,019.31
Development expenditure
Goodwill 635,818,717.99 635,818,717.99
Long-term prepaid expenses 835,269,963.57 607,333,082.04
Deferred income tax assets 415,550,864.14 244,903,723.68
Other non-current assets 1,547,022,743.45 1,056,166,007.39
Total non-current assets 38,660,396,049.06 33,077,626,645.98
Total assets 64,251,948,070.91 46,820,950,745.60
Current liabilities
Short-term loan 2,349,154,525.77 3,622,853,209.83
Borrowings from the central bank
Loans from other banks
Trading financial liabilities
Derivative financial liabilities
Notes payable 9,411,924,434.78 5,294,623,239.24
Accounts payable 3,917,320,980.64 3,609,038,689.71
Advance receipt 35,072,100.83 1,571,445,278.97
Contract liabilities 2,302,728,492.73

2020 Annual Report
98 / 246
Financial assets sold for repurchase
Deposits from customers and interbank
Receivings from vicariously traded securities
Receivings from vicariously sold securities
Employee compensation payable 736,363,100.05 692,632,415.17
Taxes and fees payable 220,414,765.91 173,544,507.36
Other payables 743,639,264.91 613,261,268.85
Including: Interest payable 53,828,469.22
Dividend payable 1,188,940.27
Fees and commissions payable
Reinsurance amounts payable
Held-for-sale liabilities
Non-current liabilities due within one year 2,533,702,158.71 1,142,185,072.84
Other current liabilities 130,204,120.53 1,123,805,086.92
Total current liabilities 22,380,523,944.86 17,843,388,768.89
Non-current liabilities:
Insurance contract reserves
Long-term loan 6,296,585,539.34 4,088,988,505.70
Bonds payable 410,096,446.33 4,212,346,552.36
Including: Preferred shares
Perpetual bond
Lease liabilities
Long-term payables 2,526,572,275.65 1,901,507,753.72
Long-term employee compensation payable
Estimated liabilities
Deferred incomes 782,273,717.14 544,324,456.73
Deferred income tax liabilities 311,949,837.40 142,204,473.38
Other non-current liabilities
Total non-current liabilities 10,327,477,815.86 10,889,371,741.89
Total liabilities 32,708,001,760.72 28,732,760,510.78
Owners' equity (or shareholders' equity):
Paid-in capital (or share capital) 4,501,548,184.00 3,882,594,596.00
Other equity instruments 854,235,969.85
Including: Preferred shares
Perpetual bond
Capital reserves 16,105,693,787.44 5,672,664,800.50
Less: Treasury shares
Other comprehensive income -73,914,221.72 -31,800,201.05
Special reserves 16,401,063.07 18,057,814.87
Surplus reserves 925,322,362.44 564,141,320.54
General risk provision
Undistributed profit 9,066,353,854.50 6,617,152,692.38
Total owners' equity (or shareholders' equity)
attributable to the parent company
30,541,405,029.73 17,577,046,993.09
Non-controlling interest 1,002,541,280.46 511,143,241.73
Total owners' equity (or shareholders' equity) 31,543,946,310.19 18,088,190,234.82
Total liabilities and owners’ equity (or
shareholders’ equity)
64,251,948,070.91 46,820,950,745.60
Legal Representative: Xie Yi
Person in Charge of Accounting Work: Zhou Bin
Person in Charge of Accounting Firm: Lei Jiaowen
Balance Sheet of the Parent Company
December 31, 2020
Prepared by: Tongwei Co., Ltd.
Unit:Yuan Currency:RMB Item Note December 31, 2020 December 31, 2019
Current assets:
Cash at bank and on hand 5,430,260,350.86 1,471,405,136.59
Trading financial assets 1,500,000,000.00
Derivative financial assets
Notes receivable 192,411,653.25

2020 Annual Report
99 / 246
Accounts receivable 3,002,746.85 11,818,819.45
Receivables financing 69,390,676.70
Advance payment 16,500,340.59 20,317,564.39
Other receivables 12,569,916,260.88 12,954,465,620.37
Including: Interest receivable
Dividend receivable 1,371,854.15
Inventories 235,553,546.57 286,015,214.02
Contract assets
Held-for-sale assets
Non-current assets due within one year
Other current assets 11,747,755.66 18,065,477.24
Total current assets 19,836,371,678.11 14,954,499,485.31
Non-current assets:
Debt investment
Other debt investments
Long-term receivables 3,821,033,136.03 2,633,845,533.29
Long-term equity investments 13,836,401,258.90 10,949,592,149.18
Other equity instrument investments 153,445,100.85 153,385,357.94
Other non-current financial assets
Investment real estate 38,690,960.02 40,379,903.86
Fixed assets 298,259,368.75 338,148,583.81
Construction in progress 26,343,888.97 13,972,100.27
Productive biological assets
Oil and gas assets
Right-of-use assets
Intangible assets 60,200,180.33 72,308,833.45
Development expenditure
Goodwill
Long-term prepaid expenses 18,576,273.26 28,898,156.41
Deferred income tax assets 1,610,507.55 1,833,741.44
Other non-current assets 4,559,373.00
Total non-current assets 18,254,560,674.66 14,236,923,732.65
Total assets 38,090,932,352.77 29,191,423,217.96
Current liabilities
Short-term loan 1,899,865,349.31 2,796,114,779.39
Trading financial liabilities
Derivative financial liabilities
Notes payable 300,000,000.00 85,940,000.00
Accounts payable 81,247,275.28 138,318,934.51
Advance receipt 1,921,719.85 142,278,536.45
Contract liabilities 122,226,302.00
Employee compensation payable 93,517,635.88 115,251,165.67
Taxes and fees payable 6,703,834.73 4,670,323.26
Other payables 3,898,411,472.34 3,317,703,159.73
Including: Interest payable 50,682,524.91
Dividend payable
Held-for-sale liabilities
Non-current liabilities due within one year 370,178,150.11 62,384,300.00
Other current liabilities 126,263.87 1,099,583,333.30
Total current liabilities 6,774,198,003.37 7,762,244,532.31
Non-current liabilities:
Long-term loan 3,405,262,828.00 2,032,538,604.00
Bonds payable 410,096,446.33 4,212,346,552.36
Including: Preferred shares
Perpetual bond
Lease liabilities
Long-term payables 875,898,885.36 1,575,898,885.36
Long-term employee compensation payable
Estimated liabilities
Deferred incomes
Deferred income tax liabilities
Other non-current liabilities

2020 Annual Report
100 / 246
Total non-current liabilities 4,691,258,159.69 7,820,784,041.72
Total liabilities 11,465,456,163.06 15,583,028,574.03
Owners' equity (or shareholders' equity):
Paid-in capital (or share capital) 4,501,548,184.00 3,882,594,596.00
Other equity instruments 854,235,969.85
Including: Preferred shares
Perpetual bond
Capital reserves 17,084,837,736.04 6,646,802,814.79
Less: Treasury shares
Other comprehensive income 6,757,300.85 6,697,557.94
Special reserves
Surplus reserves 925,322,362.44 564,141,320.54
Undistributed profit 4,107,010,606.38 1,653,922,384.81
Total owners' equity (or shareholders' equity) 26,625,476,189.71 13,608,394,643.93
Total liabilities and owners’ equity (or
shareholders’ equity)
38,090,932,352.77 29,191,423,217.96
Legal Representative: Xie Yi
Person in Charge of Accounting Work: Zhou Bin
Person in Charge of Accounting Firm: Lei Jiaowen
Consolidated Income Statement
January-December 2020
Unit:Yuan Currency:RMB Item Note 2020 2019
I. Total operating revenue 44,200,270,334.23 37,555,118,255.70
Including: operating revenue 44,200,270,334.23 37,555,118,255.70
Interest incomes
Premiums earned
Handling charges and commission incomes
II. Total operating costs 41,070,717,427.55 34,856,442,766.60
Including: operating costs 36,648,405,064.38 30,536,001,116.46
Interest expenses
Fees and commissions expenses
Refunded premiums
Net amount for insurance claims
Net amount for insurance contract reserves
Policyholder dividend expenses
Reinsurance expenses
Taxes and surcharges 124,045,656.13 122,861,135.60
Sales expenses 778,030,640.18 975,270,497.07
General and administrative expenses 1,808,578,103.39 1,513,809,599.62
R&D expenses 1,035,331,434.68 1,000,694,593.85
Financial expenses 676,326,528.79 707,805,824.00
Including: interest expenses 682,296,633.96 764,775,422.92
Interest incomes 57,540,093.05 56,710,422.17
Add: other incomes 303,549,939.09 214,303,960.33
Investment incomes (loss to be listed with “-”) 1,569,378,017.50 118,366,118.06
Including: incomes from investments in associates
and joint ventures
22,506,526.78 107,669,300.53
Incomes from derecognition of financial assets
at amortized cost
Foreign exchange incomes (loss to be listed with “-”)
Net exposure hedging incomes (loss to be listed with
“-”)
Incomes from fair value changes (loss to be listed
with “-”
4,863,068.12
Credit impairment loss (loss to be listed with “-”) -25,239,864.43 -43,006,733.75
Asset impairment loss (loss to be listed with “-”) -267,765,939.43 -4,917,914.50
Incomes from assets disposal (loss to be listed with
“-”)
-1,148,829.24 139,601,655.37
III. Operating profit (loss to be listed with “-”) 4,713,189,298.29 3,123,022,574.61

2020 Annual Report
101 / 246
Add: non-operating income 36,995,627.30 42,382,735.16
Less: non-operating expenses 476,391,959.47 13,883,488.63
IV Total profit (total loss to be listed with “-”) 4,273,792,966.12 3,151,521,821.14
Less: income tax expenses 559,054,175.03 469,185,830.00
V Net profit (net loss to be listed with “-”) 3,714,738,791.09 2,682,335,991.14
(I) Classified by operating continuity
1. Net profit from continuing operations (net loss to be
listed with“-”)
3,714,738,791.09 2,682,335,991.14
2. Net profit from termination of operations (net loss to
be listed with“-”)
(II) Classified by attribution of the ownership
1. Net profit attributable to the shareholders of the
parent company (net loss to be listed with “-”)
3,607,923,359.56 2,634,568,828.17
2. Minority interest profit and loss (net loss to be listed
with “-”)
106,815,431.53 47,767,162.97
VI. Net of tax of other comprehensive income -42,114,020.67 7,882,420.01
(I) Net of tax of other comprehensive income attributable
to the owners of parent company
-42,114,020.67 7,882,420.01
1. Other comprehensive incomes that cannot be
reclassified through profit or loss
59,742.91 5,298,046.85
(1) Changes arising from re-measurement of the defined
benefit plan
(2) Other comprehensive incomes that cannot be
reclassified into profit or loss under the equity method
(3) Changes in fair value of investment by other equity
instruments
59,742.91 5,298,046.85
(4) Changes in fair value of the enterprise’s credit risk
2. Other comprehensive incomes that cannot be
reclassified through profit or loss in the future
-42,173,763.58 2,584,373.16
(1) Other comprehensive income which can be transferred
to profit or loss under equity method
(2) Changes in fair value of other debt investments
(3) Amount of financial assets reclassified into other
comprehensive income
(4) Credit depreciation reserves of other investment on
bonds
(5) Cash flow hedge reserves
(6) Converted differences of foreign currency financial
statements
-42,173,763.58 2,584,373.16
(7) Others
(II) Net after-tax amount of other comprehensive income
attributable to minority shareholders
VII. Total comprehensive income 3,672,624,770.42 2,690,218,411.15
(I) Total comprehensive income attributable to the owners
of parent company
3,565,809,338.89 2,642,451,248.18
(II) Total comprehensive income attributable to minority
shareholders
106,815,431.53 47,767,162.97
VIII. Earnings per share:
(I) Basic earnings per share (RMB/share) 0.8581 0.6786
(II) Diluted earnings per share (RMB/share) 0.8466 0.6558
In case of business merger under common control in the current period, the net profit realized by the
merged party before merger is RMB 0 and the net profit realized by the merged party in the previous
period is RMB 0.
Legal Representative: Xie Yi
Person in Charge of Accounting Work: Zhou Bin
Person in Charge of Accounting Firm: Lei Jiaowen
Income Statement of the Parent Company
January-December 2020
Unit:Yuan Currency:RMB Item Note 2020 2019

2020 Annual Report
102 / 246
I. Operating revenue 4,192,495,277.69 4,608,001,044.23
Subtract: business costs 3,637,398,495.75 4,069,405,797.97
Taxes and surcharges 11,378,524.54 9,500,119.27
Sales expenses 102,341,946.30 135,977,514.41
General and administrative expenses 263,765,902.77 275,243,555.26
R&D expenses 82,199,172.38 94,651,070.38
Financial expenses 136,659,179.77 249,040,595.61
Including: interest expenses 304,013,432.37 603,413,663.20
Interest incomes 35,879,830.81 354,041,684.83
Add: other incomes 14,854,162.45 12,271,154.52
Investment incomes (loss to be listed with “-”) 3,696,091,743.61 1,490,069,535.76
Including: incomes from investments in associates and joint
ventures
-3,090,231.86 6,605,886.65
Incomes from derecognition of financial assets at amortized cost
Net exposure hedging incomes (loss to be listed with “-”)
Incomes from fair value changes (loss to be listed with “-”
Credit impairment loss (loss to be listed with “-”) -57,089,598.72 124,079,446.16
Asset impairment loss (loss to be listed with “-”)
Incomes from assets disposal (loss to be listed with “-”) 293,836.91 113,518,456.73
II. Operating profit (loss to be listed with “-”) 3,612,902,200.43 1,514,120,984.50
Add: non-operating income 1,719,398.03 1,778,011.79
Less: non-operating expenses 3,745,810.54 2,763,173.55
III. Total profit (loss to be listed with “-”) 3,610,875,787.92 1,513,135,822.74
Less: income tax expenses -934,631.09 213,682.96
IV Net profit (net loss to be listed with “-”) 3,611,810,419.01 1,512,922,139.78
(I) Net profit from continuing operations (net loss to be listed
with “-”)
3,611,810,419.01 1,512,922,139.78
(II) Net profit from termination of operations (net loss to be
listed with“-”)
V. Net other comprehensive income after tax 59,742.91 5,298,046.85
(I) Other comprehensive incomes that cannot be reclassified
through profit or loss
59,742.91 5,298,046.85
1. Changes arising from re-measurement of the defined
benefit plan
2. Other comprehensive incomes that cannot be reclassified
into profit and loss under the equity method
3. Changes in fair value of investment by other equity
instruments
59,742.91 5,298,046.85
4. Changes in fair value of the enterprise’s credit risk
(II) Other comprehensive incomes that will be re-classified
through profit or loss
1. Other comprehensive income which can be transferred to
profit or loss under equity method
2. Changes in fair value of other debt investments
3. Amount of financial assets reclassified into other
comprehensive income
4. Amount of financial assets reclassified into other
comprehensive income
5.Cash flow hedge reserves
6.Converted difference in foreign currency statements
7.Others
VI. Total comprehensive income 3,611,870,161.92 1,518,220,186.63
VII. Earnings per share:
(I) Basic earnings per share (RMB/share)
(II) Diluted earnings per share (RMB/share)
Legal Representative: Xie Yi
Person in Charge of Accounting Work: Zhou Bin
Person in Charge of Accounting Firm: Lei Jiaowen
Consolidated Cash Flow Statement
January-December 2020
Unit:Yuan Currency:RMB

2020 Annual Report
103 / 246
Item Note 2020 2019
I. Cash flows from operating activities:
Cash received from sales of goods and rendering of
services
37,442,245,418.41 27,794,872,880.68
Net increase in customer deposits and interbank deposits
Net increase in borrowings from the central bank
Net increase in placements from other financial institutions
Cash received for receiving premium of original insurance
contract
Net cash received from reinsurance business
Net increase in deposits of the insured and investment
Cash received from interests, fees and commissions
Net increase in placements from banks and other financial
institutions
Net increase in repurchasing
Net cash received from securities brokering
Cash received from taxes refund 423,961,983.83 193,736,805.80
Cash received relating to other operating activities 775,771,262.55 590,419,243.74
Sub-total of cash inflows from operating activities 38,641,978,664.79 28,579,028,930.22
Cash paid for goods and services 31,447,680,659.72 22,185,676,505.26
Net increase in loans and advances
Net increase in deposits in the Central Bank and other
financial institutions
Cash paid for claim settlements on original insurance
contract
Net increase in placements to banks and other financial
institutions
Cash paid for interests, fees and commissions
Cash paid for policy dividends
Cash paid to and for employees 2,730,865,444.91 2,451,933,363.64
Payments of taxes and surcharges 709,964,246.65 874,191,910.53
Cash paid relating to other operating activities 728,540,381.57 709,761,943.11
Sub-total of cash outflows from operating activities 35,617,050,732.85 26,221,563,722.54
Net cash flow from operating activities 3,024,927,931.94 2,357,465,207.68
II. Cash flows from investing activities:
Cash received from return of investments 384,107,500.00 561,877,193.62
Cash received from investments income 96,464,234.31 9,120,463.00
Net cash received from disposal of fixed assets, intangible
assets and other long-term assets
133,040,127.00 71,491,065.83
Net cash received from disposal of subsidiaries and other
business units
1,778,884,791.31 872,519.11
Cash received relating to other investing activities 502,607,812.51 292,255,854.99
Sub-total of cash inflows from investing activities 2,895,104,465.13 935,617,096.55
Cash paid to acquire fixed assets, intangible assets and
other long-term assets
5,486,604,092.60 4,208,168,887.19
Cash paid for investments 1,981,421,297.00 621,196,638.17
Net increase in pledge loans
Net cash paid to acquire subsidiaries and other business
units
2,966,998.32
Cash paid relating to other investing activities 167,329,398.46 394,058,909.35
Sub-total of cash outflow from investing activities 7,635,354,788.06 5,226,391,433.03
Net cash flows from investing activities -4,740,250,322.93 -4,290,774,336.48
III. Cash flows from financing activities:
Cash received from investment absorption 6,419,669,790.00 48,335,000.00
Including: Cash received by subsidiaries from investment
absorption of minority interest
476,130,300.00 48,335,000.00
Cash received from loans granted 14,436,194,796.08 16,467,251,676.76
Cash received relating to other financing activities 1,094,045,631.00 943,358,344.18
Sub-total of cash inflows from financing activities 21,949,910,217.08 17,458,945,020.94
Cash paid for settlement of borrowings 13,143,663,135.37 12,351,309,057.71
Cash paid for dividends, profit appropriation or payments
of interest
1,299,112,282.65 1,128,765,089.39
Including: dividends and profit paid to minority interests 64,286,181.74 27,927,672.38
Cash paid relating to other financing activities 1,711,762,473.10 2,537,786,822.34

2020 Annual Report
104 / 246
Sub-total of cash outflows from financing activities 16,154,537,891.12 16,017,860,969.44
Net cash flows from financing activities 5,795,372,325.96 1,441,084,051.50
IV. Effect of changes in foreign exchange rate on cash and
cash equivalents
-36,746,892.76 6,940,067.92
V. Net increase in cash and cash equivalents 4,043,303,042.21 -485,285,009.38
Add: beginning balance of cash and cash equivalents 1,942,739,577.25 2,428,024,586.63
VI. Ending balance of cash and cash equivalents 5,986,042,619.46 1,942,739,577.25
Legal Representative: Xie Yi
Person in Charge of Accounting Work: Zhou Bin
Person in Charge of Accounting Firm: Lei Jiaowen
Cash Flow Statement of the Parent Company January-December 2020
Unit:Yuan Currency:RMB Item Note 2020 2019
I. Cash flows from operating activities:
Cash received from sales of goods and rendering of
services
4,347,037,676.95 4,596,818,155.72
Cash received from taxes refund 68,193.57
Cash received relating to other operating activities 97,529,785.17 65,121,145.13
Sub-total of cash inflows from operating activities 4,444,635,655.69 4,661,939,300.85
Cash paid for goods and services 3,641,589,698.05 4,437,400,673.50
Cash paid to and for employees 346,227,657.01 336,283,267.65
Payments of taxes and surcharges 11,736,797.15 11,095,558.30
Cash paid relating to other operating activities 137,244,175.61 132,440,576.88
Sub-total of cash outflows from operating activities 4,136,798,327.82 4,917,220,076.33
Net cash flow from operating activities 307,837,327.87 -255,280,775.48
II. Cash flows from investing activities:
Cash received from return of investments 571,180,300.00 562,365,187.04
Cash received from investments income 4,060,910,871.57 1,489,316,904.17
Net cash received from disposal of fixed assets, intangible
assets and other long-term assets
117,199,544.67 3,873,056.72
Net cash received from disposal of subsidiaries and other
business units
Cash received relating to other investing activities
Sub-total of cash inflows from investing activities 4,749,290,716.24 2,055,555,147.93
Cash paid to acquire fixed assets, intangible assets and
other long-term assets
49,489,656.66 40,088,161.36
Cash paid for investments 5,347,326,300.00 2,230,689,032.59
Net cash paid to acquire subsidiaries and other business
units
Cash paid relating to other investing activities
Sub-total of cash outflow from investing activities 5,396,815,956.66 2,270,777,193.95
Net cash flows from investing activities -647,525,240.42 -215,222,046.02
III. Cash flows from financing activities:
Cash received from investment absorption 5,943,539,490.00
Cash received from loans granted 10,630,759,167.28 12,650,668,159.25
Cash received relating to other financing activities 3,946,866,493.29 2,668,712,469.61
Sub-total of cash inflows from financing activities 20,521,165,150.57 15,319,380,628.86
Cash paid for settlement of borrowings 10,573,275,246.67 9,763,854,825.58
Cash paid for dividends, profit appropriation or payments
of interest
1,080,839,135.95 984,738,056.66
Cash paid relating to other financing activities 4,372,171,885.77 4,009,408,217.62
Sub-total of cash outflows from financing activities 16,026,286,268.39 14,758,001,099.86
Net cash flows from financing activities 4,494,878,882.18 561,379,529.00
IV. Effect of changes in foreign exchange rate on cash and
cash equivalents
-1,798,024.13 694,976.78
V. Net increase in cash and cash equivalents 4,153,392,945.50 91,571,684.28
Add: beginning balance of cash and cash equivalents 1,276,646,954.78 1,185,075,270.50
VI. Ending balance of cash and cash equivalents 5,430,039,900.28 1,276,646,954.78
Legal Representative: Xie Yi
Person in Charge of Accounting Work: Zhou Bin
Person in Charge of Accounting Firm: Lei Jiaowen
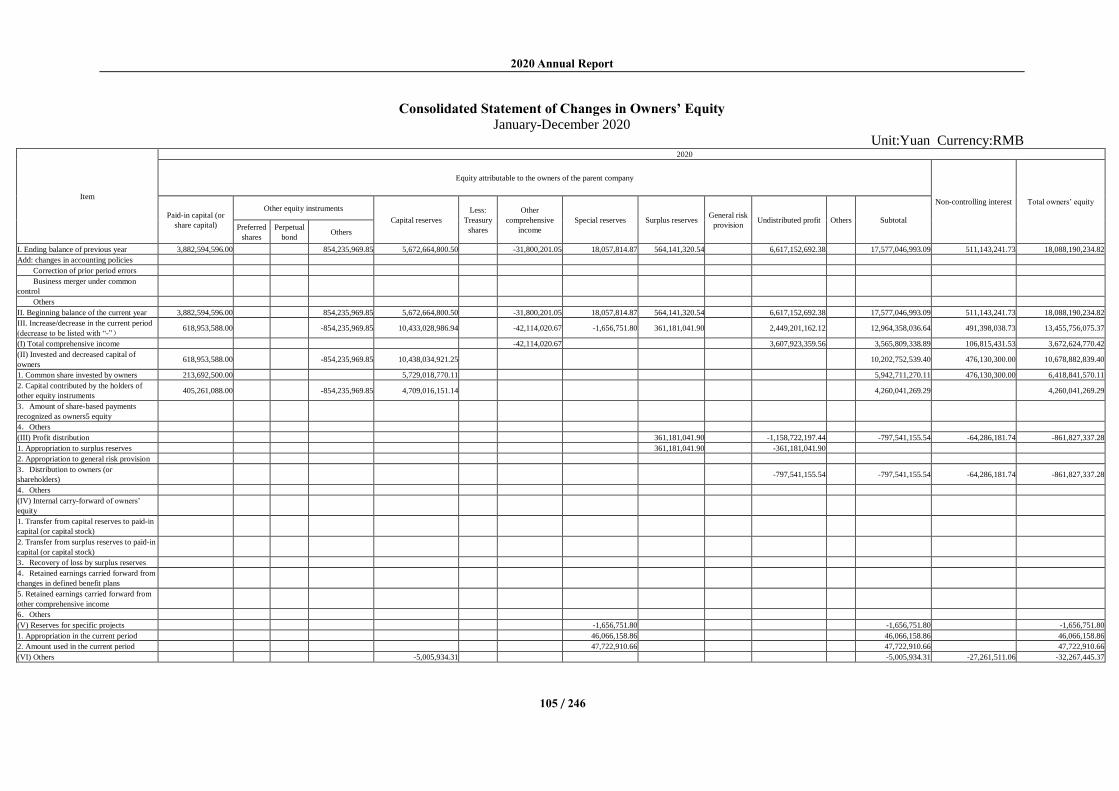
2020 Annual Report
105 / 246
Consolidated Statement of Changes in Owners’ Equity
January-December 2020
Unit:Yuan Currency:RMB
Item
2020
Equity attributable to the owners of the parent company
Non-controlling interest Total owners’ equity
Paid-in capital (or
share capital)
Other equity instruments
Capital reserves
Less:
Treasury
shares
Other
comprehensive
income
Special reserves Surplus reserves General risk
provision Undistributed profit Others Subtotal
Preferred
shares
Perpetual
bond Others
I. Ending balance of previous year 3,882,594,596.00 854,235,969.85 5,672,664,800.50 -31,800,201.05 18,057,814.87 564,141,320.54 6,617,152,692.38 17,577,046,993.09 511,143,241.73 18,088,190,234.82
Add: changes in accounting policies
Correction of prior period errors
Business merger under common
control
Others
II. Beginning balance of the current year 3,882,594,596.00 854,235,969.85 5,672,664,800.50 -31,800,201.05 18,057,814.87 564,141,320.54 6,617,152,692.38 17,577,046,993.09 511,143,241.73 18,088,190,234.82
III. Increase/decrease in the current period
(decrease to be listed with “-”) 618,953,588.00 -854,235,969.85 10,433,028,986.94 -42,114,020.67 -1,656,751.80 361,181,041.90 2,449,201,162.12 12,964,358,036.64 491,398,038.73 13,455,756,075.37
(I) Total comprehensive income -42,114,020.67 3,607,923,359.56 3,565,809,338.89 106,815,431.53 3,672,624,770.42
(II) Invested and decreased capital of
owners 618,953,588.00 -854,235,969.85 10,438,034,921.25 10,202,752,539.40 476,130,300.00 10,678,882,839.40
1. Common share invested by owners 213,692,500.00 5,729,018,770.11 5,942,711,270.11 476,130,300.00 6,418,841,570.11
2. Capital contributed by the holders of
other equity instruments 405,261,088.00 -854,235,969.85 4,709,016,151.14 4,260,041,269.29 4,260,041,269.29
3.Amount of share-based payments
recognized as owners5 equity
4.Others
(III) Profit distribution 361,181,041.90 -1,158,722,197.44 -797,541,155.54 -64,286,181.74 -861,827,337.28
1. Appropriation to surplus reserves 361,181,041.90 -361,181,041.90
2. Appropriation to general risk provision
3.Distribution to owners (or
shareholders) -797,541,155.54 -797,541,155.54 -64,286,181.74 -861,827,337.28
4.Others
(IV) Internal carry-forward of owners’
equity
1. Transfer from capital reserves to paid-in
capital (or capital stock)
2. Transfer from surplus reserves to paid-in
capital (or capital stock)
3.Recovery of loss by surplus reserves
4.Retained earnings carried forward from
changes in defined benefit plans
5. Retained earnings carried forward from
other comprehensive income
6.Others
(V) Reserves for specific projects -1,656,751.80 -1,656,751.80 -1,656,751.80
1. Appropriation in the current period 46,066,158.86 46,066,158.86 46,066,158.86
2. Amount used in the current period 47,722,910.66 47,722,910.66 47,722,910.66
(VI) Others -5,005,934.31 -5,005,934.31 -27,261,511.06 -32,267,445.37

2020 Annual Report
106 / 246
IV. Ending balance in the current period 4,501,548,184.00 16,105,693,787.44 -73,914,221.72 16,401,063.07 925,322,362.44 9,066,353,854.50 30,541,405,029.73 1,002,541,280.46 31,543,946,310.19
Item
2019
Equity attributable to the owners of the parent company
Non-controlling
interest Total owners’ equity
Paid-in capital (or
share capital)
Other equity instruments
Capital reserves
Less:
Treasury
shares
Other
comprehensive
income
Special reserves Surplus reserves
General
risk
provision
Undistributed profit Others Subtotal Preferred
shares
Perpetual
bond Others
I. Ending balance of previous year 3,882,372,220.00 5,712,534,456.10 -41,082,132.15 15,988,834.33 412,849,106.56 4,755,055,633.39 14,737,718,118.23 488,920,372.70 15,226,638,490.93
Add: changes in accounting policies 1,399,511.09 1,399,511.09 1,399,511.09
Correction of prior period errors
Business merger under common control
Others
II. Beginning balance of the current year 3,882,372,220.00 5,712,534,456.10 -39,682,621.06 15,988,834.33 412,849,106.56 4,755,055,633.39 14,739,117,629.32 488,920,372.70 15,228,038,002.02
III. Increase/decrease in the current period (decrease to be
listed with “-”) 222,376.00 854,235,969.85 -39,869,655.60 7,882,420.01 2,068,980.54 151,292,213.98 1,862,097,058.99 2,837,929,363.77 22,222,869.03 2,860,152,232.80
(I) Total comprehensive income 7,882,420.01 2,634,568,828.17 2,642,451,248.18 47,767,162.97 2,690,218,411.15
(II) Invested and decreased capital of owners 222,376.00 854,235,969.85 2,529,589.35 856,987,935.20 9,783,857.00 866,771,792.20
1. Common share invested by owners 9,783,857.00 9,783,857.00
2. Capital contributed by the holders of other equity
instruments 222,376.00 854,235,969.85 2,529,589.35 856,987,935.20 856,987,935.20
3.Amount of share-based payments recognized as
owners5 equity
4.Others
(III) Profit distribution 151,292,213.98 -772,471,769.18 -621,179,555.20 -27,927,672.38 -649,107,227.58
1. Appropriation to surplus reserves 151,292,213.98 -151,292,213.98
2. Appropriation to general risk provision
3.Distribution to owners (or shareholders) -621,179,555.20 -621,179,555.20 -27,927,672.38 -649,107,227.58
4.Others
(IV) Internal carry-forward of owners’ equity
1. Transfer from capital reserves to paid-in capital (or
capital stock)
2. Transfer from surplus reserves to paid-in capital (or
capital stock)
3.Recovery of loss by surplus reserves
4.Retained earnings carried forward from changes in
defined benefit plans
5. Retained earnings carried forward from other
comprehensive income
6.Others
(V) Reserves for specific projects 2,068,980.54 2,068,980.54 2,068,980.54
1. Appropriation in the current period 36,794,382.36 36,794,382.36 36,794,382.36
2. Amount used in the current period 34,725,401.82 34,725,401.82 34,725,401.82
(VI) Others -42,399,244.95 -42,399,244.95 -7,400,478.56 -49,799,723.51
IV. Ending balance in the current period 3,882,594,596.00 854,235,969.85 5,672,664,800.50 -31,800,201.05 18,057,814.87 564,141,320.54 6,617,152,692.38 17,577,046,993.09 511,143,241.73 18,088,190,234.82
Legal Representative: Xie Yi Person in Charge of Accounting Work: Zhou Bin Person in Charge of Accounting Firm: Lei Jiaowen

2020 Annual Report
107 / 246
Statement of Changes in Owner's Equity of the Parent Company
January-December 2020
Unit:Yuan Currency: RMB
Item
2020
Paid-in capital (or share capital)
Other equity instruments
Capital reserves
Less:
Treasury
shares
Other
comprehensive
income
Special reserves
Surplus reserves Undistributed profit Total owners’
equity Preferred
shares
Perpetual
bond Others
I. Ending balance of previous year 3,882,594,596.00 854,235,969.85 6,646,802,814.79 6,697,557.94 564,141,320.54 1,653,922,384.81 13,608,394,643.93
Add: changes in accounting policies
Correction of prior period errors
Others
II. Beginning balance of the current year 3,882,594,596.00 854,235,969.85 6,646,802,814.79 6,697,557.94 564,141,320.54 1,653,922,384.81 13,608,394,643.93
III. Increase/decrease in the current period
(decrease to be listed with “-”) 618,953,588.00 -854,235,969.85 10,438,034,921.25 59,742.91 361,181,041.90 2,453,088,221.57 13,017,081,545.78
(I) Total comprehensive income 59,742.91 3,611,810,419.01 3,611,870,161.92
(II) Invested and decreased capital of owners 618,953,588.00 -854,235,969.85 10,438,034,921.25 10,202,752,539.40
1. Common share invested by owners 213,692,500.00 5,729,018,770.11 5,942,711,270.11
2. Capital contributed by the holders of other equity instruments
405,261,088.00 -854,235,969.85 4,709,016,151.14 4,260,041,269.29
3.Amount of share-based payments recognized
as owners5 equity
4.Others
(III) Profit distribution 361,181,041.90 -1,158,722,197.44 -797,541,155.54
1. Appropriation to surplus reserves 361,181,041.90 -361,181,041.90
2. Distribution to owners (or shareholders) -797,541,155.54 -797,541,155.54
3.Others
(IV) Internal carry-forward of owners’ equity
1. Transfer from capital reserves to paid-in
capital (or capital stock)
2. Transfer from surplus reserves to paid-in capital (or capital stock)
3.Recovery of loss by surplus reserves
4.Retained earnings carried forward from
changes in defined benefit plans
5. Retained earnings carried forward from other
comprehensive income
6.Others
(V) Reserves for specific projects
1. Appropriation in the current period
2. Amount used in the current period
(VI) Others
IV. Ending balance in the current period 4,501,548,184.00 17,084,837,736.04 6,757,300.85 925,322,362.44 4,107,010,606.38 26,625,476,189.71

2020 Annual Report
108 / 246
Item
2019
Paid-in capital (or share capital)
Other equity instruments
Capital reserves Less: Treasury
shares Other comprehensive
income Special reserves
Surplus reserves Undistributed
profit Total owners’
equity Preferred shares
Perpetual bond
Others
I. Ending balance of previous year 3,882,372,220.00 6,644,233,173.78 412,849,106.56 913,472,014.21 11,852,926,514.55
Add: changes in accounting policies 1,399,511.09 1,399,511.09
Correction of prior period errors
Others
II. Beginning balance of the current year 3,882,372,220.00 6,644,233,173.78 1,399,511.09 412,849,106.56 913,472,014.21 11,854,326,025.64
III. Increase/decrease in the current period
(decrease to be listed with “-”) 222,376.00 854,235,969.85 2,569,641.01 5,298,046.85 151,292,213.98 740,450,370.60 1,754,068,618.29
(I) Total comprehensive income 5,298,046.85 1,512,922,139.78 1,518,220,186.63
(II) Invested and decreased capital of
owners 222,376.00 854,235,969.85 2,529,589.35 856,987,935.20
1. Common share invested by owners
2. Capital contributed by the holders of
other equity instruments 222,376.00 854,235,969.85 2,529,589.35 856,987,935.20
3.Amount of share-based payments
recognized as owners5 equity
4.Others
(III) Profit distribution 151,292,213.98 -772,471,769.18 -621,179,555.20
1. Appropriation to surplus reserves 151,292,213.98 -151,292,213.98
2. Distribution to owners (or shareholders) -621,179,555.20 -621,179,555.20
3.Others
(IV) Internal carry-forward of owners’ equity
1. Transfer from capital reserves to paid-in
capital (or capital stock)
2. Transfer from surplus reserves to paid-in capital (or capital stock)
3.Recovery of loss by surplus reserves
4.Retained earnings carried forward from
changes in defined benefit plans
5. Retained earnings carried forward from
other comprehensive income
6.Others
(V) Reserves for specific projects
1. Appropriation in the current period
2. Amount used in the current period
(VI) Others 40,051.66 40,051.66
IV. Ending balance in the current period 3,882,594,596.00 854,235,969.85 6,646,802,814.79 6,697,557.94 564,141,320.54 1,653,922,384.81 13,608,394,643.93
Legal Representative: Xie Yi Person in Charge of Accounting Work: Zhou Bin Person in Charge of Accounting Firm: Lei Jiaowen

2020 Annual Report
109 / 246
III. Company Information
1. Company profile
√Applicable □Inapplicable
(1) History of the Company
Tongwei Co., Ltd. (hereinafter referred to as "the Company") is a limited liability company founded
from the overall change of the Sichuan Tongwei Feed Co., Ltd. and incorporated under sponsorship. On
October 21, 2000, with the approval of Official Reply of Sichuan Provincial People’s Government on Establishing Sichuan Tongwei Co., Ltd. of CFH [2000] No. 311 of the People's Government of Sichuan
Province official, Sichuan Tongwei Feed Co., Ltd. changed as a whole and set up Tongwei Co., Ltd. in
the form of incorporation by means of sponsorship. The total share capital of the Company is converted
into shares at a ratio of 1: 1 with a net asset of RMB 111.88 million of Sichuan Tongwei Feed Co., Ltd.
audited by Sichuan Huaxin (Group) CPA Firm as of August 31, 2000, totaling 111.88 million shares. On
November 8, 2000, the Sichuan Administration for Industry and Commerce issued the business license of
Tongwei Co., Ltd. (registration number: [5100001812986]). On November 19, 2001, the State
Administration for Industry and Commerce approved the change of the Company name to "Tongwei Co.,
Ltd." according to (Guo) MCBHNZ [2001] No.419 of the Enterprise Name Change Approval Notice.
On February 16, 2004, the Company publicly issued 60 million RMB common shares (A-shares) as
approved by the document ZJFXZ [2004] No.10 of CSRC. The method of pricing and placing to secondary
market investors was used for all issues, with the issuance price of RMB 7.50 per share. The post-change
registered capital was RMB 171,880,000.
On February 20, 2006, the Company's equity division reform plan was reviewed and approved by the
shareholders meeting on the equity division reform plan of Tongwei Co., Ltd. According to the plan, the
tradable shareholders of the Company received 1.5 shares of consideration paid by non-tradable
shareholders for every 10 shares of Tongwei, and the tradable shareholders received a total of 9 million
shares of consideration. The Company completed the share change registration for the equity division
reform on March 3, 2006.
On May 25, 2006, the Company converted and increased its share capital with capital reserves,
converting and increasing 5 shares for every 10 shares, awarding 5 shares for every 10 shares with profit,
and the total share capital after conversion and bonus was 343.76 million shares; on May 23, 2007, the
Company converted and increased its share capital with capital reserves, converting and increasing 7
shares for every 10 shares, awarding 3 shares for every 10 shares with profit, and the share capital after
conversion and bonus was 687.52 million shares.
On July 4, 2013, the Company issued 129,589,632 shares to Tongwei Group Co., Ltd. The share
capital after the issuance was 817,109,600 shares.
With the approval of the Reply on Approving Tongwei Co., Ltd. to Purchase Assets and Raise
Supporting Funds by Issuing Shares to Tongwei Group Co., Ltd. (ZJXK [2016] No. 190) from the CSRC
on January 27, 2016, the Company issued 238,324,880 RMB common shares to 17 legal persons such as
Tongwei Group Co., Ltd., Sichuan Giastar Group Co., Ltd. and 29 natural persons such as Tang Guangyue,
the face value of each share was RMB 1.00, and the share capital after issuance was 1,055,434,512 shares.
On May 19, 2016, the Company converted and increased its share capital with capital reserves,
converting and increasing 4 shares for every 10 shares, awarding 6 shares for every 10 shares with profit,
and the total share capital after conversion and bonus was 2,110,869,024 shares.
On June 22, 2016, the Company issued 350,262,697 shares to eight institutions such as Tianhong
Asset Management Co., Ltd. The share capital after the issuance was 2,461,131,721 shares.
With the approval of the Reply on Approving Tongwei Co., Ltd. to Purchase Assets and Raise
Supporting Funds by Issuing Shares to Tongwei Group Co., Ltd. (ZJXK [2016] No. 2054) from the CSRC
on September 8, 2016, the Company issued 922,901,629 RMB common shares to Tongwei Group Co.,
Ltd., the face value of each share was RMB 1.00, and the share capital after issuance was 3,384,033,350
shares.
On December 23, 2016, the Company issued 498,338,870 shares to 5 institutions such as Essence
Fund Management Co., Ltd. The share capital after the issuance was 3,882,372,220 shares.
Approved by the document (ZJXK [2018] No. 1730) from the CSRC, the Company issued 50 million
pieces convertible corporate bonds of 5 billion yuan on March 18, 2019, with a term of 6 years; after
approved by the document (ZLJGJDS [2019] No.052) from the Shanghai Stock Exchange, the convertible corporate bonds are listed for transaction on the Shanghai Stock Exchange from April 10, 2019; the bonds
are named as Tongwei Convertible Bonds for short, the bond code is 110054; the corporate stock was not

2020 Annual Report
110 / 246
lower than 130% (namely 15.96yuan/share ) of the current conversion price of Tongwei Convertible
Bonds for at least 15 trading days in 30 consecutive trading days from January 14, 2020 to March 3, 2020;
the redemption clause of "Tongwei Convertible Bonds" has been triggered. Through the sixth meeting of
the seventh board of directors, the Company is approved to exercise the early redemption right to redeem
all "Tongwei Convertible Bonds" registered on the "Redemption Registration Date"; the deadline of the
redemption registration date is March 16, 2020; the face value of RMB 4,979,353,000 "Tongwei
Convertible Bonds" was converted into company shares, the conversion number was 405,483,464 shares,
and the conversion shares was 4,287,855,684.
On November 20, 2020, the Company issued additional 213,692,500 shares to 16 institutions
including Qamdo Tongrui Industrial Partnership (Limited Partnership). After the additional issuance, the
share capital was 4,501,548,184 shares.
(2) Registered address, organizational form and headquarters address of the Company
The registered address of the Company is No. 588 Middle Section Tianfu Avenue, High-Tech Zone,
Chengdu, and its organizational form is Limited Liability Company. Its headquarters is located at No. 588,
Tianfu Avenue Middle Section, High-Tech Zone, Chengdu.
(3) Nature of businesses and main operating activities of the Company
1) Business nature
The Company involved Agriculture, Forestry, livestock husbandry and Fishery. In 2016, after the
Company completed the merger of Sichuan Yongxiang Co., Ltd., Tongwei New Energy Co., Ltd. and
Tongwei Solar (Hefei) Co., Ltd. under the same control, it added "PV new energy business".
2) Main business activities
Main business activities: Production and sale of Tongwei brand fish feed, pig feed, poultry feed and
fresh water and seawater aquaculture feed; aquaculture and seedling cultivation; production, wholesale
and retail of veterinary drugs and feed additives; slaughtering and processing fish, pig and duck food and
selling live fish; production and sales of polysilicon and monocrystalline silicon, polyvinyl chloride and
its series products, sodium hydroxide and ancillary products, carbide slag cement; research and
development of new chemical products; production and sales of monocrystalline and multicrystalline
silicon wafers, solar cell wafers, solar cell modules, solar heat pipes, solar water heaters, water heating
systems and solar photothermal applications; energy technology research and development; research and
development of solar power generation technology and technical consultation; design and construction of
power engineering and power system installation engineering; sales of PV equipment and providing
technical advice; solar power generation; electricity supply; electrical installation; engineering design;
science and technology promotion and application service industry; comprehensive utilization of waste
resources; environmental governance industry; wholesale and retail of commodities; rental and
commercial services; import and export industry; internet information service, etc.
(4) Names of the largest shareholder and the ultimate substantive controller
At present, the largest shareholder of the Company is Tongwei Group Co., Ltd. (hereinafter referred
to as "Tongwei Group"), and the ultimate actual controller is Liu Hanyuan.
(5) Approver of financial statements
The Company's financial statements are approved by the Company's board of directors. This financial
statement was approved by the 18th meeting of the Company's 7th board of directors on April 9, 2021.
2. Scope of consolidated financial statements
√Applicable □Inapplicable
(1) The 80 first-level subsidiaries included in the consolidation scope in the current period are listed
as follows:
S/N Name of subsidiaries Abbreviation Subsidiaries
(Nr.)
Shareholding
proportion
(%)
Proportion
of voting
right (%)
1 Sichuan Yongxiang Co., Ltd. Yongxiang 5 100 100
2 Tongwei Solar (Hefei) Co., Ltd. Tongwei Solar
(Hefei)
10 100 100
3 Tongwei New Energy Co., Ltd. Tongwei New
Energy
94 100 100
4 Chongqing Tongwei Feed Co., Ltd. Chongqing Feed 100 100
5 Xiamen Tongwei Feed Co., Ltd. Xiamen Feed 100 100
6 Yuanjiang Tongwei Feed Co., Ltd. Yuanjiang Feed 100 100
7 Wuhan Tongwei Feed Co., Ltd. Wuhan Feed 100 100

2020 Annual Report
111 / 246
8 Shashi Tongwei Feed Co., Ltd. Shashi feed 100 100
9 Guangdong Tongwei Feed Co., Ltd. Guangdong Feed 100 100
10 Shandong Tongwei Feed Co., Ltd. Shandong Feed 92 92
11 ZaozhuangTongwei Feed Co., Ltd. Zaozhuang feed 100 100
12 Suzhou Tongwei Special Feed Co., Ltd. Suzhou Feed 100 100
13 He'nan Tongwei Feed Co., Ltd. Changchun
Tongwei Feed
Co., Ltd.
100 100
14 Changchun Tongwei Feed Co., Ltd. Changchun Feed 100 100
15 Chengdu Tongwei Aquatic Products
Technology Co., Ltd.
Chengdu
Technology
100 100
16 Chengdu Tongwei Sanxin Pharmaceutical
Co. Ltd.
Sanxin
Pharmaceutical
70 70
17 Tongwei (Hainan) Aquatic Products Co., Ltd. Hainan Products 100 100
18 Hainan Haiyi Aquatic Products Feed Co.,
Ltd.
Hainan Haiyi 100 100
19 Zhuhai Haiyi Aquatic Products Feed Co.,
Ltd.
Zhuhai Haiyi 100 100
20 Hainan Haiyi Aquatic Seed Co., Ltd. Hainan Seed 1 49.95 49.95
21 Nantong Bada Feed Co., Ltd. Nantong Bada 2 100 100
22 Hainan Haiyi Biotechnology Co., Ltd. Hainan
Biotechnology
51 51
23 Nanning Tongwei Feed Co., Ltd. Nanning Feed 100 100
24 Tianjin Tongwei Feed Co., Ltd. Tianjin Feed 100 100
25 Huai’an Tongwei Feed Co., Ltd. Huai’an Feed 100 100
26 Jieyang Tongwei Feed Co., Ltd. Jieyang Feed 100 100
27 Chengdu Ronglai Tongwei Feed Co., Ltd. Ronglai Feed 80 80
28 Yangzhou Tongwei Feed Co., Ltd. Yangzhou Feed 100 100
29 Langfang Tongwei Feed Co., Ltd. Langfang Feed 100 100
30 Chengdu Tongwei Animal Nutrition
Technology Co., Ltd.
Animal Nutrition 100 100
31 Panzhihua Tongwei Feed Co., Ltd. Panzhihua
Tongwei
100 100
32 Foshan Nanhai Tongwei Aquatic Products
Technology Co., Ltd.
Foshan
Technology
100 100
33 Tongwei Agricultural Financing Guarantee
Co., Ltd.
Tongwei
Guarantee
100 100
34 Tongwei (Chengdu) Agriculture Investment
Holding Co., Ltd.
Agriculture
Holding
100 100
35 Sichuan Tongguang Construction
Engineering Co., Ltd.
Tongguang
Construction
100 100
36 Chongqing Changshou Tongwei Feed Co.,
Ltd.
Changshou Feed 100 100
37 Qianxi Tongwei Feed Co., Ltd. Qianxi Feed 100 100
38 Lianyungang Tongwei Feed Co., Ltd. Lianyungang
Feed
100 100
39 Chengdu Tongwei Automation Equipment
Co., Ltd.
Chengdu
Automation
80 80
40 Foshan Tongwei Feed Co., Ltd. Foshan Feed 100 100
41 Zibo Tongwei Feed Co., Ltd. Zibo Feed 76 76
42 Tongwei (Dafeng) Feed Co., Ltd. Dafeng Feed 51 51
43 Kunming Tongwei Feed Co., Ltd. Kunming Feed 100 100
44 Zibo Tongwei Food Co., Ltd. Zibo Food 100 100
45 Foshan Gaoming Tongwei Feed Co., Ltd. Gaoming Feed 100 100
46 Tianmen Tongwei Biotechnology Co., Ltd. Tianmen
Biotechnology
100 100
47 Binyang Tongwei Feed Co., Ltd. Binyang Feed 100 100
48 Fuzhou Tongwei Willianm Feed Co., Ltd. Fuzhou Feed 65 65
49 Ningxia Yinchuan Tongwei Feed Co., Ltd. Yinchuan Feed 100 100
50 Harbin Tongwei Feed Co., Ltd. Harbin Feed 100 100
51 Nanjing Tongwei Aquatic Products
Technology Co., Ltd.
Nanjing
Technology
100 100
52 Tongwei Holdings PTE. Ltd. in Singapore Singapore
Holdings
8 100 100

2020 Annual Report
112 / 246
53 Tongwei Industrial (Tibet) Co., Ltd. Tibet Industrial 1 100 100
54 Chizhou Tongwei Feed Co., Ltd. Chizhou Feed 100 100
55 Chengdu Tongwei Aquatic Seed Co., Ltd. Chengdu Seed 100 100
56 Hengshui Tongwei Feed Co., Ltd. Hengshui Feed 100 100
57 Qingyuan Tongwei Feed Co., Ltd. Qingyuan Feed 100 100
58 Honghu Tongwei Feed Co., Ltd. Honghu Feed 100 100
59 Sichuan Tongwei Food Co., Ltd. Sichuan Food 10 80 80
60 Hanshou Tongwei Feed Co., Ltd. Hanshou
Tongwei
100 100
61 Tianmen Tongwei Aquatic Products
Technology Co., Ltd.
Tianmen
Technology
100 100
62 Sichuan Fishery-PV Wulian Technology Co.,
Ltd.
Fishery-PV
Wulian
60 60
63 Sichuan Willtest Technology Co., Ltd. Sichuan Willtest 1 83.04 83.04
64 Wuxi Tongwei Biotechnology Co., Ltd. Wuxi
Biotechnology
100 100
65 Tongwei New Energy Engineering Design
(Sichuan) Co., Ltd.
New Energy
Design
100 100
66 Zhejiang Tongwei Solar Technology Co.,
Ltd.
Zhejiang Solar 100 100
67 Sichuan Tongwei Feed Co., Ltd. Sichuan Tongwei 100 100
68 Sichuan Yongxiang New Material Co., Ltd. Yongxiang New
Material
1 100 100
69 Qingdao Hairen Aquatic Seed Industry
Technology Co., Ltd.
Qingdao Hairen 51 51
70 Nanning Tongwei Biotechnology Co., Ltd. Nanning
Biotechnology
100 100
71 Nanchang Tongwei Biotechnology Co., Ltd. Yangjiang Haiyi
Biotechnology
Co., Ltd.
80 80
72 Yangjiang Haiyi Biotechnology Co., Ltd. Yangjiang Haiyi 100 100
73 Gongan County Tongwei Aquatic Products
Technology Co., Ltd.
Gongan
Technology
100 100
74 Zhanjiang Haixianfeng Bio-tech Co., Ltd. Zhanjiang
Haixianfeng
51 51
75 Chengdu Xintaifeng Livestock and Poultry
Farming Co., Ltd.
Xintaifeng
Farming
100 100
76 Sichuan Chunyuan Ecological Farming Co.,
Ltd.
Chunyuan
Farming
100 100
77 Chengdu Tongwei Fishery-PV Technology
Co., Ltd.
Chengdu
Fishery-PV
Technology
100 100
78 Maoming Tongwei Biotechnology Co., Ltd. Maoming
Biotechnology
100 100
79 Maoming Tongwei Biotechnology Co., Ltd. Hainan
Biotechnology
100 100
80 Guangdong Tongwei Biotechnology Co.,
Ltd.
Guangdong
Biotechnology
100 100
Total 133
(2) Newly added first-level subsidiaries included in the consolidation in the current period Name of subsidiaries Reason for change
Chengdu Tongwei Fishery-PV Technology Co., Ltd. Newly established due to investment
Maoming Tongwei Biotechnology Co., Ltd. Newly established due to investment
Maoming Tongwei Biotechnology Co., Ltd. Newly established due to investment
Guangdong Tongwei Biotechnology Co., Ltd. Newly established due to investment
(3) First-level subsidiaries that have been cancelled in the current period Name of subsidiaries Reason for change
Chengdu Xintaifeng Livestock and Poultry Farming Co.,
Ltd.
Cancelled
Tongwei (Chengdu) Agriculture Investment Holding Co.,
Ltd.
Cancelled
Suzhou Tongwei Special Feed Co., Ltd. Cancelled
Hainan Haiyi Biotechnology Co., Ltd. Cancelled
Gongan County Tongwei Aquatic Products Technology Cancelled

2020 Annual Report
113 / 246
Co., Ltd.
(4) First-level subsidiaries that have not been absorbed, merged or disposed of in the current period
Please refer to "Change of Consolidation Scope" and "Rights and Interests in Other Entities" for details.
IV. Preparation Basis of Financial Statements
1. Preparation basis
The Company's financial statements were prepared based on the assumption of going concern and
actual transactions and events, in accordance with the Accounting Standards for Business Enterprises
issued by the Ministry of Finance and its supporting guidelines as well as explanations (hereinafter
collectively referred to as "ASBE") and the disclosure provisions in the Rules for the Compilation
Submission of Information Disclosure by Companies That Offer Securities to the Public (No. 15)—
General Rules on the Financial Statements revised by CSRC in 2014.
2. Going concern
√Applicable □Inapplicable
The Company's business activities have sufficient financial support. Based on the information
currently obtained from the Company and considering the macro-policy risks, market operation risks,
current or long-term profitability, solvency and financial resources support of the enterprise and other
factors, the Company believes that there are no matters or situations that have serious doubts about the
Company's going concern ability in the next 12 months, and it is reasonable to prepare financial statements
on the basis of going concern.
V. Significant Accounting Policies and Accounting Estimates
Notes to the specific accounting policies and accounting estimates:
□Applicable √Inapplicable
1. Declaration on compliance with ASBE
The financial statements and notes prepared by the Company meet the requirements of ASBE, truly
and fully reflect its financial status on December 31, 2020 and relevant information such as business
performance and cash flow in 2020. Additionally, all major aspects of the Company’s financial statements
comply with the requirements for the disclosure of the financial statements and the notes in the Rules for the Compilation and Submission of Information Disclosure by Companies That Offer Securities to the
Public (No. 15) — General Rules on the Financial Statements revised by CSRC in 2014.
2. Accounting period
The accounting year of the Company runs from January 1 to December 31.
3. Business cycle
√Applicable □Inapplicable
The normal business cycle refers to the period from the time when the Company buys assets for
processing to the time when such assets become cash or cash equivalents. For the Company, 12
months/year constitute a business cycle and this business cycle is used as a criterion for determining the
liquidity of assets and liabilities.
4. Recording currency
The Company takes RMB as its recording currency.
5. Accounting for business merger under common control and different control
√Applicable □Inapplicable
Business merger refers to a transaction or event that two or more individual enterprises form into a
reporting entity through merging. The merger is divided into business merger under common control and
business merger under different controls.
(1) Business merger under common control

2020 Annual Report
114 / 246
A business merger under common control is a business merger in which all of the merging companies
are ultimately controlled by the same party or parties both before and after the business merger, and that
control is not transitory. In a business merger under common control, the party which obtains control of
other merging companies on the merger date is the merging party, the other merging companies are the
merged parties. Merger date refers to the date on which the merging party actually obtains control rights
on the merged party.
The initial investment cost of long-term equity investments is taken to be the share acquired of the
owners' equity of the merged party, at its book value in the consolidated financial statements of the ultimate
controlling party. The balance between the net book value of assets acquired by the merging party and
book value of the paid merging consideration (or total face value of issued shares) shall be used to adjust
the capital reserves (share premium); where capital reserves (share premium) cannot be charged off,
retained earnings shall be adjusted.
Direct expenses incurred to the merging party during the business merger shall be included in the
current profit or loss when incurred.
(2) Business merger under different control
A business merger not under common control is a business merger in which the merging companies
are not ultimately controlled by the same party or the same parties both before and after the business
merger. In a business merger under different control, the party that acquires the right of controlling other
companies involved in the merger on acquisition date is the acquirer, and other enterprises involved in the
merger are the acquirees. Acquisition date refers to the date on which the acquirer actually obtains control
rights on the acquiree.
In a business merger under different control, the merger cost consists of assets paid, liabilities
incurred or borne and the fair value of issued equity securities paid by the acquirer on the acquisition date
to obtain control rights on the acquiree. Intermediation costs such as audit, legal service, assessment and
consultation fees and other general and administrative expenses shall be included in the current profit or
loss when incurred. The transaction expenses of equity securities or debt securities issued by the acquirer
as merging consideration will be included in the initially recognized amount of equity securities or debt
securities. Involved contingent consideration must be included in merger cost at the fair value at the
acquisition date; where the contingent consideration is to be adjusted due to new or further evidence for
existing conditions at acquisition date within 12 months after acquisition date, consolidated goodwill must
be correspondingly adjusted. The merger cost incurred to the acquirer and net identifiable assets obtained
during business merger must be measured as per the fair value at the acquisition date. Where the merger
cost is greater than the fair value of net identifiable assets obtained on the acquisition date from the
acquiree, the balance between them must be recognized as goodwill. Where the merger cost is less than
the fair value of net identifiable assets obtained from the acquiree during business merger, the fair value
and merger cost of various identifiable assets, liabilities and contingent liabilities from the acquiree must
be rechecked. Where the merger cost is, after recheck, still less than the fair value of net identifiable assets
obtained from the acquiree during business merger, the balance must be included in the current profit or
loss.
Where the temporary deductible difference obtained by the acquirer from the acquiree is not
recognized due to its non-compliance with deferred income tax assets recognition criteria at the acquisition
date, new or further information obtained within 12 months since the acquisition date reveals that relevant
conditions were present at the acquisition date, and the economic benefit brought by temporary deductible
difference at the acquisition date can be realized for expected acquiree, relevant deferred income tax assets
must be recognized, business reputation be decreased (where the business reputation is not sufficient to
offset, the balance must be recognized as current profit and loss); except aforementioned conditions,
deferred income tax assets which are confirmed to be linked with business merger must be included in
current profit and loss.
As to business merger under different control that was accomplished step by step through multiple
transactions, judge whether the multiple transactions belong to “package deal” in accordance with
judgment standard of “package deal” stipulated in Notice of the Ministry of Finance on Issuing Interpretation No. 5 of the Accounting Standards for Business Enterprises issued by Ministry of Finance
(CK [2012] No. 19) and Article 51 of Accounting Standards for Business Enterprises No. 33 -
Consolidated Financial Statements (refer to "preparation method of consolidated financial statements").
For transactions that belong to “package deal”, refer to “Long-term equity investment” to make accounting
treatment; for transactions that do not belong to “package deal”, distinguish individual financial statement
and consolidated financial statement to make relevant accounting treatment.

2020 Annual Report
115 / 246
In individual financial statements, the sum of book value of the equity investment from the acquiree
held before the acquisition date and the newly added investment cost on the acquisition date shall be taken
as initial investment costs of the investment; for acquiree’s equity held before the acquisition date that
involve other comprehensive incomes, the investment and its related other comprehensive incomes shall
be subject to accounting treatment using the same basis on which the acquiree directly disposes related
assets or liabilities (namely, except for the corresponding shares for the changes arising from the acquiree’s
re-measurement of net liabilities or net assets of defined benefit plan calculated by equity method, the rest
will be transferred to investment income of current period at the acquisition date.).
In the consolidated financial statements, acquiree’s equity held prior to the acquisition date must be
re-measured as per its fair value at the acquisition date, and the balance between fair value and book value
must be included in the investment income of current period; for acquiree’s equity held prior to the
acquisition date involving other comprehensive incomes, the incomes shall be subject to accounting
treatment using the same basis on which the acquiree directly disposes relevant assets or liabilities (namely,
except for the corresponding shares for the changes arising from the acquiree’s re-measurement of net
liabilities or net assets of defined benefit plan calculated by equity method, the rest will be transferred to
investment income of current period at the acquisition date.).
6. Preparation method of consolidated financial statements
√Applicable □Inapplicable
(1) Principles for determining consolidation scope
The consolidation scope of consolidated financial statements is determined on the basis of control.
Control means the power of the Company over the investee, and the investor can enjoy variable returns
through participating in related activities of the investee and is able to influence its amount of return with
the power over the investee. The consolidation scope consists of the Company and all its subsidiaries.
"Subsidiaries" refer to the entities under control of the Company.
(2) Preparation method of consolidated financial statements
The Company shall incorporate the subsidiaries into the scope of consolidation since its acquisition
of the actual control over the subsidiaries' net assets and rights of management and decision-making and
exclude it from the scope of consolidation when losing such control over the subsidiaries. For subsidiaries
went through settlement, their financial performance and cash flows before the disposal date have been
properly included in the consolidated income statement and consolidated cash flow statement; while for
subsidiaries going through settlement, the opening balance in the consolidated balance sheet is not adjusted.
For subsidiaries acquired through business merger under different control, their financial performance and
cash flows after the acquisition date have been properly included in the consolidated income statement
and consolidated cash flow statement; in addition, the beginning balance and comparative amount in the
consolidated financial statements are not adjusted. For subsidiaries acquired through business merger
under common control and merged parties, their financial performance and cash flow from the opening of
the current period of business merger to the merging date have been properly included in the consolidated
income statement and consolidated cash flow statement; meanwhile, comparative amount in the
consolidated financial statements are adjusted.
During compilation of consolidated financial statements, in the event that accounting policy or
accounting period adopted by the subsidiaries are not in line with those of the Company, the financial
statements of the subsidiaries shall be adjusted according to the accounting policy and accounting period
of the Company. For subsidiaries acquired through business merger under different control, their financial
statements shall be adjusted based on the fair value of net identifiable assets on the acquisition date.
Balance of major dealings and transactions and unrealized profit of the Company shall be offset
during preparation of the consolidated financial statements.
The portion of stockholders equity and that of current net profit or loss of subsidiaries which are not
owned by the Company must be respectively recognized as minority equity and minority interest income
and separately listed under the shareholders’ equity and net income in the consolidated financial statements.
The portion current net profit or loss of the subsidiaries which belongs to minority equity shall be presented
as “Minority profit and loss” in the Net Profit column in the Consolidated Income Statement. If the loss
of the subsidiaries borne by minority shareholders exceeds the amount of shareholders' equity share in the
subsidiaries at the beginning of the current period, the excess shall write down the minority equity.
In the event the Group loses the right of control over its subsidiaries due to disposal of partial equity
investment or other reasons, the residual equity must be recalculated according to its fair value on the day

2020 Annual Report
116 / 246
when the Group loses the right of control. The difference by using the sum of value received from disposal
of equity and fair value of the residual equity to deduct share in net assets continually counted from the
acquisition date of the original subsidiaries (calculated as per original shareholding proportion) shall be
recorded in the investment income of the current period without the right of control. Other comprehensive
incomes in connection with equity investment of the original subsidiaries shall be subject to accounting
treatment using the same basis on which the acquiree directly disposes relevant assets or liabilities when
the right of control is lost (namely, except for the changes arising from the original subsidiaries’-
measurement of net liabilities or net assets of defined benefit plan, the rest will be transferred to investment
income of current period). Subsequently, the residual equity shall be measured as per the Accounting
Standards for Business Enterprises No. 2 - Long-term Equity Investments or Accounting Standards for Business Enterprises No.22 - Financial Instrument Recognition and Measurement or other relevant
regulations. See “Long-term equity investments” or “Financial instrument” for details.
For the various transactions for step-by-step equity disposal by the Company that lead to the loss of
controlling power over the subsidiaries, it is necessary to distinguish whether the transactions belong to
the package deal. When the terms, conditions and economic impacts of the transactions for subsidiaries
equity investment disposal conform to one or more following situations, then it indicates that the
transactions shall be subject to accounting treatment as part of the package deal:① the transactions are
established simultaneously or at the consideration of mutual impact;② the transactions can constitute a
complete commercial result only when operating as a whole;③ the occurrence of one transaction rests
with that of another one or more;④ individually, a single transaction is not economical while, when
combined with other transactions, it is economical. For those that do not belong to the package deal, the
transactions shall be subject to accounting treatment as per “disposes of the long-term equity investment
to its subsidiaries partially without losing the right of control” (refer to the “Disposal of long-term equity
investment” for details) and “Company losses the right of control over its subsidiaries due to disposal of
partial equity investment or other reasons” (refer to the preceding paragraph for details). For the various
transactions belong to the package deal for equity disposal by the Group that lead to the loss of controlling
power over the subsidiaries, the transactions are subject to the accounting treatment oriented for
subsidiaries disposal and loss of controlling power; but, the difference between each disposal amount and
the corresponding subsidiaries net asset shares entitled to the disposal investment is recognized as other
comprehensive income in the consolidated financial statements, which is not transferred into the current
profit or loss until the controlling power is lost.
7. Classification of joint operation arrangement and accounting treatment methods for joint
operations
√Applicable □Inapplicable
Joint venture arrangement refers to an arrangement jointly controlled by two or more participants.
The Company, based on the rights and obligations under the joint arrangement, divides the joint
arrangement into joint operation and joint venture. Joint operation refers to an arrangement that the
Company enjoys assets related to the arrangement and bears liabilities related to the arrangement. Joint
venture refers to an arrangement that the Company only has the power governing net assets of the
arrangement.
The Company's investment in joint venture is calculated with equity method and handled by
accounting policies described in long-term equity investment of "Long-term equity investment calculated
by equity method".
The Company, as a part of a joint operation, fully recognizes assets and liabilities held/owed alone
and assets and liabilities jointly held/owed based on its share. It fully recognizes income from selling its
share of joint operations output, and the income from sales of jointly-produced output based on its share;
it fully recognizes expenses solely incurred itself, and expenses jointly incurred based on its share.
Where the Company, as a joint party, invests or sells assets (excluding the asset constituting business,
similarly hereinafter) to a joint operation, or purchase asset from a joint operation, before the said assets
are sold to a third party by joint operation, the Company shall only recognize the part of profit or loss
attributable to itself and other participants in the joint operation. When any impairment specified in
Accounting Standards for Business Enterprises No. 8 - Asset Impairment, occurs to said assets in the
course of investing or selling assets to a joint operation, the Company shall recognize the full amount of
the loss; in case of purchasing asset from a joint operation, the Company shall recognize based on its share
of the assets purchased.

2020 Annual Report
117 / 246
8. Standards for recognition of cash and cash equivalents
The Company’s cash equivalents determined during the preparation of the cash flow statement are
recognized as investment that is short-term (generally due within three months since the acquisition
date), highly liquid and readily convertible to a known amount of cash, and has an insignificant risk of
changes in value.
Restricted bank deposits are not regarded as cash and cash equivalents in the cash flow statement.
9. Foreign currency conversion and foreign currency statement translation
√Applicable □Inapplicable
(1) Foreign currency business accounting method:
When foreign currency business occurs, it shall be converted into standard money for bookkeeping
according to the benchmark exchange rate published by the People's Bank of China on the actual date of
occurrence (generally referred to as the middle rate of the foreign exchange quote price of that day
announced by the People’s Bank of China, the same below); At the end of the period, the foreign currency
monetary items should be converted at the ending spot rate; foreign currency non-monetary items
measured at historical cost should still be converted at the spot rate; the foreign currency non-monetary
items measured at fair value should be converted at the spot rate on the date of determination of the fair
value. For the occurred balance from conversion that is related to acquisition and construction of fixed
assets and has reached the expected serviceable condition should be included in acquisition and
construction cost of fixed assets, and that is unrelated to acquisition and construction of fixed assets and
in the start-up period should be included in the administration expense, and that is unrelated to acquisition
and construction of fixed assets and in the production and operation period should be included in current
financial expenses.
(2) Conversion method for foreign currency financial statements:
The asset items and liability items in the balance sheet adopt the exchange rate of the balance sheet
date for conversion; the owner’s equity items adopt the exchange rate of date when the transactions
occurred, except for the items of “undistributed profit”. Income and expense items in the income statement
are converted using the approximate exchange rate of the current spot exchange rate. The differences
arising from the translation of financial statements dominated in foreign currencies by the above-
mentioned method are separately listed in the “other comprehensive incomes” under the ownership rights
and interests items in the balance sheet.
Foreign currency cash flow and cash flow of overseas subsidiaries shall be converted at the
approximate exchange rate of spot rate on the cash flow date.
10. Financial instruments
√Applicable □Inapplicable
Financial instruments refer to contracts that form the financial assets of a party, and form financial
liabilities or equity instruments of other parties. When the Company becomes a party to a financial
instrument, it recognizes a financial asset or liability.
(1) Classification of financial assets
Financial assets transacted in a conventional way are subject to accounting recognition and
derecognition on the transaction day. Financial assets are divided into the following categories upon initial
recognition: financial assets measured at amortized cost; financial assets measured at fair value with
changes included in other comprehensive income; financial assets measured at fair value with changes
included in current profit and loss.
Where the financial assets of the Company meet all the following conditions, they will be classified
as financial assets measured at amortized cost:① The business mode of the Company for managing such
financial assets is to collect contract cash flows.② The contract of such financial assets specifies that the
cash flows generated at a particular date are only for the payment of principal and interest based on the
amount of outstanding principal.
Where the financial assets of the Company meet all the following conditions, they will be classified
as financial assets measured at the fair value through other comprehensive income. ① The business mode
of the Company for managing such financial assets is to collect contract cash flows and to sell the financial

2020 Annual Report
118 / 246
assets.② The contract of such financial assets specifies that the cash flows generated at a particular date
are only for the payment of principal and interest based on the amount of outstanding principal.
The Company will classify the financial assets other than the financial assets measured at the
amortized cost and the financial assets at fair value through other than comprehensive income into the
financial assets at fair value through current profit and loss. At the time of initial recognition, if eliminating
or significantly reducing accounting mismatch, financial assets can be designated as financial assets
measured at fair value and whose changes are included in the profit and loss of the current period. Such
designation, once made, shall not be revoked.
(2) Measurement of financial assets
The financial assets and financial liabilities initially recognized by the Company are measured at the
fair value. For financial assets at fair value through profit or loss, related transaction expenses shall be
directly included in the current profit or loss; the related transaction expenses of other financial assets shall
be included in the initially recognized amount. For accounts receivable or bills receivable arising from the
sale of products or the provision of services that do not include or take into account significant financing
components, the Company takes the consideration amount entitled to receive in expectation as the initially
recognized amount. Subsequent measurement of financial instruments depends on their classification.
1) Financial assets measured at amortized cost
The Company adopts the effective interest rate method for financial assets measured at amortized
cost and carries out subsequent measurement at amortized cost. Gains or losses arising on financial assets
measured at amortized cost that are not any hedging relationship are included in current profit and loss
when derecognized, reclassified, amortized using the effective interest method or recognized for
impairment.
2) Debt instruments investment measured at fair value with its changes included in other
comprehensive incomes
For such financial assets, follow-up measurement shall be based on fair value in the Company.
Interest, impairment losses or gains and exchange gains and losses of such financial assets calculated by
the effective interest rate method are included in the profit and loss of the current period, and other gains
or losses arising therefrom are included in other comprehensive income. At the derecognition, the
accumulated gains or losses previously included in other comprehensive incomes are transferred from
there to the current profit or loss.
3) Non-tradable equity instrument investments measured at fair value and whose changes are
included in other comprehensive income
The Company carries out follow-up measurement of such financial assets at fair value. Except for
dividends (except those that belong to the part of investment cost recovery) which are included in the
current profit and loss, other relevant gains or losses (including exchange gains and losses) shall be
included in other comprehensive income, and shall not be transferred into the current profit and loss. When
its recognition is terminated, the accumulated gains or losses previously booked into other comprehensive
incomes shall be transferred from other comprehensive incomes and recorded into retained earnings.
4) Financial assets measured at fair values and whose changes are included in current profit and loss
For financial assets measured at fair value and whose changes are included in the current profit and
loss (except for those related to hedge accounting), the gains or losses resulting from changes in fair value
are included in the current profit and loss.
(3) Impairment of financial assets
Based on the expected credit loss, the Company conducts impairment accounting of financial assets
classified as measured at amortized cost, financial assets classified as measured at fair value and whose
changes are included in other comprehensive income and recognizes loss reserves.
The Company considers reasonable and reliable information about past events, current situation and
forecast of future economic situation, taking the risk of default as the weight, calculates the probability
weighted amount of the present value of the difference between the cash flow receivable from the contract
and the cash flow expected to be received, and recognizes the expected credit loss.
On each balance sheet date, the Company separately measures the expected credit loss of financial
instruments at different stages. If the credit risk of financial instruments has not increased significantly
since the initial recognition, it is in the first stage. The Company will measure the provision for loss
according to the expected credit loss in the next 12 months. If the credit risk of a financial instrument has
increased significantly since its initial recognition but no credit impairment has occurred, it is in the second
stage, and the Company measures the provision for loss according to the expected credit loss of the
instrument throughout its life. If a financial instrument has suffered credit impairment since its initial

2020 Annual Report
119 / 246
recognition, it is in the third stage. The Company measures the provision for loss according to the expected
credit loss of the instrument throughout its life.
For financial instruments with low credit risk on the balance sheet date, the Company assumes that
the credit risk has not increased significantly since the initial recognition, and measures the provision for
loss according to the expected credit loss in the next 12 months.
For financial instruments in the first and second stages and with low credit risk, the Company
calculates interest income according to the book balance before deducting provision for impairment and
the actual interest rate. The interest income shall be calculated according to their book balance minus the
amortized cost after impairment provision and the effective interest rate for financial instruments in the
third stage.
For notes receivable, accounts receivable and receivables financing arising from daily business
activities such as selling commodities and providing labor services, regardless of whether there is any
significant financing component, the Company measures the provision for loss based on expected credit
loss over the whole duration.
For accounts receivable without objective evidence of impairment or when information of the
expected credit loss for a single financial asset cannot be evaluated at a reasonable cost, the Company
divides the accounts receivable into several portfolios according to the credit risk characteristics, calculates
the expected credit loss on the basis of the portfolios, and determines the portfolio on the following basis:
Classification
of portfolio Type of portfolio
Basis for portfolio
determination
Accrual method of
bad debt provision
according to the
portfolio
Portfolio 1
Bills or letters of credit receivable (excluding
commercial acceptance bills), prepayments,
deposit receivable and deposit during the
settlement period; Project construction projects
that will be reimbursed and offset by project
expenditures will borrow reserves funds and other
receivables that have sufficient evidence to show
no risk
Payment nature No provision
Portfolio 2 Accounts receivable from relevant government
departments
Credit risk
characteristics note 1 Expected credit loss
Portfolio 3
Accounts receivable from related parties within the
scope of the company's merger, and accounts
receivable from joint ventures temporarily formed
due to unified transfers of operating funds
participating in the company.
Payment nature No provision
Portfolio 4 Receivables other than the above Credit risk
characteristics note 2 Expected credit loss
Note 1: Portfolio 2, the Company will settle and recover the receivables from relevant government
departments within one year after the balance sheet date during the settlement period, for example, the
receivables from government subsidies, without risks and excluding provision for bad debt; It is expected
that the receivables collected from relevant government departments will be settled one year after the
balance sheet date, for example, the allowance for electricity receivables. Considering the time value of
assets, the bad debt reserves will be set aside at 5.00% of the receivable balance. The bad debt reserves
exceeding 5.00% of the receivable balance has already been set aside according to the account receivable
age. Based on the principle of prudence, it will not be reversed until it is collected.
Note 2: Portfolio 4: The Company combines receivables other than the above combinations according
to credit risk characteristics (account receivable age) and estimates the accrual proportion of bad debt
provision for the receivables based on all reasonable and reliable information, including forward-looking
information:
Account receivable age Provision proportion (%)
Within one year 5.00
1-2 years 10.00
2-3 years 50.00
Over 3 years 100.00
The Company shall record the provision for loss accrued or transferred back into the current profit
and loss. For debt instruments held at fair value through other comprehensive income, the Company
adjusts other comprehensive income while recording impairment loss or profit included in the current
profit or loss.

2020 Annual Report
120 / 246
(4) Recognition basis and measurement method of financial asset transfer
Financial assets should be derecognized when any of the following conditions is met:① the
contractual right to acquire cash flow of the said financial assets is terminated;② the financial assets have
been transferred and almost all risks and rewards from the ownership of the said financial assets are
transferred to the transferee;③ the financial assets has been transferred and the transferor waives its
control over the said assets, despite the enterprise has not transferred or retained any risks and rewards
from the ownership of the said financial assets.
Where the enterprise neither transfers nor retains any risks and rewards on the financial asset
ownership, if the control over the financial asset is not waived, relevant financial asset shall be recognized
to the extent of continuing involvement in the transferred financial assets, and relevant liabilities shall be
recognized correspondingly. “Continuing involvement in the transferred financial assets” refers to the risk
level that the Company will be faced with due to the change in value of such financial assets.
If the entire transfer of the financial assets meets derecognition conditions, the difference between
the book value of the transferred financial asset and the sum of the consideration received due to the
transfer and the cumulative changes in fair value that has been formerly recognized in other comprehensive
incomes, is included in the current profit or loss.
Where the partial transfer of the financial assets meets derecognition conditions, the book value of
the transferred financial assets shall be amortized between the derecognized and non-derecognized
portions as per their relative fair values respectively; and the balance between the sum of the consideration
from the transfer and the accumulative amount of changes in fair value which was previously recognized
in other comprehensive incomes of the derecognized portion and aforementioned book value shall be
included in the current profit or loss.
For non-transactional equity instruments which are designated to be measured at fair value with their
changes included in other comprehensive income. If the investment termination is recognized, the
accumulated gains or losses previously included in other comprehensive income will be transferred out
from other comprehensive income and included in retained earnings.
(5) Classification and measurement of financial liabilities
1) Financial liabilities measured at fair value with their changes included in current profit and loss
Financial liabilities measured at fair value with their changes included in current profit and loss
include transactional financial liabilities (including the derivative instruments which belong to financial
liabilities) and financial liabilities designated to be measured at fair value with their changes included in
current profit and loss. The financial liabilities which are measured at fair value and whose changes are
recognized in the current period profit or loss are subsequently measured at fair value. The gains or losses
resulting from the changes in fair value and the dividends and interest expenses related to such financial
liabilities are recorded in the current period profit or loss.
2) Other financial liabilities
If derivative financial liabilities have no quotation in an active market and they are linked with equity
instruments which cannot be reliably measured for fair value and settled by delivering such equity
instruments, they are measured subsequently at cost. Other financial liabilities are subsequently measured
at amortized cost by using the effective interest method. Gains or losses resulting from derecognition or
amortization is included in current profit and loss.
(6) Derecognition of financial liabilities
When the current obligations of financial liabilities have been wholly or partially released, such
financial liabilities or part of them can be derecognized. The Company (the Debtor) and the Creditor sign
an agreement in which the existing financial liabilities are replaced by means of undertaking new financial
liabilities; and the contractual terms of the new financial liabilities and those of existing financial liabilities
are different in essence. Therefore, the existing financial liabilities shall be derecognized and the new
financial liabilities shall be recognized.
If the financial liabilities, are entirely or the partially derecognized, the difference between the book
value of the portion terminated in recognition and the consideration afforded (including the non-cash assets
transferred or the new financial liabilities assumed) is recognized into current profit or loss.
(7) Offset of financial assets and financial liabilities
When the Group is entitled to offset the recognized financial assets and financial liabilities, this legal
right is currently enforceable, and meanwhile the Group intends to either settle on the net basis or realize
the financial assets and repay the financial liabilities simultaneously, financial assets and financial liabilities are presented in the balance sheet with the amount obtained after mutually offsetting. Besides,

2020 Annual Report
121 / 246
financial assets and financial liabilities are presented separately in the balance sheet and are not mutually
offset.
(8) Determining fair value of financial instruments
Fair value refers to the price to be received for sale of an asset or to be paid for transfer of a liability
by market participants in the orderly transaction on the measurement date. When a financial instrument
has active market, the Company uses the quotation in the active market to recognize the fair value. The
quotation in the active market refers to the price to be readily and regularly obtained from the exchange,
broker, industry association, pricing service agency and the like and represents the actual market
transaction price in a fair deal. When a financial instrument does not have active market, the Company
uses the valuation techniques to recognize the fair value. Valuation techniques include reference to the
prices used by the well-briefed and willing-to-transact parties in the latest market transactions, reference
to the current fair values of other financial instruments similar in nature, discounted cash flow technique
and option pricing models.
11. Notes receivable
Recognition method and accounting treatment of expected credit loss of notes receivable
√Applicable □Inapplicable
Notes receivable refer to banker’s acceptance bill, commercial acceptance bills and letters of credit
that are held until maturity to recover principal and interest. Commercial acceptance bills use the same
method as accounts receivable to accrue bad debt reserves. See "Financial Instruments" for details.
12. Accounts receivable
Recognition method and accounting treatment of expected credit loss of accounts receivable
√Applicable □Inapplicable
See "Financial Instruments" for details.
13. Receivables financing
√Applicable □Inapplicable
Receivable financing refers to banker's acceptance bill received by the company for the purpose of
recovering principal and interest at maturity, endorsement transfer and bank discount. If the remaining
term of a banker's acceptance bill is short and the book balance is close to the fair value, the book value
shall be taken as its fair value. See "Financial Instruments" for details.
14. Other receivables
Recognition method and accounting treatment of expected credit loss of other receivables
√Applicable □Inapplicable
See "Financial Instruments" for details.
15. Inventories
√Applicable □Inapplicable
(1) Classification of inventories
Classification of inventories: raw materials, packaging materials, in-process products, inventory
goods, goods in transit, turnover materials (including packaging materials, low-value consumables,
scaffolding of construction enterprises, etc.), consigned goods, issued goods, consigned processed goods,
consumable biological assets, engineering construction, etc.
(2) Pricing method for sent out inventory
Inventories are priced at the actual cost at the time of acquisition. Inventory collection and issue
except revolving materials shall be accounted for according to the weighted average method.
(3) Basis for determining the inventory’s net realizable value and drawing methods for provision for
obsolete inventories
At the end of the year, the inventories shall be valued by the lower one between cost and net realizable
value. If the inventory cost is greater than the balance of net realizable value, provision for inventory
falling price shall be withdrawn and included in current profit and loss. As to inventories related to the
series produced and sold in the same area which have similar purposes or final application and are hard to

2020 Annual Report
122 / 246
separate from other items, the provision can be drawn by combination; as to inventories large in quantities
and low in price, the provision is drawn by classification.
For material held for production, if the net realizable value of the finished product is higher than the
cost, the material shall be measured with the cost; if the reduction of the material price indicates that the
net realizable value of the finished product is lower than the cost, the material shall be measured with the
net realizable value.
(4) Inventory system
The perpetual inventory system is applied to inventories.
(5) Amortization method for revolving materials
When the revolving materials (low-value consumables) are collected and used, the 50%-50%
amortization method shall be adopted for the unit value above RMB 500 and one-time amortization for
the unit value below RMB 500. Tongwei Solar (Hefei) Co., Ltd., a wholly-owned subsidiary of the
Company, and its subsidiaries' low-value consumables are amortized at one time when they are collected.
The impact is small, and the amount of impact is difficult to calculate accurately. It has not been adjusted
in the consolidated statement.
16. Contract assets
(1). Recognition methods and standards of contract assets
√Applicable □Inapplicable
The Company considers that the customer has not yet paid the contract consideration, but the
company has fulfilled its performance obligations in accordance with the contract, and is not
unconditionally (that is, only depending on the passage of time) right to collect payments from the
customer, which is listed as contract assets in the balance sheet. Contract assets and contract liabilities
under the same contract are listed in net amount, and contract assets and contract liabilities under different
contracts are not offset.
(2). Recognition method and accounting treatment method of contract assets' expected credit loss
√Applicable □Inapplicable See "Financial Instruments" for details.
17. Held-for-sale assets
√Applicable □Inapplicable
Where the Company recovers its book value mainly through the sales (including the exchange of
non-monetary assets of commercial nature, similarly hereinafter) other than the continuous use of a non-
current asset or disposal group, the non-current asset or disposal group shall be classified as held-for-sale.
Non-current assets or disposal groups classified as held for sale shall meet the following conditions:
(1) Based on the practice of selling such assets or disposal groups in similar transactions, those can
be sold immediately under current conditions;
(2) Their sales are very likely to happen, that is, the Company has already made a resolution on a
sales plan and obtained a certain purchase commitment and their sales are expected to be completed within
one year. The relevant approval has been obtained from relevant authorities of the Company or regulators
for those available for sale as required by the relevant regulations.
The Company measures the non-current assets or disposal group held for sale at the book value and
net value of the fair value minus the selling expenses. If the book value is higher than the net amount of
fair value minus selling expenses, the net amount of fair value minus selling expenses shall be reduced
from the book value to the net amount of fair value. The reduced amount shall be recognized as an asset
impairment loss and included in the current profit and loss. At the same time, provision for impairment of
assets held for sale shall be made. If the net amount obtained by deducting the selling expenses from the
fair value of non-current assets or disposal groups held for sale on the subsequent balance sheet date
increases, the previous write-down amount shall be recovered and reversed from the asset impairment loss
recognized after being classified as the held-for-sale assets, and the reversed amount shall be included in
the current profit or loss. The book value of goodwill in the disposal group held for sale that has been
offset and the impairment loss of assets recognized before the non-current assets held for sale are classified
as held for sale shall not be reversed.

2020 Annual Report
123 / 246
No depreciation or amortization is provided for non-current assets held for sale or non-current assets
in the disposal group. The interest of liabilities and other expenses in the disposal group held for sale shall
be recognized continuously.
When non-current assets or disposal groups are no longer classified as held for sale because they no
longer meet the classification criteria for held for sale categories, and non-current assets are removed from
the held for sale disposal groups, they shall be measured according to the lower of the followings:
(1) The book value before being classified as held for sale, adjusted according to depreciation,
amortization or impairment that should have been recognized if it had not been classified as held for sale;
(2) Recoverable amount.
18. Debt investment
(1). Recognition method and accounting treatment of expected credit loss of debt investment
□Applicable √Inapplicable
19. Investment in other debentures
(1). Recognition method and accounting treatment of expected credit loss of other debt investments
□Applicable √Inapplicable
20. Long-term receivables
(1). Recognition method and accounting treatment of expected credit loss of long-term receivables
□Applicable √Inapplicable
21. Long-term equity investments
√Applicable □Inapplicable
The long-term equity investments of the Company refers that investors control the investees's equity
investment or significantly influence the investees, and the equity investments of the joint venture.
(1) Determination of investment cost
Long-term equity investments forming in business merger: as to long-term equity investments
forming in merger of enterprises under common control, the portion of book value in the consolidated
financial statement of the final controlling party based on the shareholder's equity of the merged party on
the merger date shall be taken as the initial capitalized costs. As to that forming in merger of corporations
under different control, the merger costs consist of assets paid, liabilities incurred or undertaken and fair
value of equity securities issued by the purchaser. Intermediation costs such as audit, legal service and
assessment and consultation and other administration costs shall be included in current profit and loss
when incurred during business merger. The transaction expenses of equity securities or debt securities
issued as merger consideration by the purchaser shall be included in the initially recognized amount
thereof.
Other equity investment other than that forming in business merger shall be calculated initially as per
costs. According to acquiring ways of long-term equity investment, the costs shall be determined as per
cash purchasing price actually paid by the Company, the fair value of equity securities issued by the
Company, value agreed in investment contract or agreement, fair or book values of exchanged assets in
non-monetary asset exchanging, fair value of the long-term equity investment itself, and other ways.
Expenses, taxes and other necessary expenditures directly related to the acquisition of the long-term equity
investments shall be included in the investment cost.
(2) Methods of subsequent measurement and recognition of profit and loss
Long-term equity investment having common control (except for joint operation) or significant
influence on the investee shall be calculated with the equity method. In addition, long-term equity
investments, regarding which the Company can exercise control on the investee, are accounted for under
the cost method.
① Long-term equity investment calculated by using cost method
When calculated by cost method, the long-term equity investment will be valued as per initial
investment costs. Except the declared but not released cash dividend or profit which is included in actual amount or consideration paid for acquiring investment, the current investment profit will be determined
as per the cash dividend or profit which is declared to release in the investee.

2020 Annual Report
124 / 246
② Long-term equity investments calculated by equity method
For long-term equity investments calculated by the equity method, where their initial investment
costs exceed the share of the fair value of the investee’s identifiable net assets at the time of the investment,
the initial investment costs of the long-term equity investment are not adjusted; where their initial
investment costs are less than the share of the fair value of the investee’s identifiable net assets at the time
of the investment, the balance shall be included in the current profit or loss and the costs of the long-term
equity investment are adjusted accordingly.
When calculated by equity method, the current investment profit or loss shall be the portion of the
net profit or loss of the investee in the current year to be enjoyed or shared. When determining the portion
to enjoy in the investee, the Company will adjust the net profit of the investee based on the fair value of
identifiable assets in the investee during acquiring of investment, and accounting policies and period of
the Company. The internal trading profit and loss incurred but not realized between the Group and joint
venture/cooperative enterprise will be offset by the portion belonging to the Group as per shareholding
ratio and then the investment profit and loss will be determined accordingly. But internal transaction profit
or loss incurred but not realized between the Company and the investee which belong to impairment loss
of transferred assets as per the Accounting Standards for Business Enterprises No. 8 - Asset Impairment,
shall not be offset. Other comprehensive income of the investee shall be recognized as other
comprehensive income by corresponding adjustment of the book value of the long-term equity investment.
For other changes of the owner's equity except net profit and loss of interested entities, other
comprehensive profit and profit distribution in investee, the book value of long-term equity investment
should be adjusted and included in the shareholders' equity. In the subsequent disposal of the long-term
equity investment, the amount included in the shareholders' equity shall be transferred to the investment
income in proportion or in full.
When determining the net loss occurring in the Investee to share, the long-term equity of the net
investment in the Investee shall be written off by the book value of the long-term equity investment and
other essential parts till the equity is nil. In addition, if the Company has obligation to bear extra loss of
the investee, the estimated liabilities shall be recognized by the estimated obligation and included in the
current investment loss. When the investees realize net profit later, the Company will recover the sharing
amount of recognized profit after the sharing amount offsets the unrecognized sharing loss.
③ Purchase of minority share holding
When consolidated financial statements are prepared, the capital reserves are adjusted by offsetting
the difference between the newly increased long-term equity investment from purchase of minority
holding and the net asset portion of the subsidiaries to share which is continuously calculated since
acquisition date (or merger date) as per newly increased holding ratio; where the capital reserves are not
sufficient to be offset, the retained earnings shall be adjusted.
④ Disposal of long-term equity investment
In consolidated financial statements, the parent company disposes the long-term equity investment
to its subsidiaries partially without losing the right of control. The difference between the disposal amount
and the net assets enjoyed in the subsidiaries corresponding to disposal of long-term equity is included in
the shareholders' equity; if the parent company loses its control power to subsidiaries because of disposal
of the long-term equity investment in the subsidiaries, the disposal shall be dealt with by relevant
accounting policies stated in “Method for preparation of consolidated financial statements”.
As for the disposal of the long-term equity investment under other circumstances, the difference
between the book value and the actual purchase price will be included in the current profit and loss; for
the long-term equity investment calculated by equity method, other comprehensive income originally
recorded in the stockholder's equity is subject to accounting treatment in proportion on the same basis as
the investee directly disposing related assets or liabilities. For the remaining equity, it will be recognized
as long-term equity investment or other relevant financial assets according to its book value and measured
subsequently in the light of above-mentioned accounting policies of long-term equity investment or
financial assets. If the remaining equity will be measured with equity method instead of cost method, it
will be retroactively adjusted in accordance with relevant stipulations.
(3) Basis for determining existence of jointly control or significant influence over investees
Control refers to the power of the investor over the investee, the exposure of the investor to variable
returns by participating in related activities of the investee and the ability to use the power of the investor
over the investee to influence the amount of the investor's returns. Common control refers to the sharing
of control over certain arrangement under related agreements, and related activities of the arrangement
can be determined only when the unanimous consent of the parties sharing the control is obtained. Material

2020 Annual Report
125 / 246
influence refers to the situation that a company has power to participate in making financial and operating
decisions of an enterprise, but cannot control or jointly control with other parties over the formulation of
these policies. In determining whether the control or significant influence can be imposed on the investee,
such potential factors concerning voting rights as the current convertible bonds and current executable
warrants of both the investor and the invested entity have been considered.
(4) Impairment test methods and drawing methods for impairment provision
The Company checks whether there are signs of possible asset impairment for the long-term equity
investment at every balance sheet date. If any evidence shows that there is possible asset impairment, the
recoverable amount thereof will be estimated. If the recoverable value of the asset is less than its carrying
amount, the impairment provision is provided according to the balance and included in current profit or
loss.
Once any impairment loss of long-term equity investment is recognized, it will not be reversed in the
future accounting period.
22. Investment real estate
(1). If measured at cost:
Depreciation or amortization method
Investment property is property held to earn rentals or for capital appreciation or for both. It includes
a land use right that is leased out; a land use right held for transfer upon capital appreciation; and a building
that is leased out.
1) Initial measurement
When the Company is able to obtain rental income or value-added income related to investment
real estate and the cost of investment real estate can be measured reliably, the Company will initially
measure it according to the actual expenditure of purchase or construction:
The cost of outsourcing investment real estate, including the purchase price and relevant taxes and
fees directly attributable to the asset;
The cost of self-built investment property includes all the necessary expenses for constructing the
asset to achieve the intended usable status;
The cost of investment property acquired by other methods shall be determined as per regulations
of relevant accounting standards.
2) Subsequent measurement
In general, the Company adopts the cost model to carry out subsequent measurement on the
subsequent expenditure of investment real estate. Depreciation or amortization shall be accrued for
investment real estate according to the Company's accounting policies for fixed assets or intangible
assets.
Where there is conclusive evidence that the fair value of the investment properties can be obtained
continuously and reliably, in principle, use the fair value model to measure the investment properties
subsequently. When using the fair value model for measurement, the Company does not draw
depreciation for or amortize investment properties. It also adjusts its book value based on the fair value
of investment properties on the balance sheet date and includes the difference between the fair value and
the original book value in current profit and loss.
3) When the Company changes the use of investment real estate, it will transfer the relevant
investment real estate to other assets.
23. Fixed assets
(1). Recognition conditions
√Applicable □Inapplicable
Fixed assets refer to houses, buildings, machinery and equipment, means of transportation and other
tools and appliances related to production and operation held by the Company for the purpose of producing
commodities, providing labor services, leasing or operation management with a service life of more than
one year. Only when the relevant economic benefits in connection to such fixed assets are likely to flow
into the enterprise and their costs can be reliably measured, the fixed assets can be recognized.
The leased fixed assets meet the finance lease conditions, and the company shall recognize and
present it as fixed assets.

2020 Annual Report
126 / 246
(2). Depreciation method
√Applicable □Inapplicable
Category Depreciation
method
Depreciation life
(year)
Residual
rate
Annual depreciation
rate
Houses and buildings Straight-line
method 5—35 5% 19%—2.71%
Where: office building Straight-line
method 35 5% 2.71%
Houses and buildings for PV
cell and module production
Straight-line
method 30 5% 3.17%
Simple building Straight-line
method 5 5% 19%
Other houses and buildings Straight-line
method 15—20 5% 6.33%—4.75%
Privatized land abroad Non-amortization Long-term
Machinery equipment Straight-line
method 5—12 5% 19%—7.92%
Where: chemical equipment Straight-line
method 12 5% 7.92%
Cell processing equipment Straight-line
method 10 5% 9.5%
Feed equipment Straight-line
method 8—10 5% 11.875%—9.5%
Food processing equipment Straight-line
method 8—10 5% 11.875%—9.5%
Electronic equipment Straight-line
method 5 5% 19%
PV power generation equipment Straight-line
method 25 5% 3.8%
Transportation equipment Straight-line
method 4—5 5% 23.75%—19%
Office equipment Straight-line
method 5 5% 19%
Note: privatized land purchased for building factories outside China (e.g. Bangladesh) has a life-long
property right and needs no amortization for long-term use. Impairment tests were conducted at the end
of the reporting period.
When the depreciation of a fixed asset with impairment provision drawn is withdrawn, the
depreciation rate and amount shall be recalculated and determined as per the book value and available
service life of the fixed asset (i.e. the original price of the fixed asset minus accumulated depreciation and
drawn impairment provision).
On the balance sheet date, fixed assets are priced according to the book value or recoverable amount
(whichever is lower).
(3). Confirmation basis, valuation methods and depreciation methods for fixed assets acquired
under finance leases
√Applicable □Inapplicable
The leased fixed assets meet the finance lease conditions, and the company shall recognize and
present it as fixed assets. The lower of the fair value of the leased asset and the present value of the
minimum lease payment on the lease commencement date shall be taken as the recorded value of the
leased asset, and depreciation shall be calculated according to the classification standard of fixed assets
and its depreciation method.
24. Construction in progress
√Applicable □Inapplicable
(1) Valuation of construction in progress
Projects under construction are priced at actual costs. Borrowing interest and related expenses
incurred during construction shall be capitalized and included in the costs of projects under construction.
When the construction in progress reaches its intended purpose and is delivered for use, the fixed
assets shall be carried forward at the actual cost. For construction in progress that has been delivered for

2020 Annual Report
127 / 246
use but has not yet completed final accounts, it shall be valued and transferred to fixed assets according to
the data such as construction budget, construction cost or actual cost of construction, and depreciation
shall be accrued. After the completion of the final accounts, the original valuation and drawn depreciation
shall be adjusted according to the final accounts.
On the balance sheet date, construction in progress is priced according to the lower of book value and
recoverable amount.
(2) Provision for impairment of construction in progress
In case of one or several of the following circumstances, the Company shall make provision for
impairment of construction in progress based on the difference between the recoverable amount at the end
of the construction in progress and its book value. Once recognized, the impairment loss of assets shall
not be reversed in future accounting periods.
① The construction has been suspended for a long time and will not be restarted within three years;
② The construction in progress has fallen behind both functionally and technologically, and it will
bring great uncertainties to the Company's economic benefit;
③ Other circumstances sufficient to prove that impairment has occurred in the construction in
progress.
25. Borrowing costs
√Applicable □Inapplicable
The Company only capitalizes the related borrowing costs that can be directly attributed to assets that
meet the capitalization conditions during the capitalization period. Capitalization of borrowing costs starts
when the following three conditions are met at the same time:① expenditures for the asset have already
been incurred;② borrowing costs have already been incurred; ③ the necessary acquisition and
construction activities have been started to make the assets reach the expected serviceable condition and
will end when the fixed assets reach the expected serviceable condition. Capitalization of borrowing costs
will be suspended and recognized as current expenses when abnormal interruption occurs in the acquisition
and construction activities of fixed assets, with the interruption lasting for more than three consecutive
months.
The capitalization amount of borrowing costs is calculated as follows: As to special borrowings
borrowed for the acquisition, construction or production of assets eligible for capitalization, the amount
shall be determined by interest expenses from special borrowings actually occurred in the current period
deducting the interest income acquired from unused borrowings which are deposited in banks, or
deducting investment profit gained from the unused borrowings temporarily invested; as for general
borrowings for the acquisition, construction or production of assets eligible for capitalization, the amount
shall be determined by multiplying the weighted average of difference between accumulative assets
expenditure and assets expenditure of specially borrowed loans by the capitalization rate of general
borrowings; the capitalization amount of interest in each accounting period shall not exceed the actual
interest of relevant borrowings incurred in the current period. If there is a discount or premium on the
borrowings, the amount of discount or premium to be amortized in each accounting period shall be
recognized according to the actual interest rate method, and the amount of interest in each period shall be
adjusted. Ancillary expenses incurred by special borrowings, which occurred before the relevant assets
reached the expected serviceable or saleable condition, are capitalized according to the incurred amount
when they occurred, and those occurred after the relevant assets reached the expected serviceable or
saleable condition, are recognized as expenses and included in the current profit and loss.
26. Biological assets
√Applicable □Inapplicable
(1) Classification of productive biological assets
The productive biological assets of the Company are divided into: boars, parent ducks, parent fish
(shrimp), etc.
(2) Valuation of productive biological assets
① Cost valuation of purchased productive biological assets, including purchase price, relevant taxes,
traffic expenses, insurance premiums and other expenditures directly attributable to the purchase of the
assets;
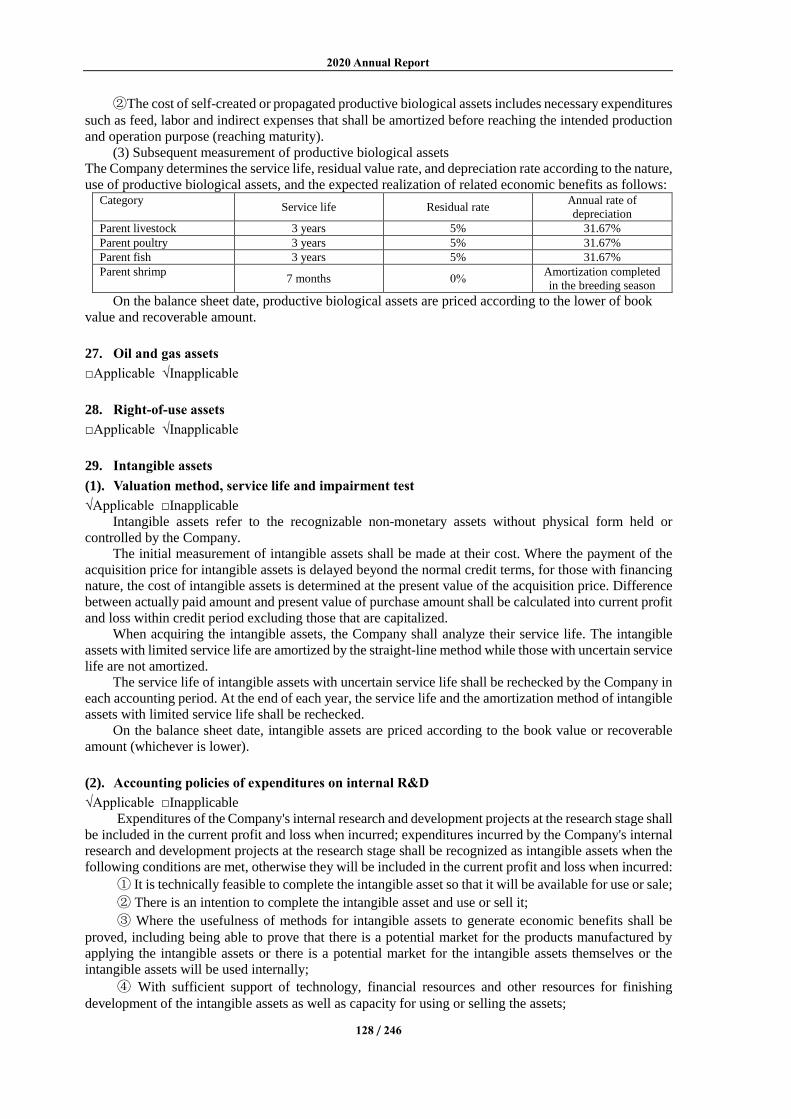
2020 Annual Report
128 / 246
②The cost of self-created or propagated productive biological assets includes necessary expenditures
such as feed, labor and indirect expenses that shall be amortized before reaching the intended production
and operation purpose (reaching maturity).
(3) Subsequent measurement of productive biological assets
The Company determines the service life, residual value rate, and depreciation rate according to the nature,
use of productive biological assets, and the expected realization of related economic benefits as follows: Category
Service life Residual rate Annual rate of
depreciation
Parent livestock 3 years 5% 31.67%
Parent poultry 3 years 5% 31.67%
Parent fish 3 years 5% 31.67%
Parent shrimp 7 months 0%
Amortization completed
in the breeding season
On the balance sheet date, productive biological assets are priced according to the lower of book
value and recoverable amount.
27. Oil and gas assets
□Applicable √Inapplicable
28. Right-of-use assets
□Applicable √Inapplicable
29. Intangible assets
(1). Valuation method, service life and impairment test
√Applicable □Inapplicable
Intangible assets refer to the recognizable non-monetary assets without physical form held or
controlled by the Company.
The initial measurement of intangible assets shall be made at their cost. Where the payment of the
acquisition price for intangible assets is delayed beyond the normal credit terms, for those with financing
nature, the cost of intangible assets is determined at the present value of the acquisition price. Difference
between actually paid amount and present value of purchase amount shall be calculated into current profit
and loss within credit period excluding those that are capitalized.
When acquiring the intangible assets, the Company shall analyze their service life. The intangible
assets with limited service life are amortized by the straight-line method while those with uncertain service
life are not amortized.
The service life of intangible assets with uncertain service life shall be rechecked by the Company in
each accounting period. At the end of each year, the service life and the amortization method of intangible
assets with limited service life shall be rechecked.
On the balance sheet date, intangible assets are priced according to the book value or recoverable
amount (whichever is lower).
(2). Accounting policies of expenditures on internal R&D
√Applicable □Inapplicable
Expenditures of the Company's internal research and development projects at the research stage shall
be included in the current profit and loss when incurred; expenditures incurred by the Company's internal
research and development projects at the research stage shall be recognized as intangible assets when the
following conditions are met, otherwise they will be included in the current profit and loss when incurred:
① It is technically feasible to complete the intangible asset so that it will be available for use or sale;
② There is an intention to complete the intangible asset and use or sell it;
③ Where the usefulness of methods for intangible assets to generate economic benefits shall be
proved, including being able to prove that there is a potential market for the products manufactured by
applying the intangible assets or there is a potential market for the intangible assets themselves or the
intangible assets will be used internally;
④ With sufficient support of technology, financial resources and other resources for finishing
development of the intangible assets as well as capacity for using or selling the assets;

2020 Annual Report
129 / 246
⑤ With reliable measurement of the expenditures belonging to development stage of the intangible
assets.
30. Impairment of long-term assets
√Applicable □Inapplicable
As to fixed assets, construction in progress, intangible assets with limited service life, investment
properties measured by cost model, long-term equity investment to subsidiaries, joint ventures and
associates, and other non-current and non-financial assets, the Company will determine whether they have
signs of impairment on the balance sheet date. If any, the recoverable amount shall be estimated and the
impairment tests shall be conducted. Impairment test shall be conducted on intangible assets every year
with uncertain goodwill and service life and the intangible assets not yet available, no matter whether there
is any sign of impairment.
If the impairment test result shows that the recoverable amount of the assets is less than the carrying
amount, the impairment provision shall be provided as per their difference and included in impairment
loss. The recoverable amount is the net amount of the fair value of the assets after deducting the disposal
expenses or the present value of the expected future cash flow of the assets, whichever is higher. The fair
value of the assets shall be recognized as per the price in sales agreement of fair dealing. If there is no
sales agreement but assets active market exists, the fair value shall be recognized as per the buyer’s price.
If there is neither sales agreement nor assets active market, the fair value of the assets shall be estimated
based on the best information available. Disposal expenses shall include legal expenses, relevant taxes and
handling expenses arising from assets disposal and other direct expenses for enabling the assets to be
available for sale. The discounted present value of the expected future cash flow of the assets shall be
recognized at suitable discount rate as per the expected future cash flow generated in the process of
continuous use and final disposal of the assets. Impairment provisions of assets shall be calculated and
recognized on a single asset basis. If it is difficult to estimate the recoverable value of the single assets,
the recoverable value shall be recognized as per the asset portfolio to which the single asset belongs. An
asset portfolio is the smallest portfolio of assets that is able to generate independent cash inflows.
In conducting the impairment test, the book value of goodwill presented in the financial statements
shall be allocated to the related asset portfolios or groups of asset portfolios which are expected to benefit
from the synergies of the business merger. If the test result indicates that the recoverable value of an asset
portfolio or group of asset portfolios, including the allocated goodwill, is lower than its carrying amount,
the corresponding impairment loss shall be recognized. The impairment loss shall be first deducted from
the book value of goodwill that is allocated to the asset portfolio or group of asset portfolios, and then
deducted from the carrying amounts of other assets within the asset portfolios or groups of asset portfolios
in proportion to the book values of assets other than goodwill.
Once impairment loss is recognized for the above-mentioned asset, the part with value recovered
shall not be reversed.
31. Long-term prepaid expenses
√Applicable □Inapplicable
Long-term prepaid expense shall be recorded according to the actual amount incurred and amortized
within the benefit period or the specified amortization period by the straight-line method. If the long-term
prepaid expenses are no longer beneficial to the subsequent accounting periods, the amortized value of
unamortized expenses will be completely carried forward to profit and loss of current period.
32. Contract liabilities
(1). Confirmation method of contract liabilities
√Applicable □Inapplicable
Contract liabilities refer to the Company's obligation to transfer goods to customers for consideration
received or receivable from customers. If the customer has already paid the contract consideration or the
Company has obtained the unconditional right to receive payment before the Company transfers the goods
to the customer, the Company shall list the received or receivables as contract liabilities at the earlier of
the time between the actual payment by the customer and the payment due. Contract assets and contract
liabilities under the same contract are listed in net amount, and contract assets and contract liabilities under
different contracts are not offset.

2020 Annual Report
130 / 246
33. Employee compensation
(1). Accounting treatment methods for short-term compensation
√Applicable □Inapplicable
Short-term compensation mainly includes salary, bonus, allowances and subsidies, employee welfare
expenses, medical insurance premiums, birth insurance premium, work injury insurance premium, housing
fund, labor union funds and personnel education fund, non-monetary welfare, etc. During the period of
accountant when staffs provide services for the Company, the actual short-term employee compensation
would be recognized as liabilities by the Company and be included in the current profit and loss or relevant
asset cost. The non-monetary welfare shall be measured based on the fair value.
(2). Accounting treatment methods for post-employment welfare
√Applicable □Inapplicable
The post-employment benefit plan includes the defined contribution plan and defined benefit plan.
The defined contribution plan mainly includes basic pension insurance premiums and unemployment
insurance premiums. The corresponding amount payable is included in the cost of a relevant asset or the
current profit and loss upon occurring. The Company's defined benefit plans specifically provides benefits
such as living allowance and medical expenses for retirees according to relevant national policies,
company regulations and considering the length of service for the Company.
For defined benefit plans, the Company performs actuarial valuation on the balance sheet date.
Actuarial gains and losses are recognized in other comprehensive income. Service costs and net interest
on net liabilities or net assets of defined benefit plans are included in current profit and loss.
(3). Accounting treatment methods for dismissal welfare
√Applicable □Inapplicable
Dismissal welfare refers to compensation provided to employees for terminating the labor
relationship with employees before the expiration of the labor contract between the Company and the
employee, or for encouraging the employees to voluntarily accept the reduction. The Company will
include the dismissal welfare arising therefrom into the employee compensation liabilities and the current
profit and loss when paying. If it is expected that such dismissal welfare cannot be paid off within 12
months at the end of the annual reporting period, then the dismissed employees shall be paid the same as
other long-term employee.
The Company provides social insurance premiums and living allowances for the internally retired
staff before their formal retirement. The internal retirement plan is treated by using the same principles
for dismissal welfare as described above. Salaries and social insurance premiums to be paid by the
Company to the internally retired staff during the period from the date when the staff ceases to provide
services to the normal retirement date are included in current profit and loss when the recognition criteria
for provisions are met (dismissal welfare).
(4). Accounting treatment methods for other long-term employee welfare
√Applicable □Inapplicable
Other long-term employee welfare provided for employees by the Company are under accounting
treatment by defined contribution plan for that meets defined contribution plan, and is under accounting
treatment by defined benefit plan for the rest part.
34. Lease liabilities
□Applicable √Inapplicable
35. Estimated liabilities
√Applicable □Inapplicable
If obligations related to contingencies occur and meet the following conditions at the same time, they
will be recognized as estimated liabilities.
① Such obligation is a current obligation undertaken by the Company;

2020 Annual Report
131 / 246
② The performance of such obligation will probably cause outflow of economic interest of the
Company;
③ The amount of such obligation can be measured reliably.
If all or part of payment necessary for the estimated liabilities are expected to be compensated by a
third party or the other party, only when the amount of compensation is basically recognized to be received,
it can be independently recognized as assets, while recognized amount of compensation cannot exceed the
book value of the recognized liabilities.
The book value of estimated liabilities shall be reviewed by the Company on the balance sheet date.
If there is concrete evidence showing that the book value cannot truly reflect the current best estimate, the
book value shall be adjusted as per the current best estimate.
36. Share-based payment
□Applicable √Inapplicable
37. Other financial instruments as preferred shares and perpetual bond
□Applicable √Inapplicable
38. Revenue
(1). Accounting policies used in revenue recognition and measurement
√Applicable □Inapplicable
Applicable from January 1, 2020
1) General principles of revenue recognition
Revenue is the total inflow of economic benefits formed in the Company's daily activities that will
increase the owner's equity and have nothing to do with the owner's capital invested.
The Company has fulfilled the performance obligations in the contract, that is, when the customer
obtains control of the relevant goods or services, the revenue is recognized.
If the contract contains two or more performance obligations, the Company will allocate the
transaction price to each individual performance obligation in accordance with the relative proportion of
the stand-alone selling price of the goods or services promised by each individual performance obligation
on the date of the contract. The income is measured according to the transaction price of each individual
performance obligation.
The transaction price is the amount of consideration that the Company expects to be entitled to receive
due to the transfer of goods or services to customers, excluding payments collected on behalf of third
parties. The transaction price confirmed by the Company does not exceed the amount at which the
accumulated confirmed income will most likely not be subject to a significant reversal when the relevant
uncertainty is eliminated. It is expected that the money returned to the customer will not be included in
the transaction price as a liability. If there is a significant financing component in the contract, the
Company shall determine the transaction price based on the amount payable in cash when the customer
assumes control of the goods or services. The difference between the transaction price and the contract
consideration shall be amortized by the effective interest method during the contract period. On the starting
date of the contract, the Company expects that the interval between the customer's acquisition of control
of the goods or services and the customer's payment of the price will not exceed one year, regardless of
the significant financing components in the contract.
When one of the following conditions is met, the Company will perform its performance obligations
within a certain period of time, otherwise, it will perform its performance obligations at a certain time:
①The customer obtains and consumes the economic benefits brought by the company's performance
at the same time as the company's performance;
②The customer can control the products under construction during the performance of the Company;
③ The goods produced by the Company during the performance of the contract have irreplaceable
uses, and the Company has the right to collect payment for the cumulative performance part that has been
completed so far during the entire contract period.
For performance obligations performed within a certain period of time, the Company recognizes
revenue in accordance with the performance progress during that period of time. When the performance progress cannot be reasonably determined, if the cost incurred by the Company is expected to be

2020 Annual Report
132 / 246
compensated, the revenue shall be recognized according to the amount of the cost incurred until the
performance progress can be reasonably determined.
For performance obligations performed at a certain point in time, the Company recognizes revenue
at the point when the customer obtains control of the relevant goods or services. When judging whether a
customer has obtained control of goods or services, the Company will consider the following signs:
①The Company has the current right to receive payment for the goods or services;
② The Company has transferred the goods in kind to the customer;
③ The Company has transferred the legal ownership of the product or the main risks and rewards of
ownership to the customer;
④ The customer has accepted the goods or services.
The Company’s unconditional (only depending on the time lapses) right to collect consideration from
customers are listed as receivables; the Company has transferred goods or services to customers and has
the right to collect consideration (and this right also depends on other factors other than the time lapses)
are listed as contract assets, and contract assets are impaired on the basis of expected credit loss; the
Company’s obligation to transfer goods or services to customers for consideration received or receivable
from customers is listed as contract liabilities.
2) The specific method recognition for revenue
① Revenue from commodity sales
The Company recognizes revenue when it transfers control of goods to customers.
The Company mainly produces and sells high-purity polysilicon, cells and components, polyvinyl
chloride, sodium hydroxide and cement, feed, fish, pigs, ducks and other products, which belong to the
performance obligations performed at a certain point time, including:
Conditions that must be met for revenue recognition of domestic sales: the Company has delivered
the product to the purchaser in accordance with the contract and the purchaser has signed for the receipt
or the transportation company entrusted by the customer to sign for the receipt, the amount of product
sales revenue has been determined, and the payment has been recovered or obtained the receipt of payment
rights certificate and related economic benefits are likely to flow in, and product-related costs can be
reliably measured.
Conditions that must be met for the recognition of income from export products: according to the
interpretation of the general rules of interpretation of international trade terms, combined with revenue
recognition standards and contract law, the realization of revenue is recognized when the control of goods
is transferred to the customer under different trading terms.
The Company's PV powerplants sell electricity online, and revenue is recognized when the grid
company confirms the electricity online.
② Revenue from rendering labor services
The Company provides labor services such as engineering construction and equipment installation,
which belong to the performance obligation performed in a certain period. The revenue is recognized
according to the performance progress, and the performance progress is recognized according to the
proportion of the invested cost to its budgeted cost. If the labor cost incurred is not expected to be
compensated, no revenue will be recognized, and the incurred cost will be included in the current profit
and loss.
③ Revenue from abalienation of right to use asset
Use the straight-line method to apportion and confirm revenue within the period of the transfer of
asset use rights
The following revenue accounting policies are applicable to 2019 and previous years;
1) Revenue from commodity sales
Revenue realization is recognized when the following conditions are met: the Company has
transferred the main risks and remunerations related to the proprietary rights of the commodity to the
purchaser; the Company does not reserve the continuing management rights which are always related to
the proprietary rights, or executes control on the sold commodities; the economic benefits related to trades
can inflow into the Company; and relevant revenues and costs can be measured reliably.
The Company produces and sells food and animal drugs such as feed, fish, pigs and ducks, and the
specific conditions for revenue recognition are: for domestic products after delivery and receipt by
customers, and for export products after declaration and release. The Company produces and sells high-purity polysilicon, polyvinyl chloride, sodium hydroxide, cement products, cells, components, etc. and the

2020 Annual Report
133 / 246
specific conditions for revenue confirmation are: for products after delivery and receipt by customers or
the transportation companies entrusted by the customers.
2) Revenue from rendering labor services
The earning of the labor service provided and finished in the same accounting year shall be
recognized when the labor service is finished; the relevant earning of the labor service provided and
finished in different accounting years shall be recognized by the percentage of completion method on the
balance sheet date, given that the result of the labor service provided can be reliably estimated; if the result
of the labor service provided cannot be reliably estimated, the earning of the labor service shall be
recognized and measured in accordance with the principle of prudence.
3) Revenue from abalienation of right to use asset
Provided that the economic benefits related to transactions can flow into the enterprise and that the
amount can be reliably measured, the revenue from such use can be recognized.
(2). Differences in accounting policies for revenue recognition caused by the adoption of different
business models for similar businesses
□Applicable √Inapplicable
39. Contract cost
√Applicable □Inapplicable
Contract costs are divided into contract performance costs and contract acquisition costs.
(1) Contract performance cost
The cost incurred by the Company for the performance of the contract is recognized as an asset of
the contract performance cost when the following conditions are met at the same time:
① The cost is directly related to a current or anticipated contract, including direct labor, direct
materials, manufacturing expenses (or similar expenses), costs clearly borne by the customer, and other
costs incurred solely due to the contract.
② This cost increases the Company's future resources for fulfilling contract performance obligations.
③ The cost is expected to be recovered.
The asset is presented in inventory or other non-current assets based on whether the amortization
period at the time of initial recognition exceeds a normal operating cycle.
(2) Contract acquisition cost
The incremental cost incurred by the Company in order to obtain the contract is expected to be
recovered, and it shall be recognized as an asset when obtaining the cost.
Incremental costs refer to costs that the Company will not incur without obtaining a contract, such as
sales commissions. If the amortization period does not exceed one year, it shall be included in the
current profit and loss when occurred.
(3) Amortization of contract costs
Assets related to contract costs are amortized when the performance obligation is performed or
according to the performance of the performance obligation on the same basis as the revenue recognition
of goods or services related to the asset, and included in the current profit and loss.
(4) Impairment of contract costs
If the book value of the asset related to the contract cost is higher than the difference between the
remaining consideration that the Company can expect to obtain due to the transfer of the commodity
related to the asset and the estimated cost for the transfer of the related commodity, the excess shall be
provided for impairment; if it is confirmed as an asset impairment loss, and it shall further consider
whether to withdraw the estimated liabilities related to the loss contract:
① The remaining consideration expected to be obtained due to the transfer of goods or services
related to the asset;
② Estimate the cost that will be incurred for the transfer of the related goods or services.
After the provision for impairment is made, if the impairment factors in the previous period change
and the difference between the above two items is higher than the book value of the asset, the original
provision for asset impairment shall be reversed and included in the current profit and loss, but transferred
book value of the asset does not exceed the book value of the asset on the return date under the assumption
that no impairment provision is made.

2020 Annual Report
134 / 246
40. Government subsidies
√Applicable □Inapplicable
(1) Judgment basis and accounting treatment method of asset-related government subsidies
Asset-related government subsidies refer to the governmental subsidies that are obtained by the
Company and used for acquisition or construction, or forming the long-term assets in other ways; if no
government document specifies the grant object, the judgment basis for dividing the government subsidies
into asset-related or income-related shall be explained separately.
Accounting treatment method: from the month when the relevant assets reach the expected
serviceable condition and begin depreciation and amortization, asset-related government subsidies are
recognized as deferred revenue, and are distributed evenly over their service life (i.e. within the
depreciation and amortization period) and included in the current profit and loss. In case of early disposal
of relevant assets, the remaining deferred revenue will be included in the current profit and loss at one
time when the assets are disposed of. However, the government subsidies measured as per nominal amount
shall be directly included in current profit and loss.
(2) Judgment basis and accounting treatment method of revenue-related government subsidies
The revenue-related government subsidies refer to those obtained by the Company other than
government subsidies related to assets;
Accounting treatment methods:
① The amount used to compensate for related expense or loss during future periods of the Company,
it shall be recognized as deferred revenue, and shall be included in current profit and loss or offset the
related costs during the period of recognizing the related expenses;
② The amount used to compensate for the incurred related expenses or loss of the enterprise shall be
included to current profit and loss or offset the related costs directly.
③ Timing for government subsidies recognition
The government subsidies shall be recognized when all the attached conditions can be satisfied and
the government subsidies can be received by the Company.
④ Measurement of government subsidies
If government subsidies are monetary assets, they shall be measured as per amount received or
amount receivable. If the government subsidies are non-monetary assets, they shall be measured based on
fair value; if the fair value cannot be acquired reliably, they shall be measured based on the nominal
amount.
41. Deferred income tax assets/Deferred income tax liabilities
√Applicable □Inapplicable
The accounting of the Company's income tax shall be conducted by using the balance sheet liability
method.
The Company recognizes deferred income tax assets when the following conditions are met at the
same time: (1) the temporary differences are likely to be reversed in the foreseeable future; (2) the amount
of taxable income that can be used to offset temporary deductible differences is likely to be obtained in
the future, and is limited to the amount of taxable income that is likely to be obtained.
On the balance sheet date, the current income tax liabilities (or assets) formed in the current period
and previous period shall be measured at the amount of income tax to be paid (or returned) calculated as
per the tax laws; deferred income tax assets and deferred income tax liabilities shall be measured according
to the applicable tax rate during the period when the assets are expected to be recovered or the liabilities
are settled according to the tax laws.
On the balance sheet date, the Company reviews the book value of deferred income tax assets and
deferred income tax liabilities. Except for income tax arising from business mergers, transactions or events
directly recognized in owner's equity, the current income tax and deferred income tax of the Company are
included in the current profit and loss as income tax expenses or income.
42. Lease
(1). Accounting treatment methods of operating lease
√Applicable □Inapplicable 1) The lease expenses paid for renting the assets by the Company shall be amortized based on the
straight-line method and included in the current expenses during the whole lease period including the rent-

2020 Annual Report
135 / 246
free period. The initial direct expenses related to the lease transaction paid by the Company shall be
included in current expenses.
When the asset lessor bears the lease-related expenses that shall be borne by the Company, the
Company will deduct this part of the expenses from the total rent, and amortize the lease expenses after
deduction within the lease period and include them in current expenses.
2) The rent charged for leasing the assets by the Company shall be amortized based on the straight-
line method and included in lease-related revenue during the whole lease period including the rent-free
period. The initial direct expenses related to the lease transaction paid by the Company shall be included
in current expenses; if the amount is relatively large, it shall be subject to the capitalization, and be
included by stages in current revenue as per the same basis for lease-related income recognition within the
whole lease term.
Where the Company bears the lease-related expenses that shall be borne by the lessee, the Company
will deduct this part of the expenses from the total rent, and allocate the lease expenses after deduction
within the lease period.
(2). Accounting treatment methods of finance lease
√Applicable □Inapplicable
1) Basis to determine finance lease
Finance lease is a kind of lease in which all or most of risks and rewards regarding the ownership of
the said assets are actually transferred. Its ownership may be transferred or not in the end. The lease which
meets one or more standards below shall be recognized as the finance lease:
First, upon the expiration of the lease term, ownership of the leasing assets is transferred to the lessee.
It usually means that the lessor can transfer the ownership of the asset to the lessee when the lease term
expires, either as agreed in the lease contract or after making a reasonable judgment based on relevant
conditions on the lease start date.
Second, the lessee has option on the purchase of leasing assets. The purchase price is expected to fall
far below the fair value when the option is performed so that it can be reasonably determined since the
commencement date of the lease that the lessee will exercise the option.
Third, even if the ownership of the leasing assets is not transferred, the lease term accounts for most
of the service life of the leasing assets. Among them, the “most” is usually controlled above 75%
(including 75%) which the lease term accounts the service life of the leasing assets.
Fourth, the present value of the minimum amount paid by the lessee at the commencement of the
lease is almost equal to the fair value of the leasing assets at that time. The present value of the minimum
amount received by the leaser at the commencement of the lease is almost equal to the fair value of the
leasing assets at that time. Among them, "almost equal to" is usually controlled above 90% (including
90%).
Fifth, the property of the leasing assets is special. The leasing assets can be used by the lessee only if
not changed significantly.
2) Accounting treatment methods of finance lease
① Financing lease assets: on the commencement date of the lease term, the Company recognizes the
fair value of leasing assets or the present value of minimum lease payment (whichever is lower) as the
entry value of the leasing assets, and recognizes the minimum lease payment as the entry value of long-
term payables and the difference between the entry values as the unrecognized financing charges. The
unrecognized finance charge shall be amortized by the Company by the effective interest method during
the asset lease period and included in financial expenses. The initial direct costs incurred in the Company
shall be included in value of leased assets.
② Financing leased assets: on the commencement date of the lease, the Company shall recognize the
finance lease receivables and the balance between the sum of unguaranteed residual value and the present
value as the unrealized financing income, and as the lease revenue in future periods when the rents are
received. The initial direct expenses related to the lease transaction incurred by the Company shall be
included in initial measurement of the finance lease receivables, and the amount of income recognized in
the lease period shall be reduced.
(3) Accounting treatment method of recognizing sale and leaseback transactions as a finance lease
The contract, signed by and between the Company and the leasing company, does not change the
right of use and management of the assets, and is essentially the sale-leaseback business financed by asset
mortgage. It is recognized as a long-term payable when it obtains the finance lease payment, and the

2020 Annual Report
136 / 246
payable rent and service fee during the finance lease payment period are recognized as unrecognized
finance charges, which are amortized according to the actual interest rate during the lease period and
included in the cost expense.
The sale and leaseback transaction recognized as an operating lease shall be provided with accounting
treatment separately based on asset disposal and lease.
(3). Determination method and accounting treatment method of lease under new lease standards
□Applicable √Inapplicable
43. Other significant accounting policies and accounting estimates
□Applicable √Inapplicable
44. Changes of significant accounting policies and accounting estimates
(1). Change of significant accounting policies
√Applicable □Inapplicable
Contents and reasons of changes
in the accounting policies
Approval
procedures
Notes (name and amount of the significantly affected statement
items)
The Ministry of Finance issued
the Accounting Standards for
Business Enterprises No. 14-
Revenue (2017 Revision)
(ck[2017] No. 22) (hereinafter
referred to as the "New Revenue
Standards") on July 5, 2017.
Companies that are required to
list domestically will implement
the new revenue standards from
January 1, 2020.
The tenth
meeting of
the seventh
board of
directors
The Ministry of Finance issued the Accounting Standards for
Business Enterprises No. 14-Revenue in 2017.
The revised standard stipulates that for the first implementation
of the standard, the amount of retained earnings and other related
items in the financial statements at the beginning of the year
should be adjusted according to the cumulative impact, and the
information during the comparable period should not be adjusted.
The Company has implemented the new revenue standard from
January 1, 2020. According to the standards, the Company only
adjusts the retained earnings at the beginning of 2020 and the
amount of other related items in the financial statements for the
cumulative impact of contracts that have not been completed on
the date of first implementation, and the comparative financial
statements are not adjusted.
The Company adjusted the receivable electricity price subsidies
corresponding to powerplants not included in the national
subsidy catalog from the original "accounts receivable" item to
the "contract assets" item for presentation. The tax-exclusive
amount of advance receipts related to sales of goods was adjusted
from the original “advance receipts” item to “contract liabilities”
and the corresponding added-value tax and output tax were
adjusted from the original “advance receipts” item to “other
current liabilities” "or "other non-current liabilities" presentation
according to the liquidity, this change only affects the
presentation of financial statements, and does not affect total
assets, net assets and net profit.
Other notes
The impact of the above changes in accounting policies on the financial statements is as follows:
① Consolidated Balance Sheet
Statement item December 31, 2019 Adjustment number January 1, 2020
Accounts receivable 1,672,241,936.75 -998,603,103.27 673,638,833.48
Contract assets 998,603,103.27 998,603,103.27
Advance receipt 1,571,445,278.97 -1,521,138,014.69 50,307,264.28
Contract liabilities 1,484,683,326.76 1,484,683,326.76
Other current liabilities 1,123,805,086.92 36,454,687.93 1,160,259,774.85
② Balance Sheet of the Parent Company
Statement item 2019/12/31 Adjustment number 2020/1/1
Advance receipt 142,278,536.45 -137,760,053.55 4,518,482.90
Contract liabilities 137,648,472.21 137,648,472.21
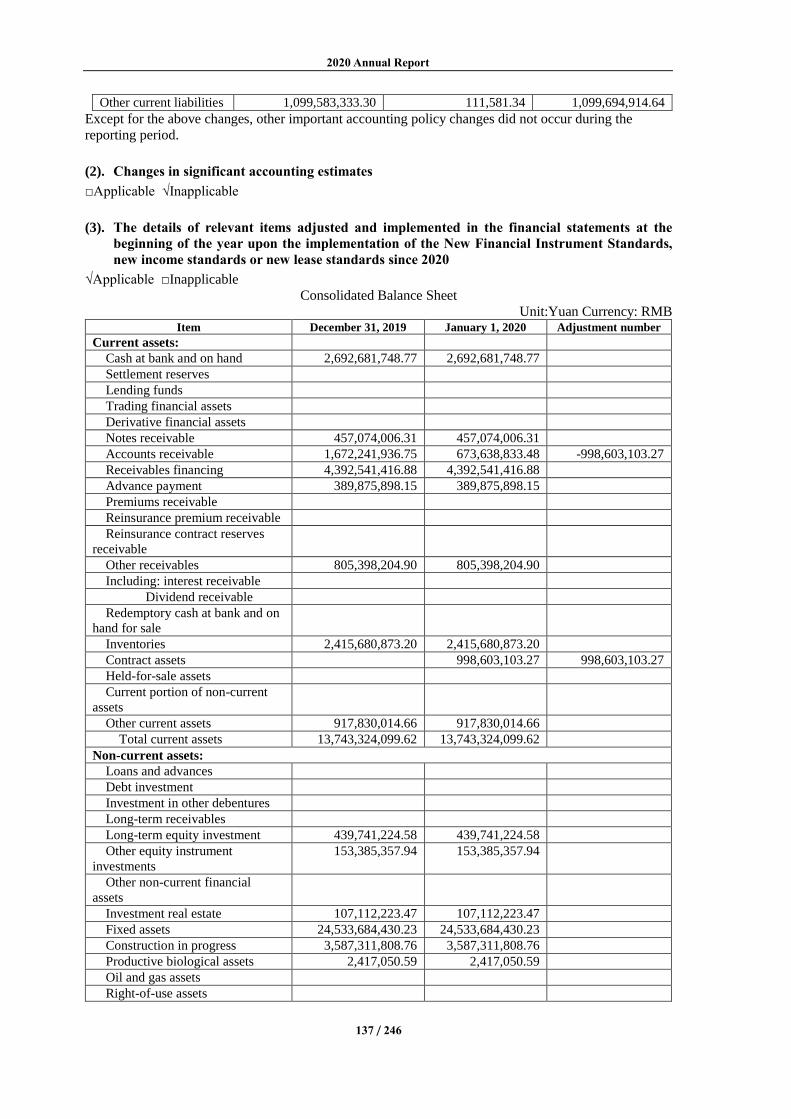
2020 Annual Report
137 / 246
Other current liabilities 1,099,583,333.30 111,581.34 1,099,694,914.64
Except for the above changes, other important accounting policy changes did not occur during the
reporting period.
(2). Changes in significant accounting estimates
□Applicable √Inapplicable
(3). The details of relevant items adjusted and implemented in the financial statements at the
beginning of the year upon the implementation of the New Financial Instrument Standards,
new income standards or new lease standards since 2020
√Applicable □Inapplicable
Consolidated Balance Sheet
Unit:Yuan Currency: RMB Item December 31, 2019 January 1, 2020 Adjustment number
Current assets:
Cash at bank and on hand 2,692,681,748.77 2,692,681,748.77
Settlement reserves
Lending funds
Trading financial assets
Derivative financial assets
Notes receivable 457,074,006.31 457,074,006.31
Accounts receivable 1,672,241,936.75 673,638,833.48 -998,603,103.27
Receivables financing 4,392,541,416.88 4,392,541,416.88
Advance payment 389,875,898.15 389,875,898.15
Premiums receivable
Reinsurance premium receivable
Reinsurance contract reserves
receivable
Other receivables 805,398,204.90 805,398,204.90
Including: interest receivable
Dividend receivable
Redemptory cash at bank and on
hand for sale
Inventories 2,415,680,873.20 2,415,680,873.20
Contract assets 998,603,103.27 998,603,103.27
Held-for-sale assets
Current portion of non-current
assets
Other current assets 917,830,014.66 917,830,014.66
Total current assets 13,743,324,099.62 13,743,324,099.62
Non-current assets:
Loans and advances
Debt investment
Investment in other debentures
Long-term receivables
Long-term equity investment 439,741,224.58 439,741,224.58
Other equity instrument
investments
153,385,357.94 153,385,357.94
Other non-current financial
assets
Investment real estate 107,112,223.47 107,112,223.47
Fixed assets 24,533,684,430.23 24,533,684,430.23
Construction in progress 3,587,311,808.76 3,587,311,808.76
Productive biological assets 2,417,050.59 2,417,050.59
Oil and gas assets
Right-of-use assets

2020 Annual Report
138 / 246
Intangible assets 1,709,753,019.31 1,709,753,019.31
Development expenditure
Goodwill 635,818,717.99 635,818,717.99
Long-term prepaid expenses 607,333,082.04 607,333,082.04
Deferred income tax assets 244,903,723.68 244,903,723.68
Other non-current assets 1,056,166,007.39 1,056,166,007.39
Total non-current assets 33,077,626,645.98 33,077,626,645.98
Total assets 46,820,950,745.60 46,820,950,745.60
Current liabilities:
Short-term loan 3,622,853,209.83 3,622,853,209.83
Borrowings from the central
bank
Loans from other banks
Trading financial liabilities
Derivative financial liabilities
Notes payable 5,294,623,239.24 5,294,623,239.24
Accounts payable 3,609,038,689.71 3,609,038,689.71
Advance receipt 1,571,445,278.97 50,307,264.28 -1,521,138,014.69
Contract liabilities 1,484,683,326.76 1,484,683,326.76
Financial assets sold for
repurchase
Deposits and placements from
other financial institutions
Customer brokerage deposits
Acting underwriting securities
Employee compensation payable 692,632,415.17 692,632,415.17
Taxes and fees payable 173,544,507.36 173,544,507.36
Other payables 613,261,268.85 613,261,268.85
Including: interest payable 53,828,469.22 53,828,469.22
Dividend payable 1,188,940.27 1,188,940.27
Fees and commissions payable
Reinsurance amounts payable
Held-for-sale liabilities
Non-current liabilities due within
one year
1,142,185,072.84 1,142,185,072.84
Other current liabilities 1,123,805,086.92 1,160,259,774.85 36,454,687.93
Total current liabilities 17,843,388,768.89 17,843,388,768.89
Non-current liabilities:
Insurance contract reserves
Long-term loan 4,088,988,505.70 4,088,988,505.70
Bonds payable 4,212,346,552.36 4,212,346,552.36
Including: preferred shares
Perpetual bond
Lease liabilities
Long-term payables 1,901,507,753.72 1,901,507,753.72
Long-term employee
compensation payable
Estimated liabilities
Deferred incomes 544,324,456.73 544,324,456.73
Deferred income tax liabilities 142,204,473.38 142,204,473.38
Other non-current liabilities
Total non-current liabilities 10,889,371,741.89 10,889,371,741.89
Total liabilities 28,732,760,510.78 28,732,760,510.78
Owners' equity (or shareholders' equity):
Paid-in capital (or share capital) 3,882,594,596.00 3,882,594,596.00
Other equity instruments 854,235,969.85 854,235,969.85
Including: preferred shares

2020 Annual Report
139 / 246
Perpetual bond
Capital reserves 5,672,664,800.50 5,672,664,800.50
Less: treasury shares
Other comprehensive income -31,800,201.05 -31,800,201.05
Special reserves 18,057,814.87 18,057,814.87
Surplus reserves 564,141,320.54 564,141,320.54
General risk provision
Undistributed profit 6,617,152,692.38 6,617,152,692.38
Total owners' equity (or
shareholders' equity) attributable to
the parent company
17,577,046,993.09 17,577,046,993.09
Non-controlling interest 511,143,241.73 511,143,241.73
Total owners' equity (or
shareholders' equity)
18,088,190,234.82 18,088,190,234.82
Total liabilities and owners’
equity (or shareholders’ equity)
46,820,950,745.60 46,820,950,745.60
Explanation of adjustment of each item:
□Applicable √Inapplicable
Balance Sheet of the Parent Company
Unit:Yuan Currency: RMB
Item December 31, 2019 January 1, 2020 Adjustment
number
Current assets:
Cash at bank and on hand 1,471,405,136.59 1,471,405,136.59
Trading financial assets
Derivative financial assets
Notes receivable 192,411,653.25 192,411,653.25
Accounts receivable 11,818,819.45 11,818,819.45
Receivables financing
Advance payment 20,317,564.39 20,317,564.39
Other receivables 12,954,465,620.37 12,954,465,620.37
Including: interest receivable
Dividend receivable 1,371,854.15 1,371,854.15
Inventories 286,015,214.02 286,015,214.02
Contract assets
Held-for-sale assets
Current portion of non-current
assets
Other current assets 18,065,477.24 18,065,477.24
Total current assets 14,954,499,485.31 14,954,499,485.31
Non-current assets:
Debt investment
Investment in other debentures
Long-term receivables 2,633,845,533.29 2,633,845,533.29
Long-term equity investment 10,949,592,149.18 10,949,592,149.18
Other equity instrument
investments
153,385,357.94 153,385,357.94
Other non-current financial
assets
Investment real estate 40,379,903.86 40,379,903.86
Fixed assets 338,148,583.81 338,148,583.81
Construction in progress 13,972,100.27 13,972,100.27
Productive biological assets
Oil and gas assets
Right-of-use assets
Intangible assets 72,308,833.45 72,308,833.45

2020 Annual Report
140 / 246
Development expenditure
Goodwill
Long-term prepaid expenses 28,898,156.41 28,898,156.41
Deferred income tax assets 1,833,741.44 1,833,741.44
Other non-current assets 4,559,373.00 4,559,373.00
Total non-current assets 14,236,923,732.65 14,236,923,732.65
Total assets 29,191,423,217.96 29,191,423,217.96
Current liabilities:
Short-term loan 2,796,114,779.39 2,796,114,779.39
Trading financial liabilities
Derivative financial liabilities
Notes payable 85,940,000.00 85,940,000.00
Accounts payable 138,318,934.51 138,318,934.51
Advance receipt 142,278,536.45 4,518,482.90 -137,760,053.55
Contract liabilities 137,648,472.21 137,648,472.21
Employee compensation
payable
115,251,165.67 115,251,165.67
Taxes and fees payable 4,670,323.26 4,670,323.26
Other payables 3,317,703,159.73 3,317,703,159.73
Including: interest payable 50,682,524.91 50,682,524.91
Dividend payable
Held-for-sale liabilities
Non-current liabilities due
within one year
62,384,300.00 62,384,300.00
Other current liabilities 1,099,583,333.30 1,099,694,914.64 111,581.34
Total current liabilities 7,762,244,532.31 7,762,244,532.31
Non-current liabilities:
Long-term loan 2,032,538,604.00 2,032,538,604.00
Bonds payable 4,212,346,552.36 4,212,346,552.36
Including: preferred shares
Perpetual bond
Lease liabilities
Long-term payables 1,575,898,885.36 1,575,898,885.36
Long-term employee
compensation payable
Estimated liabilities
Deferred incomes
Deferred income tax liabilities
Other non-current liabilities
Total non-current liabilities 7,820,784,041.72 7,820,784,041.72
Total liabilities 15,583,028,574.03 15,583,028,574.03
Owners' equity (or shareholders' equity):
Paid-in capital (or share capital) 3,882,594,596.00 3,882,594,596.00
Other equity instruments 854,235,969.85 854,235,969.85
Including: preferred shares
Perpetual bond
Capital reserves 6,646,802,814.79 6,646,802,814.79
Less: treasury shares
Other comprehensive income 6,697,557.94 6,697,557.94
Special reserves
Surplus reserves 564,141,320.54 564,141,320.54
Undistributed profit 1,653,922,384.81 1,653,922,384.81
Total owners' equity (or
shareholders' equity)
13,608,394,643.93 13,608,394,643.93
Total liabilities and
owners’ equity (or shareholders’
equity)
29,191,423,217.96 29,191,423,217.96

2020 Annual Report
141 / 246
Explanation of adjustment of each item:
□Applicable √Inapplicable
(4). Explanation of retroactive adjustment of comparative data in the earlier stage upon the
implementation of the New Financial Instrument Standards or the new leasing standards since
2020
□Applicable √Inapplicable
45. Others
□Applicable √Inapplicable
VI. Taxes
1. Main tax category and tax rates
Main tax category and tax rates
√Applicable □Inapplicable
Tax category Tax basis Tax rate
Added-value tax Sales amount 0%, 3%, 5%, 6%, 9%, 13%
Consumption tax
Business tax
Urban maintenance and
construction tax
Turnover tax payable 1%-7%
Enterprise income tax Taxable income 15%, 16.5%, 17%, 20%, 25%
Education surcharge Turnover tax payable 3%
Local education surcharge Turnover tax payable 2%
Land use tax Land use area Regulations on the location of each
company
Property tax Original value of real estate x 70%,
house rent
1.2%, 12%
For taxpayers with different enterprise income tax rates, the information note should be disclosed.
□Applicable √Inapplicable
2. Tax preference
√Applicable □Inapplicable
(1) Value-added tax
According to the provisions of CS [2001] No.121 document of the Ministry of Finance of the People's
Republic of China and State Taxation Administration, sales of feed are exempted from VAT.
Sichuan Yongxiang New Material Co., Ltd. implements the VAT policy of immediately refunding
70% upon payment for cement sales according to CS [2015] No. 78 document issued by the Ministry of
Finance and State Taxation Administration.
According to the Provisional Regulations of the People’s Republic of China on Value-Added Tax
(Order No. 538 of the State Council) and the Implementing Rules for Provisional Regulations of the People's Republic of China on Value-added Tax (Order No. 50 of the Ministry of Finance and the State
Taxation Administration), the self-produced agricultural products sold by agricultural producers shall be
exempted from VAT for the cultivation business of Nanjing Tongwei Aquatic Technology Co., Ltd. and
Chengdu Tongwei Aquatic Technology Co., Ltd.
According to the provisions of CS [2016] No. 36 document issued by the Ministry of Finance and
the State Taxation Administration, the Company will be exempted from VAT when it transfers the land
use right to agricultural producers for agricultural production from May 1, 2016.
(2) Enterprise income tax
1) Collective tax payment of parent company (including management headquarters and branches)
According to the Enterprise Income Tax Law and the Measures for the Administration of Collection of
Enterprise Income Tax on the Basis of Consolidation of Trans-regional Business Operations (Announcement No. 57, 2012 of the State Taxation Administration), the parent company shall implement

2020 Annual Report
142 / 246
the measures for the administration of collection of enterprise income tax of "unified calculation,
hierarchical management, local prepayment, consolidated liquidation and financial transfer".
2) Units enjoying preferential enterprise income tax rate in the development of the western region
According to the Notice of Tax Policy Issues Concerning Further Implementing the Western Development Strategy (CS [2011] No. 58) jointly issued by Ministry of Finance, the General
Administration of Customs of China and the State Taxation Administration, and the Notice on Issues
Concerning Enterprise Income Tax Relating to Further Implementing the Western Region Development Strategy (GS [2012] No. 12), corporate income tax will be levied at a reduced rate of 15% on encouraged
industrial enterprises located in the western region" from January 1, 2011 to December 31, 2020. Including
Tongwei Co., Ltd. Sichuan Branch, Deyang Branch, Special Feed Branch, Kunming Branch and its
subsidiaries, Chengdu Tongwei Animal Nutrition Technology Co., Ltd., Chengdu Ronglai Tongwei Feed
Co., Ltd., Tongwei Agricultural Finance Guarantee Co., Ltd., Chongqing Tongwei Feed Co., Ltd., Sichuan
Tongwei Feed Co., Ltd., Binyang Tongwei Feed Co., Ltd., Kunming Tongwei Feed Co., Ltd., Sichuan
Tongwei Sanlian Aquatic Products Co., Ltd., Chengdu Tongwei Sanxin Pharmaceutical Co., Ltd.,
Tongwei Industrial (Tibet) Co., Ltd., Sichuan Yongxiang Polycrystalline Silicon Co., Ltd., Sichuan
Yongxiang New Materials Co., Ltd., Sichuan Yongxiang New Energy Co., Ltd., Inner Mongolia Tongwei
High-purity Crystalline Silicon Co., Ltd., Yunnan Tongwei High-purity Crystalline Silicon Co., Ltd.,
Tongwei Solar ( Chengdu) Co., Ltd., Tongwei Solar (Meishan) Co., Ltd., Tongwei Solar (Jintang) Co.,
Ltd., Tongwei Solar (Pengshan) Co., Ltd., Tonghe New Energy (Jintang) Co., Ltd., Sichuan Yongxiang
Silicon Material Co., Ltd. and PV powerplant companies located in six provinces and autonomous regions
including Tibet, Qinghai, Gansu, Ningxia, Xinjiang, and Inner Mongolia.
3) Subsidiaries recognized as high-tech enterprises and enjoying the ratio of preferential enterprise
income tax rate of 15%.
Jieyang Yongxiang Co., Ltd. was recognized as a high-tech enterprise in 2018 with the Certificate
No. of GR201844001430.
Zhuhai Haiyi Aquatic Products Feed Co., Ltd. was recognized as a high-tech enterprise in 2018 with
the Certificate No. of GR201844005634.
Sichuan Willtest Technology Co., Ltd. was recognized as a high-tech enterprise in 2018 with the
Certificate No. of GR201851001142.
Tongwei Solar (Hefei) Co., Ltd. was recognized as a high-tech enterprise in 2018 with the Certificate
No. of GR201834001139.
Tongwei Solar (Anhui) Co., Ltd. was recognized as a high-tech enterprise in 2020 with the Certificate
No. of GR202034000630.
Sichuan Fishery-PV Wulian Technology Co., Ltd. was recognized as a high-tech enterprise in 2020
with the Certificate No. of GR202051001569.
Guangdong Tongwei Feed Co., Ltd. was recognized as a high-tech enterprise in 2020 with the
Certificate No. of GR202044000114.
4) Companies engaged in mariculture and inland culture and enjoying half of the enterprise income
tax
According to Article 86 of Regulation on the Implementation of the Enterprise Income Tax Law of
the People's Republic of China issued on December 6, 2007, the enterprise income tax shall be reduced
by half for the income of enterprises engaged in mariculture and inland culture projects. The enterprise
income tax of the below enterprises shall be collected in half: Hainan Haiyi Aquatic Seed Co., Ltd.,
Zhanjiang Haiyi Aquatic Seed Co., Ltd., Tongwei Fishery & PV Integration Rudong Co., Ltd., Chengdu
Tongwei Aquatic Seed Co., Ltd., Qingdao Hairen Aquatic Seed Industry Technology Co., Ltd., Nanjing
Tongwei Aquatic Products Technology Co., Ltd., Chengdu Tongwei Aquatic Technology Co., Ltd.
5) Overseas companies enjoying tax preference
According to document No. 218/2013/N-CP issued by the Vietnamese government on December 26,
2013, the statutory tax rate of enterprise income tax in Vietnam was reduced to 20% from January 1, 2016.
The tax preference policies enjoyed by Tongwei Vietnam Co., Ltd. are as follows: The main business of
feed is given a preferential tax rate of 10%, and non-main business income does not enjoy the preferential
tax policies. The preferential tax policies enjoyed by Heping Tongwei Co., Ltd. are as follows: a
preferential period of 10 years is given from the beginning of the production and operation period for the
main feed business, with 2-year free and 4-year half from the beginning of the profit period. The tax
preference policies enjoyed by Qianjiang Tongwei Co., Ltd. are as follows: a preferential period of 15
years is given from the beginning of the production and operation period for the main feed business, with

2020 Annual Report
143 / 246
a preferential tax rate of 10% during the preferential period and 4-year free and 9-year half from the
beginning of the profit period.
The interest income of the total bank deposit of Tongwei Feed Bangladesh Ltd. was levied with the
tax of 35% of income (10% of bank withholding); the non-business income was levied with the income
tax of 35% of income; the total profit apart from the interest and non-business income and expense is
levied in sections: 3% for 0-1 million Taka (including 1 million), 10% for 1-2 million Taka (including 2
million) and 15% for the part greater than 2 million.
6) Enjoy tax preference of public infrastructure projects which are key supported by the state
According to the Notice of the Ministry of Finance of the People’s Republic of China and State
Taxation Administration on Relevant Issues Concerning the Implementation of the Preferential Catalog of Enterprise Income Tax for Public Infrastructure Projects (CS 2008 [46]), the income from investment
and operation of enterprises engaged in public infrastructure projects supported by the State shall be
exempted from enterprise income tax from the first to the third year starting from the tax year in which
the first production and operation income of the project is obtained, and the enterprise income tax shall be
halved from the fourth to the sixth year.
According to the provisions of CS [2008] No. 116, the new solar power generation project approved
by the competent investment department of the government is a public infrastructure project. Now, the
new PV powerplant of the subsidiaries of Tongwei New Energy Co., Ltd. has been connected to the grid
for power generation, enjoying the preferential enterprise income tax policy of 3-year free and 3-year half.
3. Others
□Applicable √Inapplicable
VII. Notes to Items in Consolidated Financial Statement
1. Cash at bank and on hand
√Applicable □Inapplicable
Unit:Yuan Currency: RMB
Item Ending balance Beginning balance
Cash on hand 126,156.42 273,455.70
Bank deposits 5,972,818,689.87 1,752,248,881.07
Other monetary funds 291,223,395.74 940,159,412.00
Total 6,264,168,242.03 2,692,681,748.77
Including: total amount deposited
abroad
290,741,946.92 191,395,898.42
2. Trading financial assets
√Applicable □Inapplicable
Unit:Yuan Currency: RMB
Item Ending balance Beginning
balance
Financial assets that are measured at fair value and whose changes
are included in the current profit and loss
1,531,863,068.12
Including:
Debt instrument investment 1,500,000,000.00
Derivative financial assets 4,863,068.12
Equity instrument investment 27,000,000.00
Total 1,531,863,068.12
Other notes:
√Applicable □Inapplicable
(1) Debt instrument investment is the bank structured deposit purchased by the Company.
(2) Derivative financial assets are the book floating profit formed by the difference between the lock-
up exchange rate and the central bank exchange rate at the end of the period within the scope of the forward foreign exchange contract signed by the Company for export sales (hedging is invalid).

2020 Annual Report
144 / 246
(3) Equity instrument investment is that after Tongwei Industrial (Tibet) Co., Ltd., the company’s
wholly-owned subsidiaries, disposes of its 98% equity of Chengdu Tongwei Industrial Co., Ltd., it holds
2% of Chengdu Tongwei Industrial Co., Ltd. and it is measured at the fair value.
3. Derivative financial assets
□Applicable √Inapplicable
4. Notes receivable
(1). Classification list of notes receivable
√Applicable □Inapplicable
Unit:Yuan Currency: RMB
Item Ending balance Beginning balance
Bank's acceptance bill
Commercial acceptance bill
Letter of credit 530,962,356.27 457,074,006.31
Total 530,962,356.27 457,074,006.31
(2). Notes receivable pledged by the Company at the end of the period
□Applicable √Inapplicable
(3). Notes receivable which have been endorsed or discounted but not yet expired on the balance
sheet date at the end of the period
□Applicable √Inapplicable
(4). Notes to be transferred for accounts receivable due to the drawer’s failure of performance at
the end of the period
□Applicable √Inapplicable
(5). Classified disclosure by bad debt provision
□Applicable √Inapplicable
Provision for bad debt reserves is made individually:
□Applicable √Inapplicable
Provision for bad debt reserves is made by portfolio:
□Applicable √Inapplicable
If the provision for bad debt reserves is made according to the general model of expected credit loss,
please refer to the disclosure of other accounts receivable:
□Applicable √Inapplicable
(6). About provision for bad debt
□Applicable √Inapplicable
(7). About notes receivable actually written off in the current period
□Applicable √Inapplicable
Other notes
□Applicable √Inapplicable
5. Accounts receivable
(1). Disclosure by account receivable age
√Applicable □Inapplicable
Unit:Yuan Currency: RMB
Account receivable age Book balance at the end of the period
Subtotal within one year 768,043,510.20
1-2 years 205,912,333.28
2-3 years 156,044,975.56
Over 3 years 54,152,959.49
Total 1,184,153,778.53
(2). Classified disclosure by bad debt provision
√Applicable □Inapplicable

2020 Annual Report
145 / 246
Unit:Yuan Currency: RMB
Category
Ending balance Beginning balance
Book balance Bad debt provision
Book
value
Book balance Bad debt provision
Book
value Amount Proportion
(%) Amount
Proportion
of
provision
(%)
Amount Proportion
(%) Amount
Proportion
of
provision
(%)
Provision
for bad debt
reserves is
made
individually
79,183,407.43 6.69 791,834.07 1.00 78,391,573.36
Including:
Provision
for bad debt
reserves is
made by
portfolio
1,104,970,371.10 93.31 114,009,168.29 10.32 990,961,202.81 754,697,829.82 100.00 81,058,996.34 10.74 673,638,833.48
Including:
Portfolio 1 11,616,353.54 0.98 11,616,353.54 8,724,257.79 1.16 8,724,257.79
Portfolio 2 526,840,587.52 44.49 26,100,847.26 4.95 500,739,740.26 146,740,950.45 19.44 1,832,098.30 1.25 144,908,852.15
Portfolio 3 22,300.00 22,300.00
Portfolio 4 566,491,130.04 47.84 87,908,321.03 15.52 478,582,809.01 599,232,621.58 79.40 79,226,898.04 13.22 520,005,723.54
Total 1,184,153,778.53 100.00 114,801,002.36 9.69 1,069,352,776.17 754,697,829.82 100.00 81,058,996.34 10.74 673,638,833.48

2020 Annual Report
146 / 246
Provision for bad debt reserves is made individually:
√Applicable □Inapplicable
Unit:Yuan Currency:RMB
Name
Ending balance
Book balance Bad debt
provision
Proportion of
provision (%)
Reason for
provision
Bank guarantees overseas
feed payment
79,183,407.43 791,834.07 1.00 Note
Total 79,183,407.43 791,834.07 1.00 /
Explanation of provision for bad debt according to a single item:
√Applicable □Inapplicable
The customers of overseas feed companies are fully guaranteed by the local bank. When the payment
is due, the guarantee bank will pay for the goods without reason. The risk is low, so 1% is provided for
bad debt.
Provision for bad debt reserves is made by portfolio:
√Applicable □Inapplicable
Portfolio provision item: portfolio 1
Unit: Yuan Currency:RMB
Name
Ending balance
Accounts receivable Bad debt provision Proportion of
provision (%)
Unit 1 11,531,454.74
Tongwei Group Co., Ltd. 45,544.80
Unit 2 39,354.00
Total 11,616,353.54
Recognition standards and explanation of bad debt provision made by portfolio:
√Applicable □Inapplicable
The above receivables have been paid back after the period.
Portfolio provision item: portfolio 2
Unit:Yuan Currency:RMB
Name
Ending balance
Accounts receivable Bad debt provision Proportion of
provision (%)
Power supply company
(desulfurization electricity
price)
89,427,541.42
Subsidies of electricity price 437,413,046.10 26,100,847.26 5.97
Total 526,840,587.52 26,100,847.26 4.95
Recognition standards and explanation of bad debt provision made by portfolio:
√Applicable □Inapplicable
The desulfurization electricity price receivable was recovered in the next month, without risk, and no
provision for bad debt reserves was made. The electricity price subsidy in accounts receivable refers to
the electricity price subsidy receivable that has been included in the national subsidy catalog, and the
electricity price subsidy receivable that has not been included in the national subsidy catalog is listed and
reported in the contract assets.
Portfolio provision items: portfolio 3
Unit:Yuan Currency:RMB
Name
Ending balance
Accounts
receivable
Bad debt
provision
Proportion of
provision (%)
Tongwei Bioma (Wuxi) Biotechnology Co., Ltd. 22,300.00

2020 Annual Report
147 / 246
Total 22,300.00
Recognition standards and explanation of bad debt provision made by portfolio:
√Applicable □Inapplicable
The amount due from the parent company and the subsidiaries of the joint venture has no risk, and no
provision for bad debt reserves was made.
Portfolio provision items: portfolio 4
Unit:Yuan Currency: RMB
Name
Ending balance
Accounts receivable Bad debt provision Proportion of provision
(%)
Within one year 452,466,673.33 22,623,333.67 5.00
1-2 years 22,211,517.28 2,221,151.73 10.00
2-3 years 57,498,207.60 28,749,103.80 50.00
Over 3 years 34,314,731.83 34,314,731.83 100.00
Total 566,491,130.04 87,908,321.03 15.52
Recognition standards and explanation of bad debt provision made by portfolio:
√Applicable □Inapplicable
The recovery risk of such accounts receivable formed in the reporting period is related to the account
receivable age. Therefore, such portfolio accounts receivable shall be classified according to the account
receivable age, and the bad debt provision proportion corresponding to the account receivable age shall
be confirmed.
If the provision for bad debt reserves is made according to the general model of expected credit loss, please
refer to the disclosure of other accounts receivable:
□Applicable √Inapplicable
(3). About provision for bad debt
√Applicable □Inapplicable
Unit:Yuan Currency:RMB
Category Beginning
balance
Change amount in the current period
Ending balance Provision
Take back
or turn
back
Written off or
charged off Other changes
Single
provision
791,834.07 791,834.07
Risk
portfolio
81,058,996.34 18,852,264.31 782,843.04 10,935,954.67 24,251,019.27 114,009,168.29
Total 81,058,996.34 19,644,098.38 782,843.04 10,935,954.67 24,251,019.27 114,801,002.36
Note: other changes are the transfer of 24,326,281.11 yuan of contract asset impairment reserves and the
conversion difference in foreign currency statements -75,261.84 yuan.
Among them, the amount of bad debt provision recovery or reversal of the current period is important: √Applicable □Inapplicable
Unit:Yuan Currency:RMB Company name Amount recovered or reversed Recovery method
Client 1 200,000.00 Previous period of recovery
Client 2 195,416.91 Previous period of recovery
Client 3 108,000.00 Previous period of recovery
Client 4 78,482.00 Previous period of recovery
Other 7 clients 200,944.13 Previous period of recovery
Total 782,843.04 /

2020 Annual Report
148 / 246
(4). Accounts receivable actually written off in the current period
√Applicable □Inapplicable
Unit:Yuan Currency:RMB
Item Amount written off
Accounts receivable actually written off 18,300,349.95
About important accounts receivable written off among above accounts receivable
√Applicable □Inapplicable
Unit:Yuan Currency:RMB
Company name
Nature of
accounts
receivable
Amount
written off
Reasons for written
off
The written off
procedure
performed
Is the payment
caused by
related party
transaction
Client 1 Payment for
goods
5,456,681.12 Expected to be unable
to recover the
payment
Approval by
authority
No
Client 2 Customer
payment
2,000,018.13 Expected to be unable
to recover the
payment
Approval by
authority
No
Client 3 Payment for
goods
1,733,445.78 Expected to be unable
to recover the
payment
Approval by
authority
No
Client 4 Customer
payment
1,110,520.00 Expected to be unable
to recover the
payment
Approval by
authority
No
Other 63 clients 7,999,684.92 Expected to be unable
to recover the
payment
Approval by
authority
No
Total / 18,300,349.95 / / /
Explanation for accounts receivable written off:
□Applicable √Inapplicable
(5). About accounts receivable with top five ending balance collected as per the borrowers
√Applicable □Inapplicable
In the current period, accounts receivable with top five ending balance collected of the Company as
per the borrowers is RMB 363,868,985.41, accounting for 30.73% of the total ending balance of accounts
receivables, and the sum total of ending balance of provision for bad debt reserves made accordingly is
RMB 20,506,034.28.
(6). Accounts receivable derecognized due to transfer of financial assets
□Applicable √Inapplicable
(7). Assets and liabilities formed by the transfer of accounts receivable and continuous involvement
□Applicable √Inapplicable
Other notes:
√Applicable □Inapplicable
Accounts receivable are disclosed by business category as follows:
Business categories Book balance at
the end of the
period
Book balance at the
beginning of the
period
Accounts receivable from PV power generation business 526,840,587.52 146,740,950.45
Including: electricity price subsidy receivable 437,413,046.10 24,201,420.84
Accounts receivable from agricultural and animal husbandry
businesses such as feed and food processing 446,424,182.67 445,584,260.90
Accounts receivable from silicon materials and wafers, cells,
modules and related chemical businesses 210,889,008.34 162,372,618.47
Total 1,184,153,778.53 754,697,829.82

2020 Annual Report
149 / 246
6. Receivables financing
√Applicable □Inapplicable
Unit:Yuan Currency:RMB Item Ending balance Beginning balance
Bank acceptance bill 9,711,898,567.92 4,392,541,416.88
Total 9,711,898,567.92 4,392,541,416.88
Changes in the financing of receivables and changes in fair value during the current period:
√Applicable □Inapplicable
The ending balance of receivable financing increased significantly compared with the beginning
balance, mainly due to the expansion of the company's business scale, the increase of the company's
membership in the "bill pool", and the increase in the holding of pledged bank acceptance bills into the
pool at the end of the period. If the remaining term of a banker's acceptance bill is short and the book
balance is close to the fair value, the book value shall be taken as its fair value.
If the provision for bad debt reserves is made according to the general model of expected credit loss,
please refer to the disclosure of other accounts receivable:
□Applicable √Inapplicable
Other notes:
√Applicable □Inapplicable
(1) At the end of the period, the banker's acceptance bill pledged by the Company was RMB
9,511,995,347.19.
(2) The banker's acceptance bill endorsed at the end of the period but not yet due on the balance sheet
date is RMB 2,674,041,235.59.
(3) The banker's acceptance bill discounted at the end of the period but not yet due on the balance
sheet date is RMB 170,995,392.75.
As the endorser of banker's acceptance bill endorsed or discounted at the end of the period but not yet due
on the balance sheet date is a commercial bank, it has been derecognized due to the low possibility of not
being paid at maturity and the low possibility of being claimed. However, if the bill fails to be paid at the
due date, the Company will be jointly and severally liable to the holder in accordance with the provisions
of the Law of the People's Republic of China on Negotiable Instruments.
(4) At the end of the period, the Company has no accounts receivable financing transferred to
accounts receivable due to the drawer's inability to perform.
7. Advance payment
(1). Advances presented by account receivable age
√Applicable □Inapplicable
Unit:Yuan Currency: RMB
Account
receivable age
Ending balance Beginning balance
Amount Proportion (%) Amount Proportion (%)
Within one year 1,103,470,579.96 99.10 368,504,327.50 94.52
1-2 years 5,066,523.70 0.46 8,124,275.14 2.08
2-3 years 3,006,226.96 0.27 4,848,235.52 1.24
Over 3 years 1,915,547.75 0.17 8,399,059.99 2.16
Total 1,113,458,878.37 100.00 389,875,898.15 100.00
Explanation of the reason for no settlement of advances with the account receivable age over one year
with significant amount:
No advances with the account receivable age over one year and with significant amount.
(2). About advances to suppliers with top five ending balance collected as per the suppliers
√Applicable □Inapplicable
The advances to suppliers from top five of prepaid parties classified based on the ending balance totals RMB 848,184,426.71 in the current period of the Company, accounting for 76.18% of the total
ending balance of the advances to suppliers.

2020 Annual Report
150 / 246
Other notes
√Applicable □Inapplicable
About no advances written off in the current period:
8. Other receivables
Item presentation
√Applicable □Inapplicable
Unit:Yuan Currency: RMB
Item Ending balance Beginning balance
Interest receivable
Dividend receivable
Other receivables 797,517,755.34 805,398,204.90
Total 797,517,755.34 805,398,204.90
Other notes:
□Applicable √Inapplicable
Interest receivable
(1). Classification of interest receivable
□Applicable √Inapplicable
(2). Important overdue interest
□Applicable √Inapplicable
(3). About provision for bad debt
□Applicable √Inapplicable
Other notes: □Applicable √Inapplicable
Dividend receivable
(4). Dividend receivable
□Applicable √Inapplicable
(5). Significant dividends receivable with account receivable age over one year
□Applicable √Inapplicable
(6). About provision for bad debt
□Applicable √Inapplicable
Other notes:
□Applicable √Inapplicable
Other receivables
(7). Disclosure by accocunt receivable age
√Applicable □Inapplicable
Unit:Yuan Currency:RMB Account receivable age Book balance at the end of the period
Subtotal within one year 546,205,057.32
1-2 years 147,856,656.75
2-3 years 84,086,571.13
Over 3 years 53,219,395.64
Total 831,367,680.84
(8). About classification by payment nature
√Applicable □Inapplicable
Unit:Yuan Currency:RMB
Payment nature Book balance at the end of the
period
Book balance at the beginning of the
period

2020 Annual Report
151 / 246
Related party transactions 19,270,158.40
Deposit 374,102,261.00 398,401,780.75
Insurance compensation 306,340,731.68 81,290,287.57
Government subsidies 33,827,768.05 88,069,646.08
Asset disposal 115,929,359.00
Others 117,096,920.11 134,188,429.02
Total 831,367,680.84 837,149,660.82
(9). About provision for bad debt
√Applicable □Inapplicable
Unit:Yuan Currency:RMB
Bad debt provision
Stage 1 Stage 2 Stage 3
Total Expected
credit loss in
the future 12
months
Expected credit
loss within whole
duration (no credit
impairment occur)
Expected credit
loss within
whole duration
(credit
impairment has
occurred)
Balance on January 1, 2020 18,846,592.95 12,904,862.97 31,751,455.92
The balance on January 1, 2020 is
in the current period
--Be transferred to Stage 2
--Be transferred to Stage 3 -930,559.12 930,559.12
--Be transferred back to Stage 2
--Be transferred back to Stage 1
Provision in the current period -607,132.16 3,663,082.05 2,539,816.16 5,595,766.05
Amount transferred back in the
current period
Written off in the current period
Charged off in the current period -3,470,375.28 -3,470,375.28
Other changes -26,921.19 -26,921.19
20Balance on January 1, 2020 17,308,901.67 16,541,023.83 33,849,925.50
Explanation of significant changes in the book balance of other accounts receivable changed due to loss
reserves in the current period:
□Applicable √Inapplicable
The provision amount of bad debt reserves in the current period and the basis for assessing whether the
credit risk of financial instruments has increased significantly:
□Applicable √Inapplicable
(10). About provision for bad debt
√Applicable □Inapplicable
Unit:Yuan Currency:RMB
Category Beginning
balance
Change amount in the current period
Ending
balance Provision
Accounts
recovered
or
transferred
back
Amounts
written off
or charged
off
Other
changes
Other
receivables
31,751,455.92 5,595,766.05 3,470,375.28 -26,921.19 33,849,925.50
Total 31,751,455.92 5,595,766.05 3,470,375.28 -26,921.19 33,849,925.50
Significant bad debt reserves recovered or reversed among above accounts receivable:
□Applicable √Inapplicable
(11). About other accounts receivable actually written off in the current period
√Applicable □Inapplicable
Unit:Yuan Currency: RMB

2020 Annual Report
152 / 246
Item Amount written off
Other accounts receivable actually written off 3,470,375.28
About other significant accounts receivable written off among above receivables:
√Applicable □Inapplicable
Unit:Yuan Currency: RMB
Company name
Nature of
other
receivables
Amount
written off
Reasons for written
off
The written
off procedure
performed
Is the payment
caused by
related party
transaction
Client 1 Payment 2,758,071.80 Expected to be
unable to recover the
payment
Approval by
authority
No
Client 2 Payment 391,832.39 Expected to be
unable to recover the
payment
Approval by
authority
No
Other 25 clients Payment 320,471.09 Expected to be
unable to recover the
payment
Approval by
authority
No
Total / 3,470,375.28 / / /
Explanation of other accounts receivable written off:
□Applicable √Inapplicable
(12). About other accounts receivable with top five ending balance collected as per the borrowers
√Applicable □Inapplicable
Unit:Yuan Currency: RMB
Company
name
Nature of
payment Ending balance
Account
receivable
age
Proportion in
total ending
balance of other
accounts
receivable (%)
Ending balance
of bad debt
provision
Unit 1 Insurance
compensation
304,013,794.38 Within one
year
36.57
Unit 2 Deposit 109,657,265.22 Note 13.19
Unit 3 Deposit 52,000,000.00 Within one
year
6.25
Unit 4 Government
subsidies
33,827,768.05 Within one
year
4.07
Unit 5 Deposit 31,011,529.88 1-2 years 3.73 3,101,152.99
Total / 530,510,357.53 / 63.81 3,101,152.99
Note: at the end of the period, the amount of deposit receivable of Company 2 with the account receivable
age within one year is RMB 82,218,606.36 and the one with the account receivable age of 1-2 years is
RMB 27,438,658.86.
(13). Accounts receivable involving government subsidies
√Applicable □Inapplicable
Unit:Yuan Currency: RMB
Company name
Name of the
projects under the
subsidy of the
government
Ending balance
The account
receivable age at
the end of the
year
Estimated time,
amount and basis
for collection
Unit 1 Production
incentives and
interest subsidy
33,827,768.05 Within one year Note
Other notes

2020 Annual Report
153 / 246
Note: the balance of the current period shall be determined according to the notice issued by the
government or the agreement signed with the government, and it is expected to be recovered within one
year.
(14). Other accounts receivable derecognized due to transfer of financial assets
□Applicable √Inapplicable
(15). Assets and liabilities formed by the transfer of other accounts receivable and continuous
involvement
□Applicable √Inapplicable
Other notes: √Applicable □Inapplicable
The ending balances of other receivables are disclosed as follows according to the method of accruing
bad debt:
Category
Book balance Bad debt provision
Book value Amount
Proportion
(%) Amount
Proportion
(%)
Provision for bad debt
reserves is made
individually
13,403,851.90 1.61 3,080,959.56 22.99 10,322,892.34
Provision for bad debt
reserves is made by
portfolio
817,963,828.94 98.39 30,768,965.94 3.76 787,194,863.00
Including: portfolio1 610,282,004.34 73.41 610,282,004.34
Portfolio 2 43,139,875.58 5.19 43,139,875.58
Portfolio 3
Portfolio 4 164,541,949.02 19.79 30,768,965.94 18.70 133,772,983.08
Total 831,367,680.84 100.00 33,849,925.50 4.07 797,517,755.34
① Accounts receivable with single-item provision for bad debt are mainly from Tianmen Jianhua
Agricultural Technology Development Co., Ltd. (Chen Jianhua). In 2016, due to the death of Chen Jianhua,
Tianmen Jianhua Agricultural Technology Development Co., Ltd. (hereinafter referred to as "Jianhua
Technology") and Tianmen Changfeng Aquatic Products Technology Development Co., Ltd. (hereinafter
referred to as "Changfeng Technology") became insolvent. The company signed the "Repayment
Agreement" with Jianhua Technology, Changfeng Technology and Tianmen Industrial Park Management
Committee (hereinafter referred to as the "Tianmen Park Management Committee"). The agreement
stipulates: (1) Tianmen Park Management Committee recovers the land and fish ponds in the Lake
Management Bureau and pays the related expenses, and then leases back to the Company. When the
Company pays the land lease fee of the Tianmen Park Management Committee every year, the debt of
Jianhua Technology, Changfeng Technology and Chen Jianhua are directly deducted; (2) Repayment plan
is to repay 1 million yuan per year in 2016-2018, 1.5 million yuan in 2019-2027, and 593,900 yuan in
2028. So now the priority debt has been repaid. This amount of arrears is different from the arrears of
normal sales of goods, so it is adjusted to other receivables for presentation. Due to the financing nature
of this business, the Company discounted future cash flows at an approximate financing cost of 5% as the
estimated recoverable amount, and confirmed the provision for bad debt based on the book balance minus
the estimated recoverable amount.
② Portfolio1, risk-free other receivables, mainly margins, reserves funds, etc. During the settlement
period, this part of the funds is risk-free, and no bad debt provision is made.
③ Portfolio 2, other receivables due from relevant government departments. This part of the payment
is expected to be recovered or settled within the next year, without risk, and no provision for bad debt is
made.
④Portfolio 4, other accounts receivable with provision for bad debt based on account receivable age
analysis:
Account receivable age Accounts receivable Bad debt provision Proportion of provision
(%)
Within one year 74,228,094.88 3,711,404.74 5.00
1-2 years 65,958,345.95 6,595,834.59 10.00
2-3 years 7,787,563.17 3,893,781.59 50.00

2020 Annual Report
154 / 246
Over 3 years 16,567,945.02 16,567,945.02 100.00
Total 164,541,949.02 30,768,965.94 18.70
9. Inventories
(1). Classification of inventories
√Applicable □Inapplicable
Unit:Yuan Currency:RMB
Item
Ending balance Beginning balance
Book balance
inventory falling
price
reserves/contract
performance cost
impairment
provision
Book value Book balance
inventory falling
price
reserves/contract
performance cost
impairment
provision
Book value
Raw materials 1,531,391,779.83 489,807.98 1,530,901,971.85 1,405,377,795.52 1,217,986.56 1,404,159,808.96
Products in
process 134,560,573.85 134,560,573.85 126,585,602.14 1,839,106.85 124,746,495.29
Packaging
materials 24,496,956.01 24,496,956.01 27,159,929.72 27,159,929.72
Inventory goods 543,565,920.80 15,850,096.94 527,715,823.86 533,654,835.00 913,689.20 532,741,145.80
Revolving
materials 49,567,023.61 49,567,023.61 44,256,832.22 44,256,832.22
Consumptive
biological assets 59,442,936.26 7,843,337.72 51,599,598.54 62,983,936.02 62,983,936.02
Goods in transit 176,229.12 176,229.12 19,726,871.83 19,726,871.83
Consigned
processing
materials
20,178,791.68 20,178,791.68 462,980.07 462,980.07
Contract
performance cost 10,687,934.60 10,687,934.60 33,607,256.58 33,607,256.58
Release products 426,536,846.43 3,344,221.57 423,192,624.86 165,835,616.71 165,835,616.71
Total 2,800,604,992.19 27,527,464.21 2,773,077,527.98 2,419,651,655.81 3,970,782.61 2,415,680,873.20
(2). Inventory falling price reserves and contract performance cost impairment provision
√Applicable □Inapplicable
Unit:Yuan Currency:RMB
Item Beginning
balance
Amount increased in the
current period
Amount decreased in the
current period
Ending
balance Provision Others
Amount
transferred
back or
charged off
Others
Raw materials 1,217,986.56 -728,178.58 489,807.98
Products in process 1,839,106.85 335,440.68 2,174,547.53
Inventory goods 913,689.20 16,802,156.56 1,865,748.82 15,850,096.94
Revolving materials
Consumptive
biological assets
7,843,337.72 7,843,337.72
Contract
performance cost
Release products 3,344,221.57 3,344,221.57
Total 3,970,782.61 27,596,977.95 4,040,296.35 27,527,464.21
(3). Explanation of ending balance of inventories containing capitalization amount of loan costs
□Applicable √Inapplicable
(4). Explanation of the current amortization amount of contract performance costs
□Applicable √Inapplicable
Other notes √Applicable □Inapplicable

2020 Annual Report
155 / 246
The basis for the provision for inventory falling price reserves for raw materials, products in process and
inventory products is the estimated net realizable value.
10. Contract assets
(1). Contract assets
√Applicable □Inapplicable
Unit:Yuan Currency:RMB
Item
Ending balance Beginning balance
Book balance Preparation
for provision Book value Book balance
Preparation
for provision Book value
Subsidies
of
electricity
price
1,051,832,084.69 63,151,888.03 988,680,196.66 1,067,789,336.53 69,186,233.26 998,603,103.27
Total 1,051,832,084.69 63,151,888.03 988,680,196.66 1,067,789,336.53 69,186,233.26 998,603,103.27
Note: the electricity price subsidy for contract asset presentation is the electricity price subsidy
receivable that has not been included in the national subsidy catalog. The electricity price subsidy
receivable that has been included in the national subsidy catalog is listed in accounts receivable.
(2). The amount and reason for the significant change in the book value during the reporting period
□Applicable √Inapplicable
(3). Provision for impairment of contract assets in the current period
□Applicable √Inapplicable
If the provision for bad debt reserves is made according to the general model of expected credit loss,
please refer to the disclosure of other accounts receivable:
□Applicable √Inapplicable
Other notes: √Applicable □Inapplicable (1) Provision for impairment of contract assets:
Category
Ending balance Beginning balance
Book balance Bad debt
provision Proportion Book balance
Bad debt
provision Proportion
Subsidies
of
electricity
price
1,051,832,084.69 63,151,888.03 6.00% 1,067,789,336.53 69,186,233.26 6.48%
(2) Changes in provision for impairment of contract assets:
Category Beginning balance Provision in the
current period
Other changes Ending balance
Subsidies of
electricity price 69,186,233.26 18,291,935.88 -24,326,281.11 63,151,888.03
Note: the other changes are the PV powerplants included in the national subsidy catalog in 2020, and the
corresponding electricity price subsidies and impairment provisions are transferred to accounts receivable
and bad debt provisions for accounts receivable.
11. Held-for-sale assets
□Applicable √Inapplicable
12. Current portion of non-current assets
□Applicable √Inapplicable
Significant debt investment and other debt investment at the end of the period:
□Applicable √Inapplicable
13. Other current assets
√Applicable □Inapplicable Unit:Yuan Currency: RMB
Item Ending balance Beginning balance

2020 Annual Report
156 / 246
Contract acquisition cost
Receivable return cost
Credit input tax/prepaid value-added
tax
800,167,237.49 859,897,264.88
Prepaid corporate income tax 9,202,582.48 49,831,097.37
Prepaid dividends for poverty
alleviation projects of PV
powerplants
655,750.06 6,199,500.00
Prepaid interest 411,938.30
Prepay other taxes and fees 135,144.66 1,902,152.41
Total 810,572,652.99 917,830,014.66
14. Debt investment
(1). About debt investments
□Applicable √Inapplicable
(2). Significant debt investments at the end of the period
□Applicable √Inapplicable
(3). About provisions for impairment reserves
□Applicable √Inapplicable
The amount of provision for impairment reserves in the current period and the basis for assessing if the
credit risk of financial instruments increases significantly
□Applicable √Inapplicable
Other notes
□Applicable √Inapplicable
15. Investment in other debentures
(1). Investment in other debentures
□Applicable √Inapplicable
(2). Significant other debt investments at the end of the period
□Applicable √Inapplicable
(3). About provisions for impairment reserves
□Applicable √Inapplicable
The amount of provision for impairment reserves in the current period and the basis for assessing if the
credit risk of financial instruments increases significantly
□Applicable √Inapplicable
Other notes:
□Applicable √Inapplicable
16. Long-term receivables
(1). Long-term accounts receivable
□Applicable √Inapplicable
(2). About provision for bad debt
□Applicable √Inapplicable
The provision amount of bad debt reserves in the current period and the basis for assessing whether the
credit risk of financial instruments has increased significantly:
□Applicable √Inapplicable
(3). Long-term accounts receivable derecognized due to transfer of financial assets
□Applicable √Inapplicable
(4). Assets and liabilities formed by the transfer of long-term accounts receivable and continuous
involvement
□Applicable √Inapplicable
Other notes
□Applicable √Inapplicable
2020 Annual Report
157 / 246
17. Long-term equity investment
√Applicable □Inapplicable

2020 Annual Report
158 / 246
Unit:Yuan Currency: RMB
Investee
Beginning
balance
Increase/decrease in the current period
Ending balance
Ending balance of
impairment
reserves
Additional investment
Reduced investment
Investment profit
or loss recognized under
equity method
Adjustm
ents in
other compreh
ensive
income
Other
equity
changes
Cash dividend
or profit declared to
distribute
Provision for
impairment
reserves
Others
I. Joint Ventures
Shaoxing Tongwei Jiuding Feed
Co., Ltd. 5,363,465.90 374,442.93 5,737,908.83
Hefei Tongwei Jiuding Feed Co.,
Ltd. 5,570,133.37 -341,236.30 5,228,897.07
Maoming Tongwei Jiuding Feed
Co., Ltd. 9,083,496.02 674,274.34 9,757,770.36
Huangmei Tongwei Jiuding
Fodder Co., Ltd. 4,105,011.98 -390,230.55 3,714,781.43
Tongwei Bioma (Wuxi)
Biotechnology Co., Ltd. 104,632,791.70 -3,407,482.28 101,225,309.42
Jiangsu Yanhai Tongwei Fuyun
New Energy Co., Ltd. 4,441,511.27 4,410,114.75 -31,396.52
Subtotal 133,196,410.24 4,410,114.75 -3,121,628.38 125,664,667.11 II. Joint ventures
Lijiang LONGi Silicon Materials
Co., Ltd. 224,746,085.31 52,989,624.97 8,196.83 95,165,451.22 182,578,455.89
Zhongwei New Energy
(Chengdu) Co., Ltd. 81,798,729.03 -27,161,103.80 54,637,625.23
Bohai Aquatic Products Co., Ltd. 100,055,700.00 100,055,700.00
Suzhou Taiyangjing New Energy
Co., Ltd. 15,000,000.00 -200,366.01 14,799,633.99
Subtotal 306,544,814.34 115,055,700.00 25,628,155.16 8,196.83 95,165,451.22 352,071,415.11
Total 439,741,224.58 115,055,700.00 4,410,114.75 22,506,526.78 8,196.83 95,165,451.22 477,736,082.22
Other notes
(1) On July 9, 2020, Tongwei Huijin New Energy Co., Ltd., a holding subsidiary of Tongwei New Energy Co., Ltd., a wholly-owned subsidiary of the company,
signed an equity transfer agreement with Jiangsu Coastal Development Investment Co., Ltd. to transfer its holdings; all equity of the joint venture, Jiangsu Coastal
Tongwei Fuyun New Energy Co., Ltd. is transferred, and all equity changes procedures were completed in July 2020.
(2) In December 2020, the Company invested 100,055,700.00 yuan in Bohai Aquatic Products Co., Ltd., subscribed for 10,390,000 shares, and held 9.10% of
the equity of Bohai Aquatic Products Co., Ltd. The articles of association of Bohai Aquatic Products Co., Ltd. stipulate that there are 6 members of the board of
directors, and the Company appoints one. In summary, the Company has a significant impact on the production and operation of Bohai Aquatic Products Co., Ltd., so
the accounting is carried out according to the equity method.

2020 Annual Report
159 / 246
(3) Suzhou Taiyangjing New Energy Co., Ltd. was established on April 25, 2017. Tongwei Solar, a subsidiary of the Company, paid an investment of
15,000,000.00 yuan in 2020. In addition to the subscribed registered capital of 1,315,750.00 yuan, 13,684,250.00 yuan was included in the capital reserves of Suzhou
Taiyangjing New Energy Co., Ltd.
(4) There are no significant restrictions on the realization of the Company's investment and the remittance of investment income.
(5) The book value of each long-term equity investment of the Company at the end of the period is lower than its recoverable amount, so no provision for the
impairment of long-term equity is made.

2020 Annual Report
160 / 246
18. Other equity instrument investments
(1). Other equity instrument investments
√Applicable □Inapplicable
Unit:Yuan Currency:RMB
Item Ending balance Beginning balance
Chengdu Tongwei Property Co., Ltd. 153,445,100.85 153,385,357.94
Total 153,445,100.85 153,385,357.94
(2). About non-marketable equity instrument investment
√Applicable □Inapplicable
Unit:Yuan Currency: RMB
Item
Dividend
income
recognized
in the
current
period
Accrued
gains
Accrued
losses
Amount
transferred
from other
comprehensive
income to
retained
earnings
Measured at
designated fair value
with their changes
included in other
comprehensive
income
Reasons for
transfer of
other
comprehensive
income to
retained
earnings
Chengdu Tongwei
Property Co., Ltd.
6,757,300.85
Based on the mode of
the management used
to manage the asset
Other notes:
□Applicable √Inapplicable
19. Other non-current financial assets
√Applicable □Inapplicable
Unit:Yuan Currency: RMB
Item Ending balance Beginning balance
Sichuan Electric Power Trading Center Co., Ltd. 1,258,097.00
Total 1,258,097.00
Other notes:
√Applicable □Inapplicable
Note: Sichuan Tongwei Green Energy Power Co., Ltd., a subsidiary of the Company, has a
shareholding ratio of 1.25% in the equity investment in Sichuan Power Exchange Center. It has no board
of directors and cannot have a significant impact on the Company. Therefore, it is classified as fair value
and the changes are included in the financial assets of the current profit and loss. Because the Company
intends to hold the equity of Sichuan Electric Power Exchange Center Co., Ltd. for a long time, it is listed
in the item of "other non-current financial assets".
20. Investment real estate
Measurement model of investment properties
(1). Investment properties measured at cost
Unit:Yuan Currency: RMB
Item Houses and
buildings Land use right
Construction in
progress Total
I. Original book value
1.Beginning balance 147,370,436.43 21,630,000.00 169,000,436.43
2.Amount increased in the
current period
(1) Outsourcing
(2) Transferred from inventory
/ fixed assets / construction in
progress

2020 Annual Report
161 / 246
(3) Increase due to business
merger
3.Amount decreased in the
current period
(1) Disposal
(2) Other transfer-out
4.Ending balance 147,370,436.43 21,630,000.00 169,000,436.43
II. Accumulated depreciation and
accumulated amortization
1.Beginning balance 24,497,378.54 8,023,927.57 32,521,306.11
2.Amount increased in the
current period
3,508,066.64 611,108.68 4,119,175.32
(1) Provision or amortization 3,508,066.64 611,108.68 4,119,175.32
3.Amount decreased in the
current period
(1) Disposal
(2) Other transfer-out
4.Ending balance 28,005,445.18 8,635,036.25 36,640,481.43
III. Impairment reserves
1.Beginning balance 29,366,906.85 29,366,906.85
2.Amount increased in the
current period
(1) Provision
3. Amount decreased in the
current period
(1) Disposal
(2) Other transfer-out
4.Ending balance 29,366,906.85 29,366,906.85
IV. Book Value
1.Book value at the end of the
period
89,998,084.40 12,994,963.75 102,993,048.15
2.Book value at the beginning
of the period
93,506,151.04 13,606,072.43 107,112,223.47
(2). About investment real estates which property certificates are not obtained
□Applicable √Inapplicable
Other notes
□Applicable √Inapplicable
21. Fixed assets
Item presentation
√Applicable □Inapplicable
Unit:Yuan Currency: RMB Item Ending balance Beginning balance
Fixed assets 29,818,556,732.35 24,531,015,710.34
Liquidation of fixed assets 11,045,892.65 2,668,719.89
Total 29,829,602,625.00 24,533,684,430.23
Other notes:
□Applicable √Inapplicable
Fixed assets
(1). About fixed assets
√Applicable □Inapplicable
Unit:Yuan Currency: RMB

2020 Annual Report
162 / 246
Item Houses and
buildings
Machinery
equipment
PV power
generation
equipment
Means of
transport
Office
equipment Total
I. Original book value:
1.Beginning
balance 7,563,864,986.86 16,965,400,812.76 7,052,861,940.08 227,981,091.33 245,979,498.82 32,056,088,329.85
2.Amount
increased in the current
period
1,639,888,391.14 4,227,072,347.45 2,309,991,978.65 80,924,583.45 65,909,723.06 8,323,787,023.75
(1) Purchase 183,202,457.18 5,676,302.58 81,683,568.15 35,139,533.58 305,701,861.49
(2) Transferred
from construction in
progress
1,615,901,114.48 4,058,713,285.48 2,423,230,715.30 16,338,499.41 8,114,183,614.67
(3) Increase due
to business merger 74,820,609.19 74,820,609.19
(4) Adjustment
of final settlement of
account
42,331,861.78 1,705,845.62 -193,735,648.42 83,991.85 15,566,240.43 -134,047,708.74
(5) Exchange
rate changes -18,344,585.12 -16,549,240.83 -842,976.55 -1,134,550.36 -36,871,352.86
3.Amount
decreased in the current
period
144,752,805.44 880,170,366.73 2,450,169.74 42,938,721.38 14,529,210.91 1,084,841,274.20
(1) Disposal or
scrapping 131,506,111.60 879,476,051.61 2,450,169.74 42,332,326.38 13,393,884.61 1,069,158,543.94
(2) Decrease in
disposal of subsidiaries 13,246,693.84 694,315.12 606,395.00 1,135,326.30 15,682,730.26
4.Ending balance 9,059,000,572.56 20,312,302,793.48 9,360,403,748.99 265,966,953.40 297,360,010.97 39,295,034,079.40
II. Accumulated
depreciation
1.Beginning
balance 1,695,079,321.24 4,382,239,178.70 453,760,986.16 142,329,010.12 150,826,787.36 6,824,235,283.58
2.Amount
increased in the current
period
347,252,189.36 1,607,806,593.95 309,518,862.15 30,154,365.22 36,385,801.34 2,331,117,812.02
(1) Provision 351,165,801.06 1,613,054,797.03 315,825,021.58 30,608,536.99 32,690,690.27 2,343,344,846.93
(2) Increase due
to business merger
9,112,866.95 9,112,866.95
(3) Adjustment
of final settlement of
account
-161,118.92 1,440,044.88 -15,419,026.38 51,899.44 4,341,380.07 -9,746,820.91
(4) Exchange
rate changes
-3,752,492.78 -6,688,247.96 -506,071.21 -646,269.00 -11,593,080.95
3.Amount
decreased in the current
period
55,963,544.42 458,328,118.41 690,738.41 36,847,096.47 11,763,474.33 563,592,972.04
(1) Disposal or
scrapping 47,392,254.77 457,696,307.99 690,738.41 36,271,021.22 10,753,298.07 552,803,620.46
(2) Decrease in
disposal of subsidiaries
8,571,289.65 631,810.42 576,075.25 1,010,176.26 10,789,351.58
4.Ending balance 1,986,367,966.18 5,531,717,654.24 762,589,109.90 135,636,278.87 175,449,114.37 8,591,760,123.56
III. Impairment
reserves
1.Beginning
balance 145,998,642.91 554,276,420.34 32,124.08 530,148.60 700,837,335.93
2.Amount
increased in the current
period
7,368,425.66 221,877,025.60 229,245,451.26
(1) Provision 221,877,025.60 221,877,025.60
(2) Transferred
from construction in
progress
7,368,425.66 7,368,425.66
3.Amount
decreased in the current
period
45,343,658.75 21,904.95 45,365,563.70

2020 Annual Report
163 / 246
(1) Disposal or
scrapping 45,343,658.75 21,904.95 45,365,563.70
4.Ending balance 153,367,068.57 508,932,761.59 221,877,025.60 10,219.13 530,148.60 884,717,223.49
IV. Book Value
1.Book value at
the end of the period 6,919,265,537.81 14,271,652,377.65 8,375,937,613.49 130,320,455.40 121,380,748.00 29,818,556,732.35
2.Book value at
the beginning of the
period
5,722,787,022.71 12,028,885,213.72 6,599,100,953.92 85,619,957.13 94,622,562.86 24,531,015,710.34
①The decrease in disposal of subsidiaries is due to the Company’s wholly-owned subsidiaries,
Tongwei Industrial (Tibet) Co., Ltd. transferring its wholly-owned subsidiary Chengdu Tongwei Industrial
Co., Ltd. equity in July 2020. On December 31, 2020, Chengdu Tongwei Industrial Co., Ltd. is no longer
included in the scope of consolidation.
②The adjustment of the final accounts for completion is mainly the adjustment of the original pre-
transferred fixed assets in the final accounts of the completion of the PV powerplant.
③The original value of fixed assets of 74,820,609.19 yuan was merged and increased in the current
merger; and it was formed by the acquisition of Zibo Huixiang New Energy Co., Ltd. by Tongwei New
Energy (Shenzhen) Co., Ltd., a holding subsidiary of Tongwei New Energy Co., Ltd., a wholly-owned
subsidiary of the Company.
④The provision for impairment of fixed assets was RMB 221,877,025.60, which was the provision
for impairment of PV powerplants owned by the Company. For details, please refer to "Impairment Loss
of PV Powerplants". There is no sign of impairment for other fixed assets at the end of the period, so no
impairment provision has been made.
(2). About temporarily idle fixed assets
√Applicable □Inapplicable
Unit:Yuan Currency: RMB
Item Original book
value
Accumulated
depreciation
Preparation for
provision Book value Remarks
Houses and
buildings
50,795,741.48 34,707,015.51 16,088,725.97
Machinery
equipment
28,510,257.82 24,912,184.82 3,598,073.00
Transportation
equipment
978,040.00 924,504.37 53,535.63
Office
equipment
989,223.90 926,537.94 62,685.96
Total 81,273,263.20 61,470,242.64 19,803,020.56
Note: the idle fixed assets at the end of the period are mainly due to the relocation of the plant of
Yangzhou Tongwei Feed Co., Ltd., and the corresponding fixed assets are suspended for use. When the
relocation of the Company is completed, the relocated assets will be compensated accordingly. As there
is no impairment, no provision for impairment reserves is made.
(3). About fixed assets acquired under finance lease
√Applicable □Inapplicable
Unit:Yuan Currency: RMB
Item Original book value Accumulated
depreciation
Preparation for
provision Book value
Machinery
equipment
1,906,742,875.51 327,703,464.62 1,579,039,410.89
(4). Fixed assets leased out under operating lease
√Applicable □Inapplicable
Unit:Yuan Currency: RMB Item Book value at the end of the period
Houses and buildings 50,844,458.12
Machinery equipment 116,944,427.51
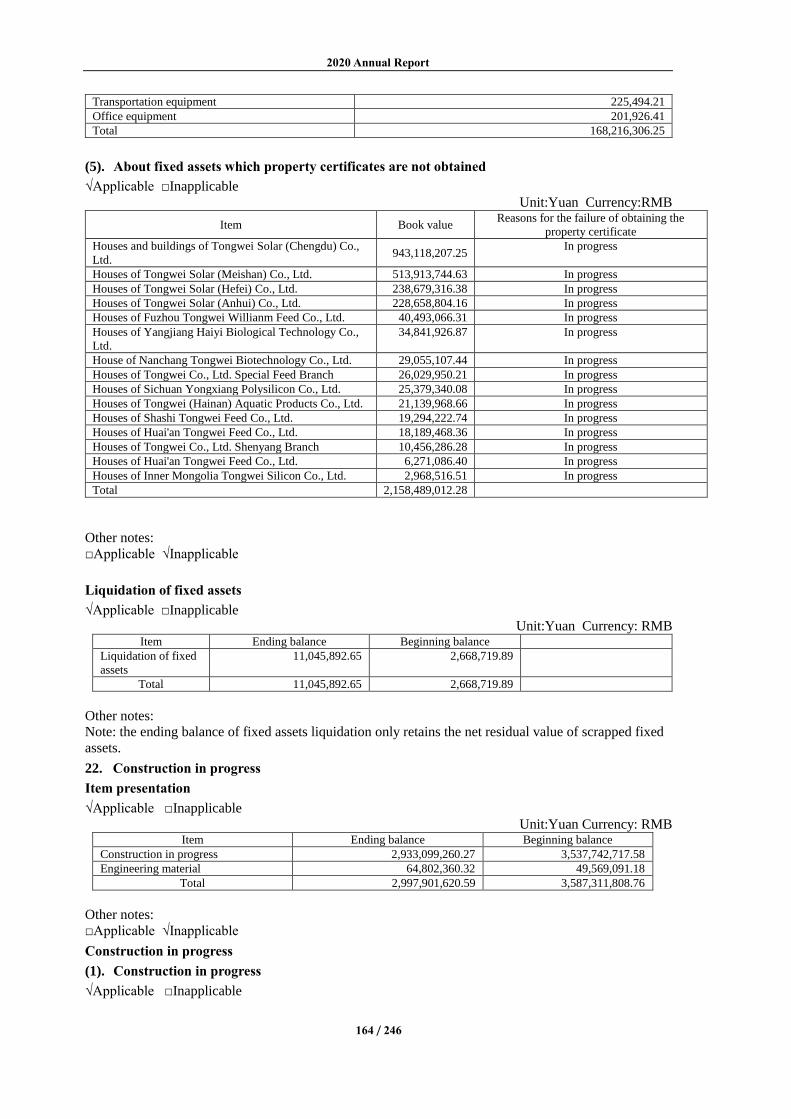
2020 Annual Report
164 / 246
Transportation equipment 225,494.21
Office equipment 201,926.41
Total 168,216,306.25
(5). About fixed assets which property certificates are not obtained
√Applicable □Inapplicable
Unit:Yuan Currency:RMB
Item Book value Reasons for the failure of obtaining the
property certificate
Houses and buildings of Tongwei Solar (Chengdu) Co.,
Ltd. 943,118,207.25
In progress
Houses of Tongwei Solar (Meishan) Co., Ltd. 513,913,744.63 In progress
Houses of Tongwei Solar (Hefei) Co., Ltd. 238,679,316.38 In progress
Houses of Tongwei Solar (Anhui) Co., Ltd. 228,658,804.16 In progress
Houses of Fuzhou Tongwei Willianm Feed Co., Ltd. 40,493,066.31 In progress
Houses of Yangjiang Haiyi Biological Technology Co.,
Ltd.
34,841,926.87 In progress
House of Nanchang Tongwei Biotechnology Co., Ltd. 29,055,107.44 In progress
Houses of Tongwei Co., Ltd. Special Feed Branch 26,029,950.21 In progress
Houses of Sichuan Yongxiang Polysilicon Co., Ltd. 25,379,340.08 In progress
Houses of Tongwei (Hainan) Aquatic Products Co., Ltd. 21,139,968.66 In progress
Houses of Shashi Tongwei Feed Co., Ltd. 19,294,222.74 In progress
Houses of Huai'an Tongwei Feed Co., Ltd. 18,189,468.36 In progress
Houses of Tongwei Co., Ltd. Shenyang Branch 10,456,286.28 In progress
Houses of Huai'an Tongwei Feed Co., Ltd. 6,271,086.40 In progress
Houses of Inner Mongolia Tongwei Silicon Co., Ltd. 2,968,516.51 In progress
Total 2,158,489,012.28
Other notes:
□Applicable √Inapplicable
Liquidation of fixed assets
√Applicable □Inapplicable
Unit:Yuan Currency: RMB Item Ending balance Beginning balance
Liquidation of fixed
assets
11,045,892.65 2,668,719.89
Total 11,045,892.65 2,668,719.89
Other notes:
Note: the ending balance of fixed assets liquidation only retains the net residual value of scrapped fixed
assets.
22. Construction in progress
Item presentation
√Applicable □Inapplicable
Unit:Yuan Currency: RMB Item Ending balance Beginning balance
Construction in progress 2,933,099,260.27 3,537,742,717.58
Engineering material 64,802,360.32 49,569,091.18
Total 2,997,901,620.59 3,587,311,808.76
Other notes:
□Applicable √Inapplicable
Construction in progress
(1). Construction in progress
√Applicable □Inapplicable

2020 Annual Report
165 / 246
Unit:Yuan Currency: RMB
Item
Ending balance Beginning balance
Book balance Preparation
for provision Book value Book balance
Preparation for
provision Book value
Projects in Tongwei New Energy Segment:
200MW Fishery & PV Integration in Dongying Animal Husbandry Area 585,781,725.88 585,781,725.88 9,974,168.23 9,974,168.23
100MW Fishery & PV Integration project in Gong'an 5,170,676.75 5,170,676.75
Phase-II 75MW Fishery & PV Integration Project in Tianjin Yangjiabo 18,442,662.74 18,442,662.74 242,213,369.62 242,213,369.62
100MWp Fishery & PV Integration project in Changde Dingcheng 100,303,896.82 100,303,896.82
300MW Fishery & PV Integration project in Shandong Zhanhua 167,836,236.96 167,836,236.96
200mwp Fishery & PV Integration project in Huaiyuan County, Bengbu City 239,338,460.65 239,338,460.65 4,331,916.61 4,331,916.61
Phase-III 20MW Fishery & PV Integration project in Kangxiling 345,585.39 345,585.39 59,952,676.00 59,952,676.00
100MW Fishery & PV Integration project in Gaoan Bajing 82,134,624.82 82,134,624.82
200MW Fishery & PV Integration Project in Jianping County 102,332,874.21 102,332,874.21 10,092,090.73 10,092,090.73
Other projects of new energy 110,826,345.68 110,826,345.68 50,027,436.98 50,027,436.98
Projects in Yongxiang segment:
Technological upgrading project of Yongxiang polysilicon production line 240,839,251.28 240,839,251.28 77,898,475.02 77,898,475.02
Tongwei phase-I 25,000MT high-purity polysilicon project in Inner
Mongolia 35,857,736.68 35,857,736.68 166,506,965.33 166,506,965.33
Other projects of Yongxiang 97,361,251.29 97,361,251.29 6,299,211.46 6,299,211.46
Projects in Tongwei Solar Segment:
Chengdu 3.2GW high-efficiency solar cell project 34,435,430.63 34,435,430.63
Chengdu 3.8GW high-efficiency solar cell project 1,299,296,637.72 1,299,296,637.72
Meishan phase-II 7.5GW high-efficiency solar cell project 523,132,682.15 523,132,682.15
Meishan phase-I 7.5GW high-efficiency solar cell project 27,832,971.13 27,832,971.13 541,616,543.52 541,616,543.52
Jintang phase-I 7.5GW high-efficiency solar cell project 484,681,023.28 484,681,023.28
Anhui production and efficiency improvement project 13,247,840.01 13,247,840.01 58,905,069.01 58,905,069.01
Component efficient project 27,160,603.05 5,282,262.90 21,878,340.15 248,885,502.21 12,650,688.56 236,234,813.65
Other projects of solar 163,845,460.83 163,845,460.83 137,610,070.42 137,610,070.42
Projects in agriculture and animal husbandry segment:
Nanchang biological feed production line project 2,509,239.85 2,509,239.85 49,406,626.80 49,406,626.80
Yangzhou feed production line project 325,745.62 325,745.62 18,538,562.63 18,538,562.63
Relocation project of Nanning Tongwei Feed Co., Ltd. 74,459,717.42 74,459,717.42 1,885,322.85 1,885,322.85
Yangjiang Haiyi shrimp special material production line project 82,206,111.86 82,206,111.86
Other projects in the agricultural segment 190,060,346.03 190,060,346.03 94,865,783.16 94,865,783.16
Total 2,938,381,523.17 5,282,262.90 2,933,099,260.27 3,550,393,406.14 12,650,688.56 3,537,742,717.58
(2). About changes of construction in progress in the current period
√Applicable □Inapplicable

2020 Annual Report
166 / 246
Unit:Yuan Currency:RMB
Project name Budget amount
Beginning
balance
Amount increased
in the current
period
Amount
transferred into
fixed assets in the
current period
Other amount
decreased in
the current
period
Ending balance
Proportion
of total
project
investment
in budget
(%)
Project
progress
Cumulative
amount of
interest
capitalization
Including:
Amount of
capitalization
of interest in
the current
period
Capitalization
rate of
interest in the
current
period (%)
Fund
source
Projects in Tongwei New
Energy Segment:
200MW Fishery & PV
Integration in Dongying Animal Husbandry Area
764,232,500.00 9,974,168.23 575,807,557.65 585,781,725.88 76.65 96.00% 285,065.37 4.58 Self-
raised
100MW Fishery & PV Integration project in Gong'an
386,194,700.00 5,170,676.75 339,226,829.22 344,397,505.97 89.18 100.00% 4,918,611.20 4,917,618.14 4.58 Self-raised
Phase-II 75MW Fishery & PV
Integration Project in Tianjin
Yangjiabo
343,915,100.00 242,213,369.62 51,355,632.74 275,126,339.62 18,442,662.74 85.36 95.00% 9,002,293.55 6,095,806.27 4.58 Self-
raised
100MWp Fishery & PV
Integration project in Changde
Dingcheng
378,531,600.00 100,303,896.82 234,253,969.44 334,557,866.26 88.38 100.00% 501,003.10 4.58 Self-
raised
300MW Fishery & PV
Integration project in
Shandong Zhanhua
1,189,060,000.00 167,836,236.96 697,213,566.75 865,049,803.71 72.75 100.00% 9,532,740.57 9,110,080.85 4.58 Self-
raised
Phase-II 30MW PV
powerplant project in Zibo Huixiang Gaoqing
92,220,800.00 88,069,689.19 88,069,689.19 95.50 100.00% Self-
raised
200mwp Fishery & PV Integration project in
Huaiyuan County, Bengbu
City
674,250,000.00 4,331,916.61 279,661,735.32 44,655,191.28 239,338,460.65 42.12 50.00% 38,063.40 4.58 Self-
raised
Phase-III 20MW Fishery &
PV Integration project in
Kangxiling
99,449,100.00 59,952,676.00 30,248,005.25 89,855,095.86 345,585.39 90.70 98.00% 3,886,237.32 3,431,129.48 4.58 Self-
raised
100MW Fishery & PV
Integration project in Gaoan
Bajing
375,480,200.00 82,134,624.82 181,183,166.81 263,317,791.63 70.13 83.00% 1,706,863.74 1,275,633.36 4.58 Self-
raised
200MW Fishery & PV
Integration Project in Jianping County
822,580,000.00 10,092,090.73 92,240,783.48 102,332,874.21 12.44 12.00% Self-raised
Other projects of new energy 50,027,436.98 201,178,609.16 132,786,744.25 7,592,956.21 110,826,345.68 100,507,750.32 1,449,957.74 4.58
Self-
raised
Projects in Yongxiang
segment:
Technological upgrading
project of Yongxiang
polysilicon production line
580,602,800.00 77,898,475.02 356,729,959.56 193,789,183.30 240,839,251.28 74.86 70.00% Self-
raised
Tongwei phase-I 25,000MT
high-purity polysilicon project
in Inner Mongolia
3,428,660,000.00 166,506,965.33 120,890,329.47 223,588,059.26 27,951,498.86 35,857,736.68 97.44 98.00% 18,669,747.53 4.49
Raising
+ self-
raised

2020 Annual Report
167 / 246
Other projects of Yongxiang 6,299,211.46 156,585,301.15 63,539,579.24 1,983,682.08 97,361,251.29 28,641,748.40 4.49
Projects in Tongwei Solar
Segment:
Chengdu 3.2GW high-
efficiency solar cell project 190,000,000.00 34,435,430.63 157,061,871.32 163,181,657.48 28,315,644.47 100.79 100.00%
Self-
raised
Chengdu 3.8GW high-
efficiency solar cell project 1,621,621,600.00 1,299,296,637.72 299,464,036.21 1,542,477,966.26 56,282,707.67 98.59 100.00%
Self-
raised
Meishan phase-II 7.5GW high-efficiency solar cell project
2,400,000,000.00 523,132,682.15 523,132,682.15 21.80 20.00% Raised
Meishan phase-I 7.5GW high-
efficiency solar cell project 2,500,000,000.00 541,616,543.52 1,766,097,294.61 2,189,274,156.69 90,606,710.31 27,832,971.13 92.32 92.00%
Self-
raised
Jintang phase-I 7.5GW high-
efficiency solar cell project 2,700,613,900.00 484,681,023.28 484,681,023.28 17.96 18.00% Raised
Anhui production and
efficiency improvement
project
364,442,800.00 58,905,069.01 179,709,195.23 225,366,424.23 13,247,840.01 67.46 65.00% Self-
raised
Component efficient project 1,181,000,000.00 248,885,502.21 316,118,077.10 535,460,425.55 2,382,550.71 27,160,603.05 47.84 50.00%
Self-
raised
Other projects of solar 137,610,070.42 147,385,904.38 99,920,136.68 21,230,377.29 163,845,460.83
Projects in agriculture and
animal husbandry segment:
Nanchang biological feed
production line project 120,000,000.00 49,406,626.80 56,217,420.81 103,114,807.76 2,509,239.85 88.02 97.00%
Self-
raised
Yangzhou feed production line
project 170,000,000.00 18,538,562.63 26,188,911.57 44,401,728.58 325,745.62 111.40 99.00% 884,507.09 4.37
Self-
raised
Nanning feed relocation
project 115,631,700.00 1,885,322.85 73,947,354.40 1,372,959.83 74,459,717.42 65.58 70.00% 667,787.84 667,787.84 4.37
Self-
raised
Yangjiang Haiyi shrimp special material production
line project
128,738,900.00 82,206,111.86 19,770,865.81 101,976,977.67 79.21 100.00% 1,228,539.54 4.37 Self-raised
Other projects in the
agricultural segment 94,865,783.16 297,879,804.14 188,903,524.37 13,781,716.90 190,060,346.03 4,639,666.98 3,420,080.18 4.37
Self-
raised
Total 20,627,225,700.00 3,550,393,406.14 7,752,299,576.20 8,114,183,614.67 250,127,844.50 2,938,381,523.17 / / 185,110,625.95 30,368,093.86 / /

2020 Annual Report
168 / 246
Notes:
1. Budget amount refers to the budget amount of project investment. The proportion of project investment
in the budget refers to the proportion of accumulated investment in the budget of the project. The
accumulated investment includes the amount of fixed assets carried forward in the previous year. The
investment budget of the raised fund PV powerplant project includes the project construction cost and the
fish ponds rental fee. The budget of the non-raised fund PV powerplant project does not include the fish
ponds rental fee, which was reflected in the “long-term prepaid expenses”.
2. 300MW Fishery & PV Integration Project in Shandong Zhanhua accounted for 72.75% of the budget,
and the project progress was 100.00%. The major difference is that the project investment budget includes
powerplant energy storage projects, which are in the preliminary preparation stage and have not yet been
invested.
3. In the current period, Tongwei New Energy (Shenzhen) Co., Ltd., a subsidiary of Tongwei New Energy
(Shenzhen) Co., Ltd., a wholly-owned subsidiary of the company, was added to the acquisition of Zibo
Huixiang New Energy Co., Ltd., with an increase of RMB 68,204,857.68.
4. The application project of domestically produced intelligent equipment (system) with an annual output
of 7.5GW of high-efficiency crystalline silicon solar cells in Meishan Phase I was originally filed as an
application project of domestic intelligent equipment (system) with an annual output of 3.8GW of high-
efficiency crystalline silicon solar cells. The name of the project was changed on February 27, 2020, and
the project was completed in August 2020, handed over to use and fixed.
5. The amount of other decrease is RMB 250,127,844.50, including RMB 168,171,796.41 carry-forward
into intangible assets - land use right, RMB 45,627,532.08 in software, RMB 5,880,715.59 in transfer
management expenses, RMB 243,829.36 decreased in the disposal of subsidiaries and RMB
30,203,971.06 transferred in long-term prepaid expenses.
(3). About provision for impairment reserves of construction in progress in the current period
□Applicable √Inapplicable
Other notes
√Applicable □Inapplicable
The impairment of construction in progress is the solar energy segment project. The initial
impairment provision is RMB 12,650,688.56. There is no new increase in the current period. As the project
is completed, it will be transferred to fixed assets of RMB 7,368,425.66, and the ending balance is RMB
5,282,262.90.
Engineering material
(4). About engineering materials
√Applicable □Inapplicable
Unit:Yuan Currency: RMB
Item
Ending balance Beginning balance
Book balance
Preparation
for
provision
Book value Book balance
Preparation
for
provision
Book value
Special equipment 50,203,546.20 50,203,546.20 49,569,091.18 49,569,091.18
Special materials 14,598,814.12 14,598,814.12
Total 64,802,360.32 64,802,360.32 49,569,091.18 49,569,091.18
Other notes:
As no net realizable value of engineering materials is lower than the book cost at the end of the period,
no provision for impairment reserves of engineering materials is made.
23. Productive biological assets
(1). Productive biological assets using cost measurement models
√Applicable □Inapplicable Unit:Yuan Currency: RMB

2020 Annual Report
169 / 246
Item Aquatic industry
Total Fish Shrimp
I. Original book value
1.Beginning balance 918,585.04 2,013,400.00 2,931,985.04
2.Amount increased in the current period 7,552,101.67 7,552,101.67
(1) Outsourcing 7,552,101.67 7,552,101.67
(2) Self-cultivation
3.Amount decreased in the current period 362,793.04 9,565,501.67 9,928,294.71
(1) Disposal 362,793.04 9,565,501.67 9,928,294.71
(2) Others
4.Ending balance 555,792.00 555,792.00
II. Accumulated depreciation
1.Beginning balance 514,934.45 514,934.45
2.Amount increased in the current period 159,617.65 9,565,501.67 9,725,119.32
(1) Provision 159,617.65 9,565,501.67 9,725,119.32
3.Amount decreased in the current period 210,157.45 9,565,501.67 9,775,659.12
(1) Disposal 210,157.45 9,565,501.67 9,775,659.12
(2) Others
4.Ending balance 464,394.65 464,394.65
III. Impairment reserves
1.Beginning balance
2.Amount increased in the current period
(1) Provision
3.Amount decreased in the current period
(1) Disposal
(2) Others
4.Ending balance
IV. Book Value
1.Book value at the end of the period 91,397.35 91,397.35
2.Book value at the beginning of the period 403,650.59 2,013,400.00 2,417,050.59
(2). Productive biological assets measured at fair value
□Applicable √Inapplicable
Other notes
√Applicable □Inapplicable
At the end of the period, there was no situation where the net realizable value of productive biological
assets was lower than the book cost, so no provision for impairment of productive biological assets was
made.
24. Oil and gas assets
□Applicable √Inapplicable
25. Right-of-use assets
□Applicable √Inapplicable
26. Intangible assets
(1). Intangible assets
√Applicable □Inapplicable
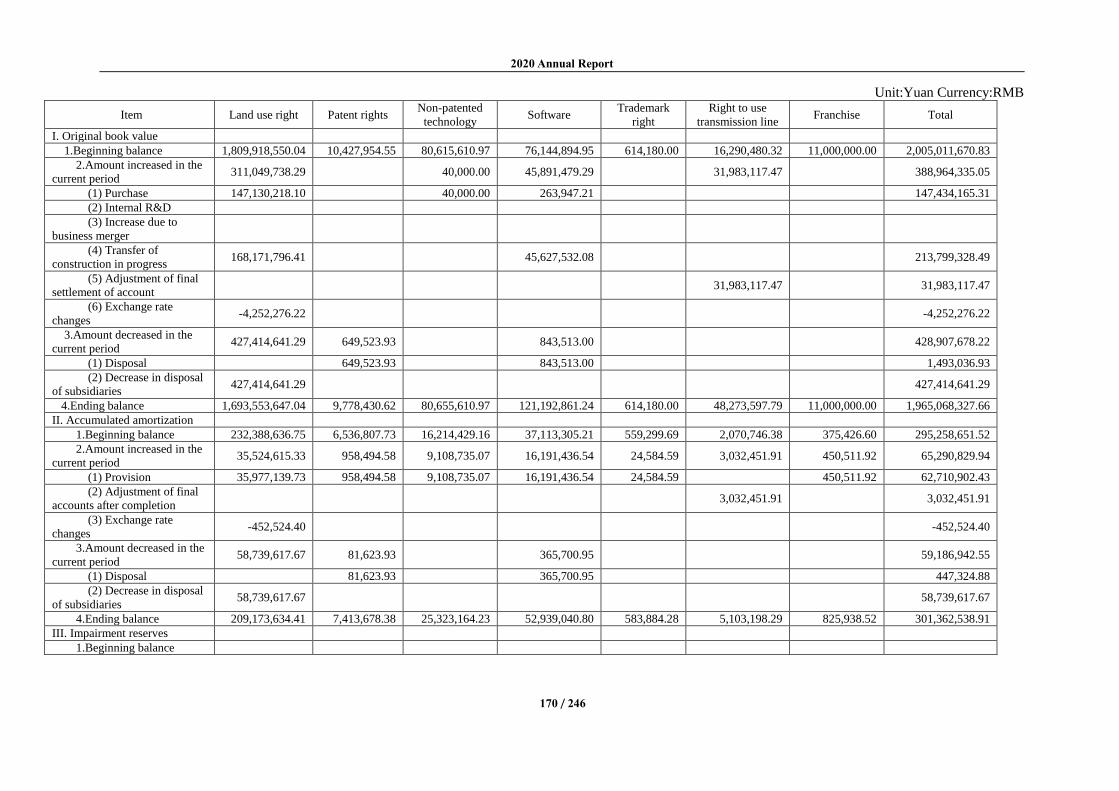
2020 Annual Report
170 / 246
Unit:Yuan Currency:RMB
Item Land use right Patent rights Non-patented
technology Software
Trademark
right
Right to use
transmission line Franchise Total
I. Original book value
1.Beginning balance 1,809,918,550.04 10,427,954.55 80,615,610.97 76,144,894.95 614,180.00 16,290,480.32 11,000,000.00 2,005,011,670.83
2.Amount increased in the
current period 311,049,738.29 40,000.00 45,891,479.29 31,983,117.47 388,964,335.05
(1) Purchase 147,130,218.10 40,000.00 263,947.21 147,434,165.31
(2) Internal R&D
(3) Increase due to
business merger
(4) Transfer of
construction in progress 168,171,796.41 45,627,532.08 213,799,328.49
(5) Adjustment of final
settlement of account 31,983,117.47 31,983,117.47
(6) Exchange rate
changes -4,252,276.22 -4,252,276.22
3.Amount decreased in the
current period 427,414,641.29 649,523.93 843,513.00 428,907,678.22
(1) Disposal 649,523.93 843,513.00 1,493,036.93
(2) Decrease in disposal
of subsidiaries 427,414,641.29 427,414,641.29
4.Ending balance 1,693,553,647.04 9,778,430.62 80,655,610.97 121,192,861.24 614,180.00 48,273,597.79 11,000,000.00 1,965,068,327.66
II. Accumulated amortization
1.Beginning balance 232,388,636.75 6,536,807.73 16,214,429.16 37,113,305.21 559,299.69 2,070,746.38 375,426.60 295,258,651.52
2.Amount increased in the
current period 35,524,615.33 958,494.58 9,108,735.07 16,191,436.54 24,584.59 3,032,451.91 450,511.92 65,290,829.94
(1) Provision 35,977,139.73 958,494.58 9,108,735.07 16,191,436.54 24,584.59 450,511.92 62,710,902.43
(2) Adjustment of final
accounts after completion 3,032,451.91 3,032,451.91
(3) Exchange rate
changes -452,524.40 -452,524.40
3.Amount decreased in the
current period 58,739,617.67 81,623.93 365,700.95 59,186,942.55
(1) Disposal 81,623.93 365,700.95 447,324.88
(2) Decrease in disposal
of subsidiaries 58,739,617.67 58,739,617.67
4.Ending balance 209,173,634.41 7,413,678.38 25,323,164.23 52,939,040.80 583,884.28 5,103,198.29 825,938.52 301,362,538.91
III. Impairment reserves
1.Beginning balance

2020 Annual Report
171 / 246
2.Amount increased in the
current period
(1) Provision
3.Amount decreased in the
current period
(1) Disposal
4.Ending balance
IV. Book Value
1.Book value at the end of
the period 1,484,380,012.63 2,364,752.24 55,332,446.74 68,253,820.44 30,295.72 43,170,399.50 10,174,061.48 1,663,705,788.75
2.Book value at the
beginning of the period 1,577,529,913.29 3,891,146.82 64,401,181.81 39,031,589.74 54,880.31 14,219,733.94 10,624,573.40 1,709,753,019.31
Ratio of intangible assets formed through internal R&D to the balance of intangible assets at the end of the current period: 0

2020 Annual Report
172 / 246
(2). Land use rights whose property certificates are not obtained
√Applicable □Inapplicable
Unit:Yuan Currency: RMB Item Book value Reasons for the failure of obtaining the property certificate
Land of Tongwei Solar (Chengdu) Co., Ltd. 52,033,506.03 In progress
Land of Xiamen Tongwei Feed Co., Ltd. 3,953,414.33
The foundation was not leveled according to regulations during
construction. The application materials are being supplemented and
improved in accordance with relevant procedures and requirements
Land of Chongqing Tongwei New Energy
Co., Ltd. 1,393,558.00 In progress
Land of Xide Tongwei Huijin New Energy
Co., Ltd. 1,304,625.00 In progress
Land of Huai'an Tongwei Feed Co., Ltd. 604,351.60
The company is located in Baotan town. Huai 'an City allocates a
fixed area of industrial land to Baotan government every year, and
then the government allocates the land to enterprises from the total
area. It is now being coordinated with the government
Land of Linghai Zhongqing Energy Co., Ltd. 424,135.60 In progress
Total 59,713,590.56
Other notes:
√Applicable □Inapplicable
At the end of the period, there was no situation where the net realizable value of intangible assets was
lower than the book cost, so no provision for impairment of intangible assets was made.
27. Development expenditure
√Applicable □Inapplicable
Unit:Yuan Currency: RMB
Item
Beginning
balance
Amount increased in the current
period Amount decreased in the current period
Ending
balance Internal
development
expenditure
Others
Recognized
as intangible
assets
Transferred to
current period
profit or loss
Production, research and
development project of cells
530,133,043.30 530,133,043.30
Research and development
project of aquatic feed
102,024,595.95 102,024,595.95
Research and development
project of cultivation technology
66,271,192.77 66,271,192.77
Production, research and
development project of high-
purity polysilicon
245,781,335.24 245,781,335.24
Production, research and
development project of PVC and
sodium hydroxide
27,961,594.03 27,961,594.03
Production, research and
development project of poultry
feed
52,146,762.28 52,146,762.28
Others 11,012,911.11 11,012,911.11
Total 1,035,331,434.68 1,035,331,434.68
28. Goodwill
(1). Original book value of goodwill
√Applicable □Inapplicable
Unit:Yuan Currency: RMB
Name of the investee or event from which the
goodwill arises
Beginning
balance
Increase in the
current period
Decrease in
the current
period Ending balance
Increase due
to business
combination
Disposal
Tongwei Solar (Hefei) Co., Ltd. 591,542,868.55 591,542,868.55

2020 Annual Report
173 / 246
Hainan Haiyi Aquatic Products Feed Co., Ltd. 22,461,157.77 22,461,157.77
Zhuhai Haiyi Aquatic Products Feed Co., Ltd. 21,814,691.67 21,814,691.67
Chengdu Chunyuan Food Co., Ltd. 17,886,370.20 17,886,370.20
Hainan Haiyi Aquatic Seed Co., Ltd. 2,911,456.80 2,911,456.80
Sichuan Chunyuan Ecological Breeding Co.,
Ltd.
1,486,979.12 1,486,979.12
Total 658,103,524.11 658,103,524.11
(2). Impairment provision for goodwill
√Applicable □Inapplicable
Unit:Yuan Currency: RMB
Name of the investee or event from which
the goodwill arises
Beginning
balance
Increase in the
current period
Decrease in
the current
period Ending
balance
Provision Disposal
Chengdu Chunyuan Food Co., Ltd 17,886,370.20 17,886,370.20
Hainan Haiyi Aquatic Seed Co., Ltd. 2,911,456.80 2,911,456.80
Sichuan Chunyuan Ecological Breeding
Co., Ltd.
1,486,979.12 1,486,979.12
Total 22,284,806.12 22,284,806.12
(3). Information of the asset portfolios or groups of asset portfolios in which goodwill is located
√Applicable □Inapplicable
The products produced by the above-mentioned -companies with goodwill are in active market.
Major cash inflows are independent of cash inflows from other assets or asset groups. Companies are
identified as independent asset groups. These asset groups are consistent with the asset portfolios
recognized in the goodwill devaluation testing at the date of purchase.
(4). Explanation of recognition method for the process of goodwill devaluation testing, key
parameters (e.g. growth rate in the forecast period, growth rate in the stable period, profit rate,
discount rate, forecast period when forecasting the present value of future cash flow, if
applicable) and goodwill impairment loss
√Applicable □Inapplicable
The recoverable amounts of Tongwei Solar (Hefei) Co., Ltd., Hainan Haiyi Aquatic Feed Co., Ltd.
and Zhuhai Haiyi Aquatic Feed Co., Ltd. are determined according to the present value of the expected
future cash flows of the asset group. The future cash flow is determined based on the financial budget
approved by the management from 2021 to 2025. The cash flow of the asset group over 5 years adopts
stable and sustainable cash flow. Other key assumptions used in predicting future cash flows include:
Estimated operating revenue, gross profit margin, expenses, depreciation and amortization, and increase
in long-term asset investment based on the asset group's past performance, industry development trends,
and management's expectation of market development. The management believes that any reasonable
changes in the above assumptions will not lead the book value of the asset groups of Tongwei Solar (Hefei)
Co., Ltd., Hainan Haiyi Aquatic Feed Co., Ltd. and Zhuhai Haiyi Aquatic Feed Co., Ltd. to exceed their
recoverable amounts.
(5). Effect of goodwill devaluation testing
□Applicable √Inapplicable
Other notes
□Applicable √Inapplicable
29. Long-term prepaid expenses
√Applicable □Inapplicable

2020 Annual Report
174 / 246
Unit:Yuan Currency: RMB Item Beginning balance Amount increased
in the current
period
Amortization in
the current period
Other decrease
amount
Ending balance
Rental fees 590,130,632.82 606,515,820.75 394,318,140.70 30,578,722.58 771,749,590.29
Renovation
costs
2,933,233.83 56,655,089.50 10,906,432.34 48,681,890.99
Others 14,269,215.39 18,610,180.83 18,040,913.93 14,838,482.29
Total 607,333,082.04 681,781,091.08 423,265,486.97 30,578,722.58 835,269,963.57
Other notes:
(1) Rental fees mainly include the fees for Fishery & PV Integration Project and fish ponds for
aquaculture, which are amortized on an average basis according to the lease term agreed in the contract.
Among them, the amortization of rental fees of land and fish ponds during the normal construction period
of Fishery & PV Integration powerplant is included in the construction cost, and the amortization during
the abnormal construction period is included in the current profit and loss.
(2) Other reductions were due to the long-term prepaid expenses of 29,340,469.89 yuan transferred
out by the Company after the termination of the lease contract, and 1,238,252.69 yuan transferred to the
intangible assets-the right to use transmission lines from the final accounts of the new energy segment.
30. Deferred income tax assets/Deferred income tax liabilities
(1). Deferred income tax assets not offset
√Applicable □Inapplicable
Unit:Yuan Currency: RMB
Item
Ending balance Beginning balance
Temporary
deductible
difference
Deferred income
tax
assets
Temporary
deductible
difference
Deferred income
tax
assets
Asset depreciation reserves 1,064,729,156.95 181,000,631.40 817,564,148.18 127,094,887.91
Unrealized profit of internal
transaction 553,308,162.08 82,996,224.31 512,148,218.73 89,153,194.40
Deductible loss 676,668,440.56 100,731,514.19 118,888,345.84 26,820,269.10
Liability reserves 21,958,001.65 3,293,700.25 24,221,753.62 3,633,263.04
Amortization of fixed assets
greater than that stipulated in
the tax law
-50,791,292.05 -8,145,487.67 -55,688,341.74 -8,344,785.12
Less depreciation of fixed
assets due to provision of
assets impairment
-318,546,577.09 -47,781,986.56 -275,532,612.46 -41,329,891.88
Employee compensation
payable 114,323,627.95 17,300,092.29 95,571,900.72 17,444,909.91
Deferred incomes 530,339,401.39 79,769,580.23 153,806,729.30 24,603,975.17
Value-added income offset in
land evaluation during
merging
24,830,399.13 3,724,559.87 25,601,886.53 3,840,282.98
Amortized interest on finance
leases 17,746,905.56 2,662,035.83 13,250,787.79 1,987,618.17
Total 2,634,566,226.13 415,550,864.14 1,429,832,816.51 244,903,723.68
(2). Deferred tax liabilities not offset
√Applicable □Inapplicable
Unit:Yuan Currency: RMB
Item
Ending balance Beginning balance
Taxable temporary
difference
Deferred income
tax
liabilities
Taxable temporary
difference
Deferred income
tax
liabilities

2020 Annual Report
175 / 246
Asset evaluation increment
from business combination
under different control
Changes in the fair value of
other debt investments
Changes in fair value of
investment by other equity
instruments
Income of interest-free
liabilities discounted 39,270,080.33 5,890,512.05 66,401,185.70 9,960,177.86
Amortization of fixed assets
less than that stipulated in
the tax law
2,014,647,721.36 302,197,158.22 692,207,544.25 132,244,295.52
Assets profit from trading
financial assets 25,747,780.82 3,862,167.13
Total 2,079,665,582.51 311,949,837.40 758,608,729.95 142,204,473.38
(3). Deferred income tax assets or liabilities listed in net amount after offset
□Applicable √Inapplicable
(4). Details of unrecognized deferred tax assets
√Applicable □Inapplicable
Unit:Yuan Currency: RMB
Item Ending balance Beginning balance
Temporary deductible difference
Deductible loss 1,191,015,304.72 750,647,107.09
Asset depreciation reserves 93,967,516.39 103,882,871.68
Total 1,284,982,821.11 854,529,978.77
(5). Deductible loss due in the following year of unrecognized deferred income tax assets
√Applicable □Inapplicable
Unit:Yuan Currency:RMB
Year Ending amount Beginning amount Remarks
2020 95,772,266.55
2021 93,613,531.47 97,840,095.54
2022 101,491,933.53 116,377,449.84
2023 75,229,312.46 118,719,387.60
2024 218,117,138.83 321,937,907.56
2025 702,563,388.43
Total 1,191,015,304.72 750,647,107.09 /
Other notes:
□Applicable √Inapplicable
31. Other non-current assets
√Applicable □Inapplicable
Unit:Yuan Currency: RMB
Item
Ending balance Beginning balance
Book balance Impairment
provision Book value Book balance
Impairment
provision Book value
Contract
acquisition
cost
Contract
performance
cost
Receivable
return cost

2020 Annual Report
176 / 246
Contract
assets
Input taxes
of overpaid
VAT
752,680,595.05 752,680,595.05 684,132,729.00 684,132,729.00
Prepaid
amount for
engineering
and
equipment
716,619,559.20 716,619,559.20 237,510,552.07 237,510,552.07
Payable for
share
acquisition
3,082,000.00 3,082,000.00 134,522,726.32 134,522,726.32
Land
prepayment 74,640,589.20 74,640,589.20
Total 1,547,022,743.45 1,547,022,743.45 1,056,166,007.39 1,056,166,007.39
Other notes:
Note: it is estimated that the retained input tax that cannot be deducted within one year is presented in
other non-current assets.
32. Short-term loans
(1). Classification of short-term loans
√Applicable □Inapplicable
Unit:Yuan Currency: RMB
Item Ending balance Beginning balance
Pledged loans
Mortgage loans 200,201,666.63
Guaranteed loans 1,813,559,433.63 3,367,822,936.07
Credit loans 335,393,425.51 255,030,273.76
Total 2,349,154,525.77 3,622,853,209.83
(2). Unpaid short-term loans in maturity
□Applicable √Inapplicable
The important short-term loans that have been overdue and have not been repaid are as follows:
□Applicable √Inapplicable
Other notes
√Applicable □Inapplicable
At the end of the period, the Company guaranteed RMB 1,813,559,433.63 in short-term loans. For
details of the Company's guarantee by Tongwei Group Co., Ltd., refer to "related party guarantee", and
the Company's guarantee for subsidiaries is as follows: Guarantor Guaranteed party Guaranteed
amount
Starting date of
the guarantee
Expiration date of
the guarantee
Tongwei Co., Ltd. Tongwei (Hainan) Aquatic Products
Co., Ltd. 5,006,041.67 2020/1/16 2021/1/16
Tongwei Co., Ltd. Tongwei (Hainan) Aquatic Products
Co., Ltd. 45,054,375.00 2020/2/13 2021/2/13
Tongwei Co., Ltd. Tongwei (Hainan) Aquatic Products
Co., Ltd. 30,036,250.00 2020/4/3 2021/4/3
Tongwei Co., Ltd. Tongwei (Hainan) Aquatic Products
Co., Ltd. 30,032,083.33 2020/11/27 2021/11/27
Tongwei Co., Ltd. Tongwei (Hainan) Aquatic Products
Co., Ltd. 30,032,083.33 2020/12/9 2021/12/9
Tongwei Co., Ltd. Tongwei (Hainan) Aquatic Products
Co., Ltd. 20,753,862.25 2020/11/25 2021/11/6
Tongwei Co., Ltd. Indonesia Tongwei Co., Ltd. 710,669.93 2020/10/19 2021/2/15
Tongwei Co., Ltd. Indonesia Tongwei Co., Ltd. 699,708.47 2020/10/19 2021/2/15
Tongwei Co., Ltd. Indonesia Tongwei Co., Ltd. 1,053,036.79 2020/10/26 2021/2/25

2020 Annual Report
177 / 246
Tongwei Co., Ltd. Indonesia Tongwei Co., Ltd. 739,908.38 2020/11/15 2021/3/14
Tongwei Co., Ltd. Indonesia Tongwei Co., Ltd. 953,765.78 2020/11/25 2021/3/24
Tongwei Co., Ltd. Indonesia Tongwei Co., Ltd. 1,056,412.92 2020/11/25 2021/3/24
Tongwei Co., Ltd. Indonesia Tongwei Co., Ltd. 307,242.02 2020/11/25 2021/3/24
Tongwei Co., Ltd. Indonesia Tongwei Co., Ltd. 1,037,262.84 2020/12/4 2021/4/3
Tongwei Co., Ltd. Indonesia Tongwei Co., Ltd. 649,862.54 2020/12/4 2021/4/3
Tongwei Co., Ltd. Indonesia Tongwei Co., Ltd. 827,273.70 2020/12/4 2021/4/3
Tongwei Co., Ltd. Indonesia Tongwei Co., Ltd. 704,551.13 2020/12/7 2021/4/6
Tongwei Co., Ltd. Indonesia Tongwei Co., Ltd. 198,519.20 2020/12/7 2021/4/6
Tongwei Co., Ltd. Indonesia Tongwei Co., Ltd. 925,497.45 2020/12/8 2021/4/7
Tongwei Co., Ltd. Indonesia Tongwei Co., Ltd. 236,001.85 2020/12/8 2021/4/7
Tongwei Co., Ltd. Indonesia Tongwei Co., Ltd. 156,831.10 2020/12/8 2021/4/7
Tongwei Co., Ltd. Indonesia Tongwei Co., Ltd. 2,313,743.64 2020/12/11 2021/4/10
Tongwei Co., Ltd. Indonesia Tongwei Co., Ltd. 2,631,019.31 2020/12/14 2021/4/20
Tongwei Co., Ltd. Indonesia Tongwei Co., Ltd. 1,720,381.23 2020/12/31 2021/12/31
Tongwei Co., Ltd. Indonesia Tongwei Co., Ltd. 2,482,822.19 2020/10/14 2021/2/13
Tongwei Co., Ltd. Indonesia Tongwei Co., Ltd. 2,284,038.64 2020/11/3 2021/3/2
Tongwei Co., Ltd. Indonesia Tongwei Co., Ltd. 1,034,468.09 2020/11/12 2021/3/12
Tongwei Co., Ltd. Indonesia Tongwei Co., Ltd. 545,106.59 2020/12/4 2021/4/3
Tongwei Co., Ltd. Indonesia Tongwei Co., Ltd. 1,189,067.96 2020/12/15 2021/4/14
Tongwei Co., Ltd. Indonesia Tongwei Co., Ltd. 1,442,910.38 2020/12/2 2021/4/2
Tongwei Co., Ltd. Indonesia Tongwei Co., Ltd. 3,274,074.11 2020/11/24 2021/3/23
Tongwei Co., Ltd. Indonesia Tongwei Co., Ltd. 1,388,246.19 2020/12/29 2021/4/28
Tongwei Co., Ltd.,
Tongwei Vietnam Tongta Tongwei Co., Ltd. 1,292,750.57 2020/11/16 2021/2/17
Tongwei Co., Ltd.,
Tongwei Vietnam Tongta Tongwei Co., Ltd. 608,507.94 2020/11/25 2021/2/23
Tongwei Co., Ltd.,
Tongwei Vietnam Tongta Tongwei Co., Ltd. 1,923,655.60 2020/11/26 2021/2/24
Tongwei Co., Ltd.,
Tongwei Vietnam Tongta Tongwei Co., Ltd. 837,104.91 2020/11/27 2021/2/25
Tongwei Co., Ltd.,
Tongwei Vietnam Tongta Tongwei Co., Ltd. 1,799,164.15 2020/12/17 2021/3/17
Tongwei Co., Ltd.,
Tongwei Vietnam Tongta Tongwei Co., Ltd. 849,422.51 2020/12/28 2021/3/29
Tongwei Co., Ltd.,
Tongwei Vietnam Tongta Tongwei Co., Ltd. 1,994,823.85 2020/12/28 2021/3/29
Tongwei Co., Ltd.,
Tongwei Vietnam Tongta Tongwei Co., Ltd. 1,730,775.83 2020/12/30 2021/3/30
Tongwei Co., Ltd. Vietnam Tongwei Co., Ltd. 6,616,096.69 2020/10/13 2021/1/11
Tongwei Co., Ltd. Qianjiang Tongwei Co., Ltd. 2,567,400.09 2020/10/12 2021/1/08
Tongwei Co., Ltd. Qianjiang Tongwei Co., Ltd. 400,357.02 2020/10/29 2021/1/27
Tongwei Co., Ltd. Qianjiang Tongwei Co., Ltd. 386,999.79 2020/10/29 2021/1/22
Tongwei Co., Ltd. Qianjiang Tongwei Co., Ltd. 2,944,789.86 2020/11/03 2021/1/11
Tongwei Co., Ltd. Qianjiang Tongwei Co., Ltd. 1,198,702.59 2020/11/17 2021/2/09
Tongwei Co., Ltd. Qianjiang Tongwei Co., Ltd. 448,749.00 2020/11/20 2021/2/18
Tongwei Co., Ltd. Qianjiang Tongwei Co., Ltd. 3,352,348.79 2020/11/30 2021/2/26
Tongwei Co., Ltd. Qianjiang Tongwei Co., Ltd. 2,888,672.82 2020/12/01 2021/1/27
Tongwei Co., Ltd. Qianjiang Tongwei Co., Ltd. 2,178,193.10 2020/12/08 2021/3/08
Tongwei Co., Ltd. Qianjiang Tongwei Co., Ltd. 292,797.21 2020/12/10 2021/3/10
Tongwei Co., Ltd. Qianjiang Tongwei Co., Ltd. 850,598.32 2020/12/16 2021/3/16
Tongwei Co., Ltd. Qianjiang Tongwei Co., Ltd. 3,326,406.80 2020/12/16 2021/3/16
Tongwei Co., Ltd. Qianjiang Tongwei Co., Ltd. 1,034,886.96 2020/12/22 2021/3/22
Tongwei Co., Ltd. Qianjiang Tongwei Co., Ltd. 2,060,003.82 2020/12/29 2021/3/29
Tongwei Co., Ltd. Qianjiang Tongwei Co., Ltd. 694,262.10 2020/12/29 2021/3/29
Tongwei Co., Ltd. Tongwei Solar (Chengdu) Co., Ltd. 6,538,384.82 2020/12/1 2021/5/28
Tongwei Co., Ltd. Sichuan Yongxiang Co., Ltd. 73,780,000.00 2020/9/2 2021/3/1
Total 314,072,973.15
33. Trading financial liabilities
□Applicable √Inapplicable

2020 Annual Report
178 / 246
34. Derivative financial liabilities
□Applicable √Inapplicable
35. Notes payable
(1). Presentation of notes payable
√Applicable □Inapplicable
Unit:Yuan Currency: RMB
Category Ending balance Beginning balance
Commercial acceptance
bills
Banker's acceptance bills 9,363,914,654.37 5,248,895,767.77
Letter of credit 48,009,780.41 45,727,471.47
Total 9,411,924,434.78 5,294,623,239.24
At the end of the current period, the total amount of notes payable that have not yet been paid is 0 yuan.
Note: at the end of the period, the company's bill guarantees for its subsidiaries are as follows:
Guarantor Guaranteed party Guaranteed
amount
Starting date
of the
guarantee
Expiration date
of the
guarantee
Tongwei Co., Ltd. Tongwei Solar (Chengdu) Co., Ltd. 78,360,000.00 2020/7/22 2021/1/22
Tongwei Co., Ltd. Tongwei Solar (Chengdu) Co., Ltd. 100,000,000.00 2020/9/11 2021/3/11
Total 178,360,000.00
Note: the Company has signed a maximum guarantee contract (XYR[EB] 1902 No.117) with the
Chengdu Branch of Industrial Bank Co., Ltd. and a supplemental contract of XYR[EB] 2020 No.001 to
provide a maximum guarantee of RMB 240 million for bills loans and other debt that its subsidiary
Tongwei Solar (Chengdu) Co., Ltd. continuously incurred within a certain period of time in Chengdu
Branch of Industrial Bank Co., Ltd.
36. Accounts payable
(1). List of accounts payable
√Applicable □Inapplicable
Unit:Yuan Currency: RMB Item Ending balance Beginning balance
Within one year 3,345,411,733.19 2,515,471,429.20
1-2 years 404,083,464.63 1,025,791,846.71
2-3 years 145,845,168.26 48,997,595.66
Over 3 years 21,980,614.56 18,777,818.14
Total 3,917,320,980.64 3,609,038,689.71
(2). Significant payables with account receivable age over one year
□Applicable √Inapplicable
Other notes
√Applicable □Inapplicable
1) Accounts payable with account receivable age over one year mainly refer to the Company's accounts
payable for equipment and project funds.
2) Classification of accounts payable by nature: Item Ending balance Beginning balance
Payable for business activities 1,552,527,877.70 1,285,230,601.77
Payable for non- business activities 2,364,793,102.94 2,323,808,087.94
Total 3,917,320,980.64 3,609,038,689.71
37. Advance receipt
(1). List of accounts received in advance
√Applicable □Inapplicable
Unit:Yuan Currency: RMB

2020 Annual Report
179 / 246
Item Ending balance Beginning balance
Within one year 31,301,784.79 46,261,702.91
1-2 years 1,823,123.19 4,045,561.37
2-3 years 1,947,192.85
Total 35,072,100.83 50,307,264.28
(2). Major advances the with account receivable age over one year
□Applicable √Inapplicable
Other notes
√Applicable □Inapplicable
The advance receipts are mainly the advance receipts from the company's leasing business.
38. Contract liabilities
(1). About contract liabilities
√Applicable □Inapplicable
Unit:Yuan Currency:RMB Item Ending balance Beginning balance
Advance payment 2,302,728,492.73 1,484,683,326.76
Total 2,302,728,492.73 1,484,683,326.76
(2). The amount and reason for the significant change in the book value during the reporting period
□Applicable √Inapplicable
Other notes:
□Applicable √Inapplicable
39. Employee compensation payable
(1). List of employee compensation payable
√Applicable □Inapplicable
Unit:Yuan Currency: RMB
Item Beginning
balance
Increase in the
current period
Decrease in the
current period Ending balance
I. Short-term compensation 692,632,415.17 2,893,779,815.47 2,850,049,130.59 736,363,100.05
II. Post-employment benefits - defined
contribution plan 40,847,073.58 40,847,073.58
III. Dismissal welfare 7,901,338.81 7,901,338.81
IV. Current portion of other welfare
Total 692,632,415.17 2,942,528,227.86 2,898,797,542.98 736,363,100.05
(2). List of short-term compensation
√Applicable □Inapplicable
Unit:Yuan Currency: RMB
Item Beginning
balance
Increase in the
current period
Decrease in the
current period Ending balance
I. Wages, salaries, bonuses,
allowances and subsidies 661,427,496.63 2,588,209,031.25 2,556,018,211.22 693,618,316.66
II. Employee benefits 158,213,269.41 158,213,269.41
III. Social insurance premium 63,336,676.38 63,336,676.38
Including: medical insurance
premium 57,130,949.71 57,130,949.71
Industrial injury insurance premium 1,667,977.03 1,667,977.03
Maternity insurance premium 4,537,749.64 4,537,749.64
IV. Housing fund 37,079.41 35,417,791.31 35,454,870.72
V. Labor union expenditure and
employee education fund 31,167,839.13 47,536,766.47 35,959,822.21 42,744,783.39
VI. Short-term compensated absence
VII. Short-term profit sharing plan
VIII. Non-monetary welfare 296,654.48 296,654.48
IX. Others 769,626.17 769,626.17

2020 Annual Report
180 / 246
Total 692,632,415.17 2,893,779,815.47 2,850,049,130.59 736,363,100.05
(3). List of defined contribution plan
√Applicable □Inapplicable
Unit:Yuan Currency: RMB
Item Beginning balance Increase in the
current period
Decrease in the
current period Ending balance
1 .Basic retirement insurance 39,239,483.23 39,239,483.23
2.Unemployment insurance
premium
1,607,590.35 1,607,590.35
3.Enterprise annuity
Total 40,847,073.58 40,847,073.58
Other notes:
√Applicable □Inapplicable
Note: the balance of wages, bonuses, allowances and subsidies payable is the December wage and
bonus of the current year paid in the next month, so there is no case of salary arrears.
40. Taxes and fees payable
√Applicable □Inapplicable
Unit:Yuan Currency:RMB Item Ending balance Beginning balance
VAT 17,055,192.80 50,438,638.48
Enterprise income tax 176,762,634.48 92,588,221.35
Individual income tax 10,437,660.41 9,901,760.58
Property tax 6,137,519.90 4,975,347.13
Land use tax 2,837,025.80 2,869,677.91
Stamp tax 3,578,837.17 2,003,732.92
Others 3,605,895.35 10,767,128.99
Total 220,414,765.91 173,544,507.36
Other notes:
According to the Corporate Income Tax Law, the parent company of the Company pays corporate
income tax. The taxable income of the headquarters and branches accounts for 50% of the total tax. The
remaining branches are distributed based on income, employee remuneration, and assets. The proportions
are 35%, 35%, and 30% respectively; the income tax payable is calculated by multiplying the allocated
taxable income by the applicable tax rate of each institution. The income tax payable by the headquarters
and branch offices accounts for 50%, and the remaining part is distributed based on income, employee
compensation, and assets, and the proportions are 35%, 35%, and 30% respectively.
41. Other payables
Item presentation
√Applicable □Inapplicable
Unit:Yuan Currency: RMB Item Ending balance Beginning balance
Interest payable 53,828,469.22
Dividend payable 1,188,940.27
Other payables 743,639,264.91 558,243,859.36
Total 743,639,264.91 613,261,268.85
Other notes:
□Applicable √Inapplicable
Interest payable
(1). Classification presentation
√Applicable □Inapplicable
Unit:Yuan Currency: RMB Item Ending balance Beginning balance

2020 Annual Report
181 / 246
Interest payable on long-term loans for
repayment of interest by installments and
repayment of principal
5,108,380.87
Interest of corporate bonds 44,052,827.59
Interest payable on short-term loans 4,667,260.76
Total 53,828,469.22
Significant interest due but unpaid
□Applicable √Inapplicable
Other notes:
□Applicable √Inapplicable
Dividend payable
(2). Classification presentation
√Applicable □Inapplicable
Unit:Yuan Currency: RMB Item Ending balance Beginning balance
Common stock dividend 1,188,940.27
Total 1,188,940.27
Other notes: including significant dividends payable unpaid for over one year. The unpaid reason shall
be disclosed:
1) The Company has no dividends payable unpaid for over one year;
2) Common stock dividends payable at the end of the period are dividends payable to minority
shareholders by Sichuan Tongwei Sanlian Aquatic Products Co., Ltd.
Other payables
(1). List of other payables by nature
√Applicable □Inapplicable
Unit:Yuan Currency: RMB Item Ending balance Beginning balance
Current accounts of affiliated units 1,119,397.77 30,373,880.57
Margin and deposit 499,462,015.47 366,860,864.13
Equity transfer 91,500,000.00 1,900,000.00
Others 151,557,851.67 159,109,114.66
Total 743,639,264.91 558,243,859.36
(2). Payables with significant amount and account receivable age over one year
√Applicable □Inapplicable
Unit:Yuan Currency: RMB
Item Ending balance Unpaid or carry-forward reasons
Inner Mongolia Taimengda Material
Management Co., Ltd.
76,000,000.00 Margin during the settlement
period
Total 76,000,000.00 /
Other notes:
□Applicable √Inapplicable
42. Held-for-sale liabilities
□Applicable √Inapplicable
43. Non-current liabilities due within one year
√Applicable □Inapplicable
Unit:Yuan Currency: RMB Item Ending balance Beginning balance
Long-term loans due within one year 1,076,804,937.39 139,118,287.89
Long-term payables due within one year 1,456,897,221.32 1,003,066,784.95

2020 Annual Report
182 / 246
Total 2,533,702,158.71 1,142,185,072.84
Other notes:
(1) Long-term loans due within one year Item Ending balance Beginning balance
Credit loans 1,164,229.82
Guaranteed loans 570,152,809.18 112,384,300.00
Pledged loans 16,733,987.89
Pledge + guaranteed loan 90,154,083.77
Mortgage + guaranteed loan 300,403,333.34 10,000,000.00
Mortgage + pledge + guaranteed loan 114,930,481.28
Total 1,076,804,937.39 139,118,287.89
1) At the end of the period, the Company’s guaranteed loan due within one year is RMB
570,152,809.18, pledge + guaranteed loan is RMB 90,154,083.77, mortgage + guaranteed loan is RMB
300,403,333.34, mortgage + pledge + guaranteed loan is RMB 114,930,481.28, Tongwei Group Co., Ltd.
guarantees the company’s guarantee for the company, and see "related party guarantee". The company's
guarantees for its subsidiaries are as follows: Guarantee Guaranteed party Amount
guaranteed
Guaranteed start
date
Guaranteed due
date
Tongwei Co., Ltd. Tongwei Solar (Chengdu) Co., Ltd. 201,138,888.89 2019/11/27 2021/11/26
Tongwei Co., Ltd. Tongwei Solar (Hefei) Co., Ltd. 300,403,333.34 2019/10/29 2021/10/29
Tongwei Co., Ltd. Tongwei New Energy Co., Ltd. 5,147,353.92 2019/3/18 2021/5/20
Tongwei Co., Ltd. Tongwei New Energy Co., Ltd. 5,000,000.00 2019/3/18 2021/11/20
Tongwei Co., Ltd. Aohanqi Xinhuo New Energy Co., Ltd. 20,579,104.17 2020/3/27 2021/3/26
Tongwei Co., Ltd. Aohanqi Xinhuo New Energy Co., Ltd. 20,000,000.00 2020/3/27 2021/9/26
Tongwei Co., Ltd. Panzhihua Tongwei Huijin New Energy Co., Ltd. 11,109,555.56 2019/6/28 2021/4/10
Tongwei Co., Ltd. Binzhou Zhanhua District Tonghui Ocean Technology
Co., Ltd. 15,118,833.33 2020/12/30 2021/6/20
Tongwei Co., Ltd. Binzhou Zhanhua District Tonghui Ocean Technology
Co., Ltd. 15,000,000.00 2020/12/30 2021/12/20
Tongwei Co., Ltd. Tianjin Binhai New Area Tongli New Energy Co., Ltd. 10,397,833.34 2020/6/30 2021/6/10
Tongwei Co., Ltd. Tianjin Binhai New Area Tongli New Energy Co., Ltd. 17,500,000.00 2020/6/30 2021/12/10
Tongwei Co., Ltd. Xichang Tongwei New Energy Co., Ltd. 3,417,502.91 2020/9/27 2021/6/21
Tongwei Co., Ltd. Xichang Tongwei New Energy Co., Ltd. 3,300,000.00 2020/9/27 2021/12/21
Tongwei Co., Ltd. Sihong Tongli New Energy Co., Ltd. 12,446,755.64 2019/10/20 2021/4/20
Tongwei Co., Ltd. Sihong Tongli New Energy Co., Ltd. 38,000,000.00 2019/10/20 2021/10/20
Tongwei Co., Ltd. Gaoan Tongwei Fishery & PV Integration Technology
Co., Ltd. 8,258,131.39 2020/4/1 2021/6/21
Tongwei Co., Ltd. Gaoan Tongwei Fishery & PV Integration Technology
Co., Ltd. 8,000,000.00 2020/4/1 2021/12/21
Tongwei Co., Ltd. Changde Dingcheng Tongwei New Energy Co., Ltd. 4,809,494.79 2020/9/11 2021/6/20
Tongwei Co., Ltd. Changde Dingcheng Tongwei New Energy Co., Ltd. 7,000,000.00 2020/9/11 2021/12/20
Total 706,626,787.28
The amount of ending long-term loans of Tongwei New Energy Co., Ltd. is RMB 10,000,000.00 due
within one year with mortgage guarantee by the powerplant assets of Xide Tongwei Huijin New Energy
Co., Ltd., a wholly-owned subsidiary of Tongwei Huijin New Energy Co., Ltd. which is the controlling
subsidiary of Tongwei New Energy Co., Ltd., and pledge guarantee by electricity fee income right of Xide
Tongwei Huijin New Energy Co., Ltd. powerplant, and warrandice of the loans by the Company.
2) For details of pledged loans and mortgage, please refer to "Assets with Limited Ownership or Use
Right".
3) There is no overdue loan in the current portion of long-term loans.
(2) For details of long-term payables due within one year, please refer to "Long-term Payables".
44. Other current liabilities
Other current liabilities
√Applicable □Inapplicable
Unit:Yuan Currency:RMB Item Ending balance Beginning balance
Short-term bonds payable 1,099,583,333.30
Payable return payment
Tax amount to be charged off 108,250,357.80 36,454,687.93

2020 Annual Report
183 / 246
Provisions made by guarantee companies 21,953,762.73 24,221,753.62
Total 130,204,120.53 1,160,259,774.85
Changes in short-term bonds payable:
√Applicable □Inapplicable

2020 Annual Report
184 / 246
Unit:Yuan Currency: RMB
Bond
name
Face
value
Issuance
date
Bond
term
Issuance
amount
Beginning
balance
Issuance in this
period
Interest
accrued
according to
face value
Amortization
of premium
or discount
Repayment in
the current
period
Ending
balance
2019 Phase I
Short-Term
Financing Bill
of Tongwei
Co., Ltd.
100.00 2019/3/12 365 days 500,000,000.00 499,833,333.30 5,009,787.43 504,843,120.73
2019 Phase IV
Short-Term
Financing Bill
of Tongwei
Co., Ltd.
100.00 2019/9/20 270 days 300,000,000.00 299,750,000.00 6,353,276.45 306,103,276.45
2019 Phase V
Short-Term
Financing Bill
of Tongwei
Co., Ltd.
100.00 2019/9/27 100days 300,000,000.00 300,000,000.00 132,938.69 300,132,938.69
2020 Phase I
Super & Short-
term Financing
Bill of
Tongwei Co.,
Ltd.
100.00 2020/1/14 150 days 300,000,000.00 300,000,000.00 5,286,885.25 250,000.00 305,536,885.25
2020 Phase II
Super & Short-
term Financing
Bill of
Tongwei Co.,
Ltd.
100.00 2020/2/18 180 days 500,000,000.00 500,000,000.00 8,852,459.02 500,000.00 509,352,459.02
Total / / / 1,900,000,000.00 1,099,583,333.30 800,000,000.00 25,635,346.84 750,000.00 1,925,968,680.14
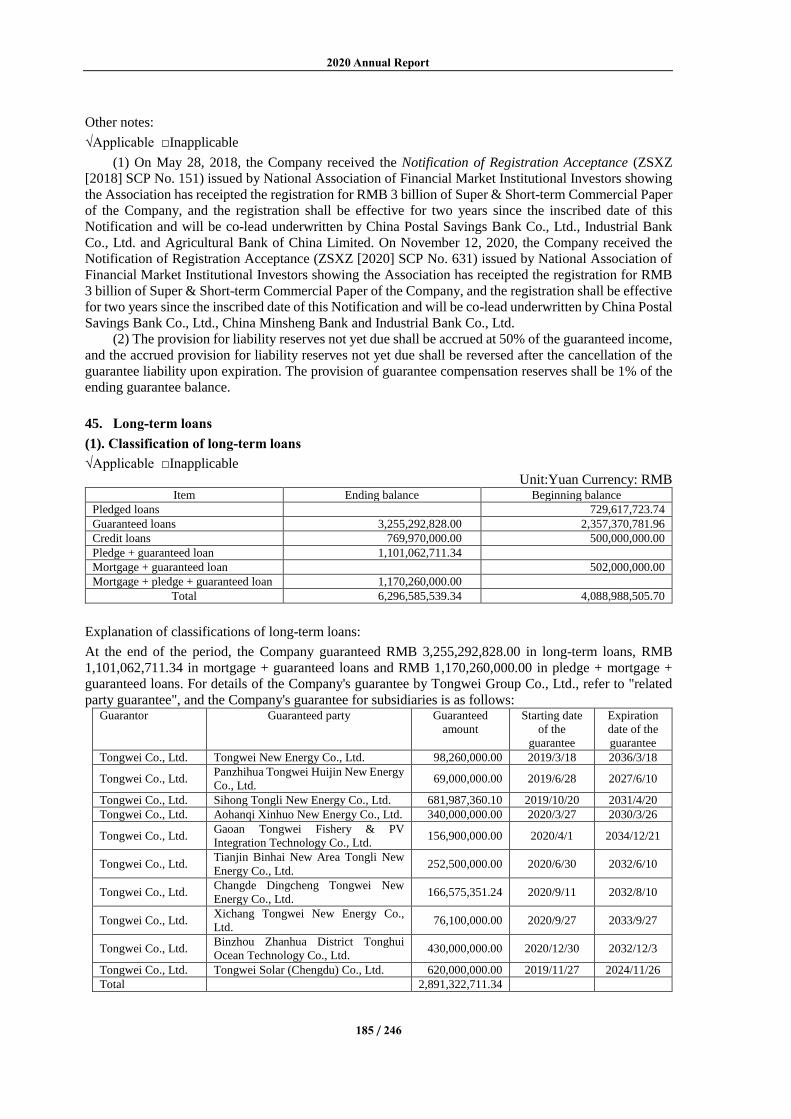
2020 Annual Report
185 / 246
Other notes:
√Applicable □Inapplicable
(1) On May 28, 2018, the Company received the Notification of Registration Acceptance (ZSXZ
[2018] SCP No. 151) issued by National Association of Financial Market Institutional Investors showing
the Association has receipted the registration for RMB 3 billion of Super & Short-term Commercial Paper
of the Company, and the registration shall be effective for two years since the inscribed date of this
Notification and will be co-lead underwritten by China Postal Savings Bank Co., Ltd., Industrial Bank
Co., Ltd. and Agricultural Bank of China Limited. On November 12, 2020, the Company received the
Notification of Registration Acceptance (ZSXZ [2020] SCP No. 631) issued by National Association of
Financial Market Institutional Investors showing the Association has receipted the registration for RMB
3 billion of Super & Short-term Commercial Paper of the Company, and the registration shall be effective
for two years since the inscribed date of this Notification and will be co-lead underwritten by China Postal
Savings Bank Co., Ltd., China Minsheng Bank and Industrial Bank Co., Ltd.
(2) The provision for liability reserves not yet due shall be accrued at 50% of the guaranteed income,
and the accrued provision for liability reserves not yet due shall be reversed after the cancellation of the
guarantee liability upon expiration. The provision of guarantee compensation reserves shall be 1% of the
ending guarantee balance.
45. Long-term loans
(1). Classification of long-term loans
√Applicable □Inapplicable
Unit:Yuan Currency: RMB Item Ending balance Beginning balance
Pledged loans 729,617,723.74
Guaranteed loans 3,255,292,828.00 2,357,370,781.96
Credit loans 769,970,000.00 500,000,000.00
Pledge + guaranteed loan 1,101,062,711.34
Mortgage + guaranteed loan 502,000,000.00
Mortgage + pledge + guaranteed loan 1,170,260,000.00
Total 6,296,585,539.34 4,088,988,505.70
Explanation of classifications of long-term loans:
At the end of the period, the Company guaranteed RMB 3,255,292,828.00 in long-term loans, RMB
1,101,062,711.34 in mortgage + guaranteed loans and RMB 1,170,260,000.00 in pledge + mortgage +
guaranteed loans. For details of the Company's guarantee by Tongwei Group Co., Ltd., refer to "related
party guarantee", and the Company's guarantee for subsidiaries is as follows: Guarantor Guaranteed party Guaranteed
amount
Starting date
of the
guarantee
Expiration
date of the
guarantee
Tongwei Co., Ltd. Tongwei New Energy Co., Ltd. 98,260,000.00 2019/3/18 2036/3/18
Tongwei Co., Ltd. Panzhihua Tongwei Huijin New Energy
Co., Ltd. 69,000,000.00 2019/6/28 2027/6/10
Tongwei Co., Ltd. Sihong Tongli New Energy Co., Ltd. 681,987,360.10 2019/10/20 2031/4/20
Tongwei Co., Ltd. Aohanqi Xinhuo New Energy Co., Ltd. 340,000,000.00 2020/3/27 2030/3/26
Tongwei Co., Ltd. Gaoan Tongwei Fishery & PV
Integration Technology Co., Ltd. 156,900,000.00 2020/4/1 2034/12/21
Tongwei Co., Ltd. Tianjin Binhai New Area Tongli New
Energy Co., Ltd. 252,500,000.00 2020/6/30 2032/6/10
Tongwei Co., Ltd. Changde Dingcheng Tongwei New
Energy Co., Ltd. 166,575,351.24 2020/9/11 2032/8/10
Tongwei Co., Ltd. Xichang Tongwei New Energy Co.,
Ltd. 76,100,000.00 2020/9/27 2033/9/27
Tongwei Co., Ltd. Binzhou Zhanhua District Tonghui
Ocean Technology Co., Ltd. 430,000,000.00 2020/12/30 2032/12/3
Tongwei Co., Ltd. Tongwei Solar (Chengdu) Co., Ltd. 620,000,000.00 2019/11/27 2024/11/26
Total 2,891,322,711.34

2020 Annual Report
186 / 246
① The loan of RMB 98,260,000.00 obtained by Tongwei New Energy Co., Ltd. was pledged by the
powerplant assets of the wholly-owned subsidiary of Tongwei Huijin New Energy Co., Ltd., a subsidiary
of Tongwei New Energy Co., Ltd. The right of income from the electricity fee of the powerplant is pledged
by the Company.
② The loan of RMB 69,000,000.00 obtained by Panzhihua Tongwei Huijin New Energy Co., Ltd.
was pledged by the powerplant assets of Panzhihua Tongwei Huijin New Energy Co., Ltd., and the
powerplant electricity fee income right was pledged by Panzhihua Tongwei Huijin New Energy Co. The
loan is guaranteed by the Company.
③ The loan of RMB 681,987,360.10 obtained by Sihong Tongli New Energy Co., Ltd. was pledged
by the powerplant electricity fee income right of Sihong Tongli New Energy Co., Ltd., which was secured
by Hengfeng County Jingxin Power Co., Ltd. and Huludao City Lianshan Tongwei New Energy Co., Ltd.
and the shares held by Sihong Tongli New Energy Co., Ltd. provide equity pledge guarantee, and the
Company provides guarantee.
④The loan of RMB 340,000,000.00 obtained by Aohanqi Xinhuo New Energy Co., Ltd. was
pledged and guaranteed by the powerplant assets of Aohanqi Xinhuo New Energy Co., Ltd., and the
power income right of the powerplant was pledged and guaranteed by the 80% equity of Aohanqi
Xinhuo New Energy Co., Ltd.; and the Company provides guarantee.
⑤ The loan of RMB 156,900,000.00 obtained by Gaoan Tongwei Yuguang Integrated Technology
Co., Ltd. was pledged and guaranteed by the powerplant assets of Gaoan Tongwei Yuguang Integrated
Technology Co., Ltd. The power income right of the powerplant is pledged and guaranteed by the
Company.
⑥ The loan of RMB 252,500,000.00 obtained by Tianjin Binhai New Area Tongli New Energy Co.,
Ltd. was pledged and guaranteed by the powerplant electricity fee income right of Tianjin Binhai New
Area Tongli New Energy Co., Ltd., and 100% of equity pledge guarantee of the Tianjin Binhai New Area
held by Tongwei New Energy Technology (Beijing) Co., Ltd.; and the Company provides guarantee.
⑦ The loan of RMB 166,575,351.24 obtained by Changde Dingcheng Tongwei New Energy Co.,
Ltd. was pledged and guaranteed by the powerplant power income right of Changde Dingcheng Tongwei
New Energy Co., Ltd., and the Company provides guarantee.
⑧ The loan of RMB 76,100,000.00 obtained by Xichang Tongwei New Energy Co., Ltd. was
pledged and guaranteed by the powerplant assets of Xichang Tongwei New Energy Co., Ltd., and the
power income right of the powerplant was pledged and guaranteed; and the Company provides guarantee.
⑨The loan of RMB 430,000,000.00 obtained by Tonghui Ocean Technology Co., Ltd. in Zhanhua
District of Binzhou City was pledged and guaranteed by the powerplant assets of Tonghui Ocean
Technology Co., Ltd. in Zhanhua District, Binzhou City. (Shenzhen) Co., Ltd. The powerplant fee equity
was used as the pledge and guarantee; 51% of stock equity of Binzhou Zhanhua District Tonghui Ocean
Technology Co., Ltd. was used as pledge guarantee, and the Company provides guarantee.
Other notes, including the interest rate collar:
√Applicable □Inapplicable
The interest rate of long-term loans is between 2.65% and LPR+0.35% with five-year.
46. Bonds payable
(1). Bonds payable
√Applicable □Inapplicable
Unit:Yuan Currency: RMB Item Ending balance Beginning balance
2019 Convertible Corporate Bonds of Tongwei Co., Ltd. 4,212,346,552.36
2020 phase I medium-term notes of Tongwei Co., Ltd. 410,096,446.33
Total 410,096,446.33 4,212,346,552.36
(2). Increase/decrease of bond payable (preferred shares, perpetual bond and other financial
instruments classified as financial liabilities excluded)
√Applicable □Inapplicable

2020 Annual Report
187 / 246
Unit:Yuan Currency:RMB
Bond
name
Face
value
Issuance
date
Bond
term
Issuance
amount
Beginning
balance
Issuance in
this period
Interest accrued
according to face
value
Amortization
of premium or
discount
Repayment in the
current period
Ending
balance
2019 Convertible Corporate
Bonds of Tongwei Co., Ltd. 100.00 2019/3/18 6 years 5,000,000,000.00 4,212,346,552.36 5,169,637.71 44,242,854.61 4,261,759,044.68
2020 Phase I Medium-term Notes of Tongwei Co., Ltd.
100.00 2020/6/17 3 years 400,000,000.00 400,000,000.00 11,093,333.31 203,113.02 1,200,000.00 410,096,446.33
Total / / / 5,400,000,000.00 4,212,346,552.36 400,000,000.00 16,262,971.02 44,445,967.63 4,262,959,044.68 410,096,446.33

2020 Annual Report
188 / 246
(3). Explanation of conversion condition and conversion time of convertible corporate bonds
√Applicable □Inapplicable
1) According to the twentieth meeting of the sixth board of directors of the Company held on
December 15, 2017, and the resolutions of the first extraordinary general meeting of shareholders of 2018
held on January 5, 2018, after approved by Reply on Approval of the Public Issuance of Convertible Bonds
of Tongwei Co., Ltd. (ZJXK [2018] No. 1730) of China Securities Regulatory Commission on October 27,
2018, the Company publicly issued 5 billion yuan of convertible bonds (6 years) on March 18, 2019; after
deducting the sponsorship and underwriting costs, as of March 22, 2019, the Company received RMB
4,942,500,000.00 for the subscription of convertible bonds. The Company received the approval of the
Self-Regulatory Decision [2019] No.052 of Shanghai Stock Exchange, and the 5 billion Convertible
corporate bonds of the Company will be listed for trading on the Shanghai Stock Exchange on April 10,
2019. The abbreviation of the bond is "Tongwei Convertible Bonds" and the bond code is "110054".
According to the Prospectus of Tongwei Co., Ltd. about Public Issuance of A-Shares Convertible
Corporate Bonds, the conversion price is RMB 12.44 yuan/share. As the Company reviewed and approved
at the 2018 Annual General Meeting of Shareholders, based on the total share capital on the registration
date of the dividend payment, a cash dividend of RMB 1.60 (including tax) will be distributed to all
shareholders for every 10 shares; therefore the convertible bond conversion price was adjusted to 12.28
yuan/share, which took effect on May 23, 2019; the company’s shares had 15 shares in 30 consecutive
trading days from January 14, 2020 to March 3, 2020. The closing price of each trading day was not less
than 130% of the current conversion price of "Tongwei Convertible Bonds" (i.e 15.96 yuan/share), the
redemption clause of "Tongwei Convertible Bonds" was triggered, which was reviewed at the sixth
meeting of the seventh board of directors. The Company was approved to exercise the right of early
redemption and redeem all the "Tongwei Convertible Bonds" registered on the "redemption registration
date". As of the redemption registration date (March 16, 2020), the cumulative face value of RMB
4,979,353,000 was " Tongwei Convertible Bonds", which have been converted into company stocks, with
405,483,464 shares converted. Shanghai Branch was registered and settled in China on March 17, 2020,
and the industrial and commercial registration was completed on May 19, 2020. The Company has
redeemed 206,470 "Tongwei Convertible Bonds" with a face value of RMB 20,647,000. The total amount
of redemption and redemption was RMB 20,750,028.53. The redemption payment date was March 17,
2020.
2) On April 2, 2020, the Company obtained the Notice of Acceptance of Registration issued by the
China Interbank Market Exchange Association (ZSXZ [2020] MTN311), and accepted the company's
medium-term note registration with a registered amount of 5 billion yuan. The quota is valid for 2 years
from the date of inscription of the notice and is jointly underwritten by China Postal Savings Bank Co.,
Ltd. and China Securities Co., Ltd.
(4). Explanation of other financial instruments classified as financial liabilities
Basic information of other financial instruments as preferred shares and perpetual bonds externally
issued at the end of period
□Applicable √Inapplicable
Variation to other financial instruments as preferred shares and perpetual bonds externally issued at the
end of period
□Applicable √Inapplicable
Basis for financial instruments classified as financial liabilities:
□Applicable √Inapplicable
Other notes:
□Applicable √Inapplicable
47. Lease liabilities
□Applicable √Inapplicable
48. Long-term payables
Item presentation
√Applicable □Inapplicable

2020 Annual Report
189 / 246
Unit:Yuan Currency: RMB Item Ending balance Beginning balance
Long-term payables 2,525,722,275.65 1,900,657,753.72
Special payables 850,000.00 850,000.00
Total 2,526,572,275.65 1,901,507,753.72
Other notes:
□Applicable √Inapplicable
Long-term payables
(1). Presentation of long-term payables by nature
√Applicable □Inapplicable
Unit:Yuan Currency: RMB
Item Beginning balance Ending balance
Net deferred debt repayment 330,905,754.60 488,862,566.78
Finance lease payable 2,194,816,521.05 1,411,795,186.94
Total 2,525,722,275.65 1,900,657,753.72
Other notes:
1) The net amount of deferred debt repayment is listed as follows:
Item Ending balance Beginning balance
Socialized Service Company in Hefei High-tech Industrial Development Zone 452,115,821.87 602,821,095.82
Hefei High-tech Innovation Park Management Co., Ltd. 59,021,050.61 78,694,734.21
Hefei High-tech Construction Investment Group Company 44,126,880.00 58,835,840.00
Total original value of liabilities 555,263,752.48 740,351,670.03
Less: unrecognized financing expenses measured at fair value 39,270,080.33 66,401,185.70
Net debt deferred payments 515,993,672.15 673,950,484.33
Including: due within one year 185,087,917.55 185,087,917.55
Due over one year 330,905,754.60 488,862,566.78
In February 2016, Tongwei Solar (Hefei) Co., Ltd., Tongwei Group Co., Ltd., Hefei High-tech
Innovation Park Management Co., Ltd., Management Committee of Hefei High-tech Industrial
Development Zone, and Hefei High-tech Urban Construction Investment Co., Ltd jointly signed a
supplementary agreement to the Debt Restructuring Agreement, stipulating that Tongwei Solar (Hefei)
Co., Ltd. will transfer the debt receivable of RMB 925,439,587.58; it shall be paid off for 5 years from
2019; according to the agreement, the paid debt of Tongwei Solar (Hefei) Co., Ltd. was RMB
185,087,917.55; and the accumulated paid debt was RMB 370,175,835.10.
2) Financial leases are listed as follows: Item Ending balance Beginning balance
Finance lease payable 2,356,443,895.93 1,521,164,138.14
Less: unrecognized financing costs 161,627,374.88 109,368,951.20
Net finance lease payables 2,194,816,521.05 1,411,795,186.94
3) The Company is listed by financial lease as follows: Item Beginning balance Ending balance
Finance lease 2,447,704,832.76 3,773,885,404.96
Including: 1. China Huarong Financial Leasing Co., Ltd. 747,038,538.93 418,719,303.30
2. CITIC Financing Leasing Co., Ltd. 1,223,643,182.31 1,844,349,985.40
3. SPDB Financial Leasing Co., Ltd. 412,623,111.52 446,412,861.36
4. Jiangsu Financial Leasing Co., Ltd. 64,400,000.00 891,304,326.00
5. Industrial Financial Leasing Co., Ltd. 173,098,928.90
Less: unrecognized financing costs 217,930,778.42 307,259,580.14
Including: 1. China Huarong Financial Leasing Co., Ltd. 27,629,534.11 13,348,710.73
2. CITIC Financing Leasing Co., Ltd. 135,824,354.86 173,843,439.69
3. SPDB Financial Leasing Co., Ltd. 48,126,152.27 49,804,509.85
4. Jiangsu Financial Leasing Co., Ltd. 6,350,737.18 48,712,778.06
5. Industrial Financial Leasing Co., Ltd. 21,550,141.81
Net finance lease payments 2,229,774,054.34 3,466,625,824.82
Including: 1. China Huarong Financial Leasing Co., Ltd. 719,409,004.82 405,370,592.57
2. CITIC Financing Leasing Co., Ltd. 1,087,818,827.45 1,670,506,545.71

2020 Annual Report
190 / 246
3. SPDB Financial Leasing Co., Ltd. 364,496,959.25 396,608,351.51
4. Jiangsu Financial Leasing Co., Ltd. 58,049,262.82 842,591,547.94
5. Industrial Financial Leasing Co., Ltd. 151,548,787.09
Less: financial lease payments due within one year 926,540,694.62 1,417,441,509.03
Including: 1. China Huarong Financial Leasing Co., Ltd. 463,457,911.41 282,710,178.03
2. CITIC Financing Leasing Co., Ltd. 339,702,998.01 549,153,605.74
3. SPDB Financial Leasing Co., Ltd. 104,779,785.20 121,714,324.58
4. Jiangsu Financial Leasing Co., Ltd. 18,600,000.00 431,585,260.00
5. Industrial Financial Leasing Co., Ltd. 32,278,140.68
Less: unrecognized financing expenses due within one year 108,561,827.22 145,632,205.26
Including: 1. China Huarong Financial Leasing Co., Ltd. 21,188,716.25 9,746,923.42
2. CITIC Financing Leasing Co., Ltd. 64,649,046.98 79,859,241.12
3. SPDB Financial Leasing Co., Ltd. 20,021,411.54 19,941,254.45
4. Jiangsu Financial Leasing Co., Ltd. 2,702,652.45 29,697,034.62
5. Industrial Financial Leasing Co., Ltd. 6,387,751.65
Net finance lease payments due within one year 817,978,867.40 1,271,809,303.77
Including: 1. China Huarong Financial Leasing Co., Ltd. 442,269,195.16 272,963,254.61
2. CITIC Financing Leasing Co., Ltd. 275,053,951.03 469,294,364.62
3. SPDB Financial Leasing Co., Ltd. 84,758,373.66 101,773,070.13
4. Jiangsu Financial Leasing Co., Ltd. 15,897,347.55 401,888,225.38
5. Industrial Financial Leasing Co., Ltd. 25,890,389.03
Finance lease payments due over one year 1,521,164,138.14 2,356,443,895.93
Including: 1. China Huarong Financial Leasing Co., Ltd. 283,580,627.52 136,009,125.27
2. CITIC Financing Leasing Co., Ltd. 883,940,184.30 1,295,196,379.66
3. SPDB Financial Leasing Co., Ltd. 307,843,326.32 324,698,536.78
4. Jiangsu Financial Leasing Co., Ltd. 45,800,000.00 459,719,066.00
5. Industrial Financial Leasing Co., Ltd. 140,820,788.22
Less: unrecognized financing expenses due over one year 109,368,951.20 161,627,374.88
Including: 1. China Huarong Financial Leasing Co., Ltd. 6,440,817.86 3,601,787.31
2. CITIC Financing Leasing Co., Ltd. 71,175,307.88 93,984,198.57
3. SPDB Financial Leasing Co., Ltd. 28,104,740.73 29,863,255.40
4. Jiangsu Financial Leasing Co., Ltd. 3,648,084.73 19,015,743.44
5. Industrial Financial Leasing Co., Ltd. 15,162,390.16
Net finance lease payments due over one year 1,411,795,186.94 2,194,816,521.05
Including: 1. China Huarong Financial Leasing Co., Ltd. 277,139,809.66 132,407,337.96
2. CITIC Financing Leasing Co., Ltd. 812,764,876.42 1,201,212,181.09
3. SPDB Financial Leasing Co., Ltd. 279,738,585.59 294,835,281.38
4. Jiangsu Financial Leasing Co., Ltd. 42,151,915.27 440,703,322.56
5. Industrial Financial Leasing Co., Ltd. 125,658,398.06
①As of December 31, 2020, Inner Mongolia Tongwei High-purity Crystalline Silicon Co., Ltd. used
direct lease financing to form a net financial lease of 125,127,268.43 yuan, which was guaranteed by the
Company and Sichuan Yongxiang Co., Ltd.
② As of December 31, 2020, Sichuan Yongxiang New Energy Co., Ltd. used direct lease financing
to form a net financial lease of RMB147,819,977.40, which was guaranteed by the Company and Sichuan
Yongxiang Co., Ltd.
③ As of December 31, 2020, Tongwei Solar (Chengdu) Co., Ltd. used direct lease financing to form
a net financial lease of RMB132,423,346.74, which was guaranteed by the Company and Sichuan
Yongxiang Co., Ltd.
④As of December 31, 2020, the Company’s PV powerplant company used sale and leaseback
financing to form a net financial lease of RMB3,061,255,232.25, all of which were provided by the
Company as a joint liability guarantee. The leaseback subject provided mortgage guarantee, and the
shareholders of the affiliated company provided equity pledge guarantee with their equity.
⑤ The annual interest rate range of the above financing is 4.55%-5.89%.
Special payables
(2). Presentation of special payables by nature
√Applicable □Inapplicable
Unit:Yuan Currrency: RMB

2020 Annual Report
191 / 246
Item
Beginning balance Increase in the current
period
Decrease
in the
current
period
Ending
balance
Reason of
formation
Special fund for
agricultural credit
guarantee of Tongwei
agricultural guarantee
850,000.00 850,000.00
Total 850,000.00 850,000.00 /
Other notes:
The amount of special fund for agricultural credit guarantee of Tongwei agricultural guarantee is
RMB 2,480,000.00, including: risk subsidy for RMB 1,630,000.00 and compensation fund for RMB
850,000.00. This fund shall be managed and used in accordance with the "Financial Special Subsidy Fund
Management Measures of Sichuan Provincial Agricultural Credit Guarantee" issued by Sichuan Provincial
Finance Department on August 28, 2012. Article 18 of the Measures stipulates that: The funds will be
used to increase the capital of guarantee institutions instead of subsidies, and will be injected in the form
of state-owned capital. Whenever a guarantee institution receives a total amount of more than RMB 10
million (including RMB 10 million) in compensation funds, it shall promptly report to the relevant
departments for approval before completing the change of industrial and commercial registration of
registered capital, etc. in accordance with the relevant provisions; the risk subsidy fund shall be used to
compensate for the guarantee risk loss when the risk reserves drawn by the guarantee institution is
insufficient to compensate for the loss; balance (if any) will be carried forward to the next year. The fund
received by the Company has been used in 2018 to make up for the loss of RMB 1,630,000.00 due to the
irrecoverable part of the compensation receivable, with a balance of RMB 850,000.00.
49. Long-term employee compensation payable
□Applicable √Inapplicable
50. Estimated liabilities
□Applicable √Inapplicable
51. Deferred incomes
Deferred incomes
√Applicable □Inapplicable
Unit:Yuan Currency: RMB
Item Beginning
balance
Increase in the
current period
Decrease in the
current period Ending balance
Reason of
formation
Government
subsidies
544,324,456.73 327,674,941.00 89,725,680.59 782,273,717.14
Total 544,324,456.73 327,674,941.00 89,725,680.59 782,273,717.14 /
Projects with government subsidies
√Applicable □Inapplicable
Unit:Yuan Currency: RMB
Liability items Beginning
balance
Newly
increased
amount of
subsidy in the
current period
Amount
of non-
operating
income
of
current
period
Other income
amount
included in
the current
period
Other
changes Ending balance
Related to
assets/related
to income
2.3GW one
project one
discussion
fixed asset
investment
rewards
120,000,000.00 8,636,444.99 111,363,555.01 Related to
assets
Fixed
investment 56,579,428.55 55,000,000.00 11,742,239.88 99,837,188.67
Related to
assets

2020 Annual Report
192 / 246
subsidy at
Phase II
Fixed asset
investment
subsidy
39,757,270.40 37,000,000.00 6,565,611.84 70,191,658.56 Related to
assets
Land
investment
subsidy
58,983,050.85 1,220,339.04 57,762,711.81 Related to
assets
Special fund
for
infrastructure
construction
57,552,400.00 1,918,413.32 55,633,986.68 Related to
assets
High-purity
polysilicon
subsidy
41,700,065.67 1,604,296.20 40,095,769.47 Related to
assets
Fixed assets
technological
transformation
project
subsidies of "
Post-award
and Subsidy
Fund"
43,732,897.16 5,660,190.95 38,072,706.21 Related to
assets
2GW
intelligent
factory skills
upgrading
project
33,435,780.27 5,090,000.00 8,088,900.13 30,436,880.14 Related to
assets
Special
subsidy for
1GW project
fixed assets
and sewage
station
30,012,000.00 4,392,000.00 25,620,000.00 Related to
assets
Baotou's
financial
emerging
strategic
subsidy
23,263,888.90 2,083,333.32 21,180,555.58 Related to
assets
Triple one
innovation
fixed assets
subsidies
802,330.87 17,471,200.00 1,662,311.96 16,611,218.91 Related to
assets
New energy
project
subsidy
18,888,888.88 1,666,666.68 17,222,222.20 Related to
assets
Tianjin feed
relocation
compensation
20,793,751.82 4,694,164.68 16,099,587.14 Related to
assets
Provincial
special fund
for strategic
emerging
industries
projects in
2018
17,614,678.88 2,201,834.88 15,412,844.00 Related to
assets
Compensation
for Huai'an
feed
relocation
17,777,215.73 2,794,704.48 14,982,511.25 Related to
assets
Subsidy for
research and
development
of instruments
and
equipment
12,246,615.80 1,517,196.26 10,729,419.54 Related to
assets

2020 Annual Report
193 / 246
Provincial
special fund
for strategic
emerging
industries
projects in
2017
10,658,853.47 1,438,998.84 9,219,854.63 Related to
assets
Compensation
for Chongqing
Tongwei
relocation
10,923,076.22 2,061,528.36 8,861,547.86 Related to
assets
Other items
related to
assets
106,332,336.62 30,259,341.00 15,382,744.47 -441,042.54 120,767,890.61 Related to
assets
Other items
related to
income
822,326.64 5,302,000.00 1,294,384.42 -
2,658,333.35 2,171,608.87
Related to
income
Total 544,324,456.73 327,674,941.00 86,626,304.70 -
3,099,375.89 782,273,717.14
Other notes:
√Applicable □Inapplicable
Other changes RMB 3,099,375.89 were due to the reduction of government subsidies of RMB 441,042.54
due to the fact that Chengdu Tongwei Industrial Co., Ltd. was no longer included in the scope of
consolidation, and financial discounts of RMB 2,658,333.35 were transferred into financial expenses.
52. Other non-current liabilities
□Applicable √Inapplicable
53. Capital stock
√Applicable □Inapplicable
Unit:Yuan Currency: RMB
Beginning
balance
Increase (+)/Decrease (-) During the Period
Ending
balance Issuance
New shares
issued
Allotment
Turned
from
capital
reserves
Others Subtotal
Total number
of shares
3,882,594,596 213,692,500 405,261,088 618,953,588 4,501,548,184
Other notes:
The number of newly added shares in the current period is 618,953,588 shares, including:
1) Due to the 2019 convertible corporate bonds of conversion of Tongwei Co., Ltd., an increase of
405,261,088 shares, please refer to "Bonds Payable" for details;
2) Approved by CSRC [2020] No. 2492 about Reply of the Approval of Tongwei Co., Ltd. Non-public
Offering of Stocks on October 9, 2020, the Company additional shares of 213,692,500 shares to 16
institutions, including Qamdo Tongrui limited partnerships).
54. Other equity instruments
(1). Basic information of other financial instruments as preferred shares and perpetual bonds
externally issued at the end of period
□Applicable √Inapplicable
(2). Variation to other financial instruments as preferred shares and perpetual bonds externally
issued at the end of period
√Applicable □Inapplicable
Financial instrument
externally issued Beginning
Increase in the
current period
Decrease in the current
period Ending

2020 Annual Report
194 / 246
About changes and causes thereof in increase/decrease of other equity instruments in the current period
and basis of related accounting treatment:
√Applicable □Inapplicable
The decrease in this period is due to the fact that the closing price of the Company’s shares for 15
trading days within 30 consecutive trading days from January 14, 2020 to March 3, 2020 is not less than
130% of the current conversion price of "Tongwei Convertible Bonds" (i.e.15.96 yuan/share), triggering
the redemption clause of “Tongwei Convertible Bonds” (110054). The sixth meeting of the seventh board
of directors approved the Company to perform the early redemption right to redeem all registered
“Tongwei Convertible Bonds. As of the redemption registration date (March 16, 2020), the cumulative
face value of RMB 4,979,353,000 “Tongwei Convertible Bonds” was converted to RMB 20,647,000; and
the transfer corresponding other equity instruments is carried forward into the capital reserves.
Other notes
□Applicable √Inapplicable
55. Capital reserves
√Applicable □Inapplicable
Unit:Yuan Currency: RMB
Item Beginning
balance
Increase in the
current period
Decrease in the
current period Ending balance
Capital premium (share premium) 5,669,871,396.23 10,438,332,283.56 4,099,349.18 16,104,104,330.61
Other capital reserves 2,793,404.27 8,196.83 1,212,144.27 1,589,456.83
Total 5,672,664,800.50 10,438,340,480.39 5,311,493.45 16,105,693,787.44
Other notes, including explanations about changes and causes thereof in increase/decrease in the current
period:
Note: 1. The share premium increased by RMB 10,438,332,283.56, including:
(1) In 2020, 49,766,220 shares of the convertible corporate bonds issued by the company "Tongwei
Convertible Bonds" (110054) were converted into company stocks, 405,261,088 shares were converted,
and 206,470 bonds were redeemed. The book value of the converted convertible corporate bonds is RMB
4,257,900,109.22 plus the interest payable of RMB 22,891,188.60, minus the redemption amount of RMB
20,750,028.53 and the transferred equity amount of RMB 405,261,088 plus other equity instruments of
RMB 854,235,969.85, totaling RMB 4,709,016,151.14 -equity premium.
(2) On November 20, 2020, the Company issued 213,692,500 additional shares to 16 institutions
including Qamdo Tongrui Industrial Partnership (Limited Partnership), raising a total of 5,983,390,000.00
yuan, deducting the increased share capital of 213,692,500.00 yuan, and including additional issuance
expenses in the premium 41,594,202.50 yuan, plus the deductible value-added tax input tax of 915,472.61
yuan such as underwriting expenses and capital verification expenses, increasing the capital reserves-
equity premium of 5,729,018,770.11 yuan.
(3) In January 2020, Jinxian Tiancheng Copper Co., Ltd., a shareholder of Nanchang Tongwei
Biotechnology Co., Ltd., a subsidiary of the company, increased its capital. After the capital increase, the
company’s shareholding ratio in Nanchang Tongwei Biotechnology Co., Ltd. is changed to 80.00% from
82.76%. The transaction is an equity transaction. According to the accounting standards, the difference
between the purchase price and the equity ratio of the Company’s net assets was 788.43 yuan, and the
capital reserves-equity premium was increased.
(4) In September 2020, the Company negotiated with Zhao Yan and others to acquire the 1.36%
equity of Sichuan Willtest Technology Co., Ltd., after the equity transfer, the company’s holding of
Sichuan Willtest Technology Co., Ltd., the share ratio was changed from 81.68% to 83.04%. The
transaction was an equity transaction. According to the accounting standards, the difference between the
purchase price and the equity ratio of the Company’s net assets was 375.80 yuan, and the capital reserves-
equity premium was increased.
(5) In December 2020, the Company increased its capital to Chengdu Tongwei Automation
Equipment Co., Ltd. by RMB 10,229,800.00. After the capital increase, the Company’s shareholding in
Quantity Book value Quantity Book
value Quantity Book value Quantity
Book
value
2019 Convertible
Corporate Bonds of
Tongwei Co., Ltd.
49,972,690 854,235,969.85 49,972,690 854,235,969.85
Total 49,972,690 854,235,969.85 49,972,690 854,235,969.85

2020 Annual Report
195 / 246
Chengdu Tongwei Automation Equipment Co., Ltd. was changed from 62.95% to 80.00%, forming an
equity transaction increased capital reserves-equity premium of RMB 296,198.08.
Note 2: The share premium decreased by RMB 4,099,349.18, including:
(1) In 2020, the Company increased the capital of Sichuan Tongwei Food Co., Ltd. by RMB
44,500,000.00. After the capital increase, the Company’s shareholding in Sichuan Tongwei Food Co., Ltd.
was changed from 70.00% to 80.00%, forming an equity transaction to reduce capital-share premium of
3,062,846.31 yuan.
(2) In May 2020, the Company’s subsidiary Tongwei Solar Co., Ltd. negotiated with Fu Jiayun to
acquire the 0.6% equity of Sichuan Yongxiang Silicon Materials Co., Ltd. After the equity transfer, the
Company’s subsidiary Tongwei Solar Co., Ltd., the Company’s shareholding ratio in Sichuan Yongxiang
Silicon Materials Co., Ltd. was changed from 91.55% to 92.15%. The transaction was an equity
transaction. According to the accounting standards, the difference between the purchase price and the
equity ratio of the Company’s net assets was 295,878.77 yuan; and capital reserves-equity premium was
reduced.
(3) In August 2020, Tongwei New Energy Co., Ltd., a wholly-owned subsidiary of the company,
negotiated with Feng Dezhi and others to acquire 6.01% of the shares of Tongwei Huijin New Energy Co.,
Ltd. After the equity transfer, the company's wholly-owned subsidiary, the Company’s Tongwei New
Energy Co., Ltd.’s shareholding ratio in Tongwei Huijin New Energy Co., Ltd. was changed from 88.75%
to 94.75%. The difference in assets was RMB 617,462.18, and the capital reserves-equity premium was
reduced.
(4) In December 2020, Sichuan Tongwei Food Co., Ltd., the holding subsidiary of the company,
negotiated with Xue Feng and others to acquire 2.06% of the equity of Sichuan Tongwei Sanlian Aquatic
Products Co., Ltd. After the equity transfer, the Company’s holding subsidiary Sichuan Tongwei Food
Co., Ltd.’s shareholding ratio in Sichuan Tongwei Sanlian Aquatic Products Co., Ltd. was changed from
53.57% to 55.62%. The transaction was an equity transaction. According to the accounting standards, the
purchase price and the equity ratio of the Company’s net assets were calculated. The difference was RMB
123,161.92, and the capital reserves-equity premium was reduced.
Note 3: the increase in other capital reserves, amounted to RMB 8,196.83, is due to changes in capital
reserves caused by capital increase in the equity ratio of Lijiang LONGi Silicon Materials Co., Ltd. The
Company adjusted its long-term equity investment and capital reserves-other capital reserves of RMB
8,196.83 based on the proportion of equity.
Note 4: the decrease of other capital reserves by RMB 1,212,144.27 was due to the fact that Chengdu
Tongwei Industrial Co., Ltd. was no longer included in the scope of consolidation. Chengdu Tongwei
Industrial Co., Ltd. used land occupation compensation in previous years for the demolition and restoration
of gate walls and other demolition and restoration projects. The capital reserves of RMB 1,212,144.27
were transferred out.
56. Treasury shares
□Applicable √Inapplicable
57. Other comprehensive income
√Applicable □Inapplicable

2020 Annual Report
196 / 246
Unit:Yuan Currency:RMB
Item Beginning
balance
Amount in the current period
Ending
balance
Amount
incurred before
income tax in
the current
period
Less: Profit or
loss included in
other
comprehensive
incomes at early
stage and
transferred in
the current
period
Less: Profit or
loss included in
other
comprehensive
incomes at early
stage and
transferred to
the retained
earnings in the
current period
Less:
income
tax
expenses
After-tax
amount
attributable to
parent company
After-tax
amount
attributable
to minority
shareholders
I. Other comprehensive income that cannot be
reclassified through profit or loss 6,697,557.94 59,742.91 59,742.91 6,757,300.85
Including: changes arising from re-measurement of
the defined benefit plan
Other comprehensive incomes that cannot be
reclassified into profit and loss under the equity
method
Changes in fair value of investment by other
equity instruments 6,697,557.94 59,742.91 59,742.91 6,757,300.85
Changes in fair value of the enterprise’s credit
risk
II. Other comprehensive income to be reclassified
into profit or loss -38,497,758.99 -42,173,763.58 -42,173,763.58 -80,671,522.57
Including: other comprehensive income to be
reclassified through profit or loss under the equity
method
Changes in the fair value of other debt
investments
Amount of financial assets reclassified into other
comprehensive income
Impairment provision of credit in other debt
investments
Cash flow hedge reserves
Translation difference of foreign currency financial
statements -38,497,758.99 -42,173,763.58 -42,173,763.58 -80,671,522.57
Total other comprehensive income -31,800,201.05 -42,114,020.67 -42,114,020.67 -73,914,221.72

2020 Annual Report
197 / 246
58. Special reserves
√Applicable □Inapplicable
Unit:Yuan Currency: RMB
Item Beginning balance Increase in the
current period
Decrease in the
current period Ending balance
Safety production
fee
18,057,814.87 46,066,158.86 47,722,910.66 16,401,063.07
Total 18,057,814.87 46,066,158.86 47,722,910.66 16,401,063.07
59. Surplus reserves
√Applicable □Inapplicable
Unit:Yuan Currency:RMB Item Beginning balance Increase in the current
period
Decrease in the current
period
Ending balance
Statutory surplus
reserves
564,141,320.54 361,181,041.90 925,322,362.44
Total 564,141,320.54 361,181,041.90 925,322,362.44
60. Undistributed profit
√Applicable □Inapplicable
Unit:Yuan Currency: RMB Item Current period Previous period
Undistributed profit at the end of the previous period before adjustment 6,617,152,692.38 4,755,055,633.39
Total number of undistributed profit at beginning of adjustment
(adjustment +/-)
Undistributed profit at the beginning of the period after adjustment 6,617,152,692.38 4,755,055,633.39
Add: net profit attributable to owners of parent company in the current
period
3,607,923,359.56 2,634,568,828.17
Less: appropriation of statutory surplus reserves 361,181,041.90 151,292,213.98
Appropriation of discretionary surplus reserves
Appropriation to general risk provision
Common stock dividends payable 797,541,155.54 621,179,555.20
Common stock dividends converted into share capital
Undistributed profit at the end of the period 9,066,353,854.50 6,617,152,692.38
Details of undistributed profit at the beginning of the adjustment period:
1. The amount that will affect the undistributed profit at the beginning of the period due to retroactive
adjustment of ASBE and its relevant new regulations is RMB 0.00.
2. The amount that will affect the undistributed profit at the beginning of the period due to accounting
policy alternation is RMB 0.00.
3. The amount that will affect the undistributed profit at the beginning of the period due to correction of
major accounting error is RMB 0.00.
4. The amount that will affect the undistributed profit at the beginning of the period due to change of
consolidation scope as a result of common control is RMB 0.00.
5. Amount of the undistributed profit at the beginning of the period that will be affected due to total of
other adjustments is RMB 0.00.
61. Operating revenue and operating cost
(1). Operating revenue and operating cost
√Applicable □Inapplicable
Unit:Yuan Currency: RMB
Item Amount in the current period Amount in the previous period
Income Cost Income Cost
Major operation 43,433,643,659.03 35,981,319,412.69 36,427,626,635.92 29,468,482,925.80
Other
operations
766,626,675.20 667,085,651.69 1,127,491,619.78 1,067,518,190.66

2020 Annual Report
198 / 246
Total 44,200,270,334.23 36,648,405,064.38 37,555,118,255.70 30,536,001,116.46
(2). About income generated by the contract
□Applicable √Inapplicable
Explanation of the income generated by the contract:
□Applicable √Inapplicable
(3). Explanation of performance obligations
□Applicable √Inapplicable
(4). Explanation of allocation to remaining performance obligations
□Applicable √Inapplicable
62. Taxes and surcharges
√Applicable □Inapplicable
Unit:Yuan Currency: RMB
Item Amount in the current period Amount in the previous period
Consumption tax
Business tax
Urban maintenance and
construction tax
5,811,390.46 16,603,047.61
Education surcharge 2,586,236.78 7,235,680.06
Resources tax
Property tax 44,632,018.07 35,892,612.31
Land use tax 29,384,134.86 28,917,026.05
Vehicle and vessel use tax
Stamp tax 28,693,509.43 19,739,909.38
Local education surcharge 1,748,269.18 4,820,318.56
Others 11,190,097.35 9,652,541.63
Total 124,045,656.13 122,861,135.60
Other notes:
Please refer to "Taxes" for details of the standard for calculation and payment various taxes.
63. Sales expenses
√Applicable □Inapplicable
Unit:Yuan Currency: RMB Item Amount in the current period Amount in the previous period
Employee compensation 481,340,424.63 478,656,539.45
Travel expenses 93,026,260.91 132,861,310.52
Advertising expenses 92,957,781.88 100,665,942.89
After-sales service charges 25,354,463.26 10,856,506.63
Certification and review expense 22,613,724.87 5,680,079.84
Rental fees 10,655,396.40 5,671,057.09
Business entertainment expenses 9,629,364.81 11,980,350.91
Depreciation expenses 6,540,599.41 5,680,079.84
Traffic expenses 155,634,509.88
Export expenses 13,591,382.76
Others 35,912,624.01 53,992,737.26
Total 778,030,640.18 975,270,497.07
Other notes:
The Company will implement the Accounting Standards for Business Enterprises No. 14-Revenue revised by the Ministry of Finance from January 1, 2020, and change the transportation and export costs
directly related to contract performance to be listed in operating costs.

2020 Annual Report
199 / 246
64. Administrative expenses
√Applicable □Inapplicable
Unit:Yuan Currency: RMB Item Amount in the current period Amount in the previous
period
Employee compensation 814,656,806.60 723,061,371.26
Repair expenses 304,634,465.83 196,365,971.43
Depreciation expenses 193,923,343.42 127,571,184.92
Amortization of intangible assets 55,901,116.03 55,175,036.79
Safety production fee 47,383,065.35 33,343,882.12
Consulting fees (including consultant fees) 34,706,761.03 36,595,155.73
Travel expenses 32,384,792.97 39,181,159.47
Business entertainment expenses 28,870,562.00 27,419,152.75
Poverty alleviation fee 25,607,452.08 20,465,500.00
Property management fee 25,587,370.41 24,211,393.61
Property insurance premium 23,769,131.07 13,721,033.05
Rental fees 20,025,522.43 31,377,052.10
Others 201,127,714.17 185,321,706.39
Total 1,808,578,103.39 1,513,809,599.62
65. R&D expenses
√Applicable □Inapplicable
Unit:Yuan Currency:RMB Item Amount in the current period Amount in the previous
period
Personnel expense 265,265,919.94 240,334,947.09
Material cost 467,088,270.02 488,555,308.52
Depreciation cost 107,915,190.95 104,463,367.14
Fuel and power 162,999,918.05 137,089,633.84
Other expenses 32,062,135.72 30,251,337.26
Total 1,035,331,434.68 1,000,694,593.85
66. Financial expenses
√Applicable □Inapplicable
Unit:Yuan Currency: RMB Item Amount in the current period Amount in the previous
period
Interest expenses 521,590,309.29 605,992,874.97
Less: financial discount -12,760,919.51 -27,900,347.52
Less: interest income -57,540,093.05 -56,710,422.17
Add: exchange loss 98,373,973.54 28,396,268.64
Less: exchange income -59,002,987.44 -39,377,208.72
Add: amortization of unrecognized financing
expenses
173,467,244.18 186,682,895.47
Add: handling charge of financial institutions 12,199,001.78 10,721,763.33
Total 676,326,528.79 707,805,824.00
67. Other incomes
√Applicable □Inapplicable
Unit:Yuan Currency: RMB Item Amount in the current period Amount in the previous period
Government subsidies related to daily
operating activities
303,549,939.09 214,303,960.33
Total 303,549,939.09 214,303,960.33
Other notes:
Details of government subsidies related to daily operating activities are listed as follows:
Item Amount in the Amount in the Related to

2020 Annual Report
200 / 246
current period previous period assets/related to
income
Asset-related items to which deferred income is transferred 85,331,920.28 59,981,555.86 Related to assets
Industry support subsidies 83,377,737.58
Related to
income
Tax returns 20,861,993.94 41,013,193.38
Related to
income
Government support funds 16,212,962.86
Related to
income
Job stabilization subsidy 9,085,635.05 4,268,144.99
Related to
income
2.3GW one project one discussion R&D investment rewards 5,000,000.00
Related to
income
Fixed asset investment reward 5,000,000.00
Related to
income
Special fund for logistics project of crystalline silicon solar
cell project 25,285,243.75
Related to
income
Subsidies for provincial key enterprises 18,148,911.00
Related to
income
Subsidies for Low Energy Consumption and Zero Emission
Polysilicon Green Key Process System Integration Project 6,400,000.00
Related to
income
In 2019, electricity price subsidies for Phase I and II of the
"support fund project" 5,580,000.00
Related to
income
PV industry support policy subsidy 5,824,000.00
Related to
income
Other items related to income 77,385,304.96 47,550,937.99
Related to
income
Asset-related items to which deferred income is transferred 1,294,384.42 251,973.36
Related to
income
Total 303,549,939.09 214,303,960.33
68. Investment income
√Applicable □Inapplicable
Unit:Yuan Currency: RMB
Item Amount in the current
period
Amount in the previous
period
Investment income of long-term equity investments
measured under equity method
22,506,526.78 107,669,300.53
Investment income from disposal of long-term equity
investments
1,536,050,665.48 9,516,812.37
Forward income from foreign exchange settlement 9,522,042.15
Investment income from purchasing bank wealth
management products
1,298,783.09 1,180,005.16
Total 1,569,378,017.50 118,366,118.06
Other notes:
Investment income from disposal of long-term equity investments Investee Amount in the current period Amount in the previous period
Chengdu Tongwei Industrial Co., Ltd. 1,521,815,054.77
Jiangsu Yanhai Tongwei Fuyun New Energy
Co., Ltd.
14,389,885.25
Danzhou Tongwei Huijin New Energy Co.,
Ltd.
111,272.90
Dongying Tongwei New Energy Co., Ltd. -265,547.44
Xiangcheng Tongwei Huijin New Energy Co.,
Ltd.
9,300,000.00
Panzhihua Tongwei Fish Co., Ltd. 216,812.37
Total 1,536,050,665.48 9,516,812.37
69. Net exposure hedging income
□Applicable √Inapplicable

2020 Annual Report
201 / 246
70. Income from changes in fair value
√Applicable □Inapplicable
Unit:Yuan Currency: RMB
Sources of income from changes in fair value Amount in the
current period
Amount in the
previous period
Trading financial assets 4,863,068.12
Including: income from changes in fair values arising from derivative
financial instruments
4,863,068.12
Trading financial liabilities
Investment properties measured at fair value
Total 4,863,068.12
71. Credit impairment loss
√Applicable □Inapplicable
Unit:Yuan Currency:RMB Item Amount in the current period Amount in the previous period
Loss on bad debt of notes receivable -19,644,098.38 -25,090,248.17
Bad debt loss of other receivables -5,595,766.05 -17,916,485.58
Total -25,239,864.43 -43,006,733.75
72. Asset impairment loss
√Applicable □Inapplicable
Unit:Yuan Currency: RMB
Item Amount in the
current period
Amount in the
previous period
I. Bad debt loss
II. Inventory falling price loss and loss of contract
performance cost impairment
-27,596,977.95 -4,917,914.50
III. Impairment loss of long-term equity investment
IV. Impairment loss of investment property
V. Loss from fixed assets impairment -221,877,025.60
VI. Loss from construction materials impairment
VII. Loss from construction in progress impairment
VIII. Loss from productive biological assets impairment
IX. Loss from oil and gas assets impairment
X. Loss from intangible assets impairment
XI. Loss from goodwill impairment
XII. Others -18,291,935.88
Total -267,765,939.43 -4,917,914.50
73. Incomes from assets disposal
√Applicable □Inapplicable
Unit:Yuan Currency: RMB Item Amount in the
current period
Amount in the
previous period
Profit from the sale of non-current assets classified as held for sale 36,044,702.46
Incomes from disposal of fixed assets -1,164,677.07 87,806,056.20
Incomes from productive biological assets disposal 15,847.83 61,370.10
Incomes from disposal of construction in progress 15,689,526.61
Total -1,148,829.24 139,601,655.37
74. Non-operating income
About non-operating income
√Applicable □Inapplicable
Unit:Yuan Currency: RMB
Item Amount in the
current period
Amount in the
previous period
Amount of non-
recurring profit and loss

2020 Annual Report
202 / 246
included in the current
period
Total gains from disposal of non-current assets 256,277.03 843,121.44 256,277.03
Including: gains from disposal of fixed assets 256,277.03 843,121.44 256,277.03
Gains from disposal of intangible assets
Gains from debt restructurings
Gains from exchange of non-monetary assets
Donation accepted
Government subsidies
Unpayable payables 24,527,711.39 27,904,992.69 24,527,711.39
Income from breach indemnity 9,364,996.71 12,363,294.78 9,364,996.71
Others 2,846,642.17 1,271,326.25 2,846,642.17
Total 36,995,627.30 42,382,735.16 36,995,627.30
Government subsidies included in the current profit and loss
□Applicable √Inapplicable
Other notes:
□Applicable √Inapplicable
75. Non-operating expenses
√Applicable □Inapplicable
Unit:Yuan Currency: RMB
Item Amount in the
current period
Amount in the
previous period
Amount of non-
recurring profit and loss
included in the current
period
Total loss from disposal of non-current assets 400,228,648.84 4,077,869.41 400,228,648.84
Including: loss from disposal of fixed assets 399,711,840.78 4,077,869.41 399,711,840.78
Loss from disposal of intangible assets 477,812.05 477,812.05
Loss from debt restructuring 1,162,174.00
Loss from exchange of non-monetary assets
External donation 4,119,119.08 2,892,339.59 4,119,119.08
Fines expenses 2,038,058.10 1,424,173.21 2,038,058.10
Overdue fine 486,097.27 319,816.35 486,097.27
Abnormal loss 66,502,545.02 250,200.12 66,502,545.02
Expenditure of compensation 1,704,252.25 2,333,803.58 1,704,252.25
Others 1,313,238.91 1,423,112.37 1,313,238.91
Total 476,391,959.47 13,883,488.63 476,391,959.47
Note: the loss of non-current assets was RMB 400,228,648.84, which was mainly due to technical
renovation and demolition assets of RMB 376,564,106.18 of Sichuan Yongxiang Polysilicon Co., Ltd.,
Tongwei Solar (Hefei) Co., Ltd., Tongwei Solar (Chengdu) Co., Ltd. For details, refer to "Fixed Assets
Scrap Loss"; extraordinary loss of RMB 66,502,545.02, of which, flood loss was RMB 64,387,346.70,
refer to "Flood Disaster Loss" for details.
76. Income tax expense
(1). List of income tax expenses
√Applicable □Inapplicable
Unit:Yuan Currency:RMB
Item Amount in the current period Amount in the previous period
Current income tax expenses 578,250,527.36 374,328,222.52
Deferred income tax expenses -19,196,352.33 94,857,607.48
Total 559,054,175.03 469,185,830.00
(2). Adjustment process of accounting profit and income tax expenses
√Applicable □Inapplicable
Unit:Yuan Currency: RMB

2020 Annual Report
203 / 246
Item Amount in the current period
Total profit 4,273,792,966.12
Income tax expenses calculated with legal or applicable tax rate 1,068,448,241.53
Effect of different tax rate applicable to subsidiaries -514,211,482.83
Effect of adjustments to income tax of prior period -15,780,503.50
Effect of non-taxable income -93,072,622.83
Effect of cost, expense and loss nondeductible 19,404,890.89
Effect of using the deductible loss of the unrecognized in prior period -26,195,079.86
Impact of temporary deductible difference or deductible loss of deferred income tax
assets recognized at the end of the period 181,385,806.08
Effect of reversal of deductible loss of deferred income tax assets confirmed in prior
period 5,032,881.75
Impact of research and development costs plus deduction -37,478,339.85
Deferred income tax expenses affected by tax rate changes -26,338,094.67
Reduce corporate income tax -2,141,521.68
Income tax expense 559,054,175.03
Other notes:
□Applicable √Inapplicable
77. Other comprehensive income
√Applicable □Inapplicable
Refer to Note.
78. Items of cash flow statement
(1). Other cash received concerning operating activities
√Applicable □Inapplicable
Unit:Yuan Currency: RMB
Item Amount in the current period Amount in the previous period
Government subsidies 541,500,627.50 437,706,525.63
Insurance compensation 115,076,534.20 1,509,070.96
Security deposit and cash pledge received 35,682,905.20 2,241,053.44
Interest income from bank deposit 34,466,767.72 42,169,626.41
Production award and interest subsidy
received 12,760,919.51
47,800,000.00
Income from breach indemnity 8,338,615.45 4,686,247.42
Rental income 24,886,231.48 48,138,743.48
Others 3,058,661.49 6,167,976.40
Total 775,771,262.55 590,419,243.74
(2). Other cash paid for related operating activities
√Applicable □Inapplicable
Unit:Yuan Currency:RMB Item Amount in the current period Amount in the previous
period
Other expenses paid for related operating
activities
661,342,975.25 652,557,229.53
Petty cash and intercourse fund paid 53,949,024.73 45,902,080.85
PV powerplant poverty alleviation project
prepaid divided profit to pay cash
3,218,902.14 4,332,500.00
Guarantee deposit and security deposit paid 10,029,479.45 6,970,132.73
Total 728,540,381.57 709,761,943.11
(3). Other cash received relating to investing activities
√Applicable □Inapplicable

2020 Annual Report
204 / 246
Unit:Yuan Currency: RMB
Item Amount in the current period Amount in the previous
period
Project bid bond received 276,742,512.51 281,412,760.57
Disposal of Chengdu Tongwei Industrial Co.,
Ltd. to recover the loan 136,265,300.00
Equity transfer fund received 89,600,000.00 10,843,094.42
Total 502,607,812.51 292,255,854.99
(4). Other cash paid relating to investing activities
√Applicable □Inapplicable
Unit:Yuan Currency: RMB Item Amount in the current period Amount in the previous
period
Pre-paid equity acquisition funds 3,082,000.00 134,522,726.32
Refund of transfer funds and land funds 15,300,000.00
Project bid bond paid 164,247,398.46 244,236,183.03
Total 167,329,398.46 394,058,909.35
(5). Other cash received relating to financing activities
√Applicable □Inapplicable
Unit:Yuan Currency: RMB Item Amount in the current period Amount in the previous
period
Net decrease in guarantee deposits of notes 861,743,891.85 168,808,449.80
Joint venture capital adjustments 221,176,251.72 768,149,439.68
Interest income from guarantee deposit 11,125,487.43 6,400,454.70
Total 1,094,045,631.00 943,358,344.18
(6). Other cash paid related to financing activities
√Applicable □Inapplicable
Unit:Yuan Currency: RMB Item Amount in the current period Amount in the previous
period
Financial lease fees paid 854,903,139.02 1,490,531,553.53
Payment of bills and letter of credit deposit 384,773,935.90
Joint venture capital adjustments 235,893,051.73 776,327,757.89
Interest-free debt repayment of principal 185,087,917.55 185,087,917.55
Acquisition of minority shareholders' equity 29,870,084.86 36,651,143.00
Financial leasing risk fund 11,247,063.94 20,017,669.48
Financing fees paid 5,793,587.60 26,523,169.82
Minority shareholders recovering their
investment 2,450,000.00
Frozen bank deposits 1,697,738.00
Others 1,743,692.50 949,873.07
Total 1,711,762,473.10 2,537,786,822.34
79. Supplementary Information of Cash Flow Statement
(1). Supplementary Information of Cash Flow Statement
√Applicable □Inapplicable
Unit:Yuan Currency: RMB
Supplementary information Amount of the current
period
Amount in the
previous period
1.Adjust the net profit to cash flow from operating activities
Net profit 3,714,738,791.09 2,682,335,991.14
Add: provision for impairment of assets 267,765,939.43 4,917,914.50
Credit impairment loss 25,239,864.43 43,006,733.75

2020 Annual Report
205 / 246
Depreciation of fixed assets, oil and gas assets and productive
biological assets 2,357,189,141.57 1,930,044,400.29
Amortization of use right asset
Amortization of intangible assets 62,710,902.43 58,294,273.58
Amortization of long-term prepaid expenses 59,146,836.63 7,391,774.43
Loss from disposal of fixed assets, intangible assets and other long-
term assets (gains to be listed with"-") 1,148,829.24 -139,601,655.37
Loss from scrapping of fixed assets (income to be listed with “-”) 399,972,371.81 3,234,747.97
Loss from changes in fair value (gains to be listed with “-”) -4,863,068.12
Financial expenses (gains to be listed with “-”) 726,479,351.22 753,794,482.84
Investment loss (gains to be listed with “-”) -1,569,378,017.50 -118,366,118.06
Decreases of deferred income tax assets (increases to be listed with
“-”) -188,941,716.35 -8,431,755.25
Increases of deferred income tax liabilities (decrease to be listed
with “-”) 169,745,364.02 103,289,362.73
Decrease of inventory (increase to be listed with “-”) -384,993,632.73 -824,901,708.95
Decreases of operating receivables (increase to be listed with “-”) -6,669,843,200.17 -4,787,479,039.95
Increase in operating payables (decrease to be listed with “-”) 4,058,810,174.94 2,649,935,804.03
Others
Net cash flow from operating activities 3,024,927,931.94 2,357,465,207.68
2.Major investment and financing activities not relating to
cash deposit and withdrawal:
Conversion of debt into capital 4,224,357,901.63
Convertible bonds due within one year
Fixed assets acquired under financial leases
3.Net changes in cash and cash equivalents:
Ending balance of cash 5,986,042,619.46 1,942,739,577.25
Subtract: cash at the beginning of the balance 1,942,739,577.25 2,428,024,586.63
Plus: ending balance of cash equivalents
Less: beginning balance of cash equivalents
Net increase in cash and cash equivalents 4,043,303,042.21 -485,285,009.38
(2). Net cash paid for acquisition of subsidiaries in the current period
□Applicable √Inapplicable
(3). Net cash received from disposal of subsidiaries in the current period
√Applicable □Inapplicable
Unit:Yuan Currency:RMB amount
Cash or cash equivalents paid in the current period for disposal in the
current period
1,778,885,970.61
Including: Chengdu Tongwei Industrial Co., Ltd. 1,778,885,970.61
Less: cash and cash equivalents held by subsidiaries on the date of losing
control right
1,179.30
Including: Chengdu Tongwei Industrial Co., Ltd. 1,179.30
Add: cash or cash equivalents received in the current period for disposal
during previous year
Net cash received for disposal of subsidiaries 1,778,884,791.31
(4). Composition of cash and cash equivalents
√Applicable □Inapplicable
Unit:Yuan Currency: RMB
Item Ending balance Beginning balance
I. Cash 5,986,042,619.46 1,942,739,577.25
Including: cash on hand 126,156.42 273,455.70
Bank deposits available for payment on demand 5,956,397,774.28 1,749,657,393.40
Other cash and cash equivalents available for
payment at any time 29,518,688.76 192,808,728.15

2020 Annual Report
206 / 246
Available fund that is deposited into the Central
Bank for payment
Inter-bank deposits
Interbank loans
II. Cash equivalents
Including: bond investment due within 3 months
III. Ending balance of cash and cash equivalents 5,986,042,619.46 1,942,739,577.25
Including: restricted cash and cash equivalents used
by parent company or subsidiaries under the Group 278,125,622.57 749,942,171.52
Other notes:
√Applicable □Inapplicable
The cash flow statement of the Company in the current period "Cash received from sales of goods
and services provided" does not include the unreceived cash of RMB 6,425,225,991.93 for sales of goods
and services caused by the endorsement of notes receivable.
80. Notes to items of changes in owners' equity
Explain the names and amounts of “others” items adjusted to the ending balance of the previous year.
□Applicable √Inapplicable
81. Assets with restricted ownership or use right
□Applicable √Inapplicable
Unit:Yuan Currency:RMB Item Book value at the end of the
period
Reason of being restricted
Cash at bank and on hand 278,125,622.57 Provide guarantee for Company financing
and operation
Notes receivable
Inventories
Fixed assets 7,509,245,190.86 Provide guarantees, financial leases, etc. for
Company financing
Intangible assets 218,700,255.76 Provide pledge for Company financing
Receivables financing 9,511,995,347.19 Provide pledge for the company to issue
bank acceptance bills
Accounts receivable 472,806,633.48 Provide pledge for Company financing
Contract assets 916,383,442.93 Provide pledge for Company financing
Construction in progress 10,805,572.28 Provide pledge for Company financing
Investment real estate 64,302,088.13 Provide pledge for Company financing
Total 18,982,364,153.20 /
82. Monetary items in foreign currency
(1). Monetary items in foreign currency
√Applicable □Inapplicable
Unit:Yuan
Item Ending foreign currency
balance
Conversion exchange
rate
Ending balance of
converted RMB
Cash at bank and on hand
Including: USD 8,939,778.13 6.5249 58,331,158.32
EUR 161,693.45 8.0250 1,297,589.94
HKD 781,753.59 0.8416 657,955.33
VND 835,629,747,769.84 0.0002834 236,856,504.47
BDT 537,073,842.57 0.07686 41,279,396.39
SGD 37,073.70 4.9314 182,825.24
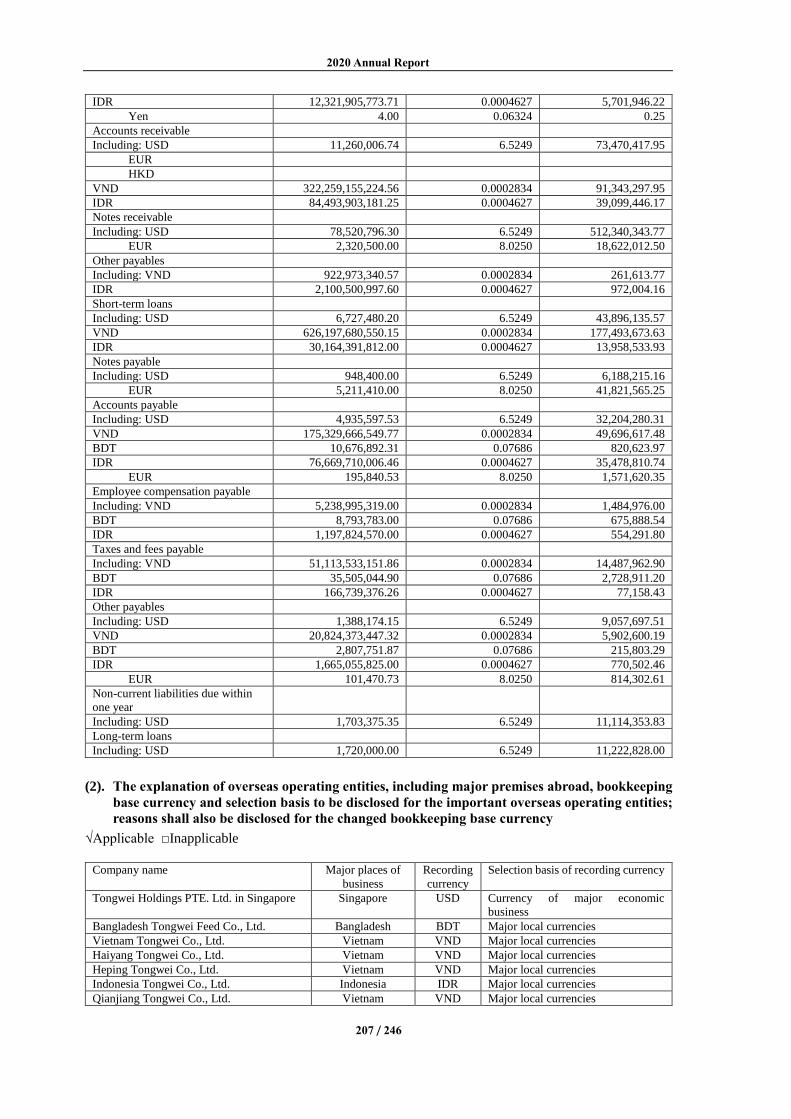
2020 Annual Report
207 / 246
IDR 12,321,905,773.71 0.0004627 5,701,946.22
Yen 4.00 0.06324 0.25
Accounts receivable
Including: USD 11,260,006.74 6.5249 73,470,417.95
EUR
HKD
VND 322,259,155,224.56 0.0002834 91,343,297.95
IDR 84,493,903,181.25 0.0004627 39,099,446.17
Notes receivable
Including: USD 78,520,796.30 6.5249 512,340,343.77
EUR 2,320,500.00 8.0250 18,622,012.50
Other payables
Including: VND 922,973,340.57 0.0002834 261,613.77
IDR 2,100,500,997.60 0.0004627 972,004.16
Short-term loans
Including: USD 6,727,480.20 6.5249 43,896,135.57
VND 626,197,680,550.15 0.0002834 177,493,673.63
IDR 30,164,391,812.00 0.0004627 13,958,533.93
Notes payable
Including: USD 948,400.00 6.5249 6,188,215.16
EUR 5,211,410.00 8.0250 41,821,565.25
Accounts payable
Including: USD 4,935,597.53 6.5249 32,204,280.31
VND 175,329,666,549.77 0.0002834 49,696,617.48
BDT 10,676,892.31 0.07686 820,623.97
IDR 76,669,710,006.46 0.0004627 35,478,810.74
EUR 195,840.53 8.0250 1,571,620.35
Employee compensation payable
Including: VND 5,238,995,319.00 0.0002834 1,484,976.00
BDT 8,793,783.00 0.07686 675,888.54
IDR 1,197,824,570.00 0.0004627 554,291.80
Taxes and fees payable
Including: VND 51,113,533,151.86 0.0002834 14,487,962.90
BDT 35,505,044.90 0.07686 2,728,911.20
IDR 166,739,376.26 0.0004627 77,158.43
Other payables
Including: USD 1,388,174.15 6.5249 9,057,697.51
VND 20,824,373,447.32 0.0002834 5,902,600.19
BDT 2,807,751.87 0.07686 215,803.29
IDR 1,665,055,825.00 0.0004627 770,502.46
EUR 101,470.73 8.0250 814,302.61
Non-current liabilities due within
one year
Including: USD 1,703,375.35 6.5249 11,114,353.83
Long-term loans
Including: USD 1,720,000.00 6.5249 11,222,828.00
(2). The explanation of overseas operating entities, including major premises abroad, bookkeeping
base currency and selection basis to be disclosed for the important overseas operating entities;
reasons shall also be disclosed for the changed bookkeeping base currency
√Applicable □Inapplicable
Company name Major places of
business
Recording
currency
Selection basis of recording currency
Tongwei Holdings PTE. Ltd. in Singapore Singapore USD Currency of major economic
business
Bangladesh Tongwei Feed Co., Ltd. Bangladesh BDT Major local currencies
Vietnam Tongwei Co., Ltd. Vietnam VND Major local currencies
Haiyang Tongwei Co., Ltd. Vietnam VND Major local currencies
Heping Tongwei Co., Ltd. Vietnam VND Major local currencies
Indonesia Tongwei Co., Ltd. Indonesia IDR Major local currencies
Qianjiang Tongwei Co., Ltd. Vietnam VND Major local currencies

2020 Annual Report
208 / 246
Tongta Tongwei Co., Ltd. Vietnam VND Major local currencies
Tongwei Solar HK Co., Ltd. Hong Kong USD Currency of major economic
business
83. Hedging
□Applicable √Inapplicable
84. Government subsidies
(1). Basic information of government subsidies
√Applicable □Inapplicable
Unit:Yuan Currency:RMB
Category amount Item presented Amount included in the
current profit and loss
Assets-related government subsidies 865,875,071.09 Deferred incomes 85,331,920.28
Income-related government
subsidies
3,224,326.64 Deferred incomes 1,294,384.42
Income-related government
subsidies (note)
2,900,000.00 Deferred incomes 2,658,333.35
Income-related government
subsidies
216,923,634.39 Other incomes 216,923,634.39
Income-related government
subsidies
514,445,362.18 Operating cost 514,445,362.18
Income-related government
subsidies
10,102,586.16 Financial expenses 10,102,586.16
Note: the financial discount of RMB 2,900,000.00 was received this year, which was included in the
financial expense of RMB 2,658,333.35 in the current period.
(2). Refund of government subsidies
□Applicable √Inapplicable
85. Others
□Applicable √Inapplicable
VIII. Changes in Consolidation Scope
1. Business merger under different control
√Applicable □Inapplicable
(1). Business merger under different control in the current period
√Applicable □Inapplicable
Unit:Yuan Currency:RMB
Name of acquiree
Date of
acquisition
of equity
Acquisition
cost of
equity
Acquisition
proportion
of equity
(%)
Acquisition
method of
equity
Acquisition
date
Basis for
determination
of acquisition
date
Income of
acquiree from
acquisition
date to the end
of the period
Net profit of
acquiree from
acquisition
date to the end
of the period
Zibo Huixiang
New Energy Co.,
Ltd.
2020/1/1 0.00 100.00 Purchasing 2020/1/1 Note 23,838,595.88 9,471,840.97
Other notes:
Note: on January 1, 2020, Tongwei New Energy (Shezhen) Co., Ltd., the controlling subsidiary and
natural persons Zhao Ling and Xu Guilian signed an equity transfer agreement to acquire 95.00% equity
in Zibo Huixiang New Energy Co., Ltd. held by Zhaoling for a price of RMB 0.00 and 5.00% of equity in
Zibo Huixiang New Energy Co., Ltd. held by Xu Guilian; the Company's Articles of Association were
amended; and the new business license was obtained in January 2020 and the handover was completed.

2020 Annual Report
209 / 246
(2). Merger cost and goodwill
√Applicable □Inapplicable
Unit:Yuan Currency: RMB Merger cost Zibo Huixiang New Energy Co., Ltd.
--Cash 0
--Fair value of non-cash assets
--Fair value of liabilities issued or borne
--Fair value of equity securities issued
--Fair value of contingent consideration
--Fair value on acquisition date for equity held prior to the acquisition date
--Others
Total merger cost 0
Less: fair value of net identifiable assets acquired 0
Amount of which the goodwill/merger cost is less than the fair value of net
identifiable assets acquired
0
(3). Identifiable assets and liabilities of the acquiree on the acquisition date
√Applicable □Inapplicable
Unit:Yuan Currency:RMB Zibo Huixiang New Energy Co., Ltd.
Fair value on purchase date Book value on purchase day
Assets: 169,327,334.40 169,327,334.40
Cash at bank and on
hand
142,410.81 142,410.81
Accounts receivable 19,064,834.31 19,064,834.31
Inventories
Fixed assets 65,707,742.24 65,707,742.24
Intangible assets
Prepayments 84,365.00 84,365.00
Other payables 126,000.00 126,000.00
Other current assets 2,970,553.27 2,970,553.27
Construction in
progress
68,204,857.68 68,204,857.68
Other non-current assets 13,026,571.09 13,026,571.09
Liabilities: 169,327,334.40 169,327,334.40
Loan
Payables 35,250,998.44 35,250,998.44
Other payables 134,076,335.96 134,076,335.96
Deferred income tax
liabilities
Net assets 0.00 0.00
Less: minority
shareholders' equity
Net assets acquired 0.00 0.00
(4). Acquisition profit or loss arising from the revaluation of the equity held prior to the date at the
fair value
Whether there is a transaction that realizes business combination step by step through multiple
transactions and obtains control during the reporting period
□Applicable √Inapplicable
(5). Relevant explanation of the merging consideration or the fair value of identifiable net assets
and liabilities of acquiree that cannot be confirmed rationally on the acquisition date or at the
end of the current merging period
□Applicable √Inapplicable
(6). Other notes
□Applicable √Inapplicable

2020 Annual Report
210 / 246
2. Business merger under common control
□Applicable √Inapplicable
3. Counter purchase
□Applicable √Inapplicable

2020 Annual Report
211 / 246
4. Disposal of subsidiaries
Whether conditions of single disposal of the investment in subsidiaries with control lost occurred
√Applicable □Inapplicable
Unit:Yuan Currency: RMB
Name of
subsidiaries
Disposal price of
equity
Disposal
proportion
of equity
(%)
Disposal
way of
equity
Date for loss
of control
Basis for
determining
date for loss of
control
Difference between the
disposal price and the
Company’s share of
the subsidiaries’ net
assets in the
consolidated financial
statements relevant to
the disposed equity
interest
Proportion
of
remaining
equity on
the date of
loss of
control
(%)
Carrying value
of remaining
equity on the
date of loss of
control
Fair value of
remaining
equity on the
date of loss of
control
Profit or loss
caused by
recalculation of
remaining
equity
Determining
method and
major
assumptions of
remaining
equity fair
value on the
date of loss of
control
Profit or loss on
investment
transferred from
other
comprehensive
incomes in
connection with
equity
investment of
the original
subsidiaries
Chengdu
Tongwei
Industrial
Co., Ltd.
1,749,500,000.00 98.00 Equity
Transfer 2020/7/31
Assets
transferring 1,499,908,753.67 2.00 5,093,698.90 27,000,000.00 21,906,301.10
Dongying
Tongwei
New Energy
Co., Ltd.
0.00 100.00 Equity
Transfer 2020/5/21
Industrial and
commercial
changes
-265,547.44 0.00
Danzhou
Tongwei
Huijin New
Energy Co.,
Ltd.
200,000.00 100.00 Equity
Transfer 2020/3/24
Industrial and
commercial
changes
111,272.90 0.00
Other notes:
√Applicable □Inapplicable
(1) In accordance with the resolutions and authorizations of the 2017 Annual General Meeting of
Shareholders, on the basis of maximizing the interests of the Company and investors, the Company sold
98% of its subsidiary Chengdu Tongwei Industrial Co., Ltd. and 100% of the creditor's rights of Tongwei
Industrial held by the company. Chengdu Yihua Real Estate Co., Ltd., a wholly-owned subsidiary of
Guangdong Aoyuan Commercial Real Estate Group Co., Ltd., won the bid for the above equity and
creditor rights at a price of RMB 1,936,265,300. The Company and Yihua Real Estate and related parties
signed an agreement on equity transfer on July 10, 2020. In July 2020, the Company received most of the
transfer money, and July 31, 2020 is used as the date of equity transfer of Chengdu Tongwei Industrial
Co., Ltd. The Company received an equity transfer deposit of RMB 27,000,000.00 as the fair value of the
remaining 2% of the equity.
(2) Dongying Tongwei New Energy Co., Ltd., a wholly-owned subsidiary of Tongwei New Energy
Co., Ltd., a wholly-owned subsidiary of the Company, signed an equity transfer agreement with Dongying
Caijin Clean Energy Co., Ltd. on May 19, 2020. All equity change procedures were completed on May
21, 2015.
(3) Danzhou Tongwei Huijin New Energy Co., Ltd., a wholly-owned subsidiary of Tongwei New
Energy Co., Ltd., a wholly-owned subsidiary of the company, and Tongwei Huijin New Energy Co., Ltd.
Jiangsu Santou Energy Co., Ltd. signed an equity transfer agreement and completed all equity change
procedures on March 24, 2020.
5. Changes in consolidation scope for other reasons
Explain the changes in consolidation scope due to other reasons (such as establishment of new subsidiaries,
liquidation of subsidiaries etc.) and related circumstances:
√Applicable □Inapplicable
In 2020, the Company invested in the establishment of Chengdu Tongwei Yuguang Technology Co.,
Ltd., Maoming Tongwei Biological Technology Co., Ltd., Hainan Tongwei Biological Technology Co.,
Ltd., and Guangdong Tongwei Biological Technology Co., Ltd.
In 2020, the Company's first-tier subsidiaries: Chengdu Tongwei Fish Co., Ltd., Tongwei (Chengdu)
Aquatic Food Co., Ltd., Chengdu Xintaifeng Agricultural Development Co., Ltd., Tongwei Aquatic
Products Co., Ltd., Tongwei (Chengdu) Salmon Co., Ltd., Sichuan Tongwei Sanlian Aquatic Products
Co., Ltd., Chengdu Tongwei Quannonghui E-commerce Co., Ltd. and Chengdu Chunyuan Food Co., Ltd.
were transferred to second-level subsidiaries.
6. Others
□Applicable √Inapplicable

2020 Annual Report
212 / 246
IX. Equity in Other Entities
1. Equities in subsidiaries
(1). Composition of the Group
√Applicable □Inapplicable
Subsidiaries
name
Major places
of business
Registered
place Business nature
Shareholding
proportion (%) Obtaining
method Direct Indirect
Sichuan Yongxiang Co., Ltd. Leshan Leshan Chemical industry, PV
new energy
99.9999 0.0001 Business merger
under common
control
Tongwei Solar (Hefei) Co., Ltd. Hefei Hefei Production and
operation of cells and
modules
100 Business merger
under common
control
Tongwei New Energy Co., Ltd. Chengdu Chengdu PV power management 100 Business merger
under common
control
Chongqing Tongwei Feed Co., Ltd. Chongqing Chongqing Feed production and
operation
100 Business merger
under common
control
Xiamen Tongwei Feed Co., Ltd. Xiamen Xiamen Feed production and
operation
100 Business merger
under common
control
Yuanjiang Tongwei Feed Co., Ltd. Yuanjiang Yuanjiang Feed production and
operation
100 Business merger
under common
control
Wuhan Tongwei Feed Co., Ltd. Wuhan Wuhan Feed production and
operation
100 Business merger
under common
control
Shashi Tongwei Feed Co., Ltd. Shashi Shashi Feed production and
operation
100 Business merger
under common
control
Guangdong Tongwei Feed Co., Ltd. Foshan Foshan Feed production and
operation
100 Business merger
under common
control
Shandong Tongwei Feed Co., Ltd. Zibo Zibo Feed production and
operation
92 Business merger
under common
control
Shandong Tongwei Feed Co., Ltd. Zaozhuang Zaozhuang Feed production and
operation
100 Business merger
under common
control
Suzhou Tongwei Special Feed Co.,
Ltd.
Suzhou Suzhou Feed production and
operation
100 Business merger
under common
control
He'nan Tongwei Feed Co., Ltd. Xinxiang Xinxiang Feed production and
operation
100 Business merger
under common
control
Changchun Tongwei Feed Co., Ltd. Changchun Changchun Feed production and
operation
100 Business merger
under common
control
Chengdu Tongwei Aquatic Products
Technology Co., Ltd.
Chengdu Chengdu Aquaculture industries 100 Business merger
under common
control
Chengdu Tongwei Fish Co., Ltd. Chengdu Chengdu Aquaculture industries 100 Business merger
under common
control
Chengdu Tongwei Sanxin
Pharmaceutical Co. Ltd.
Chengdu Chengdu Veterinary drugs 70 Business merger
under common
control
Tongwei (Hainan) Aquatic Products
Co., Ltd.
Hainan Hainan Food processing 100 Business merger
under common
control
Hainan Haiyi Aquatic Products Feed
Co., Ltd.
Hainan Hainan Feed production and
operation
100 Business merger
under common
control

2020 Annual Report
213 / 246
Zhuhai Haiyi Aquatic Products Feed
Co., Ltd.
Zhuhai Zhuhai Feed production and
operation
100 Business merger
under common
control
Hainan Haiyi Aquatic Seed Co., Ltd. Hainan Hainan Aquaculture industries 49.95 Business merger
under common
control
Nantong Bada Feed Co., Ltd. Nantong Nantong Feed production and
operation
100 Business merger
under common
control
Tongwei (Chengdu) Salmon Co.,
Ltd.
Chengdu Chengdu Aquaculture industries 100 Business merger
under common
control
Hainan Haiyi Biotechnology Co.,
Ltd.
Hainan Chengmai Biological products 51 Business merger
under common
control
Chengdu Xintaifeng Agricultural
Development Co., Ltd.
Chengdu Chengdu Food processing 100 Business merger
under common
control
Nanning Tongwei Feed Co., Ltd. Nanning Nanning Feed production and
operation
100 Establishment by
investment
Tianjin Tongwei Feed Co., Ltd. Tianjin Tianjin Feed production and
operation
100 Establishment by
investment
Huai'an Tongwei Feed Co., Ltd. Huai’an Huai’an Feed production and
operation
100 Establishment by
investment
Jieyang Tongwei Feed Co., Ltd. Jieyang Jieyang Feed production and
operation
100 Establishment by
investment
Chengdu Ronglai Tongwei Feed Co.,
Ltd.
Chengdu Chengdu Feed production and
operation
80 Establishment by
investment
Yangzhou Tongwei Feed Co., Ltd. Yangzhou Yangzhou Feed production and
operation
100 Establishment by
investment
Langfang Tongwei Feed Co., Ltd. Langfang Langfang Feed production and
operation
100 Establishment by
investment
Chengdu Tongwei Animal Nutrition
Technology Co., Ltd.
Chengdu Chengdu Feed production and
operation
100 Establishment by
investment
Panzhihua Tongwei Feed Co., Ltd. Panzhihua Panzhihua Feed production and
operation
100 Establishment by
investment
Tongwei (Chengdu) Aquatic
Products Co., Ltd.
Chengdu Chengdu Food processing 100 Establishment by
investment
Foshan Nanhai Tongwei Aquatic
Products Technology Co., Ltd.
Guangzhou Guangzhou Aquaculture industries 100 Establishment by
investment
Tongwei Agricultural Financing
Guarantee Co., Ltd.
Chengdu Chengdu Guarantee 100 Establishment by
investment
Tongwei (Chengdu) Agriculture
Investment Holding Co., Ltd.
Chengdu Chengdu Investment 100 Establishment by
investment
Sichuan Tongguang Construction
Engineering Co., Ltd.
Chengdu Chengdu Aquaculture industries 100 Establishment by
investment
Tongwei Aquatic Products Co., Ltd. Chengdu Chengdu Aquaculture industries 100 Establishment by
investment
Chongqing Changshou Tongwei
Feed Co., Ltd.
Chongqing
Changshou
Chongqing
Changshou
Feed production and
operation
100 Establishment by
investment
Qianxi Tongwei Feed Co., Ltd. Qianxi Qianxi Feed production and
operation
100 Establishment by
investment
Lianyungang Tongwei Feed Co.,
Ltd.
Lianyungang Lianyungang Feed production and
operation
100 Establishment by
investment
Chengdu Tongwei Automation
Equipment Co., Ltd.
Chengdu Chengdu Equipment
Manufacturing
80 Establishment by
investment
Foshan Tongwei Feed Co., Ltd. Foshan Foshan Feed production and
operation
100 Establishment by
investment
Zibo Tongwei Feed Co., Ltd. Zibo Zibo Feed production and
operation
76 Establishment by
investment
Tongwei (Dafeng) Feed Co., Ltd. Yancheng Yancheng Feed production and
operation
51 Establishment by
investment
Kunming Tongwei Feed Co., Ltd. Kunming Kunming Feed production and
operation
100 Establishment by
investment

2020 Annual Report
214 / 246
Zibo Tongwei Food Co., Ltd. Zibo Zibo Food processing 100 Establishment by
investment
Foshan Gaoming Tongwei Feed Co.,
Ltd.
Gaoming Gaoming Feed production and
operation
100 Establishment by
investment
Tianmen Tongwei Biotechnology
Co., Ltd.
Tianmen Tianmen Feed production and
operation
100 Establishment by
investment
Binyang Tongwei Feed Co., Ltd. Binyang Binyang Feed production and
operation
100 Establishment by
investment
Fuzhou Tongwei Willianm Feed Co.,
Ltd.
Fuzhou Fuzhou Feed production and
operation
65 Establishment by
investment
Ningxia Yinchuan Tongwei Feed
Co., Ltd.
Yinchuan Yinchuan Feed production and
operation
100 Establishment by
investment
Harbin Tongwei Feed Co., Ltd. Binxian
County
Binxian
County
Feed sales 100 Establishment by
investment
Nanjing Tongwei Aquatic Products
Technology Co., Ltd.
Nanjing Nanjing Aquaculture, feed sales 100 Establishment by
investment
Tongwei Holding Pte. Ltd. Singapore Singapore Trade 100 Establishment by
investment
Tongwei Industrial (Tibet) Co., Ltd. Lhasa Lhasa Trade 100 Establishment by
investment
Chizhou Tongwei Feed Co., Ltd. Anhui
Province
Chizhou Feed production and
operation
100 Establishment by
investment
Chengdu Tongwei Aquatic Seed Co.,
Ltd.
Chengdu Chengdu Aquaculture industries 100 Establishment by
investment
Hengshui Tongwei Feed Co., Ltd. Hebei
Province
Hebei
Province
Feed production and
operation
100 Establishment by
investment
Qingyuan Tongwei Feed Co., Ltd. Yingde Yingde Feed production and
operation
100 Establishment by
investment
Honghu Tongwei Feed Co., Ltd. Honghu Honghu Feed production and
operation
100 Establishment by
investment
Sichuan Tongwei Food Co., Ltd. Chengdu Chengdu Food processing 80 Establishment by
investment
Hanshou Tongwei Feed Co., Ltd. Changde Honghu Feed production and
operation
100 Establishment by
investment
Sichuan Fishery-PV Wulian
Technology Co., Ltd.
Chengdu Chengdu Others 60 Establishment by
investment
Sichuan Willtest Technology Co.,
Ltd.
Chengdu Chengdu Testing service 83.04 Establishment by
investment
Wuxi Tongwei Biotechnology Co.,
Ltd.
Wuxi Wuxi Aquaculture, feed sales 100 Establishment by
investment
Tongwei New Energy Engineering
Design (Sichuan) Co., Ltd.
Chengdu Chengdu Electrical Engineering
Design
100 Business merger
under common
control
Zhejiang Tongwei Solar Technology
Co., Ltd.
Zhejiang
Province
Zhejiang
Province
PV new energy 100 Establishment by
investment
Sichuan Tongwei Feed Co., Ltd. Meishan Chengdu Feed production and
operation
100 Establishment by
investment
Sichuan Tongwei Sanlian Aquatic
Products Co., Ltd.
Chengdu Chengdu Aquatic product market
management
55.62 Establishment by
investment
Qingdao Hairen Aquatic Seed
Industry Technology Co., Ltd.
Qingdao Qingdao Aquaculture industries 51 Business merger
under common
control
Chengdu Tongwei Quannonghui
Electronic Commerce Co., Ltd.
Chengdu Chengdu Retail Business 100 Business merger
under common
control
Sichuan Yongxiang New Material
Co., Ltd.
Leshan Leshan Chemical 100 Establishment by
investment
Tianmen Tongwei Aquatic Products
Technology Co., Ltd.
Tianmen Tianmen PV power management 100 Establishment by
investment
Nanning Tongwei Biotechnology
Co., Ltd.
Nanning Nanning Feed production and
operation
100 Establishment by
investment
Yangjiang Haiyi Biotechnology Co.,
Ltd.
Yangjiang Yangjiang Feed production and
operation
100 Establishment by
investment
Nanchang Tongwei Biotechnology
Co., Ltd.
Nanchang Nanchang Feed production and
operation
80 Establishment by
investment

2020 Annual Report
215 / 246
Gongan County Tongwei Aquatic
Products Technology Co., Ltd.
Gong'an Gong'an Aquaculture and
seedling breeding
100 Establishment by
investment
Sichuan Chunyuan Ecological
Breeding Co., Ltd.
Qionglai Qionglai Aquaculture industries 100 Business merger
under common
control
Chengdu Xintaifeng Livestock and
Poultry Farming Co., Ltd.
Qionglai Qionglai Aquaculture industries 100 Business merger
under common
control
Chengdu Chunyuan Food Co., Ltd Qionglai Qionglai Food processing 93.63 Business merger
under common
control
Zhanjiang Haixianfeng Bio-tech Co.,
Ltd.
Hainan Chengmai Biological products 51 Business merger
under common
control
Chengdu Tongwei Fishery-PV
Technology Co., Ltd.
Chengdu Xinjin Others 100 Establishment by
investment
Maoming Tongwei Biotechnology
Co., Ltd.
Maoming Maoming Feed production and
operation
100 Establishment by
investment
Hainan Tongwei Biotechnology Co.,
Ltd.
Hainan Chengmai Feed production and
operation
100 Establishment by
investment
Guangdong Tongwei Biotechnology
Co., Ltd.
Guangdong
Province
Sihui Feed production and
operation
100 Establishment by
investment
Explanation of the fact that the shareholding percentage of the subsidiaries is different from proportion
of votes:
None
Basis for the Company's control over the investee when holding half of the votes or less and the
Company’s loss of control over the investee when holding half of the votes or more:
None
Basis for control over the important structured entities incorporated in consolidated scope:
None
Basis to determine the Company is the agent or the principal:
None
Other notes:
① In 2020, the Company established Chengdu Tongwei Yuguang Technology Co., Ltd., Maoming
Tongwei Biological Technology Co., Ltd., Hainan Tongwei Biological Technology Co., Ltd., and
Guangdong Tongwei Biological Technology Co., Ltd.
② In 2020, the Company's first-tier subsidiaries: Chengdu Tongwei Fish Co., Ltd., Tongwei
(Chengdu) Aquatic Food Co., Ltd., Chengdu Xintaifeng Agricultural Development Co., Ltd., Tongwei
Aquatic Products Co., Ltd., Tongwei (Chengdu) Salmon Co., Ltd., Sichuan Tongwei Sanlian Aquatic
Products Co., Ltd., Chengdu Tongwei Quannonghui E-commerce Co., Ltd. and Chengdu Chunyuan Food
Co., Ltd. were transferred the subsidiaries of Sichuan Tongwei Food Co., Ltd., becoming the second-level
subsidiaries of the Company.
③ Tongwei (Chengdu) Agricultural Investment Holding Co., Ltd., Suzhou Tongwei Special Feed
Co., Ltd., Hainan Haiyi Biotechnology Co., Ltd., Gong'an County Tongwei Aquatic Products Technology
Co., Ltd. and Chengdu Xintaifeng Livestock and Poultry Farming Co., Ltd. were cancelled in 2020.
(2). Important non-wholly-owned subsidiaries
√Applicable □Inapplicable
Unit:Yuan Currency:RMB
Name of subsidiaries
Shareholding
proportion of
minority
shareholders
Profit or loss
attributable to minority
shareholders in the
current period
Dividends declared to
minority shareholders
in the current period
Equity balance of
minority
shareholders at the
end of the period

2020 Annual Report
216 / 246
Sichuan Yongxiang New Energy
Co., Ltd.
15.00% 79,152,378.91 54,000,000.00 288,219,639.38
Explanation of the fact that shareholding percentage is different from the proportion of voting rights for
minority shareholders in the subsidiaries:
□Applicable √Inapplicable
Other notes:
□Applicable √Inapplicable
(3). Major financial information of important non-wholly-owned subsidiaries
√Applicable □Inapplicable

2020 Annual Report
217 / 246
Unit:Yuan Currency:RMB
Name of
subsidiaries
Ending balance Beginning balance
Current assets Non-current assets Total assets Current
liabilities
Non-current
liabilities Total liabilities Current assets Non-current assets Total assets
Current
liabilities
Non-current
liabilities Total liabilities
Sichuan
Yongxiang
New
Energy Co., Ltd.
1,741,305,412.65 3,124,618,871.64 4,865,924,284.29 1,460,492,652.45 1,483,967,369.23 2,944,460,021.68 1,023,382,697.73 2,734,680,780.58 3,758,063,478.31 913,637,643.35 1,450,644,098.45 2,364,281,741.80
Name of subsidiaries
Amount in the current period Amount in the previous period
Operating revenue Net profit Total comprehensive
income
Cash flow from
operating activities Operating revenue Net profit
Total comprehensive
income
Cash flow from
operating activities
Sichuan Yongxiang New
Energy Co., Ltd. 2,290,460,762.24 527,682,526.10 527,682,526.10 91,803,475.40 1,246,542,200.06 193,912,441.10 193,912,441.10 -91,786,560.31

2020 Annual Report
218 / 246
(4). Major limitations on use of enterprise group assets and payment of enterprise group debt:
□Applicable √Inapplicable
(5). Financial support or other supports provided to structured entities incorporated into the scope
of consolidated financial statement
□Applicable √Inapplicable
Other notes:
□Applicable √Inapplicable
2. Transactions of the owner's equity portion variation in the subsidiaries and the subsidiaries still
being under control
□Applicable √Inapplicable
(1). Explanation of the change in the share of the owner’s equity in the subsidiaries
√Applicable □Inapplicable
In January 2020, Jinxian Tiancheng Copper Co., Ltd., a shareholder of Nanchang Tongwei
Biotechnology Co., Ltd., a subsidiary of the Company, increased its capital. After the capital increase, the
company's shareholding ratio in Nanchang Tongwei Biotechnology Co., Ltd. was changed from 82.76%
to 80.00%.
In May 2020, the Company has acquired 0.6% of its equity held by Fu Jiayun of Sichuan Yongxiang
Silicon Material Co., Ltd. with RMB 654,500.00. After the acquisition, the equity ratio of Tongwei Solar
Co., Ltd. in Sichuan Yongxiang Silicon Material Co., Ltd. was changed from 91.55% to 92.15%.
In August 2020, Tongwei New Energy Co., Ltd., a wholly-owned subsidiary of the Company,
acquired 6.01% of Tongwei Huijin New Energy Co., Ltd. held by Feng Dezhi and others for RMB
17,528,723.10. After the acquisition, the shareholding ratio of Tongwei Huijin New Energy Co., Ltd. held
by Tongwei New Energy Co., Ltd., a wholly-owned subsidiary of the Company was changed from 88.75%
to 94.75%.
In September 2020, the Company has acquired 3.68% of its equity held by Zhao Yan of Sichuan
Willtest Technology Co., Ltd. with RMB 343,861.76. After the acquisition, the Company's equity ratio in
Sichuan Willtest Technology Co., Ltd. was increased from 81.68% to 83.04%.
In December 2020, the Company increased its capital to Chengdu Tongwei Automation Equipment
Co., Ltd. by RMB 10,229,800.00. After the capital increase, the company's shareholding in Chengdu
Tongwei Automation Equipment Co., Ltd. was changed from 62.95% to 80.00%.
In December 2020, Sichuan Tongwei Food Co., Ltd., a subsidiary of the Company, acquired 2.06%
of Sichuan Tongwei Sanlian Aquatic Products Co., Ltd. held by Xue Feng and others for RMB 943,000.00.
After the acquisition, the shareholding ratio of Sichuan Tongwei Food Co., Ltd. in Sichuan Tongwei
Sanlian Aquatic Products Co., Ltd. was changed from 53.57% to 55.62%.
In 2020, the Company increased the capital of Sichuan Tongwei Food Co., Ltd. by RMB
44,500,000.00. After the capital increase, the Company's shareholding in Sichuan Tongwei Food Co.,
Ltd.was changed from 70.00% to 80.00%.
(2). The impact of the transaction on the minority shareholders' equity and the owner's equity
attributable to the parent Company
√Applicable □Inapplicable
Unit:Yuan Currency:RMB
Nanchang
Tongwei
Biotechnology
Co., Ltd.
Sichuan
Yongxiang
Silicon
Material
Co., Ltd.
Tongwei
Huijin New
Energy Co.,
Ltd.
Sichuan
Willtest
Technology
Co., Ltd.
Chengdu
Tongwei
Automation
Equipment
Co., Ltd.
Sichuan
Tongwei
Sanlian
Aquatic
Products
Co., Ltd.
Sichuan
Tongwei
Food Co.,
Ltd.
Acquisition
cost/disposal
consideration
654,500.00 17,528,723.10 343,861.76 10,229,800.00 943,000.00 44,500,000.00
--Cash 654,500.00 17,528,723.10 343,861.76 10,229,800.00 943,000.00 44,500,000.00

2020 Annual Report
219 / 246
--Fair value of non-
cash assets
Total acquisition
cost/disposal
consideration
654,500.00 17,528,723.10 343,861.76 10,229,800.00 943,000.00 44,500,000.00
Less: net assets of
the subsidiaries
calculated based on
the proportion of
assets
acquired/disposed
788.43 358,621.23 16,911,260.92 344,237.56 10,525,998.08 819,838.08 41,437,153.69
Difference -788.43 295,878.77 617,462.18 -375.80 -296,198.08 123,161.92 3,062,846.31
Including:
adjustment to the
capital reserves
788.43 -295,878.77 -617,462.18 375.80 296,198.08 -123,161.92 -3,062,846.31
Adjustment of
surplus reserves
Adjustment of
undistributed profit
Other notes
□Applicable √Inapplicable
3. Equity in joint ventures or associates
√Applicable □Inapplicable
(1). Important joint ventures or associates
√Applicable □Inapplicable
Unit:Yuan Currency:RMB
Name of
joint venture
or associate
Major places
of business
Registered
place
Business
nature
Shareholding proportion
(%)
Accounting
treatment method of
joint ventures or
associates Direct Indirect
Lijiang
LONGi
Silicon
Materials
Co., Ltd.
Huaping
County,
Lijiang City,
Yunnan
Province
Clean and
Energy-
bearing
Industry
Park,
Shilongba
Town,
Huaping
County
Production
and sales of
silicon
materials
15.00 Equity method
Explanation of shareholding proportion of joint ventures or associates different from proportion of
voting rights:
None
Basis for determining a shareholder holding less than 20% of the voting rights has significant influence,
or a shareholder holding 20% or more of the voting rights does not have significant influence:
None
(2). Major financial information of important joint ventures
□Applicable √Inapplicable
(3). Major financial information of important associates
√Applicable □Inapplicable
Unit:Yuan Currency:RMB
Ending balance/ Amount
incurred in the current period
Beginning balance/ Amount
incurred in the previous period
Lijiang LONGi Silicon
Materials Co., Ltd.
Lijiang LONGi Silicon
Materials Co., Ltd.

2020 Annual Report
220 / 246
Current assets 1,574,684,481.13
Non-current assets 1,082,766,809.32
Total assets 2,657,451,290.45
Current liabilities 789,201,631.89
Non-current liabilities 362,596,492.47
Total liabilities 1,151,798,124.36
Non-controlling interest
Equity attributable to shareholders of
the parent company
1,505,653,166.09
Net assets calculated based on
percentage of shareholding
225,847,974.91
Adjustment events -1,101,889.60
--Goodwill
--Unrealized profit of internal
transaction
-1,101,889.60
--Others
Book value of equity investment in
associates
224,746,085.31
Fair value of equity investment in
associates with public offer
Operating revenue 3,041,951,877.56
Net profit 685,658,922.50
Net profit from termination of
operation
Other comprehensive income
Total comprehensive income
Dividends received from associates in
the current year
Other notes
In February 2021, the Company signed an equity transfer agreement with Longi Green Energy
Technology Co., Ltd., stipulating that the Company held 15% of the shares of Lijiang Longi Silicon
Materials Co., Ltd.based on the audited net assets on September 30, 2020. After the profit distribution of
Lijiang Longi Silicon Materials Co., Ltd. was multiplied by the shareholding ratio, the net assets are
transferred to Longi Green Energy Technology Co., Ltd., so Lijiang Longi Silicon Materials Co., Ltd. was
not an important joint venture in 2020. The corresponding data was reported in unimportant associates.
(4). Summary of financial information of unimportant joint ventures and associates
√Applicable □Inapplicable
Unit:Yuan Currency:RMB Ending balance/ Amount incurred in
the current period
Beginning balance/ Amount incurred
in the previous period
Joint ventures:
Total book value of investment 125,664,667.11 133,196,410.24
Total amount of following items according to shareholding proportion
--Net profit -3,121,628.38 6,008,246.06
--Other comprehensive income 40,051.66
--Total comprehensive income -3,121,628.38 6,048,297.72
Associate:
Total book value of investment 352,071,415.11 81,798,729.03
Total amount of following items according to shareholding proportion
--Net profit 25,628,155.16 -56,957.92

2020 Annual Report
221 / 246
--Other comprehensive income
--Total comprehensive income 25,628,155.16 -56,957.92
(5). Explanation on major restrictions on the capability of transferring capital from joint ventures
or associates to the Company
□Applicable √Inapplicable
(6). Excess loss incurred to joint ventures or associates
□Applicable √Inapplicable
(7). Unrecognized commitments related to investment of joint ventures
□Applicable √Inapplicable
(8). Contingent liabilities related to investment in associates or joint ventures
□Applicable √Inapplicable
4. Significant joint operation
□Applicable √Inapplicable
5. Equity in the structured entities not included in consolidated financial statements
Explanation of the structured entities not included in consolidated financial statements:
□Applicable √Inapplicable
6. Others
□Applicable √Inapplicable
X. Risks Related to Financial Instruments
√Applicable □Inapplicable
The Company is faced with all kinds of financial risks during operation: credit risk, market risk and
liquidity risk.
(I). Credit risk
Credit risk refers to the risk of financial loss of one party due to the failure to perform obligations by
another party of financial instruments. The Company is mainly confronted with customer credit risks
arising from sale on credit. Before the conclusion of a new contract, the Company may evaluate the credit
risk of a new customer, including external credit rating and, in some cases, bank reference letter (if
available). The Company has set a credit limit for each customer which is the maximum limit without
obtaining any additional approval.
Through credit monitoring and account receivable age management for existing customers, the
financial department submits weekly changes in receivables of key customers to ensure that the Company's
overall credit risk is within a controllable range. Customers shall be grouped according to the credit
features in monitoring the credit risks of customers. Customers classified into "high risk" level will be
listed in the list of restricted customers, and they must make corresponding payments in advance.
(II). Market risk
Market risk of financial instruments refers to the risk of fluctuation in fair value or future cash flow
of financial instruments due to market price development, including foreign exchange risk, interest rate
risk and other price risk.
1. Interest rate risk
Interest rate risk refers to the risk of fluctuation in fair value or future cash flow of financial
instruments due to change in market interest rate. Interest rate risks faced by the Company are mainly from
bank borrowings.
By controlling the debt structure within a reasonable range, the Company's headquarters will
uniformly dispatch the funds of domestic branches, enhance the liquidity of funds, prevent the occurrence of overdue loans, maintain good bank credit and effectively control interest rate risks.
2. Foreign exchange risk

2020 Annual Report
222 / 246
Foreign exchange risk refers to the risk of fluctuation in fair value or future cash flow of financial
instruments due to change in foreign exchange rate. The Company tries to match the foreign currency
income and foreign expense to reduce foreign exchange risk. The foreign exchange risks faced by the
Company mainly come from financial assets and financial liabilities denominated in foreign currencies
such as us dollar, Vietnamese dong, Bangladesh taka, Indonesian rupiah, SGD, euro and HKD. Please
refer to "monetary items for foreign currency" for the amount converted from foreign currency financial
assets and foreign currency financial liabilities into RMB.
(III). Liquidity risk
Liquidity risk refers to the risk of capital shortage in performing obligation of settling accounts by
cash payment or other financial assets. The policy of the Company is to ensure that there is sufficient cash
to pay the matured debt. Liquidity risk is generally controlled by the finance department of the Company.
The finance department ensures that the Company possesses sufficient capital to pay the debt through
monitoring of cash reserves and negotiable securities which can be converted into cash at any time and
rolling prediction of cash flow in the next 12 months.
XI. Disclosure of Fair Value
1. Ending fair value of assets and liabilities measured at fair value
√Applicable □Inapplicable
Unit:Yuan Currency:RMB
Item
Ending fair value
Level 1 fair value
measurement
Level 2 fair value
measurement
Level 3 fair value
measurement Total
I. Continuous fair value
measurement
(I) Trading financial assets 4,863,068.12 1,527,000,000.00 1,531,863,068.12
1.Financial assets at fair
value through current profit
and loss
(1) Bond instrument
investment 1,500,000,000.00 1,500,000,000.00
(2) Equity instrument
investment 27,000,000.00 27,000,000.00
(3) Derivative financial
assets 4,863,068.12 4,863,068.12
2. Financial assets
designated to be measured at
fair value with the changes
in fair value included in
current profit and loss
(1) Bond instrument
investment
(2) Equity instrument
investment
(II) Other debt investments
(III) Other equity instrument
investments 153,445,100.85 153,445,100.85
(IV) Investment real estates
1.Land use right for lease
2. Buildings for lease
3. Land use rights possessed
and ready for transfer after
appreciation
(V) Biological assets
1.Consumptive biological
assets
2. Productive biological
assets
Receivable financing 9,711,898,567.92 9,711,898,567.92
Other non-current financial
assets 1,258,097.00 1,258,097.00

2020 Annual Report
223 / 246
Total amount of assets
continuously measured at
fair value
4,863,068.12 11,393,601,765.77 11,398,464,833.89
(VI) Trading financial
liabilities
1.Financial liabilities at fair
value through current profit
and loss
Including: trading bonds
issued
Derivative financial
liabilities
Others
2. Financial liabilities
measured at fair value with
their variance recorded into
current profit and loss
Total liabilities
continuously measured at
fair value
II. Non-continuous fair
value measurement
(I) Held-for-sale assets
Total amount of assets
non-continuously
measured at fair value
Total amount of liabilities
non-continuously
measured at fair value
2. Basis for recognition of market prices for continuous and non-continuous level 1 fair value
measurement items
√Applicable □Inapplicable
Derivative financial assets are floating profit from US dollar forward foreign exchange purchase
contracts, and the ending fair value is calculated from data published by the bank that signed the
contract.
3. Qualitative and quantitative information about valuation techniques and key parameters of
items subject to continuous and non-continuous level 2 fair value measurement
□Applicable √Inapplicable
4. Qualitative and quantitative information about valuation techniques and key parameters of
items subject to continuous and non-continuous level 3 fair value measurement
√Applicable □Inapplicable
Debt instrument investment is the structured deposit purchased by the company. Due to the short
term and the book value is similar to the fair value, it is measured at the investment cost as the fair value.
The equity instrument investment is the company’s equity holdings and the expected recovery amount is
measured as the fair value.
The remaining period of receivables financing is relatively short, and the book value is close to the
fair value. The book value is adopted as the fair value.
Investment in other equity instruments takes the net assets of the invested entity at the end of the
period as an important reference basis for assessing its fair value. The fair value is determined by specific

2020 Annual Report
224 / 246
valuation techniques, and the important parameters include the interest rate that cannot be directly
observed.
Other non-current financial assets have not undergone major changes due to the business environment,
operating conditions, and financial status of the investee, and the company shall use the investment cost
as its fair value to be measured.
5. Information on adjustment between beginning book value and ending book value of items
subject to continuous level 3 fair value measurement and sensitivity analysis of non-observable
parameters
□Applicable √Inapplicable
6. Reasons for transfer and the policies applicable at the time of transfer for items subject to
continuous fair value measurement and having transferred between levels in the current period
□Applicable √Inapplicable
7. Change of valuation techniques incurred in the current period and the reasons thereof
□Applicable √Inapplicable
8. Fair value of financial assets and liabilities not measured at fair value
□Applicable √Inapplicable
9. Others
□Applicable √Inapplicable
XII. Related Parties and Related Party Transactions
1. Parent company of the Company
√Applicable □Inapplicable
Unit:10,000Yuan Currency:RMB
Name of the parent
company
Registered
place
Business
nature
Registered
capital
Share proportion
held by parent
company in the
Company (%)
Voting right
proportion of parent
company in the
Company (%)
Tongwei Group Co., Ltd. Sichuan
Province
Mixed
operation
20,000.00 44.39 44.39
Instructions to the parent company of the Company
Company name: Tongwei Group Co., Ltd.; nature of enterprise: limited liability company; Registered
Address: No. 588, Tianfu Avenue Middle Section, High-Tech Zone, Chengdu; office location: No.588,
Tianfu Avenue Middle Section, High-Tech Zone, Chengdu; legal Representative: Guan Yamei; registered
capital: RMB 200 million. Scope of business: (The following scope does not include items requiring prior
approval, and items subject to ex-post approval are operated with license or approval documents) Feed
processing; manufacturing of special equipment for electronic industry; manufacturing of PV equipment
and components; cell manufacturing; manufacturing of domestic appliances for gas, solar and similar
energy sources; aquaculture (the above items are limited to branches); wholesale and retail of commodities;
livestock husbandry; science and technology promotion and application services; software and
information technology services; import and export industry; real estate development and management;
property management; leasing industry; advertising; solar power generation. (For the items that are subject
to approval according to laws, the business activities shall be carried out only with approval from relevant
departments.)
Ultimate controller of the Company is Liu Hanyuan
Other notes:
None
2. Subsidiaries of the Company
For detailed information about subsidiaries of the Company, see Notes.
√Applicable □Inapplicable

2020 Annual Report
225 / 246
For detailed information about subsidiaries of the Company, see “Equity in Other Entities”.
3. Information of joint ventures and associates of the Company
For detailed information about important joint ventures or associates of the Company, see Notes.
□Applicable √Inapplicable
The information on other joint ventures or associates which produced balance for conducting related party
transaction with the Company in the current period or in the previous period is shown as follows
√Applicable □Inapplicable
Name of joint venture or associate Relationship with the Company
Shaoxing Tongwei Jiuding Feed Co., Ltd. Joint venture
Hefei Tongwei Jiuding Feed Co., Ltd. Joint venture
Maoming Tongwei Jiuding Feed Co., Ltd. Joint venture
Huangmei Tongwei Jiuding Feed Co., Ltd. Joint venture
BioMar Tongwei (Wuxi) Biotech Co., Ltd. Joint venture
Jiangsu Yanhai Tongwei Fuyun New Energy
Co., Ltd.
Joint venture
Lijiang LONGi Silicon Materials Co., Ltd. Associate
Zhongwei New Energy (Chengdu) Co., Ltd. Associate
Other notes
□Applicable √Inapplicable
4. Information of other related parties
√Applicable □Inapplicable Name of other related parties Relationship between other related parties and the Company
Chengdu Care Pet Food Co., Ltd. The same ultimate control
Chengdu Tongwei Culture Media Co.,
Ltd.
The same ultimate control
Chengdu Tongwei Property Co., Ltd. The same ultimate control
Chengdu Tongyu Property Co., Ltd. The same ultimate control
Chengdu Xinrui Technology
Development Co., Ltd.
The same ultimate control
Sichuan Huadi Hengtong Group Co., Ltd. The same ultimate control
Meishan Tongwei Land Property Co.,
Ltd.
The same ultimate control
Leshan Yongxiang Polysilicon Co., Ltd. The same ultimate control
Zhuhai Haiwei Feed Co., Ltd. A wholly-owned subsidiary of the joint venture BioMar Tongwei (Wuxi)
Biotech Co., Ltd.
Other notes
None
5. Related party transactions
(1). Related transactions of purchasing or selling goods and rendering or receiving labor services
Table of purchasing goods/receiving labor services
√Applicable □Inapplicable
Unit:Yuan Currency:RMB
Related party Content of related party transaction Amount in the
current period
Amount in the
previous period
Zhuhai Haiwei Feed Co., Ltd. Feed, raw materials, packaging, labels 51,746,426.23 106,061,035.89
Zhongwei New Energy (Chengdu) Co., Ltd. Cells, monocrystalline silicon wafers, pastes,
chemical major materials 24,038,384.44
BioMar Tongwei (Wuxi) Biotech Co., Ltd. Feed, premix 132,070.00 1,606,357.70
Zhuhai Haiwei Feed Co., Ltd. Processing charges 35,145.94 35,073.44
Leshan Yongxiang Polysilicon Co., Ltd. Machinery equipment 5,512,820.52

2020 Annual Report
226 / 246
Chengdu Tongyu Property Co., Ltd. Property fees and service charge 33,118,380.09 29,057,206.36
Chengdu Tongwei Culture Media Co., Ltd. Goods and labor services 13,193,706.47 8,215,962.90
Chengdu Xinrui Technology Development Co.,
Ltd.
ERP Information Management Platform 600,000.00
Chengdu Xinrui Technology Development Co.,
Ltd.
Spare parts and equipment 56,823,096.05 30,829,166.75
Table of selling goods/rendering labor services
√Applicable □Inapplicable
Unit:Yuan Currency:RMB
Related party Content of related party transaction Amount in the
current period
Amount in the
previous period
Lijiang LONGi Silicon Materials Co., Ltd. Polysilicon 411,596,495.67 323,495,908.88
Zhuhai Haiwei Feed Co., Ltd. Raw materials, feed, medicine, packaging 43,895,114.93 13,533,225.60
BioMar Tongwei (Wuxi) Biotech Co., Ltd. Feed, raw materials, premix, packaging 21,140,103.85 56,927,718.15
Zhongwei New Energy (Chengdu) Co., Ltd. Cells, monocrystalline silicon wafers,
others, tooling 13,986,289.11 9,622,828.86
Tongwei Group Co., Ltd. and its subsidiaries Food 2,248,468.28 532,763.02
Chengdu Care Pet Food Co., Ltd. Premix 171,972.50 134,395.00
Maoming Tongwei Jiuding Feed Co., Ltd. Feed 86,878,572.97 157,780,969.90
Shaoxing Tongwei Jiuding Feed Co., Ltd. Feed, packaging 24,455,667.01 68,614,519.94
Hefei Tongwei Jiuding Feed Co., Ltd. Feed 8,406,436.28 66,667,939.32
Huangmei Tongwei Jiuding Feed Co., Ltd. Feed 12,039,841.63 58,963,841.98
Tongwei Group Co., Ltd. Feed 17,250.00
BioMar Tongwei (Wuxi) Biotech Co., Ltd. Machinery equipment 1,655,191.09
Tongwei Group Co., Ltd. Machinery equipment 185,683.25
Zhuhai Haiwei Feed Co., Ltd. Machinery equipment 69,254.00
Chengdu Care Pet Food Co., Ltd. Machinery equipment 39,067.95
Meishan Tongwei Land Property Co., Ltd. Office equipment 4,275.14
Chengdu Care Pet Food Co., Ltd. Testing service 70,629.25 75,533.50
Tongwei Group Co., Ltd. Testing service 5,629.25
Zhuhai Haiwei Feed Co., Ltd. Service charge 435,394.32
BioMar Tongwei (Wuxi) Biotech Co., Ltd. Service service, engineering labor 677,242.47
Tongwei Group Co., Ltd. and its subsidiaries Others 72,982.32
Explanation for related party transactions of purchasing or selling goods and rendering or receiving labor
services
□Applicable √Inapplicable
(2). Related entrusted management/contracting and entrusting management/outsourcing
Entrusted management/contracting of the Company:
□Applicable √Inapplicable
Related entrusting/contracting
□Applicable √Inapplicable
Entrusting management/outsourcing of the Company
□Applicable √Inapplicable
Related management/outsourcing
□Applicable √Inapplicable
(3). Related lease
The Company as the lessor:
√Applicable □Inapplicable
Unit:Yuan Currency:RMB
Name of lessee Type of leased
assets
Lease income recognized in
the current period
Lease income recognized
in the previous period
Chengdu Care Pet Food Co., Ltd. Machinery
equipment
4,948,883.02 5,267,228.58
Chengdu Care Pet Food Co., Ltd. Houses and
buildings
1,402,394.82 1,513,219.08
Sichuan Huadi Hengtong Group Co., Ltd.
Houses and
buildings
16,274.31

2020 Annual Report
227 / 246
Zhongwei New Energy (Chengdu)
Co., Ltd.
Houses and
buildings
2,582,095.45
The Company as the leasee:
√Applicable □Inapplicable
Unit:Yuan Currency:RMB
Name of lessor Type of leased
assets
Lease expenses
recognized in the
current period
Lease expenses
recognized in the
previous period
Chengdu Tongwei Property Co., Ltd.
Houses and
buildings
13,142,095.31 13,197,211.98
Tongwei Group Co., Ltd.
Houses and buildings
1,086,024.76 1,134,712.86
Notes for related lease
□Applicable √Inapplicable
(4). Related party guarantee
The Company as the guarantor
□Applicable √Inapplicable
The Company as the secured party
√Applicable □Inapplicable
Unit:Yuan Currency:RMB
Guarantor Guaranteed amount Starting date of the
guarantee
Expiration date of the
guarantee
Whether the guarantee has
been fulfilled
Tongwei Group 400,300,932.69 2020/2/25 2021/2/24 No
Tongwei Group 100,030,833.33 2020/2/25 2021/2/24 No
Tongwei Group 200,238,333.33 2020/3/13 2021/3/12 No
Tongwei Group 98,089,833.33 2020/4/30 2021/4/29 No
Tongwei Group 100,117,638.90 2020/8/31 2021/2/28 No
Tongwei Group 100,128,333.34 2020/9/29 2021/9/28 No
Tongwei Group 100,110,000.00 2020/10/30 2021/10/29 No
Tongwei Group 200,235,277.78 2020/12/10 2021/12/9 No
Tongwei Group 200,235,277.78 2020/12/25 2021/12/9 No
Tongwei Group 10,011.92 2020/6/12 2021/6/8 No
Tongwei Group 10,011.92 2020/6/12 2021/12/8 No
Tongwei Group 10,011.92 2020/8/14 2021/2/8 No
Tongwei Group 10,011.92 2020/8/14 2021/8/8 No
Tongwei Group 5,551,638.76 2016/11/25 2021/5/18 No
Tongwei Group 5,551,638.76 2016/11/25 2021/11/18 No
Tongwei Group 5,784,680.19 2017/3/16 2021/5/31 No
Tongwei Group 5,784,680.19 2017/3/16 2021/11/30 No
Tongwei Group 10,012,986.11 2020/6/22 2021/5/25 No
Tongwei Group 13,611,012.22 2016/11/25 2021/11/18 No
Tongwei Group 14,211,498.06 2017/3/16 2021/5/31 No
Tongwei Group 14,211,498.06 2017/3/16 2021/11/30 No
Tongwei Group 260,349,555.56 2019/10/31 2021/10/31 No
Tongwei Group 10,613,937.50 2020/11/24 2021/9/20 No
Tongwei Group 10,294,402.78 2020/11/23 2021/3/20 No
Tongwei Group 10,294,402.78 2020/11/23 2021/10/25 No
Tongwei Group 1,368,362.50 2020/10/27 2021/12/23 No
Tongwei Group 1,322,502.83 No
Tongwei Group 11,076.31 No
Tongwei Group 270,000,000.00 2020/5/29 2022/5/29 No
Tongwei Group 99,970,000.00 2020/6/12 2022/6/10 No
Tongwei Group 220,000,000.00 2020/6/22 2022/5/25 No
Tongwei Group 10,000,000.00 2020/6/22 2022/5/25 No
Tongwei Group 99,980,000.00 2020/8/14 2022/8/12 No

2020 Annual Report
228 / 246
Tongwei Group 269,000,000.00 2020/10/27 2023/9/7 No
Tongwei Group 200,000,000.00 2020/11/11 2023/11/10 No
Tongwei Group 460,000,000.00 2020/11/23 2023/11/22 No
Tongwei Group 450,000,000.00 2020/11/24 2023/11/23 No
Tongwei Group 500,000,000.00 2020/12/28 2023/12/27 No
Tongwei Group 5,611,414.00 2016/11/25 2022/5/18 No
Tongwei Group 5,611,414.00 2016/11/25 2022/11/18 No
Tongwei Group 5,850,000.00 2017/3/16 2022/5/31 No
Tongwei Group 5,870,000.00 2017/3/16 2022/11/18 No
Tongwei Group 16,600,000.00 2017/3/16 2022/5/31 No
Tongwei Group 16,800,000.00 2017/3/16 2022/11/30 No
Notes for related party guarantee
√Applicable □Inapplicable
The long-term loan due within one year includes interest payable within one year on the long-term loan
is RMB 1,333,579.14.
(5). Fund lending/borrowing of related parties
□Applicable √Inapplicable
(6). Asset transfer and debt restructuring of related parties
□Applicable √Inapplicable
(7). Remuneration of key management personnel
√Applicable □Inapplicable
Unit:Yuan Currency:RMB
Item Amount in the current period Amount in the previous period
Remuneration of key management
personnel
34,163,794.45 30,892,837.68
(8). Other related party transactions
□Applicable √Inapplicable
6. Receivables and payables of related parties
(1). Receivable items
√Applicable □Inapplicable
Unit:Yuan Currency:RMB
Project name
Related party
Ending balance Beginning balance
Book balance
Bad debt
reserves Book balance
Bad debt
reserves
Accounts
receivable
Tongwei Co., Ltd. 45,544.80
Accounts
receivable
Tongwei Bioma (Wuxi) Biotechnology Co.,
Ltd. 22,300.00
Other receivables
Zhuhai Haiwei Feed Co., Ltd. 14,995,598.87
Other receivables
Jiangsu Yanhai Tongwei Fuyun New Energy
Co., Ltd. 4,274,559.53
(2). Payable items
√Applicable □Inapplicable
Unit:Yuan Currency:RMB
Project name Related party Book balance at the
end of the period
Book balance at
the beginning of
the period
Accounts payable Chengdu Xinrui Technology Development
Co., Ltd.
19,615,058.44 2,048,734.66
Accounts payable Chengdu Tongwei Culture Media Co., Ltd. 3,583,632.38 480,010.53

2020 Annual Report
229 / 246
Accounts payable Zhuhai Haiwei Feed Co., Ltd. 209,203.69 175,075.93
Accounts payable Chengdu Tongyu Property Co., Ltd. 683.05
Contract liability Maoming Tongwei Jiuding Feed Co., Ltd. 1,365,919.05
Contract liability Zhongwei New Energy (Chengdu) Co., Ltd. 1,350,000.37
Contract liability BioMar Tongwei (Wuxi) Biotech Co., Ltd. 296,096.73
Contract liability Tongwei Group Co., Ltd. 7,988.20
Other payables
Chengdu Xinrui Technology Development
Co., Ltd.
670,000.00 450,000.00
Other payables Chengdu Tongwei Culture Media Co., Ltd. 328,978.47 68,974.40
Other payables Chengdu Tongyu Property Co., Ltd. 86,747.86 108,835.85
Other payables Zhuhai Haiwei Feed Co., Ltd. 33,422.22 329,375.80
Other payables Shaoxing Tongwei Jiuding Feed Co., Ltd. 12,365,759.65
Other payables Huangmei Tongwei Jiuding Fodder Co., Ltd. 8,763,049.31
Other payables Hefei Tongwei Jiuding Feed Co., Ltd. 5,357,569.86
Other payables Maoming Tongwei Jiuding Feed Co., Ltd. 249.22 2,839,538.75
Other payables BioMar Tongwei (Wuxi) Biotech Co., Ltd. 90,776.95
Note: the Company implements unified adjust for the venture capital (including: BioMar Tongwei (Wuxi)
Biotech Co., Ltd., Zhuhai Haiwei Feed Co., Ltd., dispensing money provided by the shareholders in
proportion to their respective shares of capital contribution), and according to the interest rate calculated
with the benchmark interest rate of one-year loan regulated by the People's Bank of China, the interest
amount paid by the Company (negative: show the received interest of the Company) is as follows:
Related party Amount in the current
period
Amount in the previous period
Huangmei Tongwei Jiuding Fodder Co., Ltd. 270,061.53 328,485.06
Hefei Tongwei Jiuding Feed Co., Ltd. 175,665.88 388,124.68
Shaoxing Tongwei Jiuding Feed Co., Ltd. 459,688.47 171,697.93
Zhuhai Haiwei Feed Co., Ltd. -715,997.24 35,737.92
Maoming Tongwei Jiuding Feed Co., Ltd. 129,735.92 5,824.56
BioMar Tongwei (Wuxi) Biotech Co., Ltd. 751,919.52 -1,078,741.84
Total 1,071,074.08 -148,871.69
7. Commitments by related parties
□Applicable √Inapplicable
8. Others
□Applicable √Inapplicable
XIII. Share-based payment
1. General conditions of share-based payment
□Applicable √Inapplicable
2. Equity-settled share-based payment
□Applicable √Inapplicable
3. Cash-settled share-based payment
□Applicable √Inapplicable
4. Changes to and termination of shared-based payment
□Applicable √Inapplicable
5. Others
□Applicable √Inapplicable

2020 Annual Report
230 / 246
XIV. Commitments and Contingencies
1. Significant commitments
□Applicable √Inapplicable
2. Contingencies
(1). Significant contingencies existed on the balance sheet date
√Applicable □Inapplicable
External guarantee
As of December 31, 2020, the Company's external guarantees, the repayment of guaranteed loans
and the recovery of guaranteed credit sales after the statement date are as follows:
Providing guarantee to borrow money from financial institutions, which for husbandry farmers to buy
Tongwei feed and for farmers to build rooftop powerplants:
Item
Starting date
of the
guarantee
Expiration
date of the
guarantee
Guaranteed amount
Return the loan or
collect the loan after
the statement date
Tongwei Agricultural Financing Guarantee Co.,
Ltd. provides guarantee for husbandry farmers to borrow money from financial institutions to buy
Tongwei feed
2020/1/3 2021/12/31 451,934,771.28 206,306,006.50
Tongwei Agricultural Financing Guarantee Co.,
Ltd. provides guarantee for farmers to borrow
money from financial institutions to build rooftop
powerplants
2017/9/15 2028/5/31 23,430,098.75 651,086.46
Total 475,364,870.03 206,957,092.96
As of December 31, 2020, Tongwei Agricultural Financing Guarantee Co., Ltd. had a guaranteed
compensation balance of RMB 21,886,190.75, and the Company was seeking compensation.
As of December 31, 2020, the Company has no other significant contingencies that shall be disclosed
except for those mentioned above.
(2). In case of no significant contingencies to be disclosed, explanation shall be given:
□Applicable √Inapplicable
3. Others
□Applicable √Inapplicable
XV. Events after the Balance Sheet Date
1. Significant non-adjusting events
□Applicable √Inapplicable
2. Profit distribution
√Applicable □Inapplicable
Unit:Yuan Currency: RMB Proposed profit or dividends 1,084,873,112.34
Profit or dividends declared to be paid after
examination and approval
3. Sales return
□Applicable √Inapplicable
4. Explanation for other events after the Balance Sheet Date
√Applicable □Inapplicable
On February 25, 2021, the 2021 first extraordinary general meeting of shareholders of the Company
reviewed and approved the Tongwei Co., Ltd. Employee Stock Ownership Plan 2021-2023 (Draft) and its
summary and other related proposals. On February 9, 2021, the seventeenth meeting of the seventh board
of directors and the sixteenth meeting of the seventh board of supervisors reviewed and approved Tongwei Co., Ltd. Employee Stock Ownership Plan 2021-2023 (Draft) and Proposal. The total amount of funds

2020 Annual Report
231 / 246
raised during the establishment of the current employee stock ownership plan does not exceed 1,350
million yuan, and the source of stocks is purchased in the secondary market (including but not limited to
bidding transactions, block transactions (including but not limited to the transfer of shares from the
controlling shareholder) transfer by agreement) and other methods permitted by laws and regulations.
Except for the above matters, as of April 9, 2021, the Company had no other major post-balance sheet
matters that need to be disclosed.
XVI. Other Significant Events
1. Correction of accounting errors in the previous period
(1). Retrospective restatement
□Applicable √Inapplicable
(2). Prospective application
□Applicable √Inapplicable
2. Debt restructuring
□Applicable √Inapplicable
3. Replacement of assets
(1). Exchange of non-monetary assets
□Applicable √Inapplicable
(2). Replacement of other assets
□Applicable √Inapplicable
4. Annuity plan
□Applicable √Inapplicable
5. Discontinued operation
□Applicable √Inapplicable
6. Segment information
(1). Determination basis and accounting policy of reporting segments
√Applicable □Inapplicable
The Company determines the operating segments on the basis of internal organization structure,
management requirements and internal reporting system. An operating segment of the Company is a
component that satisfies all of the following conditions:① it is able to create revenue and incur expenses
from ordinary business activities; ② its operating results can be regularly reviewed by the Management
for making decision about resources to be allocated and to assess its performance;③ the accounting
information on its financial position, operating results and cash flow is available through analysis. Where
two or more operating segments have similar economic features and meet certain conditions, they can be
combined into one operating segment.
The Company determines the reporting segments based on the business segments. The major business
income and cost, assets and liabilities are divided according to similar business operating entities.
(2). Financial information of reporting segments
√Applicable □Inapplicable
Unit:Yuan Currency: RMB Item Management
headquarters
Agriculture and
animal husbandry
business
PV business Offset among
segments
Total
Total assets 32,824,494,504.24 7,239,459,251.35 49,794,896,994.95 25,606,902,679.63 64,251,948,070.91

2020 Annual Report
232 / 246
Total liabilities 7,330,083,315.43 4,287,557,341.80 35,825,264,345.46 14,734,903,241.97 32,708,001,760.72
Major business
income
20,935,749,897.11 22,502,320,432.61 4,426,670.69 43,433,643,659.03
Cost of major
operations
18,699,941,643.52 17,284,675,795.86 3,298,026.69 35,981,319,412.69
(3). Where the Company has no reporting segment or cannot disclose total assets and total liabilities
of reporting segments, explain the reasons
□Applicable √Inapplicable
(4). Other notes
□Applicable √Inapplicable
7. Other significant transactions and matters affecting investors’ decisions
□Applicable √Inapplicable
8. Others
√Applicable □Inapplicable
(1) The pledge of shares held by the controlling shareholder
As of December 31, 2020, Tongwei Group Co., Ltd. held 1,998,422,515 shares of the Company, of
which: 738,900,000 shares were pledged for financing.
(2) Property certificate processing progress for phase-III and phase-IV project land of Tongwei Solar
(Chengdu) Co., Ltd.
The property certificate processing progress of the phase-III and phase-IV project: the phase-III and
phase-IV projects are located in Groups 5 and 6 of Bajiao Community, Huangjia Street, Shuangliu District,
Chengdu, and Group 5 of Wangjiachang Community. The total land area is 340 mu, of which: 180 acres
have been completed; the real estate property registration certificate of the plot was obtained in June 2019,
No. C (2019) Shuangliu District Real Estate Property No. 0048667, 120543.26 ㎡; the remaining land
is160 mu, of which 60 mu involve litigation disputes; after the land litigation dispute is resolved, the
relevant housing construction and ownership certificate acquisition procedures can be processed.
Land litigation disputes are disputes over exclusion and nuisance caused by land replacement matters
approved by the government. The plaintiff, Chengdu Guigu Environmental Technology Co., Ltd., was
identified as idle land by the Shuangliu District Planning and Natural Resources Bureau of Chengdu
because it had not started development for two years after the agreed start and development date. At the
same time, the government approved the replacement of the land as the land for construction of the phase-
III and phase-IV projects. The plaintiff filed a lawsuit with the Shuangliu District People's Court in
February 2019, requesting the Company to eliminate the nuisance and compensate for the loss. According
to the certification documents issued by the Southwest Airport Economic Development Zone Management
Committee, Chengdu Shuangliu District New Economy and Technology Bureau, Chengdu Shuangliu
District Planning and Natural Resources Bureau, and Chengdu Shuangliu District Housing Construction
and Transportation Bureau, the competent government department recognizes and agrees to the
construction activities of the Company, and makes every effort to promote the processing of the property
rights of related land/real estate. Therefore, the lawsuit will not have a material adverse effect on the
company's production, operation and financial status.
(3) Impairment of PV powerplant assets
By the end of 2020, among the completed grid-connected PV power generation projects of the
Company, 138.79MW has not yet obtained the subsidy indicator in full, and the possibility of obtaining
additional subsidy indicators in the future is small, and there are signs of impairment. The situation is as
follows:
1) Two PV power generation projects (Phase-I and Phase-II) in Maanshan, Anhui
According to the regulations of WNYXN [2016] No.13 “Notice on Improving Construction and
Management of "First Building and First Getting" Distributed PV Powerplants” issued by Anhui Energy
Administration, National Energy Administration East China Regulatory Bureau, Anhui Price Bureau, and

2020 Annual Report
233 / 246
State Grid Anhui Electric Power Company issued on February 17, 2016, the ground distributed PV
powerplants are built firstly and got firstly. After the project is completed, it will be included in the annual
construction scale of our province in accordance with the order of grid connection. The Company has built
the first and second phases of Fishery & PV Integration PV powerplants, with a grid-connected scale of
64.59MW, which were connected to the grid for power generation at the end of July 2017 and January
2018 respectively, and received a subsidy indicator of 3.9MW in March 2020. It is expected that the
possibility of subsidizing the target is small by the end of 2020.
2) PV Power Project in Fengnan, Tangshan of Hebei
Fishery & PV Integration PV Powerplant in Fengnan Tangshan Hebei obtained record with the
JFGNYBZ No. [2017] No. 107 of Hebei Provincial Development and Reform Commission on May 31,
2017, and was connected to the grid in December 2018, with a grid size of 74.2MW. The subsidy indicator
of 24MW has been obtained. By the end of 2020, it is expected that the possibility of obtaining the subsidy
indicator in the future is small.
The above PV power generation projects are expected to have future cash inflows lower than the
investment and construction expectations, and there are signs of impairment. For this reason, in accordance
with the principle of prudence, impairment tests are conducted based on the existing subsidy indicators,
and impairment reserves of RMB 221,877,000 are accrued.
(4) Loss from scrapping of fixed assets
In 2020, there was a loss of 399,711,800 yuan from scrapped fixed assets, mainly including:
1) Sichuan Yongxiang Polysilicon Co., Ltd. dismantled assets and lost 288.4797 million yuan
The Company upgraded the distillation and reduction sections of the original 20,000MT high-purity
polysilicon project, and dismantled part of the equipment. In the fourth quarter of 2020, after on-site survey
and appraisal by engineering technology and equipment management personnel, the corresponding assets
are no longer used, and it was scrapped. The original book value of the scrapped assets was 573,125,100
yuan, the book value was 293,318,500 yuan, and the net loss after deducting the estimated residual value
was 288,479,700 yuan.
2) Tongwei Solar (Hefei) Co., Ltd. lost RMB 60,521,800 from dismantling assets
According to data from PVInfolink, the market share of multicrystalline cells in 2020 was about 10%,
and it was expected that the market share of multicrystalline cells would further reduce to 2% in 2022.
However, due to the price advantage of multicrystalline modules, there is still a certain market demand in
the market of Southeast Asia, India, etc.; in order to reduce production costs, the Company optimized and
upgraded the polycrystalline production line in the fourth quarter of 2020 to extend the life cycle of
polycrystalline products and scrap the dismounted equipment; the original book value of the scrapped
assets was 201,261,800 yuan, the book value was 68,568,500 yuan, and the net loss after deducting the
estimated residual value was 60,521,800 yuan.
3) Tongwei Solar (Chengdu) Co., Ltd. lost 27,562,600 yuan from dismantling assets
With the development trend of large-size products in the market, after full demonstration, the original
small-size R&D equipment has no further R&D value, and the Company dismantled and scrapped the
equipment. At the same time, in order to extend the life cycle of the 156-size production line as much as
possible, the Company carried out technical innovation to the 156-size production line in the fourth quarter
of 2020, and part of the equipment was dismantled in the process. The original book value of the above
assets was RMB 46,827,300, the book value was RMB 29,382,600, and the net loss after deducting the
estimated residual value was RMB 27,562,600.
(5) Flood damage
On August 17, 2020, Leshan City was hit by serious flood, which caused the loss of RMB
428,187,300 of Sichuan Yongxiang Co., Ltd., Sichuan Yongxiang Polysilicon Co., Ltd., Sichuan
Yongxiang New Materials Co., Ltd., and Sichuan Yongxiang Silicon in Wutongqiao District, Leshan City.
After deducting insurance compensation of RMB 363,800,000, and net loss of RMB 64,387,300;
insurance compensation RMB 60 million and RMB 303.80 million was received on December 29, 2020
and February 7, 2021 respectively.
(6) The impact of the "bill pool" business on the Company's assets and liabilities
The Company's PV industry generally uses bill settlement. With the growth of business scale and the
development of the "bill pool" business, the Company uses unexpired bills as pledge to issue bills payable
for payment to suppliers, etc., so the bills receivable and payable increase significantly. At the end of 2020,
the balance of bills receivable (listed as financing receivables) and bills payable reached 9.712 billion yuan and 9.364 billion yuan, accounting for 15.12% and 28.63% of total assets and total liabilities respectively,

2020 Annual Report
234 / 246
and it has an impact of 8.38 percent points on the debt-to-asset ratio, see the following table for details
(amount unit: RMB 10,000): Item Number of consolidated
statements Influence number
Number of influence
deduction
Current assets 2,559,155.20 -936,391.47 1,622,763.74
Non-current assets 3,866,039.60 3,866,039.60
Total assets 6,425,194.81 -936,391.47 5,488,803.34
Current liabilities 2,238,052.39 -936,391.47 1,301,660.92
Non-current liabilities 1,032,747.78 1,032,747.78
Total liabilities 3,270,800.18 -936,391.47 2,334,408.71
Debt-to-asset ratio 50.91% 42.53%
In addition to the above matters, as of December 31, 2020, the Company does not need to explain other
important matters.
XVII. Notes to Major Items in Financial Statements of the Parent Company
1. Accounts receivable
(1). Disclosure by account receivable age
√Applicable □Inapplicable
Unit:Yuan Currency: RMB Account receivable age Book balance at the end of the period
Subtotal within one year 2,858,938.09
1-2 years 318,617.40
2-3 years
Over 3 years 888,421.96
Total 4,065,977.45
(2). Classified disclosure by bad debt provision
√Applicable □Inapplicable

2020 Annual Report
235 / 246
Unit:Yuan Currency: RMB
Category
Ending balance Beginning balance
Book balance Bad debt reserves
Book
value
Book balance Bad debt reserves
Book
value Amount Proportion
(%) Amount
Proportion
of
provision
(%)
Amount Proportion
(%) Amount
Proportion
of
provision
(%)
Provision for bad debt
reserve is made by
portfolio
4,065,977.45 100.00 1,063,230.60 26.15 3,002,746.85 14,385,814.78 100.00 2,566,995.33 17.84 11,818,819.45
Including:
Portfolio 4 4,065,977.45 100.00 1,063,230.60 26.15 3,002,746.85 14,385,814.78 100.00 2,566,995.33 17.84 11,818,819.45
Total 4,065,977.45 / 1,063,230.60 / 3,002,746.85 14,385,814.78 / 2,566,995.33 / 11,818,819.45
Provision for bad debt reserves is made individually:
□Applicable √Inapplicable
Provision for bad debt reserves is made by portfolio:
□Applicable √Inapplicable
If the provision for bad debt reserves is made according to the general model of expected credit loss, please refer to the disclosure of other accounts receivable:
□Applicable √Inapplicable

2020 Annual Report
236 / 246
(3). About provision for bad debt
√Applicable □Inapplicable
Unit:Yuan Currency: RMB
Category Beginning
balance
Change amount in the current period
Ending balance Provision
Accounts
recovered
or
transferred
back
Amounts
written off or
charged off
Other changes
Provision for bad debt
of accounts receivable
2,566,995.33 -183,613.01 608,053.08 -712,098.64 1,063,230.60
Total 2,566,995.33 -183,613.01 608,053.08 -712,098.64 1,063,230.60
Note: other changes are caused by the transfer of Tongwei Co., Ltd. Maoming Branch to
Maoming Tongwei Biological Technology Co., Ltd.
Among them, the amount of bad debt provision recovery or reversal of the current period is
important:
□Applicable √Inapplicable
(4). Accounts receivable actually written off in the current period
√Applicable □Inapplicable
Unit:Yuan Currency: RMB
Item Amount written off
Account receivable actually written off 608,053.08
About important accounts receivable written off among above accounts receivable
√Applicable □Inapplicable
Unit:Yuan Currency: RMB
Company
name
Nature of
accounts
receivable
Amount
written off Reasons for written off
The written off
procedure
performed
Is the payment
caused by related
party transaction
Client 1 Payment for
goods
477,396.68 Expected to be unable to
recover the payment
Approval by
authority
No
Client 2 Payment for
goods
46,789.61 Expected to be unable to
recover the payment
Approval by
authority
No
Client 3 Payment for
goods
83,866.79 Expected to be unable to
recover the payment
Approval by
authority
No
Total / 608,053.08 / / /
Explanation for accounts receivable written off:
□Applicable √Inapplicable
(5). About accounts receivable with top five ending balance collected as per the borrowers
√Applicable □Inapplicable
In the current period, accounts receivable with top five ending balance collected of the
Company as per the borrowers is RMB 2,202,706.42, accounting for 54.17% of the total ending
balance of accounts receivable, and the sum total of ending balance of provision for bad debt
reserves made accordingly is RMB 755,576.96.
(6). Accounts receivable derecognized due to transfer of financial assets
□Applicable √Inapplicable

2020 Annual Report
237 / 246
(7). Assets and liabilities formed by the transfer of accounts receivable and continuous
involvement
□Applicable √Inapplicable
Other notes:
□Applicable √Inapplicable
2. Other payables
Item presentation
√Applicable □Inapplicable
Unit:Yuan Currency:RMB
Item Ending balance Beginning balance
Interest receivable
Dividend receivable 1,371,854.15
Other payables 12,569,916,260.88 12,953,093,766.22
Total 12,569,916,260.88 12,954,465,620.37
Other notes:
□Applicable √Inapplicable
Interest receivable
(1). Classification of interest receivable
□Applicable √Inapplicable
(2). Important overdue interest
□Applicable √Inapplicable
(3). About provision for bad debt
□Applicable √Inapplicable
Other notes:
□Applicable √Inapplicable
Dividend receivable
(4). Dividend receivable
√Applicable □Inapplicable
Unit:Yuan Currency:RMB
Project (or invested unit) Ending balance Beginning balance
Sichuan Tongwei Sanlian Aquatic
Products Co., Ltd.
1,371,854.15
Total 1,371,854.15
(5). Significant dividends receivable with account receivable age over one year
□Applicable √Inapplicable
(6). About provision for bad debt
□Applicable √Inapplicable
Other notes:

2020 Annual Report
238 / 246
□Applicable √Inapplicable
Other payables
(1). Disclosure by account receivable age
√Applicable □Inapplicable
Unit:Yuan Currency:RMB
Account receivable age Book balance at the end of the period
Subtotal within one year 13,093,380,477.87
1-2 years 1,418,853.43
2-3 years 2,414,551.04
Over 3 years 2,889,653.50
Total 13,100,103,535.84
(2). About classification by payment nature
√Applicable □Inapplicable
Unit:Yuan Currency:RMB
Payment nature Book balance at the end of the
period
Book balance at the beginning of
the period
Transaction with affiliated parties 13,087,118,075.50 13,280,568,481.17
Assets disposal amount 115,929,359.00
Deposit 4,844,381.00 32,372,761.49
Others 8,141,079.34 6,163,656.97
Total 13,100,103,535.84 13,435,034,258.63
(3). About provision for bad debt
√Applicable □Inapplicable
Unit:Yuan Currency: RMB
Bad debt reserves
Stage 1 Stage 2 Stage 3
Total Expected credit
loss in the
future 12
months
Expected credit
loss within
whole duration
(no credit
impairment occur)
Expected credit loss
within whole
duration (credit
impairment has occurred)
Balance on January 1, 2020 481,940,492.41 481,940,492.41
The balance on January 1, 2020
is in the current period
--Be transferred to Stage 2
-- Be transferred to Stage 3 -7,524,313.83 7,524,313.83
--Be transferred back to Stage 2
--Be transferred back to Stage 1
Provision in the current period 57,273,211.73 57,273,211.73
Amount transferred back in the
current period
Charged off in the current
period
Written off in the current period -7,524,313.83 -7,524,313.83
Other changes -1,502,115.35 -1,502,115.35
20Balance on January 1, 2020 530,187,274.96 530,187,274.96
Explanation of significant changes in the book balance of other accounts receivable changed due to
loss reserves in the current period:
□Applicable √Inapplicable

2020 Annual Report
239 / 246
The provision amount of bad debt reserves in the current period and the basis for assessing
whether the credit risk of financial instruments has increased significantly:
□Applicable √Inapplicable
(4). About provision for bad debt
√Applicable □Inapplicable
Unit:Yuan Currency: RMB
Category Beginning
balance
Change amount in the current period
Ending balance Provision
Accounts
recovered
or
transferred
back
Amounts
written off
or charged
off
Other changes
Other
payables
481,940,492.41 57,273,211.73
7,524,313.83
-1,502,115.35 530,187,274.96
Total 481,940,492.41 57,273,211.73 7,524,313.83 -1,502,115.35 530,187,274.96
Significant bad debt reserves recovered or reversed among above accounts receivable:
□Applicable √Inapplicable
(5). About other accounts receivable actually written off in the current period
□Applicable √Inapplicable
(6). About other accounts receivable with top five ending balance collected as per the
borrowers
√Applicable □Inapplicable
Unit:Yuan Currency:RMB
Company name Nature of
payment Ending balance
Account
receivable
age
Proportion in
total ending
balance of other
accounts
receivable (%)
Ending
balance of
bad debt
reserves
Sichuan Yongxiang
New Energy Co., Ltd.
Related
transactions 1,917,612,141.53
Within
one year 14.64
Inner Mongolia
Tongwei High-purity
Crystalline Silicon
Co., Ltd.
Related
transactions 1,647,993,872.59
Within
one year 12.58
Sichuan Yongxiang
Co., Ltd.
Related
transactions 954,418,433.48
Within
one year 7.29
Sichuan Yongxiang
Polysilicon Co., Ltd.
Related
transactions 871,930,242.89
Within
one year 6.66
Tongwei Solar (Hefei)
Co., Ltd.
Related
transactions 680,992,877.29
Within
one year 5.20
Total / 6,072,947,567.78 / 46.37
(7). Account receivable involving government subsidies
□Applicable √Inapplicable
(8). Other accounts receivable derecognized due to transfer of financial assets
□Applicable √Inapplicable
(9). Assets and liabilities formed by other receivables transfer and continuous involvement
□Applicable √Inapplicable
Other notes:

2020 Annual Report
240 / 246
□Applicable √Inapplicable
3. Long-term equity investments
√Applicable □Inapplicable
Unit:Yuan Currency:RMB
Item
Ending balance Beginning balance
Book balance Impairment
reserves Book value Book balance
Impairment
reserves Book value
Investment in
subsidiaries
13,629,952,348.59 19,271,456.80 13,610,680,891.79 10,990,038,707.01 169,201,456.80 10,820,837,250.21
Investment in
joint ventures
and associates
225,720,367.11 225,720,367.11 128,754,898.97 128,754,898.97
Total 13,855,672,715.70 19,271,456.80 13,836,401,258.90 11,118,793,605.98 169,201,456.80 10,949,592,149.18
(1). Investment in subsidiaries
√Applicable □Inapplicable
Unit:Yuan Currency:RMB
Invested entity Beginning balance Increase in the
current period
Decrease in the
current period Ending balance
Provision
for
impairment
provided in
the current
period
Ending
balance of
impairment
reserves
Sichuan Yongxiang Co.,
Ltd.
2,372,199,373.39 1,731,500,000.00 4,103,699,373.39
Tongwei Solar (Hefei)
Co., Ltd.
2,884,624,940.43 2,884,624,940.43
Tongwei New Energy
Co., Ltd.
2,531,478,640.76 1,524,433,300.00 4,055,911,940.76
Chongqing Tongwei
Feed Co., Ltd.
23,074,213.76 23,074,213.76
Chengdu Tongwei
Animal Nutrition
Technology Co., Ltd.
11,605,910.79 11,605,910.79
Nanning Tongwei Feed
Co., Ltd.
28,978,368.63 28,978,368.63
Chengdu Tongwei
Aquatic Products
Technology Co., Ltd.
9,245,867.39 9,245,867.39
Chengdu Tongwei
Sanxin Pharmaceutical
Co. Ltd.
7,000,000.00 7,000,000.00
Chengdu Tongwei Fish
Co., Ltd.
18,889,244.77 18,889,244.77
Chengdu Ronglai
Tongwei Feed Co., Ltd.
16,000,000.00 16,000,000.00
Tongwei (Chengdu)
Aquatic Food Co., Ltd.
183,000,000.00 183,000,000.00
Chengdu Xintaifeng
Agricultural
Development Co., Ltd.
197,000,000.00 197,000,000.00
Tongwei (Chengdu)
Agriculture Investment
Holding Co., Ltd.
50,000,000.00 50,000,000.00
Sichuan Tongguang
Construction
Engineering Co., Ltd.
20,000,000.00 20,000,000.00
Tongwei Agricultural
Financing Guarantee
Co., Ltd.
100,000,000.00 100,000,000.00

2020 Annual Report
241 / 246
Panzhihua Tongwei
Feed Co., Ltd.
20,000,000.00 20,000,000.00
Tongwei Aquatic
Products Co., Ltd.
56,000,000.00 22,000,000.00 78,000,000.00
Chongqing Changshou
Tongwei Feed Co., Ltd.
30,000,000.00 30,000,000.00
Qianxi Tongwei Feed
Co., Ltd.
30,000,000.00 30,000,000.00
Chengdu Tongwei
Automation Equipment
Co., Ltd.
1,874,054.14 10,229,800.00 12,103,854.14
Kunming Tongwei Feed
Co., Ltd.
20,000,000.00 20,000,000.00
Tongwei (Chengdu)
Salmon Co., Ltd.
52,275,000.00 52,275,000.00
Shandong Tongwei Feed
Co., Ltd.
703,760.04 703,760.04
Suzhou Tongwei Special
Feed Co., Ltd.
26,138,780.12 26,138,780.12
Xiamen Tongwei Feed
Co., Ltd.
13,752,585.43 13,752,585.43
Zaozhuang Tongwei
Feed Co., Ltd.
18,987,038.58 18,987,038.58
Huai'an Tongwei Feed
Co., Ltd.
10,599,481.76 10,599,481.76
Yangzhou Tongwei
Feed Co., Ltd.
20,000,000.00 20,000,000.00
Lianyungang Tongwei
Feed Co., Ltd.
80,000,000.00 80,000,000.00
Zibo Tongwei Food Co.,
Ltd.
3,800,000.00 3,800,000.00
Nantong Bada Feed Co.,
Ltd.
57,372,600.00 57,372,600.00
Tongwei (Dafeng) Feed
Co., Ltd.
49,900,133.00 49,900,133.00
Zibo Tongwei Food Co.,
Ltd.
50,000,000.00 50,000,000.00 12,420,000.00
Shashi Tongwei Feed
Co., Ltd.
21,851,065.30 21,851,065.30
Yuanjiang Tongwei
Feed Co., Ltd.
70,858,072.03 70,858,072.03
He'nan Tongwei Feed
Co., Ltd.
6,518,994.97 6,518,994.97
Guangdong Tongwei
Feed Co., Ltd.
59,994,628.41 59,994,628.41
Wuhan Tongwei Feed
Co., Ltd.
16,479,438.23 16,479,438.23
Jieyang Tongwei Feed
Co., Ltd.
50,000,000.00 50,000,000.00
Tongwei (Hainan)
Aquatic Products Co.,
Ltd.
201,859,769.84 201,859,769.84
Hainan Haiyi Aquatic
Products Feed Co., Ltd.
85,711,797.01 85,711,797.01
Foshan Nanhai Tongwei
Aquatic Products
Technology Co., Ltd.
10,000,000.00 10,000,000.00 3,940,000.00
Foshan Tongwei Feed
Co., Ltd.
30,095,100.00 30,095,100.00
Foshan Gaoming
Tongwei Feed Co., Ltd.
100,000,000.00 100,000,000.00
Tianmen Tongwei
Biotechnology Co., Ltd.
15,000,000.00 15,000,000.00
Binyang Tongwei Feed
Co., Ltd.
20,000,000.00 20,000,000.00

2020 Annual Report
242 / 246
Fuzhou Tongwei
Willianm Feed Co., Ltd.
32,500,000.00 32,500,000.00
Changchun Tongwei
Feed Co., Ltd.
10,585,208.09 10,585,208.09
Tianjin Tongwei Feed
Co., Ltd.
14,700,000.00 14,700,000.00
Langfang Tongwei Feed
Co., Ltd.
15,000,000.00 15,000,000.00
Ningxia Yinchuan
Tongwei Feed Co., Ltd.
30,000,000.00 30,000,000.00
Harbin Tongwei Feed
Co., Ltd.
20,000,000.00 20,000,000.00
Nanjing Tongwei
Aquatic Products
Technology Co., Ltd.
10,000,000.00 10,000,000.00
Zhuhai Haiyi Aquatic
Products Feed Co., Ltd.
31,897,204.89 31,897,204.89
Hainan Haiyi Aquatic
Seed Co., Ltd.
20,763,456.80 20,763,456.80 2,911,456.80
Tongwei Holding Pte.
Ltd.
61,605,594.60 61,605,594.60
Tongwei Industrial
(Tibet) Co., Ltd.
100,000,000.00 100,000,000.00
Chizhou Tongwei Feed
Co., Ltd.
50,000,000.00 50,000,000.00
Honghu Tongwei Feed
Co., Ltd.
90,164,469.77 90,164,469.77
Chengdu Tongwei
Aquatic Seed Co., Ltd.
5,000,000.00 5,000,000.00
Hengshui Tongwei Feed
Co., Ltd.
5,000,000.00 5,000,000.00
Qingyuan Tongwei Feed
Co., Ltd.
5,000,000.00 5,000,000.00
Hainan Haiyi
Biotechnology Co., Ltd.
1,226,165.52 1,226,165.52
Sichuan Tongwei Food
Co., Ltd.
3,500,000.00 44,500,000.00 48,000,000.00
Hanshou Tongwei Feed
Co., Ltd.
27,900,000.00 27,900,000.00
Tianmen Tongwei
Aquatic Products
Technology Co., Ltd.
25,939,300.00 25,939,300.00
Sichuan Fishery-PV
Wulian Technology Co.,
Ltd.
1,200,000.00 1,200,000.00
Sichuan Willtest
Technology Co., Ltd.
20,551,100.00 343,861.76 20,894,961.76
Wuxi Tongwei
Biotechnology Co., Ltd.
150,007,603.05 150,007,603.05
Zhejiang Tongwei Solar
Co., Ltd.
8,000,000.00 8,000,000.00
Tongwei New Energy
Engineering Design
(Sichuan) Co., Ltd.
4,300,000.00 4,300,000.00
Sichuan Tongwei
Sanlian Aquatic
Products Co., Ltd.
15,000,000.00 15,000,000.00
Sichuan Tongwei Feed
Co., Ltd.
100,000,000.00 100,000,000.00
Qingdao Hairen Aquatic
Seed Industry
Technology Co., Ltd.
40,800,000.00 40,800,000.00
Sichuan Yongxiang
New Material Co., Ltd.
83,053,975.00 83,053,975.00

2020 Annual Report
243 / 246
Chengdu Tongwei
Quannonghui Electronic
Commerce Co., Ltd.
5,000,000.00 5,000,000.00
Nanchang Tongwei
Biotechnology Co., Ltd.
96,000,000.00 96,000,000.00
Yangjiang Haiyi
Biotechnology Co., Ltd.
50,000,000.00 50,000,000.00
Gongan County
Tongwei Aquatic
Products Technology
Co., Ltd.
5,000,000.00 5,000,000.00
Chengdu Xintaifeng
Livestock and Poultry
Farming Co., Ltd.
53,800,000.00 53,800,000.00
Chengdu Chunyuan
Food Co., Ltd
97,764,129.77 97,764,129.77
Sichuan Chunyuan
Ecological Breeding
Co., Ltd.
15,146,640.74 15,146,640.74
Zhanjiang Haixianfeng
Bio-tech Co., Ltd.
765,000.00 765,000.00
Nanning Tongwei
Biotechnology Co., Ltd.
50,000,000.00 50,000,000.00
Maoming Tongwei
Biotechnology Co., Ltd.
40,000,000.00 40,000,000.00
Total 10,990,038,707.01 3,423,006,961.76 783,093,320.18 13,629,952,348.59 19,271,456.80
1) Due to the business development, the Company increased capital to Sichuan Yongxiang Co.,
Ltd., Tongwei New Energy Co., Ltd., Tongwei Aquatic Products Co., Ltd., Chengdu Tongwei
Automation Equipment Co., Ltd., Nanjing Tongwei Biotechnology Co., Ltd. and Sichuan Tongwei
Food Co., Ltd. in 2020.
2) In September 2020, the Company acquired 1.36% of its equity held by minority shareholders
of Sichuan Willtest Technology Co., Ltd. with RMB 343,861.76 After the acquisition, the
Company's equity ratio in Sichuan Willtest Technology Co., Ltd. was increased from 81.68% to
83.04%.
3) In 2020, the Company invested in the establishment of Maoming Tongwei Biotechnology
Co., Ltd.
4) In 2020, the held shares of the Company from Chengdu Tongwei Fish Co., Ltd., Tongwei
(Chengdu) Aquatic Food Co., Ltd., Chengdu Xintaifeng Agricultural Development Co., Ltd.,
Tongwei Aquatic Products Co., Ltd., Tongwei (Chengdu) Salmon Co., Ltd., Sichuan Tongwei
Sanlian Aquatic Products Co., Ltd., Chengdu Tongwei Quannonghui E-commerce Co., Ltd. and
Chengdu Chunyuan Food Co., Ltd. were transferred the Sichuan Tongwei Food Co., Ltd., becoming
the second-level subsidiaries of the Company.
5) Tongwei (Chengdu) Agricultural Investment Holding Co., Ltd., Suzhou Tongwei Special
Feed Co., Ltd., Hainan Haiyi Biotechnology Co., Ltd., Gong'an County Tongwei Aquatic Products
Technology Co., Ltd. and Chengdu Xintaifeng Livestock and Poultry Farming Co., Ltd. were
cancelled in 2020.
(2). Investment in joint ventures and associates
√Applicable □Inapplicable
Unit:Yuan Currency: RMB
Investment unit Beginning balance
Increase / decrease in the current period
Ending balance
Ending
balance of
impairment
reserves
Additional
investment
Reduced
investment
Investment profit or
loss recognized
under equity method
Adjustments
in other
comprehensi
ve income
Other equity
changes
Cash dividend
or profit
declared to
distribute
Provision for
impairment
reserves
Others

2020 Annual Report
244 / 246
I. Joint Ventures
Shaoxing Tongwei Jiuding
Feed Co., Ltd. 5,363,465.90 374,442.93 5,737,908.83
Hefei Tongwei Jiuding Feed
Co., Ltd. 5,570,133.37 -341,236.30 5,228,897.07
Maoming Tongwei Jiuding
Feed Co., Ltd. 9,083,496.02 674,274.34 9,757,770.36
Huangmei Tongwei Jiuding
Feed Co., Ltd. 4,105,011.98 -390,230.55 3,714,781.43
BioMar Tongwei (Wuxi)
Biotech Co., Ltd. 104,632,791.70 -3,407,482.28 101,225,309.42
Subtotal 128,754,898.97 -3,090,231.86 125,664,667.11
II. Affiliated Business
Bohai Aquatic Products Co.,
Ltd. 100,055,700.00 100,055,700.00
Subtotal 100,055,700.00 100,055,700.00
Total 128,754,898.97 100,055,700.00 -3,090,231.86 225,720,367.11
Other notes:
There are no significant restrictions on the realization of the Company's investment and the
remittance of investment income.
4. Operating revenue and operating cost
(1). Operating revenue and operating cost
√Applicable □Inapplicable
Unit:Yuan Currency:RMB
Item Amount in the current period Amount in the previous period
Income Cost Income Cost
Major business 4,074,241,307.34 3,607,501,899.05 3,929,030,419.81 3,434,789,856.41
Other business 118,253,970.35 29,896,596.70 678,970,624.42 634,615,941.56
Total 4,192,495,277.69 3,637,398,495.75 4,608,001,044.23 4,069,405,797.97
(2). About income generated by the contract
□Applicable √Inapplicable
(3). Explanation of performance obligations
□Applicable √Inapplicable
(4). Explanation of allocation to remaining performance obligations
□Applicable √Inapplicable
5. Investment income
√Applicable □Inapplicable
Unit:Yuan Currency:RMB
Item Amount in the current
period
Amount in the
previous period
Long-term equity investment income calculated by cost
method
4,058,240,234.33 1,481,568,295.32
Investment income of long-term equity investments
measured under equity method
-3,090,231.86 6,605,886.65
Investment income from disposal of long-term equity
investments
-360,357,041.95 715,348.63
Investment income of trading financial assets during the
holding period
Dividend income from other equity instrument investments
during the holding period
Interest income from debt investments during the holding
period

2020 Annual Report
245 / 246
Interest income from other debt investments during the
holding period
Investment income from disposal of trading financial assets
Investment income from the disposal of other equity
instrument investments
Investment income from disposal of debt investment
Investment income from the disposal of other debt
investments
Investment income from purchasing bank wealth
management products
1,298,783.09 1,180,005.16
Total 3,696,091,743.61 1,490,069,535.76
6. Others
√Applicable □Inapplicable
The Company transfers the funds of subsidiaries in a unified way. The fund transactions
between the parent and the subsidiaries are reported as fund-raising activities under the "cash
received from other fund-raising activities" or "cash paid from other fund-raising activities" of the
"cash flow statement of the parent company" based on the net quarterly income and expenditure.
XVIII. Supplementary information
1. List of non-recurring profit or loss of the current period
√Applicable □Inapplicable
Unit:Yuan Currency:RMB
Item Amount Notes
Profit and loss of disposal on non-current liability 1,541,869,733.03
Government subsidies included in the current profit and loss (exclusive of those
which are closely related with the enterprise business or granted according to
national standard fixed rate or quantity)
296,657,874.92
In addition to the effective hedging business related to the normal business
operations of the Company, the fair value gains and losses arising from holding
transactional financial assets, derivative financial assets, transactional financial
liabilities, and derivative financial liabilities, as well as the investment income
from the disposal of transactional financial assets, derivative financial from
assets, transactional financial liabilities, derivative financial liabilities and other
debt investments;
14,385,110.27
Other non-operating income and expenses other than the above items -439,396,332.17
Amount of influence of income tax -209,491,363.52
Amount of influence of minority shareholders' equity -4,655,892.34
Total 1,199,369,130.19
Explain the reasons if the Company defines an item as a non-recurring profit and loss according to
the Explanatory Announcement No. 1 on Information Disclosure for Companies Offering Securities
to the Public—Non-Recurring Profit or Loss, or defines a non-recurring profit or loss listed in the
Explanatory Announcement No. 1 on Information Disclosure for Companies Offering Securities to
the Public—Non-Recurring Profit or Loss as a recurring one.
□Applicable √Inapplicable
2. Return on equity and earnings per share
√Applicable □Inapplicable
Profit for the reporting period Earnings per share

2020 Annual Report
246 / 246
Weighted average
return on equity (%)
Basic earnings
per share
Diluted
earnings per
share
Net profit attributable to common
shareholders of the Company 16.13 0.8581 0.8466
Net profit net of non-recurring profit
or loss attributable to common
shareholders of the Company
10.77 0.5729 0.5680
3. Differences of accounting data under domestic and foreign accounting standards
□Applicable √Inapplicable
4. Others
□Applicable √Inapplicable
Section XII List of Documents Available for Inspection
List of Documents
Available for Inspection
Financial statements signed and sealed by the person in charge of the
Company, the person in charge of accounting work and the person in
charge of the accounting firm (accountant in charge).
List of Documents
Available for Inspection
The original copy of Audit Report sealed by the accounting firm and
sealed and signed by certified public accountants.
List of Documents
Available for Inspection
Originals of all documents and announcements which have been publicly
disclosed on the website specified by CSRC during the reporting period.
Chairman: Xie Yi
Submission date Approved by the Board of Directors: April 9, 2021
Amendment Information
□Applicable √Inapplicable


![· 2019-01-21 · Aung Gyi Group of Co.,Ltd. Aung Htet Myat Co.,Ltd. [Yangon Tyre] Aung Kyaw Si [Aung Kaung San Trading Co.,Ltd.] Aung Setkyar Co.,Ltd. Aung Thein Than Co.,Ltd. Aunty](https://img.dokumen.tips/doc/110x75/5eaf00e2d37db9724c701887/2019-01-21-aung-gyi-group-of-coltd-aung-htet-myat-coltd-yangon-tyre-aung.jpg)