Embed Size (px)
Citation preview

SPARX Group Co., Ltd.
SPARX Group Co., Ltd.SPARX Group Co., Ltd. Consolidated Financial Results for Consolidated Financial Results for the the 3rd3rd Qtr of the Qtr of the FY20FY201010 (April, 20(April, 201010 –– March, 201March, 20111) )
FebruaryFebruary 1717, 201, 20111
© 2011 SPARX Group Co.,Ltd.
2
Financial Results Financial Results forfor the the 3rd3rd Qtr of the FY2010 & Qtr of the FY2010 & Future Future PlansPlans

© 2011 SPARX Group Co.,Ltd.
3
Executive Summary
Achievements: While the business showed its stable recovery, it could not offset the goodwill amortization and loss due to impairment.
• Base earnings returned to profitability. AUM clearly is heading for recovery. • Performance fee showed the significant increase, comparing to the previous quarter. The fund performance of
SAM/Cosmo/PMA is strong. - The operating profit before goodwill amortization (3Qtr, accumulated total) is 0.56B JPY.
• The operating profit shows negative figure, because the goodwill-amortization of PMA and Cosmo can not be offset. - Goodwill amortization is 1.26B JPY and operating profit (accumulated total) is -0.69B JPY.
• In addition, the loss due to impairment of PMA’s goodwill (1.52B JPY) was posted and the deficit of net profit increased. - The net profit is -3.46B JPY and the accounting capital decreased to 14.12B JPY.
There are no specific problems on financial situation.
Future Plans: SPARX will accelerate the recovery of existing business and will make a big leap into new business as one group.
• Due to the good performance of funds and upturn of business environment, the recovery of existing business become apparent.
• Implementing the unification as one group and making a quantum leap by launching new investment strategies– Maintain and enhance the competitiveness of localized players and speed up the unification of marketing
and operation – Launch “One-Asia Long-Short investment strategy” and “One-Asia Long-Only investment strategy”– Expand “Environment & Green-Tech. investment strategy”

© 2011 SPARX Group Co.,Ltd.
4
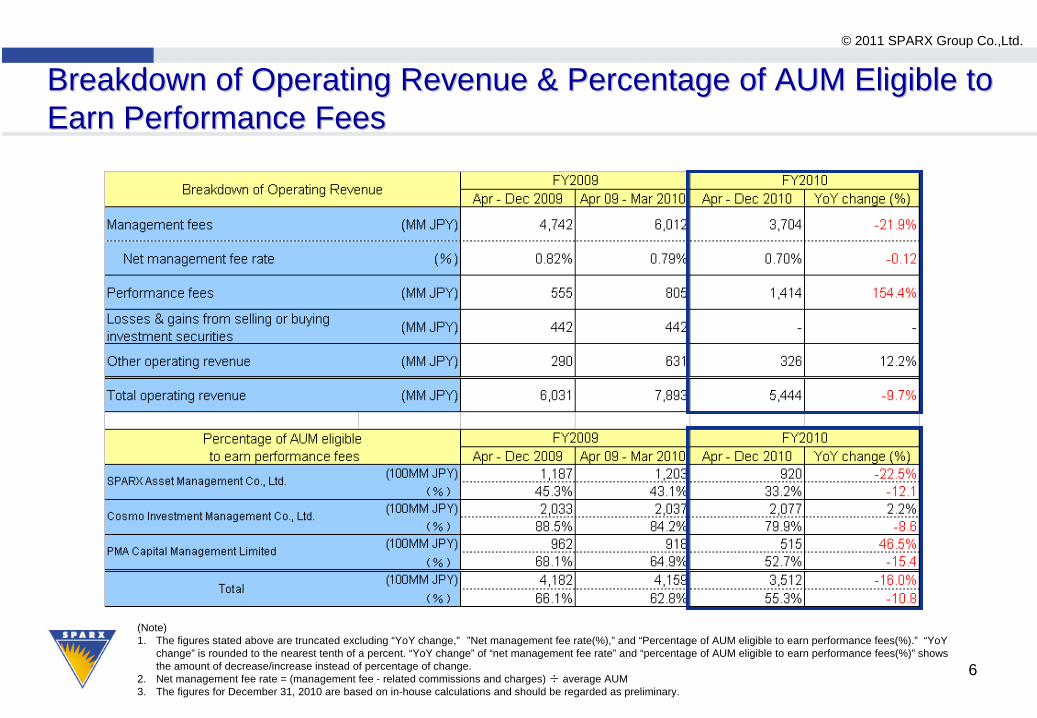
Operating Revenue: 5.44B JPY (YoY change: -9.7%)• The management fee is on a slow road to recovery. (3.70B JPY, YoY change: -21.9%)
– Average of AUM decreased by 7.6%. (613.0B JPY) and net management fee rate decreased. (0.70%)– AUM made a recovery to 664.4B JPY (Jan 31, 2011) and has increased by 16.8% since Aug 2010.
• Performance fee (1.41B JPY) increased significantly. (YoY change: 154.4%)– Maintained good performance and expect high level of realized performance fee based on the current
status toward HWM Operating and General Administrative Expenses: 61.4B JPY (YoY change: -6.9%)
• Ordinary expenses were reduced in line with the original schedule. (YoY change: -22.5%)• Bonuses (related to performance fee, etc.) and extraordinary factor (payment of severance
package to key members of overseas subsidiaries, etc.) caused an impermanent increase. • Goodwill amortization (1.26B JPY)
Operating Loss: -0.69B JPY (3rd Qtr of FY2010: -1.00B JPY)
Non-operating revenues (0.38B JPY)、Non-operating expenses (0.57B JPY)• Exchange loss had a significant impact.
Extraordinary profit (0.08B JPY)、Extraordinary loss (2.15B JPY)• The loss due to impairment on PMA’s goodwill (1.52B JPY) was posted.
Net Loss: -3.46B JPY (3rd Qtr of FY2010: -0.89B JPY)
Summary for 3rd Quarter (ProfitSummary for 3rd Quarter (Profit--andand--loss statement)loss statement)
(Note)Operating loss (before goodwill amortization) does not include “Losses & gains from selling or buying investment securities (3rd Qtr of FY2009: 0.44 B JPY, 3rd Qtr of FY2010: nil.)

© 2011 SPARX Group Co.,Ltd.
5
FY200FY20099 FY2010FY2010
Apr – Dec09
Full YearApr – Dec
10YoY
Change
Average AUM (100MM JPY) 6,633 6,527 6,130 -7.6%
Operating Revenue (MM JPY) 6,031 7,893 5,444 -9.7%Operating & General Administrative Expenses (MM JPY) 6,595 8,852 6,140 -6.9%
Operating Loss (MM JPY) -564 -959 -696 -
Recurring Loss (MM JPY) -190 -446 -889 -
Net Profit (MM JPY) 896 398 -3,469 -Number of Employees(as of the period-end) 203 203 176 -13.3%TOPIX(as of the period-end) 907.59 978.81 898.80 -1.0%
Financial HighlightsFinancial Highlights
(Note)1. The figures above, excluding “YoY change” are truncated. “YoY change” is rounded to the nearest tenth of a percent. 2. Number of employees (period-end) shows the figure that does not include the number of “board members”. 3. AUM figures cited above include those of Korean subsidiary (Cosmo Investment Management Co., Ltd.) and Hong Kong subsidiary (PMA Capital Management Limited). The
figures for December 31, 2010 are based on in-house calculations and should be regarded as preliminary.
© 2011 SPARX Group Co.,Ltd.
6
Breakdown of Operating Revenue & Percentage of AUM Eligible to Breakdown of Operating Revenue & Percentage of AUM Eligible to Earn Performance FeesEarn Performance Fees
(Note)1. The figures stated above are truncated excluding “YoY change,” ”Net management fee rate(%),” and “Percentage of AUM eligible to earn performance fees(%).” “YoY
change” is rounded to the nearest tenth of a percent. “YoY change” of “net management fee rate” and “percentage of AUM eligible to earn performance fees(%)” shows the amount of decrease/increase instead of percentage of change.
2. Net management fee rate = (management fee - related commissions and charges) ÷ average AUM3. The figures for December 31, 2010 are based on in-house calculations and should be regarded as preliminary.

© 2011 SPARX Group Co.,Ltd.
7
FY2009FY2009 FY2010FY2010
(Units: MM JPY) Category Apr.- Dec. 2009 Full Year Apr. – Dec. 2010 YoY change
Commissions paid Operating 720 960 563 -21.8%Personnel exp. General admin. 2,403 3,379 2,687 11.8%Entrusted fund admin. fees Operating 108 127 53 -51.2%Travel exp. General admin. 174 219 151 -13.2%Property rent General admin. 581 732 363 -37.6%Entrusted business expenses General admin. 488 646 289 -40.7%Depreciation on fixed assets General admin. 157 202 116 -26.2%Other expenses General admin. 838 1,062 651 -22.3%Amortization of goodwill General admin. 1,121 1,522 1,263 12.7%Total: Operating and general administrative expenses 6,595 8,852 6,140 -6.9%
Bonus 455MM JPY Bonus 970MM JPY
5.54B JPY
(FY2009)
(annualized)4.29B JPY
(FY2010)
Ordinary expenses
Details of Expenses Details of Expenses
(Note) 1. The figures above, excluding “YoY change”, are truncated. “YoY change” is rounded to the nearest tenth of a percent. 2. The “Personnel Expenses” data includes payments for temporary staff, etc. 3. As amortization of negative goodwill, 86MM JPY (3Q of FY2009) and 74MM JPY (3Q of FY2010) are posted in non-operating income. 4. Other expenses (3Q of FY2010) includes “Other expenses (Operating)” and “Other expenses (General admin.)”.
© 2011 SPARX Group Co.,Ltd.
8
Goodwill and amortization plan Goodwill and amortization plan
PMA:
2.77B JPY (as of the end of Dec 2010), amortization period (10 years)
– Approx. 0.51B JPY amortization per year (until FY2015) is expected.
Cosmo社:
3.84B JPY (as of the end of Dec 2010), amortization period (5 years)
– The schedule of amortization (until FY2015) is as follows. – FY2011/FY2012: approx. 1.03B JPY– FY2013: approx. 0.91B JPY– FY2014: approx. 0.52B JPY– FY2015: approx. 0.18B JPY
For the next three years, approx. 1.5B JPY (per year) will be expensed as goodwill amortization
(Note)1. The goodwill of Cosmo is the total of amortized amount of positive goodwill and negative goodwill. 2. By applying new accounting standard, a certain portion of goodwill caused by the additional acquisition is recognized in foreign currency. Therefore, the actual
amount will be influenced by the change of exchange rate. 3. Due to the introduction of IFRS, the goodwill might not be amortized on schedule.
© 2011 SPARX Group Co.,Ltd.
9
FY200FY20099 FY2010FY2010
(Full YearFull Year)) Apr – Dec 10(Annualized)
Average AUM (100 MM JPY) 6,527 6,130
Net management fee rate(After the deduction of commissions paid)
(%) 0.79 0.70Annualized net management fee revenue(After the deduction of commissions paid)
(MM JPY) 5,135 4,278
Annualized ordinary expenses (MM JPY) 5,543 4,296
Annualized “Base earnings”
(MM JPY) ▲408 ▲17
Consolidated Consolidated ““Base EarningsBase Earnings”” Net management fee revenue vs. annualized ordinary expense
(Note) 1. The figures above are truncated. As preliminary figures, the “Annualized net management fee revenue” is calculated by multiplying the “Net management fee rate”
and the “Average AUM” for the period. 2. The “Annualized ordinary expenses” is calculated by deducting (1) Commissions paid, (2) Bonuses (including allowance for bonuses), (3) Severances package for
key members of overseas subsidiaries and (4) Amortization of goodwill, from total operating and general administrative expenses.
© 2011 SPARX Group Co.,Ltd.
10
Movement of average AUM / net management fee revenue / ordinary expenses / base earnings (Quarterly basis)
Average AUM(Unit: MM JPY)
Net management fee revenue / Ordinary expense(Unit: MM JPY)
Net management fee revenue (Quarterly basis)
Ordinary expense (Quarterly basis)
Average AUM(Quarterly basis)
Base Earnings
“Base earnings (Quarterly basis) started to recover
20072Q
20074Q
20082Q
20084Q
20092Q
20094Q
20102Q(Unit: MM JPY)
(Note) 1. The figures above are truncated. As preliminary figures, the “Annualized net management fee revenue” is calculated by multiplying the “Net management fee rate and
the “Average AUM” for the period. 2. The “Annualized ordinary expenses” is calculated by deducting (1) Commissions paid, (2) Bonuses (including allowance for bonuses), (3) Severances package for
key members of overseas subsidiaries and (4) Amortization of goodwill, from total operating and general administrative expenses.
Average AUM
FY2010 2Q: 587.3B JPY3Q: 607.0B JPY
Base earnings
2010, Jul-Sep: +3MM JPY2010, Oct-Dec: +8MM JPY
AUM
2010, Mar: 661.8B JPY Sep: 589.3B JPYDec: 634.8B JPY
2011, Jan: 664.4B JPY

© 2011 SPARX Group Co.,Ltd.
11
Assets: 30.90B JPY (36.77B JPY: as of Mar 31, 2010)• Cash and cash equivalent: 12.85B JPY (15.27B JPY: as of Mar 31, 2010)• Investment securities (7.53B JPY): The significant portion is seed money to SPARX
funds.
Liabilities: 15.08B JPY (15.68B JPY: as of Mar 31, 2010)• Long-term borrowings due within 1yr (8.00B JPY)
– Repayment date (Jan 2011: 3.00B JPY, Nov 2011: 5.00B JPY) • Corporate bond (4.90B JPY, Maturity date: Sep 2012)
Net Assets: 15.82B JPY (21.08B JPY: as of Mar 31, 2010) • The amount (= accounting capital (14.12B JPY) – fixed assets, including goodwill
(6.62B JPY)) exceeds the required working capital significantly.
• Maintain the healthy Balance Sheet and liquidity
Summary for 3rd Quarter (Balance sheet)Summary for 3rd Quarter (Balance sheet)
Repaid on Jan 2011 as scheduled
• Maintain the sufficient liquidity for external liabilities • Operating cash-flow shows positive figure.

© 2011 SPARX Group Co.,Ltd.
12
(Units: MM JPY) Mar. Mar. 20201010 Dec. Dec. 20201010 YoY change
Current assets 19,090 16,121 -15.6%Cash and cash equivalents 15,270 12,852 -15.8%Securities 726 861 18.5%
Fixed assets 17,684 14,787 -16.4%Goodwill 7,623 6,622 -13.1%Investment securities 9,254 7,536 -18.6%
Total assetsTotal assets 36,774 30,908 -16.0%
Long-term borrowings due within 1yr 3,000 8,000 166.7%Corporate bond 5,000 4,900 -2.0%Long-term borrowings 5,000 - -100.0%
Total liabilitiesTotal liabilities 15,689 15,080 -3.9%
Common stock, Add. Paid in Capital 26,696 26,728 0.1%Retained earnings -3,868 -7,329 -Common stock in treasure at cost -4,438 -4,438 -Minority interests 2,715 1,600 -41.1%
Total Net AssetsTotal Net Assets 21,084 15,827 -24.9%
Balance sheet summary
(Note)1. The figures above, excluding “YoY change”, are truncated. “YoY change” is rounded to the nearest tenth of a percent. 2 The investment securities includes the seed money of SPARX Group funds.

© 2011 SPARX Group Co.,Ltd.
13
Movement of management fee / performance fee / other revenue (quarterly basis)
Expansion of “New Business” and Acceleration of “Recovery of Existing Business” as One Group
(Unit: MM JPY)
Expansion of New Business- SPARX’s unique products (One-Asia equity investment strategy, etc.)
•Acceleration of “Recovery of Existing Business”-Enhancement of marketing activity as one group (Recovery of AUM)-Maintain competitive performance
-Increase of performance fee -Recovery of AUM
-Good condition of equity market supports the recovery
(Note) The above-mentioned chart does not include the “Losses & gains from selling or buying investment securities”.
1
2
FY2009 3Q FY2010 3QManagement fee
Performance fee
(YoY change: 154.4% increase)
© 2011 SPARX Group Co.,Ltd.
14
SAM StatusSAM Status
”Made a clear recovery of Japanese business”– Improved the performance of Japanese equity investments
– Improved the three-years performance record of all investment strategies
– Major funds’ NAVs have come close to HWM– “Rising Sun” received the Morningstar 2010 Outstanding Performance
Award of Japan Equity Fund two years in a row. – “Hennessy Select SPARX Japan Smaller Companies Fund” received
2010 Best Japan Equity Fund Award at WSJ’s Quarterly Fund Analysis – Achieved positive figure of flow of funds (net basis)
– Significant size subscription from overseas clients (High recognition toward the capability of Japanese equity investment and the capability of product development (“Smart Grid”))
– Launched “SPARX Haitong Greater China Fund” (approx. 5.3B JPY as of the end of Jan 2011)
1

© 2011 SPARX Group Co.,Ltd.
15
Case study: Case study: ““Rising SunRising Sun””
received the Morningstar 2010 Outstanding received the Morningstar 2010 Outstanding
Performance Award of Japan Equity Fund two years in a row. Performance Award of Japan Equity Fund two years in a row.
SPARX Japan Small Cap Fund (or “Rising Sun”) Morningstar 2010 Outstanding Performance Award of Japan Equity Fund
(Note)The selection of Morningstar Award “Fund of the Year 2010” is based on the past data and does not grantee the future performance. Also, the evaluation was made on the data that Morningstar identified reliable and, however, the preciseness and completeness are not guaranteed. The copyright, intellectual ownership and other rights belong to Morningstar,Inc. and can not be duplicated and reprinted without any approvals.The Morningstar, Inc. selected and recognized the fund outstanding totally, from Japanese equity mutual funds (657 mutual funds) , based on the original quantitative analysis and qualitative analysis. The universe of Japanese equity mutual funds section consists of 657 mutual funds that have over 1 year track records.
Source: Morningstar Award Fund of The Year 2010 (February 1, 2011)
© 2011 SPARX Group Co.,Ltd.
16
0
1,000
2,000
3,000
4,000
5,000
6,000
7,000
8,000
-1,200
-1,000
-800
-600
-400
-200
0
200
400
600
2008/1Q2008/2Q2008/3Q2008/4Q2009/1Q2009/2Q2009/3Q2009/4Q2010/1Q2010/2Q2010/3Q
-1,200
-1,000
-800
-600
-400
-200
0
200
400
600
Net Subscription Redemption
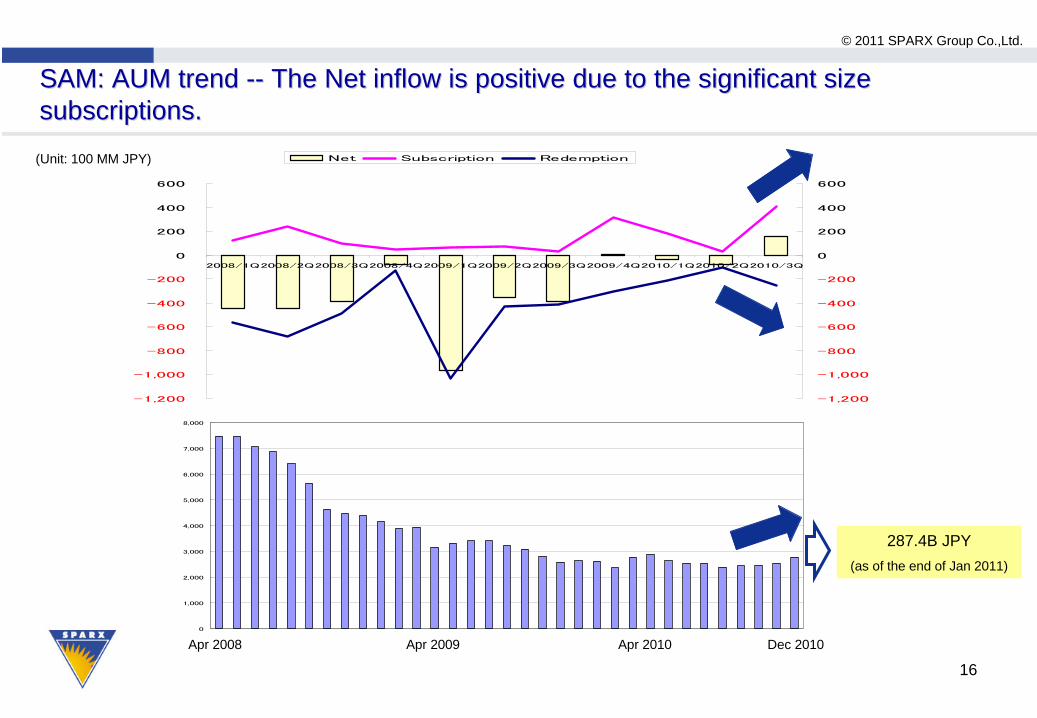
SAM: AUM trend SAM: AUM trend ---- The Net inflow is positive due to the significant size The Net inflow is positive due to the significant size subscriptions. subscriptions.
(Unit: 100 MM JPY)
Apr 2009Apr 2008 Apr 2010
287.4B JPY(as of the end of Jan 2011)
Dec 2010

© 2011 SPARX Group Co.,Ltd.
17
CosmoCosmo StatusStatus1
“Sustained good performance in AUM, investment activities and corporate financials”
– New record for high AUM value– While the change of management team caused several redemptions from overseas clients, several
subscriptions from large-sized Korean domestic institutional investors occurred. – The AUM (3.6 trillion KRW, as of the end of Dec 2010): 24.1% increase (YoY change), 3.8 trillion
KRW (as of the end of Jan 2011)– Achieved good investment performance continuously
– The latest 1 year performance of Cosmo (AUM weighted average) exceeds 4.9% KOSPI index. – The performance fee of Cosmo (Apr – Dec 2010) is 12.5B KRW. (approx. 200% increase: YoY
change)– Accomplished good business performance
– Cosmo’s net income increased by approx. 35% (YoY change) although bonuses (related to performance fee, etc.) and extraordinary factor (payment of severance package to key members, etc.) occurred.
• For subscriptions from overseas clients, Cosmo plans to launch new off-shore funds and to enhance its marketing capability as one group. Also, the process of collaboration with Korean domestic banks will be accelerated.
• Developed the organization for mutual fund business

© 2011 SPARX Group Co.,Ltd.
18
-15,000
-10,000
-5,000
0
5,000
10,000
15,000
2008/1Q 2008/2Q 2008/3Q 2008/4Q 2009/1Q 2009/2Q 2009/3Q 2009/4Q 2010/1Q 2010/2Q 2010/3Q
Net Subscription Redemption
Cosmo(KRWCosmo(KRW)): Cosmo achieved a new record in AUM. : Cosmo achieved a new record in AUM. (Unit: 100 MM KRW)
Apr 2009Apr 2008 Apr 2010
As of Jan 2011
3,852.8B KRW(+23.2%)
281.5B JPY(-13.6%)
0
5,000
10,000
15,000
20,000
25,000
30,000
35,000
40,000億
Dec 2010
As of Apr 2008
3,127.0B KRW
325.9B JPY
© 2011 SPARX Group Co.,Ltd.
19
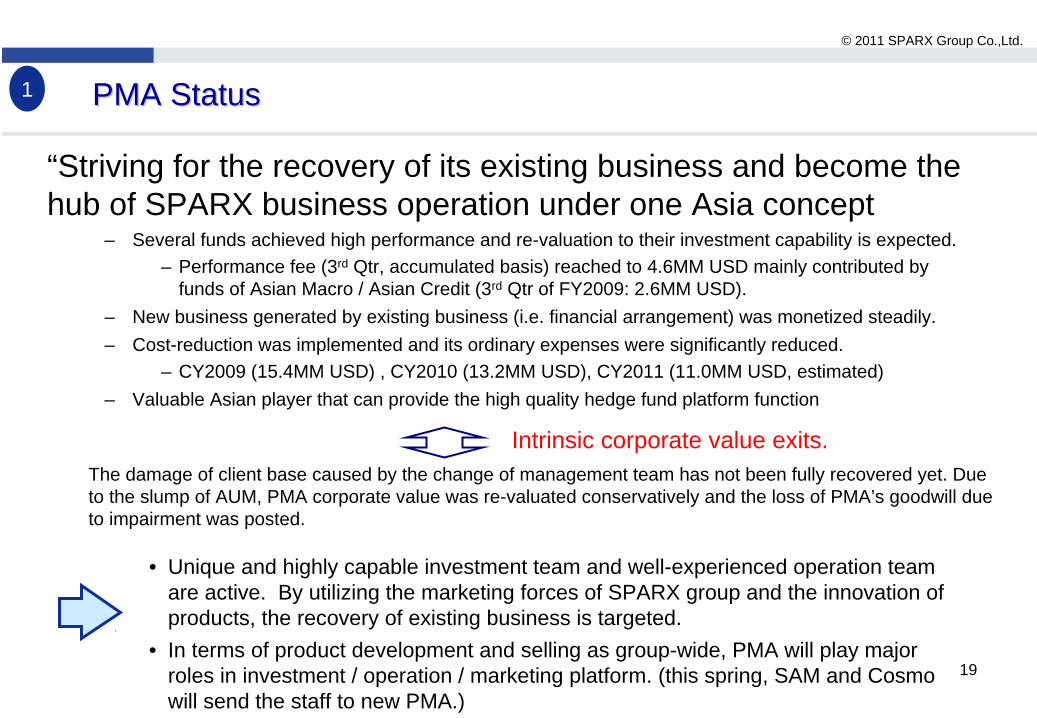
PMAPMA StatusStatus
“Striving for the recovery of its existing business and become the hub of SPARX business operation under one Asia concept
– Several funds achieved high performance and re-valuation to their investment capability is expected. – Performance fee (3rd Qtr, accumulated basis) reached to 4.6MM USD mainly contributed by
funds of Asian Macro / Asian Credit (3rd Qtr of FY2009: 2.6MM USD). – New business generated by existing business (i.e. financial arrangement) was monetized steadily. – Cost-reduction was implemented and its ordinary expenses were significantly reduced.
– CY2009 (15.4MM USD) , CY2010 (13.2MM USD), CY2011 (11.0MM USD, estimated)– Valuable Asian player that can provide the high quality hedge fund platform function
1
The damage of client base caused by the change of management team has not been fully recovered yet. Due to the slump of AUM, PMA corporate value was re-valuated conservatively and the loss of PMA’s goodwill due to impairment was posted.
Intrinsic corporate value exits.
• Unique and highly capable investment team and well-experienced operation team are active. By utilizing the marketing forces of SPARX group and the innovation of products, the recovery of existing business is targeted.
• In terms of product development and selling as group-wide, PMA will play major roles in investment / operation / marketing platform. (this spring, SAM and Cosmo will send the staff to new PMA.)

© 2011 SPARX Group Co.,Ltd.
20
-400
-300
-200
-100
0
100
200
300
2008/1Q 2008/2Q 2008/3Q 2008/4Q 2009/1Q 2009/2Q 2009/3Q 2009/4Q 2010/1Q 2010/2Q 2010/3Q
Net Subscription Redemption
0
500
1,000
1,500
2,000
2,500
3,000百万
PMAPMA ((in in US$US$)): While AUM remains stagnant, it will bottom out. : While AUM remains stagnant, it will bottom out.
(Unit: MM USD)
Apr 2009Apr 2008 Apr 2010
As of Jan 2011
1,166MM US$(-18.7%)
95.5B JPY(-29.1%)
As of April, 2010
1,433MM US$
134.7B JPY
Dec 2010

© 2011 SPARX Group Co.,Ltd.
21
Expansion to new business: further growth stage (1)
By maximizing and aggregating the power and resources of SAM (Tokyo), Cosmo (Seoul) and PMA (Hong Kong), the principle of ”Center for Asia Investment Intelligence” will be substantiated.
Investment hypothesis– Based on the intangible assets obtained through Japanese equity investment
business, the hypothesis (how the ”Asian Dynamism” (World’s Factory & Mass Consumer Markets)will work for real markets.) will be introduced.
Product development– “One Asia Long-Short” investment strategy, “One-Asia Long-Only” investment
strategy– Environment & Green-Tech. investment strategy– “Soft Activist”-type investment strategy
Investment / research system– Already created the investment/research team selected from group-wide people– Based on the analytical skills of Japanese companies that SAM generated in long-
term, Cosmo and PMA will act as “One-Asia” investment team with combining their intelligence and network .
– The base for their activities will be established in Hong Kong.
2

© 2011 SPARX Group Co.,Ltd.
22
Expansion to new business: further growth stage (2)
Marketing– Accelerate to launch the mutual funds in Japan and plan to create the core
organization of group-wide global marketing activities in Hong KongOperation
– While the each operation of domestic mutual fund should be regulated by each local rules and regulations, the operation of “off-shore” business will be centralized in Hong Kong.
– Implement the standardization of Information Technology, etc. Compliance
– Build up the compliance organization for enabling the group-wide business activities and for respecting the local rules and regulations.
HR & Management– Study the standardization level of HR system– Necessity to change the existing management system to the one well-fitted to
business model
2
By establishing the “One-Asia” operation and by recovering its profitability, SPARX plans to build up Asian-wide network (Japan, South Korea, Hong Kong and other Asian regions)

© 2011 SPARX Group Co.,Ltd.
23
AppendixAppendix

© 2011 SPARX Group Co.,Ltd.
24
(Units: 100 MM JPY)
Notes: 1. The figures stated above are truncated. 2. “Appreciation etc.” contains any gains and losses from the exchange rate differential between March 31, 2010 and December 31, 2010.3. The figures for December 31, 2010 are based on in-house calculations and should be regarded as preliminary.
Flow of funds (March 31 – December 31, 2010)
© 2011 SPARX Group Co.,Ltd.
25
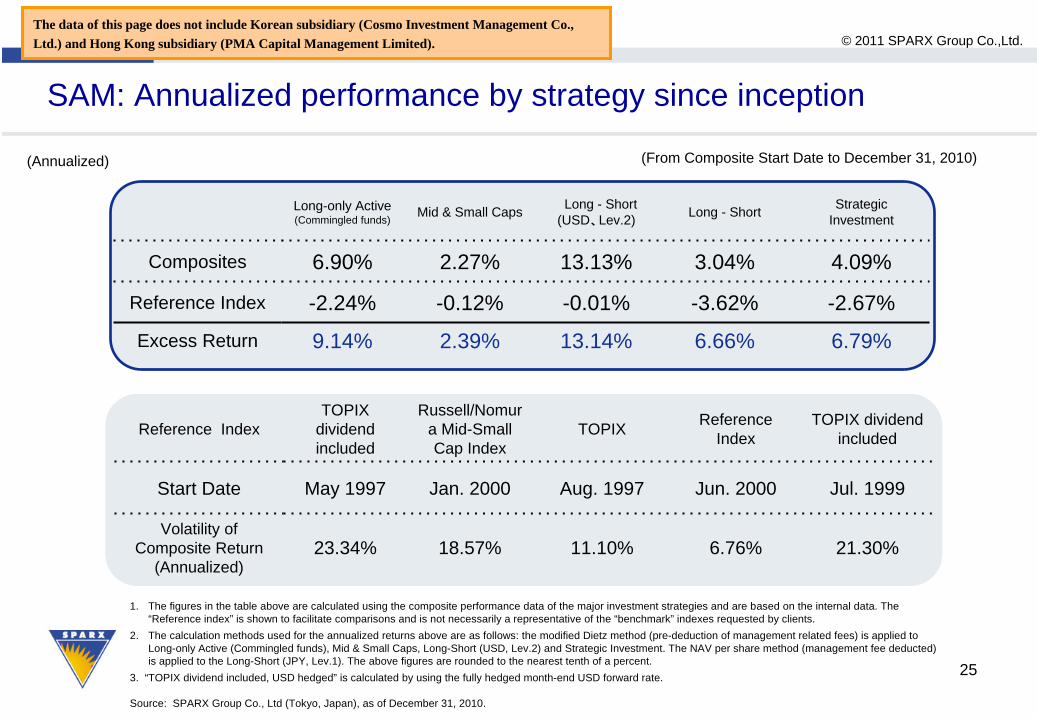
SAM: Annualized performance by strategy since inception
Reference IndexTOPIX
dividend included
Russell/Nomur a Mid-Small Cap Index
TOPIX Reference Index
TOPIX dividend included
Start Date May 1997 Jan. 2000 Aug. 1997 Jun. 2000 Jul. 1999
Volatility of Composite Return
(Annualized)23.34% 18.57% 11.10% 6.76% 21.30%
Long-only Active (Commingled funds) Mid & Small Caps Long - Short
(USD、Lev.2) Long - Short Strategic Investment
Composites 6.90% 2.27% 13.13% 3.04% 4.09%
Reference Index -2.24% -0.12% -0.01% -3.62% -2.67%
Excess Return 9.14% 2.39% 13.14% 6.66% 6.79%
The data of this page does not include Korean subsidiary (Cosmo Investment Management Co., Ltd.) and Hong Kong subsidiary (PMA Capital Management Limited).
(Annualized) (From Composite Start Date to December 31, 2010)
1. The figures in the table above are calculated using the composite performance data of the major investment strategies and are based on the internal data. The “Reference index” is shown to facilitate comparisons and is not necessarily a representative of the “benchmark” indexes requested by clients.
2. The calculation methods used for the annualized returns above are as follows: the modified Dietz method (pre-deduction of management related fees) is applied to Long-only Active (Commingled funds), Mid & Small Caps, Long-Short (USD, Lev.2) and Strategic Investment. The NAV per share method (management fee deducted) is applied to the Long-Short (JPY, Lev.1). The above figures are rounded to the nearest tenth of a percent.
3. “TOPIX dividend included, USD hedged” is calculated by using the fully hedged month-end USD forward rate.
Source: SPARX Group Co., Ltd (Tokyo, Japan), as of December 31, 2010.
© 2011 SPARX Group Co.,Ltd.
26
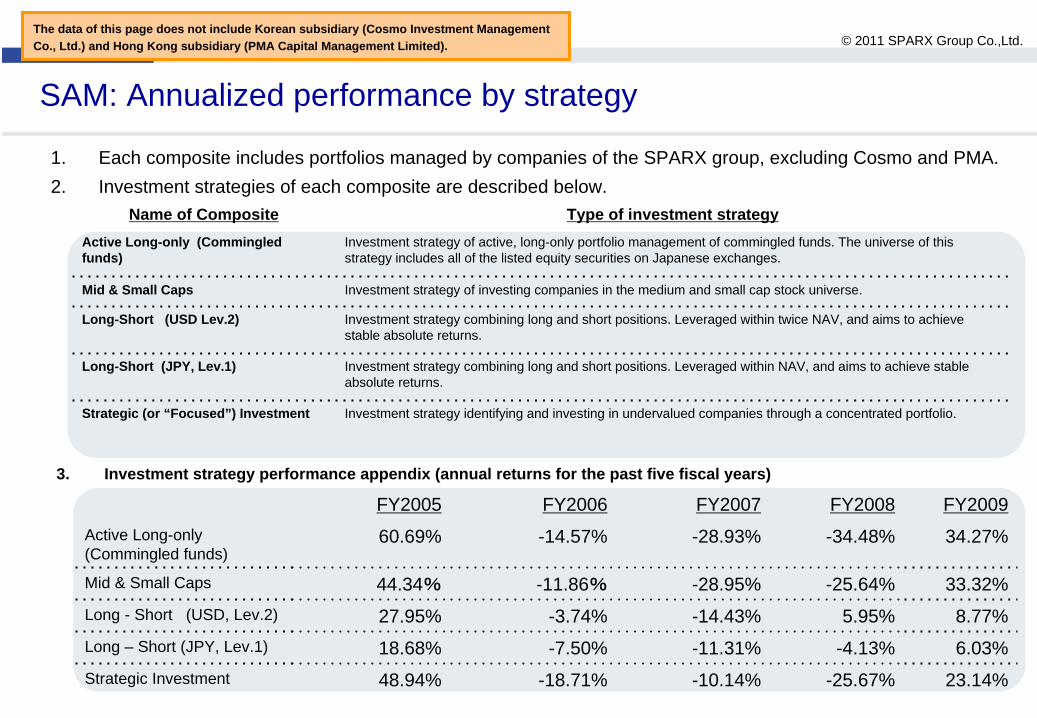
SAM: Annualized performance by strategy
FY2005 FY2006 FY2007 FY2008 FY2009Active Long-only (Commingled funds)
60.69% -14.57% -28.93% -34.48% 34.27%
Mid & Small Caps 44.34% -11.86% -28.95% -25.64% 33.32%Long - Short (USD, Lev.2) 27.95% -3.74% -14.43% 5.95% 8.77%Long – Short (JPY, Lev.1) 18.68% -7.50% -11.31% -4.13% 6.03%Strategic Investment 48.94% -18.71% -10.14% -25.67% 23.14%
1. Each composite includes portfolios managed by companies of the SPARX group, excluding Cosmo and PMA. 2. Investment strategies of each composite are described below.
Name of Composite Type of investment strategyActive Long-only (Commingled funds)
Investment strategy of active, long-only portfolio management of commingled funds. The universe of this strategy includes all of the listed equity securities on Japanese exchanges.
Mid & Small Caps Investment strategy of investing companies in the medium and small cap stock universe.
Long-Short (USD Lev.2) Investment strategy combining long and short positions. Leveraged within twice NAV, and aims to achieve stable absolute returns.
Long-Short (JPY, Lev.1) Investment strategy combining long and short positions. Leveraged within NAV, and aims to achieve stable absolute returns.
Strategic (or “Focused”) Investment Investment strategy identifying and investing in undervalued companies through a concentrated portfolio.
3. Investment strategy performance appendix (annual returns for the past five fiscal years)
The data of this page does not include Korean subsidiary (Cosmo Investment Management Co., Ltd.) and Hong Kong subsidiary (PMA Capital Management Limited).

© 2011 SPARX Group Co.,Ltd.
2727
This report is prepared solely for the purpose of providing information in English to shareholders of SPARX Group Co., Ltd. (“SPARX”) and other interested parties and is not intended to be a recommendation or solicitation to buy or sell SPARX shares or any other securities. SPARX and its group companies do not warrant the accuracy, completeness, or appropriateness of any data, information, opinions or other statements contained in this report (which remain subject to auditing), and are not liable for any damage, loss and/or other results caused by any reliance on or use of any of the said data, information, opinions or other statements. Past results are not indicative of future performance. This report contains forward-looking statements that reflect SPARX’s plans and expectations. These forward-looking statements are not guarantees of future performance and involve known and unknown risks, uncertainties and other factors that may cause SPARX’s actual results, performance, achievements or financial position to be materially different from any future results, performance, achievements or financial position expressed or implied by these forward-looking statements. A discussion of these factors which may affect SPARX’s actual results, performance, achievements or financial position is contained in SPARX’s annual securities report, which is on file with the Kanto Finance Bureau of the Japanese MOF. Further, the content of this report may be altered without any prior notice. SPARX owns the copyright of this report. No part of this report may be transmitted, reproduced, quoted, cited or otherwise used for any purpose whatsoever without the prior written permission of SPARX.
SPARX Asset Management Co., Ltd. has prepared and presented the relevant part of this report in compliance with the Global Investment Performance Standards (GIPS®). The firm has been independently verified for the periods- 1 April 1997 – 31 December 2009. The verification report is available upon request. Verification assesses whether (1) the firm has complied with all the composite construction requirements of the GIPS standards on a firm-wide basis and (2) the firm’s policies and procedures are designated to calculate and present performance in compliance with the GIPS standards. Verification does not ensure the accuracy of any specific composite presentation. The firm has been defined as SPARX, comprising SPARX Asset Management Co., Ltd. and SPARX Overseas Ltd. SPARX Asset Management Co., Ltd. is registered with Japanese authority to conduct the Investment Management Business, the Investment Advisory and Agency Business, the Type 1 Financial Instruments Business and the Type 2 Financial Instruments Business.
The term the “Firm” was redefined effective 15 October 2009 and 30 November 2010 where SPARX Investment & Research, USA, Inc. (SIR) and SPARX International (Hong Kong) Limited (SIHK) have been excluded, respectively, due to the dissolution of SIR and the transfer of SIHK’s shares to a third-party.
SPARX Group Co., Ltd.
Gate City Ohsaki East Tower 16F 1-11-2 Ohsaki, Shinagawa-ku, Tokyo 141-0032, Japan Tel: +81-(0)3-5437-9700