Embed Size (px)
Citation preview
TM
© 1999 Professional Postgraduate Services®
Diabetic Dyslipidemia
TM
© 1999 Professional Postgraduate Services®National Diabetes Data Group. Diabetes in America. 2nd ed. NIH;1995.
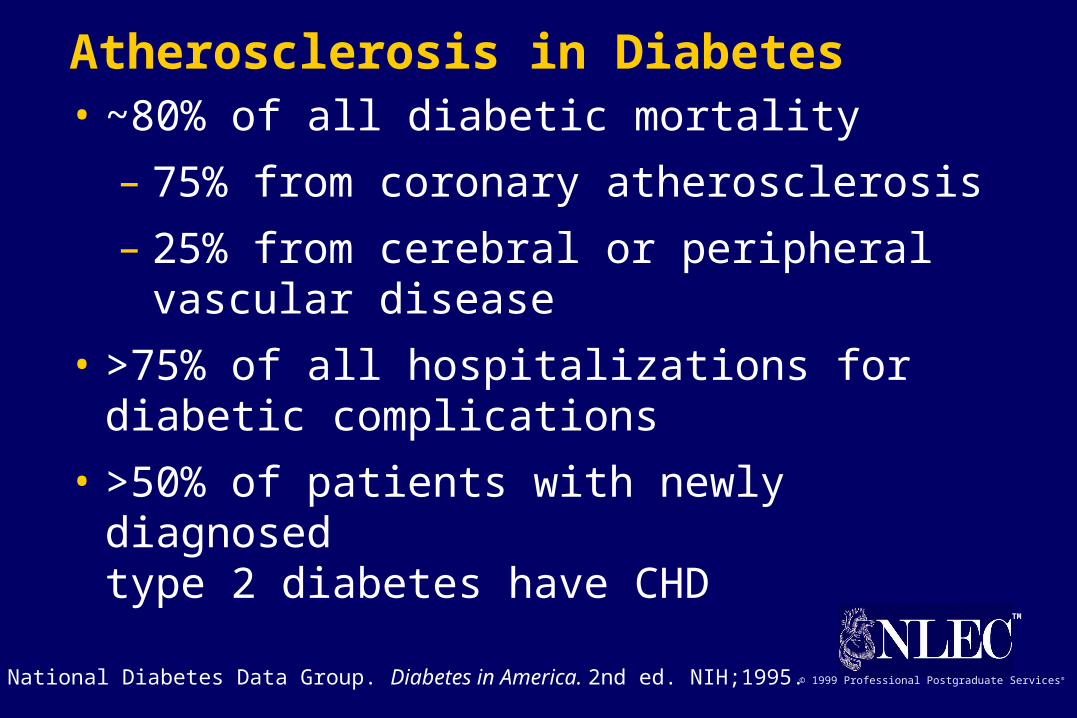
Atherosclerosis in Diabetes• ~80% of all diabetic mortality
– 75% from coronary atherosclerosis
– 25% from cerebral or peripheral vascular disease
• >75% of all hospitalizations for diabetic complications
• >50% of patients with newly diagnosed type 2 diabetes have CHD

TM
© 1999 Professional Postgraduate Services®
Framingham Heart Study 30-Year Follow-Up:CVD Events in Patients With Diabetes (Ages 35-64)
109
20
11
9 63819
3*
30
0
2
4
6
8
10
Age-adjusted annual rate/1,000
Men Women
Total CVD CHD Cardiac failure
Intermittent claudication
Stroke
Riskratio
P<0.001 for all values except *P<0.05.
Wilson PWF, Kannel WB. In: Hyperglycemia, Diabetes and Vascular Disease.Ruderman N et al, eds. Oxford; 1992.

TM
© 1999 Professional Postgraduate Services®
T M
© 1 9 9 9 P ro fe s s io n a l P o s tg ra d u a te S e rv ic e s ®
0
5
10
15
20

TM
© 1999 Professional Postgraduate Services®
T M
© 1 9 9 9 P ro fe s s io n a l P o s tg ra d u a te S e rv ic e s ®
T h e S tro n g H e a rt S tu d y : D iffe re n c e s in C V D R is kF a c to rs b y D ia b e tic S ta tu s in M e n a n d W o m e n *
*A d ju s te d fo r a g e a n d c e n te r.
A d a p te d fro m H o w a rd B V e t a l. D ia b e te s C a re . 1 9 9 8 ;2 1 :1 2 5 8 -1 2 6 5 .
-4.4
-3.7
-7.5
-5.3
-8
-7
-6
-5
-4
-3
-2
-1
0
Men
Women
TM
© 1999 Professional Postgraduate Services®
Kannel WB. Am Heart J. 1985;110:1100-1107.Abbott RD et al. JAMA. 1988;260:3456-3460.
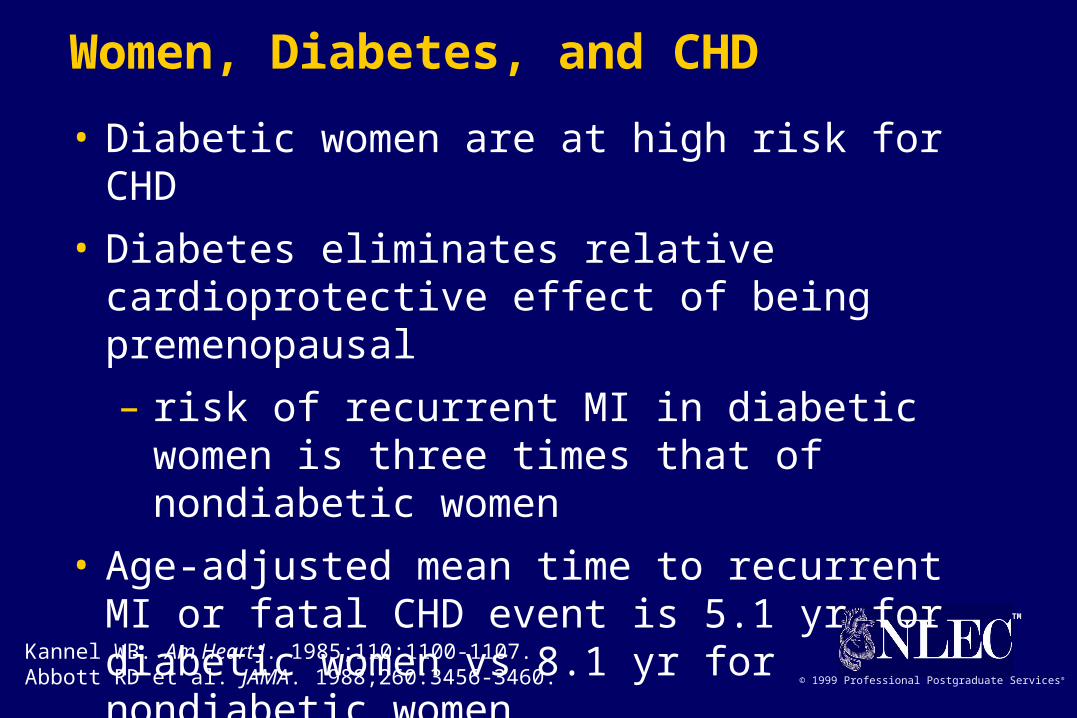
Women, Diabetes, and CHD
• Diabetic women are at high risk for CHD
• Diabetes eliminates relative cardioprotective effect of being premenopausal
– risk of recurrent MI in diabetic women is three times that of nondiabetic women
• Age-adjusted mean time to recurrent MI or fatal CHD event is 5.1 yr for diabetic women vs 8.1 yr for nondiabetic women
TM
© 1999 Professional Postgraduate Services®
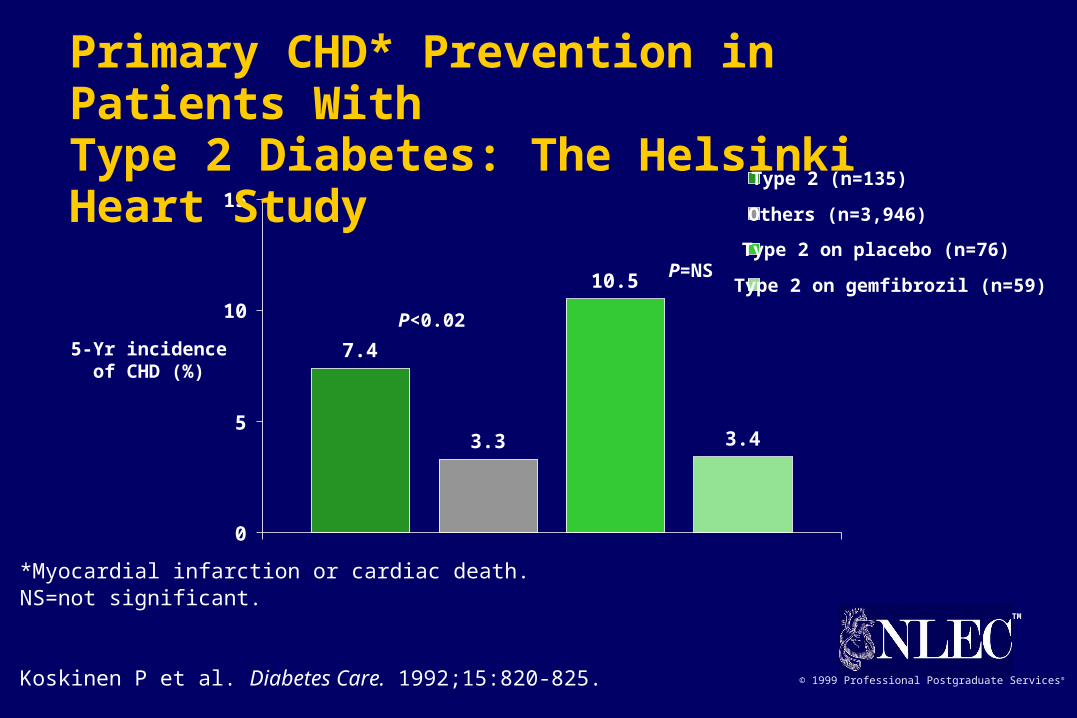
7.4
3.3
10.5
3.4
0
5
10
15Type 2 (n=135)
Others (n=3,946)
Type 2 on placebo (n=76)
Type 2 on gemfibrozil (n=59)
5-Yr incidenceof CHD (%)
*Myocardial infarction or cardiac death.NS=not significant.
Koskinen P et al. Diabetes Care. 1992;15:820-825.
P<0.02
P=NS
Primary CHD* Prevention in Patients With Type 2 Diabetes: The Helsinki Heart Study
TM
© 1999 Professional Postgraduate Services®
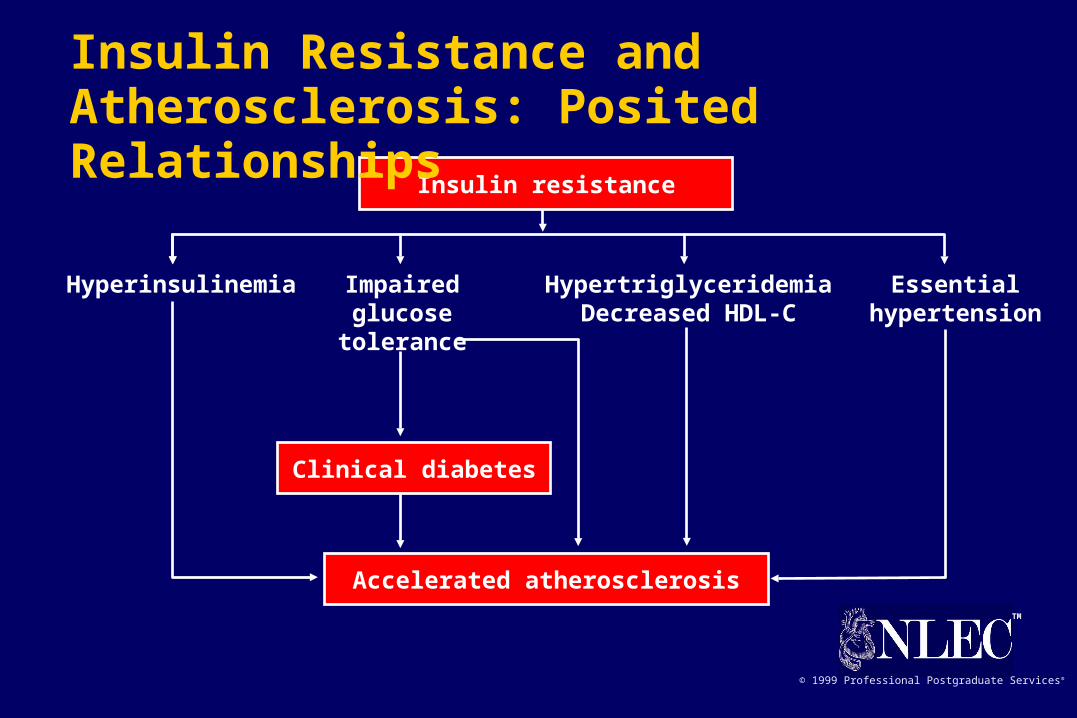
Accelerated atherosclerosis
Clinical diabetes
Hyperinsulinemia Impairedglucose
tolerance
HypertriglyceridemiaDecreased HDL-C
Essentialhypertension
Insulin resistance
Insulin Resistance and Atherosclerosis: Posited Relationships
TM
© 1999 Professional Postgraduate Services®
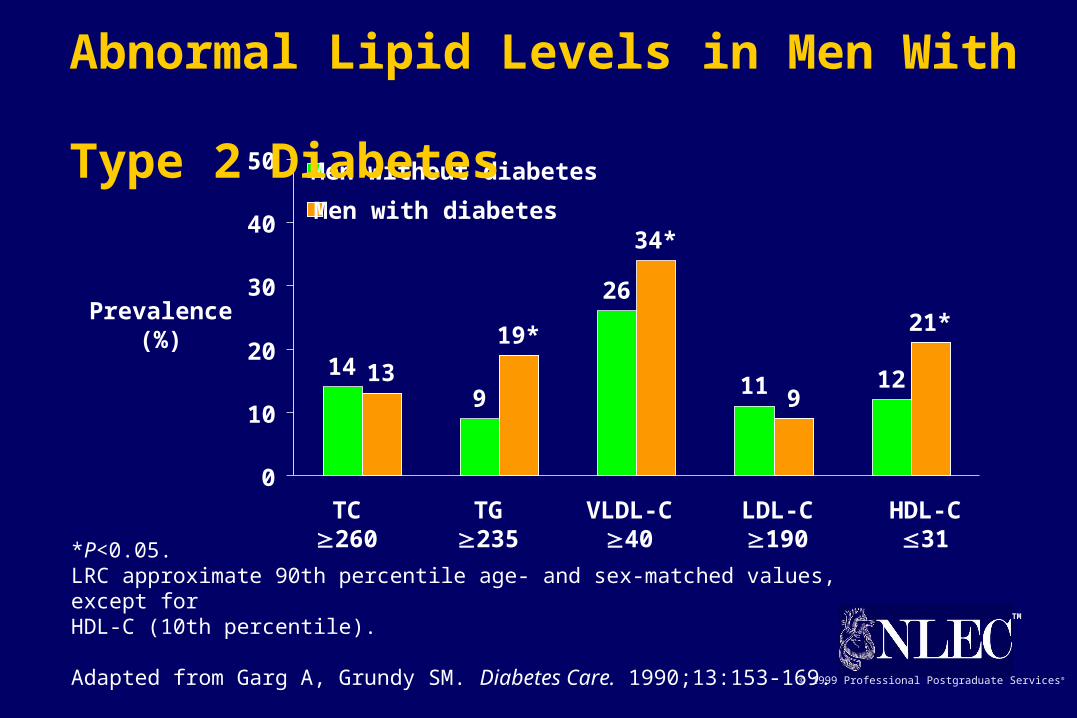
149
26
11 12139
21*
34*
19*
0
10
20
30
40
50 Men without diabetes
Men with diabetes
TC260
TG235
VLDL-C40
LDL-C190
HDL-C31
Prevalence(%)
*P<0.05.LRC approximate 90th percentile age- and sex-matched values, except for HDL-C (10th percentile).
Adapted from Garg A, Grundy SM. Diabetes Care. 1990;13:153-169.
Abnormal Lipid Levels in Men With Type 2 Diabetes
TM
© 1999 Professional Postgraduate Services®
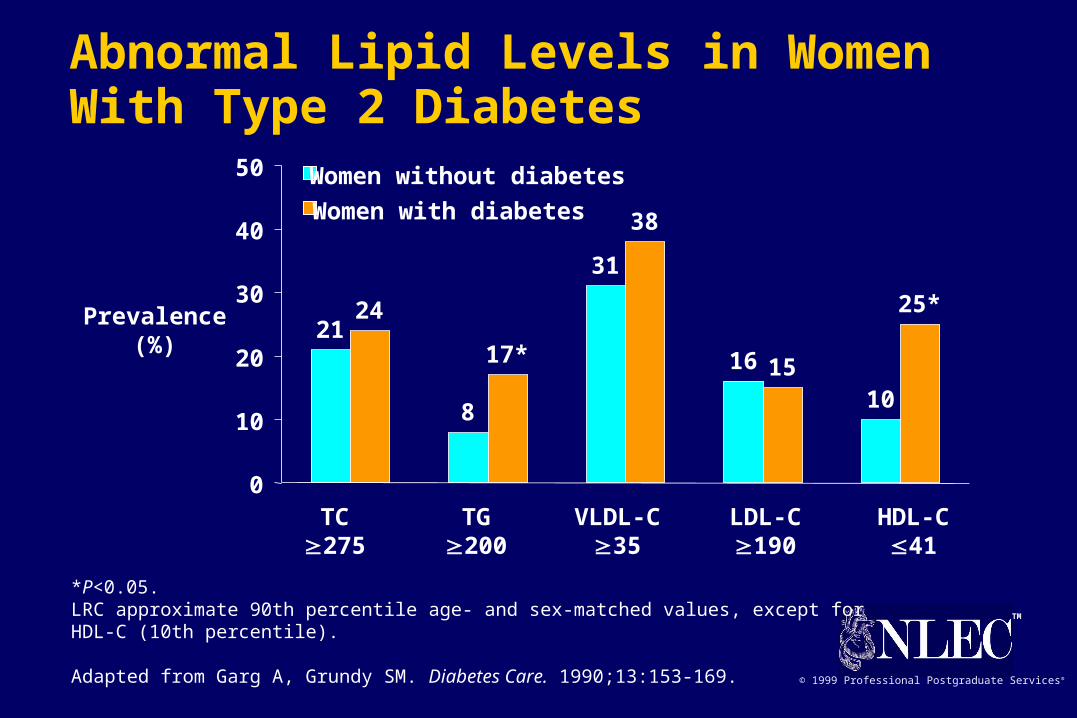
21
8
31
16
10
24
38
15
25*
17*
0
10
20
30
40
50 Women without diabetes
Women with diabetes
TC275
TG200
VLDL-C35
LDL-C190
HDL-C41
Prevalence(%)
*P<0.05.LRC approximate 90th percentile age- and sex-matched values, except for HDL-C (10th percentile).
Adapted from Garg A, Grundy SM. Diabetes Care. 1990;13:153-169.
Abnormal Lipid Levels in Women With Type 2 Diabetes

TM
© 1999 Professional Postgraduate Services®
Feingold KR et al. Arterioscler Thromb. 1992;12:1496-1502.Lamarche B et al. Circulation. 1997;95:69-75.
Significance of Small, Dense LDL• Low cholesterol content of LDL particles
particle number for given LDL-C level• Associated with levels of TG and LDL-C, and
levels of HDL2
• Marker for common genetic trait associated with risk of coronary disease (LDL subclass pattern B)
• Possible mechanisms of atherogenicity– greater arterial uptake uptake by macrophages oxidation susceptibility

TM
© 1999 Professional Postgraduate Services®
SMC=smooth muscle cell.
Adapted from Bierman EL. Arterioscler Thromb. 1992;12:647-656.
Potential Mechanisms of Atherogenesis in Diabetes• Abnormalities in apoprotein and lipoprotein particle
distribution
• Glycosylation and advanced glycation of proteins in plasma and arterial wall
• “Glycoxidation” and oxidation
• Procoagulant state
• Insulin resistance and hyperinsulinemia
• Hormone-, growth-factor–, and cytokine-enhanced SMC proliferation and foam cell formation

TM
© 1999 Professional Postgraduate Services®
ADA-Suggested Standards for Biochemical Indices of Metabolic ControlBiochemical index Acceptable Borderline* High
Fasting plasma glucose (mg/dL) <115 126>200
Postprandial (2 hr)plasma glucose (mg/dL) <140 200
>235
Hemoglobin A1c (%)† (Goal: <7%) <6 >7>10
Fasting plasma TC (mg/dL) <200 200-239240
Fasting plasma TG (mg/dL) <200 200-399400
Fasting plasma LDL-C (mg/dL) <100 100-129130
(100 if CAD)
Fasting plasma HDL-C (mg/dL) >45 35-45<35
* Current ADA recommendations call for therapeutic action for values above “borderline.”† Adjust for normal lab values.Adapted from Garber AJ et al. Diabetes Care. 1992;15:1068-1074; ADA. Diabetes Care. 1993;16:828-834; and ADA. Diabetes Care. 1998;21(suppl 1):S36-S39.

TM
© 1999 Professional Postgraduate Services®
Glycemic Control for People With Diabetes
Diabetic ActionBiochemical index Nondiabetic goal suggested
Preprandial glucose (mg/dL) <115 80-120 <80>126
Bedtime glucose (mg/dL) <120 100-140 <100>160
Hemoglobin A1c (%) <6 <7 >8These values are for nonpregnant individuals. “Action suggested” depends on individual patient circumstances. Hemoglobin A1c is referenced to a nondiabetic range of 4.0-6.0% (mean 5.0%, standard deviation 0.5%).
ADA. Diabetes Care. 1996;19(suppl 1):S8-S15.

TM
© 1999 Professional Postgraduate Services®
1999 ADA Risk Stratification Based on Lipoprotein Levels in Adults With Diabetes*
ADA. Diabetes Care. 1999;22:S56-S59.
Risk LDL-C HDL-C TG
High 130 <35 400
Borderline 100-129 35-45 200-399
Low <100 >45 <200
*Values represent mg/dL. For women, HDL-C should be increased by 10 mg/dL.
TM
© 1999 Professional Postgraduate Services®
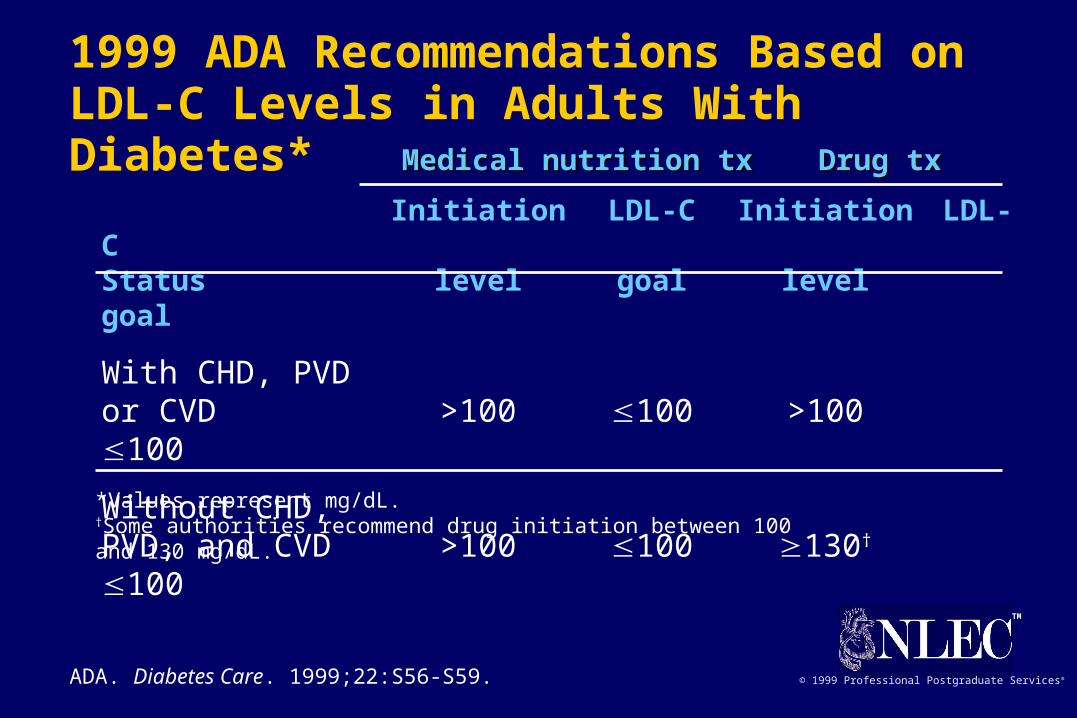
1999 ADA Recommendations Based on LDL-C Levels in Adults With Diabetes*
ADA. Diabetes Care. 1999;22:S56-S59.
Initiation LDL-C Initiation LDL-CStatus level goal levelgoal
With CHD, PVDor CVD >100 100 >100100
Without CHD,PVD, and CVD >100 100 130†
100
*Values represent mg/dL.†Some authorities recommend drug initiation between 100 and 130 mg/dL.
Medical nutrition txMedical nutrition tx Drug txDrug tx

TM
© 1999 Professional Postgraduate Services®
Order of Priorities for Treatment of Diabetic Dyslipidemia in Adults• LDL-C lowering
– first choice: HMG-CoA reductase inhibitors (statins)– second choice: bile acid binding resin or fenofibrate
• HDL-C raising– behavioral interventions (weight loss, physical activity, smoking
cessation)– glycemic control– difficult (except with niacin, which is relatively contraindicated, or fibrates)
• TG lowering– glycemic control first priority– fibric acid derivative (gemfibrozil, fenofibrate)– statins (moderately effective at high dose in patients with TG and
LDL-C)
ADA. Diabetes Care. 1999;22:S56-S59.
TM
© 1999 Professional Postgraduate Services®
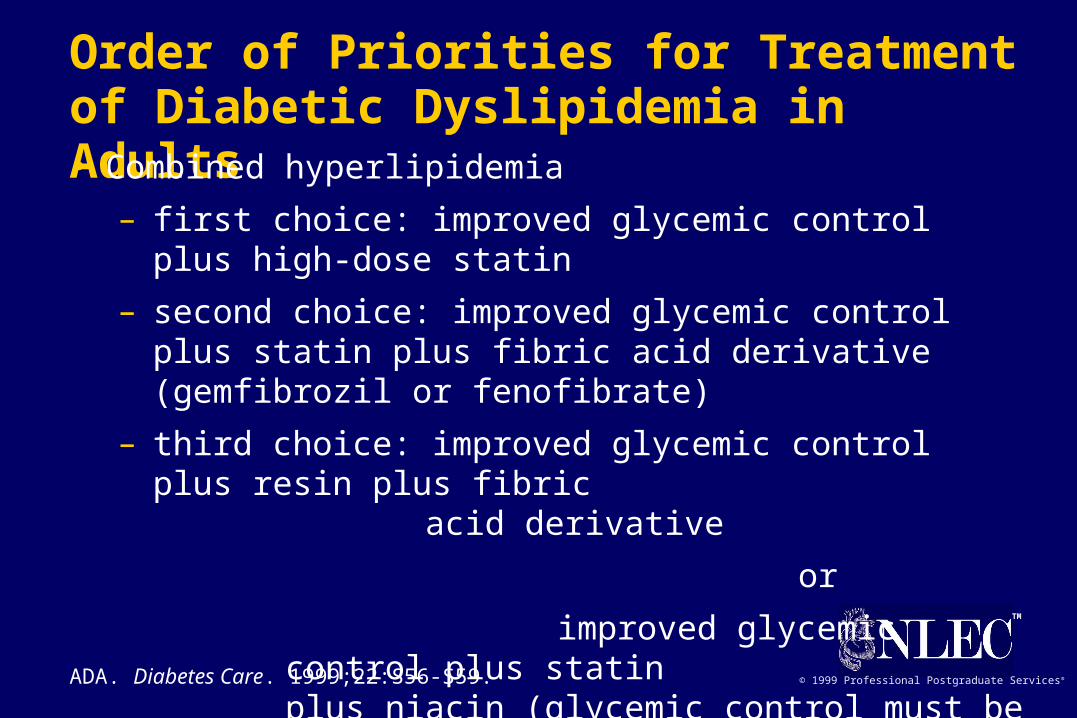
Order of Priorities for Treatment of Diabetic Dyslipidemia in Adults• Combined hyperlipidemia
– first choice: improved glycemic control plus high-dose statin
– second choice: improved glycemic control plus statin plus fibric acid derivative (gemfibrozil or fenofibrate)
– third choice: improved glycemic control plus resin plus fibric
acid derivative
or
improved glycemic control plus statin plus niacin (glycemic control must be monitored carefully)ADA. Diabetes Care. 1999;22:S56-S59.
TM
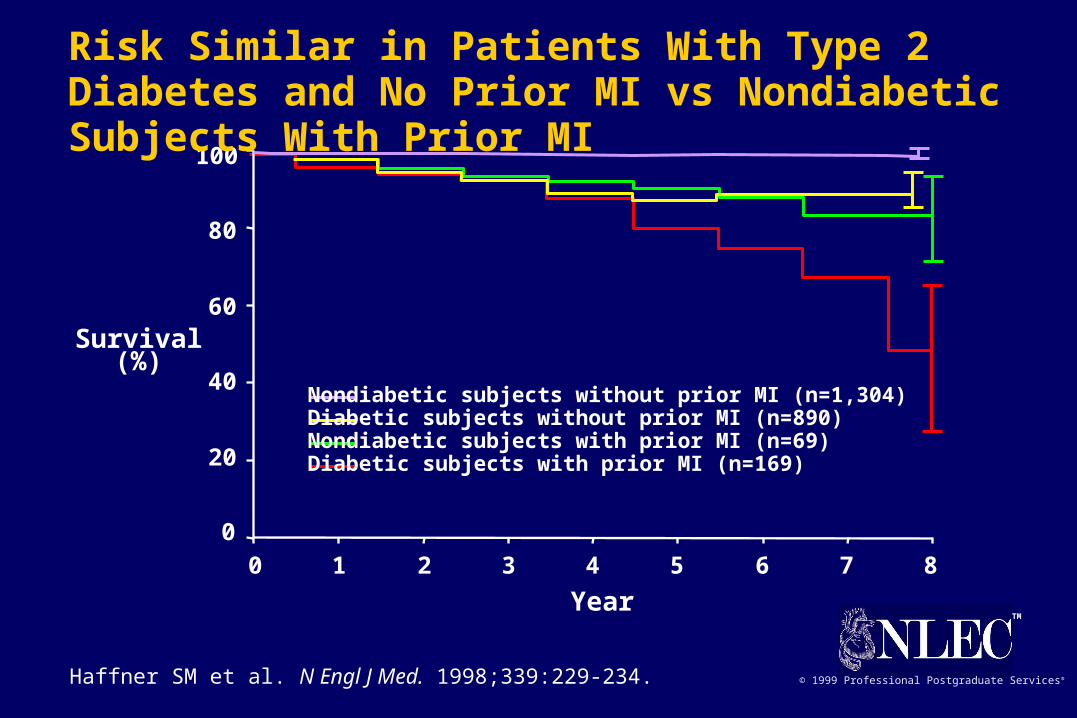
© 1999 Professional Postgraduate Services®Haffner SM et al. N Engl J Med. 1998;339:229-234.
0 1 2 3 4 5 6 7 8
0
20
40
60
80
100
Nondiabetic subjects without prior MI (n=1,304)Diabetic subjects without prior MI (n=890)Nondiabetic subjects with prior MI (n=69)Diabetic subjects with prior MI (n=169)
Survival(%)
Year
Risk Similar in Patients With Type 2 Diabetes and No Prior MI vs Nondiabetic Subjects With Prior MI
TM
© 1999 Professional Postgraduate Services®
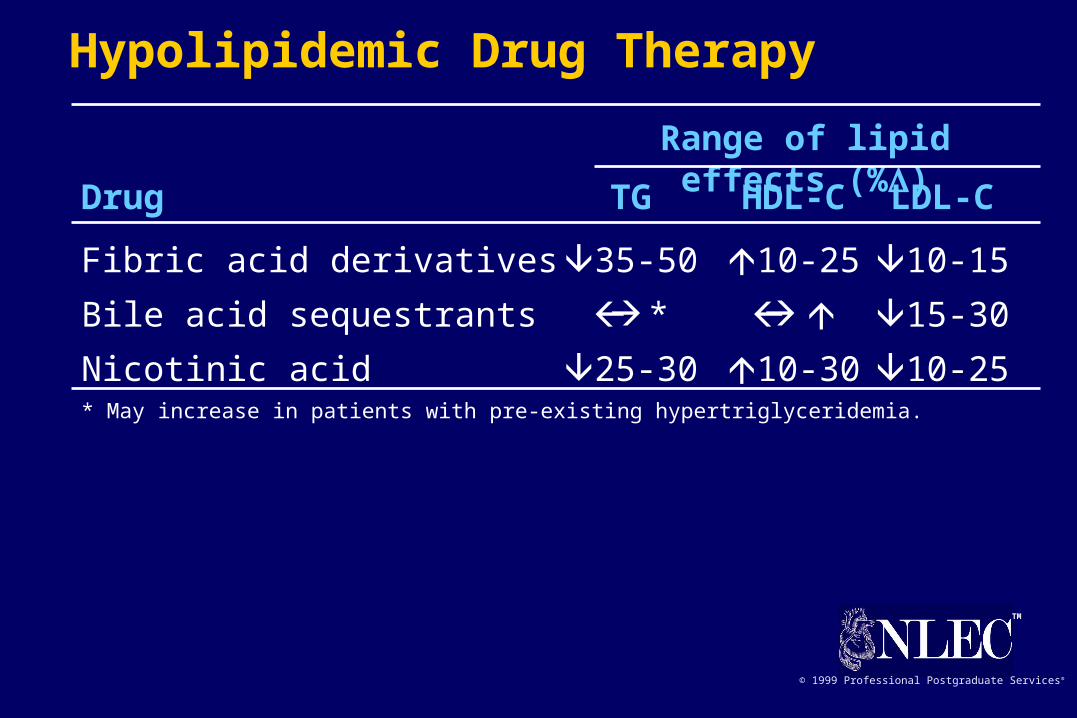
Drug TG HDL-C LDL-C
Fibric acid derivatives 35-50 10-25 10-15
Bile acid sequestrants * 15-30
Nicotinic acid 25-30 10-30 10-25* May increase in patients with pre-existing hypertriglyceridemia.
Range of lipid effects (%)
Hypolipidemic Drug Therapy
TM
© 1999 Professional Postgraduate Services®
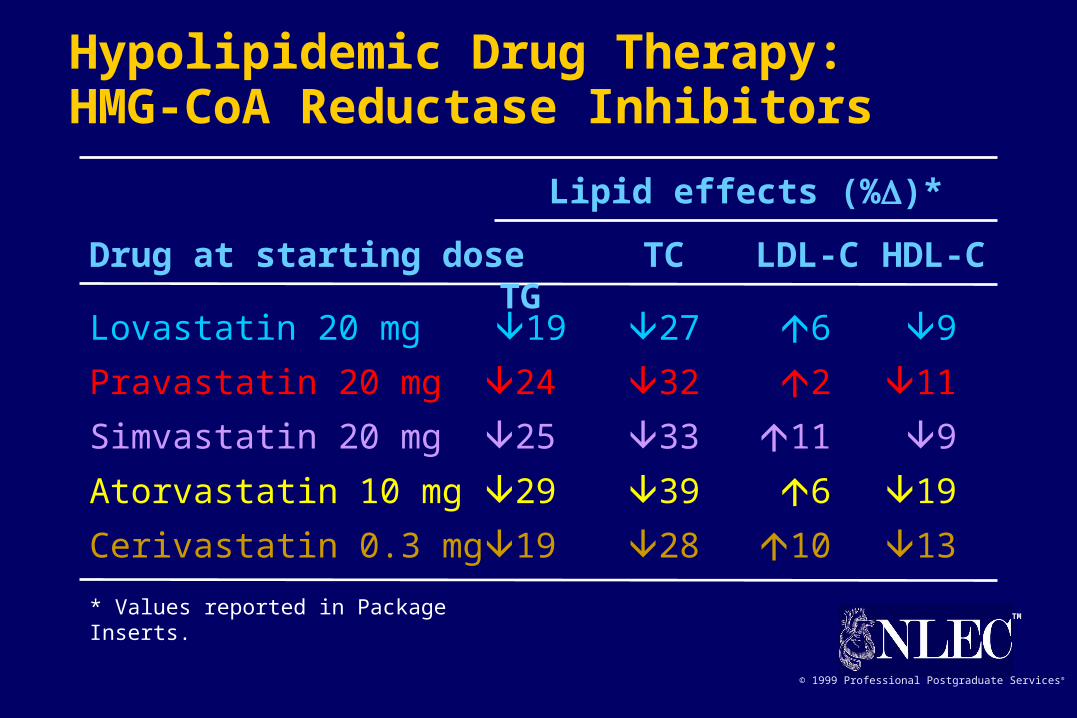
Lovastatin 20 mg 19 27 6 9
Pravastatin 20 mg 24 32 2 11
Simvastatin 20 mg 25 33 11 9
Atorvastatin 10 mg 29 39 6 19
Cerivastatin 0.3 mg 19 28 10 13
* Values reported in Package Inserts.
Lipid effects (%)*
Hypolipidemic Drug Therapy:HMG-CoA Reductase Inhibitors
Drug at starting dose TC LDL-C HDL-C TG
TM
© 1999 Professional Postgraduate Services®
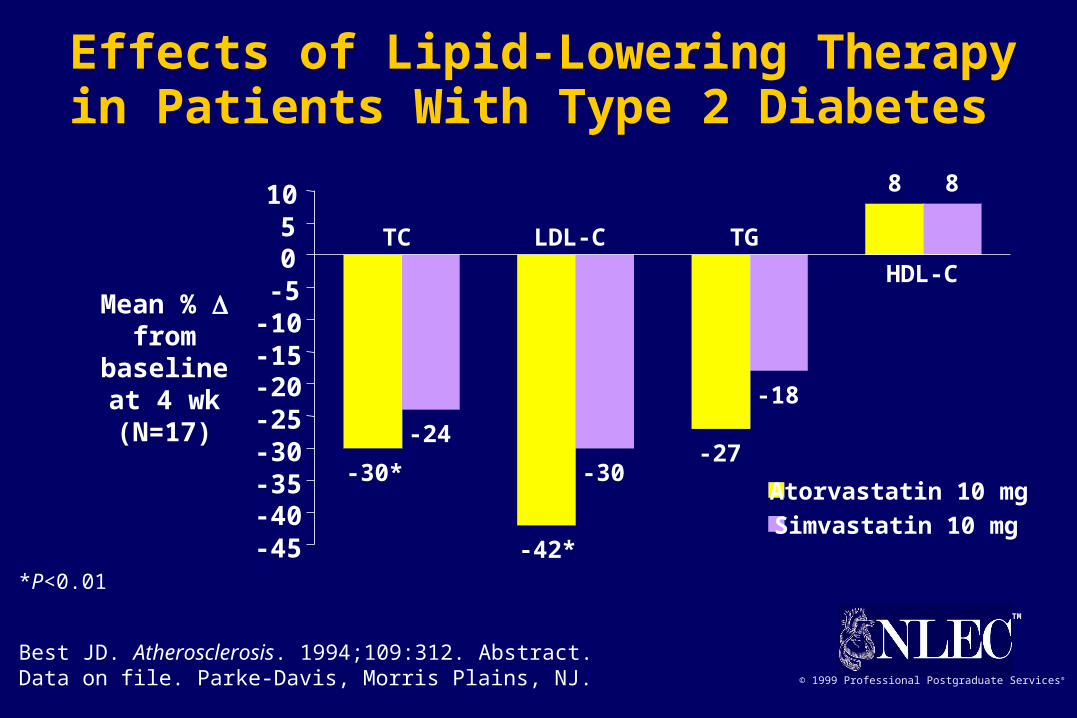
-27
8
-24
-30
-18
8
-30*
-42*-45-40-35-30-25-20-15-10-505
10
Atorvastatin 10 mg
Simvastatin 10 mg
Mean % from baseline
at 4 wk(N=17)
*P<0.01
Best JD. Atherosclerosis. 1994;109:312. Abstract.Data on file. Parke-Davis, Morris Plains, NJ.
TC LDL-C TG
HDL-C
Effects of Lipid-Lowering Therapy in Patients With Type 2 Diabetes
TM
© 1999 Professional Postgraduate Services®
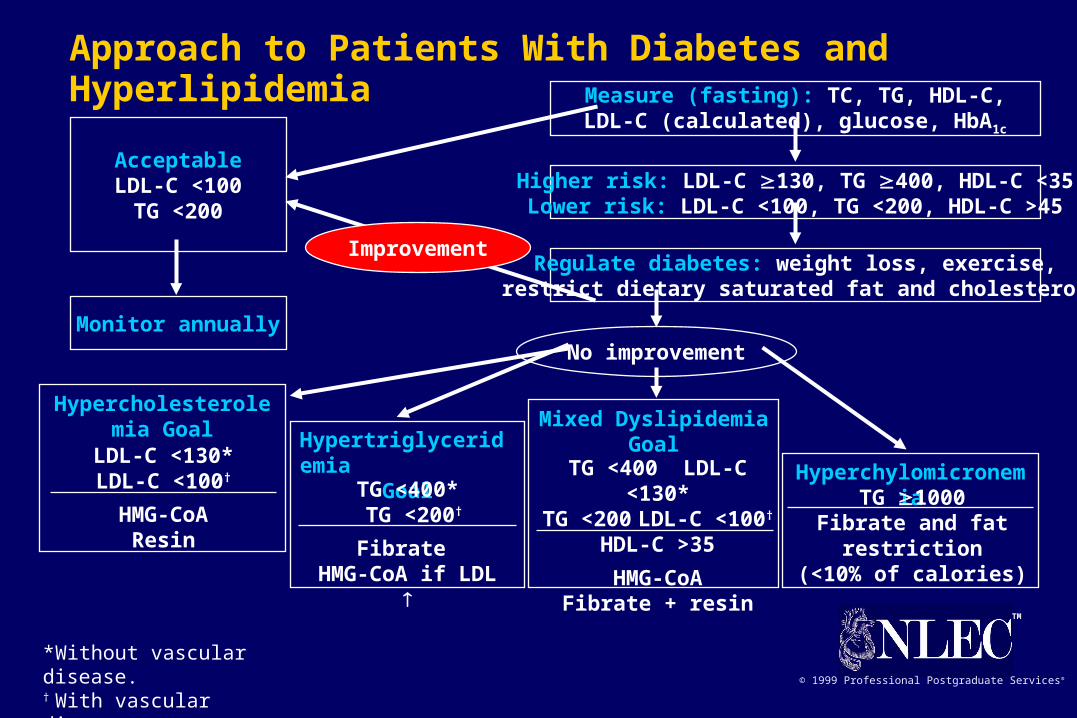
* Without vascular disease.† With vascular disease.
Approach to Patients With Diabetes and Hyperlipidemia
AcceptableLDL-C <100
TG <200
Monitor annually
Improvement
Hypercholesterolemia Goal
LDL-C <130*LDL-C <100†
HMG-CoAResin
HypertriglyceridemiaGoal
TG <400* TG <200†
Fibrate HMG-CoA if LDL
Mixed DyslipidemiaGoal
TG <400 LDL-C <130*TG <200 LDL-C <100†
HDL-C >35
HMG-CoAFibrate + resin
HyperchylomicronemiaTG 1000
Fibrate and fat restriction
(<10% of calories)
Measure (fasting): TC, TG, HDL-C,LDL-C (calculated), glucose, HbA1c
Higher risk: LDL-C 130, TG 400, HDL-C <35Lower risk: LDL-C <100, TG <200, HDL-C >45
Regulate diabetes: weight loss, exercise,restrict dietary saturated fat and cholesterol
No improvement

TM
© 1999 Professional Postgraduate Services®
TM
© 1999 Professional Postgraduate Services®
UKPDS: Intensive Blood-Glucose vs ConventionalTreatment in Patients With Type 2 Diabetes
RR=relative risk.PVD=peripheral vascular disease.
UKPDS Group. Lancet. 1998;352:837-853.
Any diabetes-related end point 0.88 (0.79–0.99) 0.029
Diabetes-related deaths 0.90 (0.73–1.11) 0.34
All-cause mortality 0.94 (0.80–1.10) 0.44
MI 0.84 (0.71–1.00) 0.052
Stroke 1.11 (0.81–1.51) 0.52
Amputation or death from PVD 0.65 (0.36–1.18) 0.15
Microvascular disease 0.75 (0.60–0.93) 0.0099
Favors Favors Log-rank RR (95% CI) intensive conventional P value
Clinical End Point0.1 1 10

TM
© 1999 Professional Postgraduate Services®
TM
© 1999 Professional Postgraduate Services®
Any diabetes-related end point 0.76 (0.62–0.92) 0.0046
Diabetes-related deaths 0.68 (0.49–0.94) 0.019
All-cause mortality 0.82 (0.63–1.08) 0.17
MI 0.79 (0.59–1.07) 0.13
Stroke 0.56 (0.35–0.89) 0.013
Peripheral vascular disease 0.51 (0.19–1.37) 0.17
Microvascular disease 0.63 (0.44–0.89) 0.0092
UKPDS: Tight Blood Pressure Control vs LessTight Control in Patients With Type 2 Diabetes
RR=relative risk.
UKPDS Group. BMJ. 1998;317:703-713.
RR for Favors Favors tight control tight less tight P
(95% CI) control control value
Clinical End Point10.1 10