Embed Size (px)
Citation preview

Thursday, 8 June 2017
Service Robots / AI 4
The force is awakening Allen Chang
Robots – On the march, Jan-2017, focused on industrial robots. We now hone in on the growingpopularity of Global Service Robots, which have the tech edge and versatility to be deployed almosteverywhere from factories to hospitals to homes.
WH Group (Initiating coverage with Outperform) 5
Pigs can fly Linda Huang
We initiate coverage of WH Group with an Outperform rating and a target price of HK$9.90 based on15x FY18E PER, the company's peak cycle valuation. WH Group's share price has been under thepressure due to CDH Investment selling pressure, a pre-IPO investor.
Shuanghui (A-Share) (Initiating coverage with Outperform) 6
Dual engine to drive growth Linda Huang
We initiate coverage of Shuanghui with an Outperform rating and a target price of Rmb28.50 based on18x FY18E PER, the stock's peak cycle valuation. Shuanghui is China's leading vertical meatprocessing company with 18.8% packaged pork and 2.7% fresh pork market share.
Korea E&C 7
Turning cautious on property market James Hong
We are turning cautious on Korea's property market and this has implications for constructioncompanies. Korean construction companies should continue to enjoy strong earnings and cash inflowfrom the domestic housing business, but pre-sale volume and profitability, a function of property prices,is likely to slow down from late 2017.
LG Electronics (Outperform) 8
Flourishing, not floundering Daniel Kim
We ascertain LGE's earnings power to be real, but vastly understated in the market. Outperform.Quarterly OP growth on YoY basis to accelerate towards year-end.
Software & Robotics 9
JUST EAT (Outperform) 10
US Semiconductors 11
China Internet 12
The Future of Japanese Tech 13
SoftBank (Outperform) 14
Taiwan Server/Networking 15
Please refer to page 50 for important disclosures and analyst certification, or on our website www.macquarie.com/research/disclosures.

TSMC (Outperform) 16
Hon Hai (Outperform) 17
China Telecom (Outperform) 18
Hikvision (A-Share) (Outperform) 19
Lenovo (Outperform) 20
Asustek Computer (Outperform) 21
KYEC (Outperform) 22
Samsung C&T (Upgrade to Outperform) 23
Hyundai E&C (Outperform) 24
Daelim Industrial (Downgrade to Neutral) 25
Hyundai Development (Downgrade to Neutral) 26
GS E&C (Underperform) 27
Brilliance China Automotive (Outperform) 28
Chongqing Changan Auto (B-Share) (Outperform) 29
Dongfeng Motor Group (Neutral) 30
Geely Automobile (Underperform) 31
Great Wall Motor Company (Outperform) 32
SAIC Motor (A-Share) (Outperform) 33
Ashoka Buildcon (Outperform) 34
BTS Growth Infrastructure Fund (Downgrade to Underperform) 35
Credit Saison (Neutral) 36
CUB (Outperform) 37
DeNA Co (Outperform) 38
Leshi Internet (A-Share) (Outperform) 39
2

Public Bank (Outperform) 40
Sekisui House (Outperform) 41
Sodick (Outperform) 42
Sumitomo Metal Mining (Neutral) 43
Macq-ro insights 44
China Department Stores 45
India financials 46
Semiconductors Tracker 47
Macquarie Commodities Comment 48
Macquarie Commodities Comment 49
3
Please refer to page 144 for important disclosures and analyst certification, or on our website
www.macquarie.com/research/disclosures.
GLOBAL
Inside
Executive summary 2
The definition of Service Robot 5
Far more than simply toys 12
Gearing up to an US$100bn market
by 2025 23
The ecosystem of Service Robots 33
Summary of related stocks 41
Taiwan Server/Networking 55
Read-across to industrial robots 56
Analyst(s) Macquarie Capital Limited Allen Chang +852 3922 1136 [email protected] Wendy Huang, CFA +852 3922 3378 [email protected] Chris Yu +86 21 2412 9024 [email protected] Hillman Chan, CFA +852 3922 3716 [email protected] Verena Jeng +852 3922 3766 [email protected] Macquarie Capital (Europe) Limited Bob Liao, CFA +44 203 037 2868 [email protected] Macquarie Capital (USA) Inc. Sarah Hindlian +1 212 231 1371 [email protected] Srini Pajjuri +1 4157625018 [email protected] Benjamin Schachter +1 212 231 0644 [email protected] Macquarie Capital Securities (Japan) Limited David Gibson, CFA +81 3 3512 7880 [email protected] Damian Thong, CFA +81 3 3512 7877 [email protected] William Montgomery, CFA +81 3 3512 7864 [email protected] George Chang +81 3 3512 7854 [email protected] Macquarie Capital Limited, Taiwan Securities Branch Jeffrey Ohlweiler +886 2 2734 [email protected] Patrick Liao +886 2 2734 7515 [email protected] Kaylin Tsai +886 2 2734 7523 [email protected] Lynn Luo +886 227347534 [email protected] Louis Cheng, CFA +886 2 2734 7526 [email protected]
7 June 2017
Service Robots / AI The force is awakening Robots – On the march, Jan-2017, focused on industrial robots. We now hone
in on the growing popularity of Global Service Robots, which have the tech edge
and versatility to be deployed almost everywhere from factories to hospitals to
homes. We see an ecosystem building around: 1) hardware manufacturing
(i.e. robot components and computing chips); 2) AI development; and,
3) server/networking builds to facilitate Service Robots as part of IoT in the
connected world.
AI capability to boost computing demand
AI-based (Artificial Intelligence) Service Robots are able to interact with humans
and other machines appropriately. We have seen tech names putting efforts into
this area, including “machine learning”, “natural user interface”, “machine-
to-machine”, “cloud computing”, and “cyber security”. iFlytek (14%-owned
by China Mobile) has been focusing on natural language processing, which
allows robots to come to accurate conclusions based on a person’s
social/emotional state. “High-performance ICs” and “Datacentres” are the
other two areas we expect to enjoy strong growth in the coming years on the
massive computing demand to power Service Robots’ rising cognitive abilities.
We expect TSMC to benefit from both advanced nodes (for high-performance
computing) and mature nodes (for connection).
Global market up to US$100bn by 2025E
We forecast the Service Robot market size could be US$100bn by 2025E
(Fig 43), or a 32% CAGR in 2017-25E, with shipments seeing a 43% CAGR to
over 142m units by 2025E on the back of: 1) significant demand for various
applications including logistics, food delivery, agriculture, reception, medical,
household chores, etc.; 2) a comprehensive supply chain; and, 3) government
support (i.e. China’s robot industry development plan). We expect 57% of total
Service Robot sales to come from professional applications in 2025E on higher
ASP and broader growth opportunities, with the other 43% from personal
applications. Shorter term, we expect the market size to reach US$17bn in 2yrs,
US$42bn in 5yrs, compared to the current US$11bn.
Comprehensive functions beyond toys
By professional sectors, we see a large market potential, given higher
technological feasibility (logistics, medical, reception and agriculture to account
for a combined 87% of professional robots sales in 2025E) or lower base (food
delivery). Hikvision has already deployed over 300 logistics robots (video link)
in a Chinese express company’s warehouse, processing up to 20k parcels <5kg
through autonomous navigation. Splunk and Symantec (covered by Sarah
Hindlian) are well positioned in software. Just Eat (covered by Bob Liao) has
already commercially deployed food-delivery robots. We also expect more high-
end models capable of complex missions in personal robots used for domestic
tasks/entertainment with better connectivity and interaction skills.
Key Beneficiaries
Robot makers: Hon Hai, Hikvision, Siasun, Dahua, Asustek, SoftBank, Amazon,
Sony; Semi: TSMC, KYEC, Nvidia, Avago, Xlinx, AMD, Intel; Servers/
networking: ZTE, Lenovo, Inventec, Accton, Alpha Networks; Cloud
computing: Baidu, Alibaba, Tencent, China Telecom, Apple, Alphabet,
Microsoft; Components: Inovance, Estun, STEP, Nidec; Service: Just Eat,
iFlytek, China Mobile, HonHai, Cheetah Mobile, Panasonic, Splunk, Symantec.
4

Please refer to page 30 for important disclosures and analyst certification, or on our website www.macquarie.com/research/disclosures.
HONG KONG
288 HK Outperform
Price (at 13:50, 06 Jun 2017 GMT) HK$7.58
Valuation HK$ 9.90 - PER
12-month target HK$ 9.90
Upside/Downside % +30.6
12-month TSR % +34.2
Volatility Index Low/Medium
GICS sector Food, Beverage & Tobacco
Market cap HK$m 111,055
Market cap US$m 14,253
Free float % 51
30-day avg turnover US$m 85.8
Number shares on issue m 14,651
Investment fundamentals Year end 31 Dec 2016A 2017E 2018E 2019E
Revenue m 21,534 21,408 22,354 23,596 EBIT m 1,665 1,826 2,041 2,154 EBIT growth % 6.9 9.7 11.8 5.6 Reported profit m 1,036 1,094 1,242 1,316 Adjusted profit m 1,036 1,094 1,242 1,316 EPS rep ¢ 7.1 7.5 8.5 9.0 EPS rep growth % 31.8 5.5 13.6 5.9 EPS adj ¢ 7.1 7.5 8.5 9.0 EPS adj growth % 31.8 5.5 13.6 5.9 PER rep x 13.8 13.0 11.5 10.8 PER adj x 13.8 13.0 11.5 10.8 Total DPS ¢ 3.4 3.5 4.0 4.2 Total div yield % 3.4 3.6 4.1 4.4 ROA % 11.9 13.5 14.4 14.0 ROE % 17.2 16.3 16.3 15.3 EV/EBITDA x 7.7 7.1 6.4 6.1 Net debt/equity % 24.7 11.1 -2.3 -12.0 P/BV x 2.3 2.0 1.8 1.6
Source: FactSet, Macquarie Research, June 2017
(all figures in USD unless noted, TP in HKD)
Analyst(s) Linda Huang, CFA +852 3922 4068 [email protected] Sunny Chow +852 3922 3768 [email protected]
7 June 2017 Macquarie Capital Limited
WH Group Pigs can fly We initiate coverage of WH Group with an Outperform rating and a target price
of HK$9.90 based on 15x FY18E PER, the company’s peak cycle valuation. WH
Group’s share price has been under the pressure due to CDH Investment selling
pressure, a pre-IPO investor. Post CDH’s recent divestment its stake is down to
3.24% and we believe the share price overhang has been removed.
WH Group’s China operations should rebound for the rest of the year and should
benefit long term from China’s consumption upgrading trend. The Smithfield
operation remains on the right track to deliver efficiency improvements. We
believe it is a good time to accumulate shares given its long-term growth outlook.
We expect WH Group net profit to grow by 5.6% and 13.6% in 2017 and 2018,
respectively. In addition to WH Group, we also initiate coverage of Shuanghui
(000895 CH, Rmb22.11, OP, TP: Rmb28.50) with an Outperform rating (LINK).
China growth drivers: premiumization, declining hog prices
WH Group’s China operations entity, Shuanghui, continues to promote low-
temperature products to catch up with the rising consumption upgrading trend.
We project low temperature product revenue contribution to the downstream
packaged meat business should pick up from 38% last year to 41% in 2017.
Meanwhile, margins are poised to expand at Shuanghui since China hog prices
have come down from a peak of Rmb21/kg in May 2016 to Rmb13/kg now. Its
fresh pork business should benefit from both volume and margin expansion. We
forecast the China operation will grow by 5.0% in 2017 to US$904m, accounting
for 43% of group operating profit.
US market riding efficiency improvements
The company kicked off its restructuring in 2015 and generated a rewarding
outcome as the US operating profit margin improved from 6.7% in 2015 to 8.4%
in 2016. The restructuring is ongoing as the company consolidates the brand
portfolio, while the SAP integration benefit should fully emerge in 2018. We
expect US OPM will further improve to 9.7% in 2018. For its fresh pork business,
profit growth should normalize from 2017 given that the China/US pork price gap
is narrowing.
Strong cash generation to lower gearing, higher payout and M&A
WH Group’s balance sheet keeps improving and we forecast it will see net cash
in 2018. This helps interest savings by US$50m/US$25m in 2017/2018,
respectively, contributing 2.8%/1.2% incremental profit growth in these two
years. The continuous strong cash generation ability offers dividend payout
upside while the cash could serve as the basis for future M&A. We expect it can
maintain a 50% payout, implying 4% dividend yield. Management will likely still
look for M&A opportunities to further strengthen its leading position in the global
animal protein market and ride emerging markets’ consumption upgrading trend.
The strong cash position can serve well as non-organic growth in the long run.
Risks
Food safety scandals; hog-related diseases; a US pork import ban into China.
5

Please refer to page 19 for important disclosures and analyst certification, or on our website www.macquarie.com/research/disclosures.
CHINA
000895 CH Outperform
Price (at 13:50, 06 Jun 2017 GMT) Rmb22.11
Valuation Rmb 28.50 - PER
12-month target Rmb 28.50
Upside/Downside % +28.9
12-month TSR % +35.0
GICS sector Food, Beverage & Tobacco
Market cap Rmbm
72,953
Market cap US$m 10,703
Free float % 22
30-day avg turnover US$m 34.6
Number shares on issue m 3,300
Investment fundamentals Year end 31 Dec 2016A 2017E 2018E 2019E
Revenue m 51,822 51,397 53,083 54,633 EBIT m 5,592 6,146 6,562 6,594 EBIT growth % 4.3 9.9 6.8 0.5 Reported profit m 4,405 4,810 5,217 5,349 Adjusted profit m 4,405 4,810 5,217 5,349 EPS rep Rmb 1.33 1.46 1.58 1.62 EPS rep growth % -13.7 9.2 8.5 2.5 EPS adj Rmb 1.33 1.46 1.58 1.62 EPS adj growth % -13.7 9.2 8.5 2.5 PER rep x 16.6 15.2 14.0 13.6 PER adj x 16.6 15.2 14.0 13.6 Total DPS Rmb 2.10 1.36 1.47 1.51 Total div yield % 9.5 6.1 6.7 6.8 ROA % 25.3 28.5 29.5 28.2 ROE % 28.4 32.7 33.3 32.5 EV/EBITDA x 10.8 10.0 9.4 9.3 Net debt/equity % -14.9 -17.4 -24.3 -24.6 P/BV x 5.1 4.8 4.5 4.3
Source: FactSet, Macquarie Research, June 2017
(all figures in Rmb unless noted)
Analyst(s) Linda Huang, CFA +852 3922 4068 [email protected] Sunny Chow +852 3922 3768 [email protected]
7 June 2017 Macquarie Capital Limited
Shuanghui (A-Share) Dual engine to drive growth We initiate coverage of Shuanghui with an Outperform rating and a target price
of Rmb28.50 based on 18x FY18E PER, the stock’s peak cycle valuation.
Shuanghui is China’s leading vertical meat processing company with 18.8%
packaged pork and 2.7% fresh pork market share. Shuanghui will accelerate its
earnings growth this year with fresh pork volume growth from lower pork prices,
margin expansion from the hog price correction and the long term consumption
upgrading trend.
Global meat processor companies valuation currently averages at 14x PER with
low-mid single digit profit growth (by taking out outliers), 20-25% ROE and 1.0-
1.5% dividend yield. Shuanghui stands out with 9.2% YoY FY17E net profit
growth, ~33% ROE and a 6% dividend yield. We strongly believe its high
valuation is justified and the market will rerate the stock.
Fresh pork benefits from volume growth and margin expansion
Based on MQ proprietary pork supply and demand model (p.13, Fig 26), we
expect China pork production to grow 2.0% YoY from 3.2%/3.4% decline
respectively in 205/2016 due to hog farmers’ healthy profit margin and rising hog
stock. China hog prices have peaked out at Rmb21/kg in May 2016 to Rmb13/kg
now. Shuanghui can benefit from the lower pork price as this can stimulate more
consumption demand. Shuanghui recorded 1.4% fresh pork volume growth in
1Q17 and it can achieve full year +10.2% YoY volume growth, implying strong
volume growth recovery for the rest of the year. Margin wise, given that pork
prices usually lag behind the hog price trend, we expect the company is in the
sweet spot with margin expansion. We project fresh pork GPM to expand 1.6ppt
YoY to 7% this year.
Premiumization is the right direction, though it takes time
In light of rising living standard and disposal income, Shuanghui concentrates on
low temperature package meat development and we expect a revenue
contribution from the downstream package meat business to pick up from 38%
last year to 41%. The company has a unique advantage of leveraging the
China/US pork price gap by importing US pork into China as the input cost.
Since WH Group acquired Smithfield in 2013, US imported pork as the raw
materials input has risen from 3% in 2014 to 16% in 2016. We believe this
effectively stabilizes the company’s downstream meat GPM even though the hog
price skyrocketed in 2016.
High dividend payout from the solid cash position and FCF
Shuanghui has very lean A/R turnover days less than one day, while inventory
turnover and A/P turnovers remain steady at ~30 days and ~20 days
respectively. We project the FCF yield at 6% and 8% for 2017/2018. Due to the
strong cash position and cash generation ability, the company has been
adopting the high payout policy. While the company has not committed a payout
ratio, we believe a 90% payout ratio is an achievable target. This implies a 6%
dividend yield.
Risks
Foods safety scandal; hog related disease; US pork import ban into China.
6

Please refer to page 27 for important disclosures and analyst certification, or on our website
www.macquarie.com/research/disclosures.
KOREA
Annual pre-sale volume
Source: REPS, Company data, Macquarie Research, June 2017
Housing exposure (2018E)
Source: Company data, Macquarie Research, June 2017
Stocks for action Market cap TP
new TP
old
TSR
Company Ticker Rec (US$bn) (won) (won) (%)
Samsung Engineering
028050 OP 2.2 17k 17k 37.1
Samsung C&T 028260 OP 24.2 169k 165k 18.2
Hyundai E&C 000720 OP 4.7 53k 54k 13.1
Daelim Industrial
000210 N 2.8 100k 105k 9.9
HDC 012630 N 3.3 52k 70k 3.8
GS E&C 006360 UP 1.9 27k 24k -11.5
Source: Macquarie Research, June 2017
Changes in estimates
Ticker Chg in 17E EPS (%)
Chg in 18E EPS (%)
Samsung Engineering 028050 0.0 0.0
Samsung C&T 028260 -22.5 -19.4
Hyundai E&C 000720 -9.3 -4.1
Daelim Industrial 000210 31.3 -10.3
HDC 012630 -14.2 -31.0
GS E&C 006360 nmf 30.0
Source: Company data, Macquarie Research, June 2017
Samsung C&T 7 Hyundai E&C 11 Daelim Industrial 15 Hyundai Development 19 GS E&C 23
Analyst(s) James Hong +82 2 3705 8661 [email protected]
7 June 2017 Macquarie Securities Korea Limited
Korea E&C Turning cautious on property market Conclusion
We are turning cautious on Korea’s property market and this has implications
for construction companies. Korean construction companies should continue
to enjoy strong earnings and cash inflow from the domestic housing business,
but pre-sale volume and profitability, a function of property prices, is likely to
slow down from late 2017.
We downgrade Hyundai Development and Daelim Industrial to Neutral and
reiterate our Underperform rating on GS E&C. At the same time, we are
upgrading Samsung C&T to Outperform in view of its investment holdings.
Impact
We turn cautious on property market. The Moon administration is turning
more aggressive in market intervention rather than just housing welfare. It is
introducing debt service ratio (DSR) requirements, taking into account not
only collateral (such LTV and DTI, which are already taken into account) but
also other personal lending. This may hurt market sentiment, but not so much
fundamentals, as LTV and DTI are already low at 50%. Fundamentally, we
see a threat to the rental market and reconstruction, which we believe have
been the main drivers for structural changes in Korea’s property market.
Rental market threatened by public rental housing supply and taxes. The
new government is considering a bigger role in public housing: it plans to
increase annual construction of rental housing units from an annual average
of 80,000 over 2011-2015 to 130,000 by 2018. This should lower rental yield.
Furthermore, a temporary waiver on taxes levied on small-scale rental
business operators will expire at the end of 2018.
Reconstruction to peak out in 2017. We believe the current strength in the
Seoul metropolitan property market is due solely to one factor: developers
advancing their reconstruction activity in a bid to avoid taxes on excess gains
that are likely to be levied from 2018. Punitive taxes on reconstruction can
incentivize redevelopment or remodelling, where overall size of order to
construction companies is much smaller.
Construction companies remain bullish on Korean property market.
Managements of construction companies remain bullish as their underlying
profitability in housing business is still far above their long-term average. With
strong cash inflow expected till 2018 (as a result of successful pre-sale till
2016), construction companies are investing back into the housing business,
securing larger land banks. This, we believe, will cause a bigger downturn
once property prices start to contract, dragging down sustainable ROEs.
Outlook
We downgrade our ratings on construction companies with exposure to
housing—Hyundai Development and Daelim Industrial—to Neutral. We
cut volume and margin assumptions for their housing business order intake.
We are keeping Underperform rating on GS E&C, which has room to
disappoint from both domestic housing and overseas plant businesses.
We prefer Samsung Engineering and Samsung C&T. We upgrade
Samsung C&T to Outperform on investment holding value. We maintain
Outperform ratings on Samsung Engineering and Hyundai E&C.
-40%
-20%
0%
20%
40%
60%
0
100
200
300
400
500
600
200
8
200
9
201
0
2011
201
2
201
3
201
4
201
5
201
6
201
7E
201
8E
('000 units)
Seoul-metopolitan Provincial
YoY change (RHS)
53%
41%
31%
17%
6%
0%0%
10%
20%
30%
40%
50%
60%
HDev GS Daelim HEC SC&T SEng
(% revenue)
7

Please refer to page 14 for important disclosures and analyst certification, or on our website
www.macquarie.com/research/disclosures.
KOREA
066570 KS Outperform
Price (at 06:41, 07 Jun 2017 GMT) Won85,300
Valuation Won 100,000 - Price to Book
12-month target Won 100,000
Upside/Downside % +17.2
12-month TSR % +17.8
Volatility Index Medium
GICS sector Consumer Durables & Apparel
Market cap Wonbn
15,422
Market cap US$m 14,115
Free float % 66
30-day avg turnover US$m 68.1
Number shares on issue m 180.8
Investment fundamentals Year end 31 Dec 2016A 2017E 2018E 2019E
Revenue bn 55,367 58,702 60,511 64,302 EBIT bn 1,338 2,837 3,047 3,169 EBIT growth % 12.2 112.1 7.4 4.0 Reported profit bn 126 1,805 1,955 1,971 Adjusted profit bn 77 1,741 1,761 1,650 EPS rep Won 699 9,984 10,810 10,897 EPS rep growth % -50.0 1,327.7 8.3 0.8 EPS adj Won 426 9,628 9,736 9,123 EPS adj growth % -68.2 2,160.6 1.1 -6.3 PER rep x 122.0 8.5 7.9 7.8 PER adj x 200.3 8.9 8.8 9.4 Total DPS Won 400 500 600 600 Total div yield % 0.5 0.6 0.7 0.7 ROA % 3.6 7.4 7.6 7.3 ROE % 0.7 13.9 12.7 10.8 EV/EBITDA x 5.4 4.1 4.1 4.1 Net debt/equity % 42.3 21.8 14.0 11.2 P/BV x 1.3 1.2 1.1 1.0
066570 KS rel KOSPI performance, & rec history
Note: Recommendation timeline - if not a continuous line, then there was no Macquarie coverage at the time or there was an embargo period.
Source: FactSet, Macquarie Research, June 2017
(all figures in Won unless noted, TP in KRW)
Analyst(s) Daniel Kim +82 2 3705 8641 [email protected] Ryan Kim +82 2 3705 8771 [email protected]
7 June 2017 Macquarie Securities Korea Limited
LG Electronics Flourishing, not floundering Event
We ascertain LGE’s earnings power to be real, but vastly understated in the
market. Outperform.
Impact
Quarterly OP growth on YoY basis to accelerate towards year-end. We
estimate OP will rise 33%YoY to Won779bn in 2Q17, despite the likely bigger
losses in Handset division. Higher losses in Handset, in our view, are not
alarming, as the company made a strategic decision to spend on marketing.
3Q17 OP, we estimate, will be more than 2x the year-ago period’s.
Home Appliance: moving up the value ladder + globally synchronized
economic recovery. LGE’s premium brand strategy seems to be paying off,
while the module approach helps keep costs low. Its new products (electricity
dryer and air-purifier) are well-received by local consumers, who are
increasingly aware of fine-dust and air quality issues. LGE’s household
appliances command better margins than global peers’ (Electrolux and
Whirlpool).
Emerged as the leader in premium TV segment. We expect LGE to grow
the proportion of premium models—OLEDs and UHD TVs—from 50% in 2016
to 70% in 2017. We believe the TV segment’s annual profit of over Won1.0tr
is sustainable in light of rising high-end TV sales and the likely stabilizing, if
not falling, LCD TV panel prices. Notably, Consumer Report in the US rated
eight of LG’s OLED TV models among the top 10 TVs.
Earnings growth story is beyond 2017. The Handset division targets to cut
losses by Won1.0tr this year, thanks not only to the absence of one-off
expenses but also lower overhead cost. More importantly, sales of premium
phones (G and V series) should normalize from 2018, improving the
prospects of a turnaround. Moreover, VC (vehicle component) division should
have critical mass next year big enough to cover its investment burden. That
should set its earnings growth story well on course to continue in 2018.
Earnings and target price revision
We have fine-tuned our above-consensus 2017/18 OP forecasts.
No change in target price of Won100,000, or 1.2x 2018E book-value.
Price catalyst
12-month price target: Won100,000 based on a Price to Book methodology.
Catalyst: 2Q17 earnings release. Potential turnaround in Handset division
Action and recommendation
Despite the strong rally year to date (68% versus KOSPI’s 17%), we see more
upside to the share price in light of the prevailing scepticism in the market.
LGE’s PE of 9x looks attractive for its historic trading range and its global
peers. Based on SOTP (sum-of-the-part) valuation, LGE looks more under-
valued, even if we assign zero value to its MC and VC divisions and gives 12x
PE multiple to HA/HE profits. SOTP-based fair value suggests Won130,000.
Outperform.
8

Please refer to page 28 for important disclosures and analyst certification, or on our website
www.macquarie.com/research/disclosures.
NORTH AMERICA
Inside
Robotics Rising – $100bn CY25e TAM 2
Microsoft Executive Summary,
Valuation, Risks and Estimates 7
Splunk Executive Summary,
Valuation, Risks and Estimates 14
Symantec Executive Summary,
Valuation, Risks and Estimates 21
Analyst(s) Sarah Hindlian +1 212 231 1371 [email protected] Frederick Havemeyer +1 212 231 1830 [email protected] David Yueh +1 212 231 8079 [email protected]
7 June 2017 Macquarie Capital (USA) Inc.
Software & Robotics Robotics Rising – $100bn CY25e TAM In conjunction with our colleagues in Asia who are evaluating a growing
trend of robotics usage and mining through the emerging trend of Service
Robots, we examine the potential impact of rising demand for this
technology on software spending and the companies within our coverage
that stand to benefit. In our broader Macquarie thematic report on the
Service Robot industry, we forecast it will represent a very large and
difficult to ignore ~$100bn TAM by CY’25e, with a 32% CY’17-CY’25 CAGR.
Service Robots Moving Beyond Factory Floors – Generating Data, More Robust AI Software & Services
Compared to Industrial Robots, Service Robots have embedded AI (Artificial
Intelligence) to enable reactions according to the environment or users’
behaviours. Service Robots are also required to understand users’ preferences
and expectations, accumulating the data to facilitate capabilities through time
(aka machine learning). Robotics and AI have long been synonymous and the
focus of innumerable science fiction stories and hyperbolic reports in the media,
and robots are not a new phenomenon. However, Service Robots are
increasingly more than just clumsy machines operating in production lines. We
believe that the progressively substantial data being generated by robots
enables software vendors to provide products and services that leverage this
data to generate value by optimizing and orchestrating operations, and
improving artificial intelligence models.
Artificial Intelligence, IoT and Cloud-Scale Data Analytics
AI software is a foundational technology for Service Robots, enabling a wide
range of capabilities from understanding human speech to recognizing images.
Unlike other robots, Service Bots require advanced software to operate. Like
other robots, Service Bots will increasingly be generating data that needs to be
analyzed and interpreted. We believe that the expanding Service Robot
ecosystem is best viewed as a fundamental component of the larger IoT
landscape as internet-connected Service Robots interface with the cloud to
benefit from cloud-scale AI capabilities, while we expect that the vast quantities
of data generated by Service Robots will require large scale big data ingestion
and analytics capabilities.
Picks for the Rise of the Machines – MSFT, SPLK & SYMC
We consider the rise of robots to be tied to three investment areas: 1) bots will
create more data to be used for better software applications which will require
scale cloud services and robust data models; 2) bots are likely to need
sophisticated software, which we expect hardware vendors to have to develop;
and 3) bots will require more security to prevent against attacks. We note that
Microsoft (MSFT US, US$72.28, Neutral, TP: US$66.00) is well positioned to
benefit with its portfolio of AI services, IoT device management, data analytics,
and cloud-based ML models. We expect Splunk (SPLK US, US$62.56,
Outperform, TP: US$74.00) to benefit from increasing quantities of machine data
generated by fleets of robots that require data aggregation, correlation and
analysis. We think the demand for security for service robots and IoT devices in
general should benefit Symantec (SYMC US, US$30.07, Outperform, TP:
US$36.00) given the company’s robust security portfolio, which includes a suite
of customizable embedded IoT security solutions.
9

Please refer to page 7 for important disclosures and analyst certification, or on our website
www.macquarie.com/research/disclosures.
UNITED KINGDOM
JE/ LN Outperform
Price (at 00:39, 03 Jun 2017 GMT) £6.70
Valuation £ 7.30 - DCF (WACC 8.5%, beta 1.2, ERP 5.5%, RFR 2.0%, TGR 2.5%)
12-month target £ 7.30
12-month TSR % +9.0
GICS sector Software & Services
Market cap £m 4,548
Market cap US$m 5,867
30-day avg turnover £m 25.6
Number shares on issue m 679.3
Investment fundamentals Year end 31 Dec 2016A 2017E 2018E 2019E
Revenue m 375.7 494.9 586.0 673.6 EBITDA m 115.3 163.8 223.6 280.4 EBITDA growth % 93.1 42.1 36.5 25.4 EPS adj £ 0.15 0.17 0.25 0.26 PER adj x 45.5 39.0 27.0 25.4 EV/EBITDA x 38.3 27.8 20.4 16.3
JE/ LN vs FTSE 100, & rec history
Note: Recommendation timeline - if not a continuous line, then there was no Macquarie coverage at the time or there was an embargo period.
Source: FactSet, Macquarie Research, June 2017
(all figures in GBP unless noted)
Analyst(s) Macquarie Capital (Europe) Limited Bob Liao, CFA +44 203 037 2868 [email protected] Macquarie Capital Limited Allen Chang +852 3922 1136 [email protected] Chris Yu +86 21 2412 9024 [email protected]
7 June 2017
JUST EAT I, Deliver Event
We are optimistic on delivery robots. Delivery robots are already commercially
deployed, they are technically capable and practical and they are expected to
be lower cost and more efficient that human delivery. We forecast global
delivery robot shipments rise from 600 in 2017 to 185,900 shipments in 2022.
We believe adoption of robot delivery services would increase Just Eat’s
market share, profitability and addressable market.
Impact
Delivery robots could be economically disruptive. Starship, a leading delivery
robot provider, is targeting a price of only £1, €1 or €1 per delivery, well below
the cost of human delivery services. In addition, Starship estimates that a van
with eight robots can more than double traditional delivery capacity.
We believe such economics could allow Just Eat to level the playing field
against its competitors with human logistics networks. Just Eat could
eventually match or better competitors’ human delivery services with efficient,
integrated and cost competitive robot delivery services.
We believe low cost robot delivery services should also increase Just Eat’s
margins with branded and chain restaurants and allow it to target previously
uneconomic customers, thereby expanding its addressable market.
Delivery robots are already being rolled out. Just Eat’s robot delivery service
has progressed beyond trials and the company now has tens of robots in
operation with plans to roll out across Britain.
Robots from Starship, a leading supplier used by Just Eat, have driven
132,000 miles and encountered over three million people without incident.
Delivery robots are backed by impressive individuals and companies. Starship
was founded by Skype co-founders Ahti Heinla and Janus Friis in 2014 and
Mercedes Benz has invested $17m in the company.
Earnings and target price revision
We raise our long term forecasts, DCF valuation and target price to £7.30
from £6.70.
Price catalyst
12-month price target: £7.30 based on a DCF methodology.
Catalyst: Interim results on 27 July
Action and recommendation
Digital takeaway is the most underpenetrated of all vertical marketplaces that
we cover and Just Eat is the clear market leader, in our view, in many of the
most attractive takeaway markets in the world. As a result, we expect the
company to readily sustain double digit revenue growth and higher profit
growth over the next few years. We reiterate our Outperform
recommendation.
10

Please refer to page 3 for important disclosures and analyst certification, or on our website
www.macquarie.com/research/disclosures.
UNITED STATES
Analyst(s) Srini Pajjuri +1 4157625018 [email protected]
7 June 2017 Macquarie Capital (USA) Inc.
US Semiconductors Implications from Service Robot Growth Nearly 150m unit opportunity by 2025
Macquarie’s global technology team published a detailed report on the emerging
trend of Service Robots (see Service Robots – The Force is Awakening). We
expect the service robot market size to approach 150m units by 2025, which
should drive incremental demand for the semiconductor industry. While robot
unit growth will help IC demand, the ecosystem and infrastructure needed to
facilitate these robots is another driver. In particular, we believe semiconductor
components that enable artificial intelligence (AI/ML), connectivity, and sensing
are well positioned. AI/ML is already driving strong growth at NVIDIA, and we
expect AMD, Broadcom, Intel, and Xilinx to also benefit from this trend in the
coming years.
Machine Learning is compute-intensive
AI-based Service Robots with cognitive capabilities could make it possible to
automate many tasks that were long regarded as impossible for machines to
perform. Initial focus for the industry is on training neural networking models that
enable cognitive capability in machines. Deep learning, which is an advanced
form of machine learning, is highly compute-intensive and is already driving
significant innovation in the semiconductor market. Graphics processing units
(GPUs) with their massively parallel computing capability currently dominate
deep learning applications on the training front. We expect GPUs to maintain
their lead in training AI models while FPGAs, custom ASICs, and CPUs appear
better suited for on-field inferencing tasks.
Analog, sensing, and connectivity ICs will also benefit
Similar to today’s consumer drones, service robots will have the ability to sense,
perceive, communicate, move (or fly), and control. In most cases, these
machines will be untethered, requiring a portable power source. We expect IC
vendors that supply 5G, WiFi, image processing, sensing, motor control, and
battery management components to be the key beneficiaries. While the Semi
content will likely be lower than that of a self-driving car, the Service Robot unit
opportunity could be much bigger given their applicability across industries
including medical, agriculture, transportation, military, and entertainment.
NVDA, AVGO, INTC, XLNX, and AMD are key beneficiaries
The service robot eco-system is coming together with advances in machine
learning software and robotics engineering. Initial investments are focused on
training models that perform human-like tasks (such as facial and voice
recognition). The AI/ML semiconductor market is still relatively small today but
NVIDIA’s early success shows that IC companies with right exposure could see
a significant benefit. We expect GPUs to dominate the training side of machine
learning in the near term. Once the models are trained, the compute intensity
needed to “infer” from data goes down significantly. We believe FPGAs, CPUs,
and custom ASICs are better suited for inferencing tasks as a result. While
NVDA should continue to benefit from this trend, our top pick in US Semis is
AVGO due to its dominant franchises in connectivity and cloud infrastructure,
growing exposure toAdvanced Micro Devices AI/ML, and attractive valuation.
11

Please refer to page 3 for important disclosures and analyst certification, or on our website
www.macquarie.com/research/disclosures.
CHINA/UNITED STATES
Baidu’s driverless car
Source: Company data, June 2017
Alibaba’s AI applications
Source: Company data, June 2017
Companies mentioned:
Baidu, BIDU US, US$187, N, TP: US$189
Alibaba, BABA US, US$125, OP, TP: US$142
Tencent, 700 HK, HK$274, OP, TP: HK$304
Cheetah Mobile, CMCM US, US$12, OP, TP: US$11.5
Kingsoft, 3888 HK, HK$21, OP, TP: HK$28.5
Softbank, 9984 JP. ¥8,949, OP, TP: ¥10,900
Analyst(s) Wendy Huang, CFA +852 3922 3378 [email protected] Hillman Chan, CFA +852 3922 3716 [email protected] Joe Yu +852 3922 1160 [email protected] Ivy Luo +852 3922 1507 [email protected]
7 June 2017 Macquarie Capital Limited
China Internet Embracing AI and robotics Baidu focuses its future on AI
Chinese leader in the AI space. Baidu, as China’s largest search engine, has
seen its investment in AI accelerate since hiring Dr. Lu Qi as the new Chief
Operating Officer in Jan 2017. It currently operates four research labs
(Augmented Reality, AI, Deep Learning, and Big Data) across Beijing and Silicon
Valley. Some of its AI technology, such as speed and image recognition, is
world-leading. The AI has been applied to Search, Duer (similar to Siri),
Autonomous Driving, Cloud and other products. Driverless cars are
approaching the commercialization stage. Among the AI-enabled products
within Baidu, driverless cars present the best growth and commercialization
opportunities. It has merged its L3 (eyes off) and L4 (mind off) autonomous
driving business into a single group (IDG) which is now led by Lu Qi. Baidu
launched the “Apollo Project” in April 2017 to open its autonomous driving
platforms (hardware + software + cloud) to car manufacturers to develop
autonomous vehicles. Baidu has already partnered with local OEMs incl. Cherry,
BYD and BAIC Motor. In terms of development timeline, Baidu plans to share its
technology for simple urban road conditions by the end of 2017, with the ultimate
goal of being fully autonomous on highways and open city roads by 2020.
Alibaba embeds AI across businesses
Empowering e-Commerce and cloud. Alibaba is building up AI on large-scale
computing power and data, and is exploring the potential to embed AI into
various business lines. For its core e-commerce, Alibaba is applying AI
algorithms to shopping experience, to upgrade supply chain management, and
to improve logistics efficiency; Alibaba Cloud is introducing AI services to
healthcare and manufacturing companies; and Alibaba’s affiliate Ant Financial is
working on face-recognition technology to secure e-payments. Cooperation
with business partners. In addition, Ant Financial acquired EyeVerify in Sep
2015 for its biometric authentication technology. EyeVerify checks identities
through eye-vein patterns and creates digital eye print IDs. Alibaba has also
established Alibaba Robotics, a joint venture with SoftBank, to operate the
Pepper robot business in China. Softbank has sold 10,000 Pepper robots in the
Japanese market. In China, Pepper will be powered by Alibaba’s YunOS
operating system and will help scan traveller ID cards and print boarding passes.
Tencent playing catch-up on AI
Boosting AI lab and R&D capabilities. Among BAT, Tencent started relatively
late in the field of AI. But it has been boosting its R&D talents since 2016.
Tencent recently opened an artificial intelligence research facility in Seattle, US,
to be led by former Microsoft scientist Yu Dong. This will strengthen its AI
capabilities in addition to the existing AI lab of about 50+ researchers and 200+
engineers in Shenzhen. Voice, AI open source and cloud collaboration.
Tencent launched its Alexa-like AI voice assistant Dingdang in Apr 2017.
Tencent will integrate Dingdang into its apps and ecosystem with services
including weather, news, music and LBS. Further, Tencent plans to open source
its AI computing platform called Angel with a focus on machine learning
techniques. Tencent applies them internally in areas such as video streaming
and social ads. In terms of Tencent Cloud, its offering comes with AI services
including face detection and optical character recognition, and Tencent recently
adopted NVIDIA Tesla for AI cloud computing.
Artificial Intelligence Algorithms
Smart Product Search and
Recommendation
Smart Customer
Service - Ali Assistant
Pervasive Personalization
Smart Supply Chain
Smart Logistics
12

Please refer to page 9 for important disclosures and analyst certification, or on our website
www.macquarie.com/research/disclosures.
JAPAN
Hitachi’s EMIEW3 customer service / hospitality robot
Source: Hitachi, June 2017
Honda’s Miimo lawn mower
Source: Honda, June 2017
The Future of Japanese Tech - and drones:
A largely untapped opportunity (11 Aug 2016)
The Future of Japanese Tech - Japan’s
leadership in Energy Storage (17 Mar 2016)
Analyst(s) Macquarie Capital Securities (Japan) Limited Damian Thong, CFA +81 3 3512 7877 [email protected] William Montgomery, CFA +81 3 3512 7864 [email protected] David Gibson, CFA +81 3 3512 7880 [email protected] George Chang +81 3 3512 7854 [email protected] Macquarie Capital Limited Allen Chang +852 3922 1136 [email protected]
7 June 2017
The Future of Japanese Tech Service robot opportunity is still latent Conclusion
Japan’s service robot market has yet to meet the hope and hype of the past
two decades, despite extensive work done in academia and at companies.
But a combination of new innovations and growing unmet need (e.g. in
logistics and infrastructure inspection) may yet drive a breakthrough. The
growth of the market may be spurred by the entry of foreign firms.
Impact
Still a latent opportunity: Back in 2013, METI/NEDO projected that Japan’s
domestic service robot market would grow from ¥60bn in 2011 to ¥373.3bn in
2015, ¥1,024.1bn in 2020 and ¥2,646.2bn in 2025. Thus far, this seems over-
optimistic. Even the home-use vacuum cleaning robot amounts to only
<¥20bn/year now. High-profile hospitality robots like Toshiba’s trilingual Junko
Chihira, Hitachi’s EMIEW3 (being tested at Haneda Airport), and Softbank’s
Pepper are mainly used for public relations, with novelty value but limited
commercial impact – though Panasonic’s HOSPI does try to strike a balance
between novelty and usefulness (in the transporting of items in hospitals).
Consumer-oriented service robot market to expand: iRobot suggests that
the vacuum cleaner market is only 1/5th penetrated by robotic products. We
expect the service robot market to grow in tandem with the development of
the Internet-of-Things. Highlighting the importance of Japan – the world’s
leading robotic vacuum cleaner producer iRobot launched its Japan direct-
sales operation in April 2017 by absorbing the assets of its distributor.
Other major opportunities are likely to be in “near-industrial” and
labour-saving applications. These include logistics/ecommerce fulfilment,
infrastructure maintenance, and security. Examples include Hitachi’s Racrew
shelf-moving robot (which has orders e.g. from MonotaRO) and Alsok’s
Reborg-X security robot. Such robots address the needs created by Japan’s
growing labour shortages, which are likely to be aggravated by a 27%
shrinkage of the working-age population over the next 30 years.
There will also be growing deployment of robotic devices in healthcare
settings. Cyberdyne’s exoskeleton systems, while not strictly speaking
robots, use comparable technology to help health care professionals with load
carrying, and to provide patients with therapeutic benefit. The PARO
therapeutic robot seal has been marketed globally to nursing homes.
Ongoing policy support: The Japanese government has not stopped trying
to spur innovation and commercialisation of service robots. In 2015, METI
released a “New Robot Strategy”; a key tenet is that “society and structure
must undergo a transformation to take full advantage of robots” to create a
“robot barrier-free society”. Supportive factors would include technological
advances (e.g. better sensors, AI), standardisation and regulatory changes.
Thematic relevance: We do not expect Japan’s big tech conglomerates to
visibly benefit from service robots in the next 3-5 years, but the theme is likely
to be increasingly prominent at many firms – e.g. at Panasonic (6752 JP,
¥1,471, Outperform, TP: ¥1,580) and its Connected Solutions and appliances
businesses. Growth in service robots may benefit tech/parts suppliers ranging
from large firms like Nidec (6594 JP, ¥11,785, Outperform, TP: ¥12,500) to
emerging unlisted firms like Mujin and 3D Media. The listed firm most exposed
to healthcare applications is Cyberdyne (7779 JP, ¥1,533, Not Rated).
13
Please refer to page 5 for important disclosures and analyst certification, or on our website
www.macquarie.com/research/disclosures.
JAPAN
9984 JP Outperform
Price (at 13:51, 02 Jun 2017 GMT) ¥8,995
Valuation ¥ 10,900 - Sum of Parts
12-month target ¥ 10,900
Upside/Downside % +21.2
12-month TSR % +21.7
Volatility Index Medium
GICS sector Telecommunication Services
Market cap ¥bn 9,900
Market cap US$m 89,183
Free float % 74
30-day avg turnover US$m 610.1
Number shares on issue m 1,101
Investment fundamentals Year end 31 Mar 2017A 2018E 2019E 2020E
Revenue bn 8,901.0 9,053.5 9,230.5 9,417.0 EBIT bn 1,026.0 1,136.4 1,231.2 1,277.7 EBIT growth % 12.9 10.8 8.3 3.8 Recurring profit bn 712.5 1,032.3 1,220.8 1,424.9 Reported profit bn 1,426.3 660.8 782.1 916.4 EPS rep ¥ 1,276 600 711 833
EPS rep growth % 218.2 -53.0 18.4 17.2 PER rep x 7.0 15.0 12.7 10.8 PER adj x 7.0 15.0 12.7 10.8 Total DPS ¥ 44 44 44 44 Total div yield % 0.5 0.5 0.5 0.5 ROA % 4.5 4.5 4.8 4.8 ROE % 46.1 17.0 17.1 17.1 EV/EBITDA x 7.8 7.4 6.8 6.4 Net debt/equity % 283.6 239.7 193.2 150.9
P/BV x 2.8 2.4 2.0 1.7
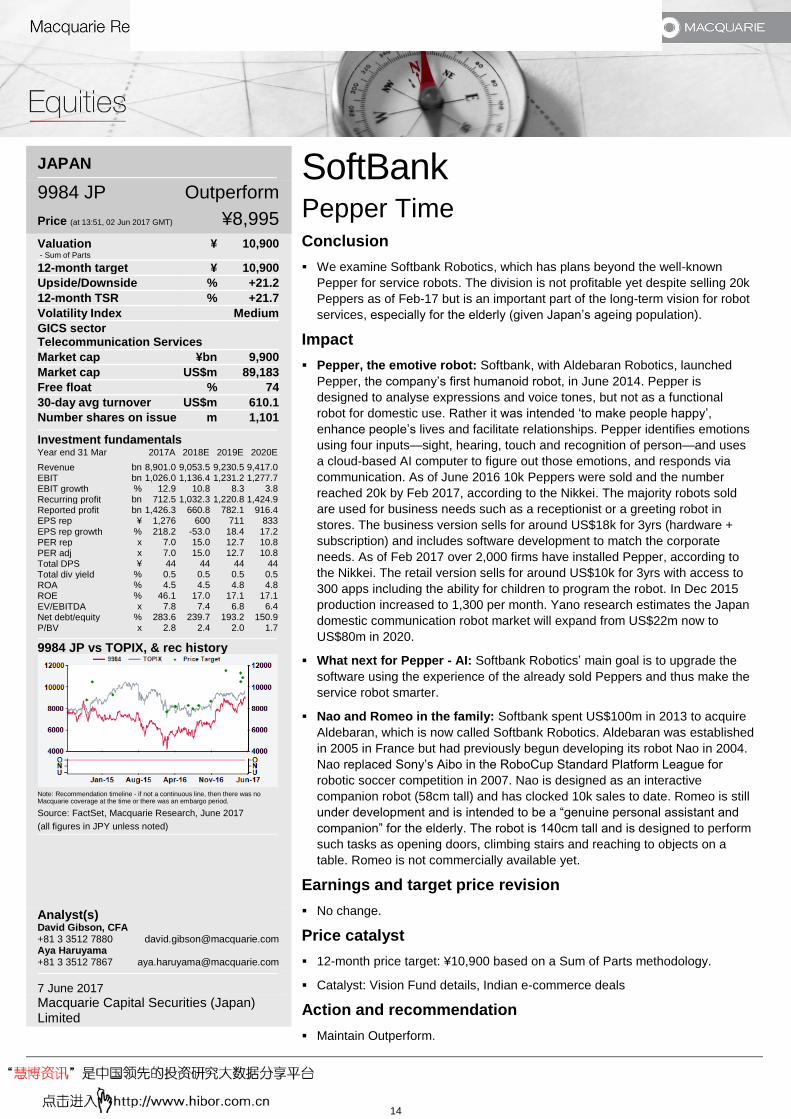
9984 JP vs TOPIX, & rec history
Note: Recommendation timeline - if not a continuous line, then there was no Macquarie coverage at the time or there was an embargo period.
Source: FactSet, Macquarie Research, June 2017
(all figures in JPY unless noted)
Analyst(s) David Gibson, CFA +81 3 3512 7880 [email protected] Aya Haruyama +81 3 3512 7867 [email protected]
7 June 2017 Macquarie Capital Securities (Japan) Limited
SoftBank Pepper Time Conclusion
We examine Softbank Robotics, which has plans beyond the well-known
Pepper for service robots. The division is not profitable yet despite selling 20k
Peppers as of Feb-17 but is an important part of the long-term vision for robot
services, especially for the elderly (given Japan’s ageing population).
Impact
Pepper, the emotive robot: Softbank, with Aldebaran Robotics, launched
Pepper, the company’s first humanoid robot, in June 2014. Pepper is
designed to analyse expressions and voice tones, but not as a functional
robot for domestic use. Rather it was intended ‘to make people happy’,
enhance people’s lives and facilitate relationships. Pepper identifies emotions
using four inputs—sight, hearing, touch and recognition of person—and uses
a cloud-based AI computer to figure out those emotions, and responds via
communication. As of June 2016 10k Peppers were sold and the number
reached 20k by Feb 2017, according to the Nikkei. The majority robots sold
are used for business needs such as a receptionist or a greeting robot in
stores. The business version sells for around US$18k for 3yrs (hardware +
subscription) and includes software development to match the corporate
needs. As of Feb 2017 over 2,000 firms have installed Pepper, according to
the Nikkei. The retail version sells for around US$10k for 3yrs with access to
300 apps including the ability for children to program the robot. In Dec 2015
production increased to 1,300 per month. Yano research estimates the Japan
domestic communication robot market will expand from US$22m now to
US$80m in 2020.
What next for Pepper - AI: Softbank Robotics’ main goal is to upgrade the
software using the experience of the already sold Peppers and thus make the
service robot smarter.
Nao and Romeo in the family: Softbank spent US$100m in 2013 to acquire
Aldebaran, which is now called Softbank Robotics. Aldebaran was established
in 2005 in France but had previously begun developing its robot Nao in 2004.
Nao replaced Sony’s Aibo in the RoboCup Standard Platform League for
robotic soccer competition in 2007. Nao is designed as an interactive
companion robot (58cm tall) and has clocked 10k sales to date. Romeo is still
under development and is intended to be a “genuine personal assistant and
companion” for the elderly. The robot is 140cm tall and is designed to perform
such tasks as opening doors, climbing stairs and reaching to objects on a
table. Romeo is not commercially available yet.
Earnings and target price revision
No change.
Price catalyst
12-month price target: ¥10,900 based on a Sum of Parts methodology.
Catalyst: Vision Fund details, Indian e-commerce deals
Action and recommendation
Maintain Outperform.
14

Please refer to page 2 for important disclosures and analyst certification, or on our website
www.macquarie.com/research/disclosures.
TAIWAN
Global tier-one service provider capex trends
Source: Bloomberg, Macquarie Research, June 2017
Datacenter switch revenue by speed
Source: IDC, Macquarie Research, June 2017
Analyst(s) Kaylin Tsai +886 2 2734 7523 [email protected] Jeffrey Ohlweiler +886 2 2734 7512 [email protected]
7 June 2017 Macquarie Capital Limited, Taiwan Securities Branch
Taiwan Server/Networking Rising back-end support demand Conclusion
We believe service robots that receive information, analyse/communicate with
clouds, and react with solutions, will serve as a new source of demand for
back-end support from datacentre server/networking. With increasing
intelligence of robots and devices, there will be more AI (artificial
intelligence)/deep-learning specialized hardware in datacenters.
Impact
Both quantity and quality expansion from hyperscale datacenters:
Driven by new services (eg. video streaming, live casting, etc) and operations
shifting to public clouds, global tier-one service providers (including Google,
Facebook, Amazon, Microsoft, etc) capex expansion is expected to grow at a
12% CAGR for 2016-2019E, according to Bloomberg consensus estimates.
And aside from a quantity expansion, AI/Deep Learning functionality has been
addressed which can be found in the comments from chipset supplier Nvidia
(growing GPU penetration in cloud and hyperscale) and ODM Inventec (some
AI server projects in 2017).
Datacenter connections also need to be upgraded: With increasing data
traffic from new services or information that we didn’t keep track of before,
datacenters are upgrading their bandwidth from 1G/10G to 40G/100G from
2015-16 to accommodate larger flow of data. The trend can be found in the
revenue growth of Accton, a leading high-speed datacentre switch provider.
Its revenue has grown 19% in 2016 and 44% YoY in 2017 YTD (Jan-Apr).
Get smart and get connected: In order to get more information from the
surroundings for the robot to perform its services, there will be more “things”
becoming connected in various communication standards, such as home
appliances, home security systems, etc. And the trend will benefit networking
players such as Alpha Networks and Wistron NeWeb.
Stock implication
In the Taiwan server space, our top pick is Inventec (2356 TT, NT$23.60,
Outperform, TP: NT$25.70, Jeffrey Ohlweiler) given high server sales
exposure, attractive valuation, high dividend yield and also other non-server
growth drivers (eg. AirPods).
For Taiwan Networking space, our top pick is Accton Technology (2345 TT,
NT$71.00, Outperform, TP: NT$73.00, Kaylin Tsai) which is a true beneficiary
datacenters turning to purchase white-box and high-speed switches. We also
like Alpha Networks (3380 TT, NT$26.85, Outperform, TP: NT$27.60, Kaylin
Tsai), which has significantly expanded its OPM by streamlining operations.
-
10
20
30
40
50
60
2013 2014 2015 2016 2017F 2018F 2019F
(US$bn)
Google Facebook Amazon Microsoft
Alibaba Baidu Tencent
01234567
(US$bn)
<1G 10G 40G 100G
15

Please refer to page 5 for important disclosures and analyst certification, or on our website
www.macquarie.com/research/disclosures.
TAIWAN
2330 TT Outperform
Price (at 10:49, 06 Jun 2017 GMT) NT$210.50
Valuation NT$ 228.00 - PER
12-month target NT$ 228.00
Upside/Downside % +8.3
12-month TSR % +11.7
Volatility Index Low
GICS sector Semiconductors & Semiconductor Equipment
Market cap NT$bn 5,458
Market cap US$m 182,602
Free float % 93
30-day avg turnover US$m 168.0
Number shares on issue m 25,930
Investment fundamentals Year end 31 Dec 2016A 2017E 2018E 2019E
Revenue bn 947.9 974.2 1,103.7 1,192.7 Reported profit bn 334.2 341.9 393.7 427.2 EPS rep NT$ 12.89 13.19 15.18 16.48
EPS rep growth % 9.0 2.3 15.1 8.5 PER rep x 16.3 16.0 13.9 12.8 Total DPS NT$ 7.00 7.12 8.20 8.90 Total div yield % 3.3 3.4 3.9 4.2 ROA % 21.3 19.8 21.0 20.6 ROE % 25.6 23.6 24.6 23.9 EV/EBITDA x 8.4 8.0 7.3 6.9 Net debt/equity % -21.0 -22.7 -26.0 -29.2 P/BV x 3.9 3.6 3.2 2.9
2330 TT rel TAIEX performance, & rec history
Note: Recommendation timeline - if not a continuous line, then there was no Macquarie coverage at the time or there was an embargo period.
Source: FactSet, Macquarie Research, June 2017
(all figures in NT$ unless noted, TP in TWD)
Analyst(s) Macquarie Capital Limited, Taiwan Securities Branch Patrick Liao +886 2 2734 7515 [email protected] Lynn Luo +886 2 2734 7534 [email protected] Macquarie Capital Limited Allen Chang +852 3922 1136 [email protected]
7 June 2017
TSMC Robots: driving demand for ICs Conclusion
We expect robots will not only drive the demand for TSMC’s advanced nodes
(for high-performance computing), but also matured nodes (for connection).
We believe TSMC’s technology leadership, variety of offering, and solid
execution will keep it the major beneficiary of the emerging robot market.
Reiterate Outperform and raise target price from NT$215 to NT$228.
Impact
Advanced nodes to support high-performance computing: We believe
robots will require HPC (high-performance computing)/AI [artificial
intelligence]) chips based on TSMC’s advanced nodes. TSMC also views
HPC as one of three key growth platforms in the next few years. We note that
one of the key customers in this area is Nvidia, which we estimate accounts
for 5-7% of TSMC’s revenue. We believe TSMC’s technology leadership will
make it the key beneficiary of the increasing HPC/AI demand.
Matured nodes to support connection: We expect robots will also drive the
demand for 40nm and above matured technologies with sensors, MCU,
connectivity, and power management ICs. In addition to the chips in robots,
we believe silicon content will also increase in other devices to interact and
connect with the robots. We believe TSMC’s continued improving efficiency
and variety of technologies positions it well for the market. We note one of the
key customers in this area is Broadcom, which we estimate accounts for 5-7%
of TSMC’s revenue. Fanuc is also a TSMC customer for machine controller IC.
Higher quality and reliability requirement: Although the robot demand
volume is still small for the whole semiconductor market, it will require better
quality and reliability comparing with consumer and communication products.
Therefore, we believe TSMC’s solid execution and track record will keep it in
leading position in this emerging market.
Earnings and target price revision
No change to earnings, but we raise target price from NT$215 to NT$228, as
we shift from 15x 2H17-1H18 P/E to 15x 2018 P/E.
Price catalyst
12-month price target: NT$228.00 based on a PER methodology.
Catalyst: Monthly sales, quarterly results/guidance, customer demand, and
progress of advanced technologies
Action and recommendation
We reiterate our Outperform rating with a target price of NT$228 (15x 2018
PER). We are optimistic on TSMC’s sales and EPS growth over 2017-19,
estimating 11% and 12% CAGRs, respectively. We believe TSMC’s continued
sales and EPS growth will lead to share price upside.
16

Please refer to page 5 for important disclosures and analyst certification, or on our website
www.macquarie.com/research/disclosures.
TAIWAN
2317 TT Outperform
Price (at 13:50, 06 Jun 2017 GMT) NT$105.00
Valuation NT$ 150.00 - PER
12-month target NT$ 150.00
Upside/Downside % +42.9
12-month TSR % +49.1
Volatility Index Low
GICS sector Technology Hardware & Equipment
Market cap NT$bn 1,820
Market cap US$m 60,486
Free float % 88
30-day avg turnover US$m 113.9
Number shares on issue m 17,329
Investment fundamentals Year end 31 Dec 2016A 2017E 2018E 2019E
Revenue bn 4,358.7 4,814.3 5,273.0 5,709.2 EBITDA bn 251.6 306.5 343.2 383.1 EBITDA growth % -4.4 21.8 12.0 11.6 EBIT bn 188.3 249.2 285.4 324.9 EBIT growth % -1.9 32.3 14.5 13.8 Reported profit bn 148.7 201.3 231.3 265.5
EPS rep NT$ 8.52 11.54 13.26 15.21 EPS rep growth % 0.9 35.4 14.9 14.8 PER rep x 12.3 9.1 7.9 6.9 Total DPS NT$ 4.30 6.10 7.00 8.04 Total div yield % 4.1 5.8 6.7 7.7 ROA % 7.7 9.3 9.9 10.3 ROE % 14.3 17.7 18.3 18.2 EV/EBITDA x 6.0 4.8 4.4 3.9 Net debt/equity % -24.8 -28.5 -31.7 -40.1
P/BV x 1.7 1.5 1.4 1.1
2317 TT rel TAIEX performance, & rec history
Note: Recommendation timeline - if not a continuous line, then there was no Macquarie coverage at the time or there was an embargo period.
Source: FactSet, Macquarie Research, June 2017
(all figures in NT$ unless noted, TP in TWD)
Analyst(s) Allen Chang +852 3922 1136 [email protected] Verena Jeng +852 3922 3766 [email protected] Chris Yu +86 21 2412 9024 [email protected]
7 June 2017 Macquarie Capital Limited
Hon Hai Service robots: in APP and hardware Conclusion
Hon Hai has been aggressively expanding its robots business, from industry
robots (Foxbot) in 2010 to service robots (Pepper) in 2014. The company has
been increasing its investment in AI after acquiring Sharp in April 2016.
Despite limited revenue contribution in the near term, we expect AI to support
Hon Hai’s valuation as it has a more diversified portfolio and is moving up the
value chain. Maintain Outperform with PT of NT$150 (13x 2017E PE).
Impact
Hon Hai in Pepper, more than manufacturing: Hon Hai is the sole
electronics manufacturing services (EMS) provider for Pepper; however,
its contribution goes beyond assembly, to hardware design (incl. finger
movements) and B2B software apps to, for example, department stores,
3C tech malls, telecom retail stores, and financial institutions. Hon Hai is also
working on B2C apps, initially targeting education and recreation (Fig 1-2).
Pepper, among the world’s first personal companion robots: Pepper,
Hon Hai-made humanoid robot, is designed to simulate human interactions
through a range of voice inflections and ‘expressions’, aided by sophisticated
facial recognition. Apart from Hardware, Hon Hai also developed APPs to
improve Pepper’s interaction with people, such as helping run a coffee shop
(greeting customers, recommending coffee based on stored customer
preferences, etc).
Sharp’s service robots: Sharp’s service robots include AI smartphone
RoBoHoN (Fig 3) and robot vacuum cleaner Cocorobo (Fig 4). RoBoHoN can
be voice-controlled and is equipped with facial recognition, enabling it to
better interact with users. Like Pepper, RoBoHoN can simulate some human
actions (eg dancing) to attract more commercial clients, especially in retail
sales and nursing care sectors. Sharp is also developing AI-featured home
assistant robots for home energy consumption management and surveillance.
Hon Hai’s recent investments in AI and Big Data: Hon Hai has been
aggressively investing in AI and big data, eg: 1) Hike (a chat app in India similar
to WhatsApp): Hon Hai invested US$75m in Aug 2016, and Hike has over
100m subscribers in India; 2) Beijing Megvii Tech: Hon Hai invested US$20m
in Sep 2016. Megvii develops facial recognition and machine vision; and;
3) TetraVue: Hon Hai was the main investor in the A-round US$10m financing
in Feb 2017. TetraVue develops 3D Flash LIDAR for autonomous driving.
Earnings and target price revision
No change.
Price catalyst
12-month price target: NT$150.00 based on a PER methodology.
Catalyst: 2Q17 results
Action and recommendation
Maintain Outperform.
17

Please refer to page 5 for important disclosures and analyst certification, or on our website
www.macquarie.com/research/disclosures.
HONG KONG
728 HK Outperform
Price (at 13:50, 06 Jun 2017 GMT) HK$3.81
Valuation HK$ 4.70 - DCF
12-month target HK$ 4.70
Upside/Downside % +23.4
12-month TSR % +26.4
Volatility Index Low
GICS sector Telecommunication Services
Market cap HK$m 308,352
Market cap US$m 39,571
Free float % 99
30-day avg turnover US$m 23.4
Number shares on issue m 80,932
Investment fundamentals Year end 31 Dec 2016A 2017E 2018E 2019E
Revenue bn 352.3 369.7 388.7 406.7 EBITDA bn 95.1 100.7 105.7 110.5 EBITDA growth % 1.1 5.9 5.0 4.5 EBIT bn 27.2 29.9 33.0 34.2 EBIT growth % 2.9 10.0 10.4 3.3 Reported profit bn 18.0 20.0 22.3 21.1
EPS rep Rmb 0.22 0.25 0.28 0.26 EPS rep growth % -10.2 11.1 11.7 -5.7 PER rep x 14.9 13.5 12.0 12.8 Total DPS Rmb 0.09 0.09 0.11 0.10 Total div yield % 2.8 2.8 3.2 3.0 ROA % 4.2 4.5 4.9 4.9 ROE % 5.8 6.2 6.7 6.1 EV/EBITDA x 3.6 3.4 3.3 3.1 Net debt/equity % 23.7 23.2 20.7 16.7
P/BV x 0.9 0.8 0.8 0.8
728 HK rel HSI performance, & rec history
Note: Recommendation timeline - if not a continuous line, then there was no Macquarie coverage at the time or there was an embargo period.
Source: FactSet, Macquarie Research, June 2017
(all figures in Rmb unless noted, TP in HKD)
Analyst(s) Allen Chang +852 3922 1136 [email protected] Verena Jeng +852 3922 3766 [email protected] Chris Yu +86 21 2412 9024 [email protected]
7 June 2017 Macquarie Capital Limited
China Telecom IoT leadership to drive growth in 5G age Conclusion
As we highlighted in March (Telecom Connecting World; 5G Era), we believe
China Telecom has built strong capabilities in emerging services such as
Internet data centres and cloud computing, Smart Family (IPTV), Internet
finance, big data, and Internet+ (specialized apps). We expect China
Telecom’s lead in fixed-line broadband and fibre infrastructure and its strong
enterprise client base to better support its growth in the coming 5G era.
Impact
Leader in IDC and cloud computing (Fig 1): China Telecom’s IDC and
cloud computing revenue rose 28% in 2016 to Rmb15.9bn, which is 2x as
large as China Unicom’s and 32x as large as China Mobile’s. We attribute
China Telecom’s leadership in this business to its dominant market share in
the fixed-line market and its higher broadband speeds. We expect the
company’s revenue from IDC and cloud computing to grow 30% in 2017.
Leader in Smart Family (IPTV) (Fig 2): China Telecom’s IPTV revenue rose
24% to Rmb4.8bn in 2016, contributing 1.4% of the year’s revenue. The
company’s IPTV subscribers increased by 21m in 2016 to 61m, or 50% of its
fixed-line broadband subscribers. Over 70% of IPTV subscribers in China are
on China Telecom’s service, based on 2016 data. IPTV can provide not only
TV content, but also educational content for children, and serve as a portal for
family conferences.
Strong fixed-line broadband subs with higher ARPU (Fig 3~4): China
Telecom has leading market share in fixed-line broadband subscribers, with
44% market share as of April 2017, followed by China Mobile (30%) and
China Unicom (26%). The company also enjoys higher ARPU in the fixed-line
broadband business, at Rmb54 in 2016, vs China Mobile’s Rmb32 and China
Unicom’s Rmb49. We attribute the higher ARPU to its higher speeds, with
25% of subscribers using >100Mbps bandwidth and 24% using 50–100Mbps.
Earnings and target price revision
No change.
Price catalyst
12-month price target: HK$4.70 based on a DCF methodology.
Catalyst: 2Q17 results
Action and recommendation
Maintain Outperform.
18

Please refer to page 5 for important disclosures and analyst certification, or on our website
www.macquarie.com/research/disclosures.
CHINA
002415 CH Outperform
Price (at CLOSE#, 06 Jun 2017) Rmb28.62
Valuation Rmb 30.00 - PER
12-month target Rmb 30.00
Upside/Downside % +4.8
12-month TSR % +7.3
Volatility Index Medium
GICS sector Technology Hardware & Equipment
Market cap Rmbm 264,134
Market cap US$m 38,837
Free float % 39
30-day avg turnover US$m 158.7
Number shares on issue m 9,229
Investment fundamentals Year end 31 Dec 2016A 2017E 2018E 2019E
Revenue m 31,924 45,065 63,021 86,874 EBITDA m 8,509 12,691 17,890 25,070 EBITDA growth % 25.3 49.1 41.0 40.1 EBIT m 8,269 12,371 17,471 24,521 EBIT growth % 24.6 49.6 41.2 40.4 Reported profit m 7,422 11,015 15,696 21,994
EPS rep Rmb 1.22 1.19 1.70 2.38 EPS rep growth % 89.7 -2.2 42.5 40.1 PER rep x 23.4 24.0 16.8 12.0 Total DPS Rmb 0.37 0.54 0.84 1.17 Total div yield % 1.3 1.9 2.9 4.1 ROA % 23.1 26.9 30.7 34.0 ROE % 34.1 40.7 46.3 50.6 EV/EBITDA x 29.2 19.8 14.1 10.0 Net debt/equity % -48.5 -43.2 -38.0 -34.0
P/BV x 9.7 7.7 6.1 4.6
002415 CH rel CSI 300 performance, & rec history
Note: Recommendation timeline - if not a continuous line, then there was no Macquarie coverage at the time or there was an embargo period.
Source: FactSet, Macquarie Research, June 2017
(all figures in Rmb unless noted, TP in CNY)
Analyst(s) Allen Chang +852 3922 1136 [email protected] Verena Jeng +852 3922 3766 [email protected] Chris Yu +86 21 2412 9024 [email protected]
7 June 2017 Macquarie Capital Limited
Hikvision (A-Share) Logistics and parking service robot Conclusion
As we highlighted in April, Hikvision disclosed its emerging business (Ezviz
Smart Home, Robot, Drones, Automotive electronics) results, with revenues
of Rmb648m in 2016, or 2% of total revenues and 39% GM. Among the
emerging businesses, Ezviz Smart Home was the main contributor, implying a
limited revenue contribution from Robot. However, we are positive on the
company’s extension into robotics, which, we expect to support valuation in
the long run, given the diversified product portfolio.
Impact
Hikvision’s robot products include robots for sorting, for logistics and for
parking. Management guides to gross margin of robots to be higher than the
company’s blended gross margin of 40%, supporting the company’s gross
margin in the long term.
Parking robots – parking within 2 mins (Fig 1): The parking robot is
capable of a 3-ton load and equipped with in-house sensors for route planning
as well as collision avoidance. The automated parking system is able to
coordinate 500 parking robots with each vehicle retrieving task being
completed within 2 minutes, according to management. Hikvision’s parking
robots are currently in trial operations in a town near Shanghai.
Intelligent storage system Crossroad: In Feb 2016, the company launched
intelligent storage system, Crossroad, which consists of storage robot, robot
scheduling system (RCS) and intelligent warehouse management system
(iWMS). Crossroad leverages Hikvision’s expertise in video analysis and
management, targeting to increase storage efficiency.
Storage robot in Crossroad (Fig 2): The square shaped robot is developed
in-house with two wheels and a maximum operating speed of 1.0 meters per
second, maximum load capacity of 500kg, independent positioning and
navigation, automatic obstacle avoidance and self-charging.
Robot scheduling system (RCS) & Intelligent warehouse management
system (iWMS) in Crossroad: RCS is the crucial part of Crossroad, in
charge of allocating tasks among storage robots, monitoring operations and
battery status of the robots and providing prompt alarm to human staff to
ensure Crossroad runs smoothly. iWMS conducts data analysis with video
surveillance network and instant operation overview to optimize warehouse
management and enhance storage space utilization.
Earnings and target price revision
No change to net income. EPS for 2017-19E adjusted by -34% on share
count update. New PT at Rmb30, based on an unchanged 25x 2017E PER
(vs. Rmb45 previously).
Price catalyst
12-month price target: Rmb30.00 based on a PER methodology.
Catalyst: 2Q17 results
Action and recommendation
Maintain Outperform.
19

Please refer to page 5 for important disclosures and analyst certification, or on our website
www.macquarie.com/research/disclosures.
HONG KONG
992 HK Outperform
Price (at 13:50, 06 Jun 2017 GMT) HK$5.07
Valuation HK$ 7.50 - PER
12-month target HK$ 7.50
Upside/Downside % +47.9
12-month TSR % +53.2
Volatility Index Medium
GICS sector Technology Hardware & Equipment
Market cap HK$m 56,321
Market cap US$m 7,228
Free float % 62
30-day avg turnover US$m 48.1
Number shares on issue m 11,109
Investment fundamentals Year end 31 Mar 2017A 2018E 2019E 2020E
Revenue m 43,035 44,389 46,136 50,554 EBITDA m 1,408 1,258 1,309 1,455 EBITDA growth % 111.1 -10.7 4.1 11.1 EBIT m 666 1,019 1,097 1,264 EBIT growth % nmf 53.0 7.7 15.2 Reported profit m 535 814 899 1,068
EPS rep ¢ 4.9 7.4 8.2 9.7 EPS rep growth % nmf 52.0 10.5 18.8 PER rep x 13.4 8.8 8.0 6.7 Total DPS ¢ 3.4 3.4 3.4 3.4 Total div yield % 5.3 5.2 5.2 5.2 ROA % 2.6 3.6 3.7 4.1 ROE % 30.4 18.3 15.8 15.6 EV/EBITDA x 5.2 5.9 5.7 5.1 Net debt/equity % 6.9 -20.0 -36.7 -45.6
P/BV x 1.9 1.4 1.1 1.0
992 HK rel HSI performance, & rec history
Note: Recommendation timeline - if not a continuous line, then there was no Macquarie coverage at the time or there was an embargo period.
Source: FactSet, Macquarie Research, June 2017
(all figures in USD unless noted, TP in HKD)
Analyst(s) Allen Chang +852 3922 1136 [email protected] Verena Jeng +852 3922 3766 [email protected] Chris Yu +86 21 2412 9024 [email protected]
7 June 2017 Macquarie Capital Limited
Lenovo AI-featured devices, Big Data, Cloud Conclusion
Lenovo’s enterprise (data centre) business was around 9% of FY2017
revenues, mainly focused on hyper-scaled and hyper-converged servers. We
are positive on Lenovo’s role in the future IoT era, given the company has a
comprehensive devices portfolio to form big data and to provide cloud
services to their devices users, and has hyper-scaled and hyper-converged
servers to run super computing for their enterprise clients.
Impact
AI-featured devices to form Big Data: Lenovo has a comprehensive
devices portfolio, including PC (leading brand with global market share at 20-
22%), smartphone (newly transitioned to high-end models), and smart home
facilities (smart assistant, smart storage), which could form Big Data and
enable Lenovo to provide cloud services to their devices users.
Lenovo AI-featured Smart Assistant (Fig 1): As we highlighted in Jan
(report link, CES 2017: AR, VR, Smart Home, Jan 5), the company
showcased its Smart assistant and Smart storage. The Smart Assistant is an
AI-featured speaker box, equipped with voice recognition, and can play music,
conduct web searches, support online shopping, create lists, etc. Voice
commands can be up to 5 meters away given eight 360-degree far-field
microphones in the device.
Private cloud services (Fig 2): Lenovo’s private cloud services could be
connected by multiple devices. It is an app in Windows OS, equal to a 100GB
hard drive, supporting printing, editing, and synchronizing. The private cloud
services also provide multiple “one-key” functions, such as copying photos to
cloud, printing files in cloud, and moving all data to new devices.
Enterprise (data centre) business outlook: Lenovo’s enterprise business is
under transition, with PTI margin at -11.6% in FY2017, mainly because of
rising components costs and continuous investments in China market (ex:
sales rep, channels, etc.). Management is confident it can improve profitability
in FY2018 given the previous opex investments and the company’s rising
partnership in hyper-converged market.
Earnings and target price revision
No change.
Price catalyst
12-month price target: HK$7.50 based on a PER methodology.
Catalyst: FY1Q18 results
Action and recommendation
Maintain Outperform.
20
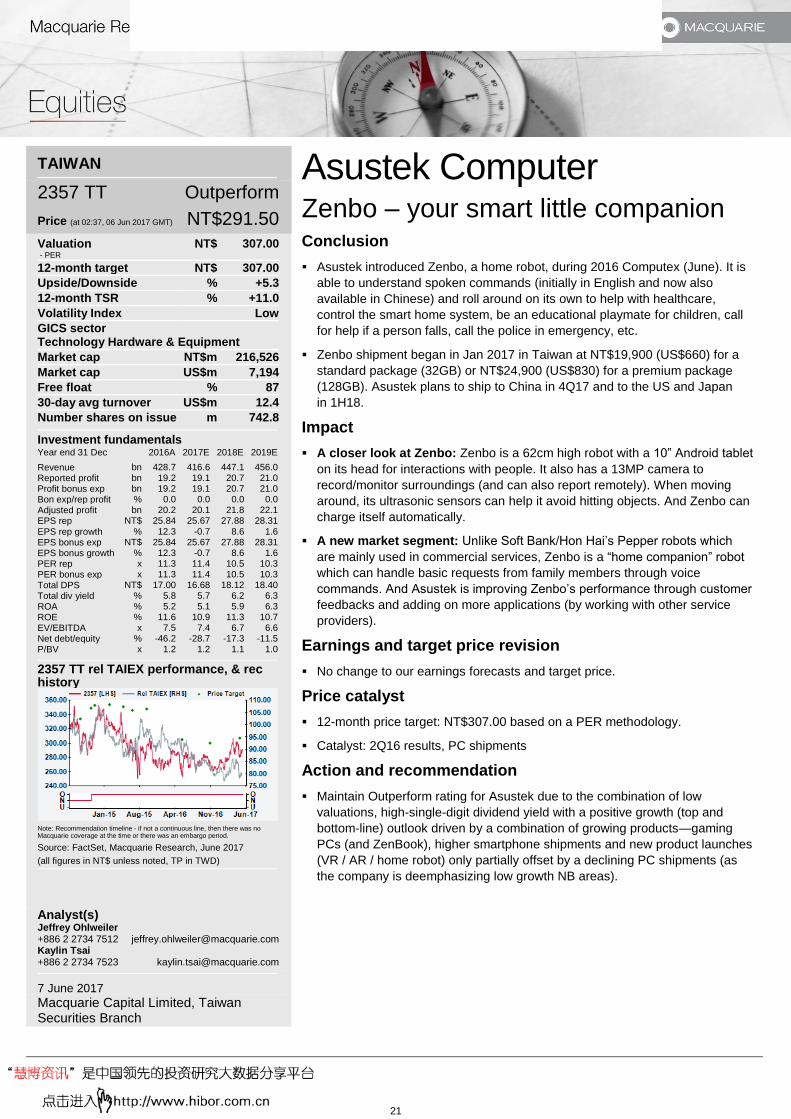
Please refer to page 5 for important disclosures and analyst certification, or on our website
www.macquarie.com/research/disclosures.
TAIWAN
2357 TT Outperform
Price (at 02:37, 06 Jun 2017 GMT) NT$291.50
Valuation NT$ 307.00 - PER
12-month target NT$ 307.00
Upside/Downside % +5.3
12-month TSR % +11.0
Volatility Index Low
GICS sector Technology Hardware & Equipment
Market cap NT$m 216,526
Market cap US$m 7,194
Free float % 87
30-day avg turnover US$m 12.4
Number shares on issue m 742.8
Investment fundamentals Year end 31 Dec 2016A 2017E 2018E 2019E
Revenue bn 428.7 416.6 447.1 456.0 Reported profit bn 19.2 19.1 20.7 21.0 Profit bonus exp bn 19.2 19.1 20.7 21.0 Bon exp/rep profit % 0.0 0.0 0.0 0.0 Adjusted profit bn 20.2 20.1 21.8 22.1 EPS rep NT$ 25.84 25.67 27.88 28.31
EPS rep growth % 12.3 -0.7 8.6 1.6 EPS bonus exp NT$ 25.84 25.67 27.88 28.31 EPS bonus growth % 12.3 -0.7 8.6 1.6 PER rep x 11.3 11.4 10.5 10.3 PER bonus exp x 11.3 11.4 10.5 10.3 Total DPS NT$ 17.00 16.68 18.12 18.40 Total div yield % 5.8 5.7 6.2 6.3 ROA % 5.2 5.1 5.9 6.3 ROE % 11.6 10.9 11.3 10.7
EV/EBITDA x 7.5 7.4 6.7 6.6 Net debt/equity % -46.2 -28.7 -17.3 -11.5 P/BV x 1.2 1.2 1.1 1.0
2357 TT rel TAIEX performance, & rec history
Note: Recommendation timeline - if not a continuous line, then there was no Macquarie coverage at the time or there was an embargo period.
Source: FactSet, Macquarie Research, June 2017
(all figures in NT$ unless noted, TP in TWD)
Analyst(s) Jeffrey Ohlweiler +886 2 2734 7512 [email protected] Kaylin Tsai +886 2 2734 7523 [email protected]
7 June 2017 Macquarie Capital Limited, Taiwan Securities Branch
Asustek Computer Zenbo – your smart little companion Conclusion
Asustek introduced Zenbo, a home robot, during 2016 Computex (June). It is
able to understand spoken commands (initially in English and now also
available in Chinese) and roll around on its own to help with healthcare,
control the smart home system, be an educational playmate for children, call
for help if a person falls, call the police in emergency, etc.
Zenbo shipment began in Jan 2017 in Taiwan at NT$19,900 (US$660) for a
standard package (32GB) or NT$24,900 (US$830) for a premium package
(128GB). Asustek plans to ship to China in 4Q17 and to the US and Japan
in 1H18.
Impact
A closer look at Zenbo: Zenbo is a 62cm high robot with a 10” Android tablet
on its head for interactions with people. It also has a 13MP camera to
record/monitor surroundings (and can also report remotely). When moving
around, its ultrasonic sensors can help it avoid hitting objects. And Zenbo can
charge itself automatically.
A new market segment: Unlike Soft Bank/Hon Hai’s Pepper robots which
are mainly used in commercial services, Zenbo is a “home companion” robot
which can handle basic requests from family members through voice
commands. And Asustek is improving Zenbo’s performance through customer
feedbacks and adding on more applications (by working with other service
providers).
Earnings and target price revision
No change to our earnings forecasts and target price.
Price catalyst
12-month price target: NT$307.00 based on a PER methodology.
Catalyst: 2Q16 results, PC shipments
Action and recommendation
Maintain Outperform rating for Asustek due to the combination of low
valuations, high-single-digit dividend yield with a positive growth (top and
bottom-line) outlook driven by a combination of growing products—gaming
PCs (and ZenBook), higher smartphone shipments and new product launches
(VR / AR / home robot) only partially offset by a declining PC shipments (as
the company is deemphasizing low growth NB areas).
21
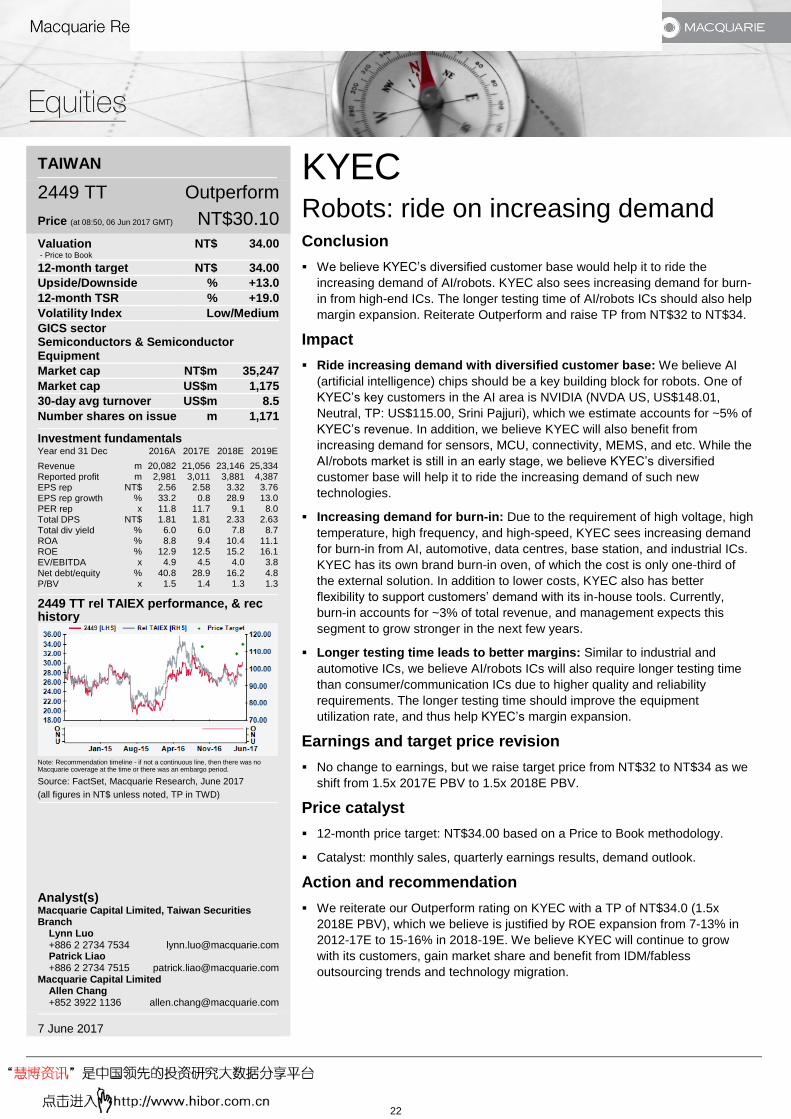
Please refer to page 5 for important disclosures and analyst certification, or on our website
www.macquarie.com/research/disclosures.
TAIWAN
2449 TT Outperform
Price (at 08:50, 06 Jun 2017 GMT) NT$30.10
Valuation NT$ 34.00 - Price to Book
12-month target NT$ 34.00
Upside/Downside % +13.0
12-month TSR % +19.0
Volatility Index Low/Medium
GICS sector Semiconductors & Semiconductor Equipment
Market cap NT$m 35,247
Market cap US$m 1,175
30-day avg turnover US$m 8.5
Number shares on issue m 1,171
Investment fundamentals Year end 31 Dec 2016A 2017E 2018E 2019E
Revenue m 20,082 21,056 23,146 25,334 Reported profit m 2,981 3,011 3,881 4,387 EPS rep NT$ 2.56 2.58 3.32 3.76 EPS rep growth % 33.2 0.8 28.9 13.0 PER rep x 11.8 11.7 9.1 8.0 Total DPS NT$ 1.81 1.81 2.33 2.63 Total div yield % 6.0 6.0 7.8 8.7 ROA % 8.8 9.4 10.4 11.1 ROE % 12.9 12.5 15.2 16.1 EV/EBITDA x 4.9 4.5 4.0 3.8
Net debt/equity % 40.8 28.9 16.2 4.8 P/BV x 1.5 1.4 1.3 1.3
2449 TT rel TAIEX performance, & rec history
Note: Recommendation timeline - if not a continuous line, then there was no Macquarie coverage at the time or there was an embargo period.
Source: FactSet, Macquarie Research, June 2017
(all figures in NT$ unless noted, TP in TWD)
Analyst(s) Macquarie Capital Limited, Taiwan Securities Branch Lynn Luo +886 2 2734 7534 [email protected] Patrick Liao +886 2 2734 7515 [email protected] Macquarie Capital Limited Allen Chang +852 3922 1136 [email protected]
7 June 2017
KYEC Robots: ride on increasing demand Conclusion
We believe KYEC’s diversified customer base would help it to ride the
increasing demand of AI/robots. KYEC also sees increasing demand for burn-
in from high-end ICs. The longer testing time of AI/robots ICs should also help
margin expansion. Reiterate Outperform and raise TP from NT$32 to NT$34.
Impact
Ride increasing demand with diversified customer base: We believe AI
(artificial intelligence) chips should be a key building block for robots. One of
KYEC’s key customers in the AI area is NVIDIA (NVDA US, US$148.01,
Neutral, TP: US$115.00, Srini Pajjuri), which we estimate accounts for ~5% of
KYEC’s revenue. In addition, we believe KYEC will also benefit from
increasing demand for sensors, MCU, connectivity, MEMS, and etc. While the
AI/robots market is still in an early stage, we believe KYEC’s diversified
customer base will help it to ride the increasing demand of such new
technologies.
Increasing demand for burn-in: Due to the requirement of high voltage, high
temperature, high frequency, and high-speed, KYEC sees increasing demand
for burn-in from AI, automotive, data centres, base station, and industrial ICs.
KYEC has its own brand burn-in oven, of which the cost is only one-third of
the external solution. In addition to lower costs, KYEC also has better
flexibility to support customers’ demand with its in-house tools. Currently,
burn-in accounts for ~3% of total revenue, and management expects this
segment to grow stronger in the next few years.
Longer testing time leads to better margins: Similar to industrial and
automotive ICs, we believe AI/robots ICs will also require longer testing time
than consumer/communication ICs due to higher quality and reliability
requirements. The longer testing time should improve the equipment
utilization rate, and thus help KYEC’s margin expansion.
Earnings and target price revision
No change to earnings, but we raise target price from NT$32 to NT$34 as we
shift from 1.5x 2017E PBV to 1.5x 2018E PBV.
Price catalyst
12-month price target: NT$34.00 based on a Price to Book methodology.
Catalyst: monthly sales, quarterly earnings results, demand outlook.
Action and recommendation
We reiterate our Outperform rating on KYEC with a TP of NT$34.0 (1.5x
2018E PBV), which we believe is justified by ROE expansion from 7-13% in
2012-17E to 15-16% in 2018-19E. We believe KYEC will continue to grow
with its customers, gain market share and benefit from IDM/fabless
outsourcing trends and technology migration.
22

Please refer to page 5 for important disclosures and analyst certification, or on our website
www.macquarie.com/research/disclosures.
KOREA
028260 KS Outperform
Price (at 13:50, 06 Jun 2017 GMT) Won143,000
Valuation Won 169,000 - Sum of Parts
12-month target Won 169,000
Upside/Downside % +18.2
12-month TSR % +18.9
Volatility Index Medium
GICS sector Capital Goods
Market cap Wonbn 27,126
Market cap US$m 24,257
Free float % 36
30-day avg turnover US$m 57.6
Number shares on issue m 189.7
Investment fundamentals Year end 31 Dec 2016A 2017E 2018E 2019E
Revenue bn 28,103 27,212 28,530 30,502 EBIT bn 140 476 958 1,294 EBIT growth % nmf 240.9 101.3 35.2 Reported profit bn 59 702 1,132 1,451 Adjusted profit bn 298 702 1,132 1,451 EPS rep Won 311 3,699 5,965 7,648 EPS rep growth % -98.0 1,087.9 61.3 28.2 EPS adj Won 1,571 3,699 5,965 7,649 EPS adj growth % -89.9 135.5 61.3 28.2
PER rep x 459.2 38.7 24.0 18.7 PER adj x 91.0 38.7 24.0 18.7 Total DPS Won 750 1,000 1,250 1,500 Total div yield % 0.5 0.7 0.9 1.0 ROA % 0.3 1.1 2.1 2.8 ROE % 1.7 3.8 5.9 7.2 EV/EBITDA x 49.6 53.4 29.1 23.8
Net debt/equity % 21.2 19.2 13.9 7.7 P/BV x 1.5 1.4 1.4 1.3
028260 KS rel KOSPI performance, & rec history
Note: Recommendation timeline - if not a continuous line, then there was no Macquarie coverage at the time or there was an embargo period.
Source: FactSet, Macquarie Research, June 2017
(all figures in Won unless noted, TP in KRW)
Analyst(s) James Hong +82 2 3705 8661 [email protected]
7 June 2017 Macquarie Securities Korea Limited
Samsung C&T Turning positive on investment holdings Conclusion
We downgrade our view on the domestic property market, perceiving a threat
to rentals and reconstruction.
However, we turn positive on Samsung C&T, given its diversified earnings
stream and rising value in its investment holdings. Our positive view is despite
there being no holding company transformation.
Impact
We downgrade our view on the domestic property market – threats to
structural changes into monthly rental market and reconstruction. We
see the Moon administration turning more aggressive on market intervention
than just housing welfare. The government is introducing a debt service ratio
(DSR) in the property market, which not only considers collateral (like existing
LTV and DTI) but other personal lending as well. Fundamentally, we see a
threat to: 1) rentals from an increase in supply of public rental housing (130k
units p.a., vs average 80k units during 2011-15) and from taxation of small-
scale rental business operators; and, 2) reconstruction of punitive taxes on
reconstruction gains from 2018.
Captive orders a key driver for the construction business. We have been
cautious on Samsung C&T, due to: 1) its poor order intake in the domestic
housing business since 2016; and, 2) poor execution overseas. However, with
the company downsizing its construction business (from an average annual
order intake of Won 15tr during 2013-15 to around Won 10tr annually from
2016), Samsung’s captive order has become a major driver for its
construction business with an average annual intake of Won 4.5tr during
2015-16. While the company is guiding to Won3tr of order intake from the
Group (out of a Won10.5tr total), we see upside potential as its current
guidance is purely maintenance (and no expansionary capex). After two years
of downsizing, the domestic housing business, which we are turning cautious
on, is only 16% of construction revenue (or 6% of total revenue) and 8% of
construction profit (or 2% of total profit) for 2018E.
Strong share price performance of investment holdings. Strong share
price performance of investment holdings, Samsung Electronics (4.6% YTD),
Samsung Life Insurance (19.3%), Samsung Biologics (43.4%), should lift
investment holding value of Samsung C&T. Value of investment holdings
explains 93% of the current market capitalization of Samsung C&T.
Earnings and target price revision
We lower our EPS forecasts for 2017-18 by 22% / 19%. However, we raise
our target price from Won165,000 to Won169,000 on investment holding
value.
Price catalyst
12-month price target: Won169,000 based on a Sum of Parts methodology.
Catalyst: Samsung captive order (semiconductor fab orders), investment
holding value
Action and recommendation
Upgrading to Outperform.
23

Please refer to page 5 for important disclosures and analyst certification, or on our website
www.macquarie.com/research/disclosures.
KOREA
000720 KS Outperform
Price (at 13:50, 06 Jun 2017 GMT) Won46,850
Valuation Won 47,000-56,000
- Average P/BV vs. ROE and EV/backlog
12-month target Won 53,000
Upside/Downside % +13.1
12-month TSR % +14.6
Volatility Index Medium
GICS sector Capital Goods
Market cap Wonbn 5,217
Market cap US$m 4,665
Free float % 65
30-day avg turnover US$m 17.8
Number shares on issue m 111.4
Investment fundamentals Year end 31 Dec 2016A 2017E 2018E 2019E
Revenue bn 18,744 21,203 20,457 20,057 EBIT bn 1,053 1,195 1,238 1,158 EBIT growth % 6.7 13.5 3.6 -6.4 Reported profit bn 491 582 633 604 Adjusted profit bn 545 637 687 658 EPS rep Won 4,400 5,219 5,671 5,413
EPS rep growth % 33.4 18.6 8.7 -4.6 EPS adj Won 4,886 5,706 6,158 5,899 EPS adj growth % 24.0 16.8 7.9 -4.2 PER rep x 10.6 9.0 8.3 8.7 PER adj x 9.6 8.2 7.6 7.9 Total DPS Won 500 700 800 800 Total div yield % 1.1 1.5 1.7 1.7 ROA % 5.4 6.0 6.1 5.5 ROE % 9.0 9.6 9.6 8.6
EV/EBITDA x 4.5 4.1 4.0 4.2 Net debt/equity % 5.2 -6.0 -18.1 -22.5 P/BV x 0.8 0.8 0.7 0.7
000720 KS rel KOSPI performance, & rec history
Note: Recommendation timeline - if not a continuous line, then there was no Macquarie coverage at the time or there was an embargo period.
Source: FactSet, Macquarie Research, June 2017
(all figures in Won unless noted, TP in KRW)
Analyst(s) James Hong +82 2 3705 8661 [email protected]
7 June 2017 Macquarie Securities Korea Limited
Hyundai E&C Keeping our positive stance but… Conclusion
We are turning cautious and downgrading our view on the domestic property
market. Although Hyundai E&C generates ~31% of its profit from domestic
housing, we think a looming slowdown in the local property market can be
partially cushioned by its businesses in the Middle East and frontier markets.
We trim our TP to Won53,000 from Won54,000. Retain Outperform.
Impact
We downgrade our view on the domestic property market – threats of
structural change into monthly rental market and reconstruction. We see
the Moon administration turning more aggressive on market intervention
rather than just focusing on housing welfare. The government is introducing a
debt service ratio (DSR) to the property market, which not only considers
collateral (like existing LTV and DTI) but other personal lending as well.
Fundamentally, we see a threat to 1) the rental market on public rental
housing supply (130k units pa vs average 80k units in 2011-15) due to higher
taxes on small-scale rental operators, and 2) punitive taxes on reconstruction
gains from 2018.
We forecast a sequential pre-sale decline in housing business. Due to a
heavy completion schedule and regulations, we forecast a sequential pre-sale
decline from 26.0k units in 2016 to 23.3k/18.0k units in 2017/18 (vs. 26.0k
guidance for 2017). More importantly, the price decline should drag down
profitability as the domestic housing business contributes 17% of Hyundai
E&C’s revenue and 31% of its profit.
Improved order flow in 2017, accelerating into 2H. Hyundai E&C will
participate in the bidding for 52 projects, worth US$23bn, in 2017 vs 29
projects (US$12bn) in 2016. Its focus is refinery and power transmission in
the Middle East and port infrastructure and CFPP in Asia. Hyundai E&C
targets new order intake of Won24.3tr in 2017 vs our Won18.4tr expectation,
thanks to the doubling of Middle East plant order flow reaching US$70bn.
Earnings and target price revision
We cut our EPS forecasts for 2017/18 by -9.3%/-4.1% and trim our target
price to Won53,000 from Won54,000. Our TP implies 10x earnings and 0.7x
book.
Price catalyst
12-month price target: Won53,000 based on a average P/BV vs. ROE and
EV/backlog methodology.
Catalyst: Order intake, shareholder return policy, Hyundai Eng. listing
Action and recommendation
Maintain Outperform. Hyundai E&C should continue to generate a stable
Won20tr of revenue and gradually improving earnings. We would be more
excited if management implements shareholder friendly policies (dividend
payout or share buyback/cancellation) with its strong cash inflow and balance
sheet.
24

Please refer to page 5 for important disclosures and analyst certification, or on our website
www.macquarie.com/research/disclosures.
KOREA
000210 KS Neutral
Price (at 13:50, 06 Jun 2017 GMT) Won91,000
Valuation Won 89,000-110,000
- Average of P/BV vs. ROE and SOTP
12-month target Won 100,000
Upside/Downside % +9.9
12-month TSR % +10.4
Volatility Index Medium
GICS sector Capital Goods
Market cap Wonbn 3,167
Market cap US$m 2,832
Free float % 78
30-day avg turnover US$m 17.2
Number shares on issue m 34.80
Investment fundamentals Year end 31 Dec 2016A 2017E 2018E 2019E
Revenue bn 9,854 11,123 11,239 11,191 EBIT bn 419 551 399 340 EBIT growth % 54.3 31.5 -27.7 -14.7 Reported profit bn 265 620 394 344 Adjusted profit bn 272 623 394 344 EPS rep Won 6,873 16,073 10,198 8,914
EPS rep growth % 28.3 133.9 -36.6 -12.6 EPS adj Won 7,051 16,138 10,198 8,914 EPS adj growth % 26.9 128.9 -36.8 -12.6 PER rep x 13.2 5.7 8.9 10.2 PER adj x 12.9 5.6 8.9 10.2 Total DPS Won 300 500 500 500 Total div yield % 0.3 0.5 0.5 0.5 ROA % 3.4 4.4 3.1 2.6 ROE % 6.1 12.3 6.9 5.6
EV/EBITDA x 5.8 4.7 7.1 8.1 Net debt/equity % 24.6 15.1 9.8 3.5 P/BV x 0.8 0.6 0.6 0.6
000210 KS rel KOSPI performance, & rec history
Note: Recommendation timeline - if not a continuous line, then there was no Macquarie coverage at the time or there was an embargo period.
Source: FactSet, Macquarie Research, June 2017
(all figures in Won unless noted, TP in KRW)
Analyst(s) James Hong +82 2 3705 8661 [email protected]
7 June 2017 Macquarie Securities Korea Limited
Daelim Industrial Iran… but what else? Conclusion
We are turning cautious on the domestic property market.
After its recent strong share price performance (+15% vs. KOSPI +10% since
its 20 April low), we downgrade Daelim Industrial to Neutral from Outperform.
Impact
We are turning cautious on the domestic property market – threats to
structural changes in the monthly rental market and reconstruction. We
see the Moon administration turning more aggressive on market intervention
than just housing welfare. The government is introducing a debt service ratio
(DSR) into property market, which not only considers collateral (like existing
LTV and DTI) but other personal lending too. Fundamentally, we see threats
to 1) the rental market due to an increase in the public rental housing supply
(130k units pa, vs. average 80k units during 2011-15) and from taxation on
small-scale rental business operators; and, 2) reconstruction from punitive
taxes on reconstruction gains starting 2018.
Sequential pre-sale decline in housing business. Due to a huge
completion schedule and heavy regulation, we forecast pre-sales will decline
sequentially from 19.2k units in 2016 to 16.1k/10.0k units in 2017/2018 (vs.
2017 guidance of 18.5k units). More importantly, price declines should drag its
profitability as the domestic housing business contributes 31% of Daelim
Industrial’s revenue and 22% of profit for 2018E.
Fully reflects investment holding value after the recent run-up. We think
the current share price fully reflects investment holding value as there is
limited potential to transform itself into a holding company structure
(maintaining current conglomerate discount of 20% in our valuation).
Earnings and target price revision
We revise our EPS forecasts for 2017/2018 by 31%/-10%. Upward revision in
2017 is due to better-than-expected earnings from Daelim Energy in 1Q17.
Accordingly, we lower our target price to Won100,000 (from Won105,000).
Our TP implies 6x earnings and 0.6x book.
Price catalyst
12-month price target: Won100,000 based on an Average of P/BV vs. ROE
and SOTP methodology.
Catalyst: Ethylene-naphtha spread, order intake from Iran, domestic property
price and transaction volume
Action and recommendation
Downgrading to Neutral. Despite its potential civil engineering order intake
from Iranian market this year, downside in domestic housing business is
difficult to be compensated. Its aggressive push to become a property
developer may drag down its ROE generation.
25

Please refer to page 5 for important disclosures and analyst certification, or on our website
www.macquarie.com/research/disclosures.
KOREA
012630 KS Neutral
Price (at 13:50, 06 Jun 2017 GMT) Won50,100
Valuation Won 51,000-54,000
- Average of P/BV vs. ROE and EV/backlog
12-month target Won 52,000
Upside/Downside % +3.8
12-month TSR % +5.8
Volatility Index High
GICS sector Capital Goods
Market cap Wonbn 3,777
Market cap US$m 3,377
Free float % 72
30-day avg turnover US$m 15.2
Number shares on issue m 75.38
Investment fundamentals Year end 31 Dec 2016A 2017E 2018E 2019E
Revenue bn 4,749.9 5,154.0 4,960.0 4,837.9 EBIT bn 517.2 535.5 473.9 406.4 EBIT growth % 32.8 3.5 -11.5 -14.2 Reported profit bn 306.7 393.3 346.3 302.5 Adjusted profit bn 308.2 394.7 347.7 303.9 EPS rep Won 4,069 5,217 4,594 4,012
EPS rep growth % 41.5 28.2 -11.9 -12.7 EPS adj Won 4,088 5,236 4,613 4,031 EPS adj growth % 41.1 28.1 -11.9 -12.6 PER rep x 12.3 9.6 10.9 12.5 PER adj x 12.3 9.6 10.9 12.4 Total DPS Won 500 1,000 1,000 1,000 Total div yield % 1.0 2.0 2.0 2.0 ROA % 9.2 9.0 7.6 6.2 ROE % 12.4 14.1 11.2 8.9
EV/EBITDA x 7.2 6.8 7.6 8.7 Net debt/equity % 2.6 2.0 -7.5 -12.6 P/BV x 1.4 1.3 1.2 1.1
012630 KS rel KOSPI performance, & rec history
Note: Recommendation timeline - if not a continuous line, then there was no Macquarie coverage at the time or there was an embargo period.
Source: FactSet, Macquarie Research, June 2017
(all figures in Won unless noted, TP in KRW)
Analyst(s) James Hong +82 2 3705 8661 [email protected]
7 June 2017 Macquarie Securities Korea Limited
Hyundai Development Downgrading on domestic property Conclusion
We are turning cautious on the domestic property market.
Hyundai Development is most leveraged to the domestic housing business
among the Korea E&C companies, and thus we downgrade it to Neutral from
Outperform.
Impact
We are turning more cautious on the domestic property market – threats
to structural changes in the monthly rental market and reconstruction. We
see the Moon administration turning more aggressive on market intervention
rather than just focusing on housing welfare. The government is introducing a
debt service ratio into the property market, which not only considers collateral
(like existing LTV and DTI) but also other personal lending. Fundamentally, we
see threats to 1) the rental market due to an increase in public rental housing
supply (130k units pa, vs. average 80k units during 2011-15) and from taxation
owing to small-scale rental business operators; and, 2) reconstruction from
punitive taxes on reconstruction gains starting 2018.
Sequential pre-sale decline in housing. Due to a heavy completion
schedule and regulations, we forecast pre-sales will decline sequential from
21k units in 2016 to 16.6k/14.9k units in 2017/2018 (vs. 2017 guidance of
18.3k units). More importantly, the price decline should drag its profitability as
we expect the domestic housing business to contribute 53% of the company’s
revenue and 56% of profit in 2018.
Positives from the non-housing business are in the price; earnings to
peak in 2017. While the company can still benefit from the larger SOC
investment (order intake in civil engineering), upside from civil engineering
seems difficult to offset the housing business downside. Earnings should peak
in 2017. In addition, the company is planning to transform itself into a holding
company structure. However, we do not see much room for unlocking hidden
value (such as heavily-discounted unlisted entities or conglomerate discount).
Earnings and target price revision
We revise our EPS forecasts for 2017/2018 by -14%/-31%.
We lower our target price to Won52,000. Our TP implies 10x earnings vs. vs.
8.2x previously and 1.3x book, vs. 1.2x previously.
Price catalyst
12-month price target: Won52,000 based on an Average of P/BV vs. ROE and
EV/backlog methodology.
Catalyst: housing price and transaction volume, pre-sale launches, corporate
restructuring
Action and recommendation
Downgrading to Neutral. Threats to structural changes in the monthly rental
market and reconstruction should keep the domestic housing business in
historical cyclicality, and over-investment at the cyclical peak should impede
its ROE generation in a downturn.
26
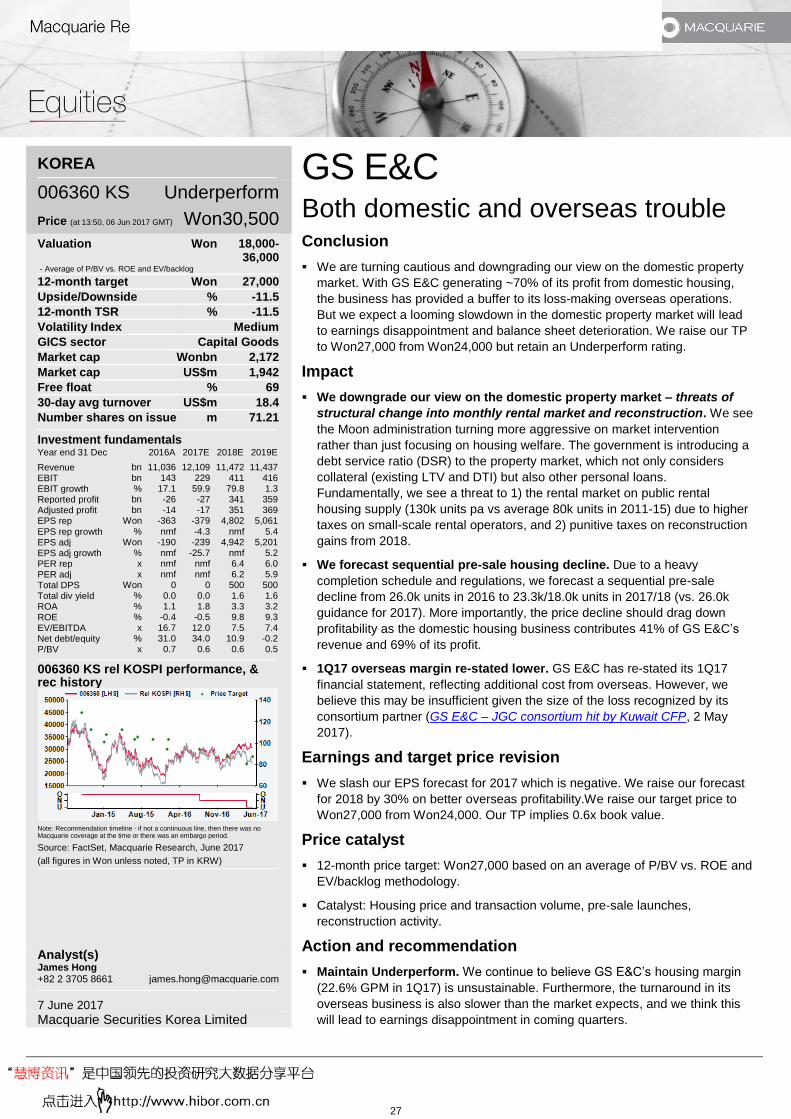
Please refer to page 5 for important disclosures and analyst certification, or on our website
www.macquarie.com/research/disclosures.
KOREA
006360 KS Underperform
Price (at 13:50, 06 Jun 2017 GMT) Won30,500
Valuation Won 18,000-36,000
- Average of P/BV vs. ROE and EV/backlog
12-month target Won 27,000
Upside/Downside % -11.5
12-month TSR % -11.5
Volatility Index Medium
GICS sector Capital Goods
Market cap Wonbn 2,172
Market cap US$m 1,942
Free float % 69
30-day avg turnover US$m 18.4
Number shares on issue m 71.21
Investment fundamentals Year end 31 Dec 2016A 2017E 2018E 2019E
Revenue bn 11,036 12,109 11,472 11,437 EBIT bn 143 229 411 416 EBIT growth % 17.1 59.9 79.8 1.3 Reported profit bn -26 -27 341 359 Adjusted profit bn -14 -17 351 369 EPS rep Won -363 -379 4,802 5,061
EPS rep growth % nmf -4.3 nmf 5.4 EPS adj Won -190 -239 4,942 5,201 EPS adj growth % nmf -25.7 nmf 5.2 PER rep x nmf nmf 6.4 6.0 PER adj x nmf nmf 6.2 5.9 Total DPS Won 0 0 500 500 Total div yield % 0.0 0.0 1.6 1.6 ROA % 1.1 1.8 3.3 3.2 ROE % -0.4 -0.5 9.8 9.3
EV/EBITDA x 16.7 12.0 7.5 7.4 Net debt/equity % 31.0 34.0 10.9 -0.2 P/BV x 0.7 0.6 0.6 0.5
006360 KS rel KOSPI performance, & rec history
Note: Recommendation timeline - if not a continuous line, then there was no Macquarie coverage at the time or there was an embargo period.
Source: FactSet, Macquarie Research, June 2017
(all figures in Won unless noted, TP in KRW)
Analyst(s) James Hong +82 2 3705 8661 [email protected]
7 June 2017 Macquarie Securities Korea Limited
GS E&C Both domestic and overseas trouble Conclusion
We are turning cautious and downgrading our view on the domestic property
market. With GS E&C generating ~70% of its profit from domestic housing,
the business has provided a buffer to its loss-making overseas operations.
But we expect a looming slowdown in the domestic property market will lead
to earnings disappointment and balance sheet deterioration. We raise our TP
to Won27,000 from Won24,000 but retain an Underperform rating.
Impact
We downgrade our view on the domestic property market – threats of
structural change into monthly rental market and reconstruction. We see
the Moon administration turning more aggressive on market intervention
rather than just focusing on housing welfare. The government is introducing a
debt service ratio (DSR) to the property market, which not only considers
collateral (existing LTV and DTI) but also other personal loans.
Fundamentally, we see a threat to 1) the rental market on public rental
housing supply (130k units pa vs average 80k units in 2011-15) due to higher
taxes on small-scale rental operators, and 2) punitive taxes on reconstruction
gains from 2018.
We forecast sequential pre-sale housing decline. Due to a heavy
completion schedule and regulations, we forecast a sequential pre-sale
decline from 26.0k units in 2016 to 23.3k/18.0k units in 2017/18 (vs. 26.0k
guidance for 2017). More importantly, the price decline should drag down
profitability as the domestic housing business contributes 41% of GS E&C’s
revenue and 69% of its profit.
1Q17 overseas margin re-stated lower. GS E&C has re-stated its 1Q17
financial statement, reflecting additional cost from overseas. However, we
believe this may be insufficient given the size of the loss recognized by its
consortium partner (GS E&C – JGC consortium hit by Kuwait CFP, 2 May
2017).
Earnings and target price revision
We slash our EPS forecast for 2017 which is negative. We raise our forecast
for 2018 by 30% on better overseas profitability.We raise our target price to
Won27,000 from Won24,000. Our TP implies 0.6x book value.
Price catalyst
12-month price target: Won27,000 based on an average of P/BV vs. ROE and
EV/backlog methodology.
Catalyst: Housing price and transaction volume, pre-sale launches,
reconstruction activity.
Action and recommendation
Maintain Underperform. We continue to believe GS E&C’s housing margin
(22.6% GPM in 1Q17) is unsustainable. Furthermore, the turnaround in its
overseas business is also slower than the market expects, and we think this
will lead to earnings disappointment in coming quarters.
27

Please refer to page 5 for important disclosures and analyst certification, or on our website
www.macquarie.com/research/disclosures.
HONG KONG
1114 HK Outperform
Price (at 08:50, 06 Jun 2017 GMT) HK$14.40
Valuation HK$ 14.50 - PER
12-month target HK$ 14.50
Upside/Downside % +0.7
12-month TSR % +3.7
Volatility Index Medium
GICS sector Automobiles & Components
Market cap HK$m 72,652
Market cap US$m 9,324
Free float % 58
30-day avg turnover US$m 19.2
Number shares on issue m 5,045
Investment fundamentals Year end 31 Dec 2016A 2017E 2018E 2019E
Revenue m 5,125.1 5,084.0 5,166.0 5,248.0 EBIT m -741.5 -731.4 -739.4 -747.2 EBIT growth % -13.8 1.4 -1.1 -1.1 Reported profit m 3,682.1 4,446.5 6,338.3 8,156.0 EPS rep Rmb 0.73 0.88 1.26 1.62 EPS rep growth % 4.9 20.8 42.5 28.7
PER rep x 17.3 14.3 10.0 7.8 Total DPS Rmb 0.10 0.22 0.38 0.65 Total div yield % 0.8 1.8 3.0 5.1 ROA % -2.6 -2.3 -2.1 -1.9 ROE % 16.9 17.6 21.9 24.5 EV/EBITDA x 16.5 13.7 9.7 7.6 Net debt/equity % -5.1 -5.1 -11.0 -13.7 P/BV x 2.7 2.4 2.0 1.8
1114 HK rel HSI performance, & rec history
Note: Recommendation timeline - if not a continuous line, then there was no Macquarie coverage at the time or there was an embargo period.
Source: FactSet, Macquarie Research, June 2017
(all figures in Rmb unless noted, TP in HKD)
Analyst(s) Macquarie Capital Securities (Japan) Limited Janet Lewis, CFA +81 3 3512 7856 [email protected] Macquarie Capital Limited Allen Yuan +86 21 2412 9009 [email protected]
7 June 2017
Brilliance China Automotive Record sales for most models in May Conclusion
The CPCA (China Passenger Car Association) reported May auto wholesale
shipment data for BMW Brilliance (BBA) after the market close on 6 June. The
JV posted 24% YoY growth in May at 32k units, a strong month considering
the run-out of the old 5 Series. We believe the market should react positively
to the numbers.
We maintain our Outperform rating on Brilliance China in light of the strong
demand for premium brands, solid product line-up, improved operational
outlook and potential increase in dividend payout.
Impact
Most models post record sales in May: BBA’s total shipments jumped 24%
YoY in May to 32k units. We view the sales performance as strong,
considering the run-out of the existing 5 Series (5k, -65% YoY). The 3 Series
(13k, +57%), X1 SUV (9k, +269%), 1 Series (3k, na) and 2 Series Active
Tourer (2k, +61%) all posted record high sales in May.
Sales momentum should remain strong in 2H: While the solid sales may
partly reflect restocking in the channel, we believe BBA’s growth momentum
will continue in 2H17 as demand for premium vehicles remains robust, driven
by new model launches, a steady rise in replacement demand and favourable
consumer sentiment, as we have outlined in our latest report (Premium
provides safe haven, 29 May).
The new 5 Series will be launched on 28 June: As the new 5 Series is
being produced at a new plant in Dadong, the ramp up of production will likely
continue through September. The new model contains a lot of new technology
and overall has been well received.
Well-planned pricing strategy: BBA will adopt a more aggressive pricing
strategy for the new generation 5 Series, instead of pricing high initially and
then discounting following the initial surge in buying. The JV has released the
presales price of the 528Li at Rmb450k, vs. Rmb550.6k for the entry trim of
the old 528Li. We believe this strategy bodes well for the model’s positioning
in the current competitive landscape and also helps protect the brand image –
it has been almost 4 years since discounts on the old 5 Series hit the double-
digit level, based on our ISE survey.
Earnings and target price revision
Our numbers are under review.
Price catalyst
12-month price target: HK$14.50 based on a PER methodology.
Catalyst: Launch of the new 5 Series on 28 June, interim results in August.
Action and recommendation
We maintain our Outperform rating on Brilliance China. The outlook for profit
growth is especially strong in 2018 and 2019, with potential upside to our
estimates from the new X2.
28

Please refer to page 5 for important disclosures and analyst certification, or on our website
www.macquarie.com/research/disclosures.
CHINA
200625 CH Outperform
Price (at 06:42, 06 Jun 2017 GMT) HK$10.25
Valuation HK$ 27.90 - PER
12-month target HK$ 16.70
Upside/Downside % +62.9
12-month TSR % +74.9
Volatility Index High
GICS sector Automobiles & Components
Market cap HK$m 49,231
Market cap US$m 6,318
30-day avg turnover US$m 3.2
Number shares on issue m 4,803
Investment fundamentals Year end 31 Dec 2016A 2017E 2018E 2019E
Revenue m 78,542 81,560 87,337 89,079
EBIT m -466 -363 -375 -22 EBIT growth % -667.4 22.1 -3.2 94.2 Reported profit m 10,285 11,553 12,578 13,294 EPS rep Rmb 2.20 2.41 2.62 2.77 EPS rep growth % 3.1 9.3 8.9 5.7 PER rep x 4.1 3.7 3.4 3.2 Total DPS Rmb 0.64 0.96 1.18 1.32 Total div yield % 7.2 10.7 13.1 14.7 ROA % -0.5 -0.3 -0.3 0.0 ROE % 26.4 25.1 24.3 22.6 EV/EBITDA x 1.7 1.6 1.5 1.6 Net debt/equity % -51.6 -43.3 -41.6 -36.8 P/BV x 1.0 0.9 0.8 0.7
200625 CH rel CSI 300 performance, & rec history
Note: Recommendation timeline - if not a continuous line, then there was no Macquarie coverage at the time or there was an embargo period.
Source: FactSet, Macquarie Research, June 2017
(all figures in Rmb unless noted, TP in HKD)
Analyst(s) Macquarie Capital Securities (Japan) Limited Janet Lewis, CFA +81 3 3512 7856 [email protected] Macquarie Capital Limited Allen Yuan +86 21 2412 9009 [email protected]
7 June 2017
Chongqing Changan Auto (B-Share) Ford recovers off low base Conclusion
Changan reported May wholesale shipment data during market hours on 6
June. Total shipments declined 5% YoY to 196k units. The Ford JV, which is
the key profit contributor, posted 17% YoY sales growth off a low base. The
local brand remained weak, with sales down 10% YoY.
Despite the weaker sales and heightened competition ahead, we view the
stock as attractive for long-term investors due to its low valuations, the lowest
among HK/China auto names at 3.6x 2017E consensus earnings, and high
dividend yield. We maintain our Outperform rating.
Impact
Changan-Ford recovers off low base: Changan-Ford’s auto shipments
grew 17% YoY to 60k units in May, off a low base last year – the JV shut
down its Chongqing Factory in 2Q last year for maintenance. Sales remained
below the trailing 12-month average level for most key models, such as the
new Focus (12k vs. 17k), Kuga (6k vs. 8k), Edge (9k vs. 11k) and Escort (19k
vs. 24k). Looking ahead, the JV faces continued headwinds due to Ford’s
ageing model portfolio in the current competitive environment. The new SUV
models from SAIC-VW, which is a direct competitor to Changan-Ford in the
mid-end market, will compete head-to-head with Ford’s key models, including
the Edge SUV.
Local brand remained weak: Changan’s local brand shipped 117k vehicles,
down 10% YoY in May. Sales of Changan’s two core SUVs, the CS35 (6k, -
52%) and CS75 (11k, -4%), remained under pressure as both models
approach the end of their model cycle. Performance of the other newer
models, such as the CS15 (4k, -30%), CX70 (12k, -18%), Oushang MPV (4k,
-178%) and Ounuo MPV (-30%), also deteriorated. Changan launched the
Lingxuan MPV, which will compete with the Baojun 730, on 18 May. The
company will also launch the CS55 SUV in July. We believe the new models
are likely to partly offset the weak sales trend though overall profitability could
remain weak given heightened competition among domestic brands.
Earnings and target price revision
Our numbers are under review.
Price catalyst
12-month price target: HK$16.70 based on a PER methodology.
Catalyst: Monthly sales; annual results in March
Action and recommendation
Maintain Outperform rating. Changan is also viewed as one of the top picks in
the auto sector by our Quant model.
29

Please refer to page 5 for important disclosures and analyst certification, or on our website
www.macquarie.com/research/disclosures.
HONG KONG
489 HK Neutral
Price (at 13:50, 05 Jun 2017 GMT) HK$9.05
Valuation HK$ 14.10 - PER
12-month target HK$ 7.90
Upside/Downside % -12.7
12-month TSR % -10.1
Volatility Index Medium
GICS sector Automobiles & Components
Market cap HK$m 77,975
Market cap US$m 10,008
Free float % 92
30-day avg turnover US$m 11.8
Number shares on issue m 8,616
Investment fundamentals Year end 31 Dec 2016A 2017E 2018E 2019E
Revenue bn 122.4 149.0 160.3 171.6 EBIT bn 2.6 0.3 0.3 1.2 EBIT growth % 108.9 -88.2 7.3 266.4 Reported profit bn 13.4 11.8 12.5 13.1 EPS rep Rmb 1.55 1.37 1.46 1.53 EPS rep growth % 15.6 -11.6 6.3 4.8
PER rep x 5.1 5.8 5.4 5.2 Total DPS Rmb 0.23 0.21 0.22 0.23 Total div yield % 2.9 2.6 2.8 2.9 ROA % 1.5 0.2 0.2 0.5 ROE % 14.7 11.7 11.4 10.8 EV/EBITDA x 2.5 3.0 2.8 2.6 Net debt/equity % -22.2 -36.3 -39.3 -44.1 P/BV x 0.7 0.6 0.6 0.5
489 HK rel HSI performance, & rec history
Note: Recommendation timeline - if not a continuous line, then there was no Macquarie coverage at the time or there was an embargo period.
Source: FactSet, Macquarie Research, June 2017
(all figures in Rmb unless noted, TP in HKD)
Analyst(s) Macquarie Capital Securities (Japan) Limited Janet Lewis, CFA +81 3 3512 7856 [email protected] Macquarie Capital Limited Allen Yuan +86 21 2412 9009 [email protected]
7 June 2017
Dongfeng Motor Group Honda and Nissan support growth Conclusion
The CPCA (China Passenger Car Association) reported May wholesale
shipment data for Dongfeng Motor Group’s (DFG) key JVs. The Honda JV
maintained double-digit growth in May, though the pace of growth moderated,
likely on destocking of the CR-V ahead of the new model in July. The Nissan
JV should see improving performance later this year, helped by new models.
Dongfeng-PSA remained weak, with sales almost halving YoY.
We maintain our Neutral rating considering the current weakness of the PSA
JV. We would become more positive if the company improved its payout to
shareholders.
Impact
New models should drive Nissan’s growth: The DF-Nissan PV JV shipped
95k vehicles in May, up 5% YoY. Sales of the X-trail (14k, -4%) weakened
due to the product transition – the facelift model was launched on 6 April. We
view the MSRPs of the new model (Rmb179.8–268.8k) as more competitive
compared with the previous generation (MSRP: Rmb209.8–247.8k),
especially the 7-seat trim at Rmb204.8k. The Kicks subcompact SUV, which
is likely to be launched in July, should help support the brand’s growth in 2H.
Sales of the Sylphy (32k, +13%) and Qashqai (14k, +22%) both held up well
in May. The Venucia T90, which was launched in December, shipped 5k units
in May.
The Civic, UR-V and Gienia support Honda: DF-Honda’s wholesale
shipments grew 18% YoY to 56k units in May. The growth was mainly
supported by solid demand for the Civic (13k, +138%) sedan. Our proprietary
ISE survey shows that the model continued to sell with no discount in early
May. New models, including the UR-V (3k) and Gienia (3k), also helped
contribute to the overall growth. Retail sales (link) for the JV, reported earlier
in the week, were slightly higher at 58k units, pointing to a healthy channel
status. The new generation CR-V will be launched in July.
PSA JV’s sales halve: DPCA’s total shipments remained weak, with total
sales down 49% YoY to 24k units in May. Sales of the Citroën brand declined
63% YoY to 8k units. The decline for the Peugeot brand (16k, -38%) was
milder, helped by the 4008 and 5008 SUVs. That said, we don’t believe the
new models, like the 5008, are sufficiently attractive to reverse the sales trend
given the two brands’ low brand equity and poor sales and marketing strategy.
Earnings and target price revision
Our numbers are under review.
Price catalyst
12-month price target: HK$7.90 based on a PER methodology.
Catalyst: Monthly auto sales
Action and recommendation
We maintain our Neutral rating.
30

Please refer to page 4 for important disclosures and analyst certification, or on our website
www.macquarie.com/research/disclosures.
HONG KONG
175 HK Underperform
Price (at 08:50, 06 Jun 2017 GMT) HK$14.40
Valuation HK$ 8.30 - PER
12-month target HK$ 8.30
Upside/Downside % -42.4
12-month TSR % -41.2
Volatility Index High
GICS sector Automobiles & Components
Market cap HK$m 126,734
Market cap US$m 16,266
30-day avg turnover US$m 115.3
Number shares on issue m 8,801
Investment fundamentals Year end 31 Dec 2016A 2017E 2018E 2019E
Revenue m 53,722 79,154 85,841 87,793
EBIT m 5,868 8,052 8,304 8,734 EBIT growth % 83.2 37.2 3.1 5.2 Reported profit m 5,112 6,360 6,571 6,917 EPS rep Rmb 0.58 0.72 0.75 0.79 EPS rep growth % 126.0 24.4 3.3 5.3 PER rep x 21.7 17.4 16.9 16.0 Total DPS Rmb 0.11 0.14 0.15 0.16 Total div yield % 0.9 1.1 1.2 1.2 ROA % 10.7 10.5 9.1 8.8 ROE % 21.6 23.6 20.4 18.4 EV/EBITDA x 13.1 9.7 9.0 8.4 Net debt/equity % -52.0 -39.0 -38.5 -36.5 P/BV x 4.5 3.8 3.2 2.8
175 HK rel HSI performance, & rec history
Note: Recommendation timeline - if not a continuous line, then there was no Macquarie coverage at the time or there was an embargo period.
Source: FactSet, Macquarie Research, June 2017
(all figures in Rmb unless noted, TP in HKD)
Analyst(s) Macquarie Capital Securities (Japan) Limited Janet Lewis, CFA +81 3 3512 7856 [email protected] Macquarie Capital Limited Allen Yuan +86 21 2412 9009 [email protected]
7 June 2017
Geely Automobile Sluggish sedan demand slows sales Conclusion
Geely reported May auto wholesale shipment data after the market close on 6
June. Total auto sales grew 67% YoY to 77k units in May. Shipments again
declined MoM by 12%, as sales of sedans slowed. The pricing on Geely’s key
models were largely stable in early May, compared with late April, according
to our proprietary ISE survey.
We maintain our Underperform rating on Geely due to its demanding
valuations as it approaches tougher comps in 2H.
Impact
Lower sedan sales drag down MoM sales performance: Geely’s total auto
shipments fell to an 8-month low of 77k units, down 12% MoM. The weaker
sales momentum was mainly due to lower demand for sedans. Shipments of
the Vision sedan (7k, -41% MoM) dropped to their lowest level since August
2015. Sales of the Emgrand Xindihao (14k, -12% MoM and 6% YoY) and
Emgrand GL (7k, -20% MoM) sedans also deteriorated. We believe this
reflects the channel inventory adjustment and overall sluggish demand for
sedans in China. Sales of the Emgrand GS (10k, +10% MoM) held up well,
while the other two SUVs, the Boyue (21k, -1% MoM) and Vison SUV (8k,
-17% MoM) posted softer sales. Demand for sedans may deteriorate further
due to intense competition and consumers’ ongoing shift to SUVs.
Potential benefits from the Proton deal, but limited contribution in the
near term: Geely’s parent company entered into agreement with DRB-
HICOM to acquire a 49.9% equity interest in Proton and 51% equity interest in
Lotus in late May. As we have noted (Parent possibly bids for Proton, 24
May), the deal potentially provides an opportunity for Geely to provide
technology to Proton and even expand its market presence in ASEAN
regions, leveraging Proton’s distribution network and manufacturing facilities.
While the deal could eventually be positive for Geely, we see little near-term
impact on earnings.
Pricing stabilises after the adjustment in April: Discounts on Geely models
were largely stable in early May, following the pricing adjustment in April
(4.7%, +0.7ppt MoM), based on our proprietary ISE survey. Discounts on
most new models, including Boyue (3.6%, +0.1ppt MoM), Emgrand GS (2.9%,
+0.2ppt) and Vision SUV (3.1%, +0.1ppt), only posted very slight increases in
early May.
Earnings and target price revision
No change.
Price catalyst
12-month price target: HK$8.30 based on a PER methodology.
Catalyst: Monthly auto sales.
Action and recommendation
We maintain our Underperform rating in light of the slowdown of demand for
sedans, uncertainties around the new Lynk & Co. brand coupled with
demanding valuations.
31

Please refer to page 4 for important disclosures and analyst certification, or on our website
www.macquarie.com/research/disclosures.
HONG KONG
2333 HK Outperform
Price (at 08:50, 06 Jun 2017 GMT) HK$8.73
Valuation HK$ 15.50 - PER
12-month target HK$ 13.50
Upside/Downside % +54.6
12-month TSR % +59.2
Volatility Index High
GICS sector Automobiles & Components
Market cap HK$m 79,681
Market cap US$m 10,227
30-day avg turnover US$m 48.4
Number shares on issue m 9,127
Investment fundamentals Year end 31 Dec 2016A 2017E 2018E 2019E
Revenue bn 98.6 112.6 138.5 156.5
EBIT bn 12.3 12.6 16.1 18.5 EBIT growth % 30.3 2.8 27.5 15.0 Reported profit bn 10.6 10.8 13.8 15.8 EPS rep Rmb 1.16 1.19 1.51 1.73 EPS rep growth % 30.9 2.7 27.1 14.8 PER rep x 6.6 6.4 5.1 4.4 Total DPS Rmb 0.35 0.36 0.45 0.52 Total div yield % 4.6 4.7 5.9 6.8 ROA % 14.9 13.1 14.7 14.8 ROE % 24.6 21.2 23.1 22.6 EV/EBITDA x 4.6 4.5 3.6 3.2 Net debt/equity % -3.9 -4.3 -7.9 -12.4 P/BV x 1.5 1.3 1.1 0.9
2333 HK rel HSI performance, & rec history
Note: Recommendation timeline - if not a continuous line, then there was no Macquarie coverage at the time or there was an embargo period.
Source: FactSet, Macquarie Research, June 2017
(all figures in Rmb unless noted, TP in HKD)
Analyst(s) Macquarie Capital Securities (Japan) Limited Janet Lewis, CFA +81 3 3512 7856 [email protected] Macquarie Capital Limited Allen Yuan +86 21 2412 9009 [email protected]
7 June 2017
Great Wall Motor Company Tripped by product transition Conclusion
Great Wall reported May auto wholesale shipment data after the market close
on 6 June. Total shipments declined 4% YoY to 69k units. We attribute the
decline to the sales disruption caused by the company’s product transition
and overall sluggish auto demand. While we find Great Wall’s valuation
appealing, we believe investors should wait for signs of more success in its
product transition strategy.
Impact
Product transition negatively impacts sales: GWM’s total sales declined
4% YoY to 69k units in May. Shipments of the Haval H6 dropped 6% YoY to
35k units (incl. 7k new H6 and 5k H6 Coupe), partly reflecting the negative
impact from the product transition. Some customers may be waiting to
purchase the new H6 or WEY vv7. As production of the new models ramps,
sales should gradually recover. The launch of the 1.3T trims of the H6 will
further enhance the new model’s performance, especially in lower tier cities
where customers are more sensitive to fuel economy. Sales of the H2 grew
25% YoY to 16k units, supported by the H2s (8k).
More colour on the WEY brand: While the company didn’t report sales for
the WEY brand in May, we believe deliveries were likely in line with the
company’s guidance of ~1k units. The market has indicated concern with the
fuel economy of the new brand. A well-known third party automobile
evaluation agency alleged (link) that the WEY vv7’s fuel consumption could
reach 15L per 100km. That said, our conversation with a WEY dealer in
Hunan indicated that it was unlikely that the model has such a high fuel
consumption level, based on their observation with the test-drive cars.
Further efforts are needed to streamline the product line-up: Our recent
conversations with GWM dealers suggests that there is clear cannibalisation
among some of GWM’s key models, including the new H6 and H6 Coupe,
WEY vv7 and Haval H7 (including H7L). Furthermore, the WEY vv5, which
will be launched in 3Q17, is likely to fall into the same product segment as the
H6. We expect to see more effective pricing and marketing strategies from
GWM to improve product differentiation and minimize internal competition.
Earnings and target price revision
Our numbers are under review.
Price catalyst
12-month price target: HK$13.50 based on a PER methodology.
Catalyst: Monthly auto sales, especially the WEY brand and new H6.
Action and recommendation
Maintain Outperform. While we consider Great Wall’s valuations attractive, in
the near term we would hold off accumulating until there is more clarity on the
strategy for differentiating sales of the Haval and WEY brands, which we
expect to be more evident in 2H.
32

Please refer to page 5 for important disclosures and analyst certification, or on our website
www.macquarie.com/research/disclosures.
CHINA
600104 CH Outperform
Price (at 06:42, 06 Jun 2017 GMT) Rmb29.23
Valuation Rmb 32.00 - PER
12-month target Rmb 32.00
Upside/Downside % +9.5
12-month TSR % +15.0
Volatility Index Medium
GICS sector Automobiles & Components
Market cap Rmbm 322,290
Market cap US$m 47,283
Free float % 16
30-day avg turnover US$m 113.3
Number shares on issue m 11,026
Investment fundamentals Year end 31 Dec 2016A 2017E 2018E 2019E
Revenue bn 756.4 792.4 838.7 880.6 EBIT bn 17.5 23.1 26.5 22.2 EBIT growth % 28.0 32.0 14.8 -16.3 Reported profit bn 32.0 38.8 42.2 40.5 EPS rep Rmb 2.90 3.23 3.52 3.38 EPS rep growth % 7.4 11.3 9.0 -4.0
PER rep x 10.1 9.0 8.3 8.6 Total DPS Rmb 1.45 1.62 1.76 1.69 Total div yield % 5.0 5.5 6.0 5.8 ROA % 3.2 4.1 4.8 3.9 ROE % 17.4 19.3 19.1 16.8 EV/EBITDA x 4.3 4.2 3.9 4.6 Net debt/equity % -33.5 -26.1 -23.0 -23.4 P/BV x 1.7 1.7 1.5 1.4
600104 CH rel HSI performance, & rec history
Note: Recommendation timeline - if not a continuous line, then there was no Macquarie coverage at the time or there was an embargo period.
Source: FactSet, Macquarie Research, June 2017
(all figures in Rmb unless noted, TP in CNY)
Analyst(s) Macquarie Capital Securities (Japan) Limited Janet Lewis, CFA +81 3 3512 7856 [email protected] Macquarie Capital Limited Allen Yuan +86 21 2412 9009 [email protected]
7 June 2017
SAIC Motor (A-Share) Large SUVs improve product mix Conclusion
SAIC reported May wholesale shipment data for SAIC’s key entities after
market close Tuesday. Sales at the SAIC-VW JV edged up 2% YoY, helped
by the success of the new SUVs. The SAIC-GM JV posted flat sales in May,
with the Chevrolet and Cadillac brands’ growth being offset by the weaker
sales for the Buick brand. SAIC local brands’ sales held up well but pricing
deteriorated.
We continue to like SAIC in light of its stable earnings growth and high
dividend yield. We maintain our Outperform rating.
Impact
Success of new models supports SAIC-VW’s sales: Sales at the SAIC-VW
JV edged up 2% YoY to 152k units in May. The sales recovery was supported
by the success of the new SUVs, including the Volkswagen Tiguan L (31k,
including old model), Teramont (6k) and Skoda Kodiaq (3k). Our proprietary
ISE survey showed that the 3 models were all sold with no discount in early
May. We believe the JV’s profitability should hold up well in 2017 underpinned
by the improved product mix and relatively low depreciation and amortisation
costs on older models, such as theLavida, Polo and old Tiguan.
Flat sales for GM JV with solid Chevrolet and Cadillac brands: SAIC-
GM’s sales were flat YoY in May at 141k units, mainly underpinned by the 9%
YoY growth of the Chevrolet brand and the continued strong performance of
the Cadillac brand (14k, +60%). The Buick brand shipped 90k units in May,
down 9% YoY, on tough comps. The new Chevrolet Equinox sold 6k units in
May, a good start after its launch in early April, though the brand started
offering a 2.8% discount for the model.
Local brands’ sales remain above 40k: Sales of the local brands jumped
122% YoY to 40k units in May, supported by continued solid demand for the
Roewe RX5 (17k) and MG ZS (9k) SUVs. Our channel checks in Shanghai
showed that the discount on the Roewe RX5 has increased from Rmb5-9k in
March to Rmb10-13k in mid-May, with inventory available for most key trims.
The MG ZS, which was launched in March, also offered a Rmb5k per unit
discount.
SAIC ranks top in Macquarie Quant Alpha model among global auto
names: Valuation is the key driver for the high score. Multiple return will be
the key stock return contributor on a 12-month horizon. Our quant model
shares our view that dividend yield is also one of the key return drivers.
Earnings and target price revision
Our numbers are under review.
Price catalyst
12-month price target: Rmb32.00 based on a PER methodology.
Catalyst: Monthly auto sales
Action and recommendation
We maintain our Outperform rating.
33
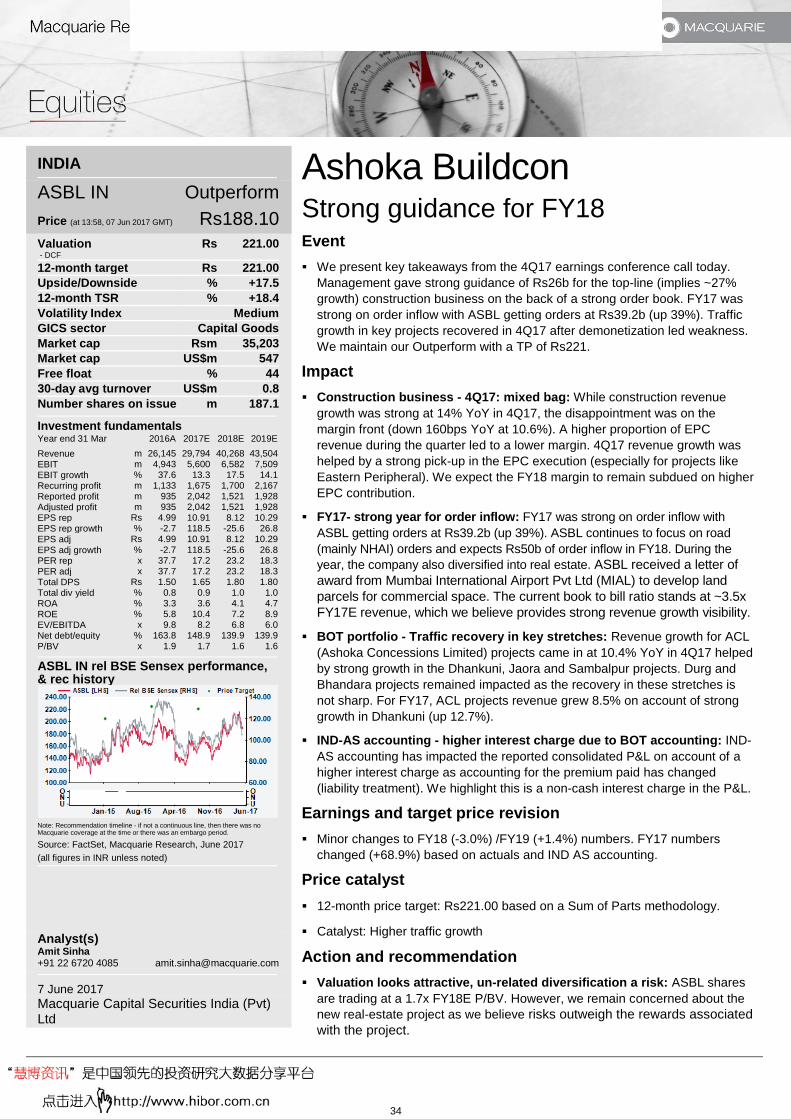
Please refer to page 5 for important disclosures and analyst certification, or on our website
www.macquarie.com/research/disclosures.
INDIA
ASBL IN Outperform
Price (at 13:58, 07 Jun 2017 GMT) Rs188.10
Valuation Rs 221.00 - DCF
12-month target Rs 221.00
Upside/Downside % +17.5
12-month TSR % +18.4
Volatility Index Medium
GICS sector Capital Goods
Market cap Rsm 35,203
Market cap US$m 547
Free float % 44
30-day avg turnover US$m 0.8
Number shares on issue m 187.1
Investment fundamentals Year end 31 Mar 2016A 2017E 2018E 2019E
Revenue m 26,145 29,794 40,268 43,504 EBIT m 4,943 5,600 6,582 7,509 EBIT growth % 37.6 13.3 17.5 14.1 Recurring profit m 1,133 1,675 1,700 2,167 Reported profit m 935 2,042 1,521 1,928 Adjusted profit m 935 2,042 1,521 1,928 EPS rep Rs 4.99 10.91 8.12 10.29 EPS rep growth % -2.7 118.5 -25.6 26.8 EPS adj Rs 4.99 10.91 8.12 10.29
EPS adj growth % -2.7 118.5 -25.6 26.8 PER rep x 37.7 17.2 23.2 18.3 PER adj x 37.7 17.2 23.2 18.3 Total DPS Rs 1.50 1.65 1.80 1.80 Total div yield % 0.8 0.9 1.0 1.0 ROA % 3.3 3.6 4.1 4.7 ROE % 5.8 10.4 7.2 8.9
EV/EBITDA x 9.8 8.2 6.8 6.0 Net debt/equity % 163.8 148.9 139.9 139.9 P/BV x 1.9 1.7 1.6 1.6
ASBL IN rel BSE Sensex performance, & rec history
Note: Recommendation timeline - if not a continuous line, then there was no Macquarie coverage at the time or there was an embargo period.
Source: FactSet, Macquarie Research, June 2017
(all figures in INR unless noted)
Analyst(s) Amit Sinha +91 22 6720 4085 [email protected]
7 June 2017 Macquarie Capital Securities India (Pvt) Ltd
Ashoka Buildcon Strong guidance for FY18 Event
We present key takeaways from the 4Q17 earnings conference call today.
Management gave strong guidance of Rs26b for the top-line (implies ~27%
growth) construction business on the back of a strong order book. FY17 was
strong on order inflow with ASBL getting orders at Rs39.2b (up 39%). Traffic
growth in key projects recovered in 4Q17 after demonetization led weakness.
We maintain our Outperform with a TP of Rs221.
Impact
Construction business - 4Q17: mixed bag: While construction revenue
growth was strong at 14% YoY in 4Q17, the disappointment was on the
margin front (down 160bps YoY at 10.6%). A higher proportion of EPC
revenue during the quarter led to a lower margin. 4Q17 revenue growth was
helped by a strong pick-up in the EPC execution (especially for projects like
Eastern Peripheral). We expect the FY18 margin to remain subdued on higher
EPC contribution.
FY17- strong year for order inflow: FY17 was strong on order inflow with
ASBL getting orders at Rs39.2b (up 39%). ASBL continues to focus on road
(mainly NHAI) orders and expects Rs50b of order inflow in FY18. During the
year, the company also diversified into real estate. ASBL received a letter of
award from Mumbai International Airport Pvt Ltd (MIAL) to develop land
parcels for commercial space. The current book to bill ratio stands at ~3.5x
FY17E revenue, which we believe provides strong revenue growth visibility.
BOT portfolio - Traffic recovery in key stretches: Revenue growth for ACL
(Ashoka Concessions Limited) projects came in at 10.4% YoY in 4Q17 helped
by strong growth in the Dhankuni, Jaora and Sambalpur projects. Durg and
Bhandara projects remained impacted as the recovery in these stretches is
not sharp. For FY17, ACL projects revenue grew 8.5% on account of strong
growth in Dhankuni (up 12.7%).
IND-AS accounting - higher interest charge due to BOT accounting: IND-
AS accounting has impacted the reported consolidated P&L on account of a
higher interest charge as accounting for the premium paid has changed
(liability treatment). We highlight this is a non-cash interest charge in the P&L.
Earnings and target price revision
Minor changes to FY18 (-3.0%) /FY19 (+1.4%) numbers. FY17 numbers
changed (+68.9%) based on actuals and IND AS accounting.
Price catalyst
12-month price target: Rs221.00 based on a Sum of Parts methodology.
Catalyst: Higher traffic growth
Action and recommendation
Valuation looks attractive, un-related diversification a risk: ASBL shares
are trading at a 1.7x FY18E P/BV. However, we remain concerned about the
new real-estate project as we believe risks outweigh the rewards associated
with the project.
34

THAILAND
BTSGIF TB Underperform
Price (at 07:44, 07 Jun 2017 GMT) Bt11.20
Valuation Bt 9.25 - DCF (WACC 7.2%, beta 0.6, ERP 7.0%, RFR 3.0%)
12-month target Bt 9.20
Upside/Downside % -17.9
12-month TSR % -11.0
Volatility Index Low
GICS sector Transportation
Market cap Btm 64,826
Market cap US$m 1,889
Free float % 64
30-day avg turnover US$m 2.0
Number shares on issue m 5,788
Investment fundamentals Year end 31 Mar 2017A 2018E 2019E 2020E
Revenue m 6,636.1 6,896.8 7,158.4 7,468.6 EBIT m 4,482.6 4,420.9 4,685.9 5,141.2 EBIT growth % 11.5 -1.4 6.0 9.7 Reported profit m 4,849.5 4,420.9 4,685.9 5,141.2 Adjusted profit m 4,482.6 4,420.9 4,685.9 5,141.2 EPS rep Bt 0.84 0.76 0.81 0.89 EPS rep growth % -10.4 -8.8 6.0 9.7 EPS adj Bt 0.77 0.76 0.81 0.89 EPS adj growth % 11.5 -1.4 6.0 9.7
PER rep x 13.4 14.7 13.8 12.6 PER adj x 14.5 14.7 13.8 12.6 Total DPS Bt 0.77 0.76 0.81 0.88 Total div yield % 6.9 6.8 7.2 7.9 ROA % 6.7 6.6 7.0 7.7 ROE % 6.7 6.6 7.0 7.7 EV/EBITDA x 14.4 14.7 13.8 12.6
Net debt/equity % -0.1 -0.1 -0.1 -0.1 P/BV x 1.0 1.0 1.0 1.0
BTSGIF TB rel SET performance, & rec history
Note: Recommendation timeline - if not a continuous line, then there was no Macquarie coverage at the time or there was an embargo period.
Source: FactSet, Macquarie Research, June 2017
(all figures in THB unless noted)
Analyst(s) Karn Lertchaipattanakul+66 2694 [email protected]
7 June 2017 Macquarie Securities (Thailand) Limited
BTS Growth Infrastructure Fund Beware of the yield gap Event
We downgrade our recommendation on BTSGIF to Underperform (from
Neutral) following adjustments to our ridership and capex assumptions. While
BTSGIF’s distribution yield of 7% may look attractive, we believe that the gap
between gross yield and amortized yield must be taken into account given the
fund’s finite life. We view amortized yield as a more realistic indicator of the
fund’s yield as it takes into account capital amortization and estimate
BTSGIF’s amortized yield to be 1% which we view as unattractive versus
other infrastructure funds under our coverage. We also note that the future
debottlenecking the Saphan Taksin station may add capex risks to the fund.
Impact
Mind the amortized yield. While BTSGIF’s yield of 7% may look attractive,
we view amortized yield as a more realistic indicator of the fund’s distribution
yield as it takes into account capital amortization given the fund’s finite life.
We estimate BTSGIF’s amortized yield to be 1% which we view as
unattractive versus other infrastructure funds under our coverage which in
addition to yield also provide investors with a terminal value. We also estimate
that at the current price, the fund provides investors with an IRR of 4%.
Farebox growth capped by affordability. We expect the fund to post a 5.2%
CAGR growth in farebox revenues from FY17-29. This is driven by a 3.7%
CAGR growth in ridership from FY17-30 driven by organic ridership growth
and feeder traffic from new lines and extensions. We however see future fare
hikes being constrained by affordability concerns and note that fares have
only been hiked twice since 1999 out of a possible ten attempts.
Risks from future capex. We highlight that the fund’s net investment income
from FY18-FY20 is pressured by capex for network improvement and rolling
stock acquisition and note that any major capex in the future would serve as
downside risks. The fund also faces uncertainty over whether it would be
responsible for any capex required for debottlenecking Saphan Taksin station.
Earnings and target price revision
We reduce our 18E and 19E estimates by 3% and 4%, respectively, and
introduce our 20E estimates. We lower our TP from Bt10.10 to Bt9.20.
Price catalyst
12-month price target: Bt9.20 based on a DCF methodology.
Catalyst: opening of new lines.
Action and recommendation
Downgrade to Underperform (from Neutral) with a reduced TP of Bt9.20 (from
Bt10.10). For yield exposure, we recommend DIF which offers a yield of 7%
while offering upside from the infrastructure sharing thematic.
35

Please refer to page 4 for important disclosures and analyst certification, or on our website
www.macquarie.com/research/disclosures.
JAPAN
8253 JP Neutral
Price (at 06:41, 07 Jun 2017 GMT) ¥2,094
Valuation ¥ 2,200 - Price to Book
12-month target ¥ 2,200
Upside/Downside % +5.1
12-month TSR % +6.7
Volatility Index Medium
GICS sector Diversified Financials
Market cap ¥m 388,321
Market cap US$m 3,516
Free float % 81
30-day avg turnover US$m 16.6
Foreign ownership % 36.51
Number shares on issue m 185.4
Investment fundamentals Year end 31 Mar 2017A 2018E 2019E 2020E
Net interest Inc bn 23.4 25.6 25.9 25.6 Non interest Inc bn 244.5 251.8 266.6 282.6 Revenue bn 267.9 277.5 292.5 308.2 PBT bn 62.2 59.0 57.2 63.9 PBT growth % 28.2 -5.1 -3.1 11.8 Recurring profit bn 62.2 59.0 57.2 63.9 Reported profit bn 42.3 41.0 39.7 44.5 EPS rep ¥ 258.7 251.0 243.1 272.0 EPS rep growth % 78.6 -3.0 -3.2 11.9 PER rep x 8.1 8.3 8.6 7.7 Total DPS ¥ 35.0 35.0 35.0 35.0 Total div yield % 1.7 1.7 1.7 1.7
ROA % 1.6 1.6 1.5 1.7 ROE % 9.8 8.9 8.0 8.3
P/BV x 0.8 0.7 0.7 0.6
8253 JP vs TOPIX, & rec history
Note: Recommendation timeline - if not a continuous line, then there was no Macquarie coverage at the time or there was an embargo period.
Source: FactSet, Macquarie Research, June 2017
(all figures in JPY unless noted)
Analyst(s) Keisuke Moriyama +81 3 3512 7476 [email protected]
7 June 2017 Macquarie Capital Securities (Japan) Limited
Credit Saison Dividend Hike Likely After Overcoming Uncertainties Conclusion
We raise our FY3/18-19 forecasts following contact with Credit Saison (CS).
The biggest change, however, is gains from sale of securities appropriated to
non-operating and extraordinary profits anticipated in FY3/18 and therefore,
we do not revise our basic view.
We expect CS’s appeal as an investment choice to improve once it
overcomes current uncertainties of excess interest refund requests and the
joint mission-critical system and redirects itself toward boosting shareholder
returns. We maintain our Neutral rating.
Impact
Changing settlement scenes: Shopping revolving business continues to
grow at a healthy pace, mainly driven by customers in 30s/40s age groups.
Affiliate card processing activity is vibrant too. We think these areas should
contribute to top-line growth in FY3/18. CS also promotes collaboration with
smartphone settlements handled by Origami and expansion of prepaid cards.
The former item curtails initial investments by stores, and the latter gets users
to experience the convenience and to boost credit-card usage. Both are
expected to build a path toward growth in cashless settlements. We have a
very favourable view of CS’s efforts to change settlement scenes utilizing its
robust marketing skills, which are a key strength.
Flat excess interest refund requests: CS assumes in its guidance that new
requests with third-party involvement are likely to stay at around 2,000 cases
for the year in FY3/18 (vs. FY3/17’s 2,100 cases). It allocated ¥15.9bn to the
interest refund losses allowance in FY3/17. CS explained at the briefing that it
expects the number of new cases to trend lower from 2H FY3/18. However,
some law firms are still continuing their aggressive advertising. We retain our
cautious stance toward the prospect of improved conditions from 2H.
Earnings and target price revision
We increase our FY3/18-19 EPS forecasts by 32% and 13% respectively. We
set our 12-month price target at ¥2,200, based on our FY3/18 BVPS estimate
and 0.75x fair P/B.
Price catalyst
12-month price target: ¥2,200 based on a Price to Book methodology.
Catalyst: 1Q FY3/18 results, trend in the number of excess interest refund
requests, release of the joint mission-critical system (from 2H FY3/18)
Action and recommendation
We maintain our Neutral rating.
36

Please refer to page 11 for important disclosures and analyst certification, or on our website
www.macquarie.com/research/disclosures.
TAIWAN
2231 TT Outperform
Price (at 06:14, 07 六月 2017 GMT) NT$358.50
Valuation NT$ 420.00 - PER
12-month target NT$ 420.00
Upside/Downside % +17.2
12-month TSR % +20.3
Volatility Index Medium
GICS sector Automobiles & Components
Market cap NT$m 32,978
Market cap US$m 1,125
Free float % 47
30-day avg turnover US$m 8.9
Number shares on issue m 91.99
Investment fundamentals Year end 31 Dec 2016A 2017E 2018E 2019E
Revenue m 3,416.5 4,284.1 6,165.0 8,164.2 Adjusted profit m 1,115.9 1,243.2 1,933.8 2,626.5 EPS rep NT$ 11.93 13.51 21.02 28.55 EPS rep growth % 19.9 13.3 55.6 35.8 PER rep x 30.0 26.5 17.1 12.6 Total DPS NT$ 9.88 11.41 11.98 12.58
Total div yield % 2.8 3.2 3.3 3.5 ROE % 36.3 33.9 39.7 38.7 P/BV x 9.6 8.1 5.8 4.2
2231 TT rel TAIEX performance, & rec history
Note: Recommendation timeline - if not a continuous line, then there was no Macquarie coverage at the time or there was an embargo period.
Source: FactSet, Macquarie Research, June 2017
(all figures in NT$ unless noted, TP in TWD)
Analyst(s) Macquarie Capital Limited, Taiwan Securities Branch Louis Cheng, CFA +886 2 2734 7526 [email protected] Jeffrey Ohlweiler +886 2 2734 7512 [email protected] Kaylin Tsai +886 2 2734 7523 [email protected] Macquarie Capital Limited Allen Chang +852 3922 1136 [email protected] Verena Jeng +852 3922 3766 [email protected] Chris Yu +86 21 2412 9024 [email protected]
7 June 2017
CUB YTD growth tracking ahead of guidance; ADAS to come in 3Q Conclusion
Based on CUB’s monthly YTD sales as well as our channel studies (e.g. Lu
Hai, 31 Inc, Standard Motor Products), we believe CUB’s original guidance for
core business growth of 20-30% YoY was too conservative. Combining this
with the positive radar-ADAS (advanced driver-assistance systems) order
feedback from US aftermarket, strengthens our confidence in CUB’s growth
outlook. Our 2018E earnings is 18% above consensus. We raise our TP to
NT$420 (20x 2018E PE) from NT$385 (20x 2018E PE). Reiterate Outperform.
Impact
TPMS – 30% YoY 2017 shipment growth is an easy target. Based on our
conversation with vendors in the supply chain, we believe CUB’s TPMS (tire-
pressure monitoring system) US shipments grew 23-25% YoY in 1Q17, and
we expect additional 25-28% growth YoY in 2Q17. With rising demand
entering 2H17, we expect CUB’s full-year US TPMS universal solution (please
refer to our detailed product analysis) shipments to reach 2.2m units in 2017
(vs 1.7m units in 2016), and EU TPMS universal solution shipments to reach
1.2m units in 2017 (vs 1.1m units in 2016). Overall, we are modelling CUB’s
TPMS universal solution shipments to reach 3.4m units globally in 2017 (vs
2.8m units in 2016), with US ASP to be flat YoY (US$16) and EU ASP to
slightly down YoY (US$18-20 in 2017 vs US$19-21 in 2016). As for retrofit
products, we expect low-single digit shipments growth in 2017E-2019E (vs
200k units in 2016). For our TPMS assumptions, please refer to Fig-3.
ADAS – raising the supply chain curtain. Following our channel studies
(Computex, AutoTronics), we have strong confidence that CUB’s radar-based
ADAS is ready to hit the market with the supply chain well established. We
believe CUB sources single-receiver/transceiver chip from STMicron. For
high-end chips, we expect CUB to source dual-receiver/transceiver chip from
Texas Instruments while procuring BSD (blind spot detection) and RCTA (rear
cross-traffic alert) chips from Freescale. As for controller, we believe CUB has
built a solid relationship with ADI.
Earnings and target price revision
We expect CUB’s monthly sales (excluding Harbinger’s project basis income)
to see sequential growth throughout 2017. Combining this with 10 new radar-
based ADAS production lines in China (NT$5.5bn output value for every 1m
shipments of 24GHz), we raise our 2017E-19E earnings by 2-9% to factor-in
better visibility for ADAS growth. We raise our TP to NT$420 (20x 2018E PE)
from NT$385 (20x 2018E PE). Our target multiple of 20x forward PE is the
company’s upcycle PE vs a peak of 26x, average of 14x and trough of 10x.
Price catalyst
12-month price target: NT$420.00 based on a PER methodology.
Catalyst: TPMS regulatory changes and radar-based ADAS development.
Action and recommendation
Reiterate Outperform. CUB is our top sector pick for its first-mover advantage,
end-to-end solutions and changes in TPMS regulations.
37

Please refer to page 9 for important disclosures and analyst certification, or on our website
www.macquarie.com/research/disclosures.
JAPAN
2432 JP Outperform
Price (at 06:41, 07 Jun 2017 GMT) ¥2,398
Valuation ¥ 1,800-4,400
- PER
12-month target ¥ 2,810
Upside/Downside % +17.2
12-month TSR % +18.6
Volatility Index High
GICS sector Software & Services
Market cap ¥m 361,642
Market cap US$m 3,274
Free float % 68
30-day avg turnover US$m 68.2
Number shares on issue m 150.8
Investment fundamentals Year end 31 Mar 2017A 2018E 2019E 2020E
Revenue bn 143.8 148.8 154.0 154.9 EBIT bn 23.2 33.6 38.4 39.2 EBIT growth % 17.0 45.1 14.1 2.3
Recurring profit bn 25.6 34.7 39.5 40.3 Reported profit bn 30.8 20.0 22.9 23.4 EPS rep ¥ 212.5 137.8 157.7 161.3 EPS rep growth % 170.6 -35.2 14.4 2.3 PER rep x 11.3 17.4 15.2 14.9 Total DPS ¥ 0.0 35.0 40.0 40.0 Total div yield % 0.0 1.5 1.7 1.7 ROA % 8.4 11.0 11.8 11.4 ROE % 14.7 8.4 9.0 8.7 EV/EBITDA x 7.4 6.4 5.7 5.6 Net debt/equity % -30.3 -30.9 -29.5 -28.0
P/BV x 1.5 1.4 1.3 1.2
2432 JP vs TOPIX, & rec history
Note: Recommendation timeline - if not a continuous line, then there was no Macquarie coverage at the time or there was an embargo period.
Source: FactSet, Macquarie Research, June 2017
(all figures in JPY unless noted)
Analyst(s) David Gibson, CFA +81 3 3512 7880 [email protected] Aya Haruyama +81 3 3512 7867 [email protected]
7 June 2017 Macquarie Capital Securities (Japan) Limited
DeNA Co Left Behind Conclusion
We think 1Q OP will beat consensus given the success of DeNA’s Othellonia
mobile game, which is often a top-10 grossing title. However we think the
Nintendo catalyst for Animal Crossing is not until Sept or later and hence the
stock may struggle in between. EPS -16% to -29% to reflect higher
costs/lower prior published Nintendo forecasts. TP from 3300 to 2810.
Outperform. We think the stock looks attractive for Nintendo growth but we
prefer Nintendo (IP holder).
Impact
Nintendo kicker in 2H: We forecast for Animal Crossing to be announced
early Sept and released soon after as discussed in our prior Nintendo report.
Until then we suspect the stock may not perform. Similarly Zelda in 4Q is
some time away as a catalyst for the stock. Longer term we still favour
Nintendo (7479 JP, ¥34,630, OP, TP: ¥36,000) over DeNA because we prefer
to own the IP holder and we think DeNA’s share of smartphone apps will
decline over time. If we are wrong and Nintendo does not partner with other
firms then this could be a positive for DeNA longer term.
DeNA Native JP title doing well: We think in the short term the market has
not noticed the rising success of Othellonia in Japan with rankings rising (#10
gross) and the DAU has continued to build. As a result we forecast 1Q OP of
¥8.8bn as compared to consensus of ¥8.4bn.
Curation maybe: While the company has rationalised the business we think
eventually the company will re-enter the curation business but in a more
controlled way. New businesses lost ¥5.1bn in FY3/17 which we think will
improve to -¥2bn FY3/19 and represents a key driver of profit growth.
Management: The curation issues caused the oversight of the CEO to
increase given he was responsible for the division. We think his swift closing
of the business and external enquiry meant he was able to avoid prosecution
and potentially jail. We like that the founder Namba-san has more
responsibility and is managing the business together with the CEO but we
don’t think the co-managing of the business is sustainable longer term and a
change will occur. Until this is completed the stock also may not perform.
Earnings and target price revision
FY3/18 -17%, FY3/19 -29%, FY3/20 -29%
TP from 3300 (17x FY3/18-19E) to 2810 (19x FY3/18-19E).
Price catalyst
12-month price target: ¥2,810 based on a PER methodology.
Catalyst: 1Q results, Apple event in early Sept for Animal Crossing
announcement
Action and recommendation
Maintain Outperform.
38

Please refer to page 3 for important disclosures and analyst certification, or on our website
www.macquarie.com/research/disclosures.
CHINA
300104 CH Outperform
Price (at 08:50, 02 Jun 2017 GMT) Rmb30.68
Valuation Rmb 40.00 - Sum of Parts
12-month target Rmb 40.00
Upside/Downside % +30.4
12-month TSR % +30.5
Volatility Index High
GICS sector Software & Services
Market cap Rmbm 61,198
Market cap US$m 8,978
Free float % 72
30-day avg turnover US$m 0.0
Number shares on issue m 1,995
Investment fundamentals Year end 31 Dec 2016A 2017E 2018E 2019E
Revenue m 21,987 28,321 35,503 39,743 EBIT m -374 531 1,268 2,696 EBIT growth % -3911.5 nmf 138.9 112.6 Reported profit m 555 640 1,213 2,352 EPS rep Rmb 0.29 0.32 0.59 1.12 EPS rep growth % -6.8 10.6 85.8 90.0 PER rep x 106.5 96.4 51.9 27.3 PER adj x 106.3 96.4 52.0 27.3 Total DPS Rmb 0.03 0.03 0.06 0.19
Total div yield % 0.1 0.1 0.2 0.6 ROA % -1.5 1.4 3.0 6.1 ROE % 7.8 4.5 6.5 11.5 EV/EBITDA x 30.7 16.2 12.0 8.8 Net debt/equity % 47.4 -14.2 1.6 7.3 P/BV x 5.9 3.4 3.3 3.0
300104 CH rel CSI 300 performance, & rec history
Note: Recommendation timeline - if not a continuous line, then there was no Macquarie coverage at the time or there was an embargo period.
Source: FactSet, Macquarie Research, June 2017
(all figures in Rmb unless noted, TP in CNY)
Analyst(s) Wendy Huang, CFA +852 3922 3378 [email protected] Hillman Chan, CFA +852 3922 3716 [email protected] Ivy Luo +852 3922 1507 [email protected] Joe Yu +852 3922 1160 [email protected]
7 June 2017 Macquarie Capital Limited
Leshi Internet (A-Share) Re-prioritizing business focuses Conclusion
Leshi is attending our flagship A-share Conference in Shenzhen on July 4-5.
With investment from Sunac China (1918 HK, HK$14.00, Neutral, TP:
HK$4.43, Wilson Ho) coming in place, we are positive on the recovery in its
core businesses, particularly in TV operations, since late 1Q17. However,
handset, sports and electric vehicle businesses outside of the listed company
remain cash-strapped. Management is re-prioritizing these businesses,
optimising cost and headcount, and seeking external financing. Retain
Outperform.
Impact
TV operations on right track. Leshi targets 7m TV shipments in 2017, up
from about 5m TV in 2016, with an aim to turn hardware GPM positive in 2017
on reasonable pricing and component cost control. We expect the ASP of
Leshi TVs will increase modestly this year as its average TV size expands. On
the other hand, dropping the US$2bn Vizio acquisition recently could save
Leshi cash for its core business. This may seem to impede Leshi's global
expansion, which at this stage is both costly and de-prioritised, in our view.
Reprioritizing cash-strapped businesses. Outside of the listed company,
Leshi is sensibly trimming handset shipments in 2017, following the cash flow
issues of Leshi’s handset business with supply chain since late 2016.
LeSports also dropped the costly broadcast rights for the Asian Football
Confederation games as well as Chinese Super League games. On the other
hand, Faraday Future and Leshi’s auto arm are seeking external financing.
We believe Leshi is taking the right steps to re-prioritize its non-core cash-
strapped businesses, but the process may take some time and can be bumpy.
Cutting US operations on cost rationalisation. Leshi is reportedly cutting
its number of employees from about 400 to less than 100 people in the US
operations. The impacted US operations is mainly on smart TV, smartphones,
set-top boxes and video content, whereas the labour force for the electric
vehicle operation (outside of listed company) in the US stays intact.
Earnings and target price revision
No change.
Price catalyst
12-month price target: Rmb40.00 based on a Sum of Parts methodology.
Catalyst: Injection of Le Vision Pictures, fund raising of entities outside the
listed company, hardware shipments and margins
Action and recommendation
Retain Outperform.
39

Please refer to page 8 for important disclosures and analyst certification, or on our website
www.macquarie.com/research/disclosures.
MALAYSIA
PBK MK Outperform
Price (at 13:50, 05 Jun 2017 GMT) RM20.30
Valuation RM 22.90 - Price to Book
12-month target RM 22.90
Upside/Downside % +12.8
12-month TSR % +15.9
Volatility Index Low
GICS sector Banks
Market cap RMm 78,807
Market cap US$m 18,408
Free float % 62
30-day avg turnover US$m 18.6
Number shares on issue m 3,882
Investment fundamentals Year end 31 Dec 2016A 2017E 2018E 2019E
Net interest Inc m 7,862 8,513 9,259 10,043 Non interest Inc m 2,094 2,154 2,254 2,362 Underlying profit m 6,745 7,112 7,600 8,153 PBT m 6,554 6,810 7,172 7,654 PBT growth % 1.0 3.9 5.3 6.7 Reported profit m 5,207 5,318 5,603 5,983 Adjusted profit m 5,207 5,318 5,603 5,983 EPS rep RM 1.35 1.38 1.45 1.55 EPS rep growth % 2.9 2.1 5.4 6.8
EPS adj RM 1.35 1.38 1.45 1.55 EPS adj growth % 2.9 2.1 5.4 6.8 PER rep x 15.1 14.7 14.0 13.1 PER adj x 15.1 14.7 14.0 13.1 Total DPS RM 0.58 0.63 0.65 0.70 Total div yield % 2.9 3.1 3.2 3.4 ROA % 1.4 1.4 1.4 1.3
ROE % 15.9 14.9 14.7 14.7 P/BV x 2.3 2.1 2.0 1.8
PBK MK rel KLCI performance, & rec history
Note: Recommendation timeline - if not a continuous line, then there was no Macquarie coverage at the time or there was an embargo period.
Source: FactSet, Macquarie Research, June 2017
(all figures in MYR unless noted)
Analyst(s) Anand Pathmakanthan +603 2059 8993 [email protected]
7 June 2017 Macquarie Capital Securities (Malaysia) Sdn. Bhd.
Public Bank Still the soundest credit Conclusion
Post-1Q17 reporting, we raise FY17E-19E forecast earnings by 4-5%, increase
target price to RM22.90 and maintain our Outperform rating. 1Q’s cost-income
ratio (CIR) jump above target is seen to moderate over the year notwithstanding
underlying structural uptrend, with NIM traction and capped credit cost keeping
earnings growth on track. While we flag current modest IT spend and a relative
lack of digital banking initiatives as potential long-term drags on growth drivers,
resources to address slippage are available. Continuing to boast the best
operating ratios, Public’s enduring qualitative strengths make it our favoured
defensive bank. Top sector pick is CIMB, followed by HLBK.
Impact
CIR slippage not unexpected…: jump in Public’s 1Q CIR, to 34.3% (4Q:
31.5%), exceeded management’s 2017 target range of 33-34%, underscoring
its guidance that CIR faces a structural uptrend due to broadly rising operating
(incl. compliance) costs. However, this rise comes from a low base (FY16 CIR
at 32.3% vs. sector average of c.49%) and is incremental given sustained top-
line growth and strong cost control track record, e.g., retail-centric operating
income has grown 46% since FY10 vs. a 3% increase in number of branches.
…and mitigated by NIM, credit cost: we expect strong 1Q NIM (+9bps vs.
4Q) to prove resilient through FY17 as support from generally benign sector
cost of funding is reinforced by favourable deposit dynamics, i.e., shedding of
wholesale deposits (Fig 4), and rising CASA share which, at 25.5%, is highest
since 4Q13. Credit cost (1Q: 9bps) is expected to continue to undershoot
guidance (Fig 7) given high NPL coverage (104%) and accelerating economy.
Low IT spend a potential concern: as underscored by Maybank’s launch of
a FinTech ecosystem and HLBK’s investments in digital banking initiatives
(see our report, Banking above its weight class), Public’s historically low IT
spend is in focus. In 1Q17, Maybank spent RM166m on IT (6% of total opex)
while HLBK spent RM38m (8%) – Public spent RM13.4m (1.5%). It has the
customer base (c.10m), branding and resources to leverage but the cost and
speed at which it can switch its (very) traditional gears remain to be seen.
Earnings and target price revision
We raise our FY17E-19E earnings by 4-5%, from upward adjustment to NIM
and moderated (sustain <15bps) credit costs, putting us marginally above
consensus. Public’s premium valuation is underpinned by i) higher ROE (15%
vs. 9.4% COE); and ii) an all-cash dividend (45% payout) vs. ROE-sapping
dividend reinvestment plans at CIMB and Maybank. Post-earnings revision,
Gordon Growth model-based TP rises to RM22.90 or 2.2x FY18E book value.
Price catalyst
12-month price target: RM22.90 based on a Price to Book methodology.
Catalyst: growing CASA share of deposits; broader non-interest income base,
i.e. trade finance, remittance; accelerating growth in Cambodia and Vietnam.
Action and recommendation
Maintain Outperform rating, with TP revised to RM22.90 (from RM22.00).
40
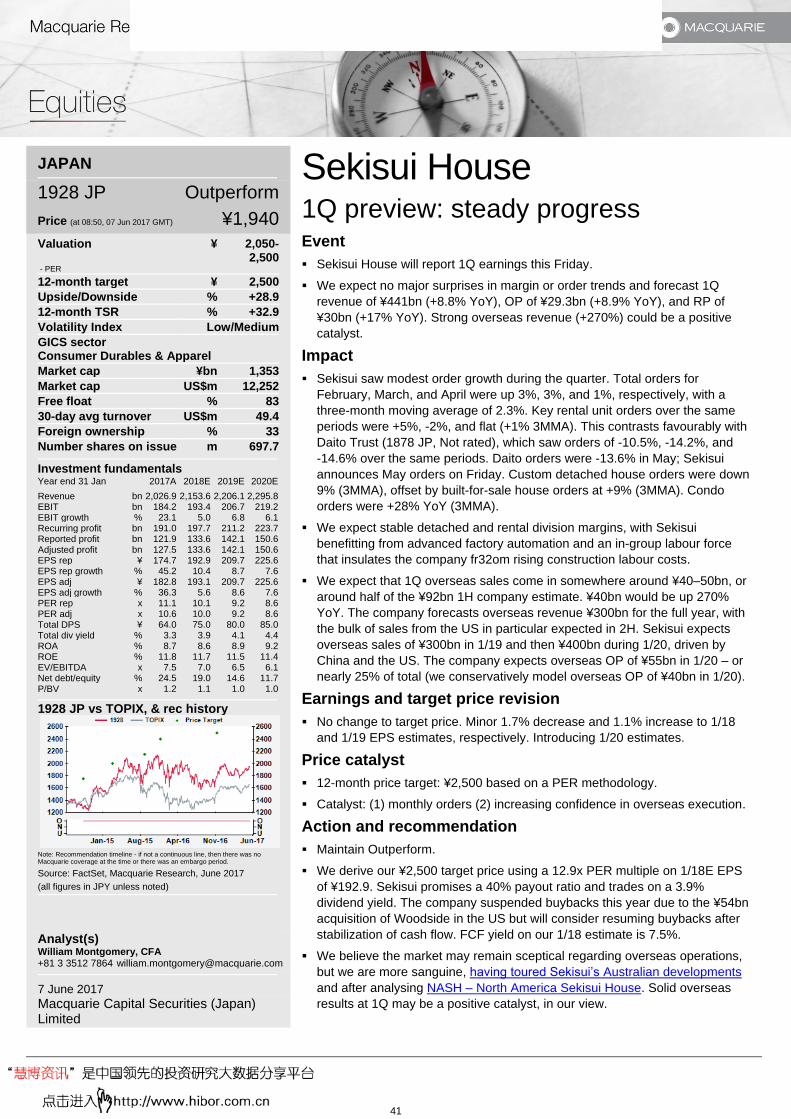
Please refer to page 7 for important disclosures and analyst certification, or on our website
www.macquarie.com/research/disclosures.
JAPAN
1928 JP Outperform
Price (at 08:50, 07 Jun 2017 GMT) ¥1,940
Valuation ¥ 2,050-2,500
- PER
12-month target ¥ 2,500
Upside/Downside % +28.9
12-month TSR % +32.9
Volatility Index Low/Medium
GICS sector Consumer Durables & Apparel
Market cap ¥bn 1,353
Market cap US$m 12,252
Free float % 83
30-day avg turnover US$m 49.4
Foreign ownership % 33
Number shares on issue m 697.7
Investment fundamentals Year end 31 Jan 2017A 2018E 2019E 2020E
Revenue bn 2,026.9 2,153.6 2,206.1 2,295.8 EBIT bn 184.2 193.4 206.7 219.2 EBIT growth % 23.1 5.0 6.8 6.1 Recurring profit bn 191.0 197.7 211.2 223.7 Reported profit bn 121.9 133.6 142.1 150.6 Adjusted profit bn 127.5 133.6 142.1 150.6 EPS rep ¥ 174.7 192.9 209.7 225.6 EPS rep growth % 45.2 10.4 8.7 7.6 EPS adj ¥ 182.8 193.1 209.7 225.6 EPS adj growth % 36.3 5.6 8.6 7.6 PER rep x 11.1 10.1 9.2 8.6 PER adj x 10.6 10.0 9.2 8.6 Total DPS ¥ 64.0 75.0 80.0 85.0 Total div yield % 3.3 3.9 4.1 4.4 ROA % 8.7 8.6 8.9 9.2 ROE % 11.8 11.7 11.5 11.4 EV/EBITDA x 7.5 7.0 6.5 6.1 Net debt/equity % 24.5 19.0 14.6 11.7 P/BV x 1.2 1.1 1.0 1.0
1928 JP vs TOPIX, & rec history
Note: Recommendation timeline - if not a continuous line, then there was no Macquarie coverage at the time or there was an embargo period.
Source: FactSet, Macquarie Research, June 2017
(all figures in JPY unless noted)
Analyst(s) William Montgomery, CFA +81 3 3512 7864 [email protected]
7 June 2017 Macquarie Capital Securities (Japan) Limited
Sekisui House 1Q preview: steady progress Event
Sekisui House will report 1Q earnings this Friday.
We expect no major surprises in margin or order trends and forecast 1Q
revenue of ¥441bn (+8.8% YoY), OP of ¥29.3bn (+8.9% YoY), and RP of
¥30bn (+17% YoY). Strong overseas revenue (+270%) could be a positive
catalyst.
Impact
Sekisui saw modest order growth during the quarter. Total orders for
February, March, and April were up 3%, 3%, and 1%, respectively, with a
three-month moving average of 2.3%. Key rental unit orders over the same
periods were +5%, -2%, and flat (+1% 3MMA). This contrasts favourably with
Daito Trust (1878 JP, Not rated), which saw orders of -10.5%, -14.2%, and
-14.6% over the same periods. Daito orders were -13.6% in May; Sekisui
announces May orders on Friday. Custom detached house orders were down
9% (3MMA), offset by built-for-sale house orders at +9% (3MMA). Condo
orders were +28% YoY (3MMA).
We expect stable detached and rental division margins, with Sekisui
benefitting from advanced factory automation and an in-group labour force
that insulates the company fr32om rising construction labour costs.
We expect that 1Q overseas sales come in somewhere around ¥40–50bn, or
around half of the ¥92bn 1H company estimate. ¥40bn would be up 270%
YoY. The company forecasts overseas revenue ¥300bn for the full year, with
the bulk of sales from the US in particular expected in 2H. Sekisui expects
overseas sales of ¥300bn in 1/19 and then ¥400bn during 1/20, driven by
China and the US. The company expects overseas OP of ¥55bn in 1/20 – or
nearly 25% of total (we conservatively model overseas OP of ¥40bn in 1/20).
Earnings and target price revision
No change to target price. Minor 1.7% decrease and 1.1% increase to 1/18
and 1/19 EPS estimates, respectively. Introducing 1/20 estimates.
Price catalyst
12-month price target: ¥2,500 based on a PER methodology.
Catalyst: (1) monthly orders (2) increasing confidence in overseas execution.
Action and recommendation
Maintain Outperform.
We derive our ¥2,500 target price using a 12.9x PER multiple on 1/18E EPS
of ¥192.9. Sekisui promises a 40% payout ratio and trades on a 3.9%
dividend yield. The company suspended buybacks this year due to the ¥54bn
acquisition of Woodside in the US but will consider resuming buybacks after
stabilization of cash flow. FCF yield on our 1/18 estimate is 7.5%.
We believe the market may remain sceptical regarding overseas operations,
but we are more sanguine, having toured Sekisui’s Australian developments
and after analysing NASH – North America Sekisui House. Solid overseas
results at 1Q may be a positive catalyst, in our view.
41
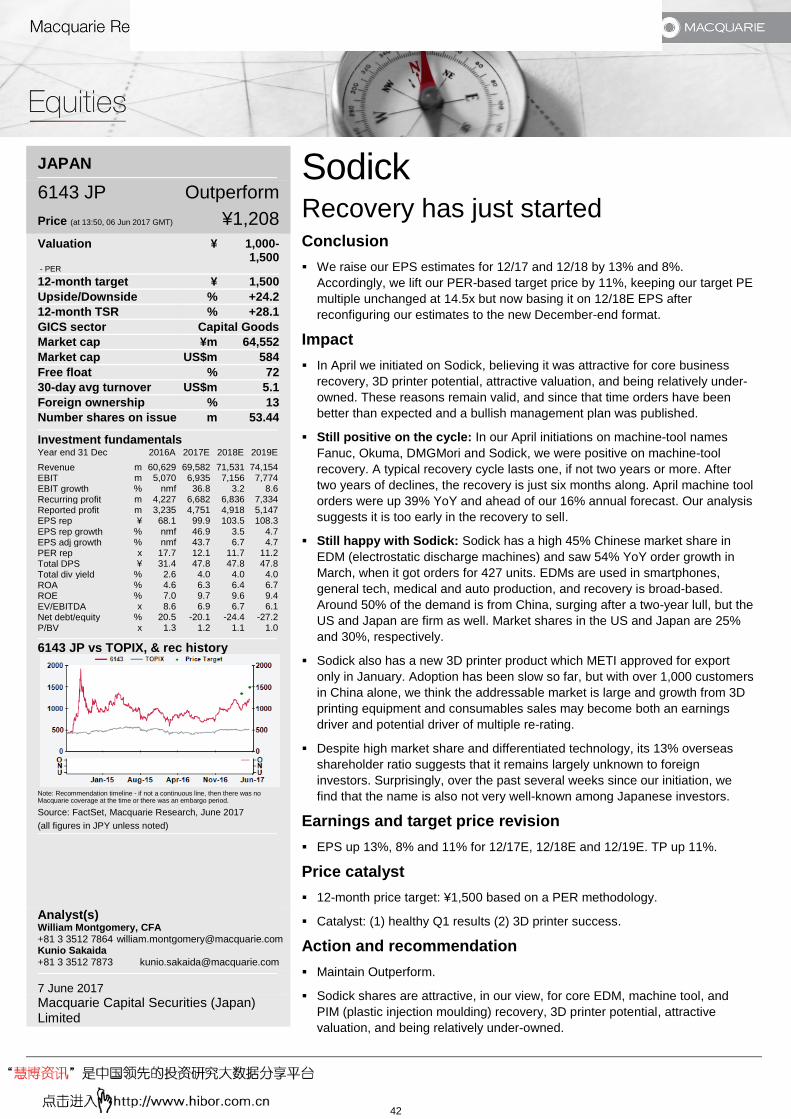
Please refer to page 10 for important disclosures and analyst certification, or on our website
www.macquarie.com/research/disclosures.
JAPAN
6143 JP Outperform
Price (at 13:50, 06 Jun 2017 GMT) ¥1,208
Valuation ¥ 1,000-1,500
- PER
12-month target ¥ 1,500
Upside/Downside % +24.2
12-month TSR % +28.1
GICS sector Capital Goods
Market cap ¥m 64,552
Market cap US$m 584
Free float % 72
30-day avg turnover US$m 5.1
Foreign ownership % 13
Number shares on issue m 53.44
Investment fundamentals Year end 31 Dec 2016A 2017E 2018E 2019E
Revenue m 60,629 69,582 71,531 74,154 EBIT m 5,070 6,935 7,156 7,774 EBIT growth % nmf 36.8 3.2 8.6 Recurring profit m 4,227 6,682 6,836 7,334 Reported profit m 3,235 4,751 4,918 5,147 EPS rep ¥ 68.1 99.9 103.5 108.3
EPS rep growth % nmf 46.9 3.5 4.7 EPS adj growth % nmf 43.7 6.7 4.7 PER rep x 17.7 12.1 11.7 11.2 Total DPS ¥ 31.4 47.8 47.8 47.8 Total div yield % 2.6 4.0 4.0 4.0 ROA % 4.6 6.3 6.4 6.7 ROE % 7.0 9.7 9.6 9.4 EV/EBITDA x 8.6 6.9 6.7 6.1 Net debt/equity % 20.5 -20.1 -24.4 -27.2
P/BV x 1.3 1.2 1.1 1.0
6143 JP vs TOPIX, & rec history
Note: Recommendation timeline - if not a continuous line, then there was no Macquarie coverage at the time or there was an embargo period.
Source: FactSet, Macquarie Research, June 2017
(all figures in JPY unless noted)
Analyst(s) William Montgomery, CFA +81 3 3512 7864 [email protected] Kunio Sakaida +81 3 3512 7873 [email protected]
7 June 2017 Macquarie Capital Securities (Japan) Limited
Sodick Recovery has just started Conclusion
We raise our EPS estimates for 12/17 and 12/18 by 13% and 8%.
Accordingly, we lift our PER-based target price by 11%, keeping our target PE
multiple unchanged at 14.5x but now basing it on 12/18E EPS after
reconfiguring our estimates to the new December-end format.
Impact
In April we initiated on Sodick, believing it was attractive for core business
recovery, 3D printer potential, attractive valuation, and being relatively under-
owned. These reasons remain valid, and since that time orders have been
better than expected and a bullish management plan was published.
Still positive on the cycle: In our April initiations on machine-tool names
Fanuc, Okuma, DMGMori and Sodick, we were positive on machine-tool
recovery. A typical recovery cycle lasts one, if not two years or more. After
two years of declines, the recovery is just six months along. April machine tool
orders were up 39% YoY and ahead of our 16% annual forecast. Our analysis
suggests it is too early in the recovery to sell.
Still happy with Sodick: Sodick has a high 45% Chinese market share in
EDM (electrostatic discharge machines) and saw 54% YoY order growth in
March, when it got orders for 427 units. EDMs are used in smartphones,
general tech, medical and auto production, and recovery is broad-based.
Around 50% of the demand is from China, surging after a two-year lull, but the
US and Japan are firm as well. Market shares in the US and Japan are 25%
and 30%, respectively.
Sodick also has a new 3D printer product which METI approved for export
only in January. Adoption has been slow so far, but with over 1,000 customers
in China alone, we think the addressable market is large and growth from 3D
printing equipment and consumables sales may become both an earnings
driver and potential driver of multiple re-rating.
Despite high market share and differentiated technology, its 13% overseas
shareholder ratio suggests that it remains largely unknown to foreign
investors. Surprisingly, over the past several weeks since our initiation, we
find that the name is also not very well-known among Japanese investors.
Earnings and target price revision
EPS up 13%, 8% and 11% for 12/17E, 12/18E and 12/19E. TP up 11%.
Price catalyst
12-month price target: ¥1,500 based on a PER methodology.
Catalyst: (1) healthy Q1 results (2) 3D printer success.
Action and recommendation
Maintain Outperform.
Sodick shares are attractive, in our view, for core EDM, machine tool, and
PIM (plastic injection moulding) recovery, 3D printer potential, attractive
valuation, and being relatively under-owned.
42

Please refer to page 10 for important disclosures and analyst certification, or on our website
www.macquarie.com/research/disclosures.
JAPAN
5713 JP Neutral
Price (at 13:50, 05 Jun 2017 GMT) ¥1,321
Valuation ¥ 1,450-1,650
- DCF
12-month target ¥ 1,450
Upside/Downside % +9.8
12-month TSR % +12.6
Volatility Index Medium
GICS sector Materials
Market cap ¥m 768,331
Market cap US$m 6,956
30-day avg turnover US$m 65.6
Number shares on issue m 581.6
Investment fundamentals Year end 31 Mar 2017A 2018E 2019E 2020E
Revenue bn 786.1 942.5 979.4 1,009.1
EBIT bn 76.4 79.3 90.8 92.8 EBIT growth % 27.9 3.8 14.5 2.2 Recurring profit bn -1.6 100.2 113.5 119.9 Reported profit bn -18.5 66.7 75.1 80.6
EPS rep ¥ -31.9 114.7 129.1 138.5 EPS rep growth % -5900.0 nmf 12.6 7.3 PER rep x nmf 11.5 10.2 9.5 Total DPS ¥ 11.0 36.0 40.0 40.0 Total div yield % 0.8 2.7 3.0 3.0 ROA % 4.6 4.7 5.3 5.2 ROE % -1.5 6.8 7.3 7.4 EV/EBITDA x 33.0 7.8 7.1 6.8 Net debt/equity % 36.5 33.5 30.3 25.9
P/BV x 0.8 0.8 0.7 0.7
5713 JP vs TOPIX, & rec history
Note: Recommendation timeline - if not a continuous line, then there was no Macquarie coverage at the time or there was an embargo period.
Source: FactSet, Macquarie Research, June 2017
(all figures in JPY unless noted)
Analyst(s) Polina Diyachkina +81 3 3512 7886 [email protected]
7 June 2017 Macquarie Capital Securities (Japan) Limited
Sumitomo Metal Mining Hunting for gold Event
Sumitomo Metal Mining announced the acquisition of a 27.75% stake in the
Cote Gold project in Canada owned by IAMGOLD Corp (IMG CN, C$6.78,
Neutral, TP: C$5.00, Michael Siperco) for US$185mn. The project is at the
final stage of a pre-feasibility study targeting development start-up in 2019
and first metal in 2021. This project adds 3tpa to SMM’s 15tpa gold portfolio
and brings the company a bit closer to its 30tpa long-term gold output target.
Development will require another US$280mn investment from SMM (US$1bn
on 100% basis). The seller IAMGOLD is arguing that cash costs can be
contained at the US$600/oz level and after-tax IRR of 14% achieved.
Impact
The project is located in the province of Ontario, ~120km south-southwest of
Timmins. Capex is US$1bn, total gold production is 5.9mn oz with 17 years
mine life (320k oz, or 10tpa output), average grade 0.94g/t Ag, open pit mine,
average strip ratio 2.85:1. IMGOLD bought it in 2012 for US$505mn.
Comparable multiples. We estimate that project acquisition cost for SMM is
US$119/oz for reserve and US87/oz for resource, which is a bit higher than
the average US$86/oz and US$60/oz, respectively, for undeveloped projects
acquired since 2015 (Fig 1) but is quite similar to projects which our NA gold
analyst Michael Gray believes to be comparable to Cote, such as Goldcorp’s
acquisition of Probe Mines ($101/oz) and Kaminak ($85/oz). His report here.
Pluses – good well developed infrastructure, low geopolitical risk, relatively
low cash costs of US$605/oz compared with other IAMGOLD assets
(US$900/oz), 14% after-tax IRR under US$1,250/oz gold.
Minuses – needs solid gold price environment to make economics work,
requires large upfront capex with unfavourable strip ratio at the early
development stage.
Scale-up optionality. In addition to US$185mn acquisition cost, the project
capex requirement from SMM is US$280mn, which will add 3tpa production to
SMM from 2021. Total 5.9mn oz size has been scaled back from original
9.2mn oz (indicated and inferred resource), which would have provided better
economics but required higher upfront capex, an option for the future.
Earnings and target price revision
No change. The project will not be contributing to profits at least until 2021.
Price catalyst
12-month price target: ¥1,450 based on a PER methodology.
Catalyst: nickel, copper and gold price, additional acquisitions in the space,
developments on EV battery materials.
Action and recommendation
At this point for SMM we are most concerned about nickel due to Chinese
stainless destocking and increased supply. We are positive on gold in 2018.
While Cote’s cost and returns are unlikely to match Hishikari or Pogo gold mine
economics, we think our US$1400/oz 2018 forecast justifies the investment.
43
Please refer to page 22 for important disclosures and analyst certification, or on our website
www.macquarie.com/research/disclosures.
GLOBAL
Why this issue matters to investors
1) As the tailwind of global recovery abates,
investors will focus back on trends. We
forecast modest global growth and low
nominal and real bond yields
17 May 2017 Demographics, productivity,
and neutral rates
24 April 2017 Financial repression for
decades
2) In the absence of headline wage
acceleration, investor perceptions could
swing from “Reflation” to “Deflation”
3) We do not think that the failure of
Japanese wages to accelerate has
international implications; rather it relates
to unique circumstances that are the driver
of Japan’s relatively low capital efficiency,
relatively low ROEs
4) In other words, it is the key to
understanding Japan, and as the cause
abates, it is a medium to long-term Bullish
factor for Japanese equities
5) In contrast, US wage growth for 25-54
year-olds has returned to the 2006 level,
growing now at 3.9% YoY
2 June 2017 US Economics: Welcome to lower potential output
Analyst(s) Peter Eadon-Clarke +81 3 3512 7850 [email protected] Nara Song +81 3 3512 7878 [email protected]
7 June 2017 Macquarie Capital Securities (Japan) Limited
Macq-ro insights Myth-busting: Japanese wages The failure of Japanese total cash earnings to accelerate, below, has caused
concern amongst investors met recently whilst global macro marketing. Rather
than taken positively as a sign of corporate cost control, it has led to increased
investor uncertainty over the sustainability of Japanese economic growth.
Wage, GDP and export growth data, YoY, %
CY 2012 2013 2014 2015 2016 2017 1Q
Base wages -0.3 -1.0 -0.4 0.3 0.2 0.2 Total cash earnings -0.9 -0.4 0.4 0.1 0.5 0.2
Real GDP growth 1.5 2.0 0.3 1.1 1.0 1.6 Nominal GDP growth 0.7 1.7 2.1 3.2 1.3 0.8
Real export growth (*) 2.7 2.5 6.8 Real export growth (**) -0.1 0.8 9.3 2.9 1.2 6.1
Note: (*) is the BOJ’s monthly data of goods export volumes. (**) is the Cabinet Office, quarterly data used in the GDP accounts of goods and services (2014 includes a change in methodology)
Source: BOJ, CAO, Macquarie Research, June 2017
The good news is that sluggish wage growth is attributable to the hiring over
1982-92 of regular employees which proved excessive, in our opinion. This was
a period of labour scarcity, chart below, when Japan’s real GDP growth was
expected to continue at 4% pa. Hired aged 22, these employees are 57-47
years-old now. Regular employees have very high job security in Japan.
A company with excess workers does not increase wages: we believe the
effective reservoir of underemployed regular workers is equivalent to over 10%
of Japan’s workforce, and is currently absorbed in non-core subsidiaries. As they
retire over the next decade, and as low-return businesses are sold or closed, we
expect capital efficiency and labour productivity to improve leading to both higher
ROEs and employee real wages. This is a medium to long-term Bullish factor for
Japanese equities.
BOJ Tankan employment diffusion index, 1974 to latest
Note: The measure is excessive employment minus insufficient employment
Source: BOJ, Macquarie Research, June 2017
-60
-50
-40
-30
-20
-10
0
10
20
30
40
50 (%) Mfg Non-Mfg
44
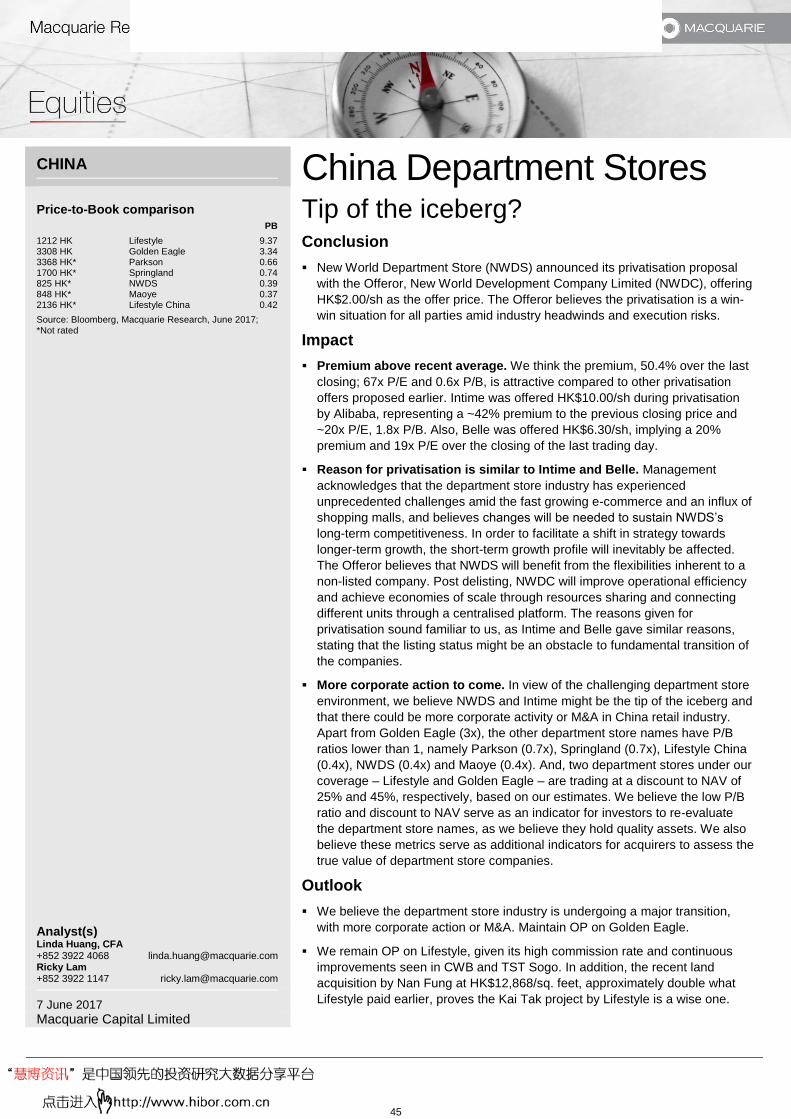
Please refer to page 3 for important disclosures and analyst certification, or on our website
www.macquarie.com/research/disclosures.
CHINA
Price-to-Book comparison
PB
1212 HK Lifestyle 9.37 3308 HK Golden Eagle 3.34 3368 HK* Parkson 0.66 1700 HK* Springland 0.74 825 HK* NWDS 0.39 848 HK* Maoye 0.37 2136 HK* Lifestyle China 0.42
Source: Bloomberg, Macquarie Research, June 2017; *Not rated
Analyst(s) Linda Huang, CFA +852 3922 4068 [email protected] Ricky Lam +852 3922 1147 [email protected]
7 June 2017 Macquarie Capital Limited
China Department Stores Tip of the iceberg? Conclusion
New World Department Store (NWDS) announced its privatisation proposal
with the Offeror, New World Development Company Limited (NWDC), offering
HK$2.00/sh as the offer price. The Offeror believes the privatisation is a win-
win situation for all parties amid industry headwinds and execution risks.
Impact
Premium above recent average. We think the premium, 50.4% over the last
closing; 67x P/E and 0.6x P/B, is attractive compared to other privatisation
offers proposed earlier. Intime was offered HK$10.00/sh during privatisation
by Alibaba, representing a ~42% premium to the previous closing price and
~20x P/E, 1.8x P/B. Also, Belle was offered HK$6.30/sh, implying a 20%
premium and 19x P/E over the closing of the last trading day.
Reason for privatisation is similar to Intime and Belle. Management
acknowledges that the department store industry has experienced
unprecedented challenges amid the fast growing e-commerce and an influx of
shopping malls, and believes changes will be needed to sustain NWDS’s
long-term competitiveness. In order to facilitate a shift in strategy towards
longer-term growth, the short-term growth profile will inevitably be affected.
The Offeror believes that NWDS will benefit from the flexibilities inherent to a
non-listed company. Post delisting, NWDC will improve operational efficiency
and achieve economies of scale through resources sharing and connecting
different units through a centralised platform. The reasons given for
privatisation sound familiar to us, as Intime and Belle gave similar reasons,
stating that the listing status might be an obstacle to fundamental transition of
the companies.
More corporate action to come. In view of the challenging department store
environment, we believe NWDS and Intime might be the tip of the iceberg and
that there could be more corporate activity or M&A in China retail industry.
Apart from Golden Eagle (3x), the other department store names have P/B
ratios lower than 1, namely Parkson (0.7x), Springland (0.7x), Lifestyle China
(0.4x), NWDS (0.4x) and Maoye (0.4x). And, two department stores under our
coverage – Lifestyle and Golden Eagle – are trading at a discount to NAV of
25% and 45%, respectively, based on our estimates. We believe the low P/B
ratio and discount to NAV serve as an indicator for investors to re-evaluate
the department store names, as we believe they hold quality assets. We also
believe these metrics serve as additional indicators for acquirers to assess the
true value of department store companies.
Outlook
We believe the department store industry is undergoing a major transition,
with more corporate action or M&A. Maintain OP on Golden Eagle.
We remain OP on Lifestyle, given its high commission rate and continuous
improvements seen in CWB and TST Sogo. In addition, the recent land
acquisition by Nan Fung at HK$12,868/sq. feet, approximately double what
Lifestyle paid earlier, proves the Kai Tak project by Lifestyle is a wise one.
45

Please refer to page 2 for important disclosures and analyst certification, or on our website www.macquarie.com/research/disclosures.
INDIA
Indian banks - total returns (%)
Reco CMP (Rs)
TP (Rs) TSR (%)
Private banks AXSB IN UP 513.70 470.00 -7.2% HDFCB IN OP 1,635.60 1,735.00 6.8% ICICIBC IN OP 319.80 380.00 20.6% IIB IN OP 1,505.30 1,625.00 8.4% KMB IN N 967.00 840.00 -13.1% YES IN OP 1,523.60 1,800.00 19.1% PSU banks BOB IN UP 178.60 135.00 -23.2% BOI IN UP 146.50 90.00 -38.6% CBK IN UP 362.70 220.00 -38.0% PNB IN UP 153.80 100.00 -33.9% SBIN IN UP 287.30 240.00 -16.4% UNBK IN UP 160.30 110.00 -30.4%
Source: Bloomberg, Macquarie Research, June 2017
Indian bank - valuations
FY19E
Companies P/BV (x) RoE (%) Private banks AXSB IN 1.9 11.5 HDFCB IN 3.6 19.1 ICICIBC IN 1.6 11.1 IIB IN 3.3 18.4 KMB IN 3.5 15.2 YES IN 2.4 19.6 PSU banks BOB IN 0.9 9.0 BOI IN 0.6 1.9 CBK IN 0.7 5.2 PNB IN 0.8 5.3 SBIN IN 1.1 8.3 UNBK IN 0.5 3.2
Source: Bloomberg, Macquarie Research, June 2017
Analyst(s) Suresh Ganapathy, CFA +91 22 6720 4078 [email protected] Sameer Bhise +91 22 6720 4099 [email protected]
7 June 2017 Macquarie Capital Securities India (Pvt) Ltd
India financials More goodies for home-loan companies Conclusion
RBI has further reduced risk-weights and standard asset provisioning
on home loans: Citing better experience in housing loans and historical loss
given defaults being low, RBI has further reduced risk-weights on homes
loans particularly with ticket size greater than Rs7.5mn from 75% to 50% and
has reduced standard asset provisioning across all categories of home loans
from 40bps to 25bps. We expect National Housing Bank to follow RBI’s rules
soon so that housing finance companies can also avail of these benefits.
Impact
We expect 15-50bps reduction in rates across product categories: As per
our calculation, rates across all product categories can potentially reduce by
15-50bps, thereby giving a boost to the home loan market. As we have been
highlighting, the regulator and the government have been very supportive
towards home loan/ affordable housing as a product/segment and hence
growth is likely to be strong in this segment. This bodes well for housing
finance companies (HFCs) and banks that are active in the mortgage space.
Fig 1 Changes in housing loan risk weights/provisioning
Earlier Oct 2015 Now (June 2017)
Ticket LTV Risk Weight
(%)
Ticket LTV Risk Weight
(%)
LTV Risk Weight (%)
Up to Rs2m Upto 90%
50% Up to Rs3m
Less than equal to
80%
35% Less than equal to 80%
35%
Between 80% and
90%
50% Between 80% and
90%
50%
Between Rs2m and Rs7.5m
Upto 80%
50% Between Rs3m and Rs7.5m
Less than equal to
75%
35% Less than equal to
80%
35%
Between 75% and
80%
50%
Above Rs7.5m
Upto 75%
75% Above Rs7.5m
Less than equal to
75%
75% Less than equal to
75%
50%
Standard asset provisioning
0.40% 0.40% 0.25%
Source: RBI, Macquarie Research, June 2017; shaded cells show changed parameters
Reduction in SLR to give more leeway towards implementation of 100%
LCR: Currently banks have excess SLR of 500bps+ and hence a reduction in
SLR by 50bps to 20% is unlikely to have any immediate impact. However
since banks have to transition to 100% LCR by 1st January 2019, RBI has
reduced SLR so that there is greater flexibility in complying with LCR
requirements.
Outlook
We maintain our positive stance on private banks and HFCs.
46

Please refer to page 9 for important disclosures and analyst certification, or on our website
www.macquarie.com/research/disclosures.
GLOBAL
YoY % change in semiconductor sales
Source: WSTS data, Macquarie Research, June 2017
Semiconductor sector recommendations Stock Ticker TP Price Up/Dn Analyst MegaChips 6875 JP 3,850.0 2,631.0 +46% D. Thong ASM Pacific 522 HK 162.0 112.1 +45% P.Liao Samsung Elec. 005930 KS 3,100K 2,297K +35% D. Kim Renesas Elec. 6723 JP 1,210.0 937.0 +29% D. Thong SK Hynix 000660 KS 71,000 56,100 +27% D. Kim Powertech 6239 TT 117.0 92.7 +26% J. Ohlweiler SUMCO 3436 JP 2,330.0 1,886.0 +24% D. Thong GlobalWafers 6488 TT 300 246 +22% P.Liao Cavium CAVM US 85.0 71.0 +20% S. Pajjuri Ulvac 6728 JP 7,380.0 6,300.0 +17% D. Thong Nanya Tech. 2408 TT 63.0 54.0 +17% J. Ohlweiler
Chroma ATE 2360 TT 111.0 96.0 +16% J. Ohlweiler
SMIC 981 HK 9.2 7.9 +16% P.Liao Shin-Etsu Chem. 4063 JP 11,750 10,310 +14% D. Thong Himax Tech. HIMX US 9.0 8.1 +12% L. Luo Micron Tech. MU US 35.0 31.2 +12% S. Pajjuri Tokyo Electron 8035 JP 18,550 16,690 +11% D. Thong Broadcom AVGO US 280.0 252.2 +11% S. Pajjuri ASE 2311 TT 42.5 39.4 +8% P.Liao
Source: Macquarie Research, June 2017 * Prices as of 6 June 2017
Analyst(s) Macquarie Capital Securities (Japan) Limited Damian Thong, CFA +81 3 3512 7877 [email protected] George Chang +81 3 3512 7854 [email protected] Macquarie Securities Korea Limited Daniel Kim +82 2 3705 8641 [email protected] Macquarie Capital Limited, Taiwan Securities Branch Patrick Liao +886 2 2734 7515 [email protected] Jeffrey Ohlweiler +886 2 2734 7512 [email protected] Lynn Luo +886 227347534 [email protected] Macquarie Capital (USA) Inc. Srini Pajjuri +1 4157625018 [email protected]
7 June 2017
Semiconductors Tracker April semiconductor sales +20.9%; FY growth forecast raised to 13% Conclusion
Driven by booming demand – propelled in part by IoT applications in the Age
of Convergence, from connected cars to robots – and strong memory pricing
due to supply tightness, semiconductor sales in April jumped 20.9% YoY to
US$31.3bn. This was 1% above our forecast, and a new record monthly high.
Given the stronger growth momentum, we are lifting our semiconductor
market growth forecast for 2017 to 13% from 12%. Our 2018 growth forecast
is unchanged at 4.5%. We estimate a semiconductor market of US$400bn in
2018, and forecast growth to US$507bn by 2025 (4.6% CAGR, 2017-25E).
Impact
3MMA sales +20.9% YoY and +1.3% MoM to US$31.3bn: This was slightly
stronger than seasonal. 3MMA semiconductor units rose 16.9% YoY and
0.8% MoM, which was slightly softer than seasonal (10-year median: ~2%).
This was offset by strong DRAM pricing. While we expect YoY to peak in May
or June at 21-23% YoY, we do not expect a swing to negative in 2017-18.
3MMA Memory sales rose 61.2% YoY and 2.3% MoM to US$8.58bn,
beating last month’s figure to reach a new high. Notably DRAM sales
jumped 76% YoY and 2.5% MoM to US$4.91bn, accelerating from 68%
YoY growth in March – with ASP/bit up ~30% YoY and ~5% MoM. NAND
flash sales rose 49% YoY and 1.9% MoM to US$3.35bn.
3MMA Non-Memory sales increased 10.5% YoY to US$22.7bn, and was
still seasonally lower than in the 4Q16.
Broad-based demand strength, notably in industrial and automotive, was
underscored by the 12% YoY / 22% YoY growth in discrete
semiconductor sales / units, 14% YoY / 19% YoY growth in analog sales /
units and 14% YoY / 15% YoY growth in microcontroller sales / units.
There were pockets of particular strength – e.g. CMOS image sensor
sales rose 33% YoY, driven by smartphone applications. These were
balanced by areas of tepid growth like microprocessors, where sales
increased just ~5% due to moderate PC volume growth.
Robust capex outlook: Semiconductor Production Equipment (SPE) sales
increased 60% YoY to US$13.2bn in 1Q17. Due to robust memory sector
capex and also increasing investment in areas such as CMOS image sensors
and discretes, we now forecast 20% SPE market growth in 2017 (vs 18%
previously) to US$49.5bn, 12% growth in 2018 and 5% growth in 2019 – with
continuing scope for upside given the flow of new project activity. The capex
plans of Chinese chipmakers – notably emerging memory players such as
Yangtze Memory – will be a key determinant of market size in 2019.
Outlook
We are constructive on the semiconductor sector, which we believe offers
investors durable, long-term growth prospects superior to other sectors (Fig.
2). We have Outperform ratings on chip vendors such as Samsung
Electronics, SK Hynix, SMIC, Renesas, Himax and Broadcom, SPE vendors
such as Tokyo Electron, Ulvac, ASM Pacific and Chroma ATE, and materials
suppliers such as GlobalWafers and SUMCO.
-40%
-30%
-20%
-10%
0%
10%
20%
30%
40%
50%
60%
70%
Ja
n-0
6Ju
l-0
6Ja
n-0
7Ju
l-0
7Ja
n-0
8Ju
l-0
8Ja
n-0
9Ju
l-0
9Ja
n-1
0Ju
l-1
0Ja
n-1
1Ju
l-1
1Ja
n-1
2Ju
l-1
2Ja
n-1
3Ju
l-1
3Ja
n-1
4Ju
l-1
4Ja
n-1
5Ju
l-1
5Ja
n-1
6Ju
l-1
6Ja
n-1
7Ju
l-1
7Ja
n-1
8Ju
l-1
8
YoY % change: 3MMA world semiconductorsector revenues
YoY sales +20.9% YoY in April
47
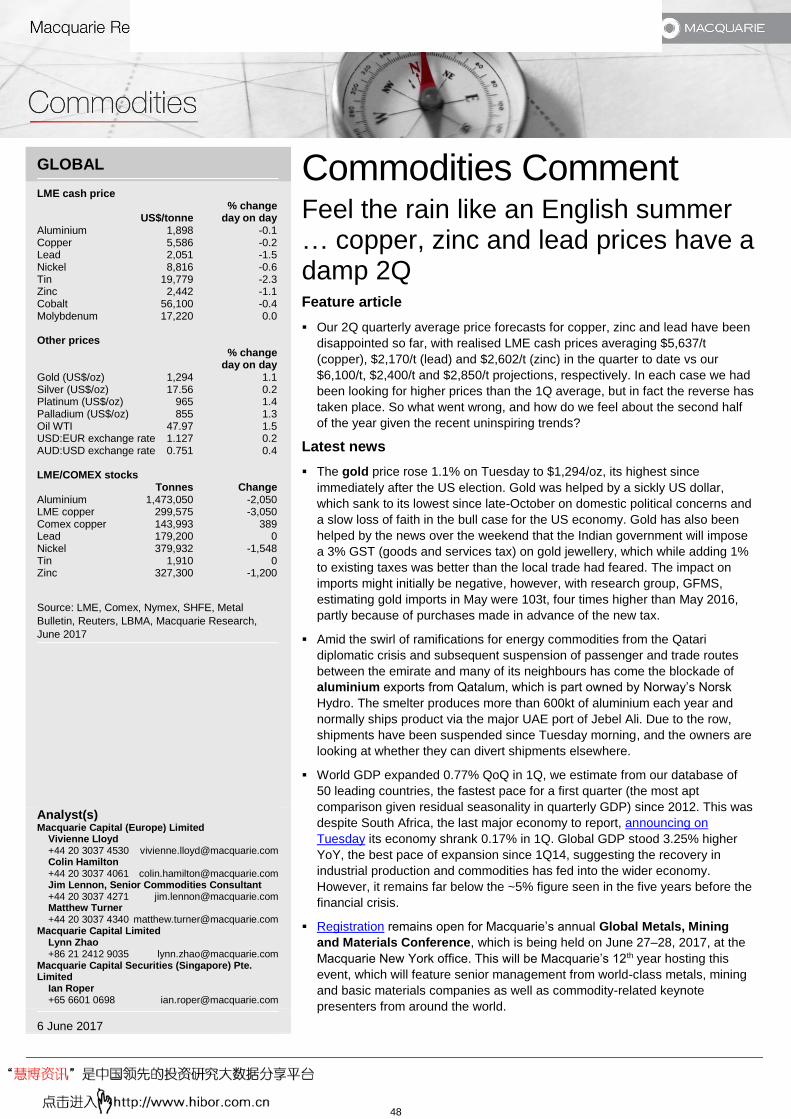
Please refer to page 7 for important disclosures and analyst certification, or on our website
www.macquarie.com/research/disclosures.
GLOBAL
LME cash price % change US$/tonne day on day Aluminium 1,898 -0.1 Copper 5,586 -0.2 Lead 2,051 -1.5 Nickel 8,816 -0.6 Tin 19,779 -2.3 Zinc 2,442 -1.1 Cobalt 56,100 -0.4 Molybdenum 17,220 0.0 Other prices % change day on day Gold (US$/oz) 1,294 1.1 Silver (US$/oz) 17.56 0.2 Platinum (US$/oz) 965 1.4 Palladium (US$/oz) 855 1.3 Oil WTI 47.97 1.5 USD:EUR exchange rate 1.127 0.2 AUD:USD exchange rate 0.751 0.4 LME/COMEX stocks Tonnes Change Aluminium 1,473,050 -2,050 LME copper 299,575 -3,050 Comex copper 143,993 389 Lead 179,200 0 Nickel 379,932 -1,548 Tin 1,910 0 Zinc 327,300 -1,200
Source: LME, Comex, Nymex, SHFE, Metal
Bulletin, Reuters, LBMA, Macquarie Research,
June 2017
Analyst(s) Macquarie Capital (Europe) Limited Vivienne Lloyd +44 20 3037 4530 [email protected] Colin Hamilton +44 20 3037 4061 [email protected] Jim Lennon, Senior Commodities Consultant +44 20 3037 4271 [email protected] Matthew Turner +44 20 3037 4340 [email protected] Macquarie Capital Limited Lynn Zhao +86 21 2412 9035 [email protected] Macquarie Capital Securities (Singapore) Pte. Limited Ian Roper +65 6601 0698 [email protected]
6 June 2017
Commodities Comment Feel the rain like an English summer … copper, zinc and lead prices have a damp 2Q Feature article
Our 2Q quarterly average price forecasts for copper, zinc and lead have been
disappointed so far, with realised LME cash prices averaging $5,637/t
(copper), $2,170/t (lead) and $2,602/t (zinc) in the quarter to date vs our
$6,100/t, $2,400/t and $2,850/t projections, respectively. In each case we had
been looking for higher prices than the 1Q average, but in fact the reverse has
taken place. So what went wrong, and how do we feel about the second half
of the year given the recent uninspiring trends?
Latest news
The gold price rose 1.1% on Tuesday to $1,294/oz, its highest since
immediately after the US election. Gold was helped by a sickly US dollar,
which sank to its lowest since late-October on domestic political concerns and
a slow loss of faith in the bull case for the US economy. Gold has also been
helped by the news over the weekend that the Indian government will impose
a 3% GST (goods and services tax) on gold jewellery, which while adding 1%
to existing taxes was better than the local trade had feared. The impact on
imports might initially be negative, however, with research group, GFMS,
estimating gold imports in May were 103t, four times higher than May 2016,
partly because of purchases made in advance of the new tax.
Amid the swirl of ramifications for energy commodities from the Qatari
diplomatic crisis and subsequent suspension of passenger and trade routes
between the emirate and many of its neighbours has come the blockade of
aluminium exports from Qatalum, which is part owned by Norway’s Norsk
Hydro. The smelter produces more than 600kt of aluminium each year and
normally ships product via the major UAE port of Jebel Ali. Due to the row,
shipments have been suspended since Tuesday morning, and the owners are
looking at whether they can divert shipments elsewhere.
World GDP expanded 0.77% QoQ in 1Q, we estimate from our database of
50 leading countries, the fastest pace for a first quarter (the most apt
comparison given residual seasonality in quarterly GDP) since 2012. This was
despite South Africa, the last major economy to report, announcing on
Tuesday its economy shrank 0.17% in 1Q. Global GDP stood 3.25% higher
YoY, the best pace of expansion since 1Q14, suggesting the recovery in
industrial production and commodities has fed into the wider economy.
However, it remains far below the ~5% figure seen in the five years before the
financial crisis.
Registration remains open for Macquarie’s annual Global Metals, Mining
and Materials Conference, which is being held on June 27–28, 2017, at the
Macquarie New York office. This will be Macquarie’s 12th year hosting this
event, which will feature senior management from world-class metals, mining
and basic materials companies as well as commodity-related keynote
presenters from around the world.
48

Please refer to page 7 for important disclosures and analyst certification, or on our website
www.macquarie.com/research/disclosures.
GLOBAL
LME cash price
% change
US$/tonne day on day
Aluminium 1,903 0.2
Copper 5,592 0.1
Lead 2,041 -0.5
Nickel 8,755 -0.7
Tin 19,412 -1.9
Zinc 2,429 -0.5
Cobalt 56,225 0.2
Molybdenum 17,219 0.0
Other prices
% change
day on day
Gold (US$/oz) 1,291 -0.2
Silver (US$/oz) 17.60 0.2
Platinum (US$/oz) 952 -1.3
Palladium (US$/oz) 843 -1.5
Oil WTI 45.99 -4.1
USD:EUR exchange rate 1.125 -0.2
AUD:USD exchange rate 0.755 0.5
LME/COMEX stocks
Tonnes Change
Aluminium 1,465,650 -7,400
LME copper 294,225 -5,350
Comex copper 144,425 432
Lead 178,175 -1,025
Nickel 379,572 -360
Tin 1,910 0
Zinc 325,975 -1,325
Source: LME, Comex, Nymex, SHFE, Metal
Bulletin, Reuters, LBMA, Macquarie Research,
June 2017
Analyst(s) Macquarie Capital Limited Lynn Zhao +86 21 2412 9035 [email protected] Macquarie Capital Securities (Singapore) Pte. Limited Ian Roper +65 6601 0698 [email protected] Macquarie Capital (Europe) Limited Colin Hamilton +44 20 3037 4061 [email protected] Jim Lennon, Senior Commodities Consultant +44 20 3037 4271 [email protected] Matthew Turner +44 20 3037 4340 [email protected] Vivienne Lloyd +44 20 3037 4530 [email protected]
7 June 2017
Commodities Comment Increased scrap steel usage among Chinese steel mills China has announced that all induction furnaces that make "ground steel" are
to close by the end of June this year. We understand that 119mtpa of
steelmaking capacity from those furnaces has been closed, with estimated
production of 60mtpa. We have begun to see the effect of such closures in the
Chinese steel market, including increased scrap steel usage in mills’ crude
steel, higher scrap steel exports, tighter construction steel supply and a
disconnect to the calculation of Chinese apparent steel consumption.
We believe much of the reported Chinese crude steel production this year is
from increased usage of scrap, and the growth in pig iron that uses iron ore is
not as much as the official data suggested. China still has extra scrap steel
waiting to be digested after the closure of induction furnaces, and it is a good
opportunity to lift the scrap share in steel making and raise EAF production.
The closure of induction furnaces has also reduced construction steel supply
and led to a jump in NBS crude steel production statistics, but real supply
growth and apparent consumption should be much lower than the official data
given this material previously was consumed under the radar.
Latest news
Latest figures from China show that substantial cuts in stainless steel are
under way in the current quarter. According to mill-by-mill data published by
Custeel, May 2017 production was down an estimated 16% YoY and 5%
MoM, as many mills slashed output in response to heavy destocking by
stainless buyers. Based on projected June data, we estimate that second-
quarter Chinese stainless production will fall 10% YoY and 6% QoQ to 5.8mt.
Part of the reason for lower output has been the forced closure by the
Chinese government of more than 4mtpa of unpermitted and small-scale
induction furnace capacity since the middle of 2016. The largest closure was
the 2mtpa Delong plant that closed in August 2016. Delong has been
approved to resume production through capacity replacement, i.e., they
purchased a carbon steel producer in the same province called “Chenggang,”
and they will close 1.4mtpa of old capacity in Chenggang in order to resume
at 1.12mtpa stainless steel capacity. Delong has started to purchase chrome
materials and take on workers and expects restart production soon.
We presented at the 10th Harbor Aluminium Summit on Wednesday on the
outlook for China’s aluminium industry. At the conference there were two
main topics of discussion: the level of current production in China and
potential for cuts and the forthcoming ruling on US tariffs and how much of
this is priced into current ingot premiums. On the former we do believe the
Chinese government is increasingly serious about tackling overcapacity, as
highlighted by the operational audit of smelters currently ongoing. This,
coupled with the likelihood of seasonal closures, is why we have the average
4Q17 LME cash price at $2,050/t, although we do see 3Q being lower than
current levels. On the latter we believe aggressive tariffs on foil are all but
certain, while there may be wider tariffs across other products; however, these
may be token in nature. The big debate surrounds P1020 material, for which
the US imports the majority of its needs, and any tariffs would pass down the
cost chain to the aluminium consumer. We would suggest the current P1020
premium is pricing in around a 5% import tariff expectation over fundamentals.
49
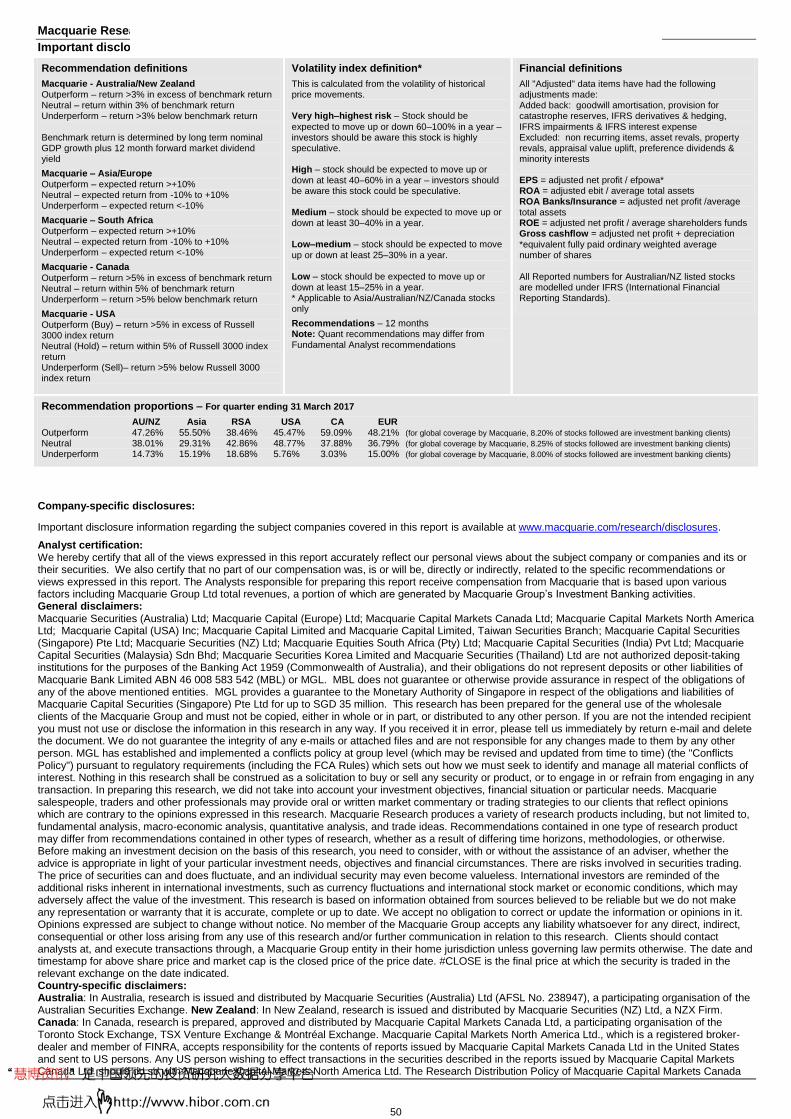
Macquarie Research
Important disclosures:
Recommendation definitions
Macquarie - Australia/New Zealand Outperform – return >3% in excess of benchmark return Neutral – return within 3% of benchmark return Underperform – return >3% below benchmark return Benchmark return is determined by long term nominal GDP growth plus 12 month forward market dividend yield
Macquarie – Asia/Europe Outperform – expected return >+10% Neutral – expected return from -10% to +10% Underperform – expected return <-10%
Macquarie – South Africa Outperform – expected return >+10% Neutral – expected return from -10% to +10% Underperform – expected return <-10%
Macquarie - Canada
Outperform – return >5% in excess of benchmark return Neutral – return within 5% of benchmark return Underperform – return >5% below benchmark return
Macquarie - USA Outperform (Buy) – return >5% in excess of Russell 3000 index return Neutral (Hold) – return within 5% of Russell 3000 index return Underperform (Sell)– return >5% below Russell 3000 index return
Volatility index definition*
This is calculated from the volatility of historical price movements. Very high–highest risk – Stock should be
expected to move up or down 60–100% in a year – investors should be aware this stock is highly speculative. High – stock should be expected to move up or down at least 40–60% in a year – investors should be aware this stock could be speculative. Medium – stock should be expected to move up or down at least 30–40% in a year. Low–medium – stock should be expected to move up or down at least 25–30% in a year. Low – stock should be expected to move up or down at least 15–25% in a year. * Applicable to Asia/Australian/NZ/Canada stocks only
Recommendations – 12 months Note: Quant recommendations may differ from Fundamental Analyst recommendations
Financial definitions
All "Adjusted" data items have had the following adjustments made: Added back: goodwill amortisation, provision for catastrophe reserves, IFRS derivatives & hedging, IFRS impairments & IFRS interest expense Excluded: non recurring items, asset revals, property revals, appraisal value uplift, preference dividends & minority interests EPS = adjusted net profit / efpowa* ROA = adjusted ebit / average total assets ROA Banks/Insurance = adjusted net profit /average total assets ROE = adjusted net profit / average shareholders funds Gross cashflow = adjusted net profit + depreciation *equivalent fully paid ordinary weighted average number of shares All Reported numbers for Australian/NZ listed stocks are modelled under IFRS (International Financial Reporting Standards).
Recommendation proportions – For quarter ending 31 March 2017
AU/NZ Asia RSA USA CA EUR Outperform 47.26% 55.50% 38.46% 45.47% 59.09% 48.21% (for global coverage by Macquarie, 8.20% of stocks followed are investment banking clients) Neutral 38.01% 29.31% 42.86% 48.77% 37.88% 36.79% (for global coverage by Macquarie, 8.25% of stocks followed are investment banking clients) Underperform 14.73% 15.19% 18.68% 5.76% 3.03% 15.00% (for global coverage by Macquarie, 8.00% of stocks followed are investment banking clients)
Company-specific disclosures: Important disclosure information regarding the subject companies covered in this report is available at www.macquarie.com/research/disclosures.
Analyst certification: We hereby certify that all of the views expressed in this report accurately reflect our personal views about the subject company or companies and its or their securities. We also certify that no part of our compensation was, is or will be, directly or indirectly, related to the specific recommendations or views expressed in this report. The Analysts responsible for preparing this report receive compensation from Macquarie that is based upon various factors including Macquarie Group Ltd total revenues, a portion of which are generated by Macquarie Group’s Investment Banking activities. General disclaimers: Macquarie Securities (Australia) Ltd; Macquarie Capital (Europe) Ltd; Macquarie Capital Markets Canada Ltd; Macquarie Capital Markets North America Ltd; Macquarie Capital (USA) Inc; Macquarie Capital Limited and Macquarie Capital Limited, Taiwan Securities Branch; Macquarie Capital Securities (Singapore) Pte Ltd; Macquarie Securities (NZ) Ltd; Macquarie Equities South Africa (Pty) Ltd; Macquarie Capital Securities (India) Pvt Ltd; Macquarie Capital Securities (Malaysia) Sdn Bhd; Macquarie Securities Korea Limited and Macquarie Securities (Thailand) Ltd are not authorized deposit-taking institutions for the purposes of the Banking Act 1959 (Commonwealth of Australia), and their obligations do not represent deposits or other liabilities of Macquarie Bank Limited ABN 46 008 583 542 (MBL) or MGL. MBL does not guarantee or otherwise provide assurance in respect of the obligations of any of the above mentioned entities. MGL provides a guarantee to the Monetary Authority of Singapore in respect of the obligations and liabilities of Macquarie Capital Securities (Singapore) Pte Ltd for up to SGD 35 million. This research has been prepared for the general use of the wholesale clients of the Macquarie Group and must not be copied, either in whole or in part, or distributed to any other person. If you are not the intended recipient you must not use or disclose the information in this research in any way. If you received it in error, please tell us immediately by return e-mail and delete the document. We do not guarantee the integrity of any e-mails or attached files and are not responsible for any changes made to them by any other person. MGL has established and implemented a conflicts policy at group level (which may be revised and updated from time to time) (the "Conflicts Policy") pursuant to regulatory requirements (including the FCA Rules) which sets out how we must seek to identify and manage all material conflicts of interest. Nothing in this research shall be construed as a solicitation to buy or sell any security or product, or to engage in or refrain from engaging in any transaction. In preparing this research, we did not take into account your investment objectives, financial situation or particular needs. Macquarie salespeople, traders and other professionals may provide oral or written market commentary or trading strategies to our clients that reflect opinions which are contrary to the opinions expressed in this research. Macquarie Research produces a variety of research products including, but not limited to, fundamental analysis, macro-economic analysis, quantitative analysis, and trade ideas. Recommendations contained in one type of research product may differ from recommendations contained in other types of research, whether as a result of differing time horizons, methodologies, or otherwise. Before making an investment decision on the basis of this research, you need to consider, with or without the assistance of an adviser, whether the advice is appropriate in light of your particular investment needs, objectives and financial circumstances. There are risks involved in securities trading. The price of securities can and does fluctuate, and an individual security may even become valueless. International investors are reminded of the additional risks inherent in international investments, such as currency fluctuations and international stock market or economic conditions, which may adversely affect the value of the investment. This research is based on information obtained from sources believed to be reliable but we do not make any representation or warranty that it is accurate, complete or up to date. We accept no obligation to correct or update the information or opinions in it. Opinions expressed are subject to change without notice. No member of the Macquarie Group accepts any liability whatsoever for any direct, indirect, consequential or other loss arising from any use of this research and/or further communication in relation to this research. Clients should contact analysts at, and execute transactions through, a Macquarie Group entity in their home jurisdiction unless governing law permits otherwise. The date and timestamp for above share price and market cap is the closed price of the price date. #CLOSE is the final price at which the security is traded in the relevant exchange on the date indicated. Country-specific disclaimers: Australia: In Australia, research is issued and distributed by Macquarie Securities (Australia) Ltd (AFSL No. 238947), a participating organisation of the Australian Securities Exchange. New Zealand: In New Zealand, research is issued and distributed by Macquarie Securities (NZ) Ltd, a NZX Firm. Canada: In Canada, research is prepared, approved and distributed by Macquarie Capital Markets Canada Ltd, a participating organisation of the Toronto Stock Exchange, TSX Venture Exchange & Montréal Exchange. Macquarie Capital Markets North America Ltd., which is a registered broker-dealer and member of FINRA, accepts responsibility for the contents of reports issued by Macquarie Capital Markets Canada Ltd in the United States and sent to US persons. Any US person wishing to effect transactions in the securities described in the reports issued by Macquarie Capital Markets Canada Ltd should do so with Macquarie Capital Markets North America Ltd. The Research Distribution Policy of Macquarie Capital Markets Canada
50
Macquarie Research
Ltd is to allow all clients that are entitled to have equal access to our research. United Kingdom: In the United Kingdom, research is issued and distributed by Macquarie Capital (Europe) Ltd, which is authorised and regulated by the Financial Conduct Authority (No. 193905). Germany: In Germany, this research is issued and/or distributed by Macquarie Capital (Europe) Limited, Niederlassung Deutschland, which is authorised and regulated by the UK Financial Conduct Authority (No. 193905). and in Germany by BaFin. France: In France, research is issued and distributed by Macquarie Capital (Europe) Ltd, which is authorised and regulated in the United Kingdom by the Financial Conduct Authority (No. 193905). Hong Kong & Mainland China: In Hong Kong, research is issued and distributed by Macquarie Capital Limited, which is licensed and regulated by the Securities and Futures Commission. In Mainland China, Macquarie Securities (Australia) Limited Shanghai Representative Office only engages in non-business operational activities excluding issuing and distributing research. Only non-A share research is distributed into Mainland China by Macquarie Capital Limited. Japan: In Japan, research is Issued and distributed by Macquarie Capital Securities (Japan) Limited, a member of the Tokyo Stock Exchange, Inc. and Osaka Exchange, Inc. (Financial Instruments Firm, Kanto Financial Bureau (kin-sho) No. 231, a member of Japan Securities Dealers Association). India: In India, research is issued and distributed by Macquarie Capital Securities (India) Pvt. Ltd. (CIN: U65920MH1995PTC090696), 92, Level 9, 2 North Avenue, Maker Maxity, Bandra Kurla Complex, Bandra (East), Mumbai – 400 051, India, which is a SEBI registered Research Analyst having registration no. INH000000545. Malaysia: In Malaysia, research is issued and distributed by Macquarie Capital Securities (Malaysia) Sdn. Bhd. (Company registration number: 463469-W) which is a Participating Organisation of Bursa Malaysia Berhad and a holder of Capital Markets Services License issued by the Securities Commission. Taiwan: In Taiwan, research is issued and distributed by Macquarie Capital Limited, Taiwan Securities Branch, which is licensed and regulated by the Financial Supervisory Commission. No portion of the report may be reproduced or quoted by the press or any other person without authorisation from Macquarie. Nothing in this research shall be construed as a solicitation to buy or sell any security or product. The recipient of this report shall not engage in any activities which may give rise to potential conflicts of interest to the report. Research Associate(s) in this report who are registered as Clerks only assist in the preparation of research and are not engaged in writing the research. Thailand: In Thailand, research is produced, issued and distributed by Macquarie Securities (Thailand) Ltd. Macquarie Securities (Thailand) Ltd. is a licensed securities company that is authorized by the Ministry of Finance, regulated by the Securities and Exchange Commission of Thailand and is an exchange member of the Stock Exchange of Thailand. The Thai Institute of Directors Association has disclosed the Corporate Governance Report of Thai Listed Companies made pursuant to the policy of the Securities and Exchange Commission of Thailand. Macquarie Securities (Thailand) Ltd does not endorse the result of the Corporate Governance Report of Thai Listed Companies but this Report can be accessed at: http://www.thai-iod.com/en/publications.asp?type=4. South Korea: In South Korea, unless otherwise stated, research is prepared, issued and distributed by Macquarie Securities Korea Limited, which is regulated by the Financial Supervisory Services. Information on analysts in MSKL is disclosed at http://dis.kofia.or.kr/websquare/index.jsp?w2xPath=/wq/fundMgr/DISFundMgrAnalystStut.xml&divisionId=MDIS03002001000000&serviceId=SDIS03002001000. South Africa: In South Africa, research is issued and distributed by Macquarie Equities South Africa (Pty) Ltd, a member of the JSE Limited. Singapore: In Singapore, research is issued and distributed by Macquarie Capital Securities (Singapore) Pte Ltd (Company Registration Number: 198702912C), a Capital Markets Services license holder under the Securities and Futures Act to deal in securities and provide custodial services in Singapore. Pursuant to the Financial Advisers (Amendment) Regulations 2005, Macquarie Capital Securities (Singapore) Pte Ltd is exempt from complying with sections 25, 27 and 36 of the Financial Advisers Act. All Singapore-based recipients of research produced by Macquarie Capital (Europe) Limited, Macquarie Capital Markets Canada Ltd, Macquarie Equities South Africa (Pty) Ltd and Macquarie Capital (USA) Inc. represent and warrant that they are institutional investors as defined in the Securities and Futures Act. United States: In the United States, research is issued and distributed by Macquarie Capital (USA) Inc., which is a registered broker-dealer and member of FINRA. Macquarie Capital (USA) Inc, accepts responsibility for the content of each research report prepared by one of its non-US affiliates when the research report is distributed in the United States by Macquarie Capital (USA) Inc. Macquarie Capital (USA) Inc.’s affiliate’s analysts are not registered as research analysts with FINRA, may not be associated persons of Macquarie Capital (USA) Inc., and therefore may not be subject to FINRA rule restrictions on communications with a subject company, public appearances, and trading securities held by a research analyst account. Information regarding futures is provided for reference purposes only and is not a solicitation for purchases or sales of futures. Any persons receiving this report directly from Macquarie Capital (USA) Inc. and wishing to effect a transaction in any security described herein should do so with Macquarie Capital (USA) Inc. Important disclosure information regarding the subject companies covered in this report is available at www.macquarie.com/research/disclosures, or contact your registered representative at 1-888-MAC-STOCK, or write to the Supervisory Analysts, Research Department, Macquarie Securities, 125 W.55th Street, New York, NY 10019. © Macquarie Group
51

Asia Research Head of Equity Research
Peter Redhead (Global – Head) (852) 3922 4836
Jake Lynch (Asia – Head) (852) 3922 3583
David Gibson (Japan – Head) (813) 3512 7880
Conrad Werner (ASEAN – Head) (65) 6601 0182
Automobiles/Auto Parts
Janet Lewis (China, Japan) (813) 3512 7856
James Hong (Korea) (822) 3705 8661
Amit Mishra (India) (9122) 6720 4084
Financials
Scott Russell (Asia) (852) 3922 3567
Dexter Hsu (China, Taiwan) (8862) 2734 7530
Keisuke Moriyama (Japan) (813) 3512 7476
Chan Hwang (Korea) (822) 3705 8643
Suresh Ganapathy (India) (9122) 6720 4078
Sameer Bhise (India) (9122) 6720 4099
Gilbert Lopez (Philippines) (632) 857 0892
Ken Ang (Singapore) (65) 6601 0836
Passakorn Linmaneechote (Thailand) (662) 694 7728
Conglomerates
David Ng (China, Hong Kong) (852) 3922 1291
Conrad Werner (Singapore) (65) 6601 0182
Gilbert Lopez (Philippines) (632) 857 0892
Consumer and Gaming
Linda Huang (Asia, China, Hong Kong) (852) 3922 4068
Zibo Chen (China, Hong Kong) (852) 3922 1130
Terence Chang (China, Hong Kong) (852) 3922 3581
Sunny Chow (China, Hong Kong) (852) 3922 3768
Satsuki Kawasaki (Japan) (813) 3512 7870
Kwang Cho (Korea) (822) 3705 4953
KJ Lee (Korea) (822) 3705 9935
Stella Li (Taiwan) (8862) 2734 7514
Amit Sinha (India) (9122) 6720 4085
Fransisca Widjaja (65) 6601 0847 (Indonesia, Singapore)
Karisa Magpayo (Philippines) (632) 857 0899
Chalinee Congmuang (Thailand) (662) 694 7993
Emerging Leaders
Jake Lynch (Asia) (852) 3922 3583
Aditya Suresh (Asia) (852) 3922 1265
Timothy Lam (China, Hong Kong) (852) 3922 1086
Kwang Cho (Korea) (822) 3705 4953
Corinne Jian (Taiwan) (8862) 2734 7522
Marcus Yang (Taiwan) (8862) 2734 7532
Conrad Werner (ASEAN) (65) 6601 0182
Industrials
Janet Lewis (Asia) (813) 3512 7856
Patrick Dai (China) (8621) 2412 9082
Kunio Sakaida (Japan) (813) 3512 7873
William Montgomery (Japan) (813) 3512 7864
James Hong (Korea) (822) 3705 8661
Benson Pan (Taiwan) (8862) 2734 7527
Inderjeetsingh Bhatia (India) (9122) 6720 4087
Justin Chiam (Singapore) (65) 6601 0560
Internet, Media and Software
Wendy Huang (Asia, China) (852) 3922 3378
David Gibson (Asia, Japan) (813) 3512 7880
Hillman Chan (China, Hong Kong) (852) 3922 3716
Soyun Shin (Korea) (822) 3705 8659
Abhishek Bhandari (India) (9122) 6720 4088
Oil, Gas and Petrochemicals
Polina Diyachkina (Asia, Japan) (813) 3512 7886
Aditya Suresh (Asia, China, India) (852) 3922 1265
Anna Park (Korea) (822) 3705 8669
Isaac Chow (Malaysia) (603) 2059 8982
Pharmaceuticals and Healthcare
Abhishek Singhal (India) (9122) 6720 4086
Wei Li (China, Hong Kong) (852) 3922 5494
Property
Tuck Yin Soong (Asia, Singapore) (65) 6601 0838
David Ng (China, Hong Kong) (852) 3922 1291
Raymond Liu (China, Hong Kong) (852) 3922 3629
Wilson Ho (China) (852) 3922 3248
William Montgomery (Japan) (813) 3512 7864
Corinne Jian (Taiwan) (8862) 2734 7522
Abhishek Bhandari (India) (9122) 6720 4088
Aiman Mohamad (Malaysia) (603) 2059 8986
Kervin Sisayan (Philippines) (632) 857 0893
Patti Tomaitrichitr (Thailand) (662) 694 7727
Resources / Metals and Mining
Polina Diyachkina (Asia, Japan) (813) 3512 7886
Coria Chow (China) (852) 3922 1181
Anna Park (Korea) (822) 3705 8669
Sumangal Nevatia (India) (9122) 6720 4093
Technology
Damian Thong (Asia, Japan) (813) 3512 7877
George Chang (Japan) (813) 3512 7854
Daniel Kim (Korea) (822) 3705 8641
Allen Chang (Greater China) (852) 3922 1136
Jeffrey Ohlweiler (Greater China) (8862) 2734 7512
Patrick Liao (Greater China) (8862) 2734 7515
Louis Cheng (Greater China) (8862) 2734 7526
Kaylin Tsai (Greater China) (8862) 2734 7523
Telecoms
Soyun Shin (Korea) (822) 3705 8659
Prem Jearajasingam (ASEAN) (603) 2059 8989
Kervin Sisayan (Philippines) (632) 857 0893
Transport & Infrastructure
Janet Lewis (Asia) (852) 3922 5417
Corinne Jian (Taiwan) (8862) 2734 7522
Azita Nazrene (ASEAN) (603) 2059 8980
Utilities & Renewables
Patrick Dai (China) (8621) 2412 9082
Candice Chen (China) (8621) 2412 9087
Alan Hon (Hong Kong) (852) 3922 3589
Inderjeetsingh Bhatia (India) (9122) 6720 4087
Prem Jearajasingam (Malaysia) (603) 2059 8989
Karisa Magpayo (Philippines) (632) 857 0899
Commodities
Colin Hamilton (Global) (44 20) 3037 4061
Ian Roper (65) 6601 0698
Jim Lennon (44 20) 3037 4271
Lynn Zhao (8621) 2412 9035
Matthew Turner (44 20) 3037 4340
Economics
Peter Eadon-Clarke (Global) (813) 3512 7850
Larry Hu (China, Hong Kong) (852) 3922 3778
Quantitative / CPG
Gurvinder Brar (Global) (44 20) 3037 4036
Woei Chan (Asia) (852) 3922 1421
Danny Deng (Asia) (852) 3922 4646
Per Gullberg (Asia) (852) 3922 1478
Strategy/Country
Viktor Shvets (Asia, Global) (852) 3922 3883
Chetan Seth (Asia) (852) 3922 4769
David Ng (China, Hong Kong) (852) 3922 1291
Peter Eadon-Clarke (Japan) (813) 3512 7850
Chan Hwang (Korea) (822) 3705 8643
Jeffrey Ohlweiler (Taiwan) (8862) 2734 7512
Inderjeetsingh Bhatia (India) (9122) 6720 4087
Jayden Vantarakis (Indonesia) (6221) 2598 8310
Anand Pathmakanthan (Malaysia) (603) 2059 8833
Gilbert Lopez (Philippines) (632) 857 0892
Conrad Werner (Singapore) (65) 6601 0182
Passakorn Linmaneechote (Thailand) (662) 694 7728
Find our research at Macquarie: www.macquarieresearch.com/ideas/ Thomson: www.thomson.com/financial Reuters: www.knowledge.reuters.com Bloomberg: MAC GO Factset: http://www.factset.com/home.aspx CapitalIQ www.capitaliq.com Email [email protected] for access
Asia Sales Regional Heads of Sales
Miki Edelman (Global) (1 212) 231 6121
Jeff Evans (Boston) (1 617) 598 2508
Jeffrey Shiu (China, Hong Kong) (852) 3922 2061
Sandeep Bhatia (India) (9122) 6720 4101
Thomas Renz (Geneva) (41 22) 818 7712
Riaz Hyder (Indonesia) (6221) 2598 8486
Nick Cant (Japan) (65) 6601 0210
John Jay Lee (Korea) (822) 3705 9988
Nik Hadi (Malaysia) (603) 2059 8888
Gino C Rojas (Philippines) (632) 857 0861
Regional Heads of Sales cont’d
Paul Colaco (San Francisco) (1 415) 762 5003
Amelia Mehta (Singapore) (65) 6601 0211
Angus Kent (Thailand) (662) 694 7601
Ben Musgrave (UK/Europe) (44 20) 3037 4882
Christina Lee (UK/Europe) (44 20) 3037 4873
Sales Trading
Adam Zaki (Asia) (852) 3922 2002
Stanley Dunda (Indonesia) (6221) 515 1555
Sales Trading cont’d
Suhaida Samsudin (Malaysia) (603) 2059 8888
Michael Santos (Philippines) (632) 857 0813
Chris Reale (New York) (1 212) 231 2555
Marc Rosa (New York) (1 212) 231 2555
Justin Morrison (Singapore) (65) 6601 0288
Daniel Clarke (Taiwan) (8862) 2734 7580
Brendan Rake (Thailand) (662) 694 7707
Mike Keen (UK/Europe) (44 20) 3037 4905
52
This publication was disseminated on 07 June 2017 at 18:25 UTC.