Embed Size (px)
Citation preview
Corinne Wilson, PhD, VTSS EvaluatorRegina Pierce, M.Ed., VTSS Consultant
Three Lane Highway: Aligning Academic, Behavior, and Mental Wellness Drivers to
Guide an MTSS Framework

1. Explain the components of each implementation driver as applied in a multi-tiered system
2. Provide processes, tools, and examples for the alignment of mental wellness
3. Summarize progress using the Virginia Tiered Systems of Supports (VTSS) framework to align the three domains implementation drivers
Learning Objectives

Wait, What? Drivers?

Implementation Drivers

Leadership Drivers
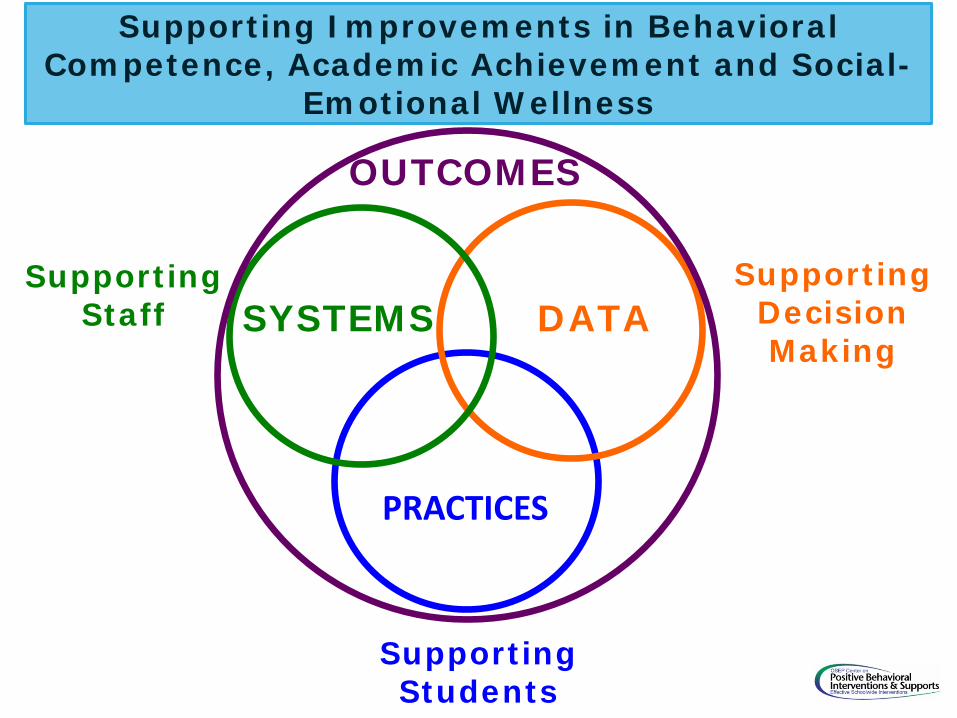
SYSTEMS
PRACTICES
DATASupporting
Staff Supporting
DecisionMaking
SupportingStudents
OUTCOMES
Supporting Improvements in Behavioral Competence, Academic Achievement and Social-
Emotional Wellness

Improved student outcomes!Students and Families
Provides practices to support students and families
Building Staff
Provides guidance and manages implementation
Building Leadership
Team
Provides guidance, visibility, training, coaching, funding, and political support
District/Regional
Team
Provides leadership, guidance, visibility, training, coaching and political support
VDOE
Provides guidance, research, visibility, political support
OSEP PBIS TA Center, Project AWARE, USDOE
Cascading System ofSupport

“All Means All” isn’t just for students anymore.
Practical: Train statewide coaches across the cascading model on developing and coaching teams
Adaptive Leadership: All Means All
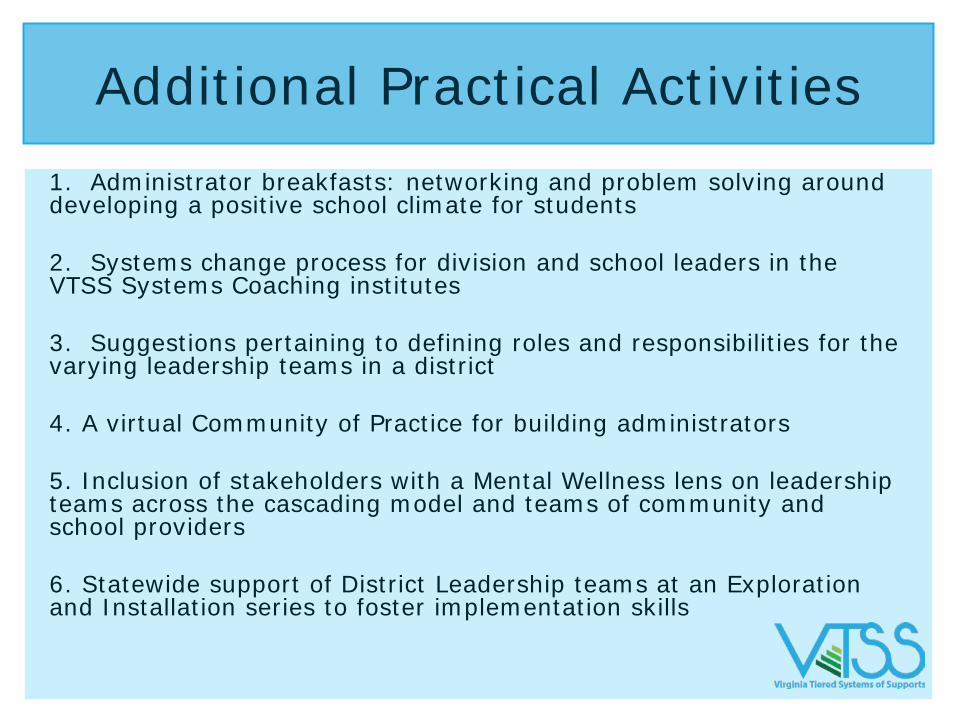
1. Administrator breakfasts: networking and problem solving around developing a positive school climate for students
2. Systems change process for division and school leaders in the VTSS Systems Coaching institutes
3. Suggestions pertaining to defining roles and responsibilities for the varying leadership teams in a district
4. A virtual Community of Practice for building administrators
5. Inclusion of stakeholders with a Mental Wellness lens on leadership teams across the cascading model and teams of community and school providers
6. Statewide support of District Leadership teams at an Exploration and Installation series to foster implementation skills
Additional Practical Activities

Refer to handout
VTSS Leadership Roles and
Responsibilities Document

Organization Drivers
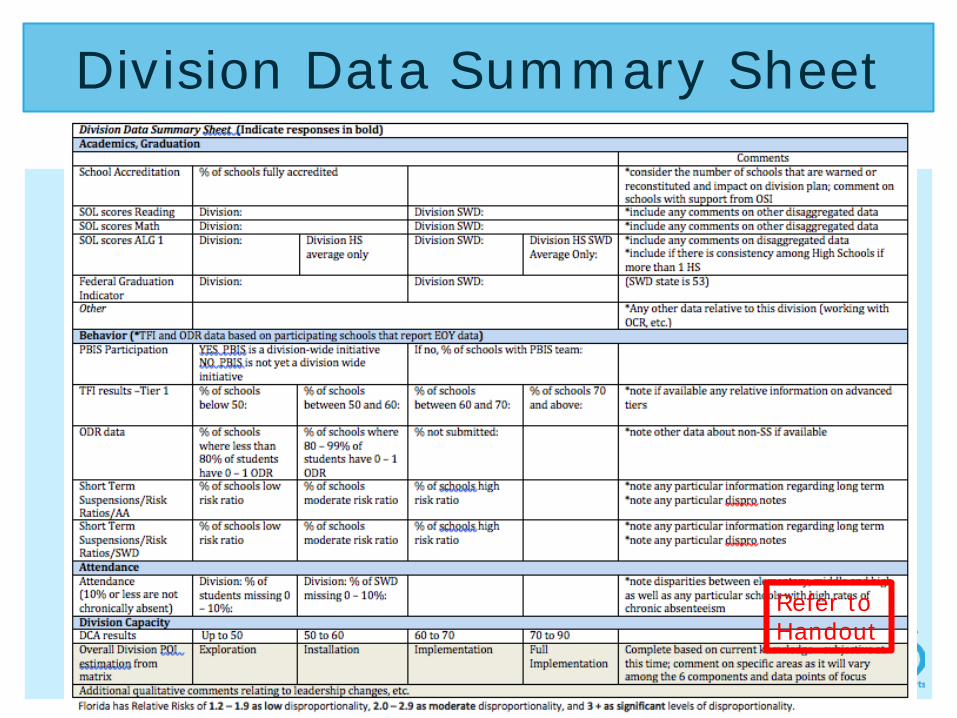
Refer to Handout
Division Data Summary Sheet

Academic: Standardized test scores, school accreditation, Federal Graduation Indicator
Behavior and Climate: Positive Behavior Interventions and Supports (PBIS) participation, Tiered Fidelity Inventory Scores, office disciplinary referrals, disproportionality risk ratios
Attendance: Chronic absenteeism percentages
Division Capacity: District Capacity Assessment, qualitative reflection on VTSS Implementation Matrix
Statewide Division Data Summary

Challenge: Currently difficult to find a uniform indicator across divisions
other than the overall “wellness” of the schools
Mental Wellness Indicators:Steer Carefully

One Possibility

Challenge: Currently difficult to find a uniform indicator across divisions
other than the overall “wellness” of the schools
Mental Wellness Indicators:Stop and Pause

Refer to Handout
Selection Tool

For all practices:1. What is the universal screener?2. What are the decision rules for
movement between tiers?3. How is fidelity monitored?4. What data is used for progress
monitoring? 5. How are families engaged?6. What coaching and other supports are
needed?
Practices Across the Three Lanes

Refer to Handout
Practices Across the Three Lanes Resource Map/Tier Definition

Very quickly write down one practice that addresses social-emotional
learning.
Can you answer the questions from slide 18?
Practices Across the Three Lanes(Stop and Pause)

Practices Across the Three Lanes Example Resource Map/Tier Definition

Evidence Based Practice: Second Step (Tier 1)
Progress Monitoring: Devereux Student Strengths Assessment (DESSA)*
Decision Rule for Tier 2 Supports: DESSA indicator, >2 referrals(one more indicator for triangulated data**)
*DESSA not yet used as universal screener**Decision rules remain a challenge; they are in process of working on this
Practices Across the Three Lanes Example
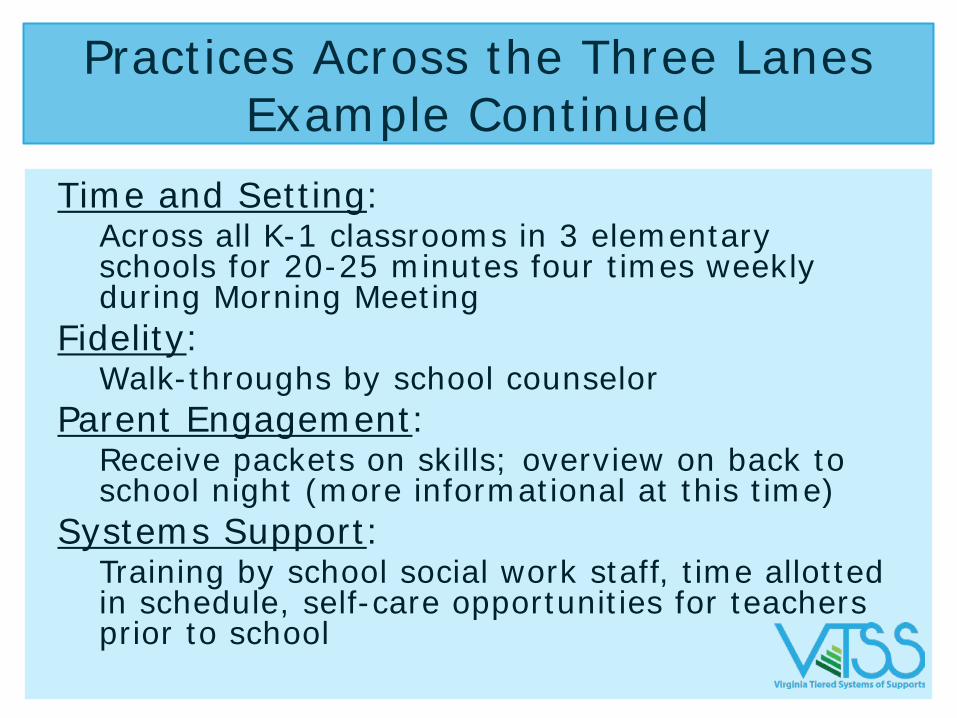
Time and Setting: Across all K-1 classrooms in 3 elementary schools for 20-25 minutes four times weekly during Morning Meeting
Fidelity: Walk-throughs by school counselor
Parent Engagement: Receive packets on skills; overview on back to school night (more informational at this time)
Systems Support: Training by school social work staff, time allotted in schedule, self-care opportunities for teachers prior to school
Practices Across the Three Lanes Example Continued

Data Driven Decision Making
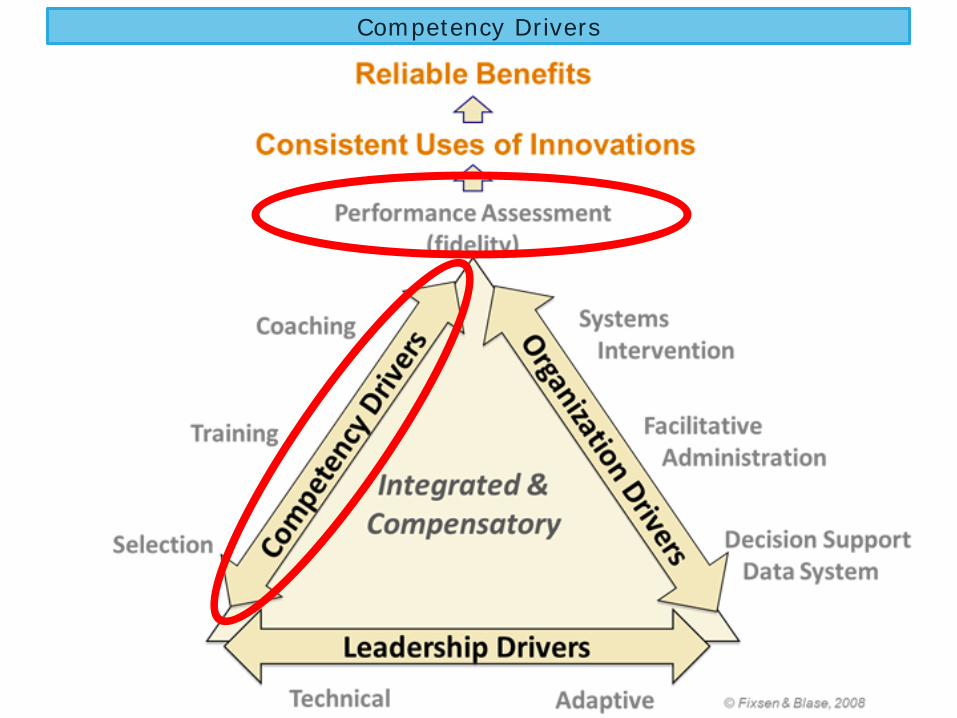
Competency Drivers

Academic Enhancements in first trial andin process of validation.
Mental Wellness draftcurrently in process
Tools

Consistent Coaching Plans

vtss-ric.org

https://www.aecf.org/resources/supporting-social-emotional-learning-with-evidence-based-programs/
Case Study ExampleCharlottesville City Schools

Where Do You See the Drivers in Action?

• 54 VTSS Divisions– 14 joined Summer 2018
• 439 schools (established VTSS divisions)
• ≈ 98% school submission rates
Why We Are Happy

Scope of Implementation

There was a 21% decrease in ODRs EOY 2015 to EOY 2017 for special education students.
21%
There was a 33% decrease in ODRs from EOY 2015 to EOY 2017 for general education students.
33%
Impact on Office Discipline Referrals (ODRs)

There was a 35% decrease in ISSs EOY 2015 to EOY 2017 for special education students.35%
There was a 33% decrease in ISSs from EOY 2015 to EOY 2017 for general education students.
33%
Impact on In-School Suspensions (ISSs)

There was a 14% decrease in OSSs EOY 2015 to EOY 2017 for special education students.
14%
There was a 21% decrease in OSSs from EOY 2015 to EOY 2017 for general education students.
21%
Impact on Out-of-School Suspensions (OSSs)

*Only Elementary, Middle, High, and Combined schools were used.
There was a 5% decrease in Short-term Suspensions in all Virginia schools from 2015-16 to 2016-17.*
5%
There was a 9% decrease in Short-term Suspensions in state-reported VTSS schools from 2015-16 to 2016-17.
9%
Impact on Short-term Suspensions

Student Enrollment by Tier

As Tier I fidelity increases Office Discipline Referrals (ODRs)
decrease
Our data shows that…

CorrelationODRs -0.258*ODRs – SE -0.196ISSs -0.117ISSs – SE -0.157OSSs -0.211OSSs – SE -0.165
Correlations between 2016-17 Outcome Summary data totals and Tiered Fidelity Inventory Tier I scores
*statistically significant using a 5% significance level
Fidelity and Disciplinary Actions

92% of VTSS Cohort 1-3 divisions had consistent or improved pass rates for all students on both the English and Mathematics SOLs from 2013-14 to
2016-17 academic years.
Impact on AcademicsDivision-level

• 76% of VTSS Cohort 1-3 divisions had consistent or improved pass rates for students with disabilities on the English SOLs from 2014-15 to 2016-17
• 48% of VTSS Cohort 1-3 divisions had consistent or improved pass rates for students with disabilities on the Math SOLs from 2014-15 to 2016-17
Impact on AcademicsSchool-level

Impact on Graduation Rates

% of respondents who said there was an adult at school they could talk with if they had a personal problem:
2013: 70%2015: 74%2017: 76%
*Data is for all Virginia Middle schools not only schools in a VTSS division
Middle School Climate Survey

Project AWARE

Training for school personnel and other adults to detect and respond to mental
illness in children, youth, and young adults:
• 7,835 students referred (since 2015) • 3,302 adults trained (in YMHFA)
Impact on Adults’ Capacity to Implement Youth Mental Health First Aid (YMHFA)

There was a 4% increase in the percentage of students referred to community mental health services who received such services 2015-16 to 2016-17 (over 72% received services).
4%
There was a 53% increase in # of students served by school-based mental health professionals from 2015-16 to 2016-17.
53%
Impact on Student Mental Health Services

There was a 41% increase in the # of Student Assistance Program (SAP Team) members from 2015-16 to 2016-17.
41%
There was a 295% increase in # of evidence-based programs in Project AWARE schools from 2015-16 to 2016-17 (20 to 79).
295%
Impact on Use of Evidence-based Programs Related to Mental Wellness
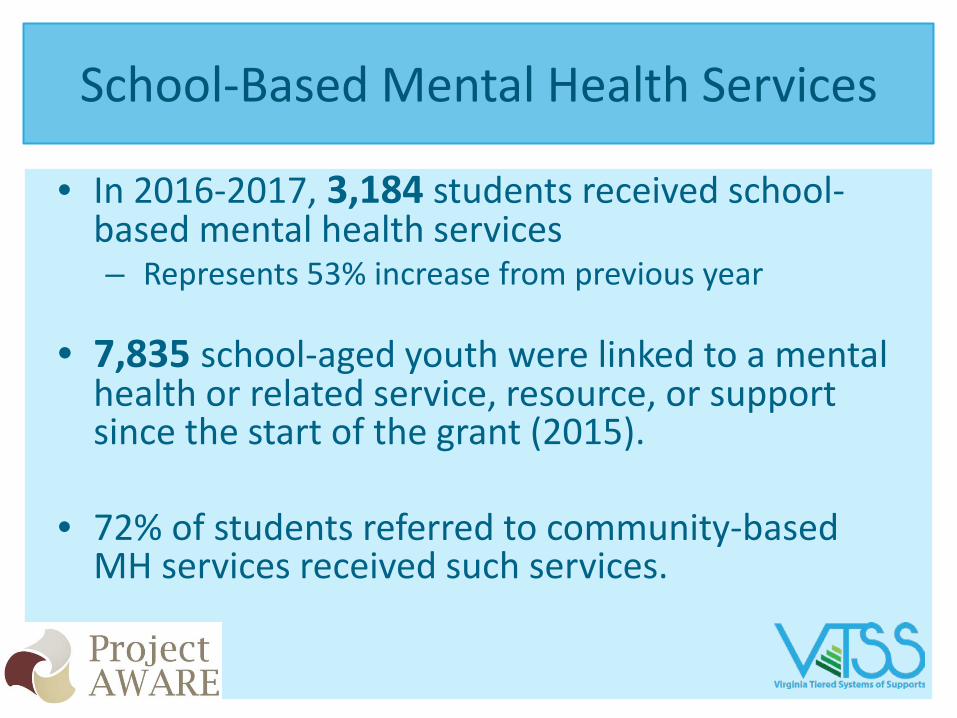
• In 2016-2017, 3,184 students received school-based mental health services – Represents 53% increase from previous year
• 7,835 school-aged youth were linked to a mental health or related service, resource, or support since the start of the grant (2015).
• 72% of students referred to community-based MH services received such services.
School-Based Mental Health Services

Our division leaders say…

In the first three years of implementing PBIS,[our] school was only partially accredited. Wequickly became fully accredited based on stateand federal requirements. Additionally, sincejoining VTSS, we have lowered the overalldiscipline for the entire school communityfrom 35% of students having at least one
office referral to 15%.
Quote 1
Student data is the focus. The VTSS tiered-support framework helps us identify those
students who really need additional academic and/or behavioral supports.
Quote 2

If kids aren’t doing well, either academically orbehaviorally, staff bring data to the school datateam meeting where we problem-solve, tryingto figure out if this is an instruction issue, a
mismatch, a fidelity issue, time, ...
...at our elementary schools last year we sawsignificant gains in reading and math for
students with disabilities…
Quotes 3 and 4

Thank You for Joining Us

Contacts
Regina Pierce: [email protected]
Corinne Wilson: [email protected]
Website: http://vtss-ric.org