Embed Size (px)
Citation preview

HIGHLIGHTS IN THIS ISSUE
I N S U R A N C E : Familiar Claims Objectives Require New Solutions
H E A LT H C A R E : Staying Effective in an Efficient World
B A N K I N G : Retail Transition—How Much, How Soon, How Prepared Are You?
P E R S P E C T I V E : Here and Now
The Nolan NewsletterM A N A G E M E N T P E R S P E C T I V E S
FIRST QUARTER 2014 / VOLUME 41 / NUMBER 1

THE NOLAN COMPANY is a full service management consulting firm comprised of
highly skilled and knowledgeable experts with hands-on management experience in the
insurance, healthcare and banking industries. We solve complex operational and technology
business challenges by partnering with you to create practical solutions.
Through The Nolan Newsletter we share experience-based perspectives and advice about
business issues faced by leaders in the industries we serve.
www.renolan.comContact us toll free at (877) 736-6526
17746 Preston Road, Dallas TX 75252
© 2014 The Nolan Company

Here and Now 2
Familiar Claims Objectives Require New Solutions 4
Bank Performance Trends: The Value of an End-to-End
Perspective in Consumer Lending 7
Coming Soon: Sign Up for the Nolan Bank Performance Study 10
Staying Effective in an Efficient World 11
Risks Abound, Now Manage Them 13
Retail Transition—How Much, How Soon,
How Prepared Are You? 16
A New Face at Nolan 18
Nolan Events 19
Forward Thinking 20
The Nolan NewsletterM A N A G E M E N T P E R S P E C T I V E S
FIRST QUARTER 2014 / VOLUME 41 / NUMBER 1
2
ROD TRAVERS / EXECUTIVE VICE PRESIDENT / [email protected]
HERE AND NOW
A t the start of a new year it’s common for business leaders to assemble their teams to review and renew company strategy. This is a sound business practice. Every company should have a clear strategy that is refreshed as business conditions and market
factors evolve. And every company leader should be able to articulate that strategy. At the same time, I think the annual strategic planning ritual could benefit from a bit of tactical reality being infused into the process. Sometimes strategic planning sessions can drift off into the world of ideals. That’s in part by design. It’s necessary to set the “idea permission meter” pretty high so that strategic discussions can at least explore what is within the art of the possible, even if those ideas aren’t exactly within the realm of practical. What I think sometimes gets lost in those discussions is the reality of today’s challenges. For example, let’s say a company is struggling with the hindrances of outdated legacy systems; however, they don’t let that stop them from conceiving a mobile-heavy service strategy – one that their legacy systems cannot realistically support. They charge ahead, fueled by competitive imperatives. And by the time next year’s strategy session rolls around, they rational-ize all the compromises they made on that mobile service model because practicality got in the way. I think they would have been better served if someone said, early on, “Wait a minute; we can’t even modernize our own core systems. Why are we
Case in point: A few years ago, a re-spected financial services company faced a strategic dilemma with their web-based member service platform. Rather than roll it out on top of inad-equate legacy systems, they made the difficult decision to fix the underly-ing systems and processes first, and then roll out their online platform. It went online more than two years after their competitors’ platforms, and long after customers had expect-ed. The company’s reputation took a hit because they were “slow to the game.” But in the end their platform ended up being a model for the in-dustry. Their aspiration was to have “the best online platform,” but they knew they had to solve major founda-tional problems before getting there.

3
tackling something even more aggressive when we haven’t solved yesterday’s problems?” Being the “reality check” czar can sometimes be an unpopular role, but it’s important. There is risk in taking action, just as there is risk with inaction – and that risk is compounded if you ignore important facts. As you embark on strategic planning this year, consider these guiding principles:
• Be realistic about today’s (and yesterday’s) unresolved problems. Don’t forget “here and now” as you contemplate the future. Does your strategy depend on competencies or resources you don’t have? If yes, don’t let that stop you; instead, solve for those limitations. Consider new talent, additional capacity, partners or outside help.
• Distinguish aspirations from specific objectives. • And to paraphrase Voltaire, “Don’t let perfect be the enemy of good.”
As always, I welcome your ideas and suggestions. How would you improve the traditional strategic planning process? Let me know your thoughts at [email protected]. In this issue of The Nolan Newsletter, my colleagues share their perspectives on risk management, effectiveness, driving change and several industry-specific issues. I hope you and your team find it valuable. We wish you and your organiza-tion a successful 2014!
WHY ARE WE TACKLING SOMETHING EVEN MORE AGGRESSIVE WHEN WE HAVEN’T SOLVED YESTERDAY’S
PROBLEMS?

Everyone agrees on the primary claims management issues. What are they doing about them?
Ask any P&C executive what the most pressing issues are for their organization, and you’re likely to get the same answer.
In a recent survey of over one hundred P&C execu-tives by The Nolan Company, over 90% of respon-dents agreed the primary management objectives of the claims operation, in today’s environment, are to reduce loss costs and loss adjustment expenses. The survey results also highlight objectives that fall into a secondary category. These include improv-ing claim reserve management and overall claims customer service. Reducing loss costs in today’s claims environ-ment is tricky, considering factors such as steadily rising medical expenses and higher vehicle repair costs. However, loss adjustment expenses can be approached more directly by increasing the number of fast-tracked claims, optimizing recovery activi-ties and improving litigation management. Improved claim reserve management practic-es can also be addressed directly. Implementing up-to-date reserve management practices to mitigate core problems such as redundancy and deficiency will have a positive balance sheet impact. Somewhat surprisingly, the survey revealed that improving customer claim service was considered a second-tier objective by most respondents. Most carriers clearly understand the impact of quality claim service on retaining customers – the competitive market tells that story. So valuing claims customer service as a lower priority is perplexing, and is a risky decision in terms of reputational risk and in-force deterioration.
FAMILIAR CLAIMS OBJECTIVES REQUIRE
NEW SOLUTIONS
4
EUGENE REAGAN / PRINCIPAL CONSULTANT / [email protected]
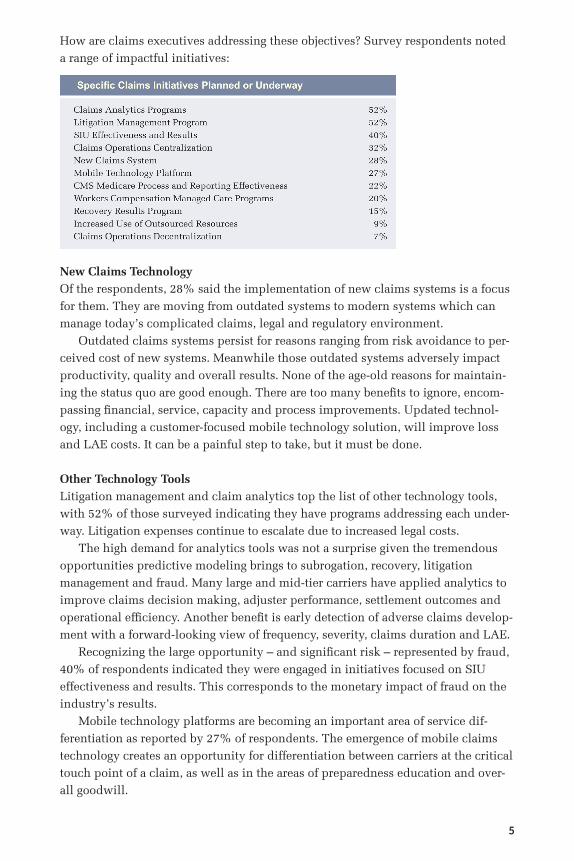
How are claims executives addressing these objectives? Survey respondents noted a range of impactful initiatives:
New Claims TechnologyOf the respondents, 28% said the implementation of new claims systems is a focus for them. They are moving from outdated systems to modern systems which can manage today’s complicated claims, legal and regulatory environment. Outdated claims systems persist for reasons ranging from risk avoidance to per-ceived cost of new systems. Meanwhile those outdated systems adversely impact productivity, quality and overall results. None of the age-old reasons for maintain-ing the status quo are good enough. There are too many benefits to ignore, encom-passing financial, service, capacity and process improvements. Updated technol-ogy, including a customer-focused mobile technology solution, will improve loss and LAE costs. It can be a painful step to take, but it must be done.
Other Technology ToolsLitigation management and claim analytics top the list of other technology tools, with 52% of those surveyed indicating they have programs addressing each under-way. Litigation expenses continue to escalate due to increased legal costs. The high demand for analytics tools was not a surprise given the tremendous opportunities predictive modeling brings to subrogation, recovery, litigation management and fraud. Many large and mid-tier carriers have applied analytics to improve claims decision making, adjuster performance, settlement outcomes and operational efficiency. Another benefit is early detection of adverse claims develop-ment with a forward-looking view of frequency, severity, claims duration and LAE. Recognizing the large opportunity – and significant risk – represented by fraud, 40% of respondents indicated they were engaged in initiatives focused on SIU effectiveness and results. This corresponds to the monetary impact of fraud on the industry’s results. Mobile technology platforms are becoming an important area of service dif-ferentiation as reported by 27% of respondents. The emergence of mobile claims technology creates an opportunity for differentiation between carriers at the critical touch point of a claim, as well as in the areas of preparedness education and over-all goodwill.
5

6
UPDATED TECHNOLOGY, INCLUDING A CUSTOMER-FOCUSED MOBILE TECHNOLOGY SOLUTION, WILL
IMPROVE LOSS AND LAE COSTS.
CentralizationAbout 32% of the survey respondents listed the centralization of claims operations as a planned initiative. This is an interesting result as, in the past, centralizing claims functions was viewed as a cost reduction measure achieved by consoli-dating branch offices and shifting field adjusting to desk adjusting – adversely affecting customer service. These survey results indicate a shift in perception and the belief that centralization can now lead to improved cus-tomer service. Today, advances in technology are mitigating the negative aspects of remote adjusting. These advanc-es include the addition of mobile FNOL apps, portal access to claims information, personalized single points of contact throughout life of the claim and video communica-tions. Given the advantages of economies of scale and lower overhead, centralizing in a manner that address-es customer expectations represents an opportunity to reduce operational expense while improving consisten-cy, quality and transaction speed. These are some of the claims-related highlights from the Nolan survey. To view other functional areas covered by the Nolan P&C Executive Survey summary report visit www.renolan.com/pcsurvey.
Legal Costs Continue to Make an Impact Tools are in demand to help carriers address ev-er-growing litigation expenses. The reasons for es-calating legal costs vary and typically fall into two categories: legal costs impacted by the claim staff and legal costs impacted by inflation. The legal costs impacted by the staff have the most impact on costs. If inexperienced claim staff is managing litigation claims, they may be relying on defense counsel to complete claim-related tasks, including settlement discussions. This prolongs the claim and increases costs. Excessive caseloads make it diffi-cult for litigation handlers to manage claims prop-erly and often lead to the defense counsel managing the litigation process. This creates backlogs and ad-versely impacts IBNR as claims pend longer. Lastly, effective business partnerships with defense coun-sel are critical in controlling litigation costs. Many carriers have implemented formal litigation man-agement programs; however, many programs have no real impact on the results. Carriers need to build effective relationships with defense firms and look beyond the hourly rate. Higher hourly rates do not necessarily translate into overall higher legal bills, particularly if the claim is being handled by a more experienced defense attorney.

7
BANK PERFORMANCE TRENDS:
THE VALUE OF AN END-TO-END PERSPECTIVE IN
CONSUMER LENDING
MIKE MEYER / PRINCIPAL CONSULTANT / [email protected]
Nolan’s Bank Performance Study provides insight into the business of banking and changes over recent years that can have potential impacts on the future. We look for significant upward and downward trends in Key Ratios at the line-of-business or
functional level. In reviewing this year’s data, another compelling trend emerged from the raw numbers as we aligned the results from the current year with the two prior years. In examining trends in the benchmarks (top-quartile performers) and averages of our participant banks, we saw a clear trend of increasing Consumer Lending Expense as a percentage of Consumer Lending Income compared to the last three years, with a significant spike upward from 2012 to 2013.
This data prompts the question, “Why are expenses as a percentage of income increasing and impacting product margins so significantly?” Is it a revenue problem or an expense problem? Or both? While each situation is unique, the revenue side of the equation itself is perceived to be driven largely by things like marketplace fac-tors and sales techniques. We have found, however, that the expense side is driven primarily by end-to-end process efficiency (or lack thereof) and technology, which can directly impact revenues in addition to expenses. Inefficient processes often

result in poor customer experiences, which can prompt customers to go elsewhere. A recent consumer lending redesign project with one of our clients provides a good example of these impacts. The Nolan Bank Performance Study indicated Consumer Lending costs as a percent of line of business income were too high, but it was unclear why. We established a cross-functional project team to develop a comprehensive, end-to-end map of the current direct consumer lending process, highlighting all human and system interactions and touch points. It began with the customer and illustrated interactions with the contact center and / or branch, systems, underwriting and all back office functions. Unit costs and a baseline end-to-end process cost were developed. Once completed, this end-to-end view provid-ed new visibility and insights into the process and it became “wallpaper” for the team’s workshop sessions. Key process-related findings included:
• Loan application completion required a high number of “touches” between originators and clients and originators and underwriters, significantly impact-ing cycle time and ultimately application withdrawal rates.
• Incomplete loan applications were submitted by some originators, which were not caught by system edits, which caused significant downstream dupli-cate handling and rework.
• Functional managers were working hard to manage their particular function, but had limited knowledge of other parts of the process and organization.
• Performance metrics were limited and activity-based within a functional area, as opposed to shared metrics across functional areas involved in the process. There were also no metrics in place for application submission quality.
• Back office functions reported up through a different set of management that did not connect except at the level of the CEO’s direct reports. This structure made cross-functional improvements difficult to implement, causing employ-ees to feel powerless to create positive change.
The technology environment provided its own set of challenges. There were more than ten systems involved in consumer loan processing, insufficient sys-tem edits and multiple points of duplicate manual entry between systems. These complexities were negatively impacting turnaround times. Also, existing system functionality was not being fully leveraged. The team developed a comprehensive list of opportunities for improvement and utilized a “leap to the ideal” approach, where characteristics of the ideal consumer
IN THIS EXAMPLE, THE NOLAN BPS DATA PROVIDED PRODUCT PROFITABILITY INSIGHTS AND REVEALED
THIS BANK’S CONSUMER LENDING EXPENSE TO INCOME TREND WAS DETERIORATING.
8

lending process environment were identified in various categories, leading to the development of a “Goal-State” process map. Recommendations for moving toward the Goal-State were categorized as either shorter-term or longer-term. The Goal-State map was also enlarged to poster size and became an essential reference for the orga-nization going forward. Both maps were used extensively as recommendations were presented to executive management. This effort resulted in several key findings and positive outcomes including:
• End-to-end time spent handling new applications was reduced by more than 50%.
• Average new application cycle time (average days from application to upload) was reduced by 70%.
• Improved revenue by significantly increasing cross-functional capacity over time.
• A clear realization and new focus on fully leveraging existing technology and pursuing new technology solutions over time to reduce manual processing between systems.
Many factors drive consumer lending profitability. In this example, The Nolan Bank Performance Study data provided product profitability insights and revealed this bank’s Consumer Lending Expense to Income trend was deteriorating, much like that of other study participants. The end-to-end view identified an inefficient process that was gobbling up operational capacity that should have been available for sales and origination efforts. Achieving end-to-end process visibility with accu-rate metrics was the key to demonstrating the need for accountability at the source and for identifying where improvements could be made to impact both the expense and revenue components. If you would like additional information on Nolan’s Bank Performance Study, information on the case study cited above, or our improvement work with banks, I invite you to visit our website at www.renolan.com/banks or contact me directly at [email protected].
IN EXAMINING TRENDS IN THE BENCHMARKS (TOP-QUARTILE PERFORMERS) AND AVERAGES OF OUR
PARTICIPANT BANKS, WE SAW A CLEAR TREND OF INCREASING CONSUMER LENDING EXPENSE AS A PERCENTAGE OF CONSUMER LENDING INCOME COMPARED TO THE LAST THREE YEARS, WITH A
SIGNIFICANT SPIKE UPWARD FROM 2012 TO 2013.
9

SIGN UP FOR THE NOLAN
BANK PERFORMANCE STUDY
The Nolan Company will again offer all banks and financial institutions with more than $900 million in assets the opportunity to participate in our Bank Per-formance Study. This comprehensive analysis, which is unlike any other, provides results in comparative line-of-business measures that help participating organiza-tions identify gaps in income, expenses, staffing, and productivity. The study is organized into 80 distinct functional areas and lines of business and provides comparisons of your bank to: the top-quartile (benchmark) partici-pants; the averages of all participants; and the medians for all participants. More than 700 performance ratios are calculated and a tailored results report is devel-oped for your organization. Best of all, there is no fee for participation.
What You Can ExpectNolan’s analysis will identify gaps in performance that quantify specific areas where the greatest opportunities for improvement exist. This unique approach ensures that each bank comprehensively accounts for its income, expenses, staff (full- and part-time), operational transactions, balance sheet items, and activities related to each line of business. In this way, a directional view can be developed to determine the underlying reasons for performance gaps.
Each participating organization will receive:
• A management summary identifying the areas with the greatest opportunity for bottom-line improvement;
• A detailed report that prioritizes the opportunities by total organization and within each line of business;
• For consecutive-year participants, year-over-year comparative data is also available.
Don’t miss out on this valuable opportunity to help plan for operational changes within your bank or financial institution. Registration will begin in March. If you would like more information about participating in Nolan’s 2014 Bank Perfor-mance Study, please contact Mike Meyer ([email protected]). For more information, go to www.renolan.com/bank-benchmarks.
10
11
The pace of business today and the realities of the current econ-omy have resulted in changes and adjustments throughout the business world. With cost pressures, businesses have stressed the impact on service.
Anyone who has endured the gauntlet of airline travel recently understands the frustrations caused by the cost pressures on the airlines and the service impacts these changes have forced on air travel. From baggage fees to inflight meals to the frustration of rescheduling flights, the list of services sacrificed for efficiency is extensive. From the consumer point of view, all these changes in the name of efficiency have stressed passengers who are looking for effectiveness and support. Of course the airlines are an easy target, but the point remains valid. When an organization’s focus shifts too far to efficiency, effectiveness suffers. Achieving an effective balance of service expectations and business efficiencies is equally critical within a company (i.e., between internal service organizations and internal consumers). Employee surveys continue to report a disconnect be-tween employees’ activities and the mission of the organization. A recent Harvard Business Review article, “To Give Your Employees Meaning, Start With Mission,” discusses the direct correlation between employee satisfaction and their sense of feeling connected to the mission (December 2012, by Teresa Amabile and Steve Kramer). A service-based organization finds a way to connect employees to services and consumers. I’ve written before about efficiency and effectiveness in corporate IT depart-ments, and while that discussion focused on IT, the lessons to be drawn from it hold true throughout any organization concerned with internal service. Few IT organizations seek to truly understand internal business units’ perception of IT’s impact and the importance the business units place on the components of IT deliv-ery. It is critical to recognize this insight to become an effective IT organization that truly enables the business. It’s easy for IT to focus on one component, such as avail-ability, but that pigeonholes the IT organization as a utility provider. CIOs might boast a 99% availability record, but if the users don’t perceive a greater value in IT than as a utility provider, they’ll only care about the 1% of the time that systems
STAYING EFFECTIVE IN AN EFFICIENT WORLD
GERALD SHIELDS / PRACTICE DIRECTOR / [email protected]

are down. To become truly effective and not just efficient, it is vital to understand the cus-tomer’s expectations and how you’re performing according to those expectations. During these difficult times of cost pressures, staffing reductions and process changes, business leaders must not ignore the relationship seams that are being stretched and potentially coming unraveled. It is vital to understand the internal consumer needs, expectations and issues while balancing the pressures, needs, services and expectations of the service provider. This process does not happen naturally. As organizational change and financial pressures continue to exert stress on organizations, internal service is often a forgotten topic. Ripple effects of these changes are rarely understood until they are implemented and wreak havoc on relationships. Leaders must drive to become a service-based organization where the needs of the internal consumers are clearly articulated, understood and managed by the internal service providers. Managing the seams between the internal service providers and service con-sumers is critical in leading a healthy, agile organization. Service leaders must actively utilize a number of proven tools and techniques to help the organization return to a service mentality. One such tool is the RATER method, as outlined in Valarie Zeithaml’s, “Delivering Quality Service.” RATER measures value in Reliability, Assurance (knowledge, quality and credibility of the staff), Tangible (physical aspects of communication, documents and processes), Empathy (relating to user concerns and issues) and Responsiveness. It is a qualitative and quantitative method that can help provide customized solutions to improve effectiveness. RATER and other tools like it provide a clear roadmap when the path toward a service focus seems murky. As an organization moves to a service focus, leaders should define the internal services the organization delivers, the appropriate service levels and the cost asso-ciated with delivering those services. This intersection of consumers and services forms the service instance that takes on definition and service levels that can clear-ly be defined and measured. The service leader and the consumer leader should meet periodically to review service delivery and mutual expectations. This kind of partnership will create a spirit of transparency and collaboration and improve relationships throughout the organization. By proactively measuring and managing internal service performance and expectations, a company will maintain a healthy service-to-consumer relationship that improves the overall business and raises the level of performance in organi-zational effectiveness, as well as organizational efficiency. This service focus gives employees throughout the organization a sense of purpose and empowerment, creating a culture that is both efficient and effective.
A SERVICE-BASED ORGANIZATION FINDS A WAY TO CONNECT EMPLOYEES TO SERVICES AND CONSUMERS.
12
RISKS ABOUND, NOW MANAGE THEM
STEVE CALLAHAN / PRACTICE DIRECTOR / [email protected]
The heart of Risk Management consists of identifying and analyzing exposures and then taking the necessary steps to minimize risk. While a variety of methods can be used to man-age the multitude of risks inherent in a business as complex as
insurance, a foundational component – the project risk management plan – is often neglected. Without a well-thought-out risk management plan, even the best-man-aged projects can’t effectively anticipate and mitigate potential risks. Instead, risk management becomes an ad hoc process occurring reactively or, worse, retrospec-tively after it is much too late to avoid negatively impacting the project. Given the vast range of opportunities offered by newer technologies, escaping the burden of legacy-bound environments has become critical to successful com-petitive differentiation. The ability to integrate social media, big data, analytics and mobile computing alone has become table stakes, challenging companies to suc-cessfully deliver on complex projects facing limited funds, short timeframes and little room for error. Managing the risk involved in these projects has moved from informal and reactive to a defined process that is integrated into the implementa-tion methodology and governance practices. Completely eliminating risk is all but impossible, thus, the emphasis shifts to the timing of risk identification. The earlier problems can be identified – or, better yet, predicted from leading indicators – the quicker corrective action can be taken to reduce negative impact. So what are the predictive indicators that can be used to identify and address risks early on? An extended review of successful and unsuccessful projects identi-fied the following as the most common warning signs of approaching problems:
• Inadequate Specifications • Changing Requirements • Inadequate Change Control Management • Inexperienced Personnel • Unrealistic Estimates • Subcontractor Misrepresentation / Underperformance • Poor Project Management
13
• Lack of User Involvement • Expectations Not Properly Set • Poor Architectural Design
A structured process incorporating the ranked assessment and constant mon-itoring of the most likely and impactful risks from the above list is critical from a project scope, cost and schedule basis. More often than not, projects with insuf-ficient risk monitoring and inadequate contingency planning will take a turn for the worse. Underestimating or even ignoring risk at any point during the project, whether internal or external, usually has a materially adverse impact – sometimes resulting in outright project failure. Project managers must continuously monitor and analyze known risks while developing an appropriate contingency plan to address the emergence of unknown risks. Obviously, intentional risk management is an integral part of the project quality assurance effort targeted at minimizing the major sources of rework, schedule and cost overruns, as well as performance and quality degradation. There is a strong correlation between the level of risk management in a project and the level of success. Without a structured system for identifying and managing risks, the level of risk tolerance (where reward exceeds the risk) decreases significantly. Applying risk management rigor to a project will improve its outcome. To incorporate effective risk assessment and governance practices, all project management plans should include these six inputs:
1. Project Scope Statement – a general overview of the project scope, the deliv-erables and framework for the degree of risk management needed;
2. Cost Management Plan – a definition of risk budgets, contingencies and financial resources needed to address risk potential;
3. Schedule Management Plan – how schedule contingencies will be reported and assessed;
4. Communications Management Plan – the information shared among the project members and stakeholders and protocol on sharing information and risk responses;
5. Enterprise Environmental Factors – factors influencing the plan including attitude toward risk and organizational risk tolerance; and
6. Organizational Process Assets – including risk categories, risk statement formats, roles and responsibilities, and authority levels.
Source: PMBOK manual
GIVEN THE VAST RANGE OF OPPORTUNITIES OFFERED BY NEWER TECHNOLOGIES, ESCAPING THE BURDEN OF
LEGACY-BOUND ENVIRONMENTS HAS BECOME CRITICAL TO SUCCESSFUL COMPETITIVE
DIFFERENTIATION.
14
Determining which risks may affect the project, documenting their characteristics, assessing their impact and ranking them accordingly is an iterative process that requires realigning existing risk profiles while incorporating new ones as they arise. The primary output of this process is the development of a Risk Register, documenting a qualitative and quantitative risk analysis, along with risk response planning. The Risk Register also provides a strategy to manage risks which include mitigate, avoid, accept and transfer. An investment in project risk management, which typically ranges from 2% to 4% of your project costs, compares favorably with potential cost overruns and lost opportunity costs, which can reach more than 50% of the project costs. Taking the necessary time to develop a comprehensive project risk management plan is essen-tial for overall project success. It’s simply a matter of good insurance.
WITHOUT A STRUCTURED SYSTEM FOR IDENTIFYING AND MANAGING RISKS, THE LEVEL OF RISK TOLERANCE
(WHERE REWARD EXCEEDS THE RISK) DECREASES SIGNIFICANTLY.
15

RETAIL TRANSITION—HOW MUCH, HOW SOON,
HOW PREPARED ARE YOU?
Retail counter traffic in banks is already in steep decline. Changing customer behaviors, including the increasing use of mo-bile banking, electronic payments, direct deposit and ATMs are altering the way banking is done in the today’s world. According
to a recent article in the Wall Street Journal, the migration to online services has resulted in record branch closures. Soon, the discussion will shift to how prepared banks are for the inevitable end of checking in North America. The top ten banks in the United States are already preparing for future changes in the industry. Last year we saw Bank of America shed more than 120 branches in an effort to reduce costs and position itself for the next wave. When one of the top ten banks decides to stop offering checking, how long will it take for other banks to react and how will they respond? Some will follow quickly in an effort to evolve the retail sales and service platform and, with it, lower cost of delivery. Others may opt to continue to offer checking – at least in the short term – and pick up the converting bank’s customers who still prefer a checking account. Others may grand-father accounts and run a two-tiered retail bank system. Let’s look at the numbers as they relate to community banks and see what is at stake. On average, over 80 percent of a bank’s branch counter activity is check-based: deposits, cashed checks, split deposit and bill payment. Also, the teller position represents between 20 and 24 percent of the bank’s staff and between 9 and 13 percent of the personnel cost. Add to that a high turnover rate and the costs for training and this creates an even greater opportunity to increase savings by reducing the number of tellers. Another factor is that branch facilities currently represent on average between 9 and 16 percent of community banks’ other operating expenses. We could expect that, in the new projected environment, offices will be configured with less staff and a smaller branch footprint using desks and cash recyclers rather than teller lines. When you look at platform, tellers and branch management, this will reduce the staff of the average branch by nearly 50 percent. We project that a bank that has planned for the change will likely reclaim 11 percent of their person-nel expense with the possibility of recouping an additional 11 percent of other op-erating expense. This must be offset by the projected possibility of lost deposits, fee
ROBERT E. GRASING / PRESIDENT / [email protected]
16

ROBERT E. GRASING / PRESIDENT / [email protected]
income and referral opportunities for new business. The projected improvements in cost, however, prove to be so significant that it will be hard to justify the short-term strategy of “continuing to offer checking” while competitors improve their bottom line considerably. How does a bank prepare for this transition? The teller position is a high-turn-over job in most banks so transition can be handled using attrition, retraining and transfer. A key issue will be to envision how the bank will serve the retail customer in a no-check environment. One step many banks have recently embraced is the concept of a “universal teller,” who performs both teller and platform activities. The more universal tellers a bank has, the greater the opportunity to shift seam-lessly to the new model. One additional element to model is the number of branch-es, their locations and which locations will be needed in the new environment. Some branches serve simply as check-cashing locations with little new retail busi-ness opportunities. Each bank will plan their current and future clients’ needs by location and the change in profitability when the shift takes place. People, process, technology, sociographics and new business analytics will determine how each bank plans for and executes this next major shift in retail delivery. This is a time of uncertainty and change in the banking industry, and it’s coming when bank profit margins are historically thin. The banks that will survive and thrive in the future are the ones that anticipate and prepare for the shifting market.
WHEN ONE OF THE TOP TEN BANKS DECIDES TO STOP OFFERING CHECKING, HOW LONG WILL IT TAKE FOR
OTHER BANKS TO REACT AND HOW WILL THEY RESPOND?
17
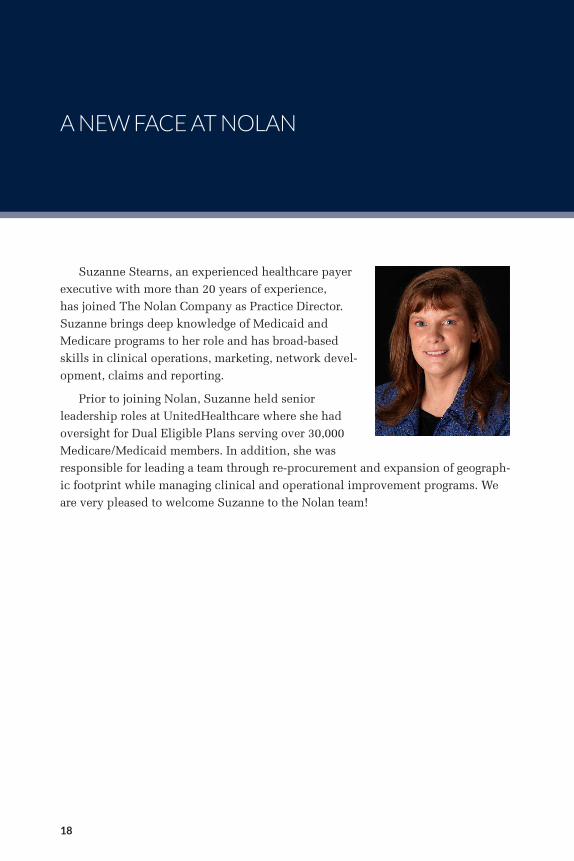
Suzanne Stearns, an experienced healthcare payer executive with more than 20 years of experience, has joined The Nolan Company as Practice Director. Suzanne brings deep knowledge of Medicaid and Medicare programs to her role and has broad-based skills in clinical operations, marketing, network devel-opment, claims and reporting.
Prior to joining Nolan, Suzanne held senior leadership roles at UnitedHealthcare where she had oversight for Dual Eligible Plans serving over 30,000 Medicare/Medicaid members. In addition, she was responsible for leading a team through re-procurement and expansion of geograph-ic footprint while managing clinical and operational improvement programs. We are very pleased to welcome Suzanne to the Nolan team!
A NEW FACE AT NOLAN
18

A NEW FACE AT NOLAN
PCI Executive Roundtable Seminar | February 9-11, 2014 | Captiva Island, FL
Nolan is pleased to again sponsor the opening reception for this annual event. Nolan’s Chair-
man and CEO, Dennis Sullivan, and Executive Vice President, Steve Discher, will attend
– www.pciaa.net
NAMIC Claims Conference | February 11-13, 2014 | St. Augustine, FL
Nolan’s Steve Murphy will be on hand to present on Claims topics in peer-to-peer learning
sessions.
– http://www.namic.org/seminars/claims.asp
LOMA Customer Service Conference | March 26-28, 2014 | Orlando, FL
Nolan Practice Director, Steve Callahan, will present on Customer Engagement at this event.
– http://www.loma.org/Events/Conferences.aspx
Michigan IASA Conference | April 16, 2014 | Detroit, MI
George Krempley, Principal Consultant, will present on Underwriting Discipline at this
event.
– http://www.iasa.org/IASA/EventDetail?EventKey=MICH42014
IASA Annual Conference | June 8-11, 2014 | Indianapolis, IN
Nolan is honored to sponsor this year’s keynote speaker, former President Bill Clinton. In
addition, Nolan will also sponsor the COO Roundtables and Nolan consultants will present
at a number of track sessions.
– http://www.iasa.org
LIMRA Annual Conference | October 26-28, 2014 | New York, NY
Nolan is pleased to be a sponsor of LIMRA’s 2014 Annual Conference.
– http://www.limra.com/Events/Conferences/2014/2014_LIMRA_Annual_Conference.aspx
NOLAN EVENTS
19

FORWARD THINKING
2014 is shaping up to be a critical year with significant industry changes ahead. And they are coming at a much faster pace than ever before. From healthcare reform, to the increasingly compet-itive environment in the P&C sector, to the need for developing
new life insurance products targeting the 25 to 45 year-old market. For the foresee-able future, a rapidly changing business environment is a fact of life. Bridging the gap between the needs of aging boomers and the growing num-bers of new entrants into the financial services market is a central challenge in the insurance and financial services industries. Attracting, serving and retaining these divergent customer groups is absolutely essential for long-term success. Yet this mandate portends critical changes to business practices and operating models. For many companies this environment presents great opportunities for differ-entiation in a crowded marketplace. Designing innovative solutions to address emerging issues will separate the winners from the losers. This has always been the case in industries such as consumer electronics. Now this innovation mandate has set its sights on insurance and financial services. Such innovations don’t happen by accident. They happen when leaders set high goals, create an entrepreneurial atmo-sphere and instill a respect for competition into the culture. Finding the right people within your organization and from outside to help navigate these changing times is of paramount importance. Social media, social evo-lution, regulation, technology, risk management, climate change and a dozen other factors are changing the way we must organize our companies and conduct business. Employing people who understand the changing landscape and who are clever and effective at adaptation will be strategically invaluable. The time to pro-mote or recruit those people is now, not next year. Amidst this environment, change must become a matter of course in our compa-nies. Does your strategy address the necessity and the importance of change? Is your organization focused and ready to adapt in the coming year and beyond? We always appreciate the opportunity to discuss these questions and potential solutions. I look forward to working with many of you in the coming year, and I hope you’ll drop me a line at [email protected].
DENNIS SULLIVAN / CHAIRMAN AND CEO / [email protected]
20

THE NOLAN COMPANY
17746 PRESTON ROAD
DALLAS TX 75252