Embed Size (px)
Citation preview

Industrial Decarbonisation &Energy Efficiency Roadmapsto 2050
MARCH 2015
This report has been prepared for the
Department of Energy and Climate Change and
the Department for Business, Innovation and Skills
Ceramic Sector
INDUSTRIAL DECARBONISATION AND ENERGY EFFICIENCY ROADMAPS TO 2050 – CERAMICS
Pathways to Decarbonisation in 2050 Page i
CONTENTS
CONTENTS ..................................................................................................................................................I
LIST OF TABLES ....................................................................................................................................... V
LIST OF FIGURES .................................................................................................................................... VI
ACRONYMS ............................................................................................................................................ VIII
1. EXECUTIVE SUMMARY ............................................................................................................... 1
1.1 What is the ‘Decarbonisation and Energy Efficiency Roadmap’ for the Ceramic Sector? 1
1.2 Developing the Ceramic Sector Roadmap 1
1.3 Sector Findings 2
1.4 Enablers and Barriers for Decarbonisation in the Ceramic Sector 3
1.5 Analysis of Decarbonisation Potential in the Ceramic Sector 3
1.6 Conclusions and Key Technology Groups 5
2. INTRODUCTION, INCLUDING METHODOLOGY ......................................................................... 8
2.1 Project Aims and Research Questions 8
2.1.1 Introduction 8
2.1.2 Aims of the Project 9
2.1.3 What is a Roadmap? 9
2.2 Overall Methodology 10
2.2.1 Findings 12
2.2.2 Pathways 15
2.2.3 Conclusions and Next Steps 18
3. FINDINGS................................................................................................................................... 20
3.1 Key Points 20
3.2 Ceramic Processes 21
3.2.1 Preparation of Raw Materials 22
3.2.2 Forming 22
3.2.3 Drying 22
INDUSTRIAL DECARBONISATION AND ENERGY EFFICIENCY ROADMAPS TO 2050 – CERAMICS
Pathways to Decarbonisation in 2050 Page ii
3.2.4 Firing 23
3.2.5 Finishing Processes 23
3.2.6 Opportunities for Carbon Emission Reduction 24
3.3 Current Emissions and Energy Use - Principal Question 1 24
3.3.1 Evolution of Emission Reductions 24
3.3.2 Heat and Power Demand 26
3.3.3 Fuels Used 27
3.3.4 Lifespan of Equipment and Key Timings 28
3.4 Business Environment - Principal Question 2 28
3.4.1 Market Structure 28
3.4.2 Business Strategies 30
3.4.3 Decision-Making Processes 32
3.4.4 Financing Investments 34
3.4.5 Enablers and Barriers 34
3.5 Technologies to Reduce Carbon Emissions 43
3.5.1 Biomass Carbon Intensity 44
3.5.2 Cost of Options 44
3.5.3 Informing Pathway Development 45
4. PATHWAYS ................................................................................................................................ 46
4.1 Key Points 46
4.2 Pathways and Scenarios – Introduction and Guide 48
4.3 Baseline Evolution - Principal Question 3 51
4.4 Emission-Reduction Potential and Pathway Analysis – Principal Question 4 and 5 52
4.4.1 Baseline - Business as Usual Pathway 53
4.4.2 20-40% CO2 Reduction Pathway 59
4.4.3 40-60% CO2 Reduction Pathway 59
4.4.4 Maximum Technical Pathway 62
4.5 Sensitivity Analysis 68
4.6 Pathway Costs 69
INDUSTRIAL DECARBONISATION AND ENERGY EFFICIENCY ROADMAPS TO 2050 – CERAMICS
Pathways to Decarbonisation in 2050 Page iii
4.6.1 Introduction 69
4.6.2 Calculation of Pathway Costs 69
4.6.3 Limitations 71
4.6.4 Cost Analysis Results 71
4.7 Implications of Enablers and Barriers 72
4.7.1 Adopt Lowest Carbon Process 73
4.7.2 Gasification of Biomass 73
4.7.3 Large Scale Electric Kilns 74
4.7.4 Carbon Capture 75
4.7.5 Low and Low-Medium Cost Options 76
5. CONCLUSIONS - PRINCIPAL QUESTION 6 .............................................................................. 77
5.1 Key Points 77
5.2 Strategic Conclusions 78
5.2.1 Strategy, Leadership and Organisation 78
5.2.2 Business Case Barriers 79
5.2.3 Future Energy Costs, Energy Supply Security, Market Structure and Competition 79
5.2.4 Industrial Energy Policy Context 80
5.2.5 Life-Cycle Accounting 80
5.2.6 Value chain collaboration 80
5.2.7 Research, Development and Deployment 81
5.2.8 Employees and Skills 81
5.3 Key Technology Groups 82
5.3.1 Electricity Grid Decarbonisation 82
5.3.2 Electrification of Heat 82
5.3.3 Fuel and Feedstock Availability (Including Biomass) 82
5.3.4 Energy Efficiency / Heat Recovery 82
5.3.5 Clustering 83
5.3.6 Carbon Capture 83
5.3.7 Specific Sectorial Decarbonisation Technologies 83
INDUSTRIAL DECARBONISATION AND ENERGY EFFICIENCY ROADMAPS TO 2050 – CERAMICS
Pathways to Decarbonisation in 2050 Page iv
5.4 Closing Statement 83
6. REFERENCES ........................................................................................................................... 84
7. GLOSSARY ................................................................................................................................ 87
8. ACKNOWEDGMENTS ................................................................................................................ 90
INDUSTRIAL DECARBONISATION AND ENERGY EFFICIENCY ROADMAPS TO 2050 – CERAMICS
Pathways to Decarbonisation in 2050 Page v
LIST OF TABLES
Table 1: Energy-intensive industry total direct and indirect carbon emissions in 2012 (data sources includeClimate Change Agreement (CCA), EU ETS and NAEI) ............................................................................... 2
Table 2: Industrial sectors evaluated in this project ....................................................................................... 8
Table 3: Inputs and outputs for the industrial decarbonisation and energy efficiency roadmap to 2050 .........10
Table 4: Survey responses to decision making factors for decarbonisation and energy reduction ................33
Table 5: Top enablers .................................................................................................................................35
Table 6: Top barriers ...................................................................................................................................38
Table 7: Pathways and scenarios matrix .....................................................................................................50
Table 8: Outlook assumptions for sector production (BCC) ..........................................................................51
Table 9: Kiln replacement programme for heavy clay subsector, as a basis for the Max Tech pathway ........67
Table 10 Summary costs and impacts of decarbonisation for the pathways .................................................72
INDUSTRIAL DECARBONISATION AND ENERGY EFFICIENCY ROADMAPS TO 2050 – CERAMICS
Pathways to Decarbonisation in 2050 Page vi
LIST OF FIGURES
Figure 1: Decarbonisation and energy efficiency pathways results for current trend scenario ........................ 4
Figure 2: Roadmap methodology ................................................................................................................11
Figure 3: Evidence- gathering process ........................................................................................................13
Figure 4: Stages in the brick manufacturing process (Carbon Trust, 2012) ..................................................22
Figure 5: Historical energy consumption by ceramic sector (BCC, 2014) .....................................................24
Figure 6: Direct, indirect and estimated process CO2 emissions 2012, Mt/a, (BCC 2012 CCA data, 2014) ...25
Figure 7: Subsector annual production 2012, tonnes, (BCC CCA data, 2014) ..............................................25
Figure 8: UK ceramic sector direct CO2 emissions (BCC 2014 from CCA, 2012) .........................................26
Figure 9: Typical energy split in the heavy clay subsector (BCC) .................................................................26
Figure 10: Typical energy breakdown of a brickworks showing heat recovery from the kiln to the dryer(Carbon Trust 2011) ....................................................................................................................................27
Figure 11: Distribution of fuel types in the ceramic sector ............................................................................27
Figure 12: Shares of production in the four ceramic subsectors used in this study .......................................29
Figure 13: Total revenues in £ millions for selected years per subsector (BCC, 2014) ..................................29
Figure 14: Attitudes to innovation ................................................................................................................32
Figure 15: Performance of pathways for the current trends scenario ............................................................47
Figure 16: Summary of analysis methodology .............................................................................................49
Figure 17: Reference trends for the different scenarios................................................................................53
Figure 18: Option deployment for the BAU pathway ....................................................................................54
Figure 19: Contribution of principal options to the absolute emissions reductions, for the BAU pathway,current trends scenario ...............................................................................................................................56
Figure 20: Breakdown of 2050 emissions reduction, for the BAU pathway, current trends scenario..............57
Figure 21: BAU pathways for the different scenarios ...................................................................................58
Figure 22: Option deployment for the 40-60% CO2 reduction pathway ........................................................60
Figure 23: Contribution of principal options to the absolute emissions reductions throughout study period, forthe 40-60% pathway, current trends scenario ..............................................................................................61
Figure 24: Breakdown of 2050 emissions reductions, for the 40-60% CO2 reduction pathway, current trendsscenario ......................................................................................................................................................62
Figure 25 shows the option deployment for the Max Tech pathway in the current trends scenario................63

INDUSTRIAL DECARBONISATION AND ENERGY EFFICIENCY ROADMAPS TO 2050 – CERAMICS
Pathways to Decarbonisation in 2050 Page vii
Figure 26: Option deployment for the Max Tech pathway ............................................................................63
Figure 27: Contribution of principal options to decarbonisation throughout the study period, for the Max Techpathway, current trends scenario.................................................................................................................65
Figure 28: Breakdown of 2050 emissions reductions, for the Max Tech pathway, current trends scenario ....66
Figure 29: Max Tech pathways for the different scenarios ...........................................................................67

INDUSTRIAL DECARBONISATION AND ENERGY EFFICIENCY ROADMAPS TO 2050 – CERAMICS
Pathways to Decarbonisation in 2050 Page viii
ACRONYMS
ADOPT Adoption RateAPP Applicability RateBAT Best Available TechnologyBAU Business As UsualBCC British Ceramic ConfederationBIS Department of Business, Innovation and SkillsCapex Capital ExpenditureCC Carbon CaptureCCA Climate Change AgreementCCS Carbon Capture and StorageCCU Carbon Capture UtilisationCHP Combined Heat and PowerCO2 CO2
DECC Department of Energy and Climate ChangeEII Energy Intensive IndustriesESCOs Energy Service CompaniesEU ETS European Union Emission Trading SchemeGDP Gross Domestic ProductGHG Greenhouse GasesICT Information and Communication TechnologiesITT Invitation to TenderMax Tech Maximum TechnicalNAEI National Atmospheric Emissions InventoryOEMs Original Equipment ManufacturerOBR Office of Budget ResponsibilityORC Organic Rankine CycleR&D Research and DevelopmentRD&D Research, Development and DemonstrationREA Rapid Evidence AssessmentRF Radio FrequencyROI Return On InvestmentSIC Standard Industrial ClassificationSME Small and Medium Sized EnterprisesSWOT Strengths, Weaknesses, Opportunities, ThreatsTRL Technology Readiness LevelUEP Updated Energy ProjectionVSD Variable Speed Drive
INDUSTRIAL DECARBONISATION AND ENERGY EFFICIENCY ROADMAPS TO 2050 – CERAMICS
Section 1 – Executive Summary Page 1 of 90
1. EXECUTIVE SUMMARY
1.1 What is the ‘Decarbonisation and Energy Efficiency Roadmap’ for theCeramic Sector?
This report is a ‘decarbonisation and energy efficiency roadmap’ for the ceramic sector, one of a series ofeight reports that assess the potential for a low-carbon future across the most energy intensive industrialsectors in the UK. It investigates how to decarbonise and increase energy efficiency industry whilstremaining competitive.
Changes in the international economy and the need to decarbonise mean that UK businesses faceincreasing challenges, as well as new opportunities. The UK Government is committed to moving to a low-carbon economy, including the most energy-intensive sectors. These sectors consume a considerableamount of energy, but also play an essential role in delivering the UK’s transition to a low-carbon economy,as well as in contributing to economic growth and rebalancing the economy.
The roadmap project aims were to:
· Improve understanding of the emissions abatement potential of individual industrial sectors, therelative costs of alternative abatement options and the related business environment includinginvestment decisions, barriers and issues of competitiveness.
· Establish a shared evidence base to inform future policy, and identify strategic conclusions andpotential next steps to help deliver cost effective decarbonisation in the medium to long term (overthe period from 2020-2050).
Each roadmap aims to present existing and new evidence, analysis and conclusions to inform subsequentmeasures with respect to issues such as industry leadership, industrial policy, decarbonisation and energyefficiency technologies, business investments, research, development and demonstration (RD&D) and skills.
This roadmap is the result of close collaboration between industry, academics and government (Departmentof Energy and Climate Change (DECC) and Department for Business, Innovation and Skills (BIS)), whichhas been facilitated and delivered by independent consultants Parsons Brinckerhoff and DNV GL; theauthors of the reports.
1.2 Developing the Ceramic Sector Roadmap
The development of the ceramic sector roadmap consisted of three main phases:
1. Collection of evidence relating to technical options and business-related enablers and barriers fordecarbonisation. Evidence was collected via a literature review, analysis of publicly available data,interviews, workshops, and surveys of ceramic manufacturing companies. Validation of evidenceand early development of the decarbonisation potential took place during an initial workshop.
2. Development of decarbonisation ‘pathways’ to 2050 to identify and investigate an illustrativetechnology mix for a range of emissions reduction levels. Draft results were validated at a secondworkshop.
3. Interpretation and analysis of the technical and business-related evidence to draw conclusions andidentify potential next steps. These example actions, which are informed by the evidence andanalysis, aim to assist with overcoming barriers to delivery of technologies within thedecarbonisation and energy efficiency pathways while maintaining international competitiveness.
INDUSTRIAL DECARBONISATION AND ENERGY EFFICIENCY ROADMAPS TO 2050 – CERAMICS
Section 1 – Executive Summary Page 2 of 90
A sector team comprising representatives from the ceramic industry and its trade association, the BritishCeramic Confederation (BCC), the government and Keele University has acted as a steering group as wellas contributing evidence and reviewing draft project outputs. In addition, the outputs have beenindependently peer-reviewed. It should be noted that the findings from the interviews and workshopsrepresent the opinions and perceptions of particular industrial stakeholders, and may not therefore berepresentative of the entire sector. Where possible we have tried to include alternative findings or viewpoints,but this has not always been possible; this needs to be taken into account when reading this report.
1.3 Sector Findings
The ceramic sector is characterised by the use of high temperature kilns to make products ranging fromfamiliar products such as bricks, wall tiles and tableware to specialist products such as high temperaturerefractories, armour plating, electronic substrates and artificial joints. Throughout the entire sector drying andfiring processes use large amounts of energy, predominantly natural gas, while a smaller number ofspecialist kilns are heated using electricity. The combustion of fossil fuel, indirect emissions from electricityconsumption, plus process emissions (resulting from chemical changes in the raw materials during firing)makes up the ceramic sector carbon dioxide emissions shown in Table 1, the smallest among the eightsectors.
SECTOR TOTAL ANNUAL CARBON EMISSIONS 2012(MILLION TONNES CO2)
Iron and Steel1 22.8
Chemicals 18.4
Oil Refining 16.3
Food and Drink 9.5
Pulp and Paper 3.3
Cement2 7.5
Glass 2.2
Ceramic 1.2
Table 1: Energy-intensive industry total direct and indirect carbon emissions in 2012 (data sources include ClimateChange Agreements (CCA), European Union Emissions Trading Scheme (EU ETS) and National Atmospheric
Emissions Inventory (NAEI))
The ceramic sector employs specific mechanical and chemical processes to convert raw materials into apowder, malleable solid or slurry. These are then shaped, typically by pressing, extruding or casting, and theresultant blank products are dried and fired to a high temperature. Further finishing processes or firing stepsmay be undertaken for specific products. The ceramic sector produced over four million tonnes of diverseproducts in 2012; 89% comprised heavy clay construction products, and the remaining 11%, refractories,whitewares and technical ceramics. The sector contributed a direct value to the UK economy of £1 billion in2012.
1 For the iron and steel sector, the reference year used is 2013. This was chosen due to the large production increase from the re-commissioning of SSI Teesside steelworks in 2012.2 For the cement sector, the 2012 actual production levels where adversely affected by the recession. Therefore we have assumedproduction of 10 mtpa (rather than the actual production in 2012) and normalised emssions to this production level
INDUSTRIAL DECARBONISATION AND ENERGY EFFICIENCY ROADMAPS TO 2050 – CERAMICS
Section 1 – Executive Summary Page 3 of 90
The ceramic sector is energy intensive; fuel costs represent up to 35% of total manufacturing costs. In 2012it was estimated to emit 0.94 million tonnes/year of carbon dioxide (CO2), with a further 0.28 milliontonnes/year emitted in electricity production for use within the sector.
1.4 Enablers and Barriers for Decarbonisation in the Ceramic Sector
In this report, we look at ‘enablers’, ‘barriers’ and ‘technical options’ for decarbonisation of the ceramic sector.There is some overlap between barriers and enablers, as they sometimes offer two perspectives on thesame issue. Based on our research, the main enablers for decarbonisation for the ceramic sector include:
· Projects providing multiple benefits (energy, carbon and labour cost reduction, improved productionyield, increased capacity to satisfy a growing market, etc.) are more likely to be invested in
· Compliance with legal obligations (e.g. environmental licence)· A strong, evidence-based business case for energy and decarbonisation measures that capture all
benefits and cost· Stable and internationally competitive business and regulatory environment that encourages long
term capital investment in new technology and innovation· Willingness of top management to make carbon emission reduction a priority· The need to replace obsolete equipment, expand production or reduce operational manpower
The main barriers to decarbonisation have been identified as:
· Long investment cycles (given equipment life of up to 40 years) and high capital costs of newtechnologies
· Low margins affecting ability to invest and limiting the appetite for innovations that risk diminishingproduct quality or causing production disruption
· Increasing concern about the security of energy supply where an interruption can cause majordamage taking months to repair coupled with increasingly volatile electricity and gas prices
· Threat of rising energy prices, the cost of carbon and UK-only climate related charges· Requirement for very high rates of return or short payback time on all projects including energy
efficiency· Shortage of proven, financially viable and demonstrated energy-efficiency technologies· Lack of government support (e.g. financial) for sector research, development and demonstration
(RD&D) and future implementation of emerging and breakthrough technologies· Regulatory uncertainty on energy, climate, environmental and innovation issues undermines the
business case for high cost, long-term investment· Lack of reliable information about technical feasibility, costs and benefits of new technologies· Limited access to affordable capital and adequate grants
1.5 Analysis of Decarbonisation Potential in the Ceramic Sector
A ‘pathway’ represents a particular selection and deployment of options from 2012 to 2050 chosen toachieve reductions falling into a specific decarbonisation band relative to a reference trend in which nooptions are deployed. Two further pathways with specific definitions were also created, assessing (i) whatwould happen if no particular additional interventions were taken to accelerate decarbonisation (business asusual, BAU) or (ii) the maximum possible technical potential for decarbonisation in the sector (Max Tech). Apathway is an illustration of how the ceramics industry could potentially decarbonise from our reference year2012 to 2050. These pathways include deployment of options comprising (i) incremental improvements toexisting technology, (ii) upgrades to utilise best available technology (BAT), and (iii) the application of
INDUSTRIAL DECARBONISATION AND ENERGY EFFICIENCY ROADMAPS TO 2050 – CERAMICS
Section 1 – Executive Summary Page 4 of 90
significant process changes using ‘disruptive’ technologies that have the potential to become commerciallyviable in the medium term.
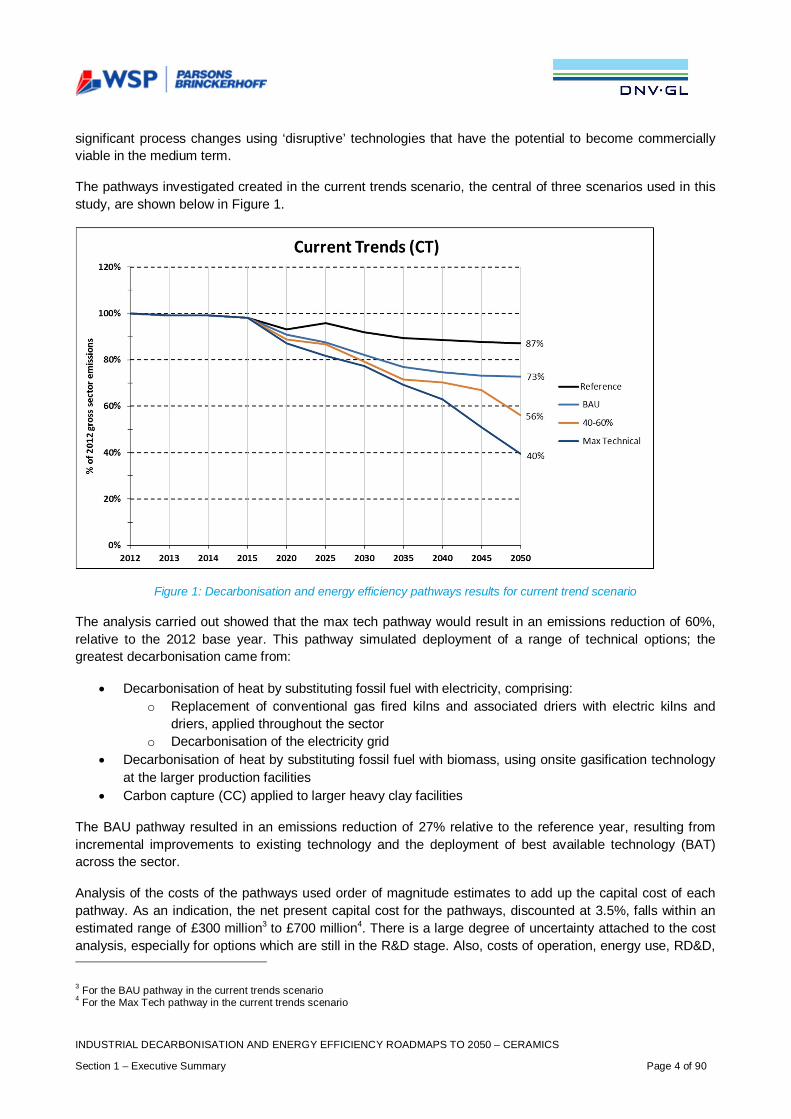
The pathways investigated created in the current trends scenario, the central of three scenarios used in thisstudy, are shown below in Figure 1.
Figure 1: Decarbonisation and energy efficiency pathways results for current trend scenario
The analysis carried out showed that the max tech pathway would result in an emissions reduction of 60%,relative to the 2012 base year. This pathway simulated deployment of a range of technical options; thegreatest decarbonisation came from:
· Decarbonisation of heat by substituting fossil fuel with electricity, comprising:o Replacement of conventional gas fired kilns and associated driers with electric kilns and
driers, applied throughout the sectoro Decarbonisation of the electricity grid
· Decarbonisation of heat by substituting fossil fuel with biomass, using onsite gasification technologyat the larger production facilities
· Carbon capture (CC) applied to larger heavy clay facilities
The BAU pathway resulted in an emissions reduction of 27% relative to the reference year, resulting fromincremental improvements to existing technology and the deployment of best available technology (BAT)across the sector.
Analysis of the costs of the pathways used order of magnitude estimates to add up the capital cost of eachpathway. As an indication, the net present capital cost for the pathways, discounted at 3.5%, falls within anestimated range of £300 million3 to £700 million4. There is a large degree of uncertainty attached to the costanalysis, especially for options which are still in the R&D stage. Also, costs of operation, energy use, RD&D,
3 For the BAU pathway in the current trends scenario4 For the Max Tech pathway in the current trends scenario

INDUSTRIAL DECARBONISATION AND ENERGY EFFICIENCY ROADMAPS TO 2050 – CERAMICS
Section 1 – Executive Summary Page 5 of 90
civil works, modifications to plant and costs to other stakeholders are significant for some options, but notincluded here. The costs presented are for the study period and are adjusted to exclude residual value after2050, thus a proportion of the costs of high capex items deployed close to 2050 is excluded. Great care mustbe taken in how these costs are interpreted. While implementation of some of the options within thepathways may reduce energy costs due to increased efficiency, the scale of the investments associated withthe pathways must be considered by stakeholders when planning the next steps in the sector.
1.6 Conclusions and Key Technology Groups
The following conclusions have been drawn from the evidence and analysis:
Strategy Leadership and Organisation
It is critical that the ceramic sector, the government and other stakeholders recognise the importance ofstrategy and leadership in the context of decarbonisation and energy efficiency and in strengthening theshort and longer term competitiveness of the sector.
Business Case Barriers
One of the most important barriers to decarbonisation and increased energy efficiency is reported by many inthe sector as lack of funding for such projects in the UK due to low margins, limiting available capital, lowerreturns and higher risks compared with competitor economies.
Future Energy Costs, Energy Supply Security, Market Structure and Competition
It is clearly critical to ensure that future decarbonisation and energy efficiency actions maintain the positionwith respect to overall cost-competitiveness of the UK sector compared to competing businesses operatingin other regions of Europe, Asia and the US. This strategic conclusion links to a number of external factorsthat influence the business environment in which the sector operates. These include energy security andenergy and carbon cost comparison to other regions (both reality and perception), as these factors areimportant criteria for investment decisions.
Industrial Energy Policy Context
Long-term energy and climate change policy is key to investor confidence. Many in the industry believe thatthere is a need for incentive schemes to become long-term commitments, as changes in policy can bedamaging, particularly when the business case for investment is marginal and is highly dependent uponfactors such as (fluctuating) energy related costs.
Life-Cycle Accounting
The ceramic sector uses raw materials from, and provides its products to, other parts of the economy. Thereneeds to be a means of understanding the overall carbon impact of the entire product life-cycle. For examplea ceramic building product or a refractory material for a glass furnace may deliver significant energy savingsin its lifetime of use. Wider application of tools to measure and allocate these products may enableinvestments to be made through recognising life-cycle benefits.
Value Chain Collaboration
The carbon emissions of the ceramic sector are significantly affected by the expectations of consumers, thebusiness needs of users together with the defined product standards. Better recognition of the opportunityand collaboration across the value chain could enable products with lower lifecycle carbon emissions to bedeveloped and adopted.
INDUSTRIAL DECARBONISATION AND ENERGY EFFICIENCY ROADMAPS TO 2050 – CERAMICS
Section 1 – Executive Summary Page 6 of 90
Research, Development and Demonstration (RD&D)
The ceramic sector needs to explore and apply new technologies to reduce energy consumption and carbonemissions. The costs and uncertainties of RD&D are challenging to fund and the cost of commercial scaledemonstrator projects needed before new technologies can be deployed often represent too large a risk foran individual company to fund. Collaboration and co-funding would be a solution but companies may beconstrained in collaborating with direct competitors. There may be opportunities for addressing commonissues across several sectors employing high temperature processes e.g. ceramic, cement, glass and ironand steel.
People and Skills
New manpower resources with specialised skills and knowledge in process and thermal engineering areincreasingly needed by the UK ceramic sector. To make the choice between ‘standard’ equipment and moreenergy efficient equipment when making investment, knowledge is needed. This is, and will continue to be,key to decarbonising the sector. Advanced technologies are attractive to the younger generation so it is alsoan opportunity to attract more young people to start working in the sector.
The key technology groups that this investigation found made the largest contributions to sectordecarbonisation are as follows:
Electricity Grid Decarbonisation
Decarbonisation of this key source of energy supply could provide a significant contribution to the overalldecarbonisation of the sector. Actions will be required to ensure that this takes place while maintaining cost-competitiveness (see also Future Energy Costs, Energy Supply Security, Market Structure and Competitionabove). The Government’s reforms of the electricity market are already driving electricity griddecarbonisation, and this report uses assumptions of a future electricity decarbonisation trajectory that isconsistent with Government methodology and modelling.
Electrification of Heat
Ceramic sector energy use is dominated by fossil fuels. The pathway analysis has demonstrated thatmigration to low carbon electricity is a key option for decarbonisation. The heavy clay subsector has thelargest energy consumption and carbon emissions but there are currently no large scale continuous kilndesigns available to meet the needs of the subsector. A large scale continuous electric kiln would be verydifferent to one designed to be heated by gas combustion and significant development will be required incollaboration with manufacturers to produce and demonstrate a suitable design for widespread application.
Fuel and Feedstock Availability (Including Biomass)
The availability and cost of biomass is a potential issue for sector decarbonisation, given its importance tothe pathways (although the no biomass Max Tech pathway has shown that significant decarbonisation canbe achieved without it). This availability issue is critical in view of the long-term investment associated withkiln upgrades. The security of biomass supply is particularly affected by competition between sectors, withlarge scale biomass use for power generation seen to be less price sensitive than the ceramic sector. Thechallenges are to understand where the greatest decarbonisation potential can be achieved with a limitedresource, as well as to maximise the availability of the resource (links to Life-cycle Accounting above).
Energy Efficiency and Heat Recovery
The pathways demonstrate that the largest early improvements in carbon emissions result from theapplication of energy efficiency and heat recovery techniques, to both existing and new kilns. The
INDUSTRIAL DECARBONISATION AND ENERGY EFFICIENCY ROADMAPS TO 2050 – CERAMICS
Section 1 – Executive Summary Page 7 of 90
improvement to energy efficiency by a range of measures related to combustion and reduction of heat lossesis complemented by the application of increased heat recovery to kiln and drier exhaust streams. New BATkilns include these features, although improvements in heat recovery technology to handle the challengingapplication will need further progressive development to maximise its potential on both new and existing kilns.
Carbon Capture
Individual ceramic sites are not considered to be of a sufficient scale to justify their own CO2 pipeline andstorage infrastructure. Collaboration is necessary to establish the networks, along with the availability ofsources of funding appropriate to this type of shared infrastructure. In addition, while even large ceramicsites produce exhaust flows for which proven carbon capture technology exists, there are challenges of lowCO2 concentration and the presence of aggressive acid gases in the exhaust stream that are unprecedented.Work is therefore necessary to develop and demonstrate economic carbon capture technology appropriateto commercial application in the sector at this scale (links to Research, Development and Demonstrationtheme).
Other Technologies (Specific to the Ceramic Sector)
High temperature transformation of materials is characteristic of ceramic products. However the sequenceand details of processing steps for each product can be refined for different purposes – to reduce costs,increase throughput, minimise rejects or reduce energy – and adjustments made to benefit one aspect mayadversely affect another. There are therefore a range of improvements to ceramic processes that can beoptimised or traded-off to reduce emissions, preferably in conjunction with reduced costs or increasedthroughput. These include changes to the composition of raw materials to permit lower firing temperatures tobe achieved, changes in manufacturing processes to permit the omission of firing steps and adjustments toimprove energy utilisation by closer kiln packing. Some of these improvements are inherently highly specificto products and production facilities, while others relate to materials properties that are generic. As a resultsome of these improvements can only be made at a company level, while others are perhaps bestaddressed in collaboration; in either case these relate to the Research, Development and Demonstrationtheme above.
Next Steps
This roadmap report is intended to provide an evidence-based foundation upon which future policy can beimplemented and actions delivered. The way in which the report has been compiled is designed to ensure ithas credibility with industrial, academic and other stakeholders and is recognised by government as a usefulcontribution when considering future policy.
INDUSTRIAL DECARBONISATION AND ENERGY EFFICIENCY ROADMAPS TO 2050 – CERAMICS
Section 2 - Introduction, Including Methodology Page 8 of 90
2. INTRODUCTION, INCLUDING METHODOLOGY
2.1 Project Aims and Research Questions
2.1.1 Introduction
Changes in the international economy, coupled with the need to decarbonise, mean that UK businesses faceincreased competition as well as new opportunities. The government wants to enable UK businesses tocompete and grow while moving to a low-carbon economy. The UK requires a low-carbon economy butcurrently includes industries that consume significant amounts of energy. These energy-intensive industrieshave an essential role to play in delivering the UK’s transition to a low-carbon economy, as well contributingto economic growth and rebalancing the economy.
Overall, industry is responsible for nearly a quarter of the UK’s total emissions (DECC, 2011)5. By 2050, thegovernment expects industry to have delivered a proportionate share of emissions cuts, achieving reductionsof up to 70% from 2009 levels (DECC, 2011). Nonetheless, the government recognises the risk of ‘carbonleakage’ and ‘investment leakage’ arising from the need to decarbonise and is committed to ensuring thatenergy-intensive industries are able to remain competitive during the transition to a low-carbon economy.
The Department of Energy and Climate Change (DECC) and the Department of Business, Innovation andSkills (BIS) have set up a joint project focusing on the eight industrial sectors which use the greatest amountof energy6. The project aims to improve the understanding of technical options available to sectors to reducecarbon emissions and increase energy efficiency while remaining competitive. This includes includeinvestigating the costs involved, the related business environment, and how investment decisions are madein sector firms. This will provide the industry and government with a better understanding of the technical andeconomic abatement potential, set in the relevant business context, with the aim to agree measures thatboth the government and these industries can take to reduce emissions while maintaining sectorcompetitiveness.
The project scope covers both direct emissions from sites within the sector and indirect emissions from theuse of electricity at the sites but generated off site
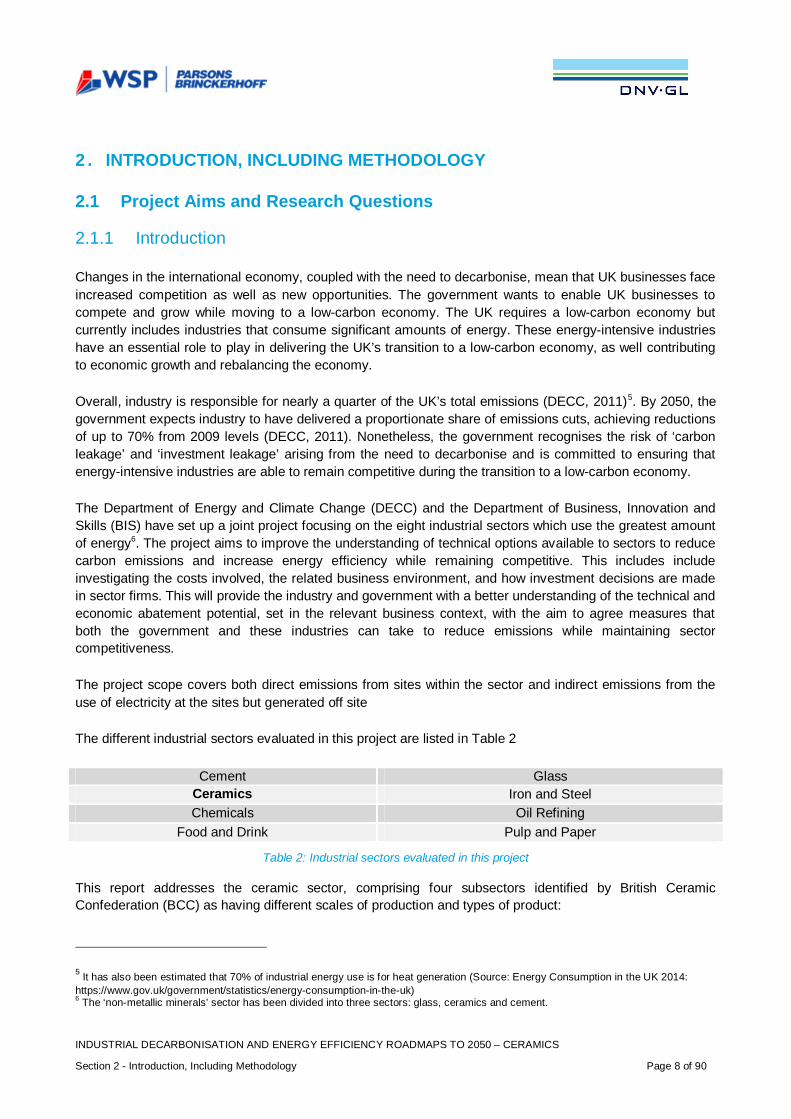
The different industrial sectors evaluated in this project are listed in Table 2
Cement GlassCeramics Iron and SteelChemicals Oil Refining
Food and Drink Pulp and Paper
Table 2: Industrial sectors evaluated in this project
This report addresses the ceramic sector, comprising four subsectors identified by British CeramicConfederation (BCC) as having different scales of production and types of product:
5 It has also been estimated that 70% of industrial energy use is for heat generation (Source: Energy Consumption in the UK 2014:https://www.gov.uk/government/statistics/energy-consumption-in-the-uk)6 The ‘non-metallic minerals’ sector has been divided into three sectors: glass, ceramics and cement.

INDUSTRIAL DECARBONISATION AND ENERGY EFFICIENCY ROADMAPS TO 2050 – CERAMICS
Section 2 - Introduction, Including Methodology Page 9 of 90
· Heavy clay construction products (bricks, roofing tiles, clay drainage pipes etc.)· Whitewares (sanitary ware, floor and wall tiles, tableware and giftware)· Refractories (high temperature heat resistant materials vital in all high-temperature processes
including metals making, the production of cement, petrochemical processes, glass and ceramic)· Technical ceramics (special purpose ceramic components for electronics, medical, environmental
protection, military and structural applications)
A fifth subsector, raw materials extraction and processing is related to ceramic sector as a supplier of somematerials. It is not addressed in this study as it covers a diverse range of processes and supplies mineralproducts to numerous sectors in addition to ceramic.
2.1.2 Aims of the Project
The DECC 2011 Carbon Plan outlined how the UK would achieve decarbonisation and make the transition toa low-carbon economy while trying to maintain energy security and minimise negative economic impacts.This project aims to improve evidence on decarbonisation and energy efficiency for eight energy-intensiveindustry sectors.
The project consortium Parsons Brinckerhoff and DNV GL was appointed by DECC and BIS in 2013 to workwith stakeholders, including the UK manufacturers’ organisations (i.e. trade associations), to establish ashared evidence base to support decarbonisation. The roadmap process consisted of three main phases:
i. Information and evidence gathering on existing technical options and potential breakthroughtechnologies, together with research to identify the social and business enablers and barriers todecarbonisation
ii. Development of sector decarbonisation and energy efficiency pathwaysiii. Conclusions and identification of potential next steps
A series of questions were posed by DECC and BIS as part of the project. These ‘principal questions’ guidedthe research undertaken and the conclusions of this report. The questions and the report section in whichthey are addressed are stated below:
1. What are the current emissions from each sector and how is energy used? - section 3.32. For each sector, what is the business environment, what are the business strategies of companies,
and how does it impact on decisions to invest in decarbonisation? - section 3.43. How might the baseline level of energy and emissions in the sectors change over the period to 2050?
- section 4.34. What is the potential to reduce emissions in these sectors beyond the baseline over the period to
2050? - section 4.45. What emissions pathways might each sector follow over the period to 2050 under different scenarios?
- section 4.46. What next steps into the future might be required by industry, the government and others to
overcome the barriers in order to achieve the pathways in each sector? - section 5
2.1.3 What is a Roadmap?
A ‘roadmap’, in the context of this research, is a mechanism to visualise future paths, the relationshipbetween them and the required actions to achieve a certain goal. A technology roadmap is a plan thatmatches short-term and long-term goals with specific technology solutions to help meet those goals.
INDUSTRIAL DECARBONISATION AND ENERGY EFFICIENCY ROADMAPS TO 2050 – CERAMICS
Section 2 - Introduction, Including Methodology Page 10 of 90
Roadmaps for achieving policy objectives go beyond technology solutions into broader consideration ofstrategic planning, market demands, supplier capabilities, and regulatory and competitive information.
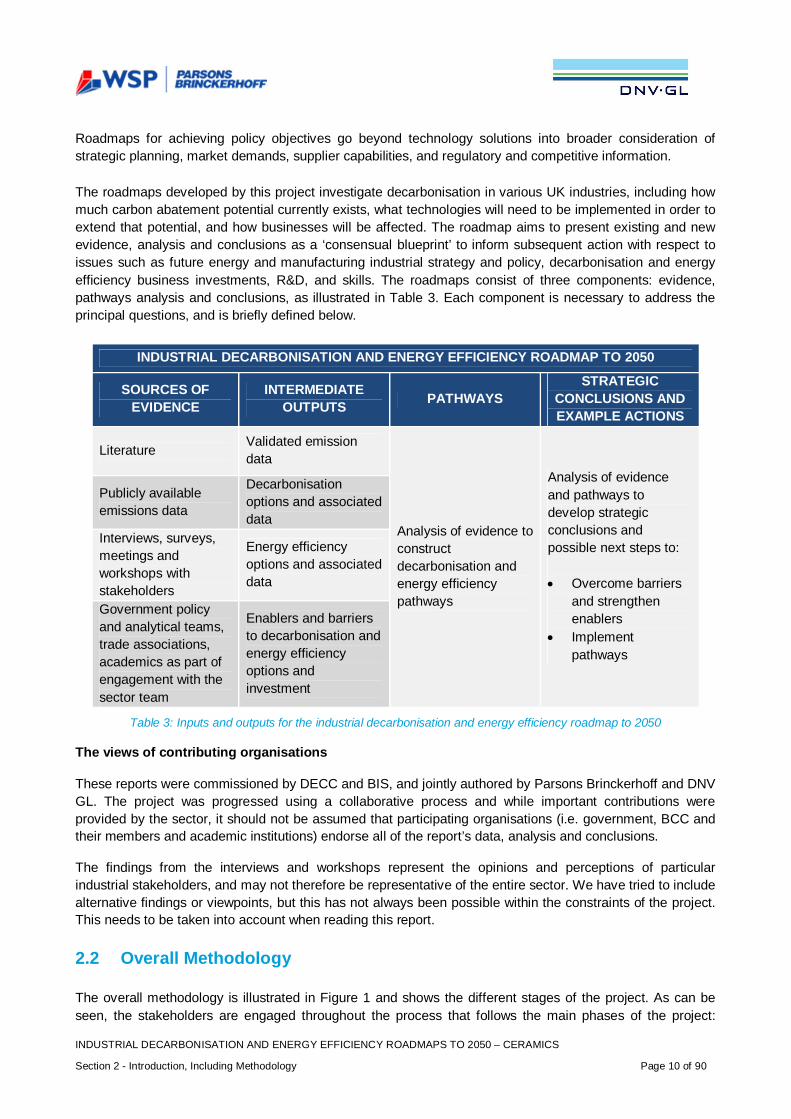
The roadmaps developed by this project investigate decarbonisation in various UK industries, including howmuch carbon abatement potential currently exists, what technologies will need to be implemented in order toextend that potential, and how businesses will be affected. The roadmap aims to present existing and newevidence, analysis and conclusions as a ‘consensual blueprint’ to inform subsequent action with respect toissues such as future energy and manufacturing industrial strategy and policy, decarbonisation and energyefficiency business investments, R&D, and skills. The roadmaps consist of three components: evidence,pathways analysis and conclusions, as illustrated in Table 3. Each component is necessary to address theprincipal questions, and is briefly defined below.
INDUSTRIAL DECARBONISATION AND ENERGY EFFICIENCY ROADMAP TO 2050
SOURCES OFEVIDENCE
INTERMEDIATEOUTPUTS PATHWAYS
STRATEGICCONCLUSIONS ANDEXAMPLE ACTIONS
LiteratureValidated emissiondata
Analysis of evidence toconstructdecarbonisation andenergy efficiencypathways
Analysis of evidenceand pathways todevelop strategicconclusions andpossible next steps to:
· Overcome barriersand strengthenenablers
· Implementpathways
Publicly availableemissions data
Decarbonisationoptions and associateddata
Interviews, surveys,meetings andworkshops withstakeholders
Energy efficiencyoptions and associateddata
Government policyand analytical teams,trade associations,academics as part ofengagement with thesector team
Enablers and barriersto decarbonisation andenergy efficiencyoptions andinvestment
Table 3: Inputs and outputs for the industrial decarbonisation and energy efficiency roadmap to 2050
The views of contributing organisations
These reports were commissioned by DECC and BIS, and jointly authored by Parsons Brinckerhoff and DNVGL. The project was progressed using a collaborative process and while important contributions wereprovided by the sector, it should not be assumed that participating organisations (i.e. government, BCC andtheir members and academic institutions) endorse all of the report’s data, analysis and conclusions.
The findings from the interviews and workshops represent the opinions and perceptions of particularindustrial stakeholders, and may not therefore be representative of the entire sector. We have tried to includealternative findings or viewpoints, but this has not always been possible within the constraints of the project.This needs to be taken into account when reading this report.
2.2 Overall Methodology
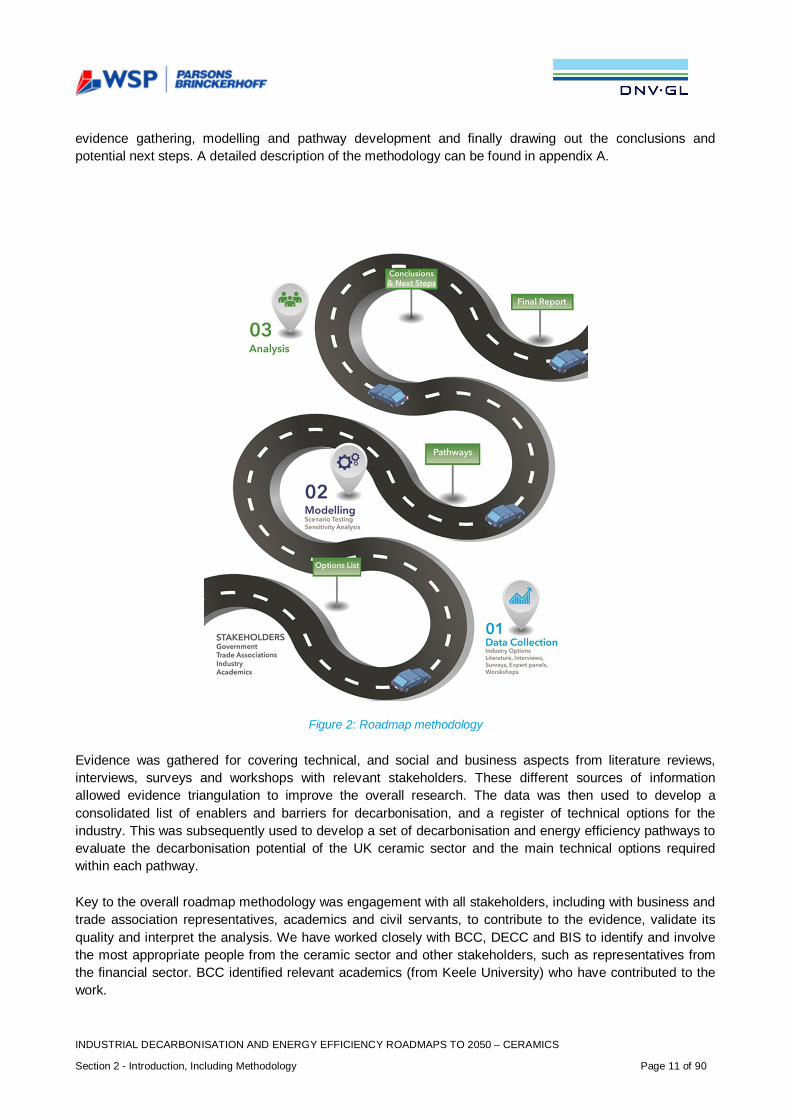
The overall methodology is illustrated in Figure 1 and shows the different stages of the project. As can beseen, the stakeholders are engaged throughout the process that follows the main phases of the project:
INDUSTRIAL DECARBONISATION AND ENERGY EFFICIENCY ROADMAPS TO 2050 – CERAMICS
Section 2 - Introduction, Including Methodology Page 11 of 90
evidence gathering, modelling and pathway development and finally drawing out the conclusions andpotential next steps. A detailed description of the methodology can be found in appendix A.
Figure 2: Roadmap methodology
Evidence was gathered for covering technical, and social and business aspects from literature reviews,interviews, surveys and workshops with relevant stakeholders. These different sources of informationallowed evidence triangulation to improve the overall research. The data was then used to develop aconsolidated list of enablers and barriers for decarbonisation, and a register of technical options for theindustry. This was subsequently used to develop a set of decarbonisation and energy efficiency pathways toevaluate the decarbonisation potential of the UK ceramic sector and the main technical options requiredwithin each pathway.
Key to the overall roadmap methodology was engagement with all stakeholders, including with business andtrade association representatives, academics and civil servants, to contribute to the evidence, validate itsquality and interpret the analysis. We have worked closely with BCC, DECC and BIS to identify and involvethe most appropriate people from the ceramic sector and other stakeholders, such as representatives fromthe financial sector. BCC identified relevant academics (from Keele University) who have contributed to thework.
INDUSTRIAL DECARBONISATION AND ENERGY EFFICIENCY ROADMAPS TO 2050 – CERAMICS
Section 2 - Introduction, Including Methodology Page 12 of 90
Together with stakeholders, the enablers and barriers were reviewed to identify a range of possible nextsteps that could be implemented.
2.2.1 Findings
Evidence Gathering
The data focused on technical, and social and business information, aiming to acquire evidence on:
· Decarbonisation options (i.e. technologies)· Enablers and barriers to decarbonisation and energy efficiency· Background to the sector· Current state of the sector and possible future changes within the sector· Business environment and markets· Potential next steps
Such evidence was required to either answer the principal questions directly and/or to inform thedevelopment of decarbonisation and energy efficiency pathways for 2050. Four methods of research wereused in order to gather as much evidence as possible (and to triangulate the information) within a shorttimescale. These methods were:
· Literature review: A short, focussed review of over 25 documents all published after 2000 wascompleted. The documents were either related to energy efficiency and decarbonisation of theceramic sector or to energy-intensive industries in general. This was not a thorough literature reviewor rapid evidence assessment (REA) but a desktop research exercise deemed sufficient by theproject team7 in its breadth and depth to capture the evidence required for the purpose of this project.The literature review was not intended to be exhaustive and aimed to capture key documentationthat applied to the UK. This included the sector structure, recent history and context includingconsumption, demand patterns and emissions, the business environment, organisational anddecision-making structures and the impacts of UK policy and regulation. Further details are providedin appendix A.
· Interviews: The ceramic companies interviewed, represented the four subsectors: heavy clay,whitewares, refractories and technical ceramics in the UK, and included UK decision-makers andtechnical specialists in the sector. These interviews were conducted to provide greater depth andinsight to the issues faced by companies. In liaison with BCC, DECC and BIS, these six face-to-facesemi-structured interviews were carried out with Ibstock Brick, Naylor Industries, Portmeirion Group,Ideal Standard, DSF Refractories / Minerals and Mantec Group, using the ’interview protocol’ (seeappendix A). The purpose of the interviews was to obtain further details on the different subsectorswithin the ceramic sector and gain a deeper understanding of the principal questions, including howcompanies make investment decisions, how advanced technologies are financed, what a company’sstrategic priorities are and where climate change sits within this. The interviewees were interviewedusing an interview protocol template, developed in liaison with DECC and BIS. This template wasused to ensure consistency across interviews, fill gaps in the literature review, identify key successstories and extract key barriers to investment in low carbon technologies. The interview protocol canbe found in appendix A.
7 DECC, BIS and the consultants of PB and DNV GL.
INDUSTRIAL DECARBONISATION AND ENERGY EFFICIENCY ROADMAPS TO 2050 – CERAMICS
Section 2 - Introduction, Including Methodology Page 13 of 90
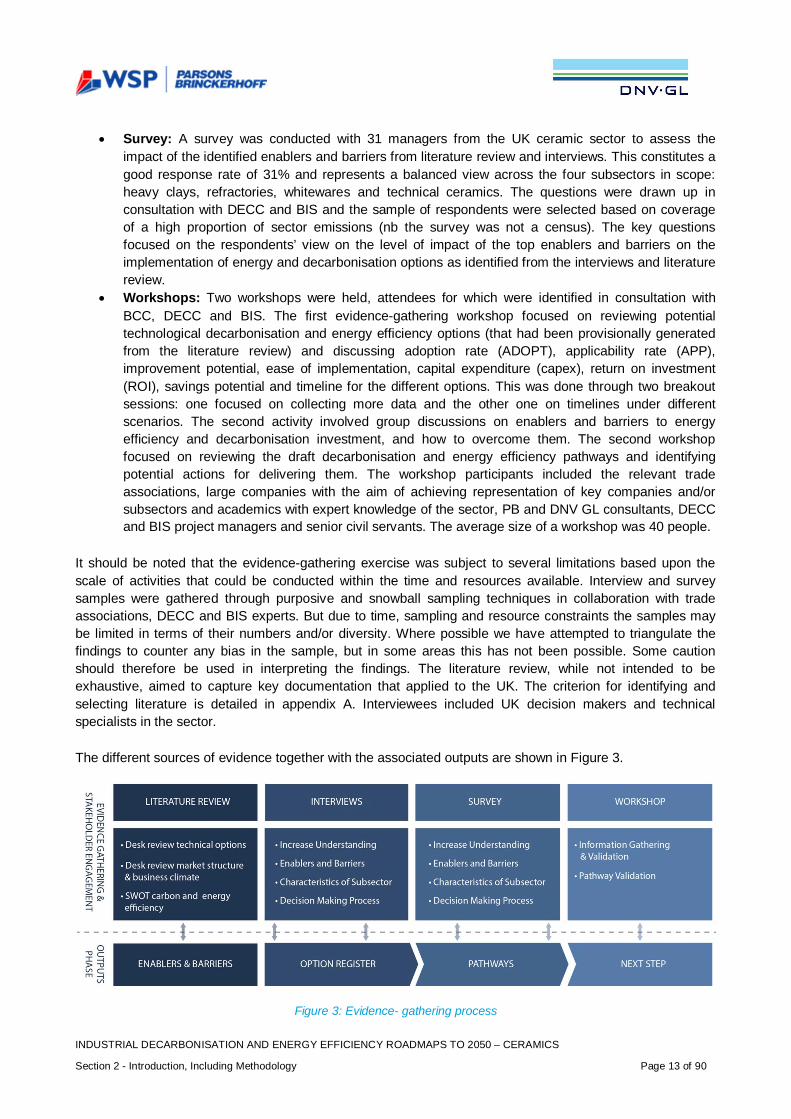
· Survey: A survey was conducted with 31 managers from the UK ceramic sector to assess theimpact of the identified enablers and barriers from literature review and interviews. This constitutes agood response rate of 31% and represents a balanced view across the four subsectors in scope:heavy clays, refractories, whitewares and technical ceramics. The questions were drawn up inconsultation with DECC and BIS and the sample of respondents were selected based on coverageof a high proportion of sector emissions (nb the survey was not a census). The key questionsfocused on the respondents’ view on the level of impact of the top enablers and barriers on theimplementation of energy and decarbonisation options as identified from the interviews and literaturereview.
· Workshops: Two workshops were held, attendees for which were identified in consultation withBCC, DECC and BIS. The first evidence-gathering workshop focused on reviewing potentialtechnological decarbonisation and energy efficiency options (that had been provisionally generatedfrom the literature review) and discussing adoption rate (ADOPT), applicability rate (APP),improvement potential, ease of implementation, capital expenditure (capex), return on investment(ROI), savings potential and timeline for the different options. This was done through two breakoutsessions: one focused on collecting more data and the other one on timelines under differentscenarios. The second activity involved group discussions on enablers and barriers to energyefficiency and decarbonisation investment, and how to overcome them. The second workshopfocused on reviewing the draft decarbonisation and energy efficiency pathways and identifyingpotential actions for delivering them. The workshop participants included the relevant tradeassociations, large companies with the aim of achieving representation of key companies and/orsubsectors and academics with expert knowledge of the sector, PB and DNV GL consultants, DECCand BIS project managers and senior civil servants. The average size of a workshop was 40 people.
It should be noted that the evidence-gathering exercise was subject to several limitations based upon thescale of activities that could be conducted within the time and resources available. Interview and surveysamples were gathered through purposive and snowball sampling techniques in collaboration with tradeassociations, DECC and BIS experts. But due to time, sampling and resource constraints the samples maybe limited in terms of their numbers and/or diversity. Where possible we have attempted to triangulate thefindings to counter any bias in the sample, but in some areas this has not been possible. Some cautionshould therefore be used in interpreting the findings. The literature review, while not intended to beexhaustive, aimed to capture key documentation that applied to the UK. The criterion for identifying andselecting literature is detailed in appendix A. Interviewees included UK decision makers and technicalspecialists in the sector.
The different sources of evidence together with the associated outputs are shown in Figure 3.
Figure 3: Evidence- gathering process
INDUSTRIAL DECARBONISATION AND ENERGY EFFICIENCY ROADMAPS TO 2050 – CERAMICS
Section 2 - Introduction, Including Methodology Page 14 of 90
The different sources of evidence were used to develop a consolidated list of barriers to and enablers fordecarbonisation and energy efficiency, and a register of technical options for the ceramic sector. Evidenceon adoption rate (ADOPT), applicability (APP), improvement potential, ease of implementation, capex, ROIand saving potential of all options (where available) was collected, together with information on strengths,weaknesses, opportunities and threats (SWOT). A SWOT analysis is a different lens to examine the enablersand barriers and reinforce conclusions and linkages between evidence sources. It identifies how internalstrengths mitigate external threats and can be used to create new opportunities, and how new opportunitiescan help overcome weaknesses. By clustering the various possibilities, we identified key stories from theSWOT analysis which enabled us to describe the business and market story in which companies operate.Further information on the SWOT analysis is provided in appendix B. The SWOT analysis was used tofurther understand and validate the surveys and initial findings from the literature review and provided thebasis for workshop and interview discussions and further helped to qualify the interview and workshopoutcomes. Enablers and barriers were prioritised as a result of the outcomes and analysis of the evidence-gathering process and workshop scores.
This information was used to inform the development of a set of decarbonisation and energy efficiencypathways to illustrate the decarbonisation potential of the ceramic sector in the UK. The summary andoutcomes of this analysis are discussed in Section 4.7.
The evidence-gathering process was supported by high levels of engagement with a wide range ofstakeholders including industry members, trade association representatives, academics and staff from DECCand BIS.
The evidence-gathering exercise (see appendix A for details) was subject to inherent limitations based uponthe scale of activities and sample sizes that could be conducted within the time and resources available. Theliterature review was not intended to be exhaustive and aimed to capture key documentation that applied tothe UK.
The identification of relevant information and data was approached from both ‘global’ and ‘UK’ viewpoints.The global outlook examined dominating technologies and process types, global production, CO2 emissions(in the EU28), and the global outlook to 2050, including the implications for ceramic producers andconsumers. The UK outlook examined the sector structure, recent history and context including consumption,demand patterns, emissions, the business environment, organisational and decision-making structures andthe impacts of UK policy and regulation.
Options examined were relevant to preparation, forming, drying, firing and finishing processes of products,as well as options that substituted lower carbon fuels for the current energy sources. Potentiallytransformative options involving radical changes to manufacturing processes were identified and assessedfor readiness for wide scale application.
Evidence Analysis
The first stage in the analysis was to assess the strength of the evidence for the identification of the enablersand barriers. This was based on the source and strength of the evidence, and whether the findings werevalidated by more than one information source. The evidence was also analysed and interpreted using avariety of analytical techniques. Elements of the Porter’s five forces analysis, SWOT analysis and systemanalysis were used to conduct the analysis of the business environment, and the enablers and barriers(section 3.4.5); while concepts from storytelling and root cause analysis were used during the interviews withstakeholders. These different techniques are discussed in appendix B.
INDUSTRIAL DECARBONISATION AND ENERGY EFFICIENCY ROADMAPS TO 2050 – CERAMICS
Section 2 - Introduction, Including Methodology Page 15 of 90
The options register of the technology options for decarbonisation was developed based on the literaturereview, interviews, the evidence gathering workshop, and additional information provided by BCC and itsmembers. The strengths, weaknesses, enablers and barriers of each option were taken into account torefine the options register, which was then used to build up the different pathways in the pathway model.
A second stage in the analysis was the classification of technological options and an assessment of theirreadiness.
Limitations of these Findings
The scope of the study did not cover a full assessment of the overall innovation chain or of presentlandscape of policies and actors. Direct and indirect impacting policies, gaps in the current policy portfolio,and how future actions would fit into that portfolio (e.g. whether they would supplement or supplant existingpolicies) are not assessed in the report in any detail.
2.2.2 Pathways
The pathways analysis is an illustration of how the ceramic industry could potentially decarbonise from thebase year 2012 to 2050. Together the set of pathways developed in the study help give a view of the rangeof technology mixes that the sector could deploy over coming decades. Each pathway consists of differenttechnology options that are implemented over time at different levels. Each technology option included anumber of key input parameters including CO2 reduction, cost, fuel use change, applicability, currentadoption (in the base year), and deployment (both rate and extent). A ‘pathway’ represents a particularselection and deployment of options from 20148 to 2050chosen to achieve reductions falling into a specificdecarbonisation band.
In this project, up to five pathways were developed, three of which were created to explore possible ways todeliver CO2 emissions to different decarbonisation bands by 2050, as shown below:
· 20-40% CO2 reduction pathway relative to the base year· 40-60% CO2 reduction pathway relative to the base year· 60-80% CO2 reduction pathway relative to the base year
Two further pathways - with specific definitions - were also created, assessing (i) what would happen if noaction was taken to accelerate decarbonisation (business as usual, BAU) or (ii) the maximum possibletechnical potential for decarbonisation in the sector (Max Tech)9.
The BAU pathway consisted of the continued deployment of technologies that are presently being deployedacross the sector as each plant or site reaches the appropriate point to implement the technology.
Pathways were developed in an iterative manual process and not through a mathematical optimisationprocess. This was done to facilitate the exploration of uncertain relationships that would be difficult toexpress analytically. This process started with data collected in the evidence gathering phase regarding thedifferent decarbonisation options, current production levels and the current use of energy or CO2 emissionsof the sector. This data was then enriched through discussion with the sector team and in the first workshop.Logic reasoning (largely driven by option interaction), sector knowledge and technical expertise were applied
8 Model anticipates deployment from 2014 (assuming 2012 and 2013 are too early).9 Definitions are provided in the glossary.
INDUSTRIAL DECARBONISATION AND ENERGY EFFICIENCY ROADMAPS TO 2050 – CERAMICS
Section 2 - Introduction, Including Methodology Page 16 of 90
when selecting technical options for the different pathways. These pathways were discussed by the sectorteam, modelled, and finally tested by the stakeholders participating in the second workshop. This feedbackwas then taken into account and final pathways were developed. All quantitative data and references aredetailed in the options register and relevant worksheets of the model. The pathway model, which is availablethrough DECC and BIS, is summarised in appendix A.
Scenario Testing
The different pathways developed have been tested under different scenarios (i.e. there are three differentscenarios for each pathway). A scenario is a specific set of conditions that could directly or indirectly affectthe ability of the sector to decarbonise. Examples of these are: future decarbonisation of the grid, futuregrowth of the sector, future energy costs, and future cost of carbon. Since we do not know what the futurewill look like, using scenarios is a way to test the robustness of the different pathways.
For each pathway, the following three scenarios were tested (a detailed description of these scenarios isprovided in appendix A):
· Current trends: This would represent a future world very similar to our world today with lowcontinuous growth of the industry in the UK.
· Challenging world: This would represent a future world with a more challenging economic climateand where decarbonisation is not a priority and the industry is declining in the UK.
· Collaborative growth: This would represent a future world with a positive economic climate andwhere there is collaboration across the globe to decarbonise and where the industry has a highergrowth rate in the UK.
In order to produce pathways for the same decarbonisation bands under the different scenarios, thedeployment rate of the options varied according to the principals set out in the scenarios. For example, inorder to achieve a specific decarbonisation band in 2050 in the collaborative growth scenario, options weretypically deployed at a faster rate and to a higher degree as compared to the current trends scenario(provided this was considered to be consistent with the conditions set out in the scenarios).
Key Assumptions and Limitations
The pathway model was developed and used to estimate the impact on emissions and costs of alternativetechnology mixes and macro-economic scenarios. Modelled estimates of decarbonisation over the period(2013 to 2050) are presented as percentage reductions in emissions meaning the percentage differencebetween emissions in 2050 and emissions in the base year (2012). CO2 emissions reductions and costs arereported compared to a future in which there was no further take up of decarbonisation options (referred toas the reference trend).
The model inputs and option deployments are based on literature review, interviews and stakeholder input atworkshops and sector meetings. Parsons Brinckerhoff and DNV GL sector leads used these sources toinform judgements for these key parameters. Key input values (e.g. decarbonisation factors for options) areadapted from literature or directly from stakeholder views. If data values were still missing then values wereestimated based on consultant team judgements. Decarbonisation inputs and pathways were reviewed andchallenged at workshops. The uncertainties in this process are large given this level of judgement, however,uncertainties are not quantified. A range of sensitivity analysis was carried out including the development ofalternative versions of the Max Tech pathway and also testing of different availabilities of biomass.
INDUSTRIAL DECARBONISATION AND ENERGY EFFICIENCY ROADMAPS TO 2050 – CERAMICS
Section 2 - Introduction, Including Methodology Page 17 of 90
Deployment of options at five-year intervals is generally restricted to 25% steps unless otherwise indicated.For example, an option cannot be incrementally deployed by 25% over ten years, but has to deploy over fiveyears and flat-line over the other five years.
In this report, when we report CO2 – this represents CO2 equivalent. However, other green house gases(GHGs) were not the focus of the study which centred on both decarbonisation and improving energyefficiency in processes, combustion and indirect emissions from electricity used on site but generated off site.Also, technical options assessed in this work result primarily in CO2 emissions reduction and improvedenergy efficiency. In general, emissions of other GHGs, relative to those of CO2, are very low.
Assumptions in relation to the Max Tech pathway
Max Tech pathway: A combination of carbon abatement options and energy savings that is both highlyambitious but also reasonably foreseeable. It is designed to investigate what might be technically possiblewhen other barriers are set to one side. Options selected in Max Tech take into account barriers todeployment but are not excluded based on these grounds. Where there is a choice between one option oranother, the easier or cheaper option is chosen or two alternative Max Tech pathways are developed.
The following assumptions apply:
1. Technology Readiness Level (TRL): process or technology at least demonstrated at a pilot scaletoday, even if that is in a different sector.
2. Other disruptive technology options that could make a significant difference but that are not matureenough for inclusion in the pathways are covered in the commentary.
3. Cost is not a constraint: it has been assumed that there are strong and growing financial incentivesto decarbonise which mean that the cost of doing so is not generally a barrier.
4. Option deployment rate: the sector team followed the roadmap method process to develop and testoption deployments in all pathways, including Max Tech. Hence, in each sector, rates at which theoptions can be deployed were considered as ‘highly ambitious but also reasonably foreseeable’.
5. Biomass: maximum penetration of biogenic material as fuel or feedstock assuming unlimitedavailability. Carbon intensity and sensitivities are included in each sector.
6. Carbon Capture (CC): All sectors have made individual (sector) assessments of the maximumpossible potential by 2050 based on what is ‘highly ambitious but also reasonably foreseeable’. Thisassessment included the most suitable CO2 capture technology or technologies for application in thesector, the existing location of the sites relative to each other and anticipated future CC infrastructure,the space constraints on sites, the potential viability of relocation, the scale of the potential CO2
captured and potential viability of both CO2 utilisation and CO2 storage of the captured CO2.7. Electricity Grid: three decarbonisation grid trends were applied through the scenario analysis.
Option Interaction Calculation
The pathway model incorporated two methods for evaluating potential interaction of options. The first methodreflected the assumption that all options interacted maximally, and the second method reflected theassumption that the options did not interact. Neither of these cases was likely to be representative of reality;however the actual pathway trend would lie between the two. The two methods therefore provided atheoretical bound on the uncertainty of this type of interaction in results that was introduced by the choice ofa top down modelling approach. Figures calculated based on the assumption of maximum interaction arepresented exclusively in the report unless otherwise stated.
INDUSTRIAL DECARBONISATION AND ENERGY EFFICIENCY ROADMAPS TO 2050 – CERAMICS
Section 2 - Introduction, Including Methodology Page 18 of 90
Cumulative Emissions
An important aspect of an emission pathway is the total emission resulting from it. The pathways presentedin this report are not designed or compared on the basis of cumulative emissions over the course to 2050.Only end-targets are assessed e.g., it is possible for a pathway of lower 2050 emission to have largercumulative emissions, and thus a greater impact on the global climate system. The exception to this is in thecost analysis section where total CO2 abated under each pathway – as calculated by the model – is quoted.
Scope of Emissions Considered
Only emissions from production or manufacturing sites were included in scope (from combustion of fuels,process emissions and indirect emissions from imported electricity). Consumed and embedded emissionswere outside the scope of this project.
Complexity of the Model
The model provided a simplified top down representation of the sector to which decarbonisation options wereapplied. It does not include any optimisation algorithm to automatically identify a least cost or optimalpathway.
Material Efficiency
Demand reduction through material efficiency was outside the scope of the quantitative analysis. It isincluded in the conclusions as material efficiency opportunities are considered to be significant in terms ofthe long-term reduction of industrial emissions: see for example Allwood et al. (2012) and the ongoing workof the UK INDEMAND Centre.
Base Year (2012)
The Climate Change Act established a legally binding target to reduce the UK’s GHG emissions by at least80% below base year (1990) levels by 2050. DECC’s 2011 Carbon Plan set out how the UK will achievedecarbonisation within the framework of the carbon budgets and policy objectives: to make the transition to alow-carbon economy while maintaining energy security and minimising costs to consumers. The Carbon Planproposed that decarbonising the UK economy “could require a reduction in overall industry emissions of upto 70% by 2050” (against 2009 emissions).
In this project for the analytical work, we have set 2012 as the base. This is the most recent dataset availableto the project, and was considered to be a suitable date to assess how sectors (as they currently are) canreduce emissions to 2050. This separates the illustrative pathways exercise from national targets, which arebased on 1990 emissions.
2.2.3 Conclusions and Next Steps
The conclusions and potential next steps are drawn from the outcomes of the pathways modelling, thescenario testing and the potential actions to overcome barriers and enhance enablers that were identifiedtogether with stakeholders. The strategic conclusions can include high-level and/or longer term issues, ormore specific, discrete example actions which can lead to tangible benefits. The potential next steps arepresented in the context of eight strategic conclusions (or themes) and six or seven technology groups. Thestrategic conclusions or themes are:
· Strategy, leadership and organisation· Business case barriers· Future energy costs, energy supply security, market structure and competition
INDUSTRIAL DECARBONISATION AND ENERGY EFFICIENCY ROADMAPS TO 2050 – CERAMICS
Section 2 - Introduction, Including Methodology Page 19 of 90
· Industrial energy policy context· Life-cycle accounting· Value chain collaboration· RD&D· People and skills
The main technology groups as presented in section 5 are:
· Electricity grid decarbonisation· Electrification of heat· Fuel and feedstock availability (including biomass)· Energy efficiency and heat recovery· Clustering· CC· Sector-specific technologies
INDUSTRIAL DECARBONISATION AND ENERGY EFFICIENCY ROADMAPS TO 2050 – CERAMICS
Section 3 - Findings Page 20 of 90
3. FINDINGS
3.1 Key Points
Emissions in 2012 from ceramic production totalled 1.2 million tonnes of CO2 (including fuel emissions,indirect emissions and estimated process emissions) and this was associated with the production of 4.2million tonnes of ceramic products (BCC figures from CCA data, 2012). Whilst these emissions representalmost a third of production, on a per tonne basis, they are a small proportion of the overall UK emissions.Direct emissions originate from fuel combustion for firing kilns and dryers, and process emissions. Whileindirect emissions arise from electricity imported from the grid for process machinery and in a limited numberof cases for heating electric kilns and furnaces. Process emissions result from inherent chemical changes inthe raw materials (decomposition of carbonates and oxidation of organic content) as they are converted toceramic products.
Before carbon-related legislation was introduced, the ceramic sector was already evolving towards a morecarbon-neutral energy strategy. As energy can represent up to 35% of overall production costs (BCC, 2014),ceramic manufacturers have been driven to maximise the efficiency of their operations over several decades.Competing in fiercely competitive global markets provides further impetus. Literature review, survey findings,interviews and workshops feedback showed that energy efficiency is perceived as essential, butdecarbonisation is generally a lower priority in the current investment climate for a variety of reasons,including10:
· Large equipment suppliers have little of their manufacturing or RD&D based in the UK· Limited RD&D for the ceramic sector in the UK· Companies are more willing to invest in financially viable technologies that have already been
proven to be successful, to reduce commercial risks· UK producers with headquarters overseas are in competition for funding with their peers abroad, and
corporate investment may be targeted on locations with higher returns associated with lower energyand wage costs
· Large upfront costs and long life cycles of kilns (30-60 years) are disincentives to invest given theuncertain market conditions and UK regulatory environment, internationally disadvantageous energyand carbon prices and perceived long-term lack of support for UK manufacturing industry
The evidence gathering identified the main enablers for decarbonisation for the ceramic sector to be:
· Projects providing multiple benefits (energy, carbon and labour cost reduction, improved productionyield, increased capacity to satisfy a growing market, etc.) are more likely to be invested in
· Compliance with legal obligations (e.g. environmental licence)· A strong, evidence-based business case for energy and decarbonisation measures that capture all
benefits and cost· Stable and internationally competitive business and regulatory environment that encourages capital
investment in innovation· Willingness of top management to make carbon emission reduction a priority· The need to replace obsolete equipment, expand production or reduce operational manpower
The evidence gathering found that the main barriers that hamper decarbonisation are:
10 Based on interviews and surveys

INDUSTRIAL DECARBONISATION AND ENERGY EFFICIENCY ROADMAPS TO 2050 – CERAMICS
Section 3 - Findings Page 21 of 90
· Long investment cycles (given equipment life of up to 40 years) and high capital costs of newtechnologies
· Risks that an innovation would diminish product quality or cause production disruption· Increasing concern about the security of energy supply where an interruption can cause major
damage taking months to repair coupled with increasingly volatile electricity and gas prices· Threat of rising energy prices, the cost of carbon and UK-only climate related charges· Requirement for very high rates of return or short payback time on all projects including energy
efficiency· Regulatory uncertainty affects the assessment of high cost, long-term investment· Shortage of proven, financially viable and demonstrated energy-efficiency technologies· Lack of government support (e.g. financial) for sector RD&D and future implementation of emerging
and breakthrough technologies· Lack of reliable information about technical feasibility, costs and benefits of new technologies· Limited access to affordable capital and adequate grants
Future production for the UK ceramic sector is projected to grow somewhat, but with differing levels acrossthe four subsectors. The heavy clay subsector could grow in response to recovery in the construction sector(however there is concern that this demand could instead be met with increasing levels of imports);whitewares is expected to have static output or grow more slowly; refractories anticipate growth with itsmarkets in Europe and overseas, while technical ceramics expect continued stronger growth, although bothof these latter subsectors have vulnerable electro-intensive production. These estimates are reflected in thecurrent trends scenario with lower and higher rates of growth in the collaborative growth and challengingworld scenarios.
The energy-saving options for the ceramic sector distilled from the literature review, interviews, surveys andworkshops can be classified into four categories: heat recovery improvements, process improvements, fuelswitching and CC options. The options were further grouped into incremental application of state-of-the-arttechnologies, major investment technologies (which involve significant change) and disruptive technologies(which result in major changes to production technology).
3.2 Ceramic Processes
The final product determines the detailed steps of manufacture, but all ceramic manufacturing processeshave a common element: the ceramic material is fired to a temperature to instigate chemical and physicalchanges that develop the final properties of the product, including bonding to form a rigid matrix. Firingrequires raw materials (e.g. clay, sand, other natural or synthesised materials), to be prepared and formedaccording to various subsector processes before being heated in a kiln to temperatures between 900°C and2750°C. The fired product is then cooled and taken out of the kiln and possibly further processed withadditional coating and firing steps or machining to produce the end product item. During these manufacturingprocesses, direct CO2 emissions arise from the combustion of fossil fuels in the kilns, the chemicaldecomposition of carbonate minerals and the combustion of organic material in the raw materials.
Figure 4 outlines the brick-making process, but the generic stages are similar for all large-scale ceramicmanufacturing processes.
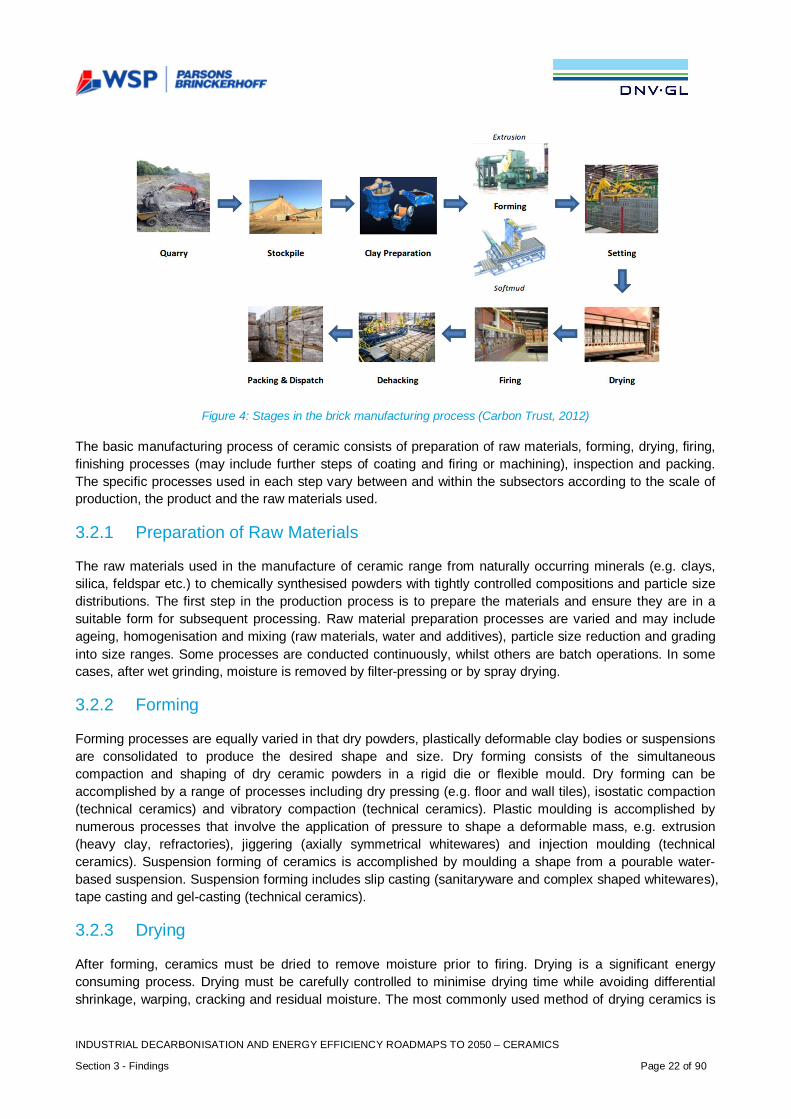
INDUSTRIAL DECARBONISATION AND ENERGY EFFICIENCY ROADMAPS TO 2050 – CERAMICS
Section 3 - Findings Page 22 of 90
Figure 4: Stages in the brick manufacturing process (Carbon Trust, 2012)
The basic manufacturing process of ceramic consists of preparation of raw materials, forming, drying, firing,finishing processes (may include further steps of coating and firing or machining), inspection and packing.The specific processes used in each step vary between and within the subsectors according to the scale ofproduction, the product and the raw materials used.
3.2.1 Preparation of Raw Materials
The raw materials used in the manufacture of ceramic range from naturally occurring minerals (e.g. clays,silica, feldspar etc.) to chemically synthesised powders with tightly controlled compositions and particle sizedistributions. The first step in the production process is to prepare the materials and ensure they are in asuitable form for subsequent processing. Raw material preparation processes are varied and may includeageing, homogenisation and mixing (raw materials, water and additives), particle size reduction and gradinginto size ranges. Some processes are conducted continuously, whilst others are batch operations. In somecases, after wet grinding, moisture is removed by filter-pressing or by spray drying.
3.2.2 Forming
Forming processes are equally varied in that dry powders, plastically deformable clay bodies or suspensionsare consolidated to produce the desired shape and size. Dry forming consists of the simultaneouscompaction and shaping of dry ceramic powders in a rigid die or flexible mould. Dry forming can beaccomplished by a range of processes including dry pressing (e.g. floor and wall tiles), isostatic compaction(technical ceramics) and vibratory compaction (technical ceramics). Plastic moulding is accomplished bynumerous processes that involve the application of pressure to shape a deformable mass, e.g. extrusion(heavy clay, refractories), jiggering (axially symmetrical whitewares) and injection moulding (technicalceramics). Suspension forming of ceramics is accomplished by moulding a shape from a pourable water-based suspension. Suspension forming includes slip casting (sanitaryware and complex shaped whitewares),tape casting and gel-casting (technical ceramics).
3.2.3 Drying
After forming, ceramics must be dried to remove moisture prior to firing. Drying is a significant energyconsuming process. Drying must be carefully controlled to minimise drying time while avoiding differentialshrinkage, warping, cracking and residual moisture. The most commonly used method of drying ceramics is
INDUSTRIAL DECARBONISATION AND ENERGY EFFICIENCY ROADMAPS TO 2050 – CERAMICS
Section 3 - Findings Page 23 of 90
by convection, in which heated air is circulated around the ceramics, in some cases using heat recoveredfrom the cooling zone of the kiln. Dryers may be continuous, where product travels through a varying heatdistribution along the length of the chamber, or intermittent (batch), where the product is stationary while theinternal temperature within the dryer follows a time-varying profile. An alternative to convection drying isradiation drying in which microwave or infrared radiation is used to promote faster and more uniform dryingof the products.
3.2.4 Firing
Firing is the process by which raw materials are thermally transformed from a friable blank into a robust, rigidproduct. This process may also be referred to as sintering or densification. Firing is the dominant energy-and emissions-intensive step. Conventional firing is accomplished by heating the dried ceramic toapproximately two-thirds of the melting point of the material and holding at this temperature for a sufficienttime for chemical and physical changes to develop the final properties of the product. There are two classesof kiln in which this heating process is done; continuous or batch kilns.
Continuous kilns are well suited to high volume production of similar items requiring the same heating andcooling profiles. The cross-section of such kilns can be as small as a fraction of a metre square (e.g. rollerhearth kilns for floor and wall tiles) up to 10m wide by 5m high (a tunnel kiln for brick or roof tiles) with alength varying from 60 to 200 metres. In either case the product travels down the length of the kiln at lowspeed passing through zones of increasing temperature to the peak temperature, which may be maintainedfor some distance to allow the reactions to be completed, followed by a controlled profile of cooling untilwarm product items are delivered at the kiln exit. Heating in continuous kilns is generally provided by thestaged combustion of fuel and the recirculation of hot gases though the kiln, while cooling is provided bycontrolled suction of air through the kiln. Product items may be stacked on insulated kiln cars that carry themthrough the kiln or may be moved along the floor of the kiln on a so-called roller hearth. The duration of thejourney of the product through a continuous kiln ranges from 30 minutes to several days according to size,thickness and type of product.
As their name suggests, batch kilns process loads of ware through the firing cycle in an insulated enclosurewith doors to permit unfired product items to be loaded and fired items unloaded. Such kilns may again varyin size from small, laboratory, table-top kilns to large room sized production kilns. The operating cycle ofbatch fired kilns can be as short as a few hours to in excess of a week according to size and thickness of theproduct. Batch kilns may be heated by fuel combustion or by electric resistance, electric arc or electricinduction heating. The kiln temperature is controlled to a prescribed schedule which determines heat inputand the operation of dampers and hatches that introduce ambient cooling air. Batch kilns offer broadflexibility in the heating and cooling profiles that can be achieved and thus are well suited for widely varyingproduct sizes and firing conditions.
3.2.5 Finishing Processes
Following firing, some ceramic products are processed further to enhance their characteristics or to meetdimensional tolerances. Ceramics can be machined by abrasive grinding, chemical polishing, electricaldischarge machining, or laser machining. Surface coatings are applied to many fired ceramics to createimpermeable surfaces (glazed products) and for aesthetic appeal. Coatings also may be applied to improvestrength and resistance to abrasion and corrosion. The application process may be by hand for specific highquality tableware and giftware, but more commonly automated techniques are used, including curtain coating,robotic spraying, contact printing and non-contact printing. Coatings may be applied onto the unfired product(where the coating and ceramic are fired simultaneously) or onto fired ceramics, necessitating an additionalfiring step. After the final finishing step products are inspected and packaged, either manually or byautomated techniques.
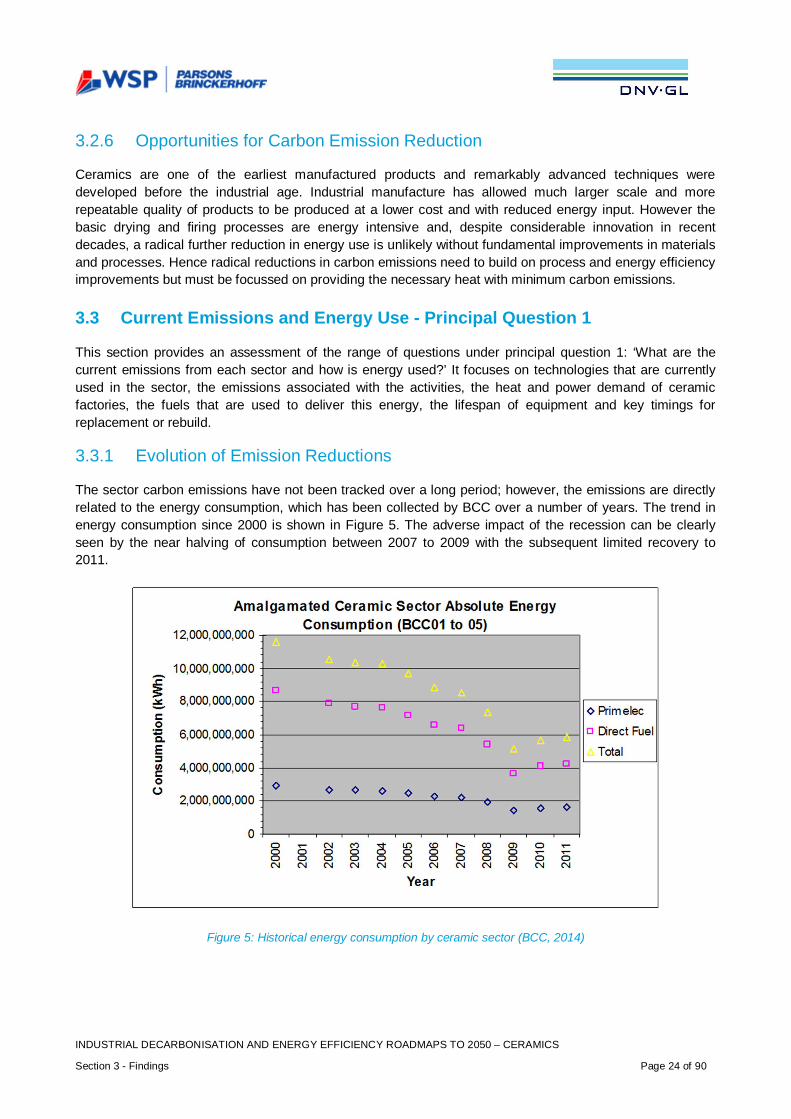
INDUSTRIAL DECARBONISATION AND ENERGY EFFICIENCY ROADMAPS TO 2050 – CERAMICS
Section 3 - Findings Page 24 of 90
3.2.6 Opportunities for Carbon Emission Reduction
Ceramics are one of the earliest manufactured products and remarkably advanced techniques weredeveloped before the industrial age. Industrial manufacture has allowed much larger scale and morerepeatable quality of products to be produced at a lower cost and with reduced energy input. However thebasic drying and firing processes are energy intensive and, despite considerable innovation in recentdecades, a radical further reduction in energy use is unlikely without fundamental improvements in materialsand processes. Hence radical reductions in carbon emissions need to build on process and energy efficiencyimprovements but must be focussed on providing the necessary heat with minimum carbon emissions.
3.3 Current Emissions and Energy Use - Principal Question 1
This section provides an assessment of the range of questions under principal question 1: ‘What are thecurrent emissions from each sector and how is energy used?’ It focuses on technologies that are currentlyused in the sector, the emissions associated with the activities, the heat and power demand of ceramicfactories, the fuels that are used to deliver this energy, the lifespan of equipment and key timings forreplacement or rebuild.
3.3.1 Evolution of Emission Reductions
The sector carbon emissions have not been tracked over a long period; however, the emissions are directlyrelated to the energy consumption, which has been collected by BCC over a number of years. The trend inenergy consumption since 2000 is shown in Figure 5. The adverse impact of the recession can be clearlyseen by the near halving of consumption between 2007 to 2009 with the subsequent limited recovery to2011.
Figure 5: Historical energy consumption by ceramic sector (BCC, 2014)

INDUSTRIAL DECARBONISATION AND ENERGY EFFICIENCY ROADMAPS TO 2050 – CERAMICS
Section 3 - Findings Page 25 of 90
Emissions
In 2012 the UK ceramic sector produced an estimated 4.2 million tonnes of ceramic products, with0.94 million tonnes of direct CO2 released by fossil fuel combustion and process emissions and an additional0.28 million tonnes of CO2 released in the production of electricity consumed by the sector (BCC, 2014).
The ceramic sector is diverse with very different scales of emissions and energy consumption across the foursubsectors identified in section 2.1.1; the breakdown of emissions by subsector and source is summarised inFigure 6 below.
Figure 6: Direct, indirect and estimated process CO2 emissions 2012, Mt/a, (BCC 2012 CCA data, 2014)
The production of the four subsectors in 2012 is shown in Figure 7 below:
Figure 7: Subsector annual production 2012, tonnes, (BCC CCA data, 2014)
The subsectors differ in scale of production facility and average daily production per kiln, ranging from anaverage of around 200 te/day per kiln for the heavy clay sector, to an average of around 3 tonnes/day perkiln in the whitewares and refractories subsectors, to less than 0.5 tonnes/day per kiln in the technical sector.
The contribution to the sector’s carbon emissions by the subsectors is shown in Figure 8. The heavy claysubsector dominates the emissions, but with its simpler processes, higher adoption of more-efficientcontinuous kilns and larger scale of production has lower emissions per tonne of product than the sector as awhole. Whitewares has substantial emissions due to the multiple firing steps, greater use of less-efficientbatch firing and higher air to ware densities in the kiln, while refractories have an intermediate level ofemissions per tonne due their simpler, but generally higher temperature, production of bulk products. Thetechnical ceramic subsector has disproportionately large emissions due to the small scale of productioncoupled with the higher firing temperatures employed.
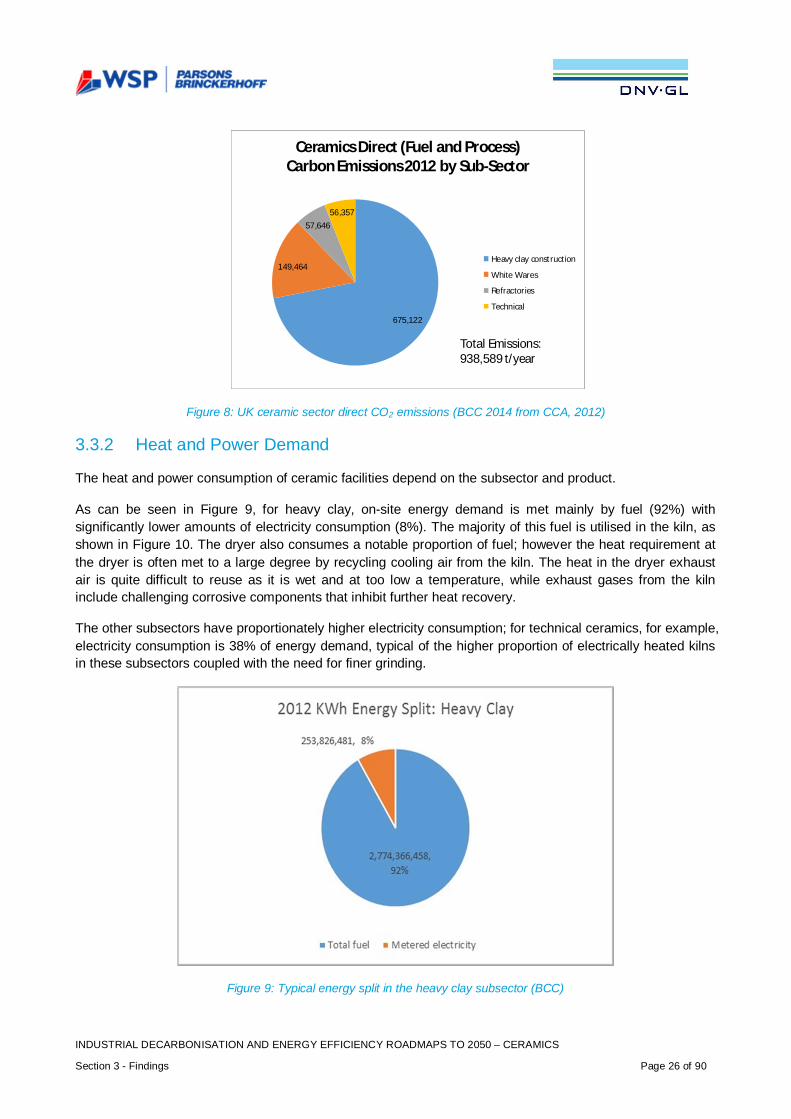
INDUSTRIAL DECARBONISATION AND ENERGY EFFICIENCY ROADMAPS TO 2050 – CERAMICS
Section 3 - Findings Page 26 of 90
Figure 8: UK ceramic sector direct CO2 emissions (BCC 2014 from CCA, 2012)
3.3.2 Heat and Power Demand
The heat and power consumption of ceramic facilities depend on the subsector and product.
As can be seen in Figure 9, for heavy clay, on-site energy demand is met mainly by fuel (92%) withsignificantly lower amounts of electricity consumption (8%). The majority of this fuel is utilised in the kiln, asshown in Figure 10. The dryer also consumes a notable proportion of fuel; however the heat requirement atthe dryer is often met to a large degree by recycling cooling air from the kiln. The heat in the dryer exhaustair is quite difficult to reuse as it is wet and at too low a temperature, while exhaust gases from the kilninclude challenging corrosive components that inhibit further heat recovery.
The other subsectors have proportionately higher electricity consumption; for technical ceramics, for example,electricity consumption is 38% of energy demand, typical of the higher proportion of electrically heated kilnsin these subsectors coupled with the need for finer grinding.
Figure 9: Typical energy split in the heavy clay subsector (BCC)
675,122
149,464
57,64656,357
Ceramics Direct (Fuel and Process)Carbon Emissions 2012 by Sub-Sector
Heavy clay construction
White Wares
Refractories
Technical
Total Emissions:938,589 t/year

INDUSTRIAL DECARBONISATION AND ENERGY EFFICIENCY ROADMAPS TO 2050 – CERAMICS
Section 3 - Findings Page 27 of 90
Figure 10: Typical energy breakdown of a brickworks showing heat recovery from the kiln to the dryer (Carbon Trust2011)
It can be seen from this example that the primary focus for energy efficiency and carbon emission reductionin the ceramic sector will be the firing and drying steps.
Heat and power demand may change in the future due to trends in market behaviour, technologicaldevelopments and regulation. Historically, there has already been a shift from coal to gas use and furtherchange can be foreseen towards the increased use of electricity (for firing, increased automation andincreased abatement of industrial emissions) and the possible substitution of biomass derived gas for naturalgas (under the appropriate commercial and regulatory conditions). One of the options presented in theoptions register (see appendix C for more information) is the development and application of 100%electrically heated brick kiln, which would result in increasing decarbonisation as the electricity grid reducesits carbon intensity.
3.3.3 Fuels Used
The 2012 distribution of energy inputs for the UK ceramic sector is shown in Figure 11
Figure 11: Distribution of fuel types in the ceramic sector
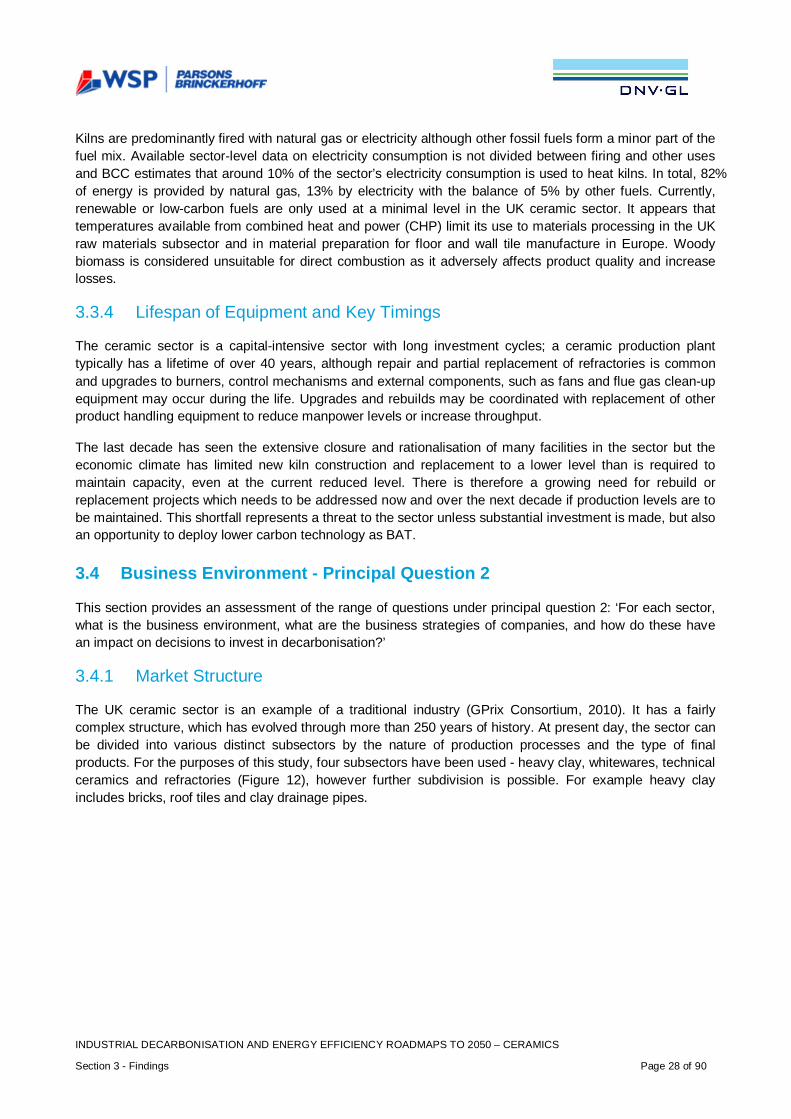
INDUSTRIAL DECARBONISATION AND ENERGY EFFICIENCY ROADMAPS TO 2050 – CERAMICS
Section 3 - Findings Page 28 of 90
Kilns are predominantly fired with natural gas or electricity although other fossil fuels form a minor part of thefuel mix. Available sector-level data on electricity consumption is not divided between firing and other usesand BCC estimates that around 10% of the sector’s electricity consumption is used to heat kilns. In total, 82%of energy is provided by natural gas, 13% by electricity with the balance of 5% by other fuels. Currently,renewable or low-carbon fuels are only used at a minimal level in the UK ceramic sector. It appears thattemperatures available from combined heat and power (CHP) limit its use to materials processing in the UKraw materials subsector and in material preparation for floor and wall tile manufacture in Europe. Woodybiomass is considered unsuitable for direct combustion as it adversely affects product quality and increaselosses.
3.3.4 Lifespan of Equipment and Key Timings
The ceramic sector is a capital-intensive sector with long investment cycles; a ceramic production planttypically has a lifetime of over 40 years, although repair and partial replacement of refractories is commonand upgrades to burners, control mechanisms and external components, such as fans and flue gas clean-upequipment may occur during the life. Upgrades and rebuilds may be coordinated with replacement of otherproduct handling equipment to reduce manpower levels or increase throughput.
The last decade has seen the extensive closure and rationalisation of many facilities in the sector but theeconomic climate has limited new kiln construction and replacement to a lower level than is required tomaintain capacity, even at the current reduced level. There is therefore a growing need for rebuild orreplacement projects which needs to be addressed now and over the next decade if production levels are tobe maintained. This shortfall represents a threat to the sector unless substantial investment is made, but alsoan opportunity to deploy lower carbon technology as BAT.
3.4 Business Environment - Principal Question 2
This section provides an assessment of the range of questions under principal question 2: ‘For each sector,what is the business environment, what are the business strategies of companies, and how do these havean impact on decisions to invest in decarbonisation?’
3.4.1 Market Structure
The UK ceramic sector is an example of a traditional industry (GPrix Consortium, 2010). It has a fairlycomplex structure, which has evolved through more than 250 years of history. At present day, the sector canbe divided into various distinct subsectors by the nature of production processes and the type of finalproducts. For the purposes of this study, four subsectors have been used - heavy clay, whitewares, technicalceramics and refractories (Figure 12), however further subdivision is possible. For example heavy clayincludes bricks, roof tiles and clay drainage pipes.

INDUSTRIAL DECARBONISATION AND ENERGY EFFICIENCY ROADMAPS TO 2050 – CERAMICS
Section 3 - Findings Page 29 of 90
Figure 12: Shares of production in the four ceramic subsectors used in this study
Between 2000 and 2010 the sector has seen more than 40% decline across all subsectors, as illustrated inFigure 13. Total revenues in 2010 were £953 million compared to £1,953 million in 2000. Since 2013, thesector has been slowly recovering. However, sales figures are still lower than in 2007. The only exception istechnical ceramics, where revenues have grown more than 30% compared to 2000. Analysis is based ondata from BCC members.
Figure 13: Total revenues in £ millions for selected years per subsector (BCC, 2014)
BCC data and all interviewed managers from the industry suggest that the main drivers of the decline havebeen recession in demand and downward pressure on prices from imports. The UK recovery started in 2013,especially for those making products used in house building. Heavy clay production increased and some

INDUSTRIAL DECARBONISATION AND ENERGY EFFICIENCY ROADMAPS TO 2050 – CERAMICS
Section 3 - Findings Page 30 of 90
plants were un-mothballed. However, imports have risen dramatically and there is still no sign of majorcapital investment in new assets. However, recovery in other subsectors has been more subdued.
Consolidation has been rapid in the past decade. According to BCC, whose membership includes themajority of ceramic manufacturers in the UK, there are around 100 companies, which in turn operate at 150sites and represent 90% of the sector turnover. The consolidation of the sector can be seen in the heavy claysector where the number of brick production sites has fallen from 180 to 63 in the last 30 years, according toone of the interviewees – a manager with technical and environmental responsibilities for a largemanufacturers.
The UK ceramic sector is considered energy and heat-intensive. According to representatives from theindustry the typical cost of energy is 30% of turnover, and can be as high as 40% for heavy clay and around15% for whitewares. The sector is also labour intensive, with labour comprising 25-30% of turnover. Such acost structure makes it very challenging for new market entrants in the UK as well as impedingcompetitiveness on the global market.
Such energy intensity of the sector makes it vulnerable. Extreme concern was expressed by BCC thatcurrent electro-intensive refractory and technical ceramic production is uncompetitive due to high electricitycosts and is at risk of being lost to the UK.
The UK ceramic sector has strong tradition and high international reputation (GPrix Consortium, 2010). Thesector is an active exporter, particularly industrial ceramics, refractories, tableware and giftware. The sectorexports internationally, with the EU as the main market, followed by North America and Asia (Oceania).However, according to BCC data, the level of exports for refractories and tableware or giftware is still wellbelow their pre-recession levels. Competition in the sector is high, with small margins, with UKmanufacturers competing with Europe and internationally. Currency variations impact imports and exports,as companies seek to increase market share in regions that offer the highest profitability. All sectors areheavily trade exposed. Apart from the very small clay drainage pipe sector, the ceramic sector now shows anegative balance of trade.
The sector is also mature and capital intensive (IBIS, 2014). The level of competition is high in general withslight variations depending on the end product. Overall, the shrinking profit margins have resulted in a lowerlevel of capital investment in new technologies.
3.4.2 Business Strategies
Interviewees and workshop participants from the industry reinforce the view that business and policyenvironment in the UK ceramic sector is volatile at the moment. This is especially supported by 21 of thesurvey11 respondents agreeing that a more stable and internationally competitive regulatory and businessenvironment will drive the sector’s growth and investment in decarbonisation. Yet, various factors affectbusiness strategies and behaviour.
Many managers from the sector expressed the view that current regulatory context could be detrimental todecarbonisation in the long term as investors look for stable and internationally competitive energy andcarbon prices and an indication of the direction the government would like to take the energy market. Despitethis concern over regulatory uncertainty, 25 of survey respondents and the majority of the 6 intervieweesperceive compliance with environmental regulations and meeting CCA and EU ETS commitments as themain drivers of decarbonisation in the sector.
11 The survey received responses from 31 managers in the UK ceramic sector.

INDUSTRIAL DECARBONISATION AND ENERGY EFFICIENCY ROADMAPS TO 2050 – CERAMICS
Section 3 - Findings Page 31 of 90
The increase of energy prices is perceived as the biggest threat to the sector according to 30 of surveyrespondents – a view shared by the managers from the industry at the workshops. This can be explained toa large extent by the fact that up to a third of operational cost of ceramic manufacturers comprises energy.So there is a clear economic incentive to optimise and reduce energy consumption in order to maintaincompetitiveness and profitability. On the other hand if margins continue to shrink, this will significantly limitthe ability of companies to invest in current or innovative technology required for decarbonisation.Decarbonisation is currently perceived to have less tangible benefits in the ceramic sector, especially as notthe whole sector is encompassed within EU ETS and there is limited market demand for low carbon products.In fact, a recent independent study commissioned by a heavy clay manufacturer discovered that althoughapproaching 40% of architects considered sustainability as important, fewer than 20% of building merchantsand developers in the UK perceive it as added value to heavy clay products. Price is the main driver ofdemand and change in the preferences of customers can play an important role in the decarbonisation of theUK ceramic sector.
The poor market condition of the sector in recent years has fostered an even more risk-averse attitude toinnovation. To support that, 25 of survey respondents would not implement any technology that risksdiminishing the end-product quality or aesthetics, as these are perceived to drives sales. Additionally, onlythree of survey respondents perceive themselves as innovators when it comes to implementing newtechnologies for decarbonisation and energy reduction. The majority of the respondents prefer to see thetechnology proven before considering implementation as the high risks limits its appeal.
On the other hand, CCA targets (which for the sector are framed around energy efficiency improvements)have had a strong influence on how companies perceive energy efficiency and to a lesser degreedecarbonisation. Mostly driven by compliance and reputational risk mitigation, some of the interviewedmanagers from the sector shared that they have incurred additional cost in order to improve efficiencies andmeet their energy reduction targets. This is a clear indication that long-term energy and carbon regulationcan have significant influence on the strategies of ceramic manufacturers in the UK.
Decarbonisation Strategies
The ceramic sector collectively is committed to contributing responsibly to a competitive low-carbon andresource-efficient economy. To sustain such a commitment, the European Ceramic Industry Association(Cerame-Unie) has developed a 2050 ceramic industry roadmap ‘Paving the Way to 2050’, which exploreswhat level of decarbonisation might be possible, which technologies can enable the achievement of such alevel of reduction and what regulatory support is necessary to achieve this by governments working inpartnership with industry. However, at an individual company level there appears to be a differentperspective on decarbonisation.
The survey results on business decision making related to decarbonisation showed that the majority (morethan 21) of the companies that responded have carbon or energy reduction targets or goals, generally aspart of the sector CCA. This observation has been confirmed by the interviewees as well. However, only halfof the companies who responded to the survey claimed to have a robust decision making processes in placefor new initiatives in relation to energy and decarbonisation. This is to suggest that while targets are in place,only half of the companies also use carbon and energy related criteria in their investment decision making.
What is also interesting to note is the impact of the decarbonisation strategies of the ceramic companies ontheir innovation, R&D agenda. When survey respondents were asked what their position was in regards tocarbon and energy reduction, from ‘first mover’ to ‘laggard’, only three of the respondents consideredthemselves as first movers and already implementing new decarbonisation technologies. The majority of therespondents appear to be risk averse and prefer to see new technologies demonstrated and proven by theircompetitors or in other industries before they consider implementing them. There is very limited appetite forinvesting in unproven technology. Full breakdown of responses is shown on Figure 14.

INDUSTRIAL DECARBONISATION AND ENERGY EFFICIENCY ROADMAPS TO 2050 – CERAMICS
Section 3 - Findings Page 32 of 90
Figure 14: Attitudes to innovation
Although the EU ceramic sector has developed a 2050 roadmap which sets out a clear vision of whatreduction might be possible, the UK ceramic sector has not yet set itself an overall quantitative reductiontarget for 2050. Although there are some platforms available to ceramic manufacturers for discussing theirviews on decarbonisation, there were limited examples of collaboration on any demonstration or pilotprojects due to commercial confidentiality concerns. Two interviewed managers indicated that they had beeninvolved in researching renewable energy generation on site but lack of sufficient financing, longer paybacktime than their investment threshold and planning approval difficulties deemed these initiatives unfeasible.Some examples were shared, at the workshops and during interviews, of collaboration between suppliers ofequipment or raw materials and ceramic manufactures or customers and ceramic manufactures. Examplesalso exist of collaboration between non-competing ceramic manufactures, e.g. those operating in differentsubsectors. However, if the sector wants to move forward on the existing roadmap and progress disruptivetechnologies, greater collaboration is needed. Further research into providing collaboration platforms forceramic manufacturers may be useful.
Funding issues for innovation are also seen to be a significant constraint. One UK manufacturer reportedexploring co-funding from over eight UK and EU sources for a breakthrough technology to no avail. Howeverits European competitors, with whom it was trying to work collaboratively, had been successful in receivingsupport from their governments for their parts of the project.
3.4.3 Decision-Making Processes
The survey results, displayed in Table 4, show high understanding of energy and decarbonisation (25 of the31 survey respondents) with 22 tracking progress on energy and reduction projects at managementmeetings. However, given the importance of energy reduction to the companies' profitability, there areseveral areas that require further development to improve decision making within the companies. Only 16 ofsurvey respondents have a systematic decision making process for new initiatives for energy anddecarbonisation. To a similar degree, 20 of respondents have specific roles or allocated responsibilitieswithin the company with regards to energy or decarbonisation and 16 of respondents have strongcommunication and information sharing channels. Employee engagement has been identified as essential inthe future according to workshop participants; and transfer of knowledge is perceived as a barrier of mediumto high impact to decarbonisation, according to majority of survey respondents and workshop participants.
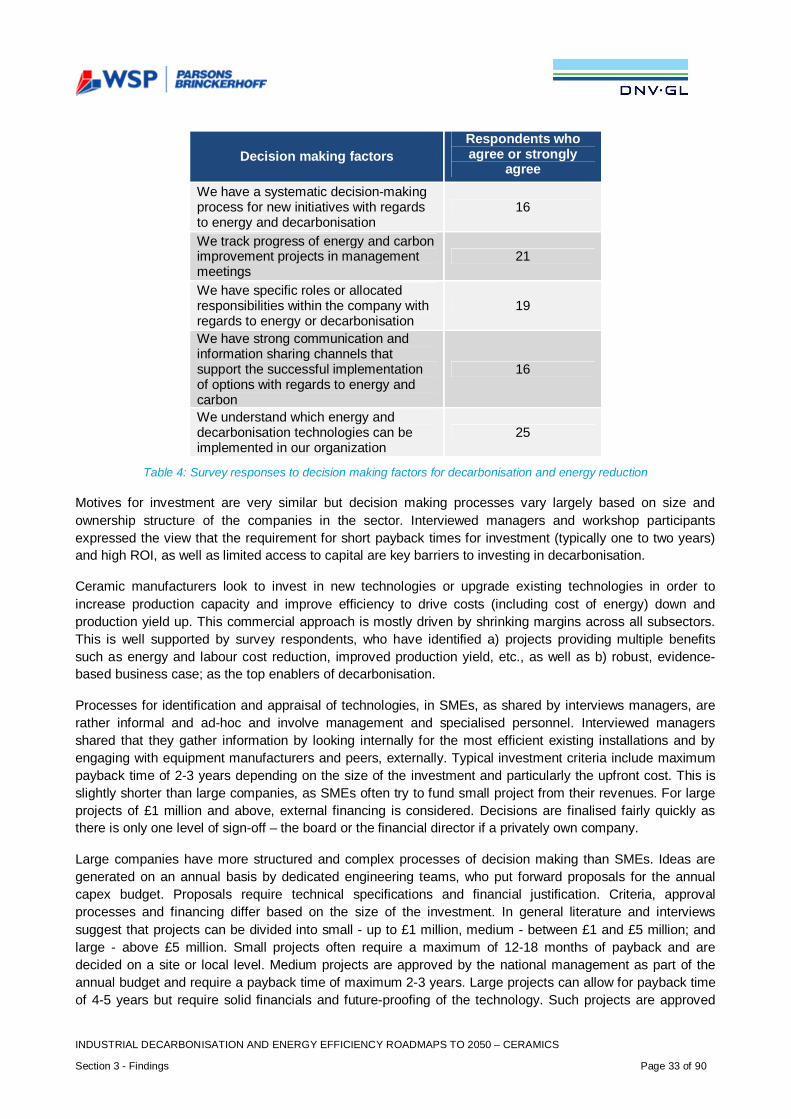
INDUSTRIAL DECARBONISATION AND ENERGY EFFICIENCY ROADMAPS TO 2050 – CERAMICS
Section 3 - Findings Page 33 of 90
Decision making factorsRespondents whoagree or strongly
agreeWe have a systematic decision-makingprocess for new initiatives with regardsto energy and decarbonisation
16
We track progress of energy and carbonimprovement projects in managementmeetings
21
We have specific roles or allocatedresponsibilities within the company withregards to energy or decarbonisation
19
We have strong communication andinformation sharing channels thatsupport the successful implementationof options with regards to energy andcarbon
16
We understand which energy anddecarbonisation technologies can beimplemented in our organization
25
Table 4: Survey responses to decision making factors for decarbonisation and energy reduction
Motives for investment are very similar but decision making processes vary largely based on size andownership structure of the companies in the sector. Interviewed managers and workshop participantsexpressed the view that the requirement for short payback times for investment (typically one to two years)and high ROI, as well as limited access to capital are key barriers to investing in decarbonisation.
Ceramic manufacturers look to invest in new technologies or upgrade existing technologies in order toincrease production capacity and improve efficiency to drive costs (including cost of energy) down andproduction yield up. This commercial approach is mostly driven by shrinking margins across all subsectors.This is well supported by survey respondents, who have identified a) projects providing multiple benefitssuch as energy and labour cost reduction, improved production yield, etc., as well as b) robust, evidence-based business case; as the top enablers of decarbonisation.
Processes for identification and appraisal of technologies, in SMEs, as shared by interviews managers, arerather informal and ad-hoc and involve management and specialised personnel. Interviewed managersshared that they gather information by looking internally for the most efficient existing installations and byengaging with equipment manufacturers and peers, externally. Typical investment criteria include maximumpayback time of 2-3 years depending on the size of the investment and particularly the upfront cost. This isslightly shorter than large companies, as SMEs often try to fund small project from their revenues. For largeprojects of £1 million and above, external financing is considered. Decisions are finalised fairly quickly asthere is only one level of sign-off – the board or the financial director if a privately own company.
Large companies have more structured and complex processes of decision making than SMEs. Ideas aregenerated on an annual basis by dedicated engineering teams, who put forward proposals for the annualcapex budget. Proposals require technical specifications and financial justification. Criteria, approvalprocesses and financing differ based on the size of the investment. In general literature and interviewssuggest that projects can be divided into small - up to £1 million, medium - between £1 and £5 million; andlarge - above £5 million. Small projects often require a maximum of 12-18 months of payback and aredecided on a site or local level. Medium projects are approved by the national management as part of theannual budget and require a payback time of maximum 2-3 years. Large projects can allow for payback timeof 4-5 years but require solid financials and future-proofing of the technology. Such projects are approved
INDUSTRIAL DECARBONISATION AND ENERGY EFFICIENCY ROADMAPS TO 2050 – CERAMICS
Section 3 - Findings Page 34 of 90
first nationally and then considered by corporate together with proposals from all subsidiaries around theworld. Interviewees suggested that this multi-layer approval process may take up to nine months. Largeprojects are financed by corporate exclusively so the internal competition is fierce.
It appears that in both cases, many of the remaining energy and decarbonisation opportunities with existingtechnologies require investments that are prohibitively expensive or have excessively long payback times.
Overall, climate change considerations to investments are related to energy savings and decarbonisation isnot an explicit criteria. However, compliance with regulations, such as the CCA (relating to energy efficiency),can influence investment decision making, as disclosed by an environmental manager, when falling behindtargets exposes the company to financial, legal and reputational risks.
3.4.4 Financing Investments
Based on the interviews conducted, the need for financing varies from company to company. It was reportedby some that the availability of capital remains a real challenge, whilst others have access to capital and it isthe issue of the attractiveness of investment the UK (and Europe) that presents an obstacle, often driven byhigher energy prices. This variety of opinions is supported by the survey results as well where only 15 ofrespondents regard scarcity of funding as a high barrier.
Small-scale investments, mostly in upgrading projects, are typically financed internally and at site level andexpect immediate returns. In large multinationals, a key barrier however is the limited availability of capital forimprovement projects due to the high level of competition for internal funds and other projects more closelyrelated to the core business. It is the case that internal financing is available, but decision-making processestend to go against UK sites and operations. International management boards allocate capital on the basis ofpotential returns: higher UK costs and greater perceived uncertainty of business conditions in the UK make itmore difficult or impossible to justify investment in longer-term UK manufacturing operations. In someorganisations, internal company funds are the only route of finance.
Some of the interviewed managers from the industry indicated that they would not expect major investmentsin new plant to be made in the UK, given the higher potential returns that could be achieved in other markets(particularly Asia). Others expressed a concern that it is difficult for the UK to demonstrate a strong businesscase and to get to the point of financing.
SMEs interviewed stated that they often struggle to secure financing for medium and large-scale investmentsand look for financing outside. Banks (including the Green Investment Bank) are often unwilling to provideaffordable finance over longer payback periods. Interviewees identified governmental, growth fundingschemes and grants, and lease contracts with equipment manufacturers as key alternatives to bank loans.
3.4.5 Enablers and Barriers
One of the outcomes of the analysis of the sector is a list of the most prevalent enablers and barriers fordecarbonisation. The enablers and barriers have been identified through a number of different researchmethods, namely literature review, interviews, surveys and workshops. Triangulating data has been ofutmost importance. Seen below are details of the enablers and barriers that have not only been triangulatedwith regards to research methods, but were also selected at the workshops as the most important enablersand barriers.
Table 5 and Table 6 below indicate the most prevalent enablers and barriers across literature and interviews,as well as the perceived level of impact to decarbonisation as assessed by survey respondents andworkshop participants. Although the number of times an enabler or barrier was referenced or highlightedcould provide some guidance as to the strength of sentiment towards a particular enabler or barrier, the
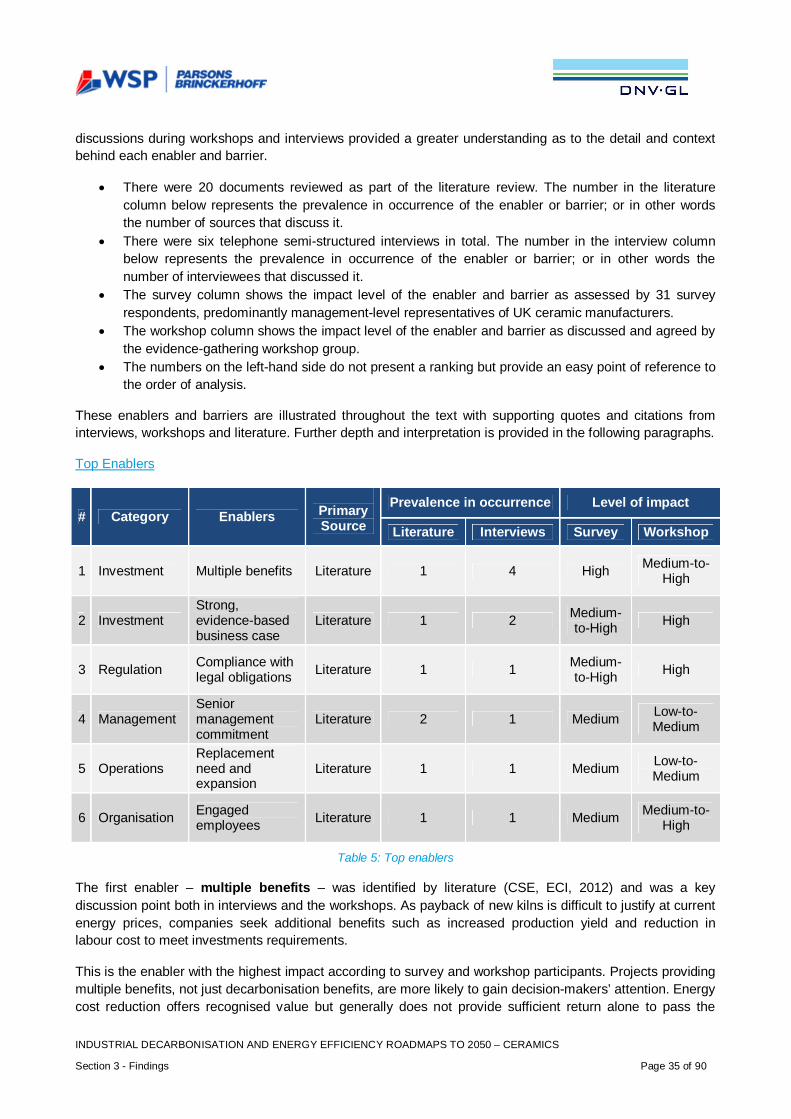
INDUSTRIAL DECARBONISATION AND ENERGY EFFICIENCY ROADMAPS TO 2050 – CERAMICS
Section 3 - Findings Page 35 of 90
discussions during workshops and interviews provided a greater understanding as to the detail and contextbehind each enabler and barrier.
· There were 20 documents reviewed as part of the literature review. The number in the literaturecolumn below represents the prevalence in occurrence of the enabler or barrier; or in other wordsthe number of sources that discuss it.
· There were six telephone semi-structured interviews in total. The number in the interview columnbelow represents the prevalence in occurrence of the enabler or barrier; or in other words thenumber of interviewees that discussed it.
· The survey column shows the impact level of the enabler and barrier as assessed by 31 surveyrespondents, predominantly management-level representatives of UK ceramic manufacturers.
· The workshop column shows the impact level of the enabler and barrier as discussed and agreed bythe evidence-gathering workshop group.
· The numbers on the left-hand side do not present a ranking but provide an easy point of reference tothe order of analysis.
These enablers and barriers are illustrated throughout the text with supporting quotes and citations frominterviews, workshops and literature. Further depth and interpretation is provided in the following paragraphs.
Top Enablers
# Category Enablers PrimarySource
Prevalence in occurrence Level of impact
Literature Interviews Survey Workshop
1 Investment Multiple benefits Literature 1 4 High Medium-to-High
2 InvestmentStrong,evidence-basedbusiness case
Literature 1 2 Medium-to-High High
3 Regulation Compliance withlegal obligations Literature 1 1 Medium-
to-High High
4 ManagementSeniormanagementcommitment
Literature 2 1 Medium Low-to-Medium
5 OperationsReplacementneed andexpansion
Literature 1 1 Medium Low-to-Medium
6 Organisation Engagedemployees Literature 1 1 Medium Medium-to-
High
Table 5: Top enablers
The first enabler – multiple benefits – was identified by literature (CSE, ECI, 2012) and was a keydiscussion point both in interviews and the workshops. As payback of new kilns is difficult to justify at currentenergy prices, companies seek additional benefits such as increased production yield and reduction inlabour cost to meet investments requirements.
This is the enabler with the highest impact according to survey and workshop participants. Projects providingmultiple benefits, not just decarbonisation benefits, are more likely to gain decision-makers’ attention. Energycost reduction offers recognised value but generally does not provide sufficient return alone to pass the

INDUSTRIAL DECARBONISATION AND ENERGY EFFICIENCY ROADMAPS TO 2050 – CERAMICS
Section 3 - Findings Page 36 of 90
currently stringent investment criteria. Increased capacity and reduced labour or maintenance cost havebeen identified as some of the other key benefits sought from investments. Under conditions of growingdemand, technologies that offer improved yield with lower energy consumption will be preferred by ceramicmanufacturers. Only the necessity for increased capacity provides sufficient justification for many large scaleinvestments. This enabler has applicability across all subsectors. This enabler is relevant now, and willbecome increasingly important in the future.
One interviewee, responsible for environmental issues in the UK, stated: “In our company payback is notacceptable just based on energy cost [reduction], so the other costs (e.g. labour) must be reduced as well orincrease yield and output.”
A second interviewee, stated: “Very often the ROI is quite small, so we need to bring other benefits to thebottom line of the project such as labour cost reduction or yield increase. Energy reduction is only a primaryfocus if there is an issue to be fixed or improved.”
The second enabler – strong, evidence-based business case – was highlighted in the literature review(Carbon Trust, 2011) and confirmed during the workshops and in the interviews. Capturing all benefits andcosts, or the complete picture, can provide support to get executive buy-in and pursue more energy efficienttechnologies, which help reduce carbon emissions as well. This is strongly linked to the first enabler, as thebusiness case, as debated by the workshop participants, must quantify the financial impact of all benefits,including reduced maintenance cost and benefits or expanded portfolio of products. Lack of reliableinformation about the technical potential and profitability of breakthrough or disruptive technologies has beenidentified as a significant barrier, especially for smaller companies. This enabler is relevant now, and willbecome increasingly important in the future.
“Business case – this will need to be robust. Savings must be deliverable and all financial savings and costscaptured. The sector would like to see all potential benefits captured. For example, could a carbon reductionmeasure also help to deliver productivity improvements or reduce maintenance requirement.” (Carbon Trust,2011)
At the evidence-gathering workshop the attendees unanimously expressed the view that: “Without it [robustbusiness case] none of the proposed projects can reach a discussion at board level or final stage of decisionmaking and sign-off process.”
The third enabler – compliance with legal obligations – was identified by literature (Frank Venmans, 2014).Despite the fact that only one interviewee - an environmental manager, had compliance with environmentalregulations as a top enabler of decarbonisation, all workshop participants agreed that it is a driving force,largely as already perceived by the industry as the norm to comply fully and follow the rules. CCA targets, forexample, have been key drivers for a lot of ceramic manufacturers, as stated by interviewees and workshopattendees; as they provide the right incentives to justify the investment in energy efficiency anddecarbonising technologies. Compliance is also perceived by interviewed managers as very costly fromreputational perspective as the risk of not complying with regulations may be quite damaging to the companybrand. Nearly 80% (21) of the survey respondents assessed this enabler as having high impact onimplementing decarbonising technologies. This enabler is relevant now.

INDUSTRIAL DECARBONISATION AND ENERGY EFFICIENCY ROADMAPS TO 2050 – CERAMICS
Section 3 - Findings Page 37 of 90
A general manager for a small manufacturer stated: “We optimised the car fill and kiln efficiencies as wewere behind CCA targets. It resulted in higher labour cost but we achieved 60% reduction in cost of carbonfrom the plant.”
Workshop attendees concluded that: “Enforcement is a key driver for example through policy inspectionsand audits. There is too high a risk of non-compliance and associated financial and reputational cost.”
“A key policy enabler is to comply with legal obligations (e.g. environmental licence)”. (Venmans, 2014)
The fourth enabler – senior management commitment – was identified by literature (Ricardo-AEA) andconfirmed both by interviews and workshop. As with many industrial sectors we see today, seniormanagement buy-in and formal business commitment, plus increasing willingness of top management tomake climate change a priority, is an enabler for the level of support and prioritisation that a company’scarbon strategy has compared to other aspects of the business strategy. This can create a cascade effectthrough the company.
Although reducing energy cost is perceived by industry as paramount to maintaining profitability, reducingcarbon emissions is not such a priority for executives and management. Decarbonisation can therefore onlyoccur when it contributes to maintaining business profitability. This could be significantly influenced ifconsumer preferences and attitude towards climate change was significantly more favourable. This enableris relevant now, and will become increasingly important in the future.
One interviewee, responsible for environmental issues in the UK, stated: “Commitment from seniormanagement has been essential to implement some of the recent technological improvements”.
“Willingness of top management to make climate change a priority [is a key enabler]. This is crucial as itaffects the overall culture of the firm.” (Ricardo-AEA, 2013)
The fifth enabler – replacement need and expansion– was identified by literature (Frank Venmans, 2014)and confirmed both by interviews and discussions at workshop. With long lifespan of kilns, replacement ofobsolete ones is a great opportunity for putting forward a case of more energy efficient options. This hasbeen reinforced by the exponentially increasing maintenance cost at the end of the life of the kiln. Similar isthe case when companies are looking to expand and add capacity to meet growing demand or diversify theproduct portfolio. However, BCC has reported that companies are not investing because of perceived lack oflonger term business viability in the UK and that energy and climate-related policies are a significant issuehere. This enabler is very relevant now.
One workshop attendee, technical manager for a small manufacturer, stated: “By 2030, 30% of currentequipment will be replaced as it will become obsolete and maintenance cost drastically increase at the endof the equipment lifespan. Major driver here is to save materials and energy cost”.
An interviewee, general manager of a plant, stated “Payback is never there to upgrade incremental optionssuch as motors, fans and lighting, as we can run with the current ones until they break. The replacementprocess has been gradual unless there is a compelling ROI.”
The sixth enabler – engaged employees – was identified in the literature (European Commission, 2007) andconfirmed through interviews. Although still gaining traction, there will be a switch of focus from energy todecarbonisation in the future and the mind-set of decision makers will change accordingly. Employeeengagement and buy-in on decarbonisation is not yet perceived as a key driver according to the workshop
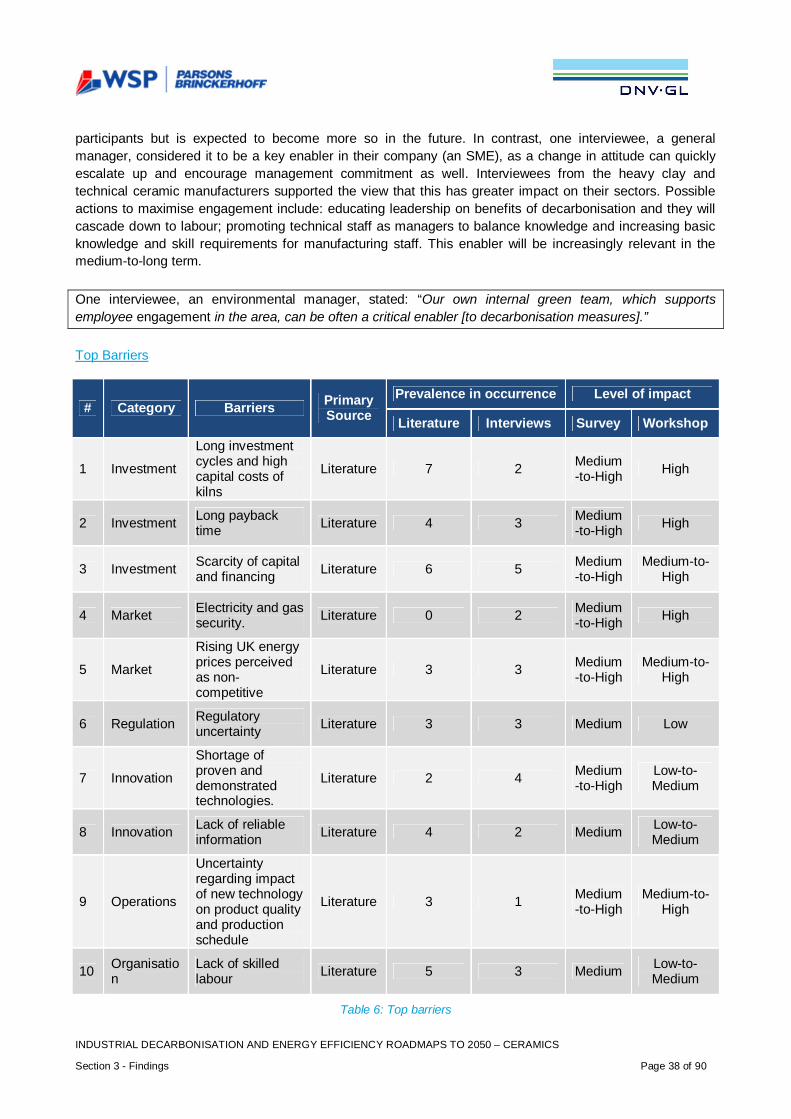
INDUSTRIAL DECARBONISATION AND ENERGY EFFICIENCY ROADMAPS TO 2050 – CERAMICS
Section 3 - Findings Page 38 of 90
participants but is expected to become more so in the future. In contrast, one interviewee, a generalmanager, considered it to be a key enabler in their company (an SME), as a change in attitude can quicklyescalate up and encourage management commitment as well. Interviewees from the heavy clay andtechnical ceramic manufacturers supported the view that this has greater impact on their sectors. Possibleactions to maximise engagement include: educating leadership on benefits of decarbonisation and they willcascade down to labour; promoting technical staff as managers to balance knowledge and increasing basicknowledge and skill requirements for manufacturing staff. This enabler will be increasingly relevant in themedium-to-long term.
One interviewee, an environmental manager, stated: “Our own internal green team, which supportsemployee engagement in the area, can be often a critical enabler [to decarbonisation measures].”
Top Barriers
# Category Barriers PrimarySource
Prevalence in occurrence Level of impact
Literature Interviews Survey Workshop
1 Investment
Long investmentcycles and highcapital costs ofkilns
Literature 7 2 Medium-to-High High
2 Investment Long paybacktime Literature 4 3 Medium
-to-High High
3 Investment Scarcity of capitaland financing Literature 6 5 Medium
-to-HighMedium-to-
High
4 Market Electricity and gassecurity. Literature 0 2 Medium
-to-High High
5 Market
Rising UK energyprices perceivedas non-competitive
Literature 3 3 Medium-to-High
Medium-to-High
6 Regulation Regulatoryuncertainty Literature 3 3 Medium Low
7 Innovation
Shortage ofproven anddemonstratedtechnologies.
Literature 2 4 Medium-to-High
Low-to-Medium
8 Innovation Lack of reliableinformation Literature 4 2 Medium Low-to-
Medium
9 Operations
Uncertaintyregarding impactof new technologyon product qualityand productionschedule
Literature 3 1 Medium-to-High
Medium-to-High
10 Organisation
Lack of skilledlabour Literature 5 3 Medium Low-to-
Medium
Table 6: Top barriers
INDUSTRIAL DECARBONISATION AND ENERGY EFFICIENCY ROADMAPS TO 2050 – CERAMICS
Section 3 - Findings Page 39 of 90
The first barrier – long lifetime and high capital cost of kilns – was identified in the literature (Cerame-Unie, 2013) and was confirmed during the interviews and workshop. Sector investment cycles are to a largeextent dictated by the lifespan of manufacturing equipment (kilns), which can typically be up to 40 years. Thislifetime implies that there will only be one or, at most, two investment cycles between now and 2050 andlimited opportunities for improvement. The majority of the manufacturers have equipment from different timeperiods and most of the equipment has been modernised at different times as well. Additionally, high upfrontcost of such investments often limits the financial ability of UK ceramic companies to upgrade multiple kilnsat the same time. Rather, companies take gradual approach to upgrading their kilns. This is a barrier nowand in the future.
Cerame-Unie roadmap states: “As the life of a kiln can be more than 40 years and represents major capitalinvestment, it is not financially-feasible to routinely upgrade kilns before the end of their life and replace themwith more energy-efficient models.”
Workshop attendee, technical manager for a small manufacturer, explained: “With a 40 year lifespan of kilnsthere is no drive for kiln manufacturers to build 2050 capable kilns.”
The second barrier – long payback time – was identified in the literature (CSE, ECI, 2012) and had beenconfirmed both by interviews and workshop. Interviews have confirmed that across the sector there is onaverage a requirement for maximum of 3-year payback for capex projects. This often puts decarbonisingoptions in an unfavourable position relative to other investment opportunities (which include those overseas).Current level of energy prices in the UK and high upfront costs of equipment often make payback periods toolong to be competitive. For external financing, banks (including the Green Investment Bank) are unwilling toprovide affordable finance over longer payback periods. This is a barrier now and in the future.
One interviewee, responsible for energy management, stated: “We typically require 3 year payback time formajor capex projects and new technologies rarely fit within that threshold”.
“Businesses generally appear to require very high rates of return on energy efficiency projects before theywill invest. Resistance to invest in energy efficiency despite reasonable rates of return is sometimes termedthe efficiency “paradox”.” (CSE, ECI, 2012)
The third barrier – scarcity of capital and financing – was identified in the literature (Carbon Trust, 2011)and had been confirmed both by interviews and workshop. The UK ceramic sector has been very slowlyrecovering since the economic crisis and that has put a significant constraint in companies’ ability to invest inmajor equipment. Large multinational companies also expressed concern that energy reduction projectsoften compete for limited funding with core business projects overseas; and longer payback times do nothelp secure that funding as risk is seen as too high. Lack of resources to identify available external funding,and reluctance to move to third party financing are seen by the sector as additional barriers to findingfinancing. Interviewees across the various subsectors indicated that there is a need for government backedfinancial schemes for industry to obtain finance at affordable rates or by funding improvement grants to helpincentivise the uptake of energy and carbon efficient technologies. In addition, support for RD&D of emergingand breakthrough technologies is urgently needed. Interviewees also indicated that there is a lack ofcollaboration on financing demonstration projects as this is seen as a competitive advantage and thussharing the financial burden amongst competing manufacturers is limited. One interviewee, general managerfor a small manufacturer, indicated that they would go through with a new technology implementation ifequipment suppliers could offer financial incentives in the form of leasing to reduce the upfront cost andshare the risk of a longer payback. This is a barrier now.
INDUSTRIAL DECARBONISATION AND ENERGY EFFICIENCY ROADMAPS TO 2050 – CERAMICS
Section 3 - Findings Page 40 of 90
One interviewee, responsible for energy management, stated: “Capital availability is paramount … as wehave to compete internally for funding with non-energy related projects”.
Another interviewee, general manager in the UK, explained: “Financing is a key issue for us as we do nothave the cash to invest upfront”.
“A large proportion of UK companies operating in the energy intensive sector are subsidiaries of globalorganisations. They compete internally for capital investment. Higher costs make it more difficult to justifyinternal group investment in the UK. The Green Investment Bank was, however, seen as potential source ofcapital for energy efficiency projects.” (Centre for Low Carbon Futures, 2011)
The fourth barrier - electricity and gas security – was identified during two interviews and confirmed at theworkshop. Main concerns include that unplanned interruption of energy supply can cause major damage tocontinuous kilns resulting in shutdown for several months, loss of product and increased production cost perunit. The majority of survey respondents and workshop participants reinforced the view that shortage of gassupplies can cause major production disruptions and drastically increase the cost of natural gas. The threatof supply loss causes high price volatility making business models uncertain and deters investment in the UKin the sector. If not addressed, this may cause some businesses to close. This barrier will have an increasingimportance in the future.
The fifth barrier – rising UK energy prices perceived as non-competitive – was identified in the literature(IEA, 2014; ICF International, 2012) and confirmed by the interviews and workshop. As an energy intensiveindustry (EII), with energy cost comprising 30-35% of total manufacturing cost, the international success ofthe sector is reliant on competitive energy and carbon prices. Divergence of these costs relative tocompetitor nations is perceived as a major threat to profitability of the UK ceramic manufacturers, especiallysince margins have been shrinking in the past years (BCC, 2014). It can be argued that rising UK energyprices may make it more attractive for ceramic companies to invest in energy-efficient technologies and forsites to justify any investments (and could therefore also be seen as an enabler). It is the industry view thatincreased costs in the UK as a result of higher energy prices reduces the capacity of the industry to invest.The view was expressed that unilateral policies were distorting international competition to the detriment ofthe UK.
This barrier is particularly acute for companies that form part of multinational organisations, where each siteeffectively competes against the others to secure long-term investment, which is heavily impacted by currentand forecasted energy prices locally for each site. The perception is that this further promotes a difficulteconomic climate and the decline of the sector, making it difficult to obtain financing for large capitalexpenditures such as related to decarbonisation.
It was stated by interviewees that the industry specifically seeks overall reassurance by government thatceramic manufacturers (and other energy-intensive industries) are not driven out of the UK by policydecisions affecting pricing of energy and carbon. In this discussion it is important to differentiate betweenelectricity costs and fuel costs. For large energy-intensive industries, the UK has among the highestelectricity prices in Europe and in the mid-range compared to G7 countries; a growing proportion of that costis linked to climate change policy (ICF International, 2012). Furthermore, unlike some overseas competitors,climate related charges on electricity are not compensated for UK electro-intensive ceramic manufacturers.Sector representatives emphasised that this issue needed to be addressed to enable UK manufactures tocompete internationally. Average natural gas prices are amongst the lowest in Europe and are also lowcompared to most G7 countries (DECC, 2014). However, average prices are perceived by the UK industry tobe higher than some competitor countries, such as North America and Russia. Price volatility is alsoperceived to be much higher in the UK than in most European countries. Price volatility, extended gas price
INDUSTRIAL DECARBONISATION AND ENERGY EFFICIENCY ROADMAPS TO 2050 – CERAMICS
Section 3 - Findings Page 41 of 90
spikes and the resulting inability to have a predictable business model has a severe and deleterious impacton investment in the sector.
A recent publication of Agora – Energiewende (2014), however, illustrates that the comparison of electricitywholesale prices between Sectors and countries is a difficult task. Moreover, a recent communication fromthe European Commission on energy prices and costs in Europe shows that UK electricity prices for industryare very similar to the average EU-27 prices (see Figure 11), although certain countries (like Bulgaria andFinland) show significantly lower prices (European Commission, 2014).
This is a barrier now and in the future.
“A number of representatives identified the high and rising costs of energy and energy taxes in the UK, aswell as rising commodity prices, as a barrier to investment. Parent companies see relatively poor returns oninvestment in the UK compared with other countries.” (Centre for Low Carbon Futures, 2011)
“While numerous European companies have complained of market distortion due to regulatory favouritismfor Germany’s energy-intensive industries, caution must be exercised when attempting to directly compareindustrial end-use prices between countries and sectors. Because firms in different regions and Sectors varyconsiderably in the extent to which they pay wholesale market prices and/or receive tax exemptions and levyreductions, comparing prices between Sectors and countries is a difficult task. The heterogeneity of thesituation is not fully and transparently captured by European statistics.” (Agora – Energiewende, 2014)
A general manager for a SME manufacturer stated: “Business is growing however we are penalised for thisgrowth by the current carbon price and thus at disadvantage compared to non-UK competitors.”
The sixth barrier – regulatory uncertainty – was identified in the literature (Centre for Low Carbon Futures,2011) but the impact of this barrier varies across sources. Interviewees and some workshop participantsperceived the lack of long-term clarity on energy, climate, environmental and innovation policies in the UK asa significant barrier to the restoration of investment confidence. The sector, including BCC, consider this tobe an extremely important barrier to investment by the sector, noting that the certainty of a high carbon pricewould deter investment in the UK rather than attracting funds to this sector, as returns would be higherelsewhere. Continuous alterations to policies and targets increases uncertainty in decision making, deterringinvestment and can render existing investments unviable. Some workshop participants, including BCC,reinforced the view that setting long-term regulatory framework and targets will provide the necessarycertainty in future energy costs and the direction of government regulatory change. Other workshopparticipants considered the uncertainty as a barrier only to the extent it causes energy prices to rise. This is abarrier now and in the future.
A general manager stated: “…Ever changing and over complicated carbon related compliance schemes thatdo not engage or encourage, just burden business.”
“Long-term clarity [of policy] was seen as vital to underpin high cost, long-term technology investment.”(Centre for Low Carbon Futures, 2011)
The seventh barrier – shortage of proven and demonstrated technologies – was identified in theliterature (Carbon Trust, 2011) and was confirmed both from interviews and the workshop. Ceramicmanufacturers are highly risk averse and are not likely to implement technologies that might lead toproduction disruptions due to malfunctioning retrofits. Therefore, technologies that have been successfulalready are more likely to gain traction. Only 10% (3) of the survey respondents identified themselves as firstmovers or innovators, which is another constraint on the rate of adoption of new technologies. However, the
INDUSTRIAL DECARBONISATION AND ENERGY EFFICIENCY ROADMAPS TO 2050 – CERAMICS
Section 3 - Findings Page 42 of 90
risks associated with investing in unproven technologies, the high level of resources required and thefrequently long timescales involved are a strong disincentive for companies or subsectors to act in isolation.There is a need to bring breakthrough technologies to market in the near term to allow their progressiveapplication as assets are slowly replaced given the long lifetime of ceramic plants (typically 40 years). This isa barrier now and in the future.
The eighth barrier – lack of reliable information – was identified from the literature (CSE, ECI, 2012) andwas confirmed both by the interviews and workshop, as a factor that could potentially lead to less investmentin low-carbon technologies. Interviewed managers expressed the concern that here is a shortage oftechnical knowledge and capacity within the UK ceramic businesses to identify new technologies andmeasures. Businesses don’t know where to start looking for new options and industry wide support can be akey to resolve this. This has been identified as a stronger barrier for SMEs in the sector. The need forgreater knowledge-sharing and RD&D collaboration among countries to accelerate technology advancementalong the curve from demonstration to commercialisation was also a theme mentioned during workshop. Thisis a barrier now and in the future as information is required on new technologies.
One interview, responsible for investments, stated: “There is currently no sensible way for us to know whatoptions are out there and what the benefits of various technologies are.”
A second interviewee, general manager, stated: “A first priority should be for governments, industry and civilsociety to develop a common vision for the transition to low-carbon energy. The process of developing thevision should involve sharing information and views on the importance of using a portfolio of low-carbontechnologies, the costs and benefits of various technology options, and the need for infrastructure andtechnology change.”
The ninth barrier – uncertainty regarding impact of new technology on product quality and productionschedule – was identified by literature (Carbon Trust, 2011) and confirmed during the workshop. Thepotential impact of any changes in operations on machine operability, and any impact on production andquality, is a barrier to decarbonisation that requires changes to machinery. Risk of production disruptionsfrom retrofit technologies is an even larger concern for small companies with limited production capacity.Interviewed managers were concerned about installing new technologies and its implications on productquality so that they can continue to meet customer demands and specifications.
“Continuity of production is of primary importance to firms. This is one of the reasons that energy efficiencytechnologies tend to have more stringent economic criteria compared to investments that are more closelyrelated to the core business.” (Ricardo-AEA, 2013)
The tenth barrier – lack of skilled labour – was identified in the literature (McKenna, 2009) and wasconfirmed both by the interviews and workshop. A shortage of technically competent staff and a lack offunding for training prevent any further advancement of the sector. There is a particularly increasing demandfor specialised engineers in heat exchange, combustion and firing technologies. Some workshop participantsexpressed concern that the ceramic sector is not attractive to young engineers anymore and that trend willcontinue unless an industry-level action is taken. This is a particular barrier now, as the workforce in thesector is ageing, without sufficient succession planning in place, particularly in technical roles.
One general manager stated: “We do struggle to find adequately skilled labour for new technologiesimplementation or processes improvement”.
INDUSTRIAL DECARBONISATION AND ENERGY EFFICIENCY ROADMAPS TO 2050 – CERAMICS
Section 3 - Findings Page 43 of 90
“The transition to low carbon industrial heat will require specialised, highly skilled and experienced heatfocused engineers. These skills are not readily available in the industry.” (DECC, 2013). A future barrier -availability of biomass / waste resources for high temperature heat – was identified by BCC after theevidence gathering phase of the study. This barrier would limit the potential deployment of industrial heatapplications of biomass or waste materials since a secure supply of competitively-priced, sustainablefeedstock would be essential for the duration of the asset life to justify the significant capital investment.
3.5 Technologies to Reduce Carbon Emissions
While actions of the sector are constrained by barriers and may be promoted by enablers, potential choicesof decarbonisation solution are limited by available technologies that are applicable to the sector
Technical options were identified from the literature review, interviews, workshops, discussions with the tradeassociation and input from academia. Data on these options was assembled from these same sources andis presented in appendix C. The energy saving and decarbonisation opportunities have been classified intofive categories:
· Conventional improvement options include improved control of combustion, minimisation of heatlosses, waste-heat recovery and heat integration, energy monitoring and management and improvedprocess control.
· Ceramic process changes that reduce energy consumption including increased product packingdensity in kilns, reduction in product weight, development of durable heat exchangers for the kilnexhaust, changes to raw materials to reduce firing temperatures and modifications to eliminateadditional firing steps.
· Radical changes to kilns including replacement of batch by continuous kilns (where product rangesand volumes allow this to be feasible and economic) and replacing kilns that are passed their life-expectancy with BAT.
· Options to utilise a lower carbon fuel including the use of biomass gasification to generate gaseousfuels to replace fossil fuels and the application of electrically heated kilns for heavy clay products.
· The application of CC technology to large kilns.
These categories were then grouped in different groups reflecting their ease and timeliness ofimplementation:
· Existing state-of-the-art technologies with wide deployment: existing and proven technologies,immediate deployment aligned with equipment replacement.
· Major investment technologies: proven technologies already implemented at some sites, but not all;proven technologies that are not yet widely accepted in industry, only a few UK demonstrationprojects; also some novel technologies included.
· Disruptive changes including radical changes to energy supply and CC.
Three disruptive options applied to kilns in the heavy clay subsector, which have no prior application in thesector, have the potential to reduce carbon emissions significantly:
· Substitution of gasified biomass for natural gas· Application of electric kilns (using low carbon electricity) to replace gas-fired kilns· CC applied to gas-fired kilns
In addition to the options that were considered to be sufficiently well advanced to be applied in the period to2050, several others were identified that could have a significant impact but were not considered sufficientlydeveloped to be included. These options range from improvements to parts of the conventional process e.g.

INDUSTRIAL DECARBONISATION AND ENERGY EFFICIENCY ROADMAPS TO 2050 – CERAMICS
Section 3 - Findings Page 44 of 90
low energy driers, to radical disruptive changes to replace many steps e.g. ceramic production at less than100ºC. The following list summarises the main options that were identified but not included in the optionsregister:
1. MIDAR™ technology is an aqueous chemical process, which produces robust ceramics products at<100°C, removing the need to use high temperature processes.
2. The low energy firing uses field enhanced sintering to apply a direct electric field to reduce the peaktemperature needed to fire ceramics by up to 600°C and lowers the exposure time to just a fewseconds.
3. Microwave assisted drying uses microwave heating to deliver energy more efficiently for dryingproducts, thereby cutting energy consumption for drying.
4. Vacuum drying applies reduced atmospheric pressure to cut the energy consumption required fordrying.
5. Electrically heated kilns apply radio frequency (RF) or microwave heating to deliver heat moreefficiently to the high temperature sections of kilns, again offering the potential to reduce time,temperature and energy consumption.
Each of these processes are being or have been examined for application in the sector but have not reachedthe point where their potential is understood adequately to be quantified from literature or by the sector team.
3.5.1 Biomass Carbon Intensity
Pathways including biomass reflect biomass carbon intensity (unless the biomass in the pathway is assumedto be waste biomass). The carbon intensities (below) are applied to two scenarios to help reflect and boundthe uncertainties around biomass carbon availability; these are (i) unlimited availability – as deployed in theMax Tech pathway or (ii) no availability.
In all cases, combustion emissions are assumed to be zero (in line with EU Renewable Energy Directivemethodology), on the basis that all biomass used is from renewable sources and thus additional CO2 isremoved from the atmosphere equivalent to that emitted on combustion. This means that all biomass isassumed to be sourced from material that meets published sustainability criteria.
Given the wide variation in pre-combustion emissions, a carbon intensity (based on pre-combustionemissions) was derived from a low scenario from the DECC-commissioned Bioenergy Emissions andCounterfactual Model report (published 2014) for modelling purposes. An emission value of 20kgCO2e/MWh(th) has been used for solid biomass use, and this has been modified to 25 kgCO2e/MWh(th) ifthe pathways includes pyrolysis, and 30 kgCO2e/MWh(th) if the pathways includes production of biogas.
3.5.2 Cost of Options
Limited information related to the capital cost of technologies was identified in this project as summarised inappendix C. In gathering capital cost-related data, literature and/or engagement with stakeholders – togetherwith expert judgement - were used to establish an initial order of magnitude dataset for use in the costanalysis assessment. The degree of stakeholder engagement in relation to the cost dataset was lower thanfor the carbon reduction pathways. Operating costs such as energy use changes, energy costs and labourare not included in this analysis, although we recognise that operating costs will have a major impact on thedecarbonisation pathways. For example some options (e.g. CC and electrification of firing) will greatlyincrease energy use and costs of a process plant.
Costs analysis was carried out for the pathways, which is presented in section 4.6.There is a large degree ofuncertainty attached to the cost analysis, especially for options which are still in the R&D stage. As well ascosts of operation and energy use – other significant costs not included in the analysis are research,

INDUSTRIAL DECARBONISATION AND ENERGY EFFICIENCY ROADMAPS TO 2050 – CERAMICS
Section 3 - Findings Page 45 of 90
development, demonstration, civil works, modifications to plant and costs to other stakeholders, which aresignificant for many options. Great care must be taken in how these costs are interpreted.
3.5.3 Informing Pathway Development
The interaction of the technical options with the sector enablers and barriers will determine which options arelikely to be deployed first, or at all, by the sector. In exploring the potential pathways to decarbonisation, thelist of enablers and barriers has informed the selection of technical options deployed in the differentpathways. They have also been used to guide the deployment of the different technical options both withregards to time and degree of deployment. For example the enabler ‘replacement need and expansion’, ledto a faster deployment of current BAT using state-of-the-art technologies with much reduced carbonemissions compared with the plant being retired.
INDUSTRIAL DECARBONISATION AND ENERGY EFFICIENCY ROADMAPS TO 2050 – CERAMICS
Section 4 - Pathways Page 46 of 90
4. PATHWAYS
4.1 Key Points
The potential future trajectories of carbon emissions in the sector were explored by an analysis of a range ofalternative pathways, each comprising different assumptions about the selection, application and timing oftechnical options for decarbonisation. A spreadsheet model was used to assess the impact of the applicationof technical options to the sector energy consumption and carbon emissions. The background pattern ofgrowth of the sector to 2050, which affects the underlying fuel consumption and emissions, was representedas a number of alternative scenarios.
The pathways development and analysis shows that the maximum decarbonisation potential of the sector inthe current trends scenario is a reduction to 0.5 MtCO2 emitted in 2050 in the Max Tech pathway, whichcorresponds to a reduction in emissions of 60% compared with emissions in 2012. Significant reductions of60% and 35% could be achieved under challenging world and collaborative growth scenarios respectively.The reductions have been achieved through a range of options, the most significant ‘disruptive’ technologiesbeing:
· The replacement of conventional gas fired kilns with electric kilns, applied throughout the sector,cutting gas combustion and using lower carbon electricity
· Decarbonisation of the electricity grid· Decarbonisation of heat by substituting fossil fuel with biomass, using onsite gasification technology
at the larger production facilities· CC applied to larger heavy clay facilities
‘Incremental’ and ‘Major’ technologies have also been applied in the short and medium terms along thepathway, generally using the types of options as follows:
· Replacing older kilns with BAT i.e. new and efficient gas kilns· Significant process improvements such as heat recovery and regeneration, materials advances for
insulation and refractories, improved combustion efficiency· Significant materials chemistry and technology refinements allowing lower firing temperatures,
reduced number of firings, and options such as pre-calcining of clay and reduced product weight· Incremental improvements extending known solutions
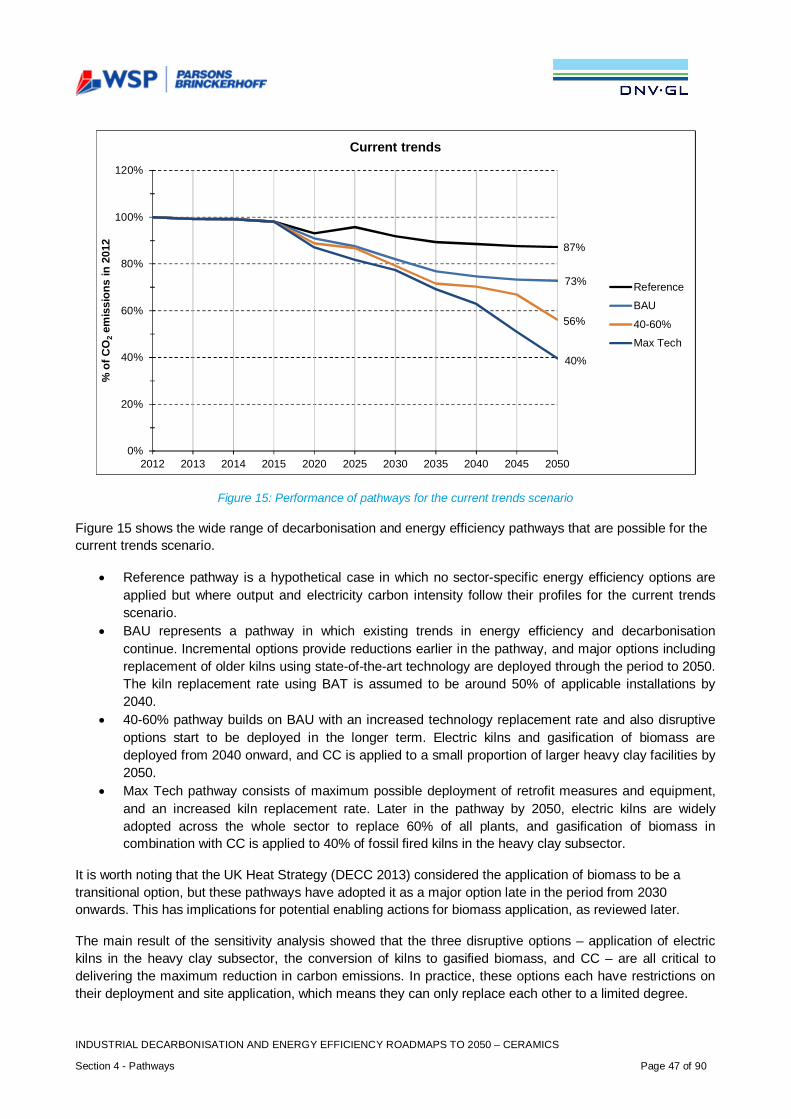
INDUSTRIAL DECARBONISATION AND ENERGY EFFICIENCY ROADMAPS TO 2050 – CERAMICS
Section 4 - Pathways Page 47 of 90
Figure 15: Performance of pathways for the current trends scenario
Figure 15 shows the wide range of decarbonisation and energy efficiency pathways that are possible for thecurrent trends scenario.
· Reference pathway is a hypothetical case in which no sector-specific energy efficiency options areapplied but where output and electricity carbon intensity follow their profiles for the current trendsscenario.
· BAU represents a pathway in which existing trends in energy efficiency and decarbonisationcontinue. Incremental options provide reductions earlier in the pathway, and major options includingreplacement of older kilns using state-of-the-art technology are deployed through the period to 2050.The kiln replacement rate using BAT is assumed to be around 50% of applicable installations by2040.
· 40-60% pathway builds on BAU with an increased technology replacement rate and also disruptiveoptions start to be deployed in the longer term. Electric kilns and gasification of biomass aredeployed from 2040 onward, and CC is applied to a small proportion of larger heavy clay facilities by2050.
· Max Tech pathway consists of maximum possible deployment of retrofit measures and equipment,and an increased kiln replacement rate. Later in the pathway by 2050, electric kilns are widelyadopted across the whole sector to replace 60% of all plants, and gasification of biomass incombination with CC is applied to 40% of fossil fired kilns in the heavy clay subsector.
It is worth noting that the UK Heat Strategy (DECC 2013) considered the application of biomass to be atransitional option, but these pathways have adopted it as a major option late in the period from 2030onwards. This has implications for potential enabling actions for biomass application, as reviewed later.
The main result of the sensitivity analysis showed that the three disruptive options – application of electrickilns in the heavy clay subsector, the conversion of kilns to gasified biomass, and CC – are all critical todelivering the maximum reduction in carbon emissions. In practice, these options each have restrictions ontheir deployment and site application, which means they can only replace each other to a limited degree.
87%
73%
56%
40%
0%
20%
40%
60%
80%
100%
120%
2012 2013 2014 2015 2020 2025 2030 2035 2040 2045 2050
%of
CO
2em
issi
ons
in20
12
Current trends
Reference
BAU
40-60%
Max Tech
INDUSTRIAL DECARBONISATION AND ENERGY EFFICIENCY ROADMAPS TO 2050 – CERAMICS
Section 4 - Pathways Page 48 of 90
4.2 Pathways and Scenarios – Introduction and Guide
The pathways development uses evidence gathered, as set out in Section 3, to create a set ofdecarbonisation ‘pathways’, which provide a quantitative component to the roadmap and help inform thestrategic conclusions.
A pathway consists of decarbonisation options deployed over time from 2015 to 2050, as well as a referenceemissions trend. The analysis covers three: ‘scenarios’: with pathways developed under a central trend(‘current trends’ scenario) and alternative future outlooks (‘challenging world’ and ‘collaborative growth’scenarios).
A scenario is a specific set of conditions that could directly or indirectly affect the ability of the sector todecarbonise. Examples of these are: future decarbonisation of the grid, future growth of the sector, futureenergy costs, and future cost of carbon. Since we do not know what the future will look like, using scenariosis a way to test the robustness of the different pathways. A detailed description of these scenarios isprovided in appendix A.
The three generic scenarios were developed, covering a range of parameters. They characterised possibleversions of the future by describing assumptions relating to international consensus; international economiccontext; resource availability and prices; international agreements on climate change; general technicalinnovation; attitude of end consumers to sustainability and energy efficiency; collaboration between sectorsand organisations; and demographics (world outlook). These scenarios were used during the workshop tohelp decide on deployment rate for the different options.
Quantitative parameters were also part of the scenarios, including production outlook (agreed sector-specificview) and DECC supplied Grid CO2 intensity profiles which both impact decarbonisation (assumingproduction and carbon emissions have a linear directly proportional relationship). Other quantitativeparameters within the scenarios governed forward price forecasts and technology deployment.
The purpose of the model that underpins this pathways analysis is to bring together the data captured fromvarious sources and to broadly reflect, using a simple ‘top down’ approach, how emissions might develop to2050. The model is therefore capable of indicating magnitudes of emission reduction that can be achieved,when various technology options are applied, and also how different deployment timings and high-leveleconomic outlooks for a sector might change the results. A sector model was used to create pathways basedon reference emissions and energy consumption in 2012. The model is not intended to give exact resultsand is not of sufficient detail to account for all mass/ energy/ carbon flows, losses and interactions in a sector(i.e. it is not ‘bottom up’ and does not use automatic optimisation techniques).
The methodology is summarised in Figure 16
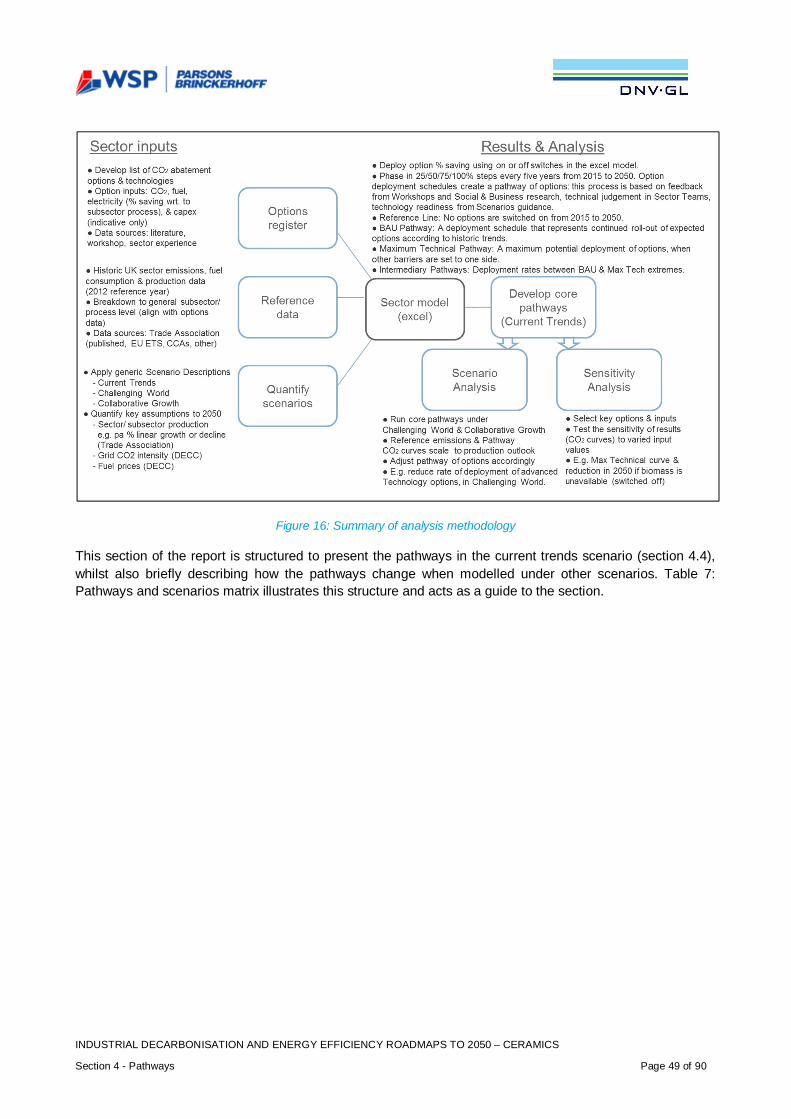
INDUSTRIAL DECARBONISATION AND ENERGY EFFICIENCY ROADMAPS TO 2050 – CERAMICS
Section 4 - Pathways Page 49 of 90
Figure 16: Summary of analysis methodology
This section of the report is structured to present the pathways in the current trends scenario (section 4.4),whilst also briefly describing how the pathways change when modelled under other scenarios. Table 7:Pathways and scenarios matrix illustrates this structure and acts as a guide to the section.
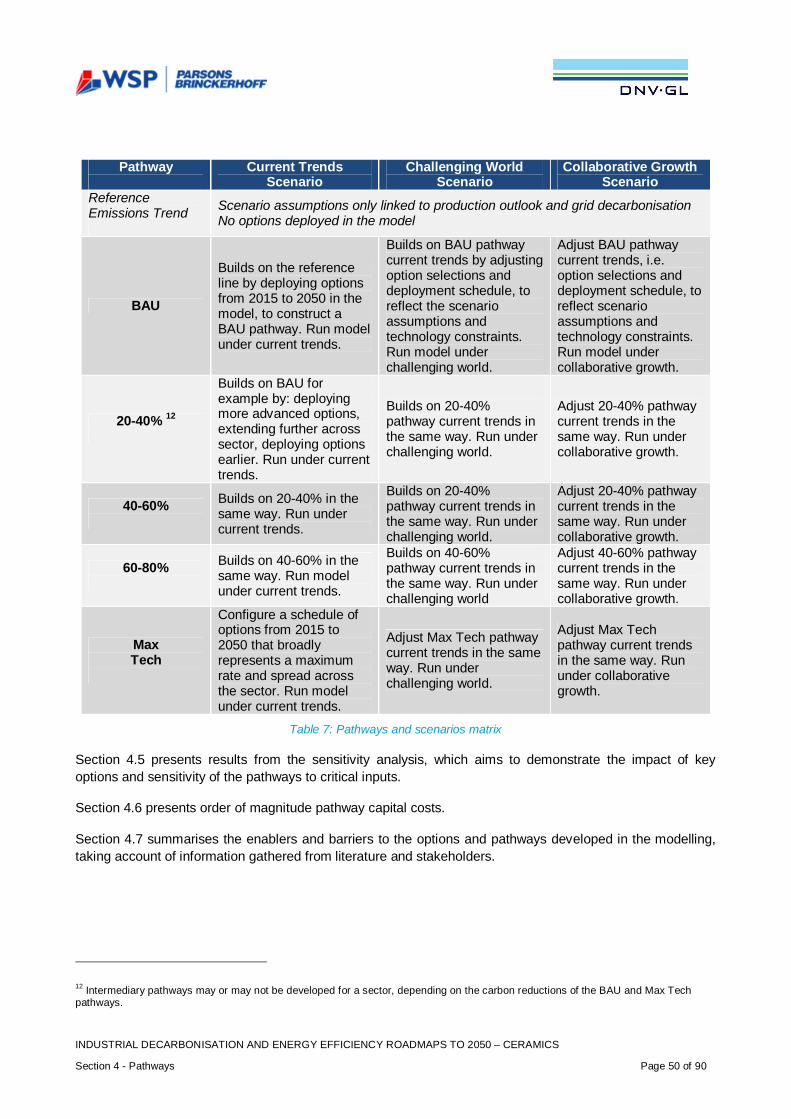
INDUSTRIAL DECARBONISATION AND ENERGY EFFICIENCY ROADMAPS TO 2050 – CERAMICS
Section 4 - Pathways Page 50 of 90
Table 7: Pathways and scenarios matrix
Section 4.5 presents results from the sensitivity analysis, which aims to demonstrate the impact of keyoptions and sensitivity of the pathways to critical inputs.
Section 4.6 presents order of magnitude pathway capital costs.
Section 4.7 summarises the enablers and barriers to the options and pathways developed in the modelling,taking account of information gathered from literature and stakeholders.
12 Intermediary pathways may or may not be developed for a sector, depending on the carbon reductions of the BAU and Max Techpathways.
Pathway Current TrendsScenario
Challenging WorldScenario
Collaborative GrowthScenario
ReferenceEmissions Trend Scenario assumptions only linked to production outlook and grid decarbonisation
No options deployed in the model
BAU
Builds on the referenceline by deploying optionsfrom 2015 to 2050 in themodel, to construct aBAU pathway. Run modelunder current trends.
Builds on BAU pathwaycurrent trends by adjustingoption selections anddeployment schedule, toreflect the scenarioassumptions andtechnology constraints.Run model underchallenging world.
Adjust BAU pathwaycurrent trends, i.e.option selections anddeployment schedule, toreflect scenarioassumptions andtechnology constraints.Run model undercollaborative growth.
20-40% 12
Builds on BAU forexample by: deployingmore advanced options,extending further acrosssector, deploying optionsearlier. Run under currenttrends.
Builds on 20-40%pathway current trends inthe same way. Run underchallenging world.
Adjust 20-40% pathwaycurrent trends in thesame way. Run undercollaborative growth.
40-60% Builds on 20-40% in thesame way. Run undercurrent trends.
Builds on 20-40%pathway current trends inthe same way. Run underchallenging world.
Adjust 20-40% pathwaycurrent trends in thesame way. Run undercollaborative growth.
60-80% Builds on 40-60% in thesame way. Run modelunder current trends.
Builds on 40-60%pathway current trends inthe same way. Run underchallenging world
Adjust 40-60% pathwaycurrent trends in thesame way. Run undercollaborative growth.
MaxTech
Configure a schedule ofoptions from 2015 to2050 that broadlyrepresents a maximumrate and spread acrossthe sector. Run modelunder current trends.
Adjust Max Tech pathwaycurrent trends in the sameway. Run underchallenging world.
Adjust Max Techpathway current trendsin the same way. Rununder collaborativegrowth.
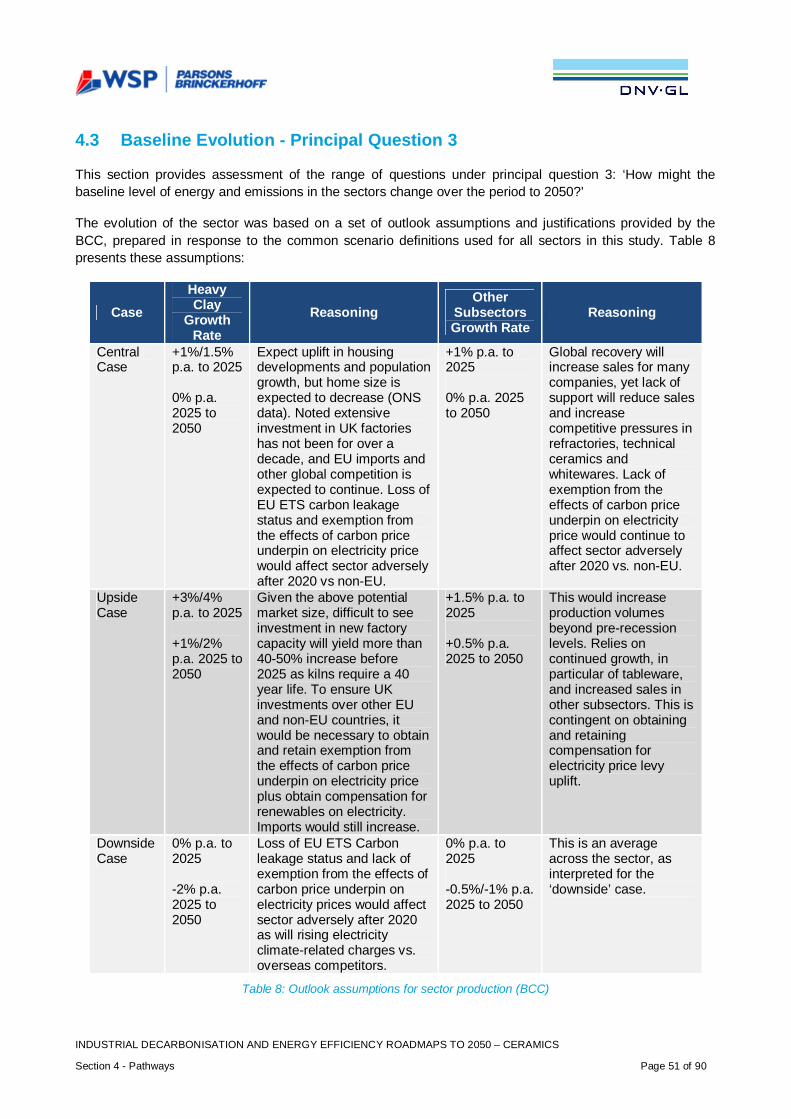
INDUSTRIAL DECARBONISATION AND ENERGY EFFICIENCY ROADMAPS TO 2050 – CERAMICS
Section 4 - Pathways Page 51 of 90
4.3 Baseline Evolution - Principal Question 3
This section provides assessment of the range of questions under principal question 3: ‘How might thebaseline level of energy and emissions in the sectors change over the period to 2050?’
The evolution of the sector was based on a set of outlook assumptions and justifications provided by theBCC, prepared in response to the common scenario definitions used for all sectors in this study. Table 8presents these assumptions:
CaseHeavyClay
GrowthRate
ReasoningOther
SubsectorsGrowth Rate
Reasoning
CentralCase
+1%/1.5%p.a. to 2025
0% p.a.2025 to2050
Expect uplift in housingdevelopments and populationgrowth, but home size isexpected to decrease (ONSdata). Noted extensiveinvestment in UK factorieshas not been for over adecade, and EU imports andother global competition isexpected to continue. Loss ofEU ETS carbon leakagestatus and exemption fromthe effects of carbon priceunderpin on electricity pricewould affect sector adverselyafter 2020 vs non-EU.
+1% p.a. to2025
0% p.a. 2025to 2050
Global recovery willincrease sales for manycompanies, yet lack ofsupport will reduce salesand increasecompetitive pressures inrefractories, technicalceramics andwhitewares. Lack ofexemption from theeffects of carbon priceunderpin on electricityprice would continue toaffect sector adverselyafter 2020 vs. non-EU.
UpsideCase
+3%/4%p.a. to 2025
+1%/2%p.a. 2025 to2050
Given the above potentialmarket size, difficult to seeinvestment in new factorycapacity will yield more than40-50% increase before2025 as kilns require a 40year life. To ensure UKinvestments over other EUand non-EU countries, itwould be necessary to obtainand retain exemption fromthe effects of carbon priceunderpin on electricity priceplus obtain compensation forrenewables on electricity.Imports would still increase.
+1.5% p.a. to2025
+0.5% p.a.2025 to 2050
This would increaseproduction volumesbeyond pre-recessionlevels. Relies oncontinued growth, inparticular of tableware,and increased sales inother subsectors. This iscontingent on obtainingand retainingcompensation forelectricity price levyuplift.
DownsideCase
0% p.a. to2025
-2% p.a.2025 to2050
Loss of EU ETS Carbonleakage status and lack ofexemption from the effects ofcarbon price underpin onelectricity prices would affectsector adversely after 2020as will rising electricityclimate-related charges vs.overseas competitors.
0% p.a. to2025
-0.5%/-1% p.a.2025 to 2050
This is an averageacross the sector, asinterpreted for the‘downside’ case.
Table 8: Outlook assumptions for sector production (BCC)

INDUSTRIAL DECARBONISATION AND ENERGY EFFICIENCY ROADMAPS TO 2050 – CERAMICS
Section 4 - Pathways Page 52 of 90
Based on the above assumptions and together with BCC, we have developed the following growth estimatesfor the different future scenarios, split out for the heavy clay (brick) subsector and the other (refractories,technical ceramics, and whitewares) subsectors.
· Current trends – brick subsector: 1.25% annual growth to 2025 and then 0% to 2050. Othersubsectors: 1% annual growth to 2025, and 0% to 2050.
· Challenging world – brick subsector: 0% to 2025 and then -2% annual decline to 2050. Othersubsectors: 0% to 2025 and -0.75% annual decline to 2050.
· Collaborative growth – brick subsector: 3.5% annual growth to 2025, and then 1.5% annual growthto 2050. Other subsectors: 1.5% annual growth to 2025 and 0.5% annual growth to 2050.
In addition to the growth and decline projections for the different scenarios the following electricity gridemission factors were used in the modelling:
· Current trends: 100g CO2 per kWh by 2030 and 26g CO2 per kWh in 2050· Challenging world: 200g CO2 per kWh by 2030 and 150g CO2 per kWh by 2050· Collaborative growth: 50g CO2 per kWh by 2030 and 25g CO2 per kWh by 2050
DECC forward forecasts for energy costs as detailed in appendix D were also selected to reflect thecircumstances of the scenarios to permit analysis of levelised costs of applying the various options.
The pathways were developed to meet the desired decarbonisation levels based on the current trendsscenario. The deployment of options for current trends was then adjusted when the other scenarios wereapplied to maintain the desired levels of decarbonisation. This typically resulted in a slower rate ofdeployment of options in the challenging world scenario and an increased level of option application in thecollaborative growth scenario.
4.4 Emission-Reduction Potential and Pathway Analysis – PrincipalQuestion 4 and 5
This section provides an assessment of the range of questions under principal questions 4 and 5:
· What is the potential to reduce emissions in these sectors beyond the baseline over the period to2050?
· What emissions pathways might each sector follow over the period to 2050, under differentscenarios?
A detailed description of the pathways development and analysis process is included in appendix A.
The feasibility and cost of decarbonisation in the sector were explored by targeting alternative levels ofdecarbonisation using a series of pathways. Each pathway comprised different degrees of application andtiming of deployment of options. The list of enablers and barriers has informed the list of technical optionsthat are being deployed in the different pathways. They also informed the deployment of the differenttechnical options both with regards to time and degree of deployment.

INDUSTRIAL DECARBONISATION AND ENERGY EFFICIENCY ROADMAPS TO 2050 – CERAMICS
Section 4 - Pathways Page 53 of 90
Figure 17: Reference trends for the different scenarios
For all of the pathways, to calculate the total CO2 reduction of the sector, three key components needed tobe accounted for, namely: the growth or decline of the sector, indirect (emissions from using electricity fromthe electricity grid) and direct emissions. The indirect emissions and growth or decline of the sector areillustrated by the reference trend. In Figure 17, the reference trends for the different scenarios are shown.The shape of the line is linked both to growth or decline of the sector and the different levels ofdecarbonisation of the electricity grid.
4.4.1 Baseline - Business as Usual Pathway
Pathway Summary
The guiding principle for the BAU pathway was to outline a set of decarbonisation and energy savingsoptions that would be expected if current rates of efficiency improvement in the UK ceramic industrycontinued without significant intervention or outside support to decarbonise the sector by 2050. Optionsrequiring no policy intervention, compared to today, and only minor changes within the sector were chosen.
Option Deployment for the Current Trends Scenario
Figure 18 shows the option deployment for the BAU pathway under the current trends scenario. This figureshows the different technical options on the left, with its relevant subsector identifier:
· All: means option is applied across the total sector· B: means option is applied to the heavy clay subsector only· R: means option is applied to the refractories subsector only· T: means option is applied to the technical ceramics subsector only· W: means option is applied to the white wares subsector only
151%
87%
55%
0%
20%
40%
60%
80%
100%
120%
140%
160%
2012 2013 2014 2015 2020 2025 2030 2035 2040 2045 2050
%of
CO
2em
issi
ons
in20
12
Reference trends
Collaborativegrowth
Current trends
Challenging world

INDUSTRIAL DECARBONISATION AND ENERGY EFFICIENCY ROADMAPS TO 2050 – CERAMICS
Section 4 - Pathways Page 54 of 90
The second column categorises the type of investment of each option (incremental, major or disruptive). Thethird and fourth columns are the estimated actual ADOPT in 2012 and the APP for the option. The APPindicates the maximum potential application of this option to the sector, or its relevant subsector. Thebreakdowns within the deployment column refer to the remaining applicability of each option. To the right ofthe APP is the level of additional deployment of the option over time to 2050. Hence an option alreadyadopted at 25% in 2012, with an APP of 65% would have 40% remaining applicability.
The resulting direct CO2 reductions for the option are scaled for its remaining applicability by percentages ineach of the deployment columns. Hence a 50% deployment of our example option for a given five yearperiod would deliver 50% of the remaining 40%, i.e. 20% of its CO2 reductions potential listed in the optionsregister. Few options affect process emissions, but where they do the process emissions reduction areadded to the direct savings in this calculation. Similar calculations are made for the indirect CO2 reductions.
Figure 18: Option deployment for the BAU pathway
In this pathway, the principal options that contribute to emissions reductions in 2050 are:
BAU - current trends
OPTION ADOP. APP.
2014 2015 2020 2025 2030 2035 2040 2045 2050
11% 15% 0% 0% 25% 25% 50% 50% 50% 50% 50%
5% 60% 0% 0% 0% 0% 0% 0% 0% 0% 0%
68% 85% 0% 0% 0% 25% 25% 50% 50% 50% 50%
65% 100% 0% 0% 0% 25% 25% 25% 25% 50% 50%
0% 25% 0% 0% 0% 0% 0% 0% 0% 0% 0%
36% 90% 0% 0% 25% 25% 25% 50% 50% 50% 50%
0% 20% 0% 0% 0% 0% 0% 0% 25% 25% 25%
6% 70% 0% 0% 0% 25% 25% 25% 50% 50% 50%
0% 5% 0% 0% 0% 0% 0% 25% 25% 50% 50%
0% 40% 0% 0% 0% 0% 0% 0% 0% 0% 0%
0% 25% 0% 0% 0% 0% 0% 0% 0% 0% 0%
0% 35% 0% 0% 0% 0% 0% 0% 0% 0% 0%
60% 100% 0% 0% 0% 25% 25% 25% 25% 25% 25%
23% 30% 0% 0% 0% 0% 0% 25% 25% 50% 50%
27% 90% 0% 0% 0% 25% 25% 25% 25% 25% 25%
2% 100% 0% 0% 0% 0% 0% 0% 0% 0% 0%
0% 40% 0% 0% 25% 25% 50% 50% 50% 50% 50%
20% 50% 0% 0% 0% 0% 25% 25% 25% 25% 25%
10% 50% 0% 0% 0% 25% 25% 25% 50% 50% 50%
0% 20% 0% 0% 0% 25% 25% 50% 25% 25% 25%
7% 70% 0% 0% 25% 25% 25% 50% 50% 50% 50%
10% 50% 0% 0% 25% 25% 50% 50% 50% 50% 50%
18% 60% 0% 0% 25% 25% 25% 50% 25% 25% 25%
10% 100% 0% 0% 0% 25% 25% 25% 50% 50% 50%
0% 10% 0% 0% 0% 25% 25% 50% 25% 25% 25%
0% 15% 0% 0% 0% 0% 25% 50% 50% 50% 50%
21% 70% 0% 0% 0% 0% 25% 50% 25% 25% 25%
0% 10% 0% 0% 0% 0% 25% 50% 50% 50% 50%
12% 80% 0% 0% 0% 0% 25% 50% 25% 25% 25%
15% 50% 0% 0% 0% 25% 25% 25% 50% 50% 50%
0% 70% 0% 0% 25% 25% 25% 50% 25% 25% 25%
5% 50% 0% 0% 25% 25% 25% 50% 25% 25% 25%
0% 30% 0% 0% 25% 25% 50% 50% 50% 50% 50%
20% 50% 0% 0% 25% 25% 25% 50% 25% 25% 25%
5% 50% 0% 0% 25% 25% 50% 50% 25% 25% 25%
0% 30% 0% 0% 0% 25% 50% 50% 50% 50% 50%
0% 40% 0% 0% 0% 25% 50% 50% 50% 50% 50%
21% 30% 0% 0% 25% 25% 25% 50% 50% 50% 50%
16% 40% 0% 0% 25% 25% 25% 50% 25% 25% 25%
W: Improve heat captureW: Improve heat useW: Increase pack densityW: Low mass refractory on kiln carsW: Optimisation of kiln circulationW: Reduce number of firingsW: Reduce product weightW: Reduce temperature of processW: Re-use heat regeneratively
R: Pulse firing of kilnsR: Re-use heat regenerativelyT: Adopt available lowest carbon process (BAT, new kilns)T: Extreme condition refractoryT: Improve emissions abatementT: Low mass kiln furnitureT: Reduce number of firingsT: Re-use heat regenerativelyW: Adopt available lowest carbon process (BAT, new kilns)
B: Improve heat use by regenerative processesB: Lighter bricks to reduce firing energyB: Low mass refractory for kiln carsB: Pre-calcining of clayB: Preheat water added for formingB: Reduce air/product mass ratioR: Adopt available lowest carbon process (BAT, new kilns)R: Low mass insulation/ refractoryR: Oxy-fuel firing/ oxygen enrichment
DEPLOYMENT
All: Apply VSD to variable duty pumps/ fansAll: Electric KilnAll: Improve combustion efficiencyAll: Improve control of processAll: Organic Rankine Cycle (ORC) on heat recoveryAll: Reduce radiant, convective and hot gas losses and leakageB: Add biomass to clayB: Adopt available lowest carbon process (BAT, new kilns)B: Avoid firing yellow bricksB: Carbon capture from exhaust gasesB: CHP heat into dryerB: Gasification of biomass

INDUSTRIAL DECARBONISATION AND ENERGY EFFICIENCY ROADMAPS TO 2050 – CERAMICS
Section 4 - Pathways Page 55 of 90
· Adoption of available lowest carbon process: in all four subsectors (heavy clay, refractories,technical ceramics, and white wares). This option refers to the replacement of older kilns with BATkilns at the time of installation. The option is deployed to 50% of remaining applicability in subsectorsby 2040, and the new BAT kiln option collectively (over the four subsectors) accounts for around30% of the total emissions reduction from deployment of options in 2050.
· Reduction of radiant and convective heat losses and leakage: in non-BAT kilns across allsubsectors. This means improved maintenance practice such as using thermal imaging technology,improving the quality of insulation along the kiln, and ensuring kiln walls and gaps are properlysealed, potentially through development and use of advanced insulation technology and the redesignof kiln cars or kiln car seals. This option is deployed to a further 25% of the sector which have notalready adopted the option by 2020 and then 50% by 2035, accounting for 16% of total emissionsreduction from deployment of options in 2050.
· Improving heat use by regenerative processes: in the heavy clay subsector. It is recognised thata good proportion of large tunnel kilns already have sophisticated designs to minimise energy use;note current adoption of heat recovery of kiln cooling air is high for this option. The BAU pathwayassumes a further deployment of heat recovery technology to remaining heavy clay kilns (e.g.recovering kiln drier or exhaust heat), deployed to 25% by 2025, which finally accounts for 11% oftotal emissions reduction from deployment of options in 2050.
· Improving combustion efficiency: in non-BAT kilns across all subsectors. This option consists ofadopting new burner technology, burner optimisation and burner control technology to enhance fuelefficiency. This option, deployed to 50% by 2035 of the remaining sector, accounts for 8% of totalemissions reduction in 2050.
· Low mass refractory for kiln cars; in the heavy clay subsector. This reduces unnecessary thermalmass requiring fuel consumption to heat the kiln cars as they pass through the kiln. Deployment ofthis option at 25% from 2025 contributes about 5% of the pathway emissions reductions by 2050.
· Improved process control in all subsectors; closer monitoring and control of heat-usingprocesses will reduce energy consumption in all subsectors.
· Reduced air/product mass ratio in the heavy clay kilns; increases the productive output of heatand hence reduces fuel consumption per tonne of product.
Figure 19 shows the calculated emissions reduction in MtCO2/yr along the pathway trajectory, split out forthe principal options, illustrating how they contribute to the trend of falling emissions:

INDUSTRIAL DECARBONISATION AND ENERGY EFFICIENCY ROADMAPS TO 2050 – CERAMICS
Section 4 - Pathways Page 56 of 90
Figure 19: Contribution of principal options to the absolute emissions reductions, for the BAU pathway, current trendsscenario
For the current trends scenario, the options deployed in the BAU pathway give an overall reduction of 27% in2050, compared to 2012. This includes the emission reductions linked to the deployment of options anddecarbonisation of the grid. The figure demonstrates that grid decarbonisation, which is a change external tothe sector, contributes over 40% to the overall BAU pathway reduction.
The detailed contribution to the pathway emissions reduction in 2050 by each of the principal options appliedin the sector is shown in Figure 20.
0.0
0.1
0.2
0.3
0.4
0.5
0.6
0.72015 2020 2025 2030 2035 2040 2045 2050
Tota
lem
issi
ons
redu
ctio
n(m
illio
nto
nnes
CO
2)
BAU - current trendsGrid decarbonisation
B: Reduce air/product mass ratio
All: Improve control of process
B: Low mass refractory for kilncars
W: Adopt available lowest carbonprocess (BAT, new kilns)
All: Improve combustionefficiency
B: Improve heat use byregenerative processes
All: Reduce radiant, convectiveand hot gas losses and leakage
B: Adopt available lowest carbonprocess (BAT, new kilns)
Others
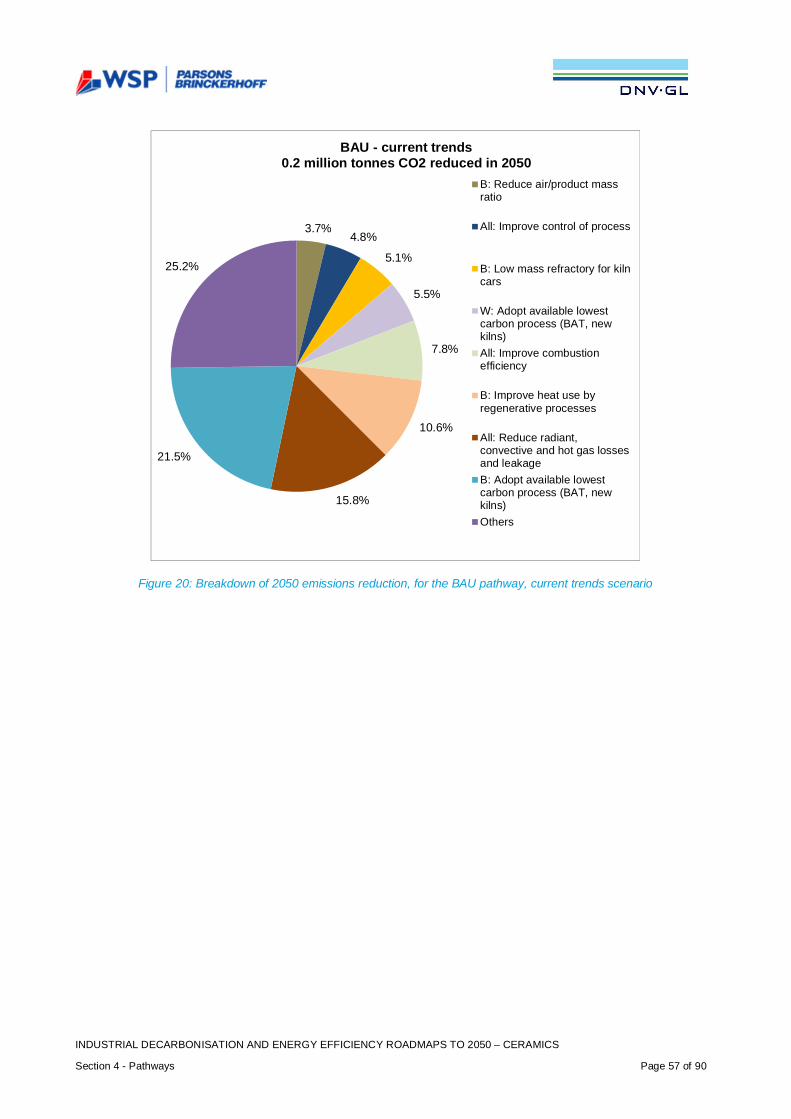
INDUSTRIAL DECARBONISATION AND ENERGY EFFICIENCY ROADMAPS TO 2050 – CERAMICS
Section 4 - Pathways Page 57 of 90
Figure 20: Breakdown of 2050 emissions reduction, for the BAU pathway, current trends scenario
3.7%4.8%
5.1%
5.5%
7.8%
10.6%
15.8%
21.5%
25.2%
BAU - current trends0.2 million tonnes CO2 reduced in 2050
B: Reduce air/product massratio
All: Improve control of process
B: Low mass refractory for kilncars
W: Adopt available lowestcarbon process (BAT, newkilns)All: Improve combustionefficiency
B: Improve heat use byregenerative processes
All: Reduce radiant,convective and hot gas lossesand leakageB: Adopt available lowestcarbon process (BAT, newkilns)Others
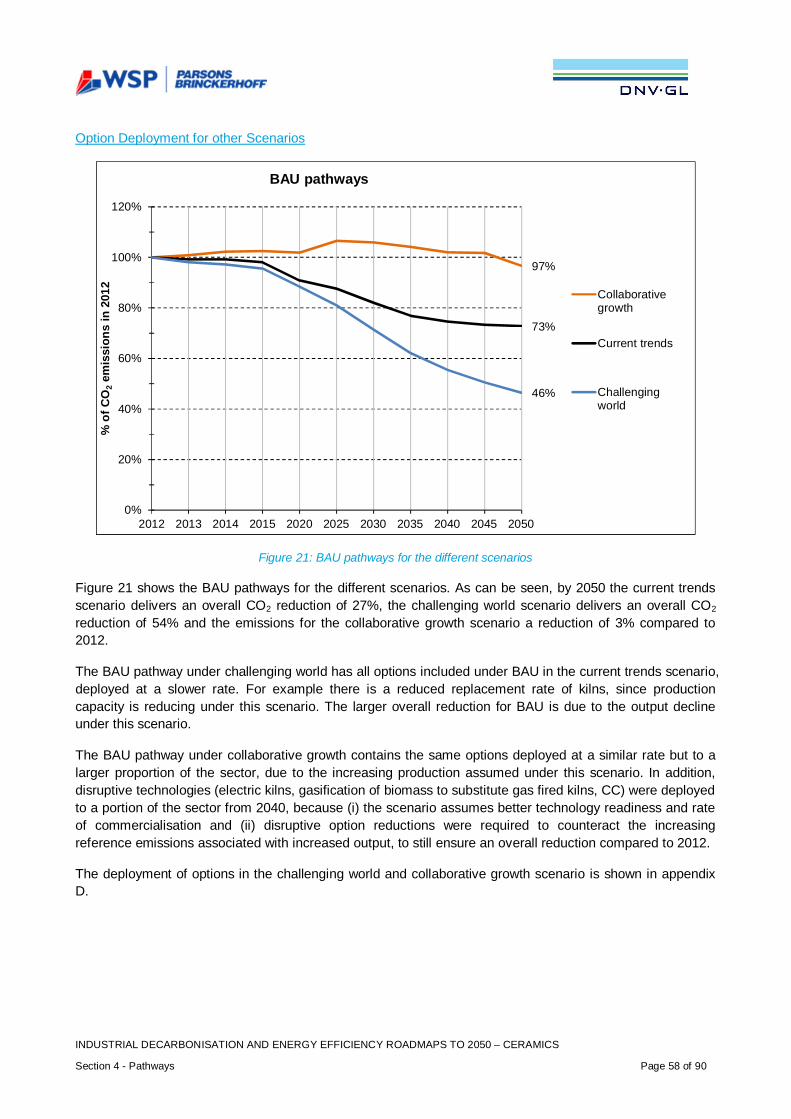
INDUSTRIAL DECARBONISATION AND ENERGY EFFICIENCY ROADMAPS TO 2050 – CERAMICS
Section 4 - Pathways Page 58 of 90
Option Deployment for other Scenarios
Figure 21: BAU pathways for the different scenarios
Figure 21 shows the BAU pathways for the different scenarios. As can be seen, by 2050 the current trendsscenario delivers an overall CO2 reduction of 27%, the challenging world scenario delivers an overall CO2
reduction of 54% and the emissions for the collaborative growth scenario a reduction of 3% compared to2012.
The BAU pathway under challenging world has all options included under BAU in the current trends scenario,deployed at a slower rate. For example there is a reduced replacement rate of kilns, since productioncapacity is reducing under this scenario. The larger overall reduction for BAU is due to the output declineunder this scenario.
The BAU pathway under collaborative growth contains the same options deployed at a similar rate but to alarger proportion of the sector, due to the increasing production assumed under this scenario. In addition,disruptive technologies (electric kilns, gasification of biomass to substitute gas fired kilns, CC) were deployedto a portion of the sector from 2040, because (i) the scenario assumes better technology readiness and rateof commercialisation and (ii) disruptive option reductions were required to counteract the increasingreference emissions associated with increased output, to still ensure an overall reduction compared to 2012.
The deployment of options in the challenging world and collaborative growth scenario is shown in appendixD.
97%
73%
46%
0%
20%
40%
60%
80%
100%
120%
2012 2013 2014 2015 2020 2025 2030 2035 2040 2045 2050
%of
CO
2em
issi
ons
in20
12
BAU pathways
Collaborativegrowth
Current trends
Challengingworld
INDUSTRIAL DECARBONISATION AND ENERGY EFFICIENCY ROADMAPS TO 2050 – CERAMICS
Section 4 - Pathways Page 59 of 90
4.4.2 20-40% CO2 Reduction Pathway
Pathway Summary
The objective of this pathway is to apply modest interventions to achieve a CO2 reduction of 20-40% in 2050.However, as the BAU pathway already achieves a CO2 reduction in the range of 20-40% under currenttrends scenario, no separate pathway was developed for this reduction band.
Option Deployment for other Scenarios
The BAU pathway addresses the option deployment for the 20-40% CO2 reduction pathway in otherscenarios.
The BAU pathway achieves over 40% reduction for the challenging world scenario so no additional 40-60%pathway was developed for that scenario. A 20-40% pathway for the challenging world scenario would beachieved by delaying new investments, such as for new BAT kilns, to reduce the level of decarbonisation.
The deployment of options for the collaborative growth scenario for this pathway is shown in appendix D.
4.4.3 40-60% CO2 Reduction Pathway
Pathway Summary
The intent of this pathway is to apply options more intensively to achieve a reduction in carbon emissions of40-60% in 2050. The options consist of a similar range of incremental and major process retrofits as the BAUpathway, but with an increased rate of kiln replacement with BAT. Disruptive technologies also start to makean impact, introducing electric kilns across the sector, with biomass and CC technologies in part of the heavyclay subsector later in the period to 2050.
Option Deployment for the Current Trends Scenario
Figure 22 shows the option deployment for the 40-60% CO2 reduction pathway for the current trendsscenario.
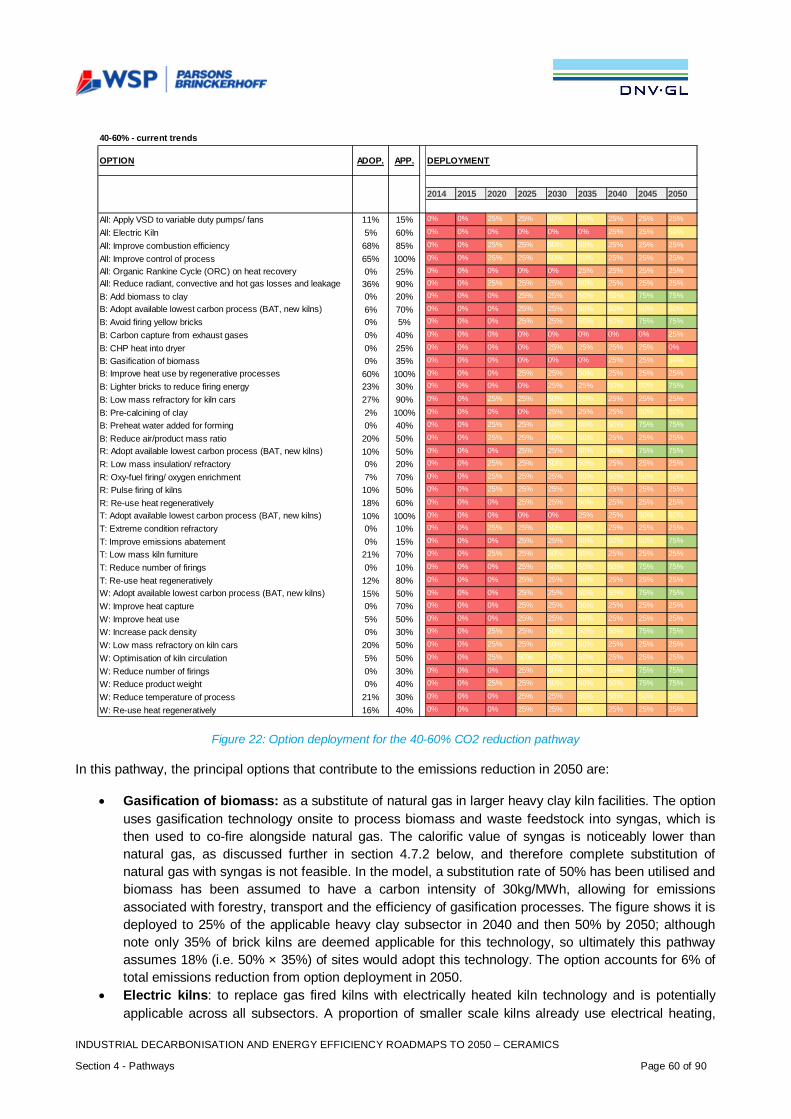
INDUSTRIAL DECARBONISATION AND ENERGY EFFICIENCY ROADMAPS TO 2050 – CERAMICS
Section 4 - Pathways Page 60 of 90
Figure 22: Option deployment for the 40-60% CO2 reduction pathway
In this pathway, the principal options that contribute to the emissions reduction in 2050 are:
· Gasification of biomass: as a substitute of natural gas in larger heavy clay kiln facilities. The optionuses gasification technology onsite to process biomass and waste feedstock into syngas, which isthen used to co-fire alongside natural gas. The calorific value of syngas is noticeably lower thannatural gas, as discussed further in section 4.7.2 below, and therefore complete substitution ofnatural gas with syngas is not feasible. In the model, a substitution rate of 50% has been utilised andbiomass has been assumed to have a carbon intensity of 30kg/MWh, allowing for emissionsassociated with forestry, transport and the efficiency of gasification processes. The figure shows it isdeployed to 25% of the applicable heavy clay subsector in 2040 and then 50% by 2050; althoughnote only 35% of brick kilns are deemed applicable for this technology, so ultimately this pathwayassumes 18% (i.e. 50% × 35%) of sites would adopt this technology. The option accounts for 6% oftotal emissions reduction from option deployment in 2050.
· Electric kilns: to replace gas fired kilns with electrically heated kiln technology and is potentiallyapplicable across all subsectors. A proportion of smaller scale kilns already use electrical heating,
40-60% - current trends
OPTION ADOP. APP.
2014 2015 2020 2025 2030 2035 2040 2045 2050
11% 15% 0% 0% 25% 25% 50% 50% 25% 25% 25%
5% 60% 0% 0% 0% 0% 0% 0% 25% 25% 50%
68% 85% 0% 0% 25% 25% 50% 50% 25% 25% 25%
65% 100% 0% 0% 25% 25% 50% 50% 25% 25% 25%
0% 25% 0% 0% 0% 0% 0% 25% 25% 25% 25%
36% 90% 0% 0% 25% 25% 25% 50% 25% 25% 25%
0% 20% 0% 0% 0% 25% 25% 50% 50% 75% 75%
6% 70% 0% 0% 0% 25% 25% 50% 50% 50% 50%
0% 5% 0% 0% 0% 25% 25% 50% 50% 75% 75%
0% 40% 0% 0% 0% 0% 0% 0% 0% 0% 25%
0% 25% 0% 0% 0% 0% 25% 25% 25% 25% 0%
0% 35% 0% 0% 0% 0% 0% 0% 25% 25% 50%
60% 100% 0% 0% 0% 25% 25% 50% 25% 25% 25%
23% 30% 0% 0% 0% 0% 25% 25% 50% 50% 75%
27% 90% 0% 0% 25% 25% 50% 50% 25% 25% 25%
2% 100% 0% 0% 0% 0% 25% 25% 25% 50% 50%
0% 40% 0% 0% 25% 25% 50% 50% 50% 75% 75%
20% 50% 0% 0% 25% 25% 50% 50% 25% 25% 25%
10% 50% 0% 0% 0% 25% 25% 50% 50% 75% 75%
0% 20% 0% 0% 25% 25% 50% 50% 25% 25% 25%
7% 70% 0% 0% 25% 25% 25% 50% 50% 50% 50%
10% 50% 0% 0% 25% 25% 25% 50% 25% 25% 25%
18% 60% 0% 0% 0% 25% 25% 50% 25% 25% 25%
10% 100% 0% 0% 0% 0% 0% 25% 25% 50% 50%
0% 10% 0% 0% 25% 25% 50% 50% 25% 25% 25%
0% 15% 0% 0% 0% 25% 25% 50% 50% 50% 75%
21% 70% 0% 0% 25% 25% 50% 50% 25% 25% 25%
0% 10% 0% 0% 0% 25% 50% 50% 50% 75% 75%
12% 80% 0% 0% 0% 25% 25% 50% 25% 25% 25%
15% 50% 0% 0% 0% 25% 25% 50% 50% 75% 75%
0% 70% 0% 0% 0% 25% 25% 50% 25% 25% 25%
5% 50% 0% 0% 0% 25% 25% 50% 25% 25% 25%
0% 30% 0% 0% 25% 25% 50% 50% 50% 75% 75%
20% 50% 0% 0% 25% 25% 50% 50% 25% 25% 25%
5% 50% 0% 0% 25% 50% 50% 50% 25% 25% 25%
0% 30% 0% 0% 0% 25% 50% 50% 50% 75% 75%
0% 40% 0% 0% 25% 25% 50% 50% 50% 75% 75%
21% 30% 0% 0% 0% 25% 25% 50% 50% 50% 50%
16% 40% 0% 0% 0% 25% 25% 50% 25% 25% 25%
W: Increase pack densityW: Low mass refractory on kiln carsW: Optimisation of kiln circulationW: Reduce number of firingsW: Reduce product weightW: Reduce temperature of processW: Re-use heat regeneratively
T: Adopt available lowest carbon process (BAT, new kilns)T: Extreme condition refractoryT: Improve emissions abatementT: Low mass kiln furnitureT: Reduce number of firingsT: Re-use heat regenerativelyW: Adopt available lowest carbon process (BAT, new kilns)W: Improve heat captureW: Improve heat use
B: Low mass refractory for kiln carsB: Pre-calcining of clayB: Preheat water added for formingB: Reduce air/product mass ratioR: Adopt available lowest carbon process (BAT, new kilns)R: Low mass insulation/ refractoryR: Oxy-fuel firing/ oxygen enrichmentR: Pulse firing of kilnsR: Re-use heat regeneratively
All: Reduce radiant, convective and hot gas losses and leakageB: Add biomass to clayB: Adopt available lowest carbon process (BAT, new kilns)B: Avoid firing yellow bricksB: Carbon capture from exhaust gasesB: CHP heat into dryerB: Gasification of biomassB: Improve heat use by regenerative processesB: Lighter bricks to reduce firing energy
All: Organic Rankine Cycle (ORC) on heat recovery
All: Apply VSD to variable duty pumps/ fansAll: Electric KilnAll: Improve combustion efficiencyAll: Improve control of process
DEPLOYMENT
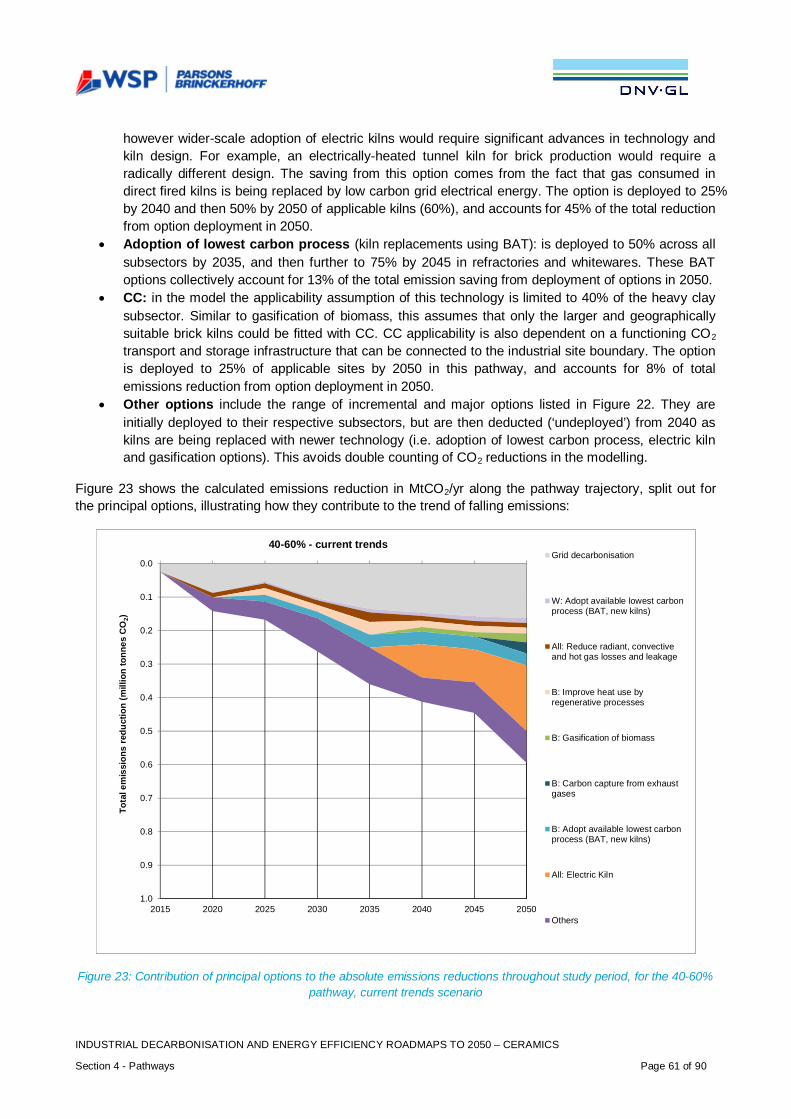
INDUSTRIAL DECARBONISATION AND ENERGY EFFICIENCY ROADMAPS TO 2050 – CERAMICS
Section 4 - Pathways Page 61 of 90
however wider-scale adoption of electric kilns would require significant advances in technology andkiln design. For example, an electrically-heated tunnel kiln for brick production would require aradically different design. The saving from this option comes from the fact that gas consumed indirect fired kilns is being replaced by low carbon grid electrical energy. The option is deployed to 25%by 2040 and then 50% by 2050 of applicable kilns (60%), and accounts for 45% of the total reductionfrom option deployment in 2050.
· Adoption of lowest carbon process (kiln replacements using BAT): is deployed to 50% across allsubsectors by 2035, and then further to 75% by 2045 in refractories and whitewares. These BAToptions collectively account for 13% of the total emission saving from deployment of options in 2050.
· CC: in the model the applicability assumption of this technology is limited to 40% of the heavy claysubsector. Similar to gasification of biomass, this assumes that only the larger and geographicallysuitable brick kilns could be fitted with CC. CC applicability is also dependent on a functioning CO2
transport and storage infrastructure that can be connected to the industrial site boundary. The optionis deployed to 25% of applicable sites by 2050 in this pathway, and accounts for 8% of totalemissions reduction from option deployment in 2050.
· Other options include the range of incremental and major options listed in Figure 22. They areinitially deployed to their respective subsectors, but are then deducted (‘undeployed’) from 2040 askilns are being replaced with newer technology (i.e. adoption of lowest carbon process, electric kilnand gasification options). This avoids double counting of CO2 reductions in the modelling.
Figure 23 shows the calculated emissions reduction in MtCO2/yr along the pathway trajectory, split out forthe principal options, illustrating how they contribute to the trend of falling emissions:
Figure 23: Contribution of principal options to the absolute emissions reductions throughout study period, for the 40-60%pathway, current trends scenario
0.0
0.1
0.2
0.3
0.4
0.5
0.6
0.7
0.8
0.9
1.02015 2020 2025 2030 2035 2040 2045 2050
Tota
lem
issi
ons
redu
ctio
n(m
illio
nto
nnes
CO
2)
40-60% - current trendsGrid decarbonisation
W: Adopt available lowest carbonprocess (BAT, new kilns)
All: Reduce radiant, convectiveand hot gas losses and leakage
B: Improve heat use byregenerative processes
B: Gasification of biomass
B: Carbon capture from exhaustgases
B: Adopt available lowest carbonprocess (BAT, new kilns)
All: Electric Kiln
Others

INDUSTRIAL DECARBONISATION AND ENERGY EFFICIENCY ROADMAPS TO 2050 – CERAMICS
Section 4 - Pathways Page 62 of 90
For the current trends scenario, the options deployed in this pathway give an overall reduction of 44% in2050, compared to 2012. This includes the emission reductions linked to the deployment of options andindirect emissions reduction (electricity grid decarbonisation). The detailed contribution to the pathwayemissions reduction in 2050 by each of the principal options applied in the sector is shown in Figure 24.
Figure 24: Breakdown of 2050 emissions reductions, for the 40-60% CO2 reduction pathway, current trends scenario
Option Deployment for other Scenarios
The 40-60% CO2 reduction pathway when run under the collaborative growth scenario falls into the 0%-20%CO2 reduction band with a reduction of 18% in 2050 compared to 2012.Under this scenario, it was assumedthat option investments and kiln replacements would be accelerated and the deployment of disruptivetechnologies increased, with particular contributions coming from electric kilns (making use of the low carbonelectricity as fuel substitution).
The deployment of options for the collaborative growth scenarios for this pathway is shown in appendix D.
4.4.4 Maximum Technical Pathway
Pathway Summary
The guiding principle for the Max Tech pathway is to select a combination of carbon abatement options andenergy savings that are both highly ambitious but also reasonably foreseeable. It is designed to investigatewhat might be technically possible when uncertain barriers, such as cost and availability of externalresources (for example delivering additional power, supplying biomass feedstock or removing captured CO2
from sites) are set to one side.
3.2% 3.3%4.1%
6.0%
7.7%
8.2%
45.4%
22.0%
40-60% - current trends0.4 million tonnes CO2 reduced in 2050
W: Adopt available lowest carbonprocess (BAT, new kilns)
All: Reduce radiant, convectiveand hot gas losses and leakage
B: Improve heat use byregenerative processes
B: Gasification of biomass
B: Carbon capture from exhaustgases
B: Adopt available lowest carbonprocess (BAT, new kilns)
All: Electric Kiln
Others
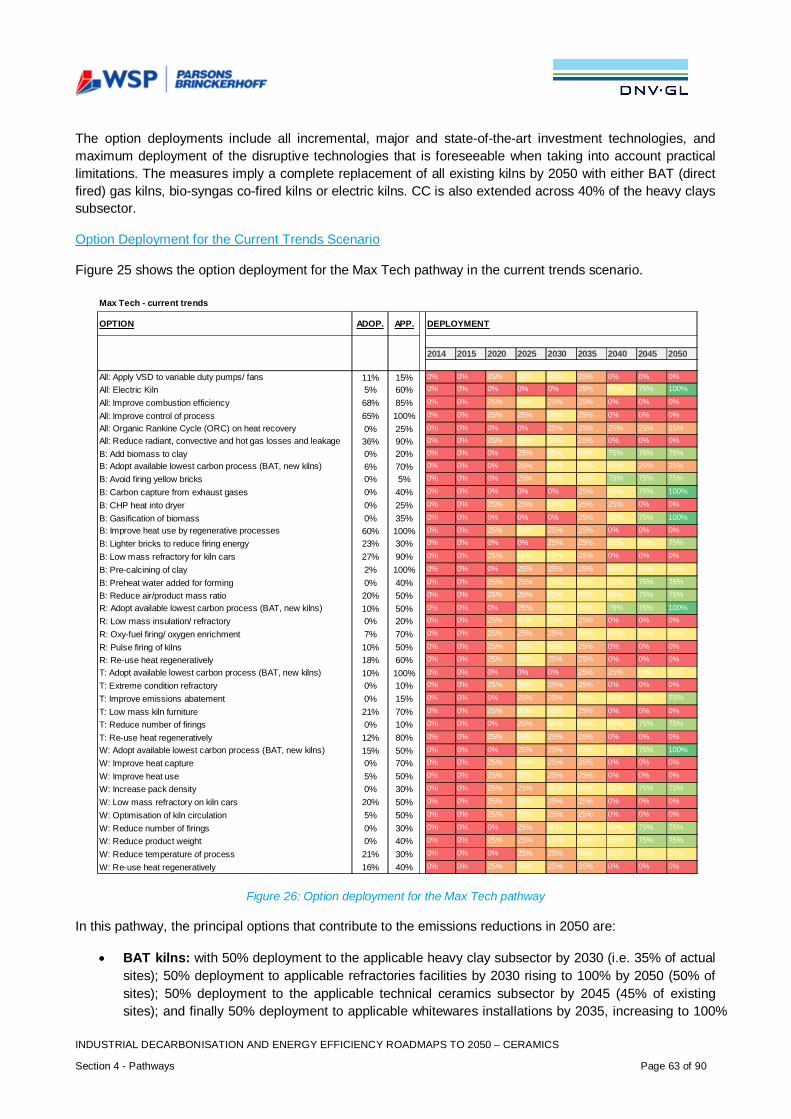
INDUSTRIAL DECARBONISATION AND ENERGY EFFICIENCY ROADMAPS TO 2050 – CERAMICS
Section 4 - Pathways Page 63 of 90
The option deployments include all incremental, major and state-of-the-art investment technologies, andmaximum deployment of the disruptive technologies that is foreseeable when taking into account practicallimitations. The measures imply a complete replacement of all existing kilns by 2050 with either BAT (directfired) gas kilns, bio-syngas co-fired kilns or electric kilns. CC is also extended across 40% of the heavy clayssubsector.
Option Deployment for the Current Trends Scenario
Figure 25 shows the option deployment for the Max Tech pathway in the current trends scenario.
Figure 26: Option deployment for the Max Tech pathway
In this pathway, the principal options that contribute to the emissions reductions in 2050 are:
· BAT kilns: with 50% deployment to the applicable heavy clay subsector by 2030 (i.e. 35% of actualsites); 50% deployment to applicable refractories facilities by 2030 rising to 100% by 2050 (50% ofsites); 50% deployment to the applicable technical ceramics subsector by 2045 (45% of existingsites); and finally 50% deployment to applicable whitewares installations by 2035, increasing to 100%
Max Tech - current trends
OPTION ADOP. APP.
2014 2015 2020 2025 2030 2035 2040 2045 2050
11% 15% 0% 0% 25% 50% 50% 25% 0% 0% 0%
5% 60% 0% 0% 0% 0% 0% 25% 50% 75% 100%
68% 85% 0% 0% 25% 50% 25% 25% 0% 0% 0%
65% 100% 0% 0% 25% 25% 50% 25% 0% 0% 0%
0% 25% 0% 0% 0% 0% 25% 25% 25% 25% 25%
36% 90% 0% 0% 25% 50% 50% 25% 0% 0% 0%
0% 20% 0% 0% 0% 25% 50% 50% 75% 75% 75%
6% 70% 0% 0% 0% 25% 50% 50% 50% 25% 25%
0% 5% 0% 0% 0% 25% 50% 50% 75% 75% 75%
0% 40% 0% 0% 0% 0% 0% 25% 50% 75% 100%
0% 25% 0% 0% 25% 25% 50% 25% 25% 0% 0%
0% 35% 0% 0% 0% 0% 0% 25% 50% 75% 100%
60% 100% 0% 0% 25% 50% 25% 25% 0% 0% 0%
23% 30% 0% 0% 0% 0% 25% 25% 50% 50% 75%
27% 90% 0% 0% 25% 50% 50% 25% 0% 0% 0%
2% 100% 0% 0% 0% 25% 25% 25% 50% 50% 50%
0% 40% 0% 0% 25% 25% 50% 50% 50% 75% 75%
20% 50% 0% 0% 25% 25% 50% 50% 50% 75% 75%
10% 50% 0% 0% 0% 25% 50% 50% 75% 75% 100%
0% 20% 0% 0% 25% 50% 50% 25% 0% 0% 0%
7% 70% 0% 0% 25% 25% 25% 50% 50% 50% 50%
10% 50% 0% 0% 25% 50% 50% 25% 0% 0% 0%
18% 60% 0% 0% 25% 50% 25% 25% 0% 0% 0%
10% 100% 0% 0% 0% 0% 0% 25% 25% 50% 50%
0% 10% 0% 0% 25% 50% 25% 25% 0% 0% 0%
0% 15% 0% 0% 0% 25% 25% 50% 50% 50% 75%
21% 70% 0% 0% 25% 50% 50% 25% 0% 0% 0%
0% 10% 0% 0% 0% 25% 50% 50% 50% 75% 75%
12% 80% 0% 0% 25% 50% 25% 25% 0% 0% 0%
15% 50% 0% 0% 0% 25% 25% 50% 50% 75% 100%
0% 70% 0% 0% 25% 50% 25% 25% 0% 0% 0%
5% 50% 0% 0% 25% 50% 25% 25% 0% 0% 0%
0% 30% 0% 0% 25% 25% 50% 50% 50% 75% 75%
20% 50% 0% 0% 25% 50% 25% 25% 0% 0% 0%
5% 50% 0% 0% 25% 50% 25% 25% 0% 0% 0%
0% 30% 0% 0% 0% 25% 50% 50% 50% 75% 75%
0% 40% 0% 0% 25% 25% 50% 50% 50% 75% 75%
21% 30% 0% 0% 0% 25% 25% 50% 50% 50% 50%
16% 40% 0% 0% 25% 50% 25% 25% 0% 0% 0%
W: Increase pack densityW: Low mass refractory on kiln carsW: Optimisation of kiln circulationW: Reduce number of firingsW: Reduce product weightW: Reduce temperature of processW: Re-use heat regeneratively
T: Adopt available lowest carbon process (BAT, new kilns)T: Extreme condition refractoryT: Improve emissions abatementT: Low mass kiln furnitureT: Reduce number of firingsT: Re-use heat regenerativelyW: Adopt available lowest carbon process (BAT, new kilns)W: Improve heat captureW: Improve heat use
B: Low mass refractory for kiln carsB: Pre-calcining of clayB: Preheat water added for formingB: Reduce air/product mass ratioR: Adopt available lowest carbon process (BAT, new kilns)R: Low mass insulation/ refractoryR: Oxy-fuel firing/ oxygen enrichmentR: Pulse firing of kilnsR: Re-use heat regeneratively
All: Reduce radiant, convective and hot gas losses and leakageB: Add biomass to clayB: Adopt available lowest carbon process (BAT, new kilns)B: Avoid firing yellow bricksB: Carbon capture from exhaust gasesB: CHP heat into dryerB: Gasification of biomassB: Improve heat use by regenerative processesB: Lighter bricks to reduce firing energy
All: Apply VSD to variable duty pumps/ fansAll: Electric KilnAll: Improve combustion efficiencyAll: Improve control of processAll: Organic Rankine Cycle (ORC) on heat recovery
DEPLOYMENT

INDUSTRIAL DECARBONISATION AND ENERGY EFFICIENCY ROADMAPS TO 2050 – CERAMICS
Section 4 - Pathways Page 64 of 90
by 2050 (which is 50% of existing whitewares sites). The sum across these four subsectors accountsfor 8% of the total emissions reduction from deployment of options in 2050.
· Electric kilns: are rapidly deployed in steps from 25% in 2035 up to 100% in 2050. This implies thatall applicable kilns (60% of total) are electric by 2050. Although electric kilns are seen to bechallenging for large heavy clays units, the technology is assumed to have been widely developed inthe pathway; given it is the Max Tech case. Also, the main impetus for investment andcommercialisation of electric kiln technology in the analysis is due to the grid decarbonisationassumption in the scenario modelling. The option accounts for 41% of total emissions reduction fromoption deployment in 2050.
· Carbon Capture: is deployed on a similar schedule from 25% up to 100% by 2050 to applicablekilns in the heavy clay subsector. This implies that 40% of actual heavy clay sites would be fitted withCC; with main limiting constraints being that only larger sites might be economically suitable andhave access to CO2 transport and storage infrastructure. It should be noted that CC is the onlyoption in the model assumed to abate process emissions (as well as fuel emissions). The optionaccounts 23% of total emissions reduction from option deployment in 2050.
· Gasification of biomass onsite: is also deployed to 25% and then up to 100% by 2050. Theapplicability assumption of this option is 35% of the heavy clay subsector, implying that around athird of heavy clay sites might adopt this technology under the Max Tech pathway. Similar to CC, thelimiting factors might be the size of facility at which this option might prove economic, and alsosystem level constraints such as availability of biomass feedstock in the UK. The option accounts for11% of total emissions reduction from option deployment in 2050.
Figure 27 shows the calculated emissions reduction in MtCO2/yr along the pathway trajectory, split out forthe principal options, illustrating how they contribute to the trend of falling emissions:

INDUSTRIAL DECARBONISATION AND ENERGY EFFICIENCY ROADMAPS TO 2050 – CERAMICS
Section 4 - Pathways Page 65 of 90
Figure 27: Contribution of principal options to decarbonisation throughout the study period, for the Max Tech pathway,current trends scenario
For the current trends scenario, the options deployed in this pathway give an overall reduction of 60% in2050, compared to 2012. As shown in Figure 27 grid decarbonisation contributes significantly to this overallreduction result as well as the direct reduction from deployment of options.
The level of reduction achieved in the Max Tech pathway may be considered to be lower than expected.However the ceramic sector has substantial process emissions, representing over 20% of total CO2
emissions. These are not reduced by energy efficiency options and are only affected by technical optionsthat reduce product weight or by CC. These options have restricted maximum impact due the properties ofthe raw materials, the small scale of the installations, the dilution of CO2 in exhaust streams and their widegeographical distribution.
The detailed contribution to the pathway emissions reduction in 2050 by each of the principal options appliedin the sector is shown in Figure 28
0.0
0.1
0.2
0.3
0.4
0.5
0.6
0.7
0.8
0.9
1.02015 2020 2025 2030 2035 2040 2045 2050
Tota
lem
issi
ons
redu
ctio
n(m
illio
nto
nnes
CO
2)
Max Tech - current trends
Grid decarbonisation
B: Gasification of biomass
B: Carbon capture from exhaustgases
All: Electric Kiln
Others
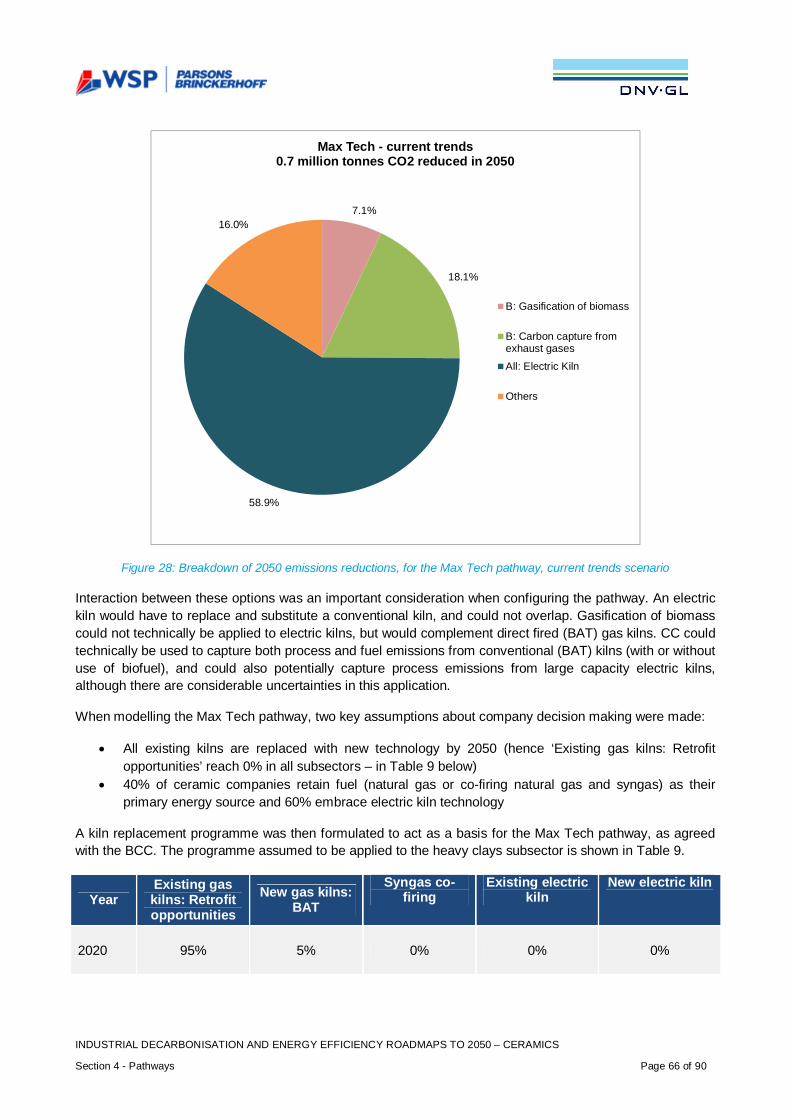
INDUSTRIAL DECARBONISATION AND ENERGY EFFICIENCY ROADMAPS TO 2050 – CERAMICS
Section 4 - Pathways Page 66 of 90
Figure 28: Breakdown of 2050 emissions reductions, for the Max Tech pathway, current trends scenario
Interaction between these options was an important consideration when configuring the pathway. An electrickiln would have to replace and substitute a conventional kiln, and could not overlap. Gasification of biomasscould not technically be applied to electric kilns, but would complement direct fired (BAT) gas kilns. CC couldtechnically be used to capture both process and fuel emissions from conventional (BAT) kilns (with or withoutuse of biofuel), and could also potentially capture process emissions from large capacity electric kilns,although there are considerable uncertainties in this application.
When modelling the Max Tech pathway, two key assumptions about company decision making were made:
· All existing kilns are replaced with new technology by 2050 (hence ‘Existing gas kilns: Retrofitopportunities’ reach 0% in all subsectors – in Table 9 below)
· 40% of ceramic companies retain fuel (natural gas or co-firing natural gas and syngas) as theirprimary energy source and 60% embrace electric kiln technology
A kiln replacement programme was then formulated to act as a basis for the Max Tech pathway, as agreedwith the BCC. The programme assumed to be applied to the heavy clays subsector is shown in Table 9.
YearExisting gaskilns: Retrofitopportunities
New gas kilns:BAT
Syngas co-firing
Existing electrickiln
New electric kiln
2020 95% 5% 0% 0% 0%
7.1%
18.1%
58.9%
16.0%
Max Tech - current trends0.7 million tonnes CO2 reduced in 2050
B: Gasification of biomass
B: Carbon capture fromexhaust gases
All: Electric Kiln
Others

INDUSTRIAL DECARBONISATION AND ENERGY EFFICIENCY ROADMAPS TO 2050 – CERAMICS
Section 4 - Pathways Page 67 of 90
2030 60% 40% 0% 0% 0%
2040 20% 30% 20% 0% 30%
2050 0% 5% 35% 0% 60%
Table 9: Kiln replacement programme for heavy clay subsector, as a basis for the Max Tech pathway
Retrofit options are assumed to be the option of choice from 2020-2030 but from 2040 onwards the numberof retrofits drop as new kilns are installed. New gas BAT kilns will be installed rapidly in the lead up to 2030then the rate of new installations will slow, but the number of new installations will continue to rise overall.Simultaneously, some of the new kilns will have syngas retrofitted from 2030 onwards. The use of syngasco-firing was assumed to increase between 2030 and 2050. 60% of kilns were assumed to be electric by2050, but with deployment starting after 2030.
Option Deployment for other Scenarios
Figure 29: Max Tech pathways for the different scenarios
Figure 29 shows the Max Tech pathways for the different scenarios. As can be seen both the current trendsand challenging world scenarios deliver a CO2 reduction of 60%, while the collaborative growth scenariodelivers CO2 reduction of 35% compared to 2012.
For the challenging world scenario, short and medium-term investments that extend known solutions andprocess improvements are delayed by five years and Major plant replacements are also reduced.Deployment of electric kilns was reduced because grid decarbonisation is not as ambitious and effective
65%
40%
0%
20%
40%
60%
80%
100%
120%
2012 2013 2014 2015 2020 2025 2030 2035 2040 2045 2050
%of
CO
2em
issi
ons
in20
12
Max Tech pathways
Collaborativegrowth
Current trends
Challengingworld

INDUSTRIAL DECARBONISATION AND ENERGY EFFICIENCY ROADMAPS TO 2050 – CERAMICS
Section 4 - Pathways Page 68 of 90
under this scenario. CC and gasification of biomass are deployed to their maximum potential by 2050,ensuring a total reduction of CO2 emissions for this pathway remains at 60% in 2050 compared to 2012.
In the collaborative growth scenario, the Max Tech pathway just reaches the 40-60% CO2 reduction band.The total reduction of CO2 emissions for this scenario is 41% in 2050 compared to 2012. In this scenario, theoptions and deployment rate are the same as the current trends case already discussed. Since the keyoptions for electric kilns and driers in heavy clay, large scale application of CC and gasification of biomassare already deployed to the maximum level considered feasible by BCC, the shortfall in CO2 reduction in thisscenario could not be reduced.
The deployment of options for the challenging world and collaborative growth scenarios for this pathway isshown in appendix D.
4.5 Sensitivity Analysis
A set of sensitivities were run in the model to test the significance of key options on pathway outcomes andto highlight their importance in defining potential actions. All these cases were run in the current trendsscenario to explore their impact in the base case.
First, the pathways were re-run with a reduced rate of deployment of best available kiln technology withdeployment only to 25% in 2030. The sensitivity resulted in the 40-60% and Max Tech pathways performingworse in the medium term from 2025 to 2035, but regaining a similar reduction in the long term towards 2050.This is because the disruptive options (electric kilns, biomass gasification and CC) make larger reductionsfrom 2040 onwards. Only in the case of the BAU pathway was final sector saving in 2050 degraded.However the impact was small, being only a reduction of around 2%. This shows that BAT kiln replacementdoes not significantly affect the pathway outcomes in 2050, although a reduction of the deployment of thisoption would delay decarbonisation of all pathways.
Secondly, the pathways were run with no additional deployment of electric kilns, particularly into the heavyclay subsector. The results showed a significant impact on the 40-60% pathway (12% less reduction by 2050)and the Max Tech pathway (23% less carbon saving by 2050); although there was no change for BAU. Thismoved the Max Tech pathway down by two reduction bands, i.e. from 60-80% to 20-40%. Since thealternative options for large scale reduction of CC and gasification of biomass were already deployed to themaximum level considered feasible by BCC, this impact could not be corrected. This sensitivity demonstratesthe significant importance of large scale electric kilns to the more ambitious decarbonisation and energyefficiency pathways.
Thirdly a sensitivity was run to test the influence of reduction coming from biomass substitution options; i.e.no deployment of gasification of biomass onsite, across all pathways
The results showed lower long-term reductions in the period 2040-2050 for the 40-60% and Max Techpathways; with 2% less overall reduction for 40-60% and 3% less for Max Tech pathway in 2050. Theoptions that would be available to restore this lost reduction in the sector would be the increased applicationof large electric scale kilns or CC in the heavy clay subsector. However these two technologies are mutuallyexclusive, operating on different kiln types, so that they cannot be applied further.
Finally 0% deployment of CC to the heavy clay subsector was run in the model across all pathways. TheMax Tech pathway reduction was cut by 8%, resulting in 52% CO2 saving compared to 2012, moving theMax Tech pathway into a lower reduction band. The 40-60% pathway saving moved down by 2% in 2050and the BAU was unaffected. Again, the alternative large impact options are already deployed to themaximum feasible extent in this pathway so the adverse impact of removing CC cannot be restored.
INDUSTRIAL DECARBONISATION AND ENERGY EFFICIENCY ROADMAPS TO 2050 – CERAMICS
Section 4 - Pathways Page 69 of 90
The main conclusion of the sensitivity analysis is that the application of electric kilns across the sector is themost critical option to delivering the maximum reduction in carbon emissions by the ceramic sector, thesecond being CC in the heavy clay subsector, with the use of gasified biomass also contributing. Theseoptions each have restrictions on their application which means they can only replace each other to a limiteddegree.
The implications of the pathways analysis and these sensitivity findings are that the higher CO2 reductionpathways all depend upon novel, disruptive technologies to achieve the desired results. This finding lendssignificance to the potential actions necessary to overcome the barriers to implement these essentialtechnologies.
All resulting graphs and pathway curves for these sensitivity tests can be referred in appendix D.
In the option interaction calculation, the ‘no interaction’ case adds approximately 5% to the carbon reductionin 2050 in the Max Tech pathway.
4.6 Pathway Costs
4.6.1 Introduction
Estimates of the costs of new technologies and/or capital improvements with a time horizon to 2050 isfraught with difficulties; any long term forecasts should be treated with caution. The cost analysis presentedin this report is intended to provide a high level estimate of the total capital cost of each pathway to the UKas a whole, in a form which is consistent with the government’s approach to assessing the relative capitalcosts of alternative decarbonisation options from a social perspective13. It is based on an analysis of ‘order ofmagnitude’ option capital costs. The purpose of developing and presenting this cost analysis is to provide anindication of the capital costs for the pathways, which could form a basis for further work.
In gathering capital cost-related data, literature and/or engagement with stakeholders were used to establishan initial dataset for use in the cost analysis assessment. Operating costs such as energy use changes,energy costs and labour are not included in this analysis, although we recognise that operating costsresulting from the decarbonisation pathways will have a major impact any economic assessment. Forexample some options (e.g. CC and electrification of firing) greatly increase energy use and/or operatingcosts of a process plant.
4.6.2 Calculation of Pathway Costs
The pathway costs and CO2 reductions are measured with respect to the reference trend, i.e. they arecalculated as the difference between costs and emissions under the decarbonisation pathway and thoseunder the reference trend. This means the costs represent the additional capital costs for the pathwaycompared to a future in which there was no deployment of options. The pathway costs have been assembledfrom the estimated costs of the combination of decarbonisation and energy efficiency options, in accordancewith each carbon reduction pathway including the selected deployment rates of each option. Themethodology for calculating the total discounted capital costs which produce the CO2 reductions for eachpathway can be summarised as follows:
13
https://www.gov.uk/government/uploads/system/uploads/attachment_data/file/360316/20141001_2014_DECC_HMT_Supplementary_Appraisal_Guidance.pdf
INDUSTRIAL DECARBONISATION AND ENERGY EFFICIENCY ROADMAPS TO 2050 – CERAMICS
Section 4 - Pathways Page 70 of 90
1. Capital costs of deployment for each decarbonisation and energy efficiency option are calculatedbased on the order of magnitude capital costs to deploy that option at one site (or installation or unitof equipment). This is then deployed to the applicable number of sites (or installations or units ofequipment) for the (sub) sector in the pathway as defined by the model.
2. Capital costs reflect the additional cost of delivering the CO2 and/or energy reduction optionscompared to continuing production without deploying the options. For a number of major investmentoptions, including replacement of life-expired assets with BAT (for a list of options in this categorysee appendix C), only a proportion of the cost is assumed to be attributed to CO2 emission or energyreduction, as a significant factor for the investment in this case would be to replace retiringproduction capacity and to recognise that options may be implemented for reasons other thandecarbonisation / energy efficiency. In the absence of detailed information this proportion (attributedto the capital cost calculation in this analysis) is assumed to be 50%. For all other technology optionsthe entire capital cost (i.e. 100%) is attributed to energy / carbon reduction. Capital costs are appliedat the year of each deployment step (as modelled in the carbon reduction pathways), and adjusted incases where the asset life defined in the option register would extend beyond 2050 to reflect theirresidual value on a linear depreciation basis.
3. The annual capital expenditure of each pathway is calculated from the capital cost and deploymentof each of the options selected. Capital costs are presented in present day value (i.e. 2015) andassumed to remain constant throughout the period. The discount rate for costs has been chosen tobe 3.5% to value the costs from a social perspective and in accordance with standard HM Treasurymethodology for this type of assessment. In other words, all proposed capital expenditure on thevarious pathways are adjusted for the time value of money, so costs (which occur at different pointsin time) are expressed on a common basis in terms of their ‘net present value’ using the discountrate of 3.5%. The effect of this standard methodology is to reduce the apparent cost of largeinvestments that are deployed in the pathways later in the study period.
The following specific assumptions apply:
i. Asset replacement is assumed to take place at end of the life of an existing asset. No allowancehas been made for loss of production during the shutdown period associated with theimplementation of major and/or disruptive technology options. Similarly no allowance has beenmade for loss of EU ETS allowances or civil works associated with a major shutdowns and plantrebuilds. Although costs may be incurred in a case where a plant is written off before the end ofits life, this has not been taken into account in this analysis.
ii. It has been assumed that minor incremental improvements would be implemented in the shadowof other rebuild or maintenance work so that no additional costs for shutdown would be incurred.
iii. No allowance has been made for the costs of innovation and it is assumed that the costs ofdevelopment of breakthrough technologies would be funded separately and not be charged tosubsequent capital investments. Technology licensing costs are assumed to be included in thecapital costs.
iv. No carbon price or other policy costs are included in the calculations.v. Changes in other operating costs including labour, maintenance or consumables associated with
the deployment of options have not been included (although it is noted these will be significantfor many options).
vi. This analysis covers capital costs for carbon reduction; changes to energy use and energy costs(as a result of deployment of the options) has not been quantitatively included although it will besignificant for many options.

INDUSTRIAL DECARBONISATION AND ENERGY EFFICIENCY ROADMAPS TO 2050 – CERAMICS
Section 4 - Pathways Page 71 of 90
4.6.3 Limitations
The project methodology for cost data collection and validation did not deliver a complete dataset for thecapital cost of options, and where data was available, it was qualified at low confidence levels. Further,estimates based on expert judgement have been made where data gaps remained. Also, the degree ofstakeholder engagement in relation to this cost analysis was lower than for the carbon reduction pathways.
All costs in the data input tables are subject to wide variation, for example between sites and sub-sectorsand for technology options that have not been demonstrated at commercial scale. Hence, the cost datarepresent ‘order of magnitude’ estimates that require extensive further development and validation prior toany further use, including with sector stakeholders.
Moreover, the assumptions and constraints on confidence levels limit the valid uses for the results of thiscost analysis, therefore the following applies to use of this analysis:
· The values are a starting point to help assess relative benefits of different technologies over the longterm.
· The cost analysis results should not be used in isolation to compare decarbonisation technologies ordecide on priorities for their development – additional techno-economic analysis should be carriedout on individual options or groups of options.
· The cost analysis is part of a process of research and exploration and is being shared in atransparent way to support the development of broader strategy. The results are effectivelyprovisional order of magnitude estimates which need to be developed further on the basis ofthorough research before they can be used to inform decisions.
4.6.4 Cost Analysis Results
The results of the cost analysis of decarbonisation for the various pathways within the current trendsscenario are summarised in Table 10 below.
Results can be used for relative comparison between pathways in a sector. No cost moderation processbetween the eight sectors has been carried out and therefore in the absence of further data validation andanalysis comparison between sectors is not recommended.
The CO2 emission abatement offered by each pathway has been totalled for each year to present acumulative carbon abatement figure for the period from 2013-2050 compared to the reference pathway.
Although this analysis of discounted capital cost does not include energy costs, it should be noted thatenergy cost changes will be subject to the uncertainties of future energy cost projections and the significantdivergence between energy costs applicable to the different levels of energy consumption. A high levelqualitative assessment of the impact of energy use and cost is presented in the table below.

INDUSTRIAL DECARBONISATION AND ENERGY EFFICIENCY ROADMAPS TO 2050 – CERAMICS
Section 4 - Pathways Page 72 of 90
Pathway Total Discounted CapitalCost 2013-2050 £m14
Cumulative Carbon DioxideAbated 2013-2050 (MtCO2)15
Projected Impact on Fuel /Energy use and Fuel / Energy
cost
BAU 300 4.1 This pathway includes deploymentof options that increase overall
energy efficiency and reduce overallfuel use. In the study period from2013 – 2050, this pathway wouldresult in a substantial saving in
energy and fuel used. The projectedvalue of this saving will depend on
the fuel cost forecast adopted.
40-60% 500 5.7 The increase in fuel costs from thesubstitution of natural gas with
electricity for electric kilns is off-setby the reduced cost of natural gas
consumption from energy efficiencymeasures. The overall net effectdepends on the fuel cost forecast
adopted.
Max Tech 700 8.1 The main characteristic of thispathway is a very significant
transfer of energy use from naturalgas to electricity resulting in a
projected large overall increase inenergy use and costs. The scale ofthe increased cost will depend on
the fuel cost forecast adopted.
Table 10 Summary costs and impacts of decarbonisation for the pathways
4.7 Implications of Enablers and Barriers
From the pathways described above, there are a number of options or groups of options that will makesignificant contributions to decarbonisation under some or all of the pathways and scenarios. These are:
· Adopt lowest carbon process (BAT kilns)· Gasification of biomass· Large scale electric kilns· CC from exhaust gases· Low and Low-Medium cost options
From the evidence gathered during the project (from literature, interviews, survey and workshops) a numberof enablers and barriers which could affect these options were identified. The barriers were primarily accessto investment, new technology risks and limitations of expertise and skills within the sector, as detailed insection 3.4.5 above. Enablers were also identified by the evidence gathering process and the significance ofthese enablers to promoting the adoption of the individual options was assessed. The relationships betweenthe enablers and barriers and the options are discussed below.
14 Model output rounded to 1 significant figure to reflect ‘order of magnitude’ input data15 Model output rounded to nearest million tonnes of CO2

INDUSTRIAL DECARBONISATION AND ENERGY EFFICIENCY ROADMAPS TO 2050 – CERAMICS
Section 4 - Pathways Page 73 of 90
4.7.1 Adopt Lowest Carbon Process
A major contributor to decarbonisation in the Max Tech case is the adoption of BAT kilns, especially in theheavy clay and whitewares subsector. The application of enhanced kiln designs to replace existing units willproduce a step improvement in energy consumption through improved design of heat recovery andcombustion of fuels with the application of advanced refractory and insulation materials. Decisions on suchan investment will be based on wider business considerations such as sustaining production, extending plantlife, labour savings (robotics) and waste reduction rather than savings from improved fuel efficiency.
Barriers to adoption of BAT kilns are primarily related to capital cost and investment decisions madebetween sustaining production capacity in the UK and expanding overseas where energy, carbon and labourcosts may be lower. These decisions will be driven by confidence in ROI and assessment of risks rather thanconsiderations of decarbonisation. High future fuel costs would enhance savings offered by new plant butcould make a UK based plant less competitive, would increase risks to returns on the investment and reducethe ability of firms to invest. Uncertainty on energy, climate and environmental policy and perceived risks toenergy security also undermine investment decisions.
A particular barrier for larger plants, which are obliged to participate in the EU ETS, is loss of ETSallowances if the project lasts more than 6 months. Restoration of full allowances is impossible under thecurrent interpretation of the rules and reduced allowances will be granted only after 6 months or a year ofnew plant operation. This loss of relief and increased uncertainty is a major disincentive to investment.Reform of the EU ETS would support investment in major capital projects that improve energy and carbonefficiency but which might take longer than 6 months to complete.
Enablers for the option would be confidence in the future UK demand for products and a long-termcommitment to UK based production by plant owners coupled with a supportive and stable, long-termregulatory framework. Reduced and more predictable gas prices (short and long term), would strengthen thebusiness case for new investment.
In each scenario the application of BAT kilns affects all pathways in the period 2025 to 2040, delivering asignificant proportion of early CO2 reductions, enabling the sector to make a significant change before thedisruptive options can be deployed.
EnablersReduced and more predictable gas prices (short and long term)Stable long-term regulatory environmentSenior management commitment to sustained UK production
Barriers
High capital costs and long payback periodsUncertainty about return on capitalLimited availability of capital including global competition for funding from groupheadquartersRising UK energy and, or carbon pricesRegulatory uncertaintyPerceived energy security risksEU ETS treatment of extended shutdown for energy and carbon efficiency improvement
4.7.2 Gasification of Biomass
This option would substitute a large part of the natural gas consumed by a large scale kiln by a syngasgenerated by gasification of biomass or waste. Complete replacement of the natural gas was not consideredto be viable by the sector specialists as this would require synthetic natural gas production by a morecomplex and less efficient gasifier using costly oxygen instead of air. Syngas substitution technology offersthe advantage that it can be applied to existing heavy clay kiln designs with some burner and control systemmodification.
INDUSTRIAL DECARBONISATION AND ENERGY EFFICIENCY ROADMAPS TO 2050 – CERAMICS
Section 4 - Pathways Page 74 of 90
There are several barriers to the adoption of this technology. Financial support for the development ofbreakthrough technologies will be necessary, including for industrial research, development anddemonstration of pre-commercial technologies. The availability of a secure supply of competitively-priced,sustainable feedstock will be essential. The large capital cost of the technology and its potential risks meansthat it will face strong competition for funding from head office. The uncertainty of biomass availability andprice together with the technical risks increase the uncertainty around ROI. The additional vehiclemovements to deliver the fuel and regulatory uncertainty over the exact legal treatment of CO2 emissionsfrom biomass expose the option to additional regulatory risks. The new process also has potential impactson product quality.
Enablers for the application of gasification of biomass would be clarity over the security of supply and priceand carbon rating of biomass feedstock, incentives for renewable fuels used for industrial process heatingand demonstration of the new process at commercial scale to reduce new technology risks. Seniormanagement buy-in for decarbonisation would also enhance the take-up of this option.
For the current trends scenario, the gasification of biomass option has a significant impact on Max Tech andthe 40-60% CO2 reduction pathways.
Enablers
Prior demonstration of the technology at scaleSecurity of supply of biomassAssured biomass price or other incentives for renewable fuels used in industrial processesSenior management buy-in and formal business commitment
Barriers
Lack of support for new technology development and demonstrationHigh capital cost and global competition for funding from group headquartersUncertainty about return on capitalUncertainty in biomass secure availability and priceRegulatory uncertainty for emissions and fuel supplyUncertainty about the performance and reliability of a new processUncertainty about product quality impacts
4.7.3 Large Scale Electric Kilns
This option is to replace fuel burned in kilns by electrical heating. While electrically heated kilns are used fora limited number of firing processes in the sector, there is no experience of large scale continuous kilnsbeing electrically heated as their energy costs would be radically higher than for a gas-fired kiln. The use ofelectrical heating would necessitate a substantially different kiln design to use the different heat source andwould only be implemented as a replacement for a kiln at the end of its life. The option would be adverselyaffected by electricity energy prices which are currently four to five times that of gas. Given the UK’s currentand predicted electricity prices, this option would be viable only with very substantial incentives to reducecarbon emissions. In other respects an all-electric kiln would have reduced local environmental impacts andmight offer improved product quality.
Barriers to the deployment of large scale electric kilns are dominated by the high energy cost for the optionwhich would typically at least double product costs without incentives. In addition the scale and cost for newtechnology all-electric equipment would be seen to present significant risks to the industry which couldhamper its deployment. In addition, substantially increasing electricity feeds to factories, which are oftenlocated in rural locations, is also perceived to be problematic. These risks would be seen to adversely affectreturns on investment in such an option.
An important enabler would be incentives to avoid emissions from fossil fuels. Another enabler would belarge scale demonstration of the technology to largely eliminate technology risks. The recognition ofdecarbonisation as being an important company objective would enhance senior management buy-in aswould formal business commitment to decarbonisation.
INDUSTRIAL DECARBONISATION AND ENERGY EFFICIENCY ROADMAPS TO 2050 – CERAMICS
Section 4 - Pathways Page 75 of 90
This option contributes strongly to the Max Tech and the 40-60% pathways.
Enablers
Development and demonstration of the technology at scaleIncentives to reduce fossil fuel use or increase use of low carbon electricitySenior management buy-in and formal business commitmentDecarbonisation of electricity supplies as projected
Barriers
Large multiple increase in energy cost over gasRising electricity pricesLack of support for new technology development and demonstration (new kiln design)High capital cost and global competition for funding from group headquartersUncertainty about return on capitalUncertainty of local capacity to meet increased electrical demand
4.7.4 Carbon Capture
This option would apply CC technology to the flue gases from the largest heavy clay kilns to capture a highpercentage of fuel and process carbon emissions. This is the only technology able to reduce the significantlevel of process emissions from the heavy clay subsector. The process equipment could be added to newand existing kilns and would have no impact on the production process. The site would however need tohave space for the necessary equipment for capture and export of the CO2 along with additional facilities tomanage the operation and any hazards presented by the processes. The process plant would be subject toadditional regulations, typically those for the chemical industry that could complicate the management of thesite.
Export of the captured CO2 could be pipeline, as liquid CO2 in tankers or to an adjacent chemical plant usingthe gas as a feedstock. Any of these alternatives adds requirements and may restrict the application of thistechnology to suitably located plants. The remote location of these plants away from likely national carboncapture and storage (CCS) infrastructure adds substantially to costs.
Barriers to this option include substantial capital cost without any corresponding saving from fuelconsumption reduction and added costs for energy consumption by the CC process itself. This willunavoidably have an adverse effect on ROI. The necessary investment for such development anddemonstration will need to be supported as the technology offers no financial return to the sector. Theprocess and equipment will be demanding of space that will be challenging to find on many sites. Theaddition of new hazards on site will require changes of site management and will face some regulatoryuncertainty to obtain planning consent for changes to the site and for its subsequent operation. Withoutstrong incentives the investment would not be financially viable.
Technology development for application in the ceramic sector will be necessary to address specificchallenges of the contaminants in the exhaust gas stream and the low concentration of CO2 in the exhauststream. Furthermore, the volume of emission at each site is comparatively small and the sites are widely-dispersed geographically, with proximity to local raw material reserves currently being a key locationalconsideration
Enablers for the option would be formal commitment to decarbonisation and corresponding seniormanagement buy-in, appropriate policies to provide incentives to develop, demonstrate and apply a processthat requires investment for no other return. The development of a carbon storage infrastructure will benecessary to minimise cost for such an option, while regulatory clarity would be necessary for thedevelopment and operation of the plant.
This option impacts the Max Tech and 40-60% pathways.
Enablers Incentives to invest in a decarbonisation technology with no business benefits

INDUSTRIAL DECARBONISATION AND ENERGY EFFICIENCY ROADMAPS TO 2050 – CERAMICS
Section 4 - Pathways Page 76 of 90
The development of carbon storage infrastructure to kiln sitesClarity of regulatory position for CCS applicationSenior management buy-in and formal commitment to decarbonisation
Barriers
Substantial capital cost with adverse return on capitalNeed for substantial incentives to overcome adverse impact on costsLack of support for new technology development and demonstrationAvailability of space for additional equipment on production sitesRegulatory difficulty for planning consent and operating licencesHigh capital cost and global competition for funding from group headquartersLocation of sites away from CCS infrastructure
4.7.5 Low and Low-Medium Cost Options
This is a group of options that requires only low or low-medium capital investment. These are largely thecurrent state-of-the-art technologies such as energy management, improved insulation levels, better controlof combustion, process refinements, increased density of kiln setting etc. They have been grouped togetherfor the purposes of this section as they have similar enablers and barriers. Small incremental investment wasidentified as an enabler as the site typically has access to a capital budget for small works that it can controlitself. The low capital cost options are likely to fall into such a category. For the low-medium capital costoptions with longer payback, costs might be spread over several years, otherwise funding from head officemay be difficult to obtain and external grants and borrowing may not be readily accessible, restricting theapplication of such options.
Even lower investment costs are sensitive to the lower profit margins in the marketplace. Some of theseoptions are more concerned with organisational changes rather than technical changes. Successfulimplementation would require both evidence gathering to support the understanding of technical issues aswell as a willingness to address changes in practice and the development of new skills.
These options would have an impact on all pathways, but would influence the BAU the most.
Enablers Small incremental investments
Barriers
Lack of funds or incentives for projects with medium-longer term paybacksCompetitive marketplace with lower profit marginsLack of awareness and information imperfectionsLack of skilled labour
INDUSTRIAL DECARBONISATION AND ENERGY EFFICIENCY ROADMAPS TO 2050 – CERAMICS
Section 5 - Conclusions Page 77 of 90
5. CONCLUSIONS - PRINCIPAL QUESTION 6
This section provides assessment of the questions under Principal Question 6: ’What future actions might berequired to be taken by industry, government and others to overcome the barriers in order to achieve thepathways in each sector?’
This section is structured as follows:
· Eight ‘strategic conclusions’ or themes have been developed by analysing the main enablers andbarriers. Example next steps/potential actions are also included for each strategic conclusion.
· Six key technology groups are discussed, many of which link to the themes above. As described insection 4, a small group of technologies make a significant contribution to decarbonisation in 205016.Example next steps are included to assist with developing, funding and implementing thetechnologies. A seventh ‘other’ group covers technologies that are specific to the ceramic sectorand/or in the sector’s control.
It is intended that government and industry use the roadmap to develop the example actions further in orderto achieve decarbonisation while maintaining competitiveness of the sector.
5.1 Key Points
During the development of potential pathways to decarbonisation, the barriers to their implementation andthe enablers to promote them were summarised in sections 3.4.5. In combination with other enablers andbarriers identified during the study, these were grouped into the following themes to be addressed by thesector, government and other stakeholders:
· Strategic Issueso Challenging investment climate
§ Creation of a long-term energy-intensive industry strategy§ Development of a supportive, stable, long-term policy framework to underpin
investments in new equipment and innovation§ Ease access to funding, grants or allowances to increase the uptake of a range of
energy efficiency and decarbonisation technologies within heat intensive sectors§ Promote level playing field compared with EU and global competitor markets§ Promote internationally competitive and stable energy and carbon price by
mechanisms accessible to all heat-intensive industrial users e.g. actions to extendstrategic gas storage to avoid seasonal gas price spikes, support for low cost fuelimports
§ Minimise regulatory change and uncertainty in existing and new regulation (e.g. EUETS)
§ Ease Local Authority planning approval for industrial renewable energy and lowcarbon projects
§ Investigate consumption-based emissions reportingo Need for low carbon energy supplies
§ Establish an energy strategy that establishes affordable, long-term security of supply§ Incentivise decarbonised electricity as an economically viable low carbon energy
source§ Clarity on biomass cost, availability, carbon emissions rating and regulatory position§ Prioritise biomass use for heat production rather than electricity generation
16 These six technology groups apply to the ceramics sector and also the other seven sector roadmaps.
INDUSTRIAL DECARBONISATION AND ENERGY EFFICIENCY ROADMAPS TO 2050 – CERAMICS
Section 5 - Conclusions Page 78 of 90
§ Carbon storage infrastructure
Understand interactions between decarbonisation actions by different sectors (i.e. a lifecycle approach viewof emissions that assesses more than the carbon emitted in the production phase).
· Innovation and skillso Support RD&D, innovation and early application of a portfolio of new low carbon
technologies for heat-using sectorso Strengthen skills retention and development in the sector
· Specific sectorial decarbonisation technologieso Work to make lower carbon products acceptable to marketo Undertake key specific sectorial technology developments and apply them
5.2 Strategic Conclusions
5.2.1 Strategy, Leadership and Organisation
In order to take this agenda forward, it is considered critical that the ceramic sector, the government andother stakeholders recognise the importance of strategy and leadership in the context of decarbonisation,energy efficiency and international competitiveness for the sector.
This links to all other conclusions below, including RD&D, technology deployment, energy supply andfinancing.
A possible action to address this issue is to establish a long-term energy-intensive industry strategy withsector-specific working groups. The UK would benefit from a long-term strategy that recognises the strategiceconomic benefits of maintaining EIIs within the UK. Given their importance to the UK economy in terms ofgross domestic product (GDP) contribution, direct and indirect employment and as drivers for research andinnovation, the vision should be to develop and grow the world’s most carbon-efficient EIIs. This will requireopen and on-going dialogue and partnership between government (various departments), industry and otherstakeholders, such as technology developers and, or academics, trade unions etc. This EII strategy alsoneeds to be linked to energy policy, environmental policy and other industrial policies (e.g. construction). Theceramic sector working group could bring:
· Leadership and vision to the UK sector, emphasising how ceramic production adds strategic valuefor the UK and why it is important to face the challenges and develop the opportunities for the sector.This vision could encompass the ambition, drive, passion and creativity required to maximise futureopportunities for the sector and in doing so help to continue to spread a positive message and image.
· An approach to the need to drive forward the joint priorities of maintaining competitiveness of theexisting ceramic operations (recognising the challenges of operating in the markets within which theyreside) and also the need to increase RD&D activity and support technology and product innovationin the sector
· A high-level link between industry, the government and the EU and a clear framework within whichproduction, technology, energy efficiency and decarbonisation agendas can be taken forward.Members of the working group could engage with executives in corporate headquarters (bothOriginal Equipment Manufacturers (OEMs) and ceramic production companies) to address thecurrent lack of activity and engagement between the UK and the international sector community (forexample in RD& D).
· A practical means e.g. targeted funding, to take forward the roadmap agenda with shorter-termaction plans, for example, in five-year intervals.

INDUSTRIAL DECARBONISATION AND ENERGY EFFICIENCY ROADMAPS TO 2050 – CERAMICS
Section 5 - Conclusions Page 79 of 90
This ‘strategy’ conclusion is also applicable to individual companies, which have a key role in overcomingbarriers and strengthening enablers – this links to a number of strategic conclusions, for example,management commitment to decarbonisation and energy efficiency, value chain opportunities, and shortageof skilled labour. As none of the companies interviewed has a strategy that looks further than 2025 in termsof carbon-reduction targets, it is important to link longer term conclusions from this project into shorter-termcompany-level plans.
5.2.2 Business Case Barriers
One of the most important barriers to decarbonisation and energy efficiency, based on the literature,interviews and workshops, is lack of funding for such projects as the ROI is not attractive enough or there isa lack of capital available. While this is not the only barrier to implementation of decarbonisation and energyefficiency projects (others include risk of implementing new technology, lack of skills, lack of managementtime, lack of certainty of business case), it is an important issue.
Significant improvement in the investment environment is required to permit and drive the necessary surgeof investment likely to be required in the sector to deliver changes contributing to decarbonisation from 2025.The following potential actions have been identified to improve the climate for investment in the UK ceramicsector:
· Ease access to funding, grants or allowances to increase the uptake of a range of energyefficiency / decarbonisation technologies within heat intensive sectors
· Investigate working with OEMs/ energy service companies (ESCOs) and their financial support· Financial innovation – off balance sheet· Waste heat recovery incentive· Establish an industrial energy efficiency dedicated fund which incentivises energy efficiency· Use of third-party funds, for example ethical investment funds
5.2.3 Future Energy Costs, Energy Supply Security, Market Structure andCompetition
Low carbon energy supply is critical to the ceramic sector and actions are required to maintain a competitiveposition for the UK. This strategic conclusion links to a number of external factors that influence the businessenvironment in which the sector operates. These include energy security and energy cost comparison toother regions (both reality and perception), as these factors are important when investment decisions aremade. There is a role for government in recognising the importance of and the link between long-term planson energy security to investment decisions made by companies in the sector. Moreover, the UK energysupply system will influence company decisions to invest in the sector (especially those investments that relyon secure competitive energy supply).
The following potential actions have been identified in relation to this theme:
· Implement an energy strategy that establishes affordable long-term security of supply.· Establish a means by which decarbonised electricity can be made cost competitive with fossil fuel, e.g.
progressively for the existing operations of the sector and more strongly to support large scaleconversion of facilities to electric firing no later than 2035 for the 40-60% pathway and 2030 for the MaxTech pathway. Enable the sector to obtain relief from the costs of decarbonising the grid.
· Implement the development of a broad range of low carbon technologies. Key technologies with cross-sectorial applicability include: further waste heat recovery developments, switching to low carbon fuels,electrification of heat, product reformulation and CCS or carbon capture and utilisation (CCU)
INDUSTRIAL DECARBONISATION AND ENERGY EFFICIENCY ROADMAPS TO 2050 – CERAMICS
Section 5 - Conclusions Page 80 of 90
technologies for high temperature industries (including the necessary developments and infrastructurefor CO2 transport to storage or reuse to be available for timely application in the ceramic sector).
· Promote internationally competitive and stable energy and carbon by mechanisms accessible to all heat-intensive industrial users, e.g .actions to extend strategic gas storage to avoid seasonal gas price spikes,support for low cost fuel imports.
· Promote level playing field compared with EU and global competitor markets.
5.2.4 Industrial Energy Policy Context
The need for long-term energy and climate change policy is key to investor confidence, according toliterature. We identified an increasing cost of carbon as a potential enabler for low carbon investment as itcan increase the financial benefits of energy efficiency and/or decarbonisation investment. At the same timeregulatory uncertainty has been identified to be a barrier. Investments commensurate with the moreambitious pathways will require long-term commitment to policy support, as changes in policy can bedamaging, particularly when the business case for investment is marginal and is highly dependent uponfactors such as (fluctuating) energy prices.
Possible actions as next steps to address this conclusion are as follows:
· Development of a supportive, stable, long-term policy framework to underpin investments innew equipment and innovation.
· Minimise regulatory change and uncertainty in existing and new regulation (e.g. EU ETS)· Ease Local Authority planning approval for industrial renewable energy and low carbon
projects.· Establish clear policy decisions on decarbonisation of the electricity grid to provide cost
clarity for industrial consumers.
5.2.5 Life-Cycle Accounting
While manufacturing can account for up to 90% of some ceramic products’ carbon footprint, the inherentenergy savings during the use phase together with the durability of ceramic products give them longlifespans over which time the environmental impact of the production phase is significantly reduced. Furtherdevelopment of standard tools for evaluating life-cycle ‘cradle-to-grave’ carbon impacts, from original rawmaterial and feedstock through to final product disposal could be carried out – to enable appropriate value tobe put on this type of carbon benefit and therefore easing the investment in decarbonisation.
The interaction between sectors is also significant with the carbon emissions of the ceramic sector beingnecessary for products contributing to minimising carbon emissions in other sectors (e.g. refractories whichare used in other high-temperature processes – glass, cement, ceramics, iron and steels and chemicalsmanufacture). A proper ‘lifecycle’ analysis of such activities is necessary to ensure that policies andinvestments are focussed on the most effective decarbonisation measures overall. The analysismethodology needs to be developed in the short term and its application across the industrial sectors needsto be completed by 2018 to inform investment and policy decisions in a timely manner.
Finally, consumption-based emissions reporting could be investigated and consider how climate policy couldbenefit from a broader approach which also takes into account embedded emissions in imported products inorder to ensure that the UK is not decarbonising by deindustrialising.
5.2.6 Value chain collaboration
The carbon emissions of the ceramic sector are significantly affected by the expectations of consumers, thebusiness needs of builders and other industrial users of ceramic products together with product standards
INDUSTRIAL DECARBONISATION AND ENERGY EFFICIENCY ROADMAPS TO 2050 – CERAMICS
Section 5 - Conclusions Page 81 of 90
and the requirements of building regulations. Collaboration across the value chain could enable productswith lower lifecycle carbon emissions to be developed and adopted.
Promotion of value chain collaboration requires development of a market demand for low carbon products.This can be enhanced by better exchange of information between suppliers and users, regulatory changee.g. in building regulations, to reward the use of long life and lower carbon building products. Education willbe needed for the public to recognise and value low carbon products and services.
Support mechanisms for RD&D on lower lifecycle carbon products and processes would accelerate valuechain collaboration. Discussion with users and end customers to increase the market accessibility of lesscarbon intensive products may highlight future opportunities, for example assessing potential benefits oflighter products, lower firing products and products eliminating firing steps. This action needs to commencein the near term and continue as a dialogue to promote and recognise the potential benefits of lower carbonceramic production over the following decades.
5.2.7 Research, Development and Deployment
The ceramic sector needs to explore and apply new technologies to reduce energy consumption and carbonemissions. The costs and uncertainties of RD&D are challenging and the cost of commercial scaledemonstrator facilities needed before new technologies can be deployed often represent too large a risk foran individual company to fund. Collaboration would be a solution but companies are constrained where itmight be interpreted as ‘collusion’ between competitors.
Possible actions within this theme, based on stakeholder engagement and assessment of the technologiesin the pathways, include:
· Increased collaboration in order to join up industry needs and academic research areas.· Industry and government to further develop and support centres of excellence and technology
‘catapults’.· Pre-competitive joint funding of RD&D projects.· Collaboration and joint action by industry and government on technology demonstration to drive
down capital and operating costs and ensure performance is demonstrated before mass adoption.· Identify areas of possible RD&D collaboration between companies, potentially via existing local
industry and new cross-sectorial groups. Key areas for research could include new heat exchangertechnologies to permit heat recovery from kiln exhaust gases, the development and application ofgasification of biomass to continuous kilns and the design and testing of large capacity continuouselectric kilns.
· Incentivise early adoption of new technologies in order to drive down costs and demonstrateperformance. Successful technology demonstration would reduce risks and encourage widerdeployment.
· Advances in materials development and production technology to enable less energy intensiveprocesses to be employed, e.g. shorter, lower temperature or reduced number of firing steps andadditional heat recovery
Further details are provided in the specific technology sections below.
5.2.8 Employees and Skills
The ceramic sector faces significant issues in migrating towards a low carbon future. Innovation intechnology and strengthening of skills within the sector will be essential. Potential actions for strengtheningof skills retention and development in the sector could include:

INDUSTRIAL DECARBONISATION AND ENERGY EFFICIENCY ROADMAPS TO 2050 – CERAMICS
Section 5 - Conclusions Page 82 of 90
· Better sharing of expertise and skills across the sector· Enhanced training and development of skills in existing staff and new entrants· Promoting the future economic viability of the sector in the UK
These actions need to be initiated in the near term and sustained throughout the following decades to permitand maintain momentum for development and decarbonisation.
5.3 Key Technology Groups
5.3.1 Electricity Grid Decarbonisation
Decarbonisation of this key source of energy supply could provide a significant contribution to the overalldecarbonisation of the sector. Actions will be required to ensure that this takes place while maintaining cost-competitiveness (see also section 5.2.3 above). The Government’s reforms of the electricity market arealready driving electricity grid decarbonisation, and this report uses assumptions of a future electricitydecarbonisation trajectory that is consistent with Government methodology and modelling.
5.3.2 Electrification of Heat
Ceramic sector energy use is dominated by fossil fuels. The pathway analysis has demonstrated thatmigration to low carbon electricity is an essential option for decarbonisation. The heavy clay subsector hasthe largest energy consumption and carbon emissions but there are currently no large scale continuous kilndesigns available to meet the needs of the subsector. A large scale continuous electric kiln, that providesefficient and cost-competitive electrical heating for large tunnel kilns, would be very different to one designedto be heated by gas combustion and significant development will be required in collaboration withmanufacturers to produce and prove a suitable product for widespread application (see also RD&D above).
5.3.3 Fuel and Feedstock Availability (Including Biomass)
As investigated in several of the pathways, substitution of gas derived from biomass gasification for naturalgas in kilns is a potential technology for decarbonisation in the ceramic sector.
The availability and cost of biomass is a potential issue for sector decarbonisation, given its importance tothe pathways (although the no biomass Max Tech pathway has shown that significant decarbonisation canbe achieved without it). This availability issue is critical in view of the long-term investment associated withkiln upgrades. The security of biomass supply is particularly affected by competition between sectors, forexample with large scale biomass use for power generation. The challenges are to understand where thegreatest decarbonisation potential can be achieved with a limited resource, as well as to maximise theavailability of the resource (links to Life-cycle carbon accounting above).
5.3.4 Energy Efficiency / Heat Recovery
The pathways demonstrate that the largest early improvements in carbon emissions result from theapplication of energy efficiency and heat recovery techniques, to both existing and new kilns. Theimprovement to energy efficiency by a range of measures related to combustion and reduction of heat lossesis complemented by the application of increased heat recovery to kiln and drier exhaust streams. New BATkilns include these features, although improvements in heat recovery technology to handle the challengingapplication will need further progressive development to maximise its potential on both new and existing kilns.
INDUSTRIAL DECARBONISATION AND ENERGY EFFICIENCY ROADMAPS TO 2050 – CERAMICS
Section 5 - Conclusions Page 83 of 90
Specific technical issues that could be addressed by sectorial research, development and application includeassessment of improvements in refractory and insulating materials to reduce heat consumption across allheat-intensive sectors.
5.3.5 Clustering
The benefits of clustering for example through integrated industrial manufacturing parks are well known inother industrial sectors. While this type of approach is a possibility in the ceramic sector in theory, it has notbeen considered in this study due to the current geographic distribution of manufacturing sites in the sector.
5.3.6 Carbon Capture
Individual ceramic sites are not considered to be of a sufficient scale to justify their own CO2 pipeline andstorage infrastructure. Collaboration is necessary to establish the networks, along with the availability ofsources of funding appropriate to this type of shared infrastructure. In addition, while even large ceramicsites produce exhaust flows for which proven CC technology exists, there are challenges of low CO2
concentration and the presence of aggressive acid gases in the exhaust stream that are unprecedented.Work is therefore necessary to develop and demonstrate economic CC technology appropriate tocommercial application in the sector at this scale (links to Research and Development theme).
5.3.7 Specific Sectorial Decarbonisation Technologies
High temperature transformation of materials is characteristic of ceramic products. However the sequenceand details of processing steps for each product can be refined for different purposes – to reduce costs,increase throughput, minimise rejects or reduce energy – and adjustments made to benefit one aspect mayadversely affect another. There are therefore a range of improvements to ceramic processes that can beoptimised or traded-off to reduce emissions, preferably in conjunction with reduced costs or increasedthroughput. These include changes to the composition of raw materials to permit lower firing temperatures tobe achieved, changes in manufacturing processes to permit the omission of firing steps and adjustments toimprove energy utilisation by closer kiln packing. Some of these improvements are inherently highly specificto products and production facilities, while others relate to materials properties that are generic. As a resultsome of these improvements can only be made at a company level, while others are perhaps bestaddressed in collaboration; in either case these relate to the Research and Development theme above.
5.4 Closing Statement
This roadmap report is intended to provide an evidence-based foundation upon which future policy andactions can be built. The way in which the report has been compiled is designed to ensure it has credibilitywith industrial, academic and other stakeholders and is recognised by government as a useful contributionwhen considering future policy. It will be successful if, as a result, the government and the ceramic sector areable to build on the report to deliver significant cuts in carbon emissions, increased energy efficiency and astrong on-going competitive position of the UK ceramic industry in the decades to come.
INDUSTRIAL DECARBONISATION AND ENERGY EFFICIENCY ROADMAPS TO 2050 – CERAMICS
Section 6 - References Page 84 of 90
6. REFERENCES
Agora – Energiewende (2014) The Energiewende in the Power Sector: State ofAffairs2014 - A Review of theSignificant Developments and an Outlook for 2015” Berlin, 07 Jan. 2014 http://www.agora-energiewende.de/fileadmin/downloads/publikationen/Analysen/Comparing_Electricity_prices_for_industry/Agora_Comparing_Electricity_Prices_for_Industry_web.pdf
Allwood (2012) http://www.withbotheyesopen.com/ and Allwood JM, et al. (2011) Sustainable Materials: withboth eyes open. 384 pages. UIT Cambridge, England. ISBN 978-1-906860-05-9
Ceram (2013), Ceram Unie. Paving the Way to 2050 - Ceramic Roadmap to 2050. November 2012
CLCF (2011), Centre for Low Carbon Futures, Technology Innovation for Energy Intensive Industry in theUnited Kingdom, June 2011. http://www.lowcarbonfutures.org/technology-innovation-energy-intensive-industry-uk
CSE (2012), Centre for Sustainable Energy and Environmental Change Institute, What are the factorsinfluencing energy behaviours and decision-making in the non-domestic sector? - A Rapid EvidenceAssessment, November 2012. http://www.cse.org.uk/downloads/reports-and-publications/behaviour-change/factors_influencing_energy_behaviours_in_non-dom_sector.pdf
CT-IEEA (2010), Carbon Trust Industrial Energy Efficiency Accelerator – A guide to the Brick Sector,CTG043. http://www.carbontrust.com/media/206484/ctg043-brick-industrial-energy-efficiency.pdf
DECC (2011), Department of Energy and Climate Change. The Carbon Plan - reducing greenhouse gasemissions https://www.gov.uk/government/publications/the-carbon-plan-reducing-greenhouse-gas-emissions--2
DECC (2013), Department of Energy and Climate Change. The Future of Heating: Meeting the challenge.March 2013,
DECC (2014) Biomass carbon emissions intensity guidance "Biomass Issues", 4 Sept. 2014 (unpublished).
EC-IPPC (2007), Reference document on Best Available Techniques in the Ceramics ManufacturingIndustry, European Commission IPPC Bureau, 2007
ECORYS (2008), ECORYS Nederland, FWC Sector Competitiveness Studies - Competitiveness of theCeramics Sector - ENTR/06/054 -Final report 13 October 2008,
http://ec.europa.eu/enterprise/sectors/metals-minerals/files/finalreport_ceramics_131008_en.pdf
ETI (2015) Bioenergy – Insights into the future UK Bioenergy sector, gained using the ETI’s Bioenergy ValueChain Model (BVCM) http://www.eti.co.uk/bioenergy-has-the-potential-to-help-secure-uk-energy-supplies-mitigate-climate-change-and-create-significant-green-growth-opportunities-if-deployed-effectively-eti-report/
GPrix (2010), GPrix consortium (Good Practices in Innovation Support Measures for SMEs), SWOT analysisand SME profiling of West Midlands (UK), 2010. (Deliverable 1.2 of Grant 245459 of FP7-SME-2009-1)http://business.staffs.ac.uk/gprix/docs/Del_1_2_RegionalEconomicFabric_UK.pdf
Haydock (2013), H. Haydock (Ricardo-AEA), T. Napp (Imperial College). Decarbonisation of heat in industry- A review of the research evidence. Ricardo-AEA/R/ED58571, issue 1’ , Report for The Department ofEnergy & Climate Change (DECC), July 2013
INDUSTRIAL DECARBONISATION AND ENERGY EFFICIENCY ROADMAPS TO 2050 – CERAMICS
Section 6 - References Page 85 of 90
https://www.gov.uk/government/uploads/system/uploads/attachment_data/file/230949/D13_951813__Ricardo_AEA_Industrial_Decarbonisation_Literature_Review_201___.pdf
IEA (2007), International Energy Agency, Tracking industrial energy efficiency and CO2 emissions. January2007
IEA (2009), International Energy Agency, Energy Technology Transitions for Industry - Strategies for thenext industrial revolution, 2009
JRC (2011), JRC Institute for Energy and Transport. European Commission. Technology Map of theEuropean Strategic Energy Technology Plan. 2011,
McDermott (2013), Presentation: Ceramic Industry: Current / Future Energy Efficiency Solutions, by DrAndrew McDermott, Technical Director British Ceramic Confederation. PLEEC Energy Efficiency Forum, 6November 2013, Stoke-on-Trent, UK. (Planning for Energy-Efficient Cities),
http://www.pleecproject.eu/downloads/Meetings/Energy-Efficiency-Forum-in-Stoke-on-Trent/05_andrew_mcdermott_-_am-ceramic-sector.pdf
McKenna (2009), Russell C. McKenna, Industrial energy efficiency - interdisciplinary perspectives on thethermodynamic, technical and economic constraints, University of Bath, 2009
Mezquita (2010), Mezquita et al., Energy optimisation in ceramic tile manufacture by using thermal oil, 2010
Peng (2012), Peng et al., CO2 Emission Calculation and Reduction Options in Ceramic Tile Manufacture-The Foshan Case, Energy Pocedia, Volume 16, Part A, 2012, Pages 467–476, 2012 InternationalConference on Future Energy, Environment, and Materials.http://www.sciencedirect.com/science/article/pii/S1876610212000860
ScienceDirect (2014) - reference missing completely. Need to say which date(s) the survey was done onScience Direct.
Scotton (2013a), R.Scotton, Ceramic Household & Ornamental Article Manufacturing in the UK - IBISWorldIndustry Market Research Report C23.410, 2013. http://www.reportlinker.com/p0764765-summary/Ceramic-Household-Ornamental-Article-Manufacturing-in-the-UK-Industry-Market-Research-Report.html
Scotton (2013b), Ceramic Sanitary Fixtures Manufacturing in the UK industry, report, 2013
Smith (2013), Clay Bricks and Clay Blocks: a Resource Efficiency Action Plan, Ceram and WRAP, October2013, http://www.wrap.org.uk/sites/files/wrap/CBCB%20REAP%20October%202013.pdf
Tech (2010), Tech Solutions Pvt, Manual on energy conservation measures in ceramic industry, April 2010.http://sameeeksha.org/pdf/dpr/Morbi_Ceramic.pdf
Tholl. (2013), P. Thollander and J. Palm. Improving EE in industrial energy systems - an interdisciplinaryperspective on barriers, energy audits, energy management, policies and programs. Publ. Springer ISBN978-1-4471-4162-4,http://serverlib.moe.gov.ir/documents/10157/42675/Improving+Energy+Efficiency+in+Industrial+Energy+Systems.pdf
Thomas (2010), Flooring: A Resource Efficiency Action Plan, CFA and WRAP, September 2010,http://www.wrap.org.uk/sites/files/wrap/Flooring_REAP.pdf
INDUSTRIAL DECARBONISATION AND ENERGY EFFICIENCY ROADMAPS TO 2050 – CERAMICS
Section 6 - References Page 86 of 90
TUC (2012), Trade Union Congress, Building our low-carbon industries: the benefits of securing the energy-intensive industries in the UK, June 2012,
https://www.tuc.org.uk/sites/default/files/tucfiles/buildingourlowcarboninds.pdf
Venmans (2014), Frank Venmans, Triggers and barriers to energy efficiency measures in the ceramic,cement and lime sectors. Journal of Cleaner Production, 69 . pp. 133-142. ISSN 0959-6526.http://eprints.lse.ac.uk/55919/ Agora-Energiewende, 2014

INDUSTRIAL DECARBONISATION AND ENERGY EFFICIENCY ROADMAPS TO 2050 – CERAMICS
Section 7 - Glossary Page 87 of 90
7. GLOSSARY
Adoption
The percentage of sector production capacity to which a carbon reduction option has already been applied.Therefore, of the list of options being assessed, this is a measure of the degree to which they have alreadybeen deployed in the sector.
Applicability
The percentage of the sector production capacity to which a particular option can be applied. This is ameasure of the degree to which a carbon reduction option can be applied to a particular part of the sectorproduction process.
Barrier to Decarbonisation or Energy Efficiency
Barriers are factors that hinder companies from investing in and implementing technologies and initiativesthat contribute to decarbonisation
Business as Usual
A combination of carbon abatement options and energy savings that would be expected with thecontinuation of current rates of deployment of incremental improvement options in the sector up to 2050without significant intervention or outside support.
Decarbonisation
Reduction of CO2 emissions (in MtCO2) – relative to the reference trend for that scenario. When we reportcarbon dioxide – this represents CO2 equivalent. However, other GHGs were not the focus of the studywhich centred on both decarbonisation and improving energy efficiency in processes, combustion andindirect emissions from electricity used on site but generated off site. Also, technical options assessed in thiswork result primarily in CO2 emissions reduction and improved energy efficiency. In general, emissions ofother GHGs, relative to those of CO2, are very low.
Carbon reduction band or bins
The percentage ranges of CO2 reduction achieved for a given pathway in 2050 relative to the base year e.g.20-40% of the base year emission.
Carbon reduction curve or profile
A quantitative graph which charts the evolution of sector carbon emissions from 2014 to 2050
Competition Law
The UK has three main tasks:
· Prohibiting agreements or practices that restrict free trading and competition between businessentities. This includes in particular the repression of cartels.
· Banning abusive behaviour by a firm dominating a market, or anti-competitive practices that tend tolead to such a dominant position. Practices controlled in this way may include predatory pricing, tying,price gouging, refusal to deal and many others.

INDUSTRIAL DECARBONISATION AND ENERGY EFFICIENCY ROADMAPS TO 2050 – CERAMICS
Section 7 - Glossary Page 88 of 90
· Supervising the mergers and acquisitions of large corporations, including some joint ventures.Transactions that are considered to threaten the competitive process can be prohibited altogether, orapproved subject to ‘remedies’ such as an obligation to divest part of the merged business or to offerlicences or access to facilities to enable other businesses to continue competing.
Deployment
Once the adoption and applicability of an option has been taken into account, each option can be deployedto reduce part of the sector’s CO2 emissions. Hence, the deployment of the option from 2015 through to 2050is illustrated in our analysis by the coloured matrix on the pathway presentations.
Enabler for decarbonisation or energy efficiency
Enablers are factors that that make an investment feasible or would either help overcome a barrier.
Grid CO2 emission factor
A specific scenario assumption relating to the average carbon intensity of grid electricity and projection(s) ofhow this may evolve to 2050
Maximum Technical Pathway (‘Max Tech’)
A combination of carbon abatement options and energy savings that is both highly ambitious but alsoreasonably foreseeable. It is designed to investigate what might be technically possible when other barriersare set to one side. Options selected in Max Tech take into account barriers to deployment but are notexcluded based on these grounds. Where there is a choice between one option or another, theeasier/cheaper option is chosen or two alternative max tech pathways are developed.
Option
A carbon reduction measure, often a technical measure, such as a more efficient process or technology
Option Register
The options register was developed jointly by the technical and social and business research teams. Thiswas achieved by obtaining the list of potential options from interviews, literature, asking participants at theinformation gathering workshop which options they would consider viable, and through engagement withmembers of the relevant trade associations.
Pathway
A particular selection and deployment of options from 2014 to 2050 chosen to achieve reductions falling intoa specific carbon reduction band
Projection of Production Changes
A sector specific scenario assumption which defines the changes in production as an annual percentagechange to 2050
Reference trend
the carbon dioxide emission trend that would be followed if the 2012 base year emissions were affected byproduction change and grid decarbonisation in accordance with the sector specific scenarios

INDUSTRIAL DECARBONISATION AND ENERGY EFFICIENCY ROADMAPS TO 2050 – CERAMICS
Section 7 - Glossary Page 89 of 90
Scenario
A specific set of conditions external to the sector which will affect the growth and costs of production in thesector and affect the timing and impact of options on carbon emissions and energy consumption
Scenario assumptions
A set of specific cost and technical assumptions which characterise each scenario. These include forwardfuel and carbon price projections, grid CO2 factor projection and background economic growth rate. Theassumptions may include sector forward production projections.
Sensitivity case
The evaluation of the impact of changes in a single assumption on a pathway e.g. the availability of biomass
INDUSTRIAL DECARBONISATION AND ENERGY EFFICIENCY ROADMAPS TO 2050 – CERAMICS
Section 8 - Acknowledgements Page 90 of 90
8. ACKNOWEDGMENTS
The authors would like to thank all those who contributed to this project. This included trade associations andtheir members, academic institutions and government officials within the sector team and also all those whocontributed to the project through attending workshops, engaging in interviews and provided data, reviewand comment to early drafts of the outputs.

WSP and Parsons Brinckerhoff have combined and are now one of the world's leading engineering professional services consulting firms.
Together we provide services to transform the built environment and restore the natural environment, and our expertise ranges from environmental remediation to urban planning, from engineering iconic buildings to designing sustainable transport networks, and from developing the energy sources of the future to enabling new ways of extracting essential resources.
We have approximately 32,000 employees, including engineers, technicians, scientists, architects, planners, surveyors, program and construction management professionals, and various environmental experts.
We are based in more than 500 offices across 39 countries worldwide.
www.wspgroup.com; www.pbworld.com.
DNV GL
Driven by its purpose of safeguarding life, property and
the environment, DNV GL enables organisations to
advance the safety and sustainability of their business. We
provide classification and technical assurance along with
software and independent expert advisory services to the
maritime, oil & gas, and energy industries. We also provide
certification services to customers across a wide range of
industries.
Combining leading technical and operational expertise, risk methodology and in-depth industry knowledge, we empower our customers’ decisions and actions with trust
and confidence. We continuously invest in research and
collaborative innovation to provide customers and society with operational and technological foresight.
With our origins stretching back to 1864, our reach today is
global. Operating in more than 100 countries, our 16,000 professionals are dedicated to helping customers make the
world safer, smarter and greener.
www.dnvgl.com


![Myopic decision making in energy system decarbonisation ...discovery.ucl.ac.uk/1559614/1/Fuso...system_decarbonisation_pathways.pdf · Energy Assessment (GEA) [9]. Open source optimisation](https://img.dokumen.tips/doc/110x75/5d5e5e1488c993984a8be045/myopic-decision-making-in-energy-system-decarbonisation-energy-assessment.jpg)