Embed Size (px)
Citation preview

THIRD QUARTER REPORT 31 March 2018

Contents
Company Information 03
Directors’ Report-English 04
Directors’ Report-Urdu 05
UNCONSOLIDATED FINANCIAL STATEMENT Balance Sheet 06
Profit & Loss Account 07
Statement of Comprehensive Income 08
Cash Flow Statement 09
Statement of Changes in Equity 10
Notes to the Financial Statement 11
CONSOLIDATED FINANCIAL STATEMENT Balance Sheet 15
Profit & Loss Account 16
Statement of Comprehensive Income 17
Cash Flow Statement 18
Statement of Changes in Equity 19
Notes to the Financial Statement 20

This page has beenintentionally left blank

THIRD QUARTER REPORT 2018 03
Company Information
Board of Directors
Akhtar Hussain MalikChairman
Amir AbbassciyDirector & Chief Executive Officer
Muhammad Mahmood HussainDirector
Syed Arshad RazaDirector
Omar Khan LodhiDirector
Chaudhary Khaqan SaadullahKhanDirector
Murtaza HussainDirector
Audit Committee
Muhammad MahmoodHussain, Chairman
Syed Arshad Raza,Member
Chaudhary Khaqan SaadullahKhan,Member
Human Resource andRemuneration Committee
Muhammad MahmoodHussain, Chairman
Amir Abbassciy,Member
Syed Arshad Raza,Member
Chaudhary Khaqan Saadullah Khan,Member
Services & StakeholdersCommittee
Akhtar Hussain Malik,Member
Syed Arshad Raza,Member
Chaudhary Khaqan SaadullahKhan,Member
Chief Financial Officer
Naeem Asghar Malik
Company Secretary
Majid Muqtadir
Auditors
EY Ford RhodesChartered Accountants
Bankers
Allied Bank LimitedAl Baraka Bank (Pakistan)LimitedAskari Bank LimitedBank Alfalah LimitedBank Islami Pakistan LimitedFaysal Bank LimitedFirst Women Bank LimitedHabib Bank LimitedHabib Metropolitan BankLimitedIndustrial and CommercialBank of China LimitedJS Bank LimitedMCB Bank LimitedMeezan Bank LimitedNational Bank of PakistanPak Oman InvestmentCompany LimitedSaudi Pak Industrial andAgricultural Investment Company Limited
Standard Chartered Bank(Pakistan) LimitedSoneri Bank LimitedSummit Bank LimitedSilkbank LimitedSindh Bank LimitedThe Bank of PunjabUnited Bank LimitedThe Bank of Khyber
Shares Registrar
FAMCO Associates (Pvt) Limited8-F, Next to Hotel FaranNursery, Block-6, P.E.C.H.S,Shahrah-e-Faisal, Karachi
Tel: (92 21) 3438 01013438 0102
Fax: (92 21) 3438 0106
Registered Office
9th Floor, The Harbour Front,Dolmen City, HC-3, Block-4,Marine Drive, Clifton,Karachi 75600, Pakistan
Tel: (92 21) 111 222 081Fax: (92 21) 111 888 081
Website
www.byco.com.pk

THIRD QUARTER REPORT 2018 04
Director’s Report
In the name of Allah the Most Merciful and the Most Benevolent.
The Directors of your Company are pleased to present a brief review of the financial results andoperations of your Company for the period ended 31st March 2018.
By the grace of Allah Almighty, the Company earned a gross profit of Rs. 7.1 billion in currentperiod compared to gross profit of Rs. 2.1 billion in the same period last year. This significantincrease in the profit primarily resulted from the operations of the larger refinery commencingfrom August, 2017.
We are also pleased to inform that the Reformer unit of the larger refinery commencedoperations in February, 2018 and it has been running smoothly. The operations of this Reformerincreased the Motor Gasoline production 5 times from 300 tons/day to 1,500 tons/day at currentlevel of refinery throughput. This Reformer has the capacity to convert 24,000 barrels per dayi.e. 2800 tons/day of Naphtha into Motor Gasoline and hence, the company will further benefitwith the increase in refinery and Reformer throughput.
As reported previously, the consumption of Furnace Oil (FO) has declined substantially due tothe Government’s decision of shutting down FO based power plants which had impactedthroughput of all the refineries in the country. The situation slightly improved in current quarterwhich helped in improving the refinery throughput. However, continuation of FO demand in theCountry remains a significant risk for the refineries which must be addressed by your companyin the near term period.
As informed earlier, the Company is now subject to lower pricing of HSD products till the timeit gets its HSD products Euro II compliant. The management is finalising steps to address thecompliance of HSD to Euro II and we expect to commence work on this project shortly.
The management remains committed to maintain a relentless focus on improving the turnoverand profitability of your Company and the Board wishes to place on record its gratitude forthe co- operation extended by Government of Pakistan and strategic partners including itscustomers, financial institutions, suppliers, vendors and shareholders.
For and on behalf of the Board of Directors
Chief Executive OfficerKarachi
Director
April 30, 2018

THIRD QUARTER REPORT 2018 05
( (
Unconsolidated Condensed Interim Balance SheetAs at 31 March 2018
THIRD QUARTER REPORT 2018 06
NON CURRENT ASSETSProperty, plant and equipment 6 72,051,736 73,046,950 Long term Investment 16,931,504 Long term Loans and Advances 971,023 Long-term deposits 17,044 Deferred taxation 1,282,932
91,254,239
CURRENT ASSETSStores and spares 1,125,835 Stock-in-trade 7 20,038,583 Trade debts 8 9,013,880 Loans and advances 1,212,559 Trade deposits and short-term prepayments 54,297 Accrued interest 184,208 Other receivables 9 1,993,839 Cash and bank balances 232,334
33,855,535
Non - current asset Held for Sale 10 1,487,500 -
Total assets 126,597,274
EQUITY AND LIABILITIES
SHARE CAPITAL AND RESERVESAuthorized share capital6,000,000,000 (June 2017:6,000,000,000) Ordinary 60,000,000 shares of Rs.10/- each
Share capital 53,298,847 Merger Reserves (21,303,418) Accumulated losses (8,026,608)
23,968,821 Contribution against future issue of shares 761,129
24,729,950
Surplus on revaluation of Property, plant and equipment 4,623,586
NON CURRENT LIABILITIESLong term financing 14,929,831 Loans from related parties 6,430,487 Accrued and deferred markup 10,194,397 Long-term deposits 211,011 Deferred liabilities 340,244
32,105,970
CURRENT LIABILITIESTrade and other payables 45,362,419 Advance from customers 5,060,897 Accrued mark-up 216,674 Short term borrowings - secured 8,231,124 Current portion of non-current liabilities 5,820,487 Taxation - net 446,167
65,137,768 Contingencies and Commitments 11
Total equity and liabilities 126,597,274
16,931,504947,936
16,9561,282,932
92,226,278
483,88412,582,849
4,858,3181,056,064
13,173237,951
2,147,976249,577
21,629,792
113,856,070
60,000,000
53,298,847(21,303,418)(11,820,649)
20,174,780761,129
20,935,909
4,999,836
16,288,7496,110,4178,731,596
172,375353,514
31,656,651
41,875,1892,472,871
262,3443,371,7847,932,304
349,18256,263,674
113,856,070
The annexed notes form an integral part of these unconsolidated condensed interim financial information.
--------(Rupees in '000)--------
DirectorChief Executive Chief Financial Officer
Note
31 March 2018
(Un-audited)
30 June 2017
(Audited)

THIRD QUARTER REPORT 2018 07
Unconsolidated Condensed Interim Profit and Loss AccountFor the nine months period ended 31 March 2018
DirectorChief Executive Chief Financial Officer
31 March 31 March 31 March 31 March2018 2017 2018 2017
(Restated) (Restated)
Gross turnover 138,936,341 81,373,862 57,903,486 29,416,165
Sales tax, discount and others (31,365,587) (19,037,162) (12,966,955) (6,228,800)
Turnover - net 107,570,754 62,336,700 44,936,531 23,187,365
Cost of Sales (100,487,972) (60,183,817) (42,579,561) (22,238,762)
Gross profit 7,082,782 2,152,883 2,356,970 948,603
Administrative expenses (591,672) (516,150) (173,548) (150,112) Selling and distribution expenses (265,791) (248,357) (105,518) (93,581) Other expenses (974,353) (716,106) (354,084) (292,067) Other income 490,908 1,332,531 156,751 117,944
(1,340,908) (148,082) (476,399) (417,816)
Operating profit 5,741,874 2,004,801 1,880,571 530,787
Finance cost (1,937,653) (1,791,541) (603,159) (552,858)
Profit / (loss) before taxation 3,804,221 213,260 1,277,412 (22,071)
TaxationCurrent (386,430) (341,513) (146,960) (125,513) Deferred - - - -
(386,430) (341,513) (146,960) (125,513)
Profit / (loss) after taxation 3,417,791 (128,253) 1,130,452 (147,584)
Earning per share - (Rupees)- Basic / Diluted 0.64 (0.02) 0.21 (0.03)
Nine-month period ended Three-month period ended
----------------------------Rupees in '000----------------------------
The annexed notes form an integral part of these unconsolidated condensed interim financial information.

Unconsolidated Condensed Interim Statement of OtherComprehensive IncomeFor the nine months period ended 31 March 2018
THIRD QUARTER REPORT 2018 08
DirectorChief Executive Chief Financial Officer
Profit / (loss) after taxation
Other comprehensive income
Total comprehensive Income for the period
The annexed notes form an integral part of these unconsolidated condensed interim financial information.
31 March 31 March 31 March 31 March2018 2017 2018 2017
(Restated) (Restated)
3,417,791 (128,253) 1,130,452 (147,584)
- - - -
3,417,791 (128,253) 1,130,452 (147,584)
Nine-month period ended Three-month period ended
-------------------Rupees in '000-------------------

Unconsolidated Condensed Interim Cash Flow StatementFor the nine months period ended 31 March 2018
THIRD QUARTER REPORT 2018 09
DirectorChief Executive Chief Financial Officer
CASH FLOWS FROM OPERATING ACTIVITIESProfit before taxationAdjustments for:
Depreciation Finance costsProvision for impairment against doubtful debtsInterest incomeProvision for gratuity
Net cash flow before working capital changes
Movement in working capital(Increase) / decrease in current assets
Stores and sparesStock in tradeTrade debtsLoans and advances Trade deposits and short term prepayments Other receivables
Increase / (Decrease) in current liabilitiesTrade and other payables
Cash generated from operations
Income Taxes paidGratuity paidInterest income received
Net cash from operating activities
CASH FLOWS FROM INVESTING ACTIVITIESFixed capital expenditureAdvance against investment in SharesLong term deposits-net
Net cash used in investing activities
CASH FLOWS FROM FINANCING ACTIVITIESRepayment of long term loanFinancial costs paidShort term borrowings-netLiabilities against assets subject to finance lease - net
Net cash from / (used in) financing activities
Net increase / (decrease) in cash and cash equivalentsCash and cash equivalents - opening
Cash and cash equivalents - closing
The annexed notes form an integral part of these unconsolidated condensed interim financial information.
31 March 31 March
2018 2017(Restated)
3,804,221 213,260
2,277,338 2,085,024 1,937,653 1,791,541
563,095 533,591 (471,850) (367,604)
39,489 27,651 8,149,946 4,283,463
(641,950) (49,725) (7,455,734) (2,238,855) (4,718,657) 2,213,482
(156,495) (28,984) (41,124) (21,488) 154,137 111,662
6,075,254 4,941,475 (6,784,568) 4,927,568
1,365,378 9,211,031
(289,444) (321,406) (40,000) --
76,667 122,942 1,112,601 9,012,567
(1,282,124) (2,582,811) (60,000) (90,000)
38,548 1,931 (1,303,576) (2,670,880)
(3,420,141) (1,949,773) (1,265,466) (881,825)
5,483,969 (3,553,666) (4,362)
798,362 (6,389,626)
607,387 (47,939) (1,350,423) (593,141)
(743,036) (641,080)
(Rupees in '000)
Unconsolidated Condensed Interim Statement ofChanges in EquityFor the nine months period ended 31 March 2018
THIRD QUARTER REPORT 2018 10
DirectorChief Executive Chief Financial Officer
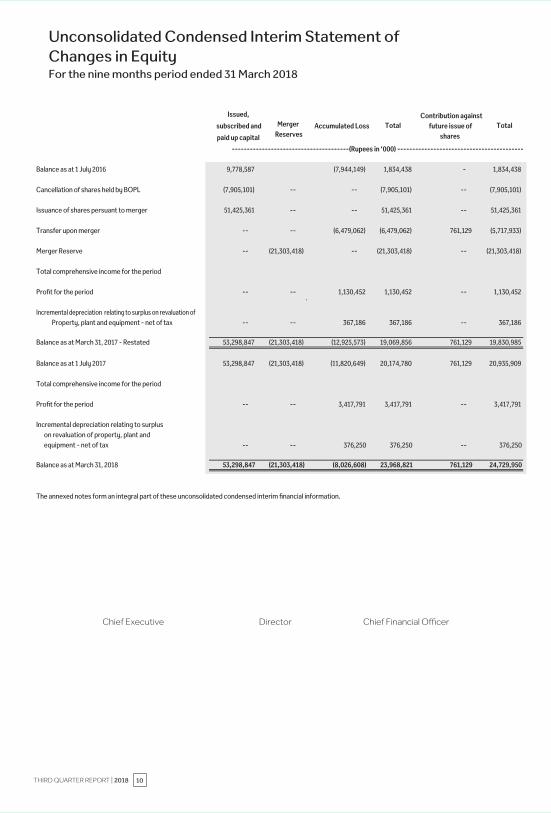
Balance as at 1 July 2016
Cancellation of shares held by BOPL
Issuance of shares persuant to merger
Transfer upon merger
Merger Reserve
Total comprehensive income for the period
Profit for the period
Incremental depreciation relating to surplus on revaluation ofProperty, plant and equipment - net of tax
Balance as at March 31, 2017 - Restated
Balance as at 1 July 2017
Total comprehensive income for the period
Profit for the period
Incremental depreciation relating to surplus on revaluation of property, plant andequipment - net of tax
Balance as at March 31, 2018
The annexed notes form an integral part of these unconsolidated condensed interim financial information.
9,778,587 (7,944,149) 1,834,438 - 1,834,438
(7,905,101) -- -- (7,905,101) -- (7,905,101)
51,425,361 -- -- 51,425,361 -- 51,425,361
-- -- (6,479,062) (6,479,062) 761,129 (5,717,933)
-- (21,303,418) -- (21,303,418) -- (21,303,418)
-- -- 1,130,452 1,130,452 -- 1,130,452 `
-- -- 367,186 367,186 -- 367,186
53,298,847 (21,303,418) (12,925,573) 19,069,856 761,129 19,830,985
53,298,847 (21,303,418) (11,820,649) 20,174,780 761,129 20,935,909
-- -- 3,417,791 3,417,791 -- 3,417,791
-- -- 376,250 376,250 -- 376,250
53,298,847 (21,303,418) (8,026,608) 23,968,821 761,129 24,729,950
Issued,
subscribed and
paid up capital
Accumulated Loss TotalContribution against
future issue of shares
TotalMerger Reserves
---------------------------------------(Rupees in ‘000) ------------------------------------------

Notes to the Unconsolidated Condensed InterimFinancial StatementsFor the nine months period ended 31 March 2018
THIRD QUARTER REPORT 2018 11
1. LEGAL STATUS AND NATURE OF BUSINESS
Byco Petroleum Pakistan Limited (the Company) was incorporated in Pakistan as a public limited companyon 09 January 1995 under the Companies Ordinance, 1984 (Repealed) and was granted a certificate ofcommencement of business on 13 March 1995. The shares of the company are listed on Pakistan StockExchange. The registered office of the Company is situated at The Harbour Front, 9th Floor, DolmenCity, HC-3, Block 4, Marine Drive, Clifton, Karachi – 75600, Pakistan.
The Company currently operates two business segments namely Oil Refinery and Petroleum MarketingBusiness. The Company has two refineries with an aggregate rated capacity of 155,000 bpd. PetroleumMarketing Business was formally launched in 2007 and has 317 retail outlets across the country.
Last year, the High Court of Sindh sanctioned the scheme of merger as fully explained in note 1.2 of theannual financial statements for the year ended June 30, 2017. Pursuant to this sanction, the entire businessof Byco Terminals Pakistan Limited (BTPL) and Byco Oil Pakistan Limited (BOPL) vested into the Company witheffect from the effective date i.e. close of business June 30, 2016. Consequently, the corresponding resultsfor the previous period presented are restated.
2. GOING CONCERN ASSUMPTION
As at 31 Mar 2018, the Company’s accumulated losses amounted to Rs. 8,026.608 million (30 June 2017:Rs.11,820.649) million. Moreover, current liabilities of the Company exceeded its current assets by Rs.29,794.731 million. `
These conditions indicate existence of material uncertainty which may cast significant doubt about theCompany's ability to continue as going concern, therefore, it may be unable to realize its assets and dischargeits liabilities in the normal course of business. These unconsolidated condensed interim financial statementshave been prepared using the going concern assumption as the management is confident that all theseconditions are temporary, and would reverse in foreseeable future due to the reasons given below:
- the Company earned a profit after tax amounting to Rs. 3,418 million (Operating profit: 5.34%) for theperiod as compared to a loss after tax of Rs. 128 million (Operating profit: 3.22%) same period last year,showing improvement in the Company’s profitability;
- the sales volume of the Company has increased by 54% showing improvement in the Company’sperformance as compared to same period last year;
- The Company is continuously reviewing its administrative costs, operating expenditures as well ascapital expenditures, with a view to optimize the associated benefits through reduction / eliminationof such costs as they find appropriate;
- the reformer of the larger refinery unit of the Company commenced its operations from February2018 which is expected to enhance the profitability of the Company in the coming years;
- Further, the parent company has given its commitment to give financial support to the Company asand when required. The support is available during the next financial year and beyond that;
- The management has also prepared financial projections to demonstrate the financial benefits ofabove measures.
The results of the above efforts, activities and actions are expected to contribute significantly towards theprofitability, cost reduction, cash flows and equity position of the Company and mitigate the risks involvedtherefore, the preparation of unconsolidated financial statements on going concern assumption is justified.
3 BASIS OF PREPARATION
3.1 Statement of compliance
These condensed interim financial statements have been prepared in accordance with the accounting andreporting standards as applicable in Pakistan for interim financial reporting. The accounting and reportingstandards as applicable in Pakistan for interim financial reporting comprise of:
- International Accounting Standard (IAS) 34, Interim Financial Reporting, issued by the InternationalAccounting Standards Board (IASB) as notified under the Companies Act, 2017; and
- Provisions and directives issued under the Companies Act, 2017

Notes to the Unconsolidated Condensed InterimFinancial StatementsFor the nine months period ended 31 March 2018
THIRD QUARTER REPORT 2018 12
3.2 This unconsolidated condensed interim financial information does not include all of the information requiredfor full annual financial statements and should be read in conjunction with the annual financial statements asat and for the year ended 30 June 2017.
3.3 This unconsolidated condensed interim financial information is un-audited and is being submitted to theshareholders as required by listing regulations of Pakistan Stock Exchange vide section 237 ofthe Companies Act, 2017.
3.4 This unconsolidated condensed interim financial information is presented in Pakistan Rupees which is alsothe Company's functional currency and all financial information presented has been rounded off tothe nearest thousand.
3.5 The comparative balance sheet presented in these unconsolidated condensed interim financial informationas at 30 June 2017 has been extracted from the unconsolidated audited financial statements of theCompany for the year ended 30 June 2017.
4 ACCOUNTING POLICIES
The accounting policies and the method of computation adopted in the preparation of these unconsolidatedcondensed interim financial information are the same as those applied in the preparation of the financialstatements of the Company for the year ended 30 June 2017.
Amendments to certain existing standards and new interpretations on approved accounting standardseffective during the period either were not relevant to the Company's operations or did not have anysignificant impact on the accounting policies of the Company.
5 ACCOUNTING ESTIMATES AND JUDGEMENTS
The preparation of this unconsolidated condensed interim financial information in conformity with approvedaccounting standards requires management to make estimates, assumptions and use judgements that affectthe application of policies and reported amounts of assets and liabilities and income and expenses. Estimates,assumptions and judgements are continually evaluated and are based on historical experience and otherfactors, including reasonable expectations of future events. Revisions to accounting estimates arerecognised prospectively commencing from the period of revision.
Judgments and estimates made by the management in the preparation of this unconsolidated condensedinterim financial information are the same as those that were applied to the unconsolidated financialstatements as at and for the year ended 30 June 2017. The Company's financial risk management objectivesand policies are consistent with those disclosed in the financial statements as at andfor the year ended 30 June 2017.
6 PROPERTY, PLANT AND EQUIPMENT Mar 31, 2018 Jun 30, 2017Unaudited Audited
Operating fixed assets 52,820,151 39,002,978 Capital work in progress - at cost 19,231,585 34,043,972
72,051,736 73,046,950
Amount in Rs. '000Note
6.1
6.1 During the period, the additions in property, plant and equipment amounted to Rs. 3.2 billion.
7 STOCK IN TRADE
Raw material Finished products
Mar 31, 2018Unaudited
Jun 30, 2017Audited
7.1 9,982,081 6,784,377 7.2, 7.3 & 7.4 10,056,503 5,798,472
20,038,583 12,582,849
Amount in Rs. '000
Where the provisions of or directives issued under the Companies Act, 2017 differ with the requirements ofIAS 34, the provisions of and directives issued under the Companies Act, 2017 have been followed.
7.1 This includes raw material in transit amouting to Rs. 5,482.970 million (30 June 2017: Rs. 4,032.88 million)as at the balance sheet date.
7.2 Finished products having cost of 5,473.973 million (June 2017: 3,589.267 million) have been written downby Rs. 534.117 million (June 2017 303.694 million) to net realizable value.

Notes to the Unconsolidated Condensed InterimFinancial StatementsFor the nine months period ended 31 March 2018
THIRD QUARTER REPORT 2018 13
7.4 This includes finished products in transit amouting to Rs. 277.811 million (30 June 2017: Rs. NIL) as at thebalance sheet date.
8 TRADE DEBTS
8.1 This mainly includes Rs. 8,684.764 million (30 June 2017: Rs. 7,553.041 million) due from an OMC andRs. 703.979 million (30 June 2017: Rs. 224.068 million) due from related party against supplies of products.
8.2
9 OTHER RECEIVABLES - considered good
9.1 This includes Rs. 831 million and Rs. 979 million (30 June 2017: Rs. 706 million and Rs. 994 million) receivablefrom related party and Coastal Refinery Limited respectively.
10 NON-CURRENT ASSET HELD FOR SALE
During the period, the management of the Company intended to sell the plot of the company located inKarachi having value of Rs. 1,487.5 million based on independent valuation.
11 CONTINGENCIES AND COMMITMENTS
11.1 Contingencies
The status for contingencies is same as disclosed in unconsolidated financial statements for the yearended 30 June 2017.
12 TRANSACTIONS AND BALANCES WITH RELATED PARTIES
The related parties comprise of ultimate parent company, parent company, subsidiary company, associatedcompanies, directors, key management personnel and post employment benefit funds. All transactionsinvolving related parties arising in the normal course of business are conducted at agreed terms andconditions. Details of transactions and balances with related parties during the period are as follows:
During the period provision was made against doubtful debts amounting to Rs. 563.095 million.
12.1 Transactions with related parties
Parent companyMarkup charged
Subsidiary CompanyOther expenses incurred
Associated companiesSales of goods and servicesPurchase of operating fixed assets and services
Post Employment Benefit PlansPayment to post employment benefit funds
Key Management PersonnelSalaries and benefits payment
Jul - Mar2018
Jul - Mar2017
(Restated)
116,611 100,793
151,128 42,306
4,381,841 1,231,616 60,645 135
162,437 56,495
71,311 46,717
------------Unaudited----------
Amount in Rs. '000
7.3 Stock of finished products includes stock held by third parties and related party amounting to Rs. 3,159.985million (June 2017: Rs. 1,033.413 million) and Rs. 321.449 million (June 2017: Rs. 103.839 million) respectively.
12.2 Balances with related parties
Parent CompanyOther receivablesContribution against future issue of sharesAccrued markupLoan payable
(Un-audited) (Audited)31 March 30 June
2018 2017
- 25,138 761,129 761,129 391,825 301,869
6,430,487 6,110,417
(Rupees in ‘000)

Notes to the Unconsolidated Condensed InterimFinancial StatementsFor the nine months period ended 31 March 2018
THIRD QUARTER REPORT 2018 14
DirectorChief Executive Chief Financial Officer
14 RECLASSIFICATION
Following corresponding figures have been reclassified for better presentation:
From To Rs. '000
Long term Loans and Advances Loans and advances 830,000 Long term financing Accrued and deferred markup 8,429,727 Accrued mark-up Long-term deposits 301,869 Selling and distribution expenses Cost of Sales 230,010 Selling and distribution expenses Gross turnover 1,194,674 Finance Cost Cost of Sales 140,621
15 DATE OF AUTHORIZATION FOR ISSUE
This unconsolidated condensed interim financial information was authorised for issue on 30th April 2018 bythe Board of Directors of the Company.
Subsidiary CompanyReceivable against expenses incurredAssociated CompaniesTrade debtsAccrued interestLong Term deposit receivablePayable against purchases OthersPayable to key management personPayable to post employment benefit funds
831,662 680,534
703,979 224,068 31,525 108,192
95 95 8,034 8,147
68,508 68,508 195,112 226,203
13 OPERATING SEGMENTS
For management purposes, the Company has determined following reportable operating segments on thebasis of business activities i.e. oil refining and petroleum marketing. Oil refining business is engaged in crudeoil refining and selling of refined petroleum products to oil marketing companies. Petroleum marketingbusiness is engaged in trading of petroleum products, procuring products from oil refining business as wellas from other sources. The quantitative data for segments is given below:
Sales to ext. customersInter-segment sales Eliminations
Total revenue
Result
Finance costsOther expensesInterest incomeTaxation
Profit / (Loss) for the period
Other InformationDepreciation
Segment results - profit
2018 2017 2018 2017 2018 2017
66,509,903 36,401,335 41,060,851 25,935,366 107,570,754 62,336,700 37,367,394 24,591,518 -- -- 37,367,394 24,591,518
(37,367,394) (24,591,518) -- -- (37,367,394) (24,591,518)
66,509,903 36,401,335 41,060,851 25,935,366 107,570,754 62,336,700
5,231,016 1,665,724 1,013,359 687,579 6,244,375 2,353,303
(1,937,653) (1,791,541) (974,353) (716,106)
471,850 367,604 (386,430) (341,513)
3,417,791 (128,253)
2,221,295 2,029,928 56,043 55,096 2,277,338 2,085,024
------------------------------- (Rupees in '000) -------------------------------
Oil Refining Petroleum Marketing Total
(Un-audited) (Audited)31 March 30 June
2018 2017
(Rupees in ‘000)

THIRD QUARTER REPORT 2018 15
Consolidated Condensed Interim Balance SheetAs at 31 March 2018
Notes31 March
201830 June
2017(Unaudited) (Audited)
NON CURRENT ASSETSProperty, plant and equipment 6 86,944,166 88,479,753 Long term Loans and Advances Long-term deposits
CURRENT ASSETSStores and spares Stock-in-trade 7 Trade debts 8 Loans and advances Trade deposits and short-term prepayments Accrued interest Other receivables 9 Cash and bank balances
Non - current asset Held for Sale 10 -
Total assets
EQUITY AND LIABILITIES
SHARE CAPITAL AND RESERVESAuthorized share capital6,000,000,000 (June 2017:6,000,000,000) Ordinary shares of Rs.10/- each
Share capital Merger Reserves Accumulated losses
Contribution against future issue of shares
Surplus on revaluation of Property, plant and equipment
NON CURRENT LIABILITIESLong term financing Loans from related parties Accrued and deferred markup Long-term deposits Deferred liabilities
CURRENT LIABILITIESTrade and other payables Advance from customers Accrued mark-up Short term borrowings - secured Current portion of non-current liabilities Taxation - net
Contingencies and Commitments 11
Total equity and liabilities
971,02417,044
87,932,234
1,125,83520,038,583
9,013,8801,212,559
54,297184,208
1,167,770232,334
33,029,466
1,487,500
122,449,200
60,000,000
53,298,847(21,303,418)(23,401,153)
8,594,276761,129
9,355,405
12,742,409
14,929,8316,430,487
10,194,397211,011
3,443,10635,208,832
45,367,2075,060,895
216,6748,231,1245,820,487
446,16765,142,554
122,449,200
947,93616,956
89,444,645
483,88412,582,849
4,858,3181,056,064
13,173237,951
1,467,442249,577
20,949,258
110,393,903
60,000,000
53,298,847(21,303,418)(26,866,160)
5,129,269761,129
5,890,398
13,254,699
16,288,7496,110,4178,731,596
172,3753,678,939
34,982,076
41,878,2452,472,871
262,3443,371,7847,932,304
349,18256,266,730
110,393,903
The annexed notes form an integral part of these consolidated condensed interim financial information.
----------(Rupees in '000)---------
DirectorChief Executive Chief Financial Officer

THIRD QUARTER REPORT 2018 16
Consolidated Condensed Interim Profit and Loss AccountFor the nine months period ended 31 March 2018
DirectorChief Executive Chief Financial Officer
Gross turnover
Sales tax, discount and others
Turnover - net
Cost of Sales
Gross profit
Administrative expensesSelling and distribution expensesOther expensesOther income
Operating profit
Finance cost
Profit / (loss) before taxation
TaxationCurrentDeferred
Profit / (loss) after taxation
Earning per share - (Rupees)- Basic / Diluted
The annexed notes form an integral part of these consolidated condensed interim financial information.
31 March 31 March 31 March 31 March2018 2017 2018 2017
(Restated) (Restated)
138,936,341 81,373,862 57,903,487 29,416,165
- -
(31,365,587)
107,570,754
(101,175,610)
6,395,144
(591,672)(265,791)(974,353)
490,908(1,340,908)
5,054,236
(1,937,653)
3,116,583
(386,430)
(386,430)
2,730,153
0.51
(19,037,162)
62,336,700
(60,874,077)
1,462,623
(519,172)(248,357)(716,106)1,332,531(151,103)
1,311,520
(1,791,541)
(480,021)
(341,513)158,810
(182,703)
(662,724)
(0.12)
(12,966,955)
44,936,532
(42,808,730)
2,127,802
(173,548)(105,518)(354,084)
156,902(476,248)
1,651,554
(603,159)
1,048,395
(146,960)
(146,960)
901,435
0.17
(6,228,800)
23,187,365
(22,468,460)
718,905
(150,112)(93,581)
(292,067)118,095
(417,665)
301,240
(552,858)
(251,618)
(125,513)52,937
(72,576)
(324,194)
(0.06)
Nine-month period ended Three-month period ended
-----------------------------Rupees in '00----------------------------

THIRD QUARTER REPORT 2018 17
Consolidated Condensed Interim Statement of OtherComprehensive IncomeFor the nine months period ended 31 March 2018
DirectorChief Executive Chief Financial Officer
31 March 31 March 31 March 31 March2018 2017 2018 2017
(Restated) (Restated)
Profit / (loss) after taxation 2,730,153 (662,724) 901,435 (324,194)
Other comprehensive income - - - -
Total comprehensive Income / (loss)for the period 2,730,153 (662,724) 901,435 (324,194)
The annexed notes form an integral part of these consolidated condensed interim financial information.
Nine-month period ended Three-month period ended
-------------------------Rupees in '000-----------------------

THIRD QUARTER REPORT 2018 18
Consolidated Condensed Interim Cash Flow StatementFor the nine months period ended 31 March 2018
DirectorChief Executive Chief Financial Officer
CASH FLOWS FROM OPERATING ACTIVITIESProfit before taxationAdjustments for:
Depreciation Finance costsProvision for impairment against doubtful debtsInterest incomeProvision for gratuity
Net cash flow before working capital changes
Movement in working capital(Increase) / decrease in current assets
Stores and sparesStock in tradeTrade debtsLoans and advances Trade deposits and short term prepayments Other receivables
Increase / (Decrease) in current liabilitiesTrade and other payables
Cash generated from operations
Income Taxes paidGratuity paidInterest income received
Net cash from operating activities
CASH FLOWS FROM INVESTING ACTIVITIESFixed capital expenditureAdvance against investment in SharesLong term deposits-net
Net cash used in investing activities
CASH FLOWS FROM FINANCING ACTIVITIESRepayment of long term loanFinancial costs paidShort term borrowings-netLiabilities against assets subject to finance lease - net
Net cash from / (used in) financing activities
Net increase / (decrease) in cash and cash equivalentsCash and cash equivalents - opening
Cash and cash equivalents - closing
The annexed notes form an integral part of these consolidated condensed interim financial information.
31 March 31 March2018 2017
(Restated)
3,116,583 (480,021)
2,739,697 1,791,541 533,591 (367,604) 27,651 4,244,855
(49,725) (2,238,855) 2,213,482 (28,984) (21,488) 111,662
4,941,475 4,927,568
9,172,422
(321,406) - 122,942 8,973,958
(2,582,811) (90,000) 1,931 (2,670,880)
(1,949,773) (881,825) (3,553,666)
-- (4,362) (6,389,626)
(86,547) (593,141)
2,932,0111,937,653
563,095(471,850)
39,4898,116,981
(641,950)(7,455,734)(4,718,657)
(156,495)(41,124)299,672
6,076,984(6,637,304)
1,479,676
(289,444)(40,000)
76,6671,226,899
(1,396,424)(60,000)
38,548(1,417,876)
(3,420,141)(1,265,466)
5,483,969
798,363
607,386(1,350,423)
(743,037) (679,688)
(Rupees in '000)
THIRD QUARTER REPORT 2018 19
Consolidated Condensed Interim Statement ofChanges in EquityFor the nine months period ended 31 March 2018
DirectorChief Executive Chief Financial Officer
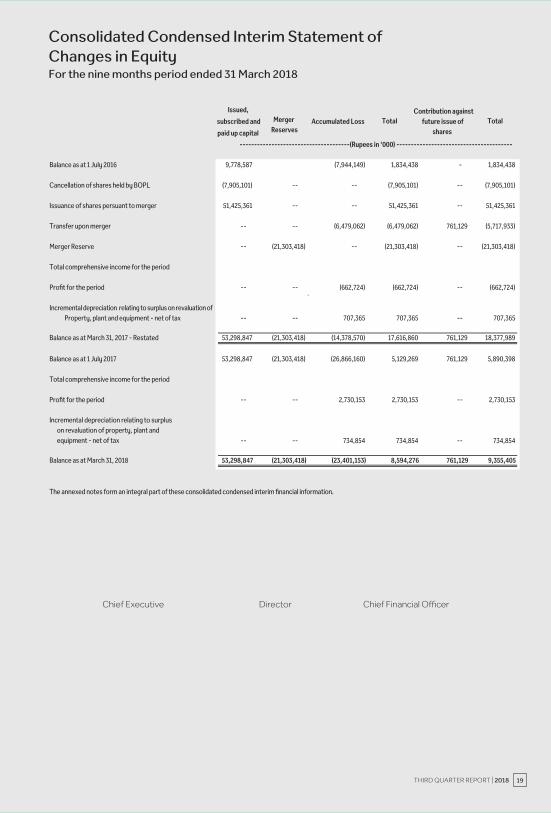
Balance as at 1 July 2016 9,778,587 (7,944,149) 1,834,438 -
1,834,438
Cancellation of shares held by BOPL (7,905,101) -- -- (7,905,101) -- (7,905,101)
Issuance of shares persuant to merger 51,425,361 -- -- 51,425,361 -- 51,425,361
Transfer upon merger -- -- (6,479,062) (6,479,062) 761,129 (5,717,933)
Merger Reserve -- (21,303,418) -- (21,303,418) -- (21,303,418)
Total comprehensive income for the period
Profit for the period -- -- (662,724) (662,724) -- (662,724) `
Incremental depreciation relating to surplus on revaluation ofProperty, plant and equipment - net of tax -- -- 707,365 707,365 -- 707,365
Balance as at March 31, 2017 - Restated 53,298,847 (21,303,418) (14,378,570) 17,616,860 761,129 18,377,989
Balance as at 1 July 2017 53,298,847 (21,303,418) (26,866,160) 5,129,269 761,129 5,890,398
Total comprehensive income for the period
Profit for the period -- -- 2,730,153 2,730,153 -- 2,730,153
Incremental depreciation relating to surplus on revaluation of property, plant andequipment - net of tax -- -- 734,854 734,854 -- 734,854
Balance as at March 31, 2018 53,298,847 (21,303,418) (23,401,153) 8,594,276 761,129 9,355,405
The annexed notes form an integral part of these consolidated condensed interim financial information.
Issued,
subscribed and
paid up capital
Accumulated Loss TotalContribution against
future issue of shares
TotalMerger Reserves
--------------------------------------(Rupees in ‘000) ----------------------------------------

THIRD QUARTER REPORT 2018 20
Notes to the Consolidated Condensed InterimFinancial StatementsFor the nine months period ended 31 March 2018
1. LEGAL STATUS AND NATURE OF BUSINESS
Byco Petroleum Pakistan Limited (the Holding Company) was incorporated in Pakistan as a public limitedCompany on 09 January 1995 under the Companies Ordinance, 1984 (Repealed) and was granted a certificateof commencement of business on 13 March 1995. The shares of the Group are listed on Pakistan StockExchange. The registered office of the Group is situated at The Harbour Front, 9th Floor,Dolmen City, HC-3, Block 4, Marine Drive, Clifton, Karachi – 75600, Pakistan.
The Group currently operates two business segments namely Oil Refinery and Petroleum MarketingBusiness. The Group has two refineries with an aggregate rated capacity of 155,000 bpd. PetroleumMarketing Business was formally launched in 2007 and has 317 retail outlets across the country.
Last year, the High Court of Sindh sanctioned the scheme of merger as fully explained in note 1.2 of theannual financial statements for the year ended June 30, 2017. Pursuant to this sanction, the entire businessof Byco Terminals Pakistan Limited (BTPL) and Byco Oil Pakistan Limited (BOPL) vested into the Companywith effect from the effective date i.e. close of business June 30, 2016. Consequently, the correspondingresults for the previous period presented are restated.
Byco Isomerization Pakistan (Private) Limited (BIPL)
BIPL was incorporated in Pakistan as a private limited company on 14 May 2014 under the CompaniesOrdinance, 1984 (repealed Ordinance) and it is a wholly owned subsidiary of the company. The registeredoffice of BIPL is situated in Islamabad Capital Territory. BIPL is principally be engaged in blending, refiningand processing of petroleum naphtha to produce petroleum products such as premium motor gasoline.
2. GOING CONCERN ASSUMPTION
As at 31 Mar 2018, the Group’s accumulated losses amounted to Rs. 23,401.153 million (30 June 2017:Rs.26,866,160 million). Moreover, current liabilities of the Group exceeded its current assets byRs. 30,625.588 million.
These conditions indicate existence of material uncertainty which may cast significant doubt about theGroup's ability to continue as going concern, therefore, it may be unable to realize its assets and dischargeits liabilities in the normal course of business. These consolidated condensed interim financial statementshave been prepared using the going concern assumption as the management is confident that all theseconditions are temporary, and would reverse in foreseeable future due to the reasons given below:
- the Group earned a profit after tax amounting to Rs. 2,730 million (Operating profit: 4.70%) for theperiod as compared to a loss after tax of Rs. 663 million (Operating profit: 2.10%) same period lastyear, showing improvement in the Group’s profitability;
- the sales volume of the Group has increased by 54% showing improvement in the Group’s performanceas compared to same period last year;
- The Group is continuously reviewing its administrative costs, operating expenditures as well as capitalexpenditures, with a view to optimize the associated benefits through reduction / elimination ofsuch costs as they find appropriate;
- the reformer of the larger refinery unit of the Group commenced its operations fromFebruary 2018 which is expected to enhance the profitability of the Group in the coming years;
- Further, the parent Group has given its commitment to give financial support to the Group asand when required. The support is available during the next financial year and beyond that;
- The management has also prepared financial projections to demonstrate the financial benefits ofabove measures.
The results of the above efforts, activities and actions are expected to contribute significantly towards theprofitability, cost reduction, cash flows and equity position of the Company and mitigate the risks involvedtherefore, the preparation of consolidated financial statements on going concern assumption is justified.

THIRD QUARTER REPORT 2018 21
Notes to the Consolidated Condensed InterimFinancial StatementsFor the nine months period ended 31 March 2018
3 BASIS OF PREPARATION
3.1 Statement of compliance
These condensed interim financial statements have been prepared in accordance with the accounting andreporting standards as applicable in Pakistan for interim financial reporting. The accounting and reportingstandards as applicable in Pakistan for interim financial reporting comprise of:
- International Accounting Standard (IAS) 34, Interim Financial Reporting, issued by the InternationalAccounting Standards Board (IASB) as notified under the Companies Act, 2017; and
- Provisions and directives issued under the Companies Act, 2017
Where the provisions of or directives issued under the Companies Act, 2017 differ with the requirements ofIAS 34, the provisions of and directives issued under the Companies Act, 2017 have been followed.
3.2 This consolidated condensed interim financial information does not include all of the information requiredfor full annual financial statements and should be read in conjunction with the annual financial statementsas at and for the year ended 30 June 2017.
3.3 This consolidated condensed interim financial information is un-audited and is being submitted to theshareholders as required by listing regulations of Pakistan Stock Exchange vide section 237 ofthe Companies Act, 2017.
3.4 This consolidated condensed interim financial information is presented in Pakistan Rupees which is also theCompany's functional currency and all financial information presented has been rounded off tothe nearest thousand.
3.5 The comparative balance sheet presented in these consolidated condensed interim financial informationas at 30 June 2017 has been extracted from the consolidated audited financial statements of the Companyfor the year ended 30 June 2017.
4 ACCOUNTING POLICIES
The accounting policies and the method of computation adopted in the preparation of these consolidatedcondensed interim financial information are the same as those applied in the preparation of the financialstatements of the Company for the year ended 30 June 2017.
Amendments to certain existing standards and new interpretations on approved accounting standardseffective during the period either were not relevant to the Company's operations or did not have anysignificant impact on the accounting policies of the Company.
5 ACCOUNTING ESTIMATES AND JUDGEMENTS
The preparation of this consolidated condensed interim financial information in conformity with approvedaccounting standards requires management to make estimates, assumptions and use judgements thataffect the application of policies and reported amounts of assets and liabilities and income and expenses.Estimates, assumptions and judgements are continually evaluated and are based on historical experienceand other factors, including reasonable expectations of future events. Revisions to accounting estimatesare recognised prospectively commencing from the period of revision.
Judgments and estimates made by the management in the preparation of this consolidated condensedinterim financial information are the same as those that were applied to the consolidated financialstatements as at and for the year ended 30 June 2017. The Group's financial risk management objectivesand policies are consistent with those disclosed in the financial statements as at and forthe year ended 30 June 2017.
6 PROPERTY, PLANT AND EQUIPMENT
Operating fixed assets Capital work in progress-at cost
31 March 2018Note 30 June 2017Unaudited Audited
52,820,151 54,435,781 34,124,015 34,043,972 86,944,166 88,479,753
Amount in Rs. '000
6.1
6.1 During the period, the additions in property, plant and equipment amounted to Rs. 3.2 billion.
THIRD QUARTER REPORT 2018 22
Notes to the Consolidated Condensed InterimFinancial StatementsFor the nine months period ended 31 March 2018
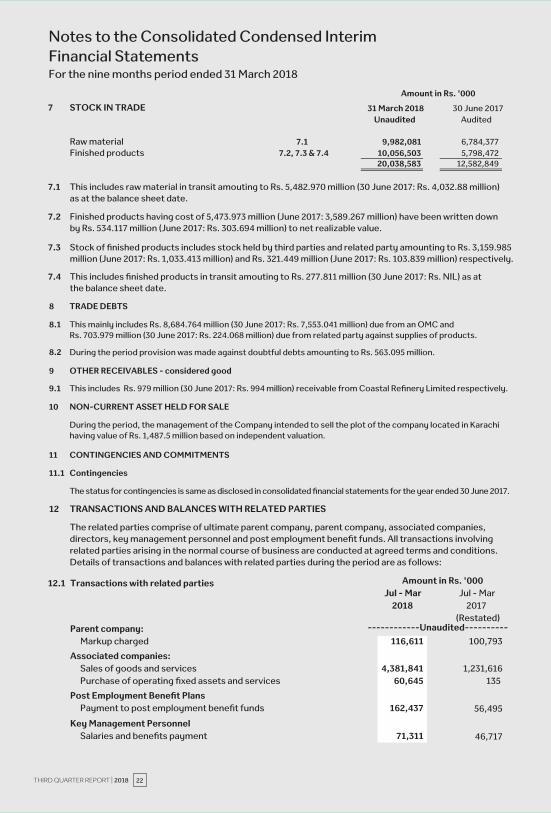
7 STOCK IN TRADE
Raw material Finished products
7.1 This includes raw material in transit amouting to Rs. 5,482.970 million (30 June 2017: Rs. 4,032.88 million)as at the balance sheet date.
7.2 Finished products having cost of 5,473.973 million (June 2017: 3,589.267 million) have been written downby Rs. 534.117 million (June 2017: Rs. 303.694 million) to net realizable value.
7.3 Stock of finished products includes stock held by third parties and related party amounting to Rs. 3,159.985million (June 2017: Rs. 1,033.413 million) and Rs. 321.449 million (June 2017: Rs. 103.839 million) respectively.
7.4 This includes finished products in transit amouting to Rs. 277.811 million (30 June 2017: Rs. NIL) as atthe balance sheet date.
7.1 9,982,081 6,784,377 7.2, 7.3 & 7.4 10,056,503 5,798,472
20,038,583 12,582,849
31 March 2018 30 June 2017Unaudited Audited
Amount in Rs. '000
8 TRADE DEBTS
8.1 This mainly includes Rs. 8,684.764 million (30 June 2017: Rs. 7,553.041 million) due from an OMC andRs. 703.979 million (30 June 2017: Rs. 224.068 million) due from related party against supplies of products.
8.2
9 OTHER RECEIVABLES - considered good
9.1 This includes Rs. 979 million (30 June 2017: Rs. 994 million) receivable from Coastal Refinery Limited respectively.
10 NON-CURRENT ASSET HELD FOR SALE
During the period, the management of the Company intended to sell the plot of the company located in Karachihaving value of Rs. 1,487.5 million based on independent valuation.
11 CONTINGENCIES AND COMMITMENTS
11.1 Contingencies
The status for contingencies is same as disclosed in consolidated financial statements for the year ended 30 June 2017.
12 TRANSACTIONS AND BALANCES WITH RELATED PARTIES
The related parties comprise of ultimate parent company, parent company, associated companies,directors, key management personnel and post employment benefit funds. All transactions involvingrelated parties arising in the normal course of business are conducted at agreed terms and conditions.Details of transactions and balances with related parties during the period are as follows:
During the period provision was made against doubtful debts amounting to Rs. 563.095 million.
12.1 Transactions with related parties Jul - Mar Jul - Mar
2018 2017(Restated)
Parent company:Markup charged 116,611 100,793
Associated companies:Sales of goods and services 1,231,616 Purchase of operating fixed assets and services 135
Post Employment Benefit PlansPayment to post employment benefit funds 56,495
Key Management PersonnelSalaries and benefits payment 46,717
4,381,84160,645
162,437
71,311
------------Unaudited----------
Amount in Rs. '000

THIRD QUARTER REPORT 2018 23
Notes to the Consolidated Condensed InterimFinancial StatementsFor the nine months period ended 31 March 2018
(Un-audited) (Audited)12.2 Balances with related parties 31 March 30 June
2018 2017
Parent CompanyOther receivables - 25,138 Contribution against future issue of shares 761,129 Accrued markup 301,869 Loan payable 6,110,417
Associated CompaniesTrade debts 224,068 Accrued interest 108,192 Long Term deposit receivable 95
Payable against purchases 8,147
OthersPayable to key management person 68,508 Payable to post employment benefit funds
761,129391,825
6,430,487
703,97931,525
958,034
68,508195,112 46,019
(Rupees in ‘000)
13 OPERATING SEGMENTS
For management purposes, the Company has determined following reportable operating segments on thebasis of business activities i.e. oil refining and petroleum marketing. Oil refining business is engaged in crudeoil refining and selling of refined petroleum products to oil marketing companies. Petroleum marketingbusiness is engaged in trading of petroleum products, procuring products from oil refining business as wellas from other sources. The quantitative data for segments is given below:
2018 2017 2018 2017 2018 2017
Sales to ext. customers 66,509,903 36,401,335 41,060,851 25,935,366 107,570,754 62,336,700 Inter-segment sales 37,367,394 24,591,518 -- -- 37,367,394 24,591,518 Eliminations (37,367,394) (24,591,518) -- -- (37,367,394) (24,591,518)
Total revenue 66,509,903 36,401,335 41,060,851 25,935,366 107,570,754 62,336,700
Result
4,543,378 972,443 1,013,359 687,579 5,556,737 1,660,022
Finance costs (1,937,653) (1,791,541) Other expenses (974,353) (716,106) Interest income 471,850 367,604 Taxation (386,430) (182,703)
Profit / (Loss) for the period 2,730,153 (662,724)
Other InformationDepreciation 2,875,968 2,684,601 56,043 55,096 2,932,011 2,739,697
Segment results - profit
------------------------------ (Rupees in '000) --------------------------------
Oil Refining Petroleum Marketing Total

THIRD QUARTER REPORT 2018 24
Notes to the Consolidated Condensed InterimFinancial StatementsFor the nine months period ended 31 March 2018
DirectorChief Executive Chief Financial Officer
Following corresponding figures have been reclassified for better presentation:
From To Rs. '000
Long term Loans and Advances Loans and advances 830,000 Long term financing Accrued and deferred markup 8,429,727 Accrued mark-up Long-term deposits 301,869 Selling and distribution expenses Cost of Sales 230,010 Selling and distribution expenses Gross turnover 1,194,674 Finance Cost Cost of Sales 140,621
15 DATE OF AUTHORIZATION FOR ISSUE
This consolidated condensed interim financial information was authorised for issue on 30th April 2018by the Board of Directors of the Company.
14 RECLASSIFICATION