Embed Size (px)
Citation preview

Third-Quarter 2017 Earnings Conference
Call Presentation October 26, 2017

Forward‐Looking Statements This presentation contains forward-looking statements within the meaning of federal securities laws regarding MPLX LP (“MPLX”) and Marathon Petroleum Corporation (“MPC”). These forward-looking statements relate to, among other things, expectations, estimates and projections concerning the business and operations of MPLX and MPC, including proposed strategic initiatives and our value creation plans. You can identify forward-looking statements by words such as “anticipate,” “believe,” “design,” “estimate,” “expect,” “forecast,” “goal,” “guidance,” “imply,” “intend,” “objective,” “opportunity,” “outlook,” “plan,” “position,” “pursue,” “prospective,” “predict,” “project,” “potential,” “seek,” “strategy,” “target,” “could,” “may,” “should,” “would,” “will” or other similar expressions that convey the uncertainty of future events or outcomes. Such forward-looking statements are not guarantees of future performance and are subject to risks, uncertainties and other factors, some of which are beyond the companies’ control and are difficult to predict. Factors that could cause MPLX’s actual results to differ materially from those implied in the forward-looking statements include: negative capital market conditions, including an increase of the current yield on common units, adversely affecting MPLX’s ability to meet its distribution growth guidance; the time, costs and ability to obtain regulatory or other approvals and consents and otherwise consummate the strategic initiatives discussed herein and other proposed transactions; the satisfaction or waiver of conditions in the agreements governing the strategic initiatives discussed herein and other proposed transactions; our ability to achieve the strategic and other objectives related to the strategic initiatives discussed herein and other proposed transactions; adverse changes in laws including with respect to tax and regulatory matters; inability to agree with respect to the timing of and value attributed to assets identified for dropdown and/or the general partner economic interests; the adequacy of MPLX’s capital resources and liquidity, including, but not limited to, availability of sufficient cash flow to pay distributions and access to debt to fund anticipated dropdowns on commercially reasonable terms, and the ability to successfully execute its business plans and growth strategy; the timing and extent of changes in commodity prices and demand for crude oil, refined products, feedstocks or other hydrocarbon-based products; continued/further volatility in and/or degradation of market and industry conditions; changes to the expected construction costs and timing of projects; completion of midstream infrastructure by competitors; disruptions due to equipment interruption or failure, including electrical shortages and power grid failures; the suspension, reduction or termination of MPC’s obligations under MPLX’s commercial agreements; modifications to earnings and distribution growth objectives; the level of support from MPC, including dropdowns, alternative financing arrangements, taking equity units, and other methods of sponsor support, as a result of the capital allocation needs of the enterprise as a whole and its ability to provide support on commercially reasonable terms; compliance with federal and state environmental, economic, health and safety, energy and other policies and regulations and/or enforcement actions initiated thereunder; adverse results in litigation; changes to MPLX’s capital budget; other risk factors inherent to MPLX’s industry; and the factors set forth under the heading “Risk Factors” in MPLX’s Annual Report on Form 10-K for the year ended Dec. 31, 2016, filed with the Securities and Exchange Commission (SEC). Factors that could cause MPC’s actual results to differ materially from those implied in the forward-looking statements include: the time, costs and ability to obtain regulatory or other approvals and consents and otherwise consummate the strategic initiatives discussed herein; the satisfaction or waiver of conditions in the agreements governing the strategic initiatives discussed herein; our ability to achieve the strategic and other objectives related to the strategic initiatives discussed herein; our ability to manage disruptions in credit markets or changes to our credit rating; adverse changes in laws including with respect to tax and regulatory matters; inability to agree with the MPLX conflicts committee with respect to the timing of and value attributed to assets identified for dropdown and/or the general partner economic interests; changes to the expected construction costs and timing of projects; continued/further volatility in and/or degradation of market and industry conditions; the availability and pricing of crude oil and other feedstocks; slower growth in domestic and Canadian crude supply; the effects of the lifting of the U.S. crude oil export ban; completion of pipeline capacity to areas outside the U.S. Midwest; consumer demand for refined products; transportation logistics; the reliability of processing units and other equipment; MPC’s ability to successfully implement growth opportunities; the impact of adverse market conditions affecting MPLX’s midstream business; modifications to MPLX earnings and distribution growth objectives, and other risks described above with respect to MPLX; compliance with federal and state environmental, economic, health and safety, energy and other policies and regulations, including the cost of compliance with the Renewable Fuel Standard, and/or enforcement actions initiated thereunder; adverse results in litigation; changes to MPC’s capital budget; other risk factors inherent to MPC’s industry; and the factors set forth under the heading “Risk Factors” in MPC’s Annual Report on Form 10-K for the year ended Dec. 31, 2016, filed with the SEC. In addition, the forward-looking statements included herein could be affected by general domestic and international economic and political conditions. Unpredictable or unknown factors not discussed here, in MPLX’s Form 10-K or in MPC’s Form 10-K could also have material adverse effects on forward-looking statements. Copies of MPLX’s Form 10-K are available on the SEC website, MPLX’s website at http://ir.mplx.com or by contacting MPLX’s Investor Relations office. Copies of MPC’s Form 10-K are available on the SEC website, MPC’s website at http://ir.marathonpetroleum.com or by contacting MPC’s Investor Relations office.
Non-GAAP Financial Measures Adjusted EBITDA, distributable cash flow (DCF) and distribution coverage ratio are non-GAAP financial measures provided in this presentation. Adjusted EBITDA and DCF reconciliations to the nearest GAAP financial measure are included in the Appendix to this presentation. Adjusted EBITDA with respect to the joint-interest acquisition is calculated as cash distributions adjusted for maintenance capital, growth capital and financing activities. Distribution coverage ratio is the ratio of DCF attributable to GP and LP unitholders to total GP and LP distributions declared. Adjusted EBITDA, DCF and distribution coverage ratio are not defined by GAAP and should not be considered in isolation or as an alternative to net income attributable to MPLX, net cash provided by operating activities or other financial measures prepared in accordance with GAAP. The EBITDA forecasts related to certain projects were determined on an EBITDA-only basis. Accordingly, information related to the elements of net income, including tax and interest, are not available and, therefore, reconciliations of these non-GAAP financial measures to the nearest GAAP financial measures have not been provided.
2

Highlights
Completed acquisition of joint-interest ownership in certain pipeline and storage facilities from sponsor MPC
Evaluating MPC’s offer of remaining dropdown
Reported record third-quarter adjusted EBITDA of $538 million and distributable cash flow of $442 million with strong coverage ratio of 1.33x
Achieved record gathered, processed, and fractionated volumes
Declared 19th consecutive quarterly distribution increase to $0.5875 per common unit for the third-quarter 2017
Expect approximately 12% distribution growth in 2017; forecast double-digit distribution growth in 2018
3

Logistics & Storage Segment
4
MPC Refineries
MPLX Terminals: Owned and Part-owned
Tank Farms
MPLX Pipelines: Owned & Operated
MPLX Interest Pipelines: Operated by Others
Cavern
Barge Dock
Headquarters
Acquired joint-interest ownership in pipelines and storage facilities from MPC
– Explorer Pipeline
– Southern Access Extension Pipeline (SAX)
– Louisiana Offshore Oil Port (LOOP)
– LOCAP
Received first cash distribution for indirect interest in Bakken Pipeline system
Expansion of Ozark pipeline is progressing and expected to be complete in mid-2018

Gathering & Processing Segment
5
Marcellus & Utica Operations
Gathering
– Record volumes averaged over 2.3 Bcf/d
– Third-quarter volumes up ~25% versus the same quarter last year
Processing
– Record volumes averaged ~5.0 Bcf/d
– Commenced operations of Sherwood VIII in July
– Third-quarter volumes up ~15% versus the same quarter last year
(a)Based on weighted average number of days plant(s) in service. Excludes periods of maintenance
Processed Volumes
Area Available Capacity
(MMcf/d)(a)
Average Volume
(MMcf/d)
Utilization (%)
Marcellus 4,520 3,986 88% Houston 520 510 98%
Majorsville 1,070 937 88%
Mobley 920 654 71%
Sherwood 1,600 1,561 98%
Bluestone 410 324 79%
Utica 1,325 1,000 75% Cadiz 525 514 98%
Seneca 800 486 61%
3Q 2017 Total 5,845 4,986 85% 2Q 2017 Total 5,645 4,690 83%
Gathering & Processing Segment
6
Marcellus & Utica Fractionation
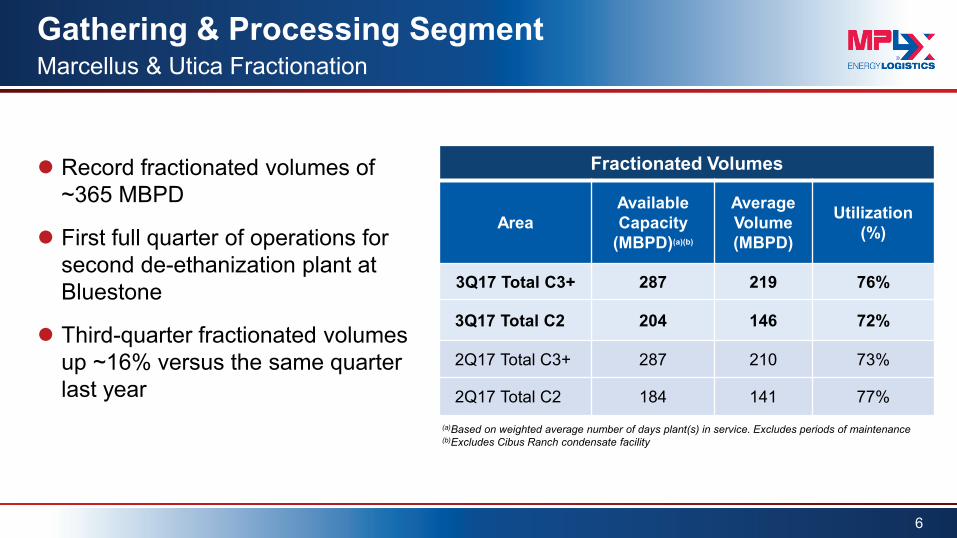
Record fractionated volumes of ~365 MBPD
First full quarter of operations for second de-ethanization plant at Bluestone
Third-quarter fractionated volumes up ~16% versus the same quarter last year
Fractionated Volumes
Area Available Capacity
(MBPD)(a)(b)
Average Volume (MBPD)
Utilization (%)
3Q17 Total C3+ 287 219 76%
3Q17 Total C2 204 146 72%
2Q17 Total C3+ 287 210 73%
2Q17 Total C2 184 141 77% (a)Based on weighted average number of days plant(s) in service. Excludes periods of maintenance (b)Excludes Cibus Ranch condensate facility

Gathering & Processing Segment Southwest Operations
Continued construction of gas processing plants in the Southwest
– Delaware Basin (Argo)
– STACK (Omega)
2017 YTD processed volumes up ~8% versus same period last year
(a)Based on weighted average number of days plant(s) in service. Excludes periods of maintenance (b)West Texas is composed of the Hidalgo plant in the Delaware Basin (c)Processing capacity includes Partnership’s portion of Centrahoma JV and excludes volumes sent to third parties
Processed Volumes
Area Available Capacity
(MMcf/d)(a)
Average Volume
(MMcf/d)
Utilization (%)
West Texas(b) 200 197 99%
East Texas 600 381 64%
Western OK 425 362 85%
Southeast OK(c) 120 120 100%
Gulf Coast 142 105 74%
3Q 2017 Total 1,487 1,165 78%
2Q 2017 Total 1,487 1,220 82%
7
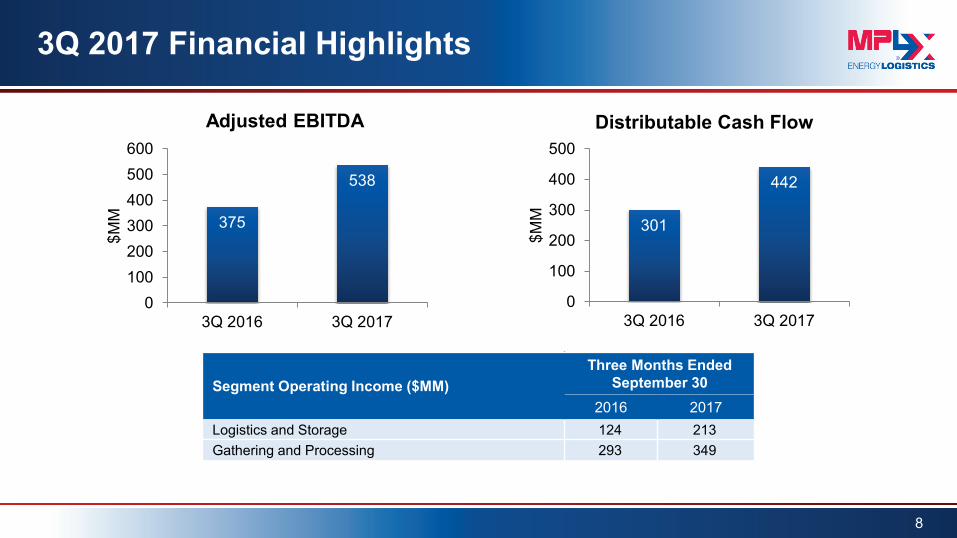
375
538
0100200300400500600
3Q 2016 3Q 2017
$MM
Adjusted EBITDA
3Q 2017 Financial Highlights
8
301
442
0
100
200
300
400
500
3Q 2016 3Q 2017
$MM
Distributable Cash Flow
Segment Operating Income ($MM) Three Months Ended
September 30 2016 2017
Logistics and Storage 124 213 Gathering and Processing 293 349

Adjusted EBITDA
9
3Q 2017 vs. 3Q 2016 Variance Analysis
375 28
64 13
58 538
0
100
200
300
400
500
600
3Q 2016 AdjustedEBITDA Attributable to
MPLX
Logistics & Storage 1Q 2017 Drop 3Q 2017 Drop Gathering & Processing 3Q 2017 AdjustedEBITDA Attributable to
MPLX
$MM

MPLX Capitalization, Leverage and Liquidity
10
($MM except ratio data) As of 9/30/17
Cash and cash equivalents 3
Total assets 19,238
Total debt(a) 7,051
Redeemable preferred units 1,000
Total equity 10,086
Consolidated total debt to LTM pro forma adjusted EBITDA(b) 3.6x
Remaining capacity available under $2.25 B revolving credit agreement 1,827
Remaining capacity available under $500 MM credit agreement with MPC 298
(a)Total debt includes $202 MM of outstanding intercompany borrowings classified in current liabilities as of September 30, 2017 (b)Calculated using face value total debt and LTM pro forma adjusted EBITDA, which is pro forma for acquisitions. Face value total debt includes approximately $428 MM of unamortized discount and debt issuance costs as of September 30, 2017.
2017 Forecast
Not revised since second-quarter 2017 earnings materials
Expect to finish 2017 above the high end of ranges provided with the exception of organic and maintenance capital expenditures, which are expected to finish below the range provided
Expect approximately 12% distribution growth in 2017
Forecast double-digit distribution growth in 2018
11

12
Appendix

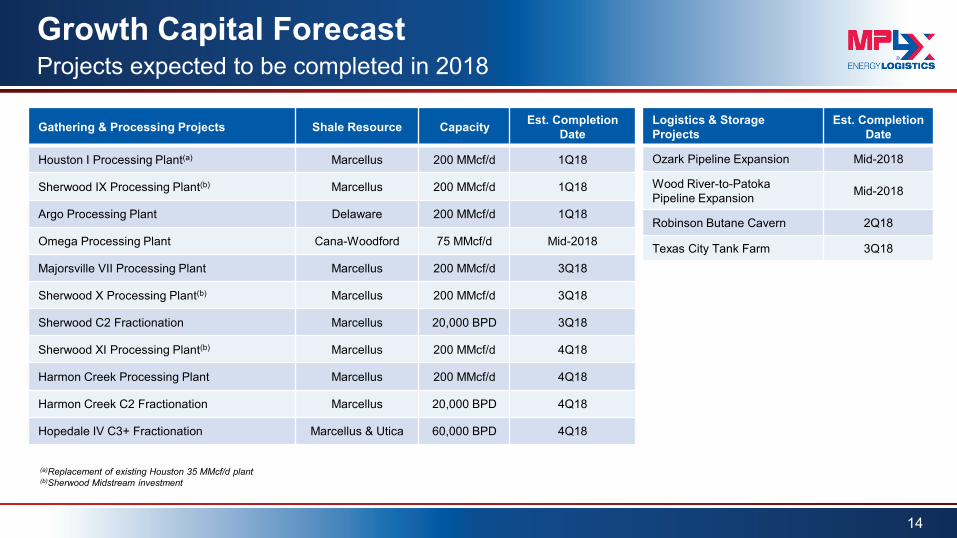
Growth Capital Forecast
13
Projects expected to be completed in 2017
(a)Utica Rich- and Dry-Gas Gathering is a joint venture between MarkWest Utica EMG’s and Summit Midstream LLC. Dry-Gas Gathering in the Utica Shale is completed through a joint venture with MarkWest and EMG. (b)MarkWest and MarkWest Utica EMG shared fractionation capacity (c)Sherwood Midstream investment
Gathering & Processing Projects Shale Resource Capacity Est. Completion Date
Rich- and Dry-Gas Gathering(a) Marcellus & Utica N/A Ongoing
Western Oklahoma - STACK Rich-Gas and Oil Gathering Cana Woodford N/A Ongoing
Hopedale III C3+ Fractionation and NGL Logistics(b)(c) Marcellus & Utica 60,000 BPD In Service - 1Q17
Sherwood VII Processing Plant(c) Marcellus 200 MMcf/d In Service - 1Q17
Bluestone C2 Fractionation Marcellus 20,000 BPD In Service - 3Q17
Sherwood VIII Processing Plant Marcellus 200 MMcf/d In Service - 3Q17
Majorsville II C2 Fractionation Marcellus 40,000 BPD 4Q17
NGL Pipeline Expansions Marcellus N/A 2017 and 2018
Logistics & Storage Projects
Est. Completion Date
Utica Build-out projects In Service – 3Q17
Midwest connectivity projects 4Q17
Growth Capital Forecast
14
Projects expected to be completed in 2018
(a)Replacement of existing Houston 35 MMcf/d plant (b)Sherwood Midstream investment
Gathering & Processing Projects Shale Resource Capacity Est. Completion Date
Houston I Processing Plant(a) Marcellus 200 MMcf/d 1Q18
Sherwood IX Processing Plant(b) Marcellus 200 MMcf/d 1Q18
Argo Processing Plant Delaware 200 MMcf/d 1Q18
Omega Processing Plant Cana-Woodford 75 MMcf/d Mid-2018
Majorsville VII Processing Plant Marcellus 200 MMcf/d 3Q18
Sherwood X Processing Plant(b) Marcellus 200 MMcf/d 3Q18
Sherwood C2 Fractionation Marcellus 20,000 BPD 3Q18
Sherwood XI Processing Plant(b) Marcellus 200 MMcf/d 4Q18
Harmon Creek Processing Plant Marcellus 200 MMcf/d 4Q18
Harmon Creek C2 Fractionation Marcellus 20,000 BPD 4Q18
Hopedale IV C3+ Fractionation Marcellus & Utica 60,000 BPD 4Q18
Logistics & Storage Projects
Est. Completion Date
Ozark Pipeline Expansion Mid-2018
Wood River-to-Patoka Pipeline Expansion Mid-2018
Robinson Butane Cavern 2Q18
Texas City Tank Farm 3Q18

Commodity Price Sensitivities
~95% fee-based net operating margin, 5% commodity exposure for 2017 Maintain active hedging program with ~35% of our 2017 commodity exposure
currently hedged Annual 2017 sensitivities to commodity price changes (assumes no hedges):
15
NOTE: Net operating margin is calculated as segment revenues less purchased product costs less total derivative gain (loss) related to purchased product costs. (a)C2 + NGL pricing based on Mont Belvieu prices assuming an NGL barrel of approximately 35 percent ethane, 35 percent propane, six percent Iso-Butane, 12 percent normal butane and 12 percent natural gasoline.
Product Commodity Price Change Annual DCF Impact
Natural Gas Liquids (Mont Belvieu) $.05 per weighted average gallon(a) ~$18 MM
Crude Oil (WTI) $1 per BBL ~$1 MM
Natural Gas (Henry Hub) $.50 per MMbtu <$1 MM

Reconciliation of Adjusted EBITDA and Distributable Cash from Net Income
16
(a)The Partnership makes a distinction between realized or unrealized gains and losses on derivatives. During the period when a derivative contract is outstanding, changes in the fair value of the derivative are recorded as an unrealized gain or loss. When a derivative contract matures or is settled, the previously recorded unrealized gain or loss is reversed and the realized gain or loss of the contract is recorded. (b)The Adjusted EBITDA and DCF adjustments related to the Predecessor are excluded from adjusted EBITDA attributable to MPLX LP and DCF prior to the acquisition dates. (c)MarkWest pre-merger EBITDA and undistributed DCF relates to MarkWest’s EBITDA and DCF from Oct. 1, 2015, through Dec. 3, 2015.
($MM) 2013 2014 2015 1Q 2016 2Q 2016 3Q 2016 4Q 2016 1Q 2017 2Q 2017 3Q 2017 Net income (loss) 211 239 333 (14) 72 194 182 187 191 217 Depreciation and amortization 70 75 129 136 151 151 153 187 164 164 Provision (benefit) for income taxes 1 1 1 (4) (8) - - - 2 1 Amortization of deferred financing costs - - 5 11 12 11 12 12 13 13 Non-cash equity-based compensation 1 2 4 2 4 3 1 3 3 4 Impairment expense - - - 129 1 - - - - - Net interest and other financial costs 1 5 42 57 52 53 53 66 74 80 (Income) loss from equity investments - - (3) (5) 83 (6) 2 (5) (1) (23) Distributions from unconsolidated subsidiaries - - 15 38 40 33 39 33 33 70 Distributions of cash received from joint-interest acquisition entities to MPC - - - - - - - - - (13)
Other adjustments to equity method investment distributions - - - - - - - - - 8 Unrealized derivative (gains) losses(a) - - (4) 9 12 2 13 (16) (3) 17 Acquisition costs - - 30 1 (2) - - 4 - 2 Adjusted EBITDA 284 322 552 360 417 441 455 471 476 540 Adjusted EBITDA attributable to noncontrolling interests (86) (69) (1) (1) - (2) - (1) (2) (2) Adjusted EBITDA attributable to Predecessor(b) (87) (87) (215) (57) (66) (64) (64) (47) - - MarkWest’s pre-merger EBITDA(c) - - 162 - - - - - - - Adjusted EBITDA attributable to MPLX LP 111 166 498 302 351 375 391 423 474 538 Deferred revenue impacts 17 (3) 6 3 4 1 8 8 9 8 Net interest and other financial costs (2) (6) (35) (57) (52) (53) (53) (66) (74) (80) Maintenance capital expenditures (19) (22) (49) (13) (20) (25) (26) (12) (23) (24) Portion of DCF adjustments attributable to Predecessor(b) - - 17 1 2 5 - 2 - - Other 7 2 (6) - - (2) (2) (1) 1 - Distributable cash flow pre-MarkWest undistributed 114 137 431 236 285 301 318 354 387 442 MarkWest undistributed DCF(c) - - (32) - - - - - - -
Distributable cash flow attributable to MPLX LP 114 137 399 236 285 301 318 354 387 442
Preferred unit distributions - - - - (9) (16) (16) (16) (17) (16) Distributable cash flow available to GP and LP unitholders 114 137 399 236 276 285 302 338 370 426
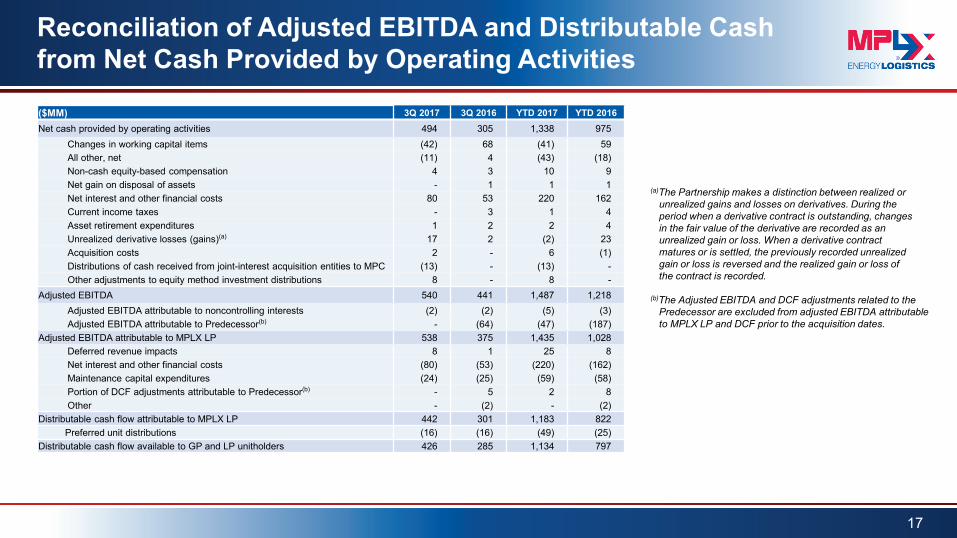
Reconciliation of Adjusted EBITDA and Distributable Cash from Net Cash Provided by Operating Activities
17
(a)The Partnership makes a distinction between realized or unrealized gains and losses on derivatives. During the period when a derivative contract is outstanding, changes in the fair value of the derivative are recorded as an unrealized gain or loss. When a derivative contract matures or is settled, the previously recorded unrealized gain or loss is reversed and the realized gain or loss of the contract is recorded. (b)The Adjusted EBITDA and DCF adjustments related to the Predecessor are excluded from adjusted EBITDA attributable to MPLX LP and DCF prior to the acquisition dates.
($MM) 3Q 2017 3Q 2016 YTD 2017 YTD 2016 Net cash provided by operating activities 494 305 1,338 975 Changes in working capital items (42) 68 (41) 59 All other, net (11) 4 (43) (18) Non-cash equity-based compensation 4 3 10 9 Net gain on disposal of assets - 1 1 1 Net interest and other financial costs 80 53 220 162 Current income taxes - 3 1 4 Asset retirement expenditures 1 2 2 4 Unrealized derivative losses (gains)(a) 17 2 (2) 23 Acquisition costs 2 - 6 (1) Distributions of cash received from joint-interest acquisition entities to MPC (13) - (13) - Other adjustments to equity method investment distributions 8 - 8 - Adjusted EBITDA 540 441 1,487 1,218 Adjusted EBITDA attributable to noncontrolling interests (2) (2) (5) (3) Adjusted EBITDA attributable to Predecessor(b) - (64) (47) (187) Adjusted EBITDA attributable to MPLX LP 538 375 1,435 1,028 Deferred revenue impacts 8 1 25 8 Net interest and other financial costs (80) (53) (220) (162) Maintenance capital expenditures (24) (25) (59) (58) Portion of DCF adjustments attributable to Predecessor(b) - 5 2 8 Other - (2) - (2) Distributable cash flow attributable to MPLX LP 442 301 1,183 822 Preferred unit distributions (16) (16) (49) (25) Distributable cash flow available to GP and LP unitholders 426 285 1,134 797

Segment Operating Income Reconciliation to Income From Operations
18
($MM) 3Q 2017 3Q 2016
L&S segment operating income attributable to MPLX 213 124
G&P segment operating income attributable to MPLX(a) 349 293
Segment portion attributable to equity affiliates (47) (41)
Segment portion attributable to Predecessor(b) - 74
Income from equity method investments 23 6
Other income – related parties 13 11
Unrealized derivative losses(c) (17) (2)
Depreciation and amortization (164) (151) General and administrative expenses (59) (56)
Income from operations 311 258
(a)All Partnership-operated, non-wholly owned subsidiaries are treated as if they are consolidated. (b)The operating income of the Predecessor is excluded from segment operating income attributable to MPLX LP prior to the acquisition dates. (c)The Partnership makes a distinction between realized or unrealized gains and losses on derivatives. During the period when a derivative contract is outstanding, changes in the fair value of the derivative are recorded as an unrealized gain or loss. When a derivative contract matures or is settled, the previously recorded unrealized gain or loss is reversed and the realized gain or loss of the contract is recorded.

19