Embed Size (px)
Citation preview

NAVAL POSTGRADUATE SCHOOL Monterey, California
THESIS
OPTIMIZED PROCUREMENT AND RETIREMENT PLANNING OF NAVY SHIPS AND AIRCRAFT
by
Ruben M. Garcia
December 2001
Thesis Advisors: Robert F. Dell Javier Salmeron Second Reader: Gerald G. Brown
Approved for public release; distribution is unlimited.

Report Documentation Page
Report Date 19 Dec 2001
Report Type N/A
Dates Covered (from... to) -
Title and Subtitle Optimized Procurement and Retirement Planning ofNavy Ships and Aircraft
Contract Number
Grant Number
Program Element Number
Author(s) Garcia, Ruben
Project Number
Task Number
Work Unit Number
Performing Organization Name(s) and Address(es) Naval Postgraduate School Monterey, California
Performing Organization Report Number
Sponsoring/Monitoring Agency Name(s) and Address(es)
Sponsor/Monitor’s Acronym(s)
Sponsor/Monitor’s Report Number(s)
Distribution/Availability Statement Approved for public release, distribution unlimited
Supplementary Notes
Abstract
Subject Terms
Report Classification unclassified
Classification of this page unclassified
Classification of Abstract unclassified
Limitation of Abstract UU
Number of Pages 78

THIS PAGE INTENTIONALLY LEFT BLANK

REPORT DOCUMENTATION PAGE Form Approved OMB No. 0704-0188 Public reporting burden for this collection of information is estimated to average 1 hour per response, including the time for reviewing instruction, searching existing data sources, gathering and maintaining the data needed, and completing and reviewing the collection of information. Send comments regarding this burden estimate or any other aspect of this collection of information, including suggestions for reducing this burden, to Washington headquarters Services, Directorate for Information Operations and Reports, 1215 Jefferson Davis Highway, Suite 1204, Arlington, VA 22202-4302, and to the Office of Management and Budget, Paperwork Reduction Project (0704-0188) Washington DC 20503. 1. AGENCY USE ONLY (Leave blank)
2. REPORT DATE December 2001
3. REPORT TYPE AND DATES COVERED Master’s Thesis
4. TITLE AND SUBTITLE: Optimized Procurement and Retirement Planning of Navy Ships and Aircraft
6. AUTHOR(S) Garcia, Ruben M.
5. FUNDING NUMBERS
7. PERFORMING ORGANIZATION NAME(S) AND ADDRESS(ES) Naval Postgraduate School Monterey, CA 93943-5000
8. PERFORMING ORGANIZATION REPORT NUMBER
9. SPONSORING / MONITORING AGENCY NAME(S) AND ADDRESS(ES) Chief of Naval Operations, Assessment Division (N81)
10. SPONSORING / MONITORING AGENCY REPORT NUMBER
11. SUPPLEMENTARY NOTES The views expressed in this thesis are those of the author and do not reflect the official policy or position of the Department of Defense or the U.S. Government. 12a. DISTRIBUTION / AVAILABILITY STATEMENT Approved for public release; distribution is unlimited.
12b. DISTRIBUTION CODE
13. ABSTRACT (maximum 200 words) The Capital Investment Planning Aid with Air Planning Update (CIPA APU) is a force structure planning tool that can be used to suggest ship, submarine, and aircraft procurement and retirement schedules over a 30-year horizon. These plans represent over a $1 Trillion commitment to ensure the Navy stays capable to fulfill its missions. Navy long-range force structure planners at the Chief of Naval Operations, Assessment Division (N81), currently manually prepare alternate future ship, submarine, and aircraft procurement and retirement schedules and evaluate these with a contractor-developed spreadsheet tool. This tool, the Extended Planning Annex/Total Obligated Authority (EPA/TOA) model, estimates the financial impact of any complete future plan over a 30-year horizon. While manually preparing such plans, N81 Force Structure Planners must consider annual budget, industrial base, and force structure requirements expressed in terms of the number of platforms needed to support a mission. With yearly time fidelity, CIPA APU replaces manual planning with optimized budget planning, with, for example, 19 mission areas, 19 ship classes, 58 aircraft types, five ship-production facilities, and three categories of money. CIPA APU tracks average aircraft age, expected attrition, and allows planners to specify a platform’s mission suitability. It also provides expeditious feedback to requests for alternate scenario feasibility and budget impact. We demonstrate CIPA APU capabilities using a few realistic scenarios.
15. NUMBER OF PAGES
78
14. SUBJECT TERMS Operations Research, Integer Programming, Procurement, Capital Investments, Military Capital Budgeting, Optimization, Average Aircraft Age, Aircraft Effectiveness, Aircraft Attrition.
16. PRICE CODE
17. SECURITY CLASSIFICATION OF REPORT
Unclassified
18. SECURITY CLASSIFICATION OF THIS PAGE
Unclassified
19. SECURITY CLASSIFICATION OF ABSTRACT
Unclassified
20. LIMITATION OF ABSTRACT
UL
NSN 7540-01-280-5500 Standard Form 298 (Rev. 2-89) Prescribed by ANSI Std. 239-18
i

THIS PAGE INTENTIONALLY LEFT BLANK
ii


THIS PAGE INTENTIONALLY LEFT BLANK
iv

ABSTRACT
The Capital Investment Planning Aid with Air Planning Update (CIPA APU) is a
force structure planning tool that can be used to suggest ship, submarine, and aircraft
procurement and retirement schedules over a 30-year horizon. These plans represent over
a $1 Trillion commitment to ensure the Navy stays capable to fulfill its missions. Navy
long-range force structure planners at the Chief of Naval Operations, Assessment
Division (N81), currently manually prepare alternate future ship, submarine, and aircraft
procurement and retirement schedules and evaluate these with a contractor-developed
spreadsheet tool. This tool, the Extended Planning Annex/Total Obligated Authority
(EPA/TOA) model, estimates the financial impact of any complete future plan over a 30-
year horizon. While manually preparing such plans, N81 Force Structure Planners must
consider annual budget, industrial base, and force structure requirements expressed in
terms of the number of platforms needed to support a mission. With yearly time fidelity,
CIPA APU replaces manual planning with optimized budget planning, with, for example,
19 mission areas, 19 ship classes, 58 aircraft types, five ship-production facilities, and
three categories of money. CIPA APU tracks average aircraft age, expected attrition, and
allows planners to specify a platform’s mission suitability. It also provides expeditious
feedback to requests for alternate scenario feasibility and budget impact. We demonstrate
CIPA APU capabilities using a few realistic scenarios.
v

THIS PAGE INTENTIONALLY LEFT BLANK
vi

DISCLAIMER
The reader is cautioned that the computer programs developed in this research
may not have been exercised for all cases of interest. While every effort has been made,
within the time available, to ensure that the programs are free of computational and logic
errors, they cannot be considered validated. Any application of these programs without
additional verification is at the risk of the user.
vii

THIS PAGE INTENTIONALLY LEFT BLANK
viii

TABLE OF CONTENTS
I. PROCUREMENT AND RETIREMENT PLANNING FOR NAVY SHIPS AND AIRCRAFT ........................................................................................................ 1
II. BUDGET PLANNING STRATEGY......................................................................... 3 A. CHANGING PRIORITIES............................................................................ 3
1. New Administration ............................................................................ 3 2. World Events and Responses in Force Structure Planning ............ 5 3. New Systems......................................................................................... 6
B. N78 AND N81 METHODS............................................................................. 8 1. N78 Force Structure Planning ........................................................... 8 2. EPA/TOA at N81................................................................................. 9
C. CAPITAL INVESTMENT PLANNING AID (CIPA)................................. 9 D. A CIPA EXTENSION: GENERALIZING PROCUREMENT
PLANNING FOR NAVAL SHIPS AND AIRCRAFT (GENSA) ............. 10
III. OPTIMIZED PROCUREMENT AND RETIREMENT PLANNING FOR NAVY SHIPS AND AIRCRAFT............................................................................. 11 A. CIPA APU MODEL OVERVIEW .............................................................. 11 B. NEW CIPA APU MODEL FEATURES..................................................... 11
1. Air Budget Constraints..................................................................... 11 2. Aircraft Average Age ........................................................................ 12 3. Operating and Maintenance Costs as Function of Age ................. 12 4. Mission Effectiveness ........................................................................ 14
C. CIPA APU FORMULATION...................................................................... 14
IV. IMPLEMENTATION AND ANALYSIS................................................................ 17 A. IMPLEMENTATION................................................................................... 17 B. VARIABLES AND PARAMETERS........................................................... 18 C. RESULTS OF SEVERAL PLANNING EXCURSIONS........................... 19
1. Baseline Case ..................................................................................... 20 2. Excursion 1: Restrict CIPA APU to emulate a notional N81
Plan ..................................................................................................... 24 3. Excursion 2: OMN as Function of Age............................................ 28 4. Excursion 3: Mission Effectiveness.................................................. 30 5. Excursion 4: New Air Platforms...................................................... 32
V. CONCLUSIONS AND RECOMMENDATIONS.................................................. 35 A. CONCLUSIONS............................................................................................ 35 B. RECOMMENDATIONS.............................................................................. 35
APPENDIX. CIPA APU FORMULATION ................................................................... 37
LIST OF REFERENCES ..................................................................................................... 51
INITIAL DISTRIBUTION LIST ........................................................................................ 55 ix

THIS PAGE INTENTIONALLY LEFT BLANK
x

LIST OF FIGURES
Figure 1. An artist’s rendition of the Lockheed Martin Joint Strike Fighter (JSF) .......... 6 Figure 2. An artist’s rendition of the Boeing Unmanned Combat Air Vehicle
(UCAV)............................................................................................................. 8 Figure 3. An embellished Navy Times cover story photo of a duct taped F-14A.......... 13 Figure 4. Baseline, CIPA APU TACAIR Inventory Projection.. ................................... 23 Figure 5. Baseline, CIPA APU Air Budget Chart.. ........................................................ 23 Figure 6. Notional N81 TACAIR Inventory Projection... .............................................. 24 Figure 7. Excursion 1a, CIPA APU TACAIR Inventory Projection.. ............................ 25 Figure 8. Excursion 1a, CIPA APU Air Budget Projection.. ......................................... 25 Figure 9. Excursion 1b, CIPA APU Inventory Projection.............................................. 26 Figure 10. Excursion 1b, CIPA APU Air Budget Projection.. ......................................... 27 Figure 11. Excursion 2, CIPA APU Inventory Projection................................................ 29 Figure 12. Excursion 2, CIPA APU Air Budget Projection.. ........................................... 29 Figure 13. Excursion 3, CIPA APU Inventory Projection................................................ 31 Figure 14. Excursion 3, CIPA APU Air Budget Projection.. ........................................... 31 Figure 15. Excursion 4, CIPA APU Inventory Projection................................................ 33 Figure 16. Excursion 4, CIPA APU Air Budget Projection.. ........................................... 33
xi

THIS PAGE INTENTIONALLY LEFT BLANK
xii

LIST OF TABLES
Table 1. Initial FY04 Aircraft Age Inventory.. ............................................................. 18 Table 2. Air Budget and Cumulative Air Budget Table (Billions of Dollars).. ............ 20 Table 3. Air Mission Budget and Cumulative Air Mission Budget Table (Billions
of Dollars).. ..................................................................................................... 20 Table 4. Yearly F18F Procurement Limits.................................................................... 21 Table 5. Revised Yearly F18F Procurement Limits...................................................... 26 Table 6. OMN as Function of Aircraft Age.. ................................................................ 28 Table 7. Relative Aircraft Mission Effectiveness for Strike Fighter and Ground
Attack Air Missions.. ...................................................................................... 30
xiii

THIS PAGE INTENTIONALLY LEFT BLANK
xiv

LIST OF ACRONYMS
APN Aircraft Procurement Navy CBO Congressional Budget Office CIPA APU Capital Investment Planning Aid Air Planning Update EPA/TOA Extended Planning Annex/Total Obligation Authority FY Fiscal Year FYDP Fiscal (Future) Years Defense Plan ISR Intelligence Surveillance and Reconnaissance JSF Joint Strike Fighter JSFN Joint Strike Fighter, Navy Variant JSFMC Joint Strike Fighter, Marine Corps Variant N78 Chief of Naval Operations, Air Warfare Division N81 Chief of Naval Operations, Assessment Division OMN Operation and Maintenance Navy O&M Operating and Maintenance OPN Other Procurement Navy PMAA Primary Mission Aircraft Authorized QDR Quadrennial Defense Review RDT&E Research Development Test and Evaluation SCN Ship Conversion Navy SEAD Suppression of Enemy Air Defenses STOVL Short Take-Off and Vertical Landing TACAIR Tactical Aircraft TOA Total Obligation Authority UAV Unmanned Air Vehicle UCAV Unmanned Combat Air Vehicle
xv

THIS PAGE INTENTIONALLY LEFT BLANK
xvi

EXECUTIVE SUMMARY
The Capital Investment Planning Aid with Air Planning Update (CIPA APU) is a
force structure planning tool that can be used to suggest ship, submarine, and aircraft
procurement and retirement schedules over a 30-year horizon. These plans represent over
a $1 Trillion commitment to ensure the Navy stays ready to fulfill its missions. Navy
long-range force structure planners at the Chief of Naval Operations, Assessment
Division (N81), currently manually prepare alternate future ship, submarine, and aircraft
procurement and retirement schedules and evaluate these with a contractor-developed
spreadsheet tool. When provided a complete procurement and retirement schedule as
input, this tool, the Extended Planning Annex/Total Obligated Authority (EPA/TOA)
model, estimates the financial impact of any complete future plan over a 30-year horizon.
CIPA APU replaces manual planning with optimization, recommending the best
yearly force structure procurement plan based on industrial constraints, budget
constraints, mission inventory requirements, and force mix requirements. CIPA APU
allows budget violations in some years that can be repaid by other savings in other years.
This is accomplished with long-term, cumulative budget goals. Given constraints for a
planning scenario, CIPA APU recommends an optimum solution. CIPA APU can
emulate EPA/TOA if CIPA APU’s discretionary variables are all fixed to constant
values. But, as a prescriptive model, CIPA APU suggests optimum solutions that might
not otherwise be discovered by manual planning and EPA/TOA evaluation.
CIPA APU builds on a prior CIPA optimization-based decision support system
that has been custom built for N81 and packaged in a user-friendly graphic user interface.
This thesis focuses on improving the underlying optimization modeling for aircraft
procurement and retirement scheduling with the expectation that these new features will
be added to the custom built decision support system. Most CIPA APU improvements
center around tracking aircraft average age. Such tracking allows CIPA APU to model
increasing Operation and Maintenance Navy (OMN) costs as aircraft age increases and
model an age-dependent aircraft effectiveness of an aircraft type for a mission.
We demonstrate CIPA APU with a few realistic scenarios that plan for 19 mission
areas, 19 ship classes, 58 aircraft types, five ship-production facilities, and three
xvii

categories of money. These scenarios highlight how CIPA APU optimally alters
procurement and retirement schedules to respond to: increasing OMN costs as aircraft
ages increase; different effectiveness for aircraft performing Strike Fighter and Ground
Attack missions; and the introduction of Unmanned Air Vehicles (UAV) and Unmanned
Combat Air Vehicles (UCAV). Results show that explicit consideration of aircraft age
and varying effectiveness for mission performance have a pronounced effect on optimal
procurement and retirement planning.
CIPA is the only Navy decision support system that integrates aircraft and ship
procurement decisions with fiscal, industrial, and mission requirements to render the best
integrated long-term advice. When added to CIPA, the CIPA APU enhancements will
more realistically model the impact of aircraft procurement and retirement.
xviii

ACKNOWLEDGMENT
I thank my wife, Kim, and children, Zachary and Alexis, for their endless love
and support while I completed this master’s program and thesis.
I thank Professors Robert Dell, Javier Salmeron, and Gerald Brown for their
inspiration, dedication, expertise, and help completing this thesis. I have the utmost
respect for their teaching abilities and unflinching support for the Naval Postgraduate
School and the Department of Defense.
xix

THIS PAGE INTENTIONALLY LEFT BLANK
xx

I. PROCUREMENT AND RETIREMENT PLANNING FOR NAVY SHIPS AND AIRCRAFT
The U. S. Navy will spend more than $1 Trillion over the next 30 years to procure
ships, submarines, and aircraft that will keep it capable to fulfill its missions. Navy long-
range force structure planners at the Chief of Naval Operations, Assessment Division
(N81), currently manually explore alternate future ship, submarine, and aircraft
procurement and retirement schedules aided only by a contractor developed spreadsheet
tool. The spreadsheet tool, the Extended Planning Annex/Total Obligated Authority
(EPA/TOA) model, estimates the financial impact of any complete future plan over a 30-
year horizon. N81 Force Structure Planners must manually consider annual budget,
industrial base, and force structure requirements expressed in terms of the number of
platforms needed to support all missions required.
CIPA (Capital Investment Planning Aid), introduced by Field [1999], with the
aircraft extensions described here, is a force structure planning tool that complements the
EPA/TOA model. The changes to CIPA are referred to here collectively as CIPA APU
(Air Planning Update). CIPA APU allows Navy force structure planners to quickly
evaluate the impact of changes in budget and/or force structure requirements. For
scenarios considered in this thesis, CIPA APU optimizes annual procurement and
retirement planning for 25 years, 19 mission areas, 19 ship classes, 58 aircraft types, five
ship production facilities, and three categories of money. The 58 aircraft types support 14
of the 19 mission areas. In addition to the preexisting features of CIPA [Field 1999,
Baran 2000], CIPA APU now considers aircraft-specific budget constraints, aircraft
mission effectiveness, aircraft attrition, minimum and maximum average aircraft age,
minimum and maximum average aircraft age designated for a specific mission, and
minimum aircraft retirement age.
1

THIS PAGE INTENTIONALLY LEFT BLANK
2

II. BUDGET PLANNING STRATEGY
The Navy budget for Fiscal Year 2002 is $99 billion. As of 5 September 2001, the
2003 and beyond annual Navy budget was expected to be cut to $80 billion [Holzer
2001]. Since then, a new worldwide military operation lead by deployed Navy ships and
aircraft may have changed this forecast. The point is that budget and force structure
planners must constantly develop plans to respond to emergent guidance from the
Secretary of Defense and Chief of Naval Operations while meeting tight budget limits.
The priorities set within this guidance are always changing. CIPA APU augments current
force structure planning tools and ushers in the use of optimization based decision models
for N81 force structure and budget planning.
A. CHANGING PRIORITIES
N81 planners face many problems determining and dealing with force structure
priorities. Priorities change for many reasons including: a new President and
administration, world events, new technologies and systems. CIPA APU can help address
some of the competing priorities and allow planners to quickly explore optimized
solutions to their ever-changing environment. Below we provide many recent examples
of scenarios that must be considered by N81 Force Structure Planners.
1. New Administration
The Defense Planning Guidance (DPG) outlines the missions the U.S. military
services must fulfill to satisfy United States National Military Strategy. The George W.
Bush administration plan for sizing the force structure started with a pledge to put
strategy priorities first and budget priorities second [Scarborough 2001a]. President Bush
directed Defense Secretary Rumsfeld to conduct a total review of the 1.36 million person
armed forces and reorganize it to meet the 21st century threats. President Bush told our
troops, “We must put strategy first, then spending. Our defense vision will drive our
defense budget; not the other way around.” Rumsfeld requested a $329 billion 2002
budget, the largest one-year defense increase since the 1980’s. Rumsfeld implied that the
3

2002 budget is still considered far less funding than required to meet existing National
Military Strategy. Rumsfeld argued that the armed forces have been so under funded and
overused in the 1990s that one budget cycle cannot repair all the damage [Scarborough
2001a].
Rumsfeld stated that the average age of aircraft has gone up about 10 years since
the 1990s and high maintenance costs are consuming the budget [Thomas 2001]. The
Navy is forced to invest valuable maintenance man-hours on aircraft cannibalization,
transferring scarce parts from aircraft to aircraft. Rumsfeld states that the “ship-building
budget at the current rate is on a trajectory from 310 ships to 230 ships” [Thomas 2001].
The Bush administration’s challenge is persuading Congress to supply the money
necessary to fix this aging fleet.
The initial 2001 Quadrennial Defense Review (QDR) guidance stated that the
U.S. forces must be sized and shaped to concurrently perform three major tasks: defend
the U. S. against attacks on the homeland or on defense-related information
infrastructure; deter forward in critical areas of the world; and win decisively against an
adversary in any one of these critical areas of the world [Grossman 2001]. Secretary
Rumsfeld later revised the QDR guidance to eliminate the requirement to perform the
major tasks concurrently. This change to QDR guidance reflects the tough compromises
being made to fulfill mission requirements while meeting tight budget realities. Defense
planners acknowledge that the mismatch between strategy and resources has created a
very large number of budget shortfalls. One of these is military modernization. The
military wants to get away from having aircraft, ships, and other equipment that are
extremely old that drive up operating and maintenance costs [Weinberger 2001].
Facing future budgets as much as $20 billion less than what they expect to receive
in 2002, U.S. Navy officials are eyeing deep cuts in force structure, primarily in aviation
assets. Navy budget planners have been given guidance from Pentagon officials to expect
budgets in 2003 and beyond to be about $80 billion per year. This level is far below the
$99 billion the service is set to receive in 2002. Some of the proposed Naval aviation
cuts include retiring an aircraft carrier in 2004, retiring all AV-8B Harriers by 2005,
4

retiring all F-14s by 2006 instead of 2009, retiring two P-3 maritime patrol squadrons in
2004, and retiring two Naval Reserve P-3 squadrons in 2003 [Holzer 2001].
2. World Events and Responses in Force Structure Planning
World events impact our Defense budget and force structure planning. The USS
Cole attack [Navy Public Affairs Library, 2000] and the EP-3 collision with a Chinese
fighter [Navy Public Affairs Library, 2001] are recent examples with minimal initial
impact on Naval inventories, but with potential widespread influence on force structure
planning.
On 11 September 2001, terrorists crashed two hijacked commercial airliners into
the twin towers of the World Trade Center in New York and a third jet into the Pentagon
[Rhem 2001]. In the wake of these terrorist attacks, Congress approved $40 billion in
emergency defense funds. The Pentagon plans to spend half of the first $2.5 billion
installment on intelligence upgrades and is expected to spend an additional $1 billion
with the next installment [Capaccio 2001]. The Pentagon plan is to improve Intelligence
Surveillance and Reconnaissance (ISR) aircraft and to buy more unmanned
reconnaissance planes and privately-owned satellite imagery. The Pentagon wants more
specialized airborne and ground sensors that can spot and analyze fixed or moving
targets. The 2001 QDR now includes specific allocations of money and tasks to
homeland defense [Liang 2001]. It will take almost a year after the 2001 QDR release to
refine the areas involving personnel, the National Guard, and Reserves. Part of the first
installment includes $200 million for repairs to the Pentagon and increased fuel costs;
$196 million for increased flying hours, maintenance, ship steaming, and mobilizing the
National Guard.
The 11 September 2001 terrorist attacks have increased efforts to upgrade the
Pentagon's aging fleets of surveillance and tanker aircraft. The Navy is considering
accelerating purchases of C-40 transport planes to replace its much older C-9 cargo
planes [Pasztor et al. 2001].
Since President Bush declared war on terrorism, more money has been promised
to the Defense Department. The QDR retains 12 Navy carriers [Scarborough 2001b].
5

The big question is whether more money will be available to upgrade the rest of the fleet.
Anti-terrorist operations will place more wear and tear on the combat fleet that is already
in urgent need of updated platforms. Another question is what additional money will be
provided to pay for operating and maintaining the Navy’s ships and planes already
deployed in support of the war on terrorism. The United States must be prepared for
homeland defense and information warfare in the wake of recent events.
3. New Systems
New technologies and systems change the way we perceive and react to threats.
These altered perceptions serve to shape our National Military Strategy, the Defense
Planning Guidance, and consequently our force structure planning. The tri-service, multi-
national Joint Strike Fighter (JSF) program (Figure 1), V-22 Osprey, Unmanned Combat
Air Vehicle (UCAV), and Unmanned Air Vehicle (UAV), are aircraft examples that will
impact our force structure for the next decade and beyond.
Figure 1. An artist’s rendition of the Lockheed Martin Joint Strike Fighter (JSF). The procurement plan calls for the Navy to buy 480 carrier versions and 609 Marine Corps short take-off and vertical landing (STOVL) versions. The $200 billion JSF contract is the largest in U.S. military history. Figure from - [LockheedMartin.com, 2001].
6

The Pentagon has been considering eliminating the Marine Corps’ short take-off
and vertical landing (STOVL) requirements from the JSF program to reduce costs and
speed up the overall JSF program schedule [Wolfe 2001]. One option being discussed is
an acceleration of the Navy JSF program and a termination of the Navy’s F/A-18E/F after
the current buy ends in FY04. The early lots of JSF are to be less capable than those
bought later. The current JSF procurement plan calls for the Navy to buy 480 Navy
carrier versions, and 609 Marine Corps STOVL versions to replace its AV-8B Harriers.
Many assumed the Pentagon would split the more than $200 billion JSF contract,
the largest in U.S. military history, to keep both main fighter-jet makers (Boeing and
Lockheed Martin) in the business for decades. If the contract were split, upfront costs
would jump between $900 million and $1.4 billion to accommodate the two separate
production lines. This was a contingency that Navy planners had to consider. Senator
Christopher Bond (R-MO) considered the added expense “well worth the price" for the
$200 billion JSF program as it would keep both companies in the fighter manufacturing
business and would preserve competition and make it easier to speed up production if
needed [Selinger 2001]. In the end, the Pentagon selected Lockheed Martin as the sole
contract winner.
The Marine Corps would get $592.3 million less than requested and build nine
instead of 12 V-22 Osprey tilt-rotor aircraft next year under the new defense bill
approved by the Senate Armed Services Committee [Whittle 2001]. A special Pentagon
panel recommended that the Pentagon hold Osprey production to a minimum while flaws
that led to one of last year's crashes are fixed. The Marines want 360 V-22s to replace
Vietnam-era helicopters.
To reduce combat fatalities, new systems such as the Predator Unmanned Air
Vehicle (UAV) are being used to support Intelligence Surveillance and Reconnaissance
missions while minimizing risk to our pilots and aircrew. The Unmanned Combat Air
Vehicle (UCAV), Figure 2, is the next step toward minimizing combat fatalities while
supporting two major combat roles: Suppression of Enemy Air Defenses (SEAD) and
precision strike. The initial operational capability of the UCAV system is now planned
for approximately 2010 [Baker 2001].
7

Figure 2. An artist’s rendition of the Boeing Unmanned Combat Air Vehicle (UCAV). The UCAV is the next step toward minimizing combat fatalities while supporting two major combat roles: Suppression of Enemy Air Defenses and precision strike. Figure from - [Boeing.com, 2001].
The multi-billion dollar JSF, V-22, UAV, and UCAV programs may affect our
defense budget for decades and significantly alter the way we prepare for and fight future
battles. Force structure planners require flexible tools to deal with new system
capabilities, uncertainties, and vulnerabilities.
B. N78 AND N81 METHODS
The Chief of Naval Operations, Air Warfare Division (N78), works closely with
N81 to shape present and future Naval Aviation warfighting capabilities. N78 determines
required aviation force levels necessary to support our National Military Strategy and
Defense Planning Guidance. N81 incorporates N78 inputs into the overall Navy force
structure plan.
1. N78 Force Structure Planning
Force structure planners at N78 must maintain air warfighting capabilities to meet
present and future threats, using aircraft modernization, procurement, and retirement 8

scheduling. Currently, planners strive to support 10 active and 1 reserve Carrier Air
Wings (CVW) with at least 50 tactical aircraft and support aircraft per wing [Paine and
Drohr 2000]. Planners must also support 3 active and 1 reserve Marine Air Wings. The
inventory required for each specific aircraft is determined by first establishing the number
of squadrons of that type of aircraft that will support each wing. The total Primary
Mission Aircraft Authorized (PMAA) number of squadrons multiplied by number of
aircraft per squadron is the basis for all future inventory calculations [Paine and Drohr
2000]. To determine an overall procurement objective for each aircraft, the PMAA must
be supplemented to account for training aircraft, test and evaluation aircraft, and aircraft
undergoing maintenance. Fleet Replacement Squadron (FRS) training aircraft account for
about a 25% inventory increase. Research, Development, Test and Evaluation (RDT&E)
aircraft account for about a 7% increase. Aircraft in the maintenance pipeline add about
10%. Finally, planners must adjust for annual aircraft attrition, which ranges from a
fraction of a percent to almost 3% per year depending on the aircraft. The grand total of
the above adjustments results in a procurement objective for each aircraft.
2. EPA/TOA at N81
N81 contracts with Systems Planning and Analysis, Incorporated, to maintain the
EPA/TOA model. EPA/TOA is a series of 62 linked spreadsheets that are manually
manipulated to reflect planning considerations and scenario development. The EPA/TOA
model estimates long-range Navy force structure costs. This cost estimation is based on a
manually prepared input with a procurement, delivery, and retirement schedule. Field
[1999] presents an N81 planning review that is still current at this writing.
C. CAPITAL INVESTMENT PLANNING AID (CIPA)
The Capital Investment Planning Aid (CIPA) is designed to augment the
EPA/TOA model by using optimization to replace much of the manual work performed
by EPA/TOA contractors and N81 planners. CIPA has been tested with a 25-year
planning horizon with eight mission areas, 19 ship classes, five aircraft types, five
production facilities, and three categories of money. CIPA recommends the best yearly
force structure procurement plan based on industrial constraints, budget constraints, 9

mission inventory requirements, and force mix requirements. CIPA allows budget
violations in some years that can be repaid by other savings in other years. Given
constraints for a planning scenario, CIPA recommends an optimum solution. CIPA can
emulate EPA/TOA if CIPA’s discretionary variables are all fixed to constant values. But,
as a prescriptive model, CIPA suggests optimum solutions that might not otherwise be
discovered by manual planning and EPA/TOA evaluation. CIPA has been demonstrated
for a 25-year plan with a representative subset of ships, submarines, aircraft, and three
major budget categories. [Field 1999]
D. A CIPA EXTENSION: GENERALIZING PROCUREMENT PLANNING FOR NAVAL SHIPS AND AIRCRAFT (GENSA)
Generalizing Procurement Planning for Naval Ships and Aircraft (GENSA),
extends CIPA to include additional ship classes, aircraft types, and Manpower Navy
(MPN) funding [Baran 2000]. GENSA extends the planning horizon to 30 years, 29
mission areas, 45 ship classes, 30 aircraft types, and 13 production facilities. GENSA is
designed to add more detail to the CIPA model while easing post-optimization analysis.
10

III. OPTIMIZED PROCUREMENT AND RETIREMENT PLANNING FOR NAVY SHIPS AND AIRCRAFT
A. CIPA APU MODEL OVERVIEW
CIPA APU optimizes, with annual fidelity over a 25-year planning horizon,
procurement and retirement planning for 58 aircraft types supporting 14 air mission areas
while considering several categories of budget constraints, aircraft mission effectiveness,
aircraft attrition, minimum and maximum average aircraft age, minimum and maximum
average aircraft age designated for a specific mission, and minimum aircraft retirement
age. CIPA APU has incorporated air budget constraints to allow flexibility to meet both
political and warfare community priorities while striving for optimum overall Navy
budget usage. CIPA APU models increased operating and maintenance costs as each
aircraft ages, accounts for aircraft average ages, and accumulates expected flight hours.
Tracking age also allows us to assess mission performance as a function of average age
and to plan realistic retirement scheduling based on age. Aircraft inventory is also
adjusted according to historical attrition rates that are reflected in CIPA APU as the
yearly survival rate of each aircraft.
B. NEW CIPA APU MODEL FEATURES
1. Air Budget Constraints
Officials believe the Navy needs to explore new long-term operational and force
concepts to provide better information on future requirements and capabilities [General
Accounting Office (GAO) 2001]. The GAO concluded that “implementing the Navy’s
transformation will be complicated and will require careful consideration of near-term
needs, as well as fundamental changes in the force structure, concepts, and organizations
required to meet future security challenges within likely budgets” [GAO 2001 p.16]. The
GAO suggests this transformation will involve using improved decision support systems
performing resource and asset optimization [GAO 2001 p.21].
11

Budget is a major factor determining a force structure plan. Currently, planners
explore force structure scenarios that are bounded by budget limits. In FY2001, the Air
Procurement Navy (APN) limit was nominally $6.2 billion, with TACAIR receiving half
[Ruck 2001]. These seemingly arbitrary limits serve as good starting points as the Navy
divides up its total service budget. When no bounds are set on overall APN and specific
mission APN, CIPA APU will spend as much as needed to meet overall Navy budget and
air mission requirements. CIPA APU introduces cumulative elastic [Brown, Dell, and
Wood 1997] air budget and air mission budget constraints to replicate planning limits.
The elastic variables allow budget violations in some years that can be repaid in others.
This flexibility can be key when trying to start production of a new airframe.
2. Aircraft Average Age
Reduced procurement in the 1990s has left the military with aging aircraft that are
increasingly expensive to maintain [Congressional Budget Office (CBO) 2001]. Many
aircraft are being flown well beyond their expected service life in order to meet crucial
mission needs. The force structure plan must retire its aging aircraft while replacing those
aircraft with an affordable mix of new and upgraded aircraft.
Brown, Clemence, Tuefert, and Wood [1991] develop a large-scale capital
budgeting model, named PHOENIX, to aid Army helicopter force planners modernize an
aging Army fleet composed of Vietnam era aircraft. CIPA APU uses average age
constraints similar to those in the PHOENIX model. As an aircraft inventory reaches the
maximum average age limit, older aircraft provide a retirement option to balance mission
inventory needs with maximum age limits. Violations of maximum average age may be
tolerated with a policy penalty to discourage excessive delays of necessary retirements.
3. Operating and Maintenance Costs as Function of Age
The Navy’s aircraft inventory is aging and it is the only Navy weapon system type
that has significantly increased in average age. Over the last 20 years, aircraft average age
has risen from 11 years to more than 16 years. In contrast, the average age of ships has
changed very little.
12
The aging aircraft (Figure 3) inventory has required more funding to maintain
older equipment at the expense of new procurement, which has in turn lead to even older
systems being kept in inventory with still higher OMN costs [Congressional Budget
Office (CBO) 2001]. CBO agrees that aircraft do become more costly to maintain as they
age. Aircraft OMN increases by 1 percent to 3 percent for every additional year of age,
after adjusting for inflation. Aging aircraft, part shortages, and high operations tempo are
draining funds [Brown 2001].
CIPA APU indexes OMN costs by aircraft type and age. OMN costs can be
expressed as a function of aircraft age, which is more realistic than assuming OMN costs
remain fixed over the aircraft’s service life. Reality may conflict with planning: OMN
budgets are sometimes held fixed as an aircraft ages, resulting in parts shortfalls, reduced
mission capability, and reduced morale. If we plan for increasing costs, we prepare for a
likely future.
Figure 3. An embellished Navy Times cover story photo of a duct taped F-14A. Operating and Maintenance costs are increasing between one and three percent per year. Spare parts shortfalls are causing increased cannibalization and forcing Navy maintainers to work harder and smarter to maintain full mission-capable aircraft. Figure from - [Fondersmith, 2001].
13

4. Mission Effectiveness
Each aircraft type within a mission area may have different effectiveness from its
cohorts. The F18AB may be less effective than the proposed JSFN in the Strike Fighter
air mission area. It is difficult to quantify relative mission effectiveness.
The F/A-18E/F program conducted a detailed analysis to determine the overall
combat effectiveness of its aircraft [Navy Public Affairs Library 1997]. A poll of experts,
aviators, aeronautical engineers, and intelligence specialists within the intelligence
community, were asked their opinion of aircraft capabilities in six important areas of
merit: maneuverability, range, radar signature, radar guided weapons, infrared weapons,
and avionics suite.
Mission effectiveness is evidently a function of the empty gross weight of an
aircraft and its vintage [Van Brabant 2001]. This makes sense because larger aircraft
usually have a longer range, can carry more weapons, have larger radar antennas and
power sources and thus have greater radar detection ranges. Conversely, a larger aircraft
might be less maneuverable and have a larger radar cross section. Because technology
changes significantly over time, the era in which an aircraft is conceived affects the
platform’s ability to integrate advanced weapons and avionics. Stealth, sensor integration,
and human factor improvements also affect combat performance and are a function of
aircraft vintage. CIPA APU uses aircraft and air mission average age constraints to limit
the number of aircraft kept in inventory beyond their service lives.
C. CIPA APU FORMULATION
The summary below outlines the primary model characteristics. The complete
CIPA APU formulation is found in the Appendix.
Main Decision Variables:
• number of aircraft to procure at the start of a fiscal year; • number of aircraft to retire at the end of a fiscal year that is a specific age; • number of ships to procure at the start of a fiscal year; • number of ships to retire at the end of a fiscal year; and
14

• magnitude of each constraint violation.
Objective Function: Minimize the penalty for violating constraints for the following areas:
Annual air and ship mission inventory; Annual aircraft and air mission average age; Annual and cumulative total budget; Annual air and cumulative air budget; Annual air mission and cumulative air mission budget; and Annual ship labor requirements.
Subject to the following annual constraints:
• Limit annual minimum ship inventory; • Limit the annual number of ships produced per plant; • Limit annual ship retirements; • Limit annual maximum ship-plant labor;
• Limit annual minimum aircraft inventory; • Limit the annual number of aircraft produced; • Limit annual aircraft retirements; • Limit annual maximum aircraft average age; • Limit annual maximum air mission average age;
• Limit minimum and maximum annual and cumulative total budget; • Limit minimum and maximum annual air and cumulative air budget; and • Limit minimum and maximum annual air mission and cumulative air mission
budget.
15

THIS PAGE INTENTIONALLY LEFT BLANK
16

IV. IMPLEMENTATION AND ANALYSIS
A. IMPLEMENTATION
CIPA APU is implemented in the General Algebraic Modeling System (GAMS)
[Brooke et al. 1998] with the CPLEX solver, Version 6.6 [ILOG 2001]. CIPA APU is a
mixed-integer linear program, which for a representative scenario exhibits about 114,000
equations and 167,000 variables, of which about 6,700 are binary variables. It generally
runs in less than 7 minutes on a personal computer equipped with a Pentium III 700 MHZ
processor and 1048 MB of RAM, when accepting any solution guaranteed to be within
10% of optimal.
CIPA APU adds new elastic constraints to the previous CIPA models [Field 1999,
Baran 2000]. CIPA APU uses upper and lower elastic constraints for the overall air
budget, cumulative air budget, air mission budget, and cumulative air mission budget
limits. Upper elastic constraints are used for maximum aircraft average age and air
mission average age limits.
CIPA APU introduces penalties associated with the new elastic variables. Similar
to the CIPA implementation, budget excesses and shortages are penalized at a 7% rate
(1.07 multiplied by the unit budget violation) and all other penalties are based on this
rate. Labor and mission penalties are unchanged from prior CIPA implementations [Field
1999, Baran 2000]. The penalty for violating average age constraints is equal to the
maximum OMN cost per year, for each respective aircraft or mission area. All of the
aforementioned penalty values, if active, are held constant for the entire planning
horizon.
CIPA APU schedules procurement only if production can be completed and
delivery accepted within the scenario’s planning horizon (FY04-FY28). Therefore, near
the end of this scenario’s planning horizon, procurements decrease to zero. For purposes
of results reported here, FY24 to FY28 may be truncated from the planning results
because those “end effects” portray unrealistic procurement and retirement scheduling.
17

B. VARIABLES AND PARAMETERS
Because CIPA APU needs to account for aircraft age, planning starts with the
expected aircraft inventory, rounded to the nearest integer year, at the beginning of the
planning horizon. Table 1 shows that the total F/A-18E inventory at the start of the
planning horizon, FY04, is expected to be 61.
Table 1. Initial FY04 Aircraft Age Inventory. For example, of 61 F18Es: 15 are two years old.
Aircraft Type Age (years) InventoryF18CD 58 0F18CD 59 0F18CD 60 0F18E 1 14F18E 2 15F18E 3 14F18E 4 5F18E 5 8F18E 6 0F18E 7 5F18E 8 0F18E 9 0F18E 10 0
. .
. .
. .
.
.
.
CIPA APU uses as much of the existing CIPA and EPA/TOA data as possible to
ensure model integration, consistency, and continuity. The most significant data changes
deal with the new constraints for overall APN, air mission APN, air mission average age,
aircraft average age, relative air mission effectiveness, and aircraft OMN costs.
Maximum APN is prototypically set to $6.2 billion annually, with a nominal
lower bound of $5.4 billion. These budget limits are held constant for the entire planning
horizon. Cumulative air budget limits are simply the sum of all previous annual yearly
budgets. Budget limits are also imposed on the Strike Fighter mission area, with a
maximum of $3.1 billion and a minimum of $2.7 billion. The other 13 air mission areas
have no separate air mission budget limits.
18

Aircraft average age limits are set using three different profiles. If the aircraft
average age at the start of the planning horizon is younger than it’s expected service life
(ESL), the maximum average age limit is held constant at the respective ESL. If the
aircraft has already exceeded it’s service life, either the maximum average age limit is
held constant somewhere above the ESL or it is set one year older than current average
age and linearly decreased until the ESL limit is reached. The third profile accounts for a
large variability in aircraft age associated with procuring aircraft over several years. In
this case, some individual aircraft will reach their ESL before the aircraft type average
age reaches the maximum age limit. This may cause an aircraft to remain in inventory
long after its ESL. To account for this, we set the maximum average age limit below the
ESL limit and linearly increase it until the ESL limit is reached. In this scenario, a
constant limit profile is predominantly used except in cases where the ESL is already
exceeded. In those cases, a linearly decreased limit is used as described above.
CIPA APU introduces survival, retirement, and air mission effectiveness
parameters. Yearly aircraft survival rates mimic EPA/TOA yearly attrition rates. The
minimum retirement age parameter limits aircraft to “retire no earlier than” 50% of ESL.
For example, if the F-14B’s ESL is 30 years, no F-14B is retired unless it is at least 15
years old. The mission effectiveness parameter values can be highly subjective and are all
initially set to 1.0. This means any aircraft assigned to a specific air mission is viewed as
fully capable to perform that air mission.
C. RESULTS OF SEVERAL PLANNING EXCURSIONS
We report on several realistic CIPA APU excursions. First, we present a baseline
case from which we compare the other excursions. Second, CIPA APU emulates a
notional N81 mission inventory example. Third, we increase OMN costs as a function of
increasing aircraft age. Fourth, we change relative Strike Fighter and Ground Attack air
mission effectiveness to explore planning impact. Finally, we include UAV and UCAV
to forecast how incorporating these new aircraft may impact overall force structure
planning.
19

1. Baseline Case
This baseline case includes air budget and air mission budget constraints as
depicted in Table 2 and 3 below.
Fiscal Year
Maximum Air Budget
Minimum Air
Budget
Maximum Cumulative Air Budget
Minimum Cumulative Air Budget
FY04 6.2 5.4 6.2 5.4FY05 6.2 5.4 12.4 10.8FY06 6.2 5.4 18.6 16.2FY07 6.2 5.4 24.8 21.6FY08 6.2 5.4 31.0 27.0FY09 6.2 5.4 37.2 32.4FY10 6.2 5.4 43.4 37.8
. . . . .
. . . . .
. . . . .Table 2. Air Budget and Cumulative Air Budget Table (Billions of Dollars). The maximum APN is set to $6.2 billion with a nominal lower bound of $5.4 billion. These budget limits are held constant for the entire planning horizon. Cumulative air budget limits are also derived from these yearly limits.
Air MissionFiscal Year
Maximum Budget
Minimum Budget
Maximum Cumulative
Budget
Minimum Cumulative
BudgetStrike Fighter FY04 3.1 2.7 3.1 2.7Strike Fighter FY05 3.1 2.7 6.2 5.4Strike Fighter FY06 3.1 2.7 9.3 8.1Strike Fighter FY07 3.1 2.7 12.4 10.8Strike Fighter FY08 3.1 2.7 15.5 13.5Strike Fighter FY09 3.1 2.7 18.6 16.2Strike Fighter FY10 3.1 2.7 21.7 18.9
. . . . . .
. . . . . .
. . . . . .Table 3. Air Mission Budget and Cumulative Air Mission Budget Table (Billions of Dollars). The maximum Strike Fighter air mission budget is $3.1 billion with a minimum budget of $2.7 billion. Cumulative air mission budget limit are derived from these limits.
The minimum yearly procurement limit is zero for all aircraft with a generous
maximum yearly procurement level set for those aircraft scheduled for procurement
during the planning horizon. Table 4 shows the F18F maximum procurement over the
planning horizon is 320 aircraft, 40 aircraft per year from FY04 through FY11. The N81
20

plan procures approximately 200 aircraft over that same time. Aircraft committed for
delivery in FY04 and FY05 are specific lots of aircraft which are purchased in FY02 and
FY03. Those aircraft will be delivered two years later and are viewed as committed
procurement in the year they are delivered.
Mission inventory levels are set high enough to require aircraft procurements to
meet mission inventory requirements. The Strike Fighter mission inventory level is 1100
aircraft, the Ground Attack mission inventory level is 500 aircraft. These levels match the
N81 TACAIR inventory level, 1300, and account for the 300 additional AH1 and UH1
helicopters included in the CIPA APU Ground Attack mission area.
Aircraft Type FY
Minimum Procurement
Maximum Procurement
Committed Procurement
F18F FY04 0 40 24F18F FY05 0 40 24F18F FY06 0 40 0F18F FY07 0 40 0F18F FY08 0 40 0F18F FY09 0 40 0F18F FY10 0 40 0F18F FY11 0 40 0F18F FY12 0 0 0F18F FY13 0 0 0F18F FY14 0 0 0
. . . . .
. . . . .
. . . . .Table 4. Yearly F18F Procurement Limits. The F18F maximum procurement over the planning horizon is 320 aircraft, 40 aircraft per year from FY04 through FY11. The N81 plan procures approximately 200 aircraft over that same time period.
Figure 4 shows the CIPA APU TACAIR inventory projection. CIPA APU
TACAIR inventory is Strike Fighter and Ground Attack mission areas combined without
attack helicopters. The TACAIR inventory goal is approximately 1300 aircraft. CIPA
APU aircraft procurements are restricted due to lack of sufficient funding. The most
inexpensive aircraft, F18E and F18F, are viewed more favorably for procurement than
the more expensive JSFN and JSFMC aircraft.
The overall air budget and TACAIR budget is shown in Figure 5. The CIPA APU
solution minimizes the penalties associated with violating the respective air budget and 21

air mission budget limits. The previously discussed end effects are apparent as
procurement spending goes to zero near the end of the planning horizon. Although budget
violations exist for both air and mission budget limits, the average yearly budget for the
planning horizon is less than the maximum yearly budget limit.
22

0
200
400
600
800
1000
1200
1400
1600
FY04FY05
FY06FY07
FY08FY09
FY10FY11
FY12FY13
FY14FY15
FY16FY17
FY18FY19
FY20FY21
FY22FY23
FY24FY25
FY26FY27
FY28
Fiscal Year
Airc
raft
Inve
ntor
y
JSFNJSFMCF18FF18EF18CDF18ABAV8BF14DF14BF14A
Figure 4. Baseline, CIPA APU TACAIR Inventory Projection. Planned procurements are restricted due to lack of sufficient funding. The most inexpensive aircraft, F18E and F18F, are viewed more favorably for procurement than the more expensive JSFN and JSFMC aircraft.
0
1000
2000
3000
4000
5000
6000
7000
8000
9000
FY04FY05
FY06FY07
FY08FY09
FY10FY11
FY12FY13
FY14FY15
FY16FY17
FY18FY19
FY20FY21
FY22FY23
FY24FY25
FY26FY27
FY28
Fiscal Year
Bud
get (
Mill
ions
)
Air Budget TACAIR Budget Max Air Budget Min Air Budget Max TACAIR Budget Min TACAIR Budget
“End Effects”
23
Figure 5. Baseline, CIPA APU Air Budget Chart. End effects are apparent as procurement spending goes to zero near the end of the planning horizon. The “bow wave” at the beginning of the planning horizon represents initial expenditures to repair deficiencies. These are repaid in later years. Although budget violations exist for both air and mission budget limits, the average yearly budget for the planning is less than the maximum yearly budget limit.

2. Excursion 1: Restrict CIPA APU to emulate a notional N81 Plan
CIPA APU can be forced to emulate a manual schedule and then results can be
compared with EPA/TOA. Figure 6 shows a notional N81 TACAIR inventory projection
as entered in EPA/TOA during May 2001. Figure 7 shows the CIPA APU emulation for
comparison. Retirement schedules differ slightly between the notional N81 plan and
those allowed in CIPA APU which accounts for the bow-wave in aircraft inventory,
FY10-FY18, as shown in Figure 7. The N81 TACAIR inventory level is relatively steady
throughout the planning horizon, Figure 6.
0
200
400
600
800
1000
1200
1400
1600
FY04FY05
FY06FY07
FY08FY09
FY10FY11
FY12FY13
FY14FY15
FY16FY17
FY18FY19
FY20FY21
FY22FY23
FY24FY25
FY26FY27
FY28
Fiscal Year
Airc
raft
Inve
ntor
y
JSFNJSFMCF18FF18EF18CDF18ABAV8BF14DF14BF14A
Figure 6. Notional N81 TACAIR Inventory Projection. This sample inventory projection attempts to maintain approximately 1300 tactical aircraft but does so using significantly more dollars than were available in the baseline scenario (Figure 5) and by significantly changing year-to-year funding.
24

0
200
400
600
800
1000
1200
1400
1600
FY04FY05
FY06FY07
FY08FY09
FY10FY11
FY12FY13
FY14FY15
FY16FY17
FY18FY19
FY20FY21
FY22FY23
FY24FY25
FY26FY27
FY28
Fiscal Year
Airc
raft
Inve
ntor
y
JSFNJSFMCF18FF18EF18CDF18ABAV8BF14DF14BF14A
Figure 7. Excursion 1a, CIPA APU TACAIR Inventory Projection. Because there is insufficient funding, the minimum number of aircraft are procured each year. The “hump” between FY10 and FY18 is caused by differing CIPA APU and N81 retirement rates.
0
2000
4000
6000
8000
10000
12000
14000
16000
18000
FY04FY05FY06FY07FY08FY09FY10FY
11FY12FY13FY14FY15FY16FY17FY
18FY
19FY20FY21FY22FY23FY24FY25FY
26FY
27FY28
Fiscal Year
Bud
get (
Mill
ions
)
Air Budget TACAIR Budget Avg Air Budget Avg TACAIR Budget
“End Effects”
Figure 8. Excursion 1a, CIPA APU Air Budget Projection. The average yearly air budget required to support this procurement plan is about $10.5 billion. The average yearly Strike Fighter air mission budget is about $4.2 billion.
25

We now focus on the procurement results. Regardless of budget limits, CIPA
APU produces the desired procurement schedule at the expense of violating the baseline
air and mission budget limits (Figure 8). With the budget limits still set at the baseline
case level, the optimized plan selects the minimum procurement levels available. We can
control this behavior and honor budgets at the expense of procurement schedule, but
either way, CIPA APU is telling us we have a conflict between funding and requirements.
Aircraft Type FY
Minimum Procurement
Maximum Procurement
Committed Procurement
F18F FY04 0 40 24F18F FY05 0 40 24F18F FY06 24 40 0F18F FY07 24 40 0F18F FY08 24 40 0F18F FY09 24 40 0F18F FY10 24 40 0F18F FY11 24 40 0F18F FY12 0 0 0F18F FY13 0 0 0F18F FY14 0 0 0
. . . . .
. . . . .
. . . . .Table 5. Revised Yearly F18F Procurement Limits. This revised table includes minimum procurement limits that attempt to emulate the notional N81 procurement plan.
We allow CIPA APU to optimize the desired aircraft procurements, by running
the model again, this time with annual budget levels centered around $10.5 billion.
Similarly, we set a reasonable bound around the average Strike Fighter air mission
budget, $4.2 billion. When the model is run again without the minimum procurement
limits, CIPA APU fulfills the mission requirements with the revised budget limits,
Figures 9 and 10. The total air budget stays within the limits better than the Strike Fighter
air mission budget because we impose a penalty for yearly and cumulative air budget
violations and imposed only a cumulative air mission penalty for Strike Fighter air
mission budget violations.
26

0
200
400
600
800
1000
1200
1400
1600
FY04FY05
FY06FY07
FY08FY09
FY10FY11
FY12FY13
FY14FY15
FY16FY17
FY18FY19
FY20FY21
FY22FY23
FY24FY25
FY26FY27
FY28
Fiscal Year
Airc
raft
Inve
ntor
y
JSFNJSFMCF18FF18EF18CDF18ABAV8BF14DF14BF14A
Figure 9. Excursion 1b, CIPA APU Inventory Projection. By allowing CIPA APU more flexibility, we obtain similar inventory levels to those obtained in Figure 7 but with more consistent yearly expenditures (Figure 10).
0
2000
4000
6000
8000
10000
12000
14000
FY04FY05
FY06FY07
FY08FY09
FY10FY11
FY12FY13
FY14FY15
FY16FY17
FY18FY19
FY20FY21
FY22FY23
FY24FY25
FY26FY27
FY28
Fiscal Year
Bud
get (
Mill
ions
)
Air Budget TACAIR Budget Max Air Budget Min Air Budget Max TACAIR Budget Min TACAIR Budget
“End Effects”
Figure 10. Excursion 1b, CIPA APU Air Budget Projection. The total air budget stays within the limits while satisfying required inventory levels (Figure 9). We impose a penalty for yearly and cumulative air budget violations and impose only a cumulative air mission penalty for the Strike Fighter air mission budget violations.
27

3. Excursion 2: OMN as Function of Age
OMN costs change over time. In this excursion, we hold the OMN cost constant
up to the average age of the aircraft at the start of the planning horizon. From that average
age forward, we increase aircraft OMN costs 3% per year of age until the maximum age
limit, 60 years old. For example, the expected F-14D average age is 15.8 years at the start
of the planning horizon. The OMN cost is held constant at $2.96 million per year for all
F14Ds 16 years old or younger. OMN costs are increased 3% per year of age for every
year after 16. These increases are in constant year dollars.
Table 6. OMN as Function of Aircraft Age. We hold OMN cost constant up to the average age of the aircraft at the start of the planning horizon. We increase aircraft OMN costs 3% per year of age until the age limit, 60 years old.
Aircraft Type Years Age OMN. . .
F14D FY04 through FY28 14 2.96F14D FY04 through FY29 15 2.96F14D FY04 through FY30 16 2.96F14D FY04 through FY31 17 3.05F14D FY04 through FY32 18 3.14F14D FY04 through FY33 19 3.23
. . .
. . .
. . .
.
.
.
.
This excursion sets air budget limits around $10.5 billion per year and Strike
Fighter air mission budget limits around $4.2 billion per year as before. Likewise, we set
only maximum aircraft procurement limits.
Figure 11 shows aging F14B’s are retired earlier than in excursion 1 with
accelerated F18E and F18F procurement. By increasing the OMN costs 3% per year of
aircraft age, the final solution is significantly changed, Figures 11 and 12.
28

0
200
400
600
800
1000
1200
1400
1600
FY04FY05
FY06FY07
FY08FY09
FY10FY11
FY12FY13
FY14FY15
FY16FY17
FY18FY19
FY20FY21
FY22FY23
FY24FY25
FY26FY27
FY28
Fiscal Year
Airc
raft
Inve
ntor
y
JSFNJSFMCF18FF18EF18CDF18ABAV8BF14DF14BF14A
Figure 11. Excursion 2, CIPA APU Inventory Projection. We increase OMN costs 3% per aircraft year of age and bound air budgets around $10.5 and $4.2 billion, with no minimum procurement limits. In FY06, aging F14B’s have earlier retirements and accelerated F18E and F18F procurement compared to excursion 1b results.
0
2000
4000
6000
8000
10000
12000
14000
FY04FY05
FY06FY07
FY08FY09
FY10FY11
FY12FY13
FY14FY15
FY16FY17
FY18FY19
FY20FY21
FY22FY23
FY24FY25
FY26FY27
FY28
Fiscal Year
Bud
get (
Mill
ions
)
Air Budget TACAIR Budget Max Air Budget Min Air Budget Max TACAIR Budget Min TACAIR Budget
“End Effects”
Figure 12. Excursion 2, CIPA APU Air Budget Projection. The increased OMN costs as a function of age cause changes to aircraft procurement and retirements to keep within budget limits.
29
4. Excursion 3: Mission Effectiveness
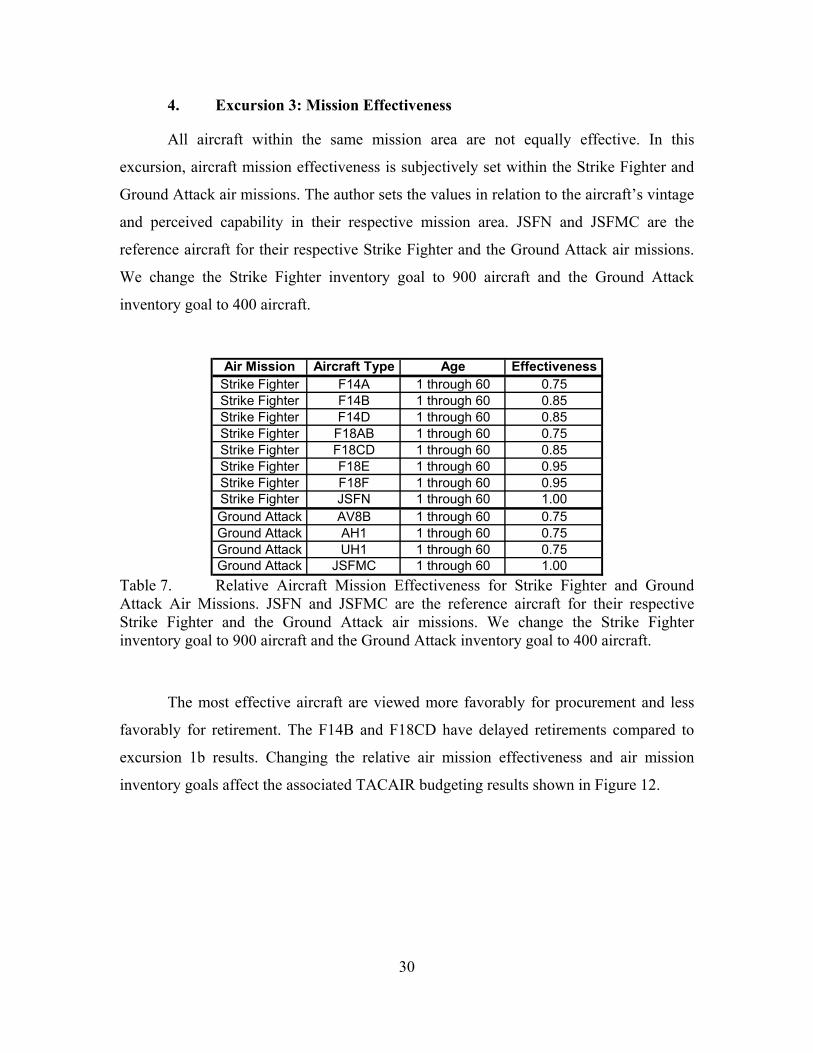
All aircraft within the same mission area are not equally effective. In this
excursion, aircraft mission effectiveness is subjectively set within the Strike Fighter and
Ground Attack air missions. The author sets the values in relation to the aircraft’s vintage
and perceived capability in their respective mission area. JSFN and JSFMC are the
reference aircraft for their respective Strike Fighter and the Ground Attack air missions.
We change the Strike Fighter inventory goal to 900 aircraft and the Ground Attack
inventory goal to 400 aircraft.
Air Mission Aircraft Type Age Effectiveness
Strike Fighter F14A 1 through 60 0.75Strike Fighter F14B 1 through 60 0.85Strike Fighter F14D 1 through 60 0.85Strike Fighter F18AB 1 through 60 0.75Strike Fighter F18CD 1 through 60 0.85Strike Fighter F18E 1 through 60 0.95Strike Fighter F18F 1 through 60 0.95Strike Fighter JSFN 1 through 60 1.00Ground Attack AV8B 1 through 60 0.75Ground Attack AH1 1 through 60 0.75Ground Attack UH1 1 through 60 0.75Ground Attack JSFMC 1 through 60 1.00
Table 7. Relative Aircraft Mission Effectiveness for Strike Fighter and Ground Attack Air Missions. JSFN and JSFMC are the reference aircraft for their respective Strike Fighter and the Ground Attack air missions. We change the Strike Fighter inventory goal to 900 aircraft and the Ground Attack inventory goal to 400 aircraft.
The most effective aircraft are viewed more favorably for procurement and less
favorably for retirement. The F14B and F18CD have delayed retirements compared to
excursion 1b results. Changing the relative air mission effectiveness and air mission
inventory goals affect the associated TACAIR budgeting results shown in Figure 12.
30

0
200
400
600
800
1000
1200
1400
1600
FY04FY05
FY06FY07
FY08FY09
FY10FY11
FY12FY13
FY14FY15
FY16FY17
FY18FY19
FY20FY21
FY22FY23
FY24FY25
FY26FY27
FY28
Fiscal Year
Airc
raft
Inve
ntor
y
JSFNJSFMCF18FF18EF18CDF18ABAV8BF14DF14BF14A
Figure 13. Excursion 3 (Varying Aircraft Effectiveness), CIPA APU Inventory Projection. The most effective aircraft are viewed more favorably for procurement and less favorably for retirement. The F14B and F18CD have delayed retirements compared to excursion 1b results.
0
2000
4000
6000
8000
10000
12000
14000
FY04FY05
FY06FY07
FY08FY09
FY10FY11
FY12FY13
FY14FY15
FY16FY17
FY18FY19
FY20FY21
FY22FY23
FY24FY25
FY26FY27
FY28
Fiscal Year
Bud
get (
Mill
ions
)
Air Budget TACAIR Budget Max Air Budget Min Air Budget Max TACAIR Budget Min TACAIR Budget
“End Effects”
Figure 14. Excursion 3, CIPA APU Air Budget Projection. Changing the relative air mission effectiveness and air mission inventory goals affect the associated TACAIR yearly budgeting results shown in Figure 12.
31

5. Excursion 4: New Air Platforms
The UAV and UCAV aircraft are added to the respective aircraft and air mission
inventory lists to see the possible affects of these new platforms on force structure
planning. The Naval UAV is expected to cost about $900,000 per aircraft, the UCAV is
expected to cost about $5.25 million per aircraft [UAV Forum 2001]. The expected
service life for these aircraft is 12 and 6 years, respectively. The lifecycle OMN for the
UCAV is expected to be about $7.5 million [AerospaceWeb.org 2001]. The author takes
the liberty of estimating the respective cost curves and yearly OMN costs based on the
previous data, using scaling similar to that of aircraft currently being procured. Because
these aircraft are significantly cheaper than other aircraft in their mission areas and are
less capable, we reduce the UAV and UCAV mission effectiveness to balance the cost
differential. For this excursion, the UAV and UCAV have only 50% relative mission
effectiveness with a maximum procurement of 200 UAV and 300 UCAV. In addition, we
eliminate F18E and F18F minimum procurements while setting JSFN and JSFMC
minimum procurement levels to honor contract commitments. For this excursion, JSFN
and JSFMC maximum total procurement was cut in half over the planning horizon.
The first “hump” in inventory level, Figure 15, is caused by forced minimum JSF
procurement between FY08 and FY18. The second “hump” is an a correction to pay the
cumulative liability of the early over-expenditure, Figure 16. The unmanned aircraft,
cheaper and less expensive to operate and maintain, are procured to their maximum levels
once the mission deficit penalty exceeds the budget limit penalties. Although we set no
minimum F18E and F18F procurement limits, the F18E and F18F are still procured to
meet the mission inventory goal. Initial UCAV procurement is delayed almost eight
years, waiting for funding to become available after earlier, pre-committed JSFN and
JSFMC procurements.
32

0
200
400
600
800
1000
1200
1400
1600
FY04FY05
FY06FY07
FY08FY09
FY10FY11
FY12FY13
FY14FY15
FY16FY17
FY18FY19
FY20FY21
FY22FY23
FY24FY25
FY26FY27
FY28
Fiscal Year
Airc
raft
Inve
ntor
yUCAVJSFNJSFMCF18FF18EF18CDF18ABAV8BF14DF14BF14A
Figure 15. Excursion 4, CIPA APU Inventory Projection. The unmanned aircraft, cheaper and less expensive to operate and maintain, are procured to their maximum levels once the mission deficit penalty exceeds the budget limit penalties. Although we set no minimum F18E and F18F procurement limits, they are still procured to meet the mission inventory goal. Initial UCAV procurement is delayed almost eight years until funding becomes available after earlier, pre-committed JSFN and JSFMC procurements.
0
2000
4000
6000
8000
10000
12000
14000
16000
18000
FY04FY05
FY06FY07
FY08FY09
FY10FY11
FY12FY13
FY14FY15
FY16FY17
FY18FY19
FY20FY21
FY22FY23
FY24FY25
FY26FY27
FY28
Fiscal Year
Bud
get (
Mill
ions
)
Air Budget TACAIR Budget Max Air Budget Min Air Budget Max TACAIR Budget Min TACAIR Budget
“End Effects”
33
Figure 16. Excursion 4, CIPA APU Air Budget Projection. Early F18E and F18F procurements to meet mission inventory goal and committed JSFN and JSFMC procurement result in delayed but maximized UCAV procurement later in the planning horizon.

THIS PAGE INTENTIONALLY LEFT BLANK
34

V. CONCLUSIONS AND RECOMMENDATIONS
We have explored several scenarios to demonstrate the new CIPA APU
capabilities. Overall, CIPA APU proves effective and realistically portrays quantifiable
planning considerations.
A. CONCLUSIONS
CIPA APU replaces manual planning with optimization, recommending the best
yearly force structure procurement plan based on industrial constraints, budget
constraints, mission inventory requirements, and force mix requirements. CIPA APU
allows budget violations in some years that can be repaid by other savings in other years.
This is accomplished with long-term, cumulative budget goals. Given constraints for a
planning scenario, CIPA APU recommends an optimum solution. As a prescriptive
model, CIPA APU suggests optimum solutions that might not otherwise be discovered by
manual planning.
Prototypic scenarios have shown how CIPA APU optimally alters procurement
and retirement schedules to respond to: increasing Operation and Maintenance Navy
(OMN) costs as aircraft ages increase; different effectiveness for aircraft performing
Strike Fighter and Ground Attack missions; and the introduction of Unmanned Air
Vehicles (UAV) and Unmanned Combat Air Vehicles (UCAV).
B. RECOMMENDATIONS
Enrich the scope and vision of Navy force structure planning to accommodate as
many of the essential details as possible while generating optimal plans. CIPA is the only
Navy decision support system that integrates aircraft and ship procurement decisions with
fiscal, industrial, and mission requirements to render the best integrated long-term advice.
When added to CIPA, the CIPA APU enhancements will more realistically model the
impact of aircraft procurement and retirement.
35

THIS PAGE INTENTIONALLY LEFT BLANK
36

APPENDIX. CIPA APU FORMULATION
SETS AND INDICES Time
Y, set of years (planning periods) of the planning horizon; For Yyy ∈', .
convenience it is assumed that Y |}|...,3,2,1{ Y=T, set of aircraft ages; t . For convenience it is assumed that Tt ∈', |}|...,3,2,1{ TT = Platform
A, set of aircraft types; Aa ∈S, set of ship classes; s S∈ Mission
AM , set of air missions; AMm ∈SM , set of ship missions; SMm ∈
AAm ⊆ , subset of aircraft types that perform mission AMm ∈SSm ⊆ , subset of ship classes that perform mission SMm ∈
Production
aI , set of cost increments for aircraft ; i Aa ∈ aI∈
P, set of production facilities; Pp ∈PPs ⊆ , subset of facilities that produce ship class Ss ∈
spyQ , set of quantities available for ship procurement at facility in Ss ∈ sPp ∈
year y ∈ . This set is defined in terms of the Yspy
sproc and spysproc
parameters (see below) as follows: }1{ spyspyspyspy sproc,,sproc,sprocQq L+=∈
Others
+Z , set of non-negative integers, }210{ ,...,,Z =+
37

PARAMETERS (and units) Conventions
The word “procurement” or “to procure” refers to “delivery” or “to deliver”, respectively, unless explicitly stated otherwise. Therefore, we refer to “procure” as the action that takes place at the moment (year) that the platform is delivered and available for use from that year onwards, regardless when the real “procurement” arrangements were made. The words “time period” and “year” are used interchangeably. The words “facility” and “plant” are used interchangeably. Objective-terms: Penalties
ampenm, penalty for shortage in completing air mission m ($ per aircraft) AM∈smpenm, penalty for shortage in completing ship mission ($ per ship) SMm ∈agepena, penalty for aircraft average age excess ($ per year of age) magepenm, penalty for air mission average age excess ($ per year of age) AMm ∈
+ybpen , penalty for budget excess ($ per $) −ybpen , penalty for budget shortage ($ per $)
+ycbpen , penalty for cumulative expenses excess ($ per $) −ycbpen , penalty for cumulative expenses shortage ($ per $) +yabpen , penalty for air budget excess in year ($ per $) Yy∈−yabpen
+
, penalty for air budget shortage in year ($ per $) Yy∈
ycabpen−
, penalty for cumulative air budget excess in year ($ per $) Yy∈
ycabpen+
, penalty for cumulative air budget shortage in year ($ per $) Yy∈
myambpen , penalty for air mission budget excess in air mission in year AMm ∈ ($ per $) Yy∈
−myambpen , penalty for air mission budget shortage in air mission in year AMm ∈
($ per $) Yy∈+mycambpen , penalty for cumulative air mission budget excess in air mission in AMm ∈
year y ($ per $) Y∈−mycambpen , penalty for cumulative air mission budget shortage in air mission
in year ($ per $) AMm ∈ Yy∈+plpen−
, penalty for labor excess at plant ($ per worker) Pp ∈
plpen , penalty for labor shortage at plant ($ per worker) Pp ∈
38

Time periods: epochs used for lead and lag events
,SBbsp number of years before (starting at 0) the procurement of ship class Ss ∈ from plant Pp ∈ requires budget (i.e. in 0,1,... years before) s 1−spSBb
(# years) ,SCbsp number of years before (starting at 0) the procurement of ship class Ss ∈
from plant Pp ∈ requires labor (i.e. in 0,1,... years before) s 1−spSCb(# years)
, number of years after (starting at 1) the procurement of ship class SBasp Ss ∈ from plant Pp ∈ requires budget (i.e. in 0,1,... years after) s spSBa
(# years) , number of years after (starting at 1) the procurement of ship class SCasp Ss ∈
from plant Pp ∈ requires labor (i.e. in 0,1,... years after) (# years) s spSCa, number of years before the procurement of aircraft type a in which ABba A∈
the aircraft is paid (at once) (# years) Ship data
, initial inventory of class ships (# ships) vsin s
0 Ss ∈,sycsproc committed procurement of class ships in year due to Ss ∈ Yy∈
production in progress (# ships) ,vsin s maximum number of class ships in inventory (# ships) Ss ∈,spstot maximum number of class ships to procure from plant Ss ∈ sPp ∈
(# ships) ,
spysproc minimum number of class ships to procure from plant in Ss ∈ sPp ∈
time period y (# ships) Y∈ Note: ,
spy0=sproc and
1-}max{ spsps SCb,SBby;Pp,Ss ≤∀∈∈∀
,sprocspy
0= }max{1 spsps SCa,SBa|Y|y;Pp,S −+≥∀∈s ∈∀ is required
,spysproc maximum number of class ships to procure from plant in Ss ∈ sPp ∈ time period y (# ships) Y∈ Note: ,spy 0=sproc and 1-}max{ spsps SCb,SBby;Pp,Ss ≤∀∈∈∀
,sprocspy 0= }max{1 spsps SCa,SBa|Y|y;Pp,Ss −+≥∀∈∈∀ is required Aircraft data
,0
atainv initial inventory of type aircraft that are years old (# aircraft) Aa ∈ Tt∈
39

,aycaproc committed procurement of type aircraft in year due to Aa ∈ Yy∈ production in progress (# aircraft)
,aainv maximum number of type aircraft in inventory (# aircraft) Aa ∈,atainvt maximum number of type aircraft in inventory that are t years Aa ∈ T∈
old (# aircraft) ,aatot maximum number of type aircraft to procure (# aircraft) Aa ∈
,ay
aproc minimum number of type aircraft to procure during time period Aa ∈
(# aircraft) Yy∈,ayaproc maximum number of type aircraft to procure during time period Aa ∈
(# aircraft) Yy∈,ayiinc increment i lower bound for the number of type a aircraft to be aI∈ A∈
procured during year y (# aircraft) Y∈,ayiinc increment i upper bound for the number of type a aircraft to be aI∈ A∈
procured during year y (# aircraft) Y∈,aasurvive survival rate of type aircraft (fraction aircraft) Aa ∈,
ayavgage minimum average age of type aircraft at end of year Aa ∈ Yy∈
(# years of age) ,ayavgage maximum average age of type a aircraft at end of year A∈ Yy∈
(# years of age) ,
myavgmage minimum average age of mission aircraft at end of year AMm ∈ Yy∈
(# years of age) ,myavgmage maximum average age of mission aircraft at end of year AMm ∈ Yy∈
(# years of age) Retirement data
,csret sy minimum cumulative number of class ships to retire by the end of Ss ∈
time period y (# ships) Y∈,csret sy maximum cumulative number of class ships to retire by the end of Ss ∈
time period y (# ships) Y∈,sret sy minimum number of class ships to retire by the end of time period Ss ∈
(# ships) Yy∈,sret sy maximum number of class ships to retire by the end of time period Ss ∈
(# ships) Yy∈,caret ay minimum cumulative number of type aircraft to retire by the end of Aa ∈
time period y (# aircraft) Y∈
40

,caret ay maximum cumulative number of type aircraft to retire by the end of Aa ∈ time period y (# aircraft) Y∈
,aret sy minimum number of type aircraft to retire by the end of time period Aa ∈ (# aircraft) Yy∈
,aret sy maximum number of type aircraft to retire by the end of time Aa ∈ period y (# aircraft) Y∈
aarnet retire no earlier than age for type aircraft (# years) Aa ∈ Mission inventory data
,
mysmreq number of reference ships required for ship mission m in time SM∈
period y (# ships) Y∈,
myamreq number of reference aircraft required for air mission in time AMm ∈
period y (# aircraft) Y∈
sseffect effectiveness of type ship in relation to reference ship (ship per Ss ∈ ship)
ataeffect effectiveness of type aircraft of years of age in relation to Aa ∈ t T∈reference aircraft (aircraft per aircraft)
Budget data
,yoscn fixed SCN cost in year ($) Yy∈,ncsco y fixed SCN cost in year for ships not considered ($) Yy∈
,frac historical fraction of total SCN cost for ship outfitting ($ per $) ,yoapn fixed APN cost in year ($) Yy∈,yocapn fixed APN cost in year for aircraft not considered in the study ($) Yy∈
,5apn historical fraction of total APN categories 1 through 4 required for categories 5 through 7 ($ per $)
,oomy fixed O&M cost in year for maintenance not considered ($) Yy∈, SCN cost incurred l years before q class-s ships are procured from plant p, tbcoss spql
for Ss ∈ , , , ($) sPp ∈ UYy
spyQq∈
∈ 1}-10{ spSBb,,,l L=
,tacoss spql SCN cost incurred l years after q class-s ships are procured from plant p,
for Ss ∈ , , , ($) sPp ∈ UYy
spyQq∈
∈ }1{ spSBa,,l L=
,tcosaa ayi increment Ii ∈ procurement cost for type aircraft in year a Aa ∈ Yy∈ ($ per aircraft)
41

, increment Ii ∈ fixed procurement cost (intercept) for type a aircraft tcosab ayi a A∈ in year y ($) Y∈
, O&M cost for class ship in year ($ per ship) omshipsy Ss ∈ Yy∈,aytomair O&M cost for type aircraft in year that are years old Aa ∈ Yy∈ Tt∈
($ per aircraft) , committed budget in year due to ship production in progress ($) csbudget y Yy∈,ycabudget committed budget in year due to aircraft production in progress ($) Yy∈
, TOA budget lower limit for year ($) toa y Yy∈
, TOA budget upper limit for year ($) toa y Yy∈,ctoa y TOA cumulative budget lower limit for year ($) Yy∈
,ctoa y TOA cumulative budget upper limit for year ($) Yy∈,yairtoa aircraft TOA budget lower limit for year ($) Yy∈
yairtoa aircraft TOA budget upper limit for year ($) Yy∈,ycairtoa aircraft TOA cumulative budget lower limit for year ($) Yy∈
ycairtoa aircraft TOA cumulative budget upper limit for year ($) Yy∈,myairmtoa aircraft TOA budget lower limit for air mission year ($) AMm ∈ Yy∈
myairmtoa aircraft TOA budget upper limit for air mission year ($) AMm ∈ Yy∈,mycairmtoa aircraft TOA cumulative budget lower limit for air mission m year AM∈
($) Yy∈
mycairmtoa aircraft TOA cumulative budget upper limit for air mission m year AM∈ ($) Yy∈ Labor data
, committed labor in year at plant due to production in claborpy Yy∈ Pp ∈
progress (# workers) , required labor n years before q class-s ships are procured from plant p, for sworkbspqn
, , , (# workers) Ss ∈ sPp ∈ UYy
spyQq∈
∈ }10{ spSCb,,,n L=
,sworkaspqn required labor n years after q class-s ships are procured from plant p, for
, , , (# workers) Ss ∈ sPp ∈ UYy
spyQq∈
∈ }1{ spSCa,,n L=
,pcappy
minimum production capacity at plant in time period Pp ∈ Yy∈
(# workers) ,pcap py maximum production capacity at plant in time period Pp ∈ Yy∈
(# workers)
42

DECISION VARIABLES (and units) Variables expressing violations of elastic constraints
, objective function value FAMmyα , air mission m shortage in year (# aircraft) AM∈ Yy ∈SMmyα , ship mission m shortage in year (# ships) SM∈ Yy ∈AGEayα , aircraft average age excess in year (# years of age) Yy ∈MAGEmyαB
, air mission average age excess in year (# years of age) AMm ∈ Yy ∈+α y
−B
, budget excess in year ($) Yy ∈
α y
+AB
, budget shortage in year ($) Yy ∈
yα−AB
, air budget excess in year ($) Yy ∈
yα+AMB
, air budget shortage in year ($) Yy ∈
myα−AMB
, air mission budget excess in year ($) AMm ∈A
Yy ∈
myα+CB
, air mission budget shortage in year ($) Mm ∈ Yy ∈
α y
−CB
, cumulative budget excess in year ($) Yy ∈
α y
+CAB
, cumulative budget shortage in year ($) Yy ∈
yα−CAB
, cumulative air budget excess in year ($) Yy ∈
yα+CAMB
, cumulative air budget shortage in year ($) Yy ∈
myα−CAMB
, cumulative air mission budget excess in year ($) AMm ∈A
Yy ∈
myα+L
, cumulative air mission budget shortage in year ($) Mm ∈ Yy ∈
α y
−L
, labor excess in year (# workers) Yy ∈
α y , labor shortage in year (# workers) Yy ∈ Main decision variables
,APROCayi number of type aircraft to procure at the start of year in cost Aa ∈ Yy∈
increment Ii ∈ (# aircraft) a
,aytARET number of type aircraft to retire by the end of year that are Aa ∈ Yy∈ years old (# aircraft) Tt∈
,SPROCspyq one if facility is to deliver q class ships at the start of Pp ∈ spyQ∈ Ss ∈ year y , and zero otherwise (0-1 variable) Y∈
,SRETsy number of class ships to retire by the end of year (# ships) Ss ∈ Yy∈
43

Control decision variables
,APayi one if aircraft is procured at the start of year in cost Aa ∈ Yy∈ increment Ii ∈ , and zero otherwise (0-1 variable) a
,aytAINV inventory of type aircraft at the start of year that are t Aa ∈ Yy∈ T∈ years old (# aircraft)
,mytAMINV inventory for air mission at the start of year that are t AMm ∈ Yy∈ T∈ years old (# aircraft)
,SINVsy inventory of class ships at the start of year (# ships) Ss ∈ Yy∈
,SMINVmy inventory for ship mission at the start of year (# ships) SMm ∈ Yy∈, amount of SCN money to budget for year ($) SBUDGETy Yy∈, amount of APN money to budget for year ($) ABUDGETy Yy∈
,myAMBUDGET amount of APN money to budget for air mission year ($) AMm ∈ Yy∈,yOMBUDGET amount of O&M money to budget for year ($) Yy∈
, total amount of money to budget for year ($) BUDGETy Yy∈, amount of labor required in year at plant (# workers) LABORpy Yy∈ Pp ∈
FORMULATION
∑∑∑∑
∑ ∑∑ ∑
∑ ∑∑ ∑
∑∑∑∑
∑∑∑∑
∑ ∑∑∑
∑ ∑∑ ∑
∈ ∈
−−
∈ ∈
++
∈
−
∈
−+
∈ ∈
+
∈
−
∈
−
∈
+
∈
+
−
∈
−+
∈
+−
∈
−+
∈
+
∈
−−
∈
++
∈
−−
∈
++
∈ ∈∈ ∈
∈ ∈∈ ∈
+
++
++
++++
++++
++
++=
Yy Pp
Lpyp
Yy Pp
Lpyp
Yy
CAMBmy
Mmmy
CAMBmy
Yy Mmmy
Yy
AMBmy
Mmmy
Yy
AMBmy
Mmmy
CABy
Yyy
CABy
Yyy
ABy
Yyy
ABY
Yyy
Yy
CByy
Yy
CByy
Yy
Byy
Yy
Byy
Yy
MAGEmy
Mmm
Yy
AGEay
Aaa
Yy Mm
SMmym
Yy Mm
AMmym
lpenlpen
cambpencambpen
ambpenambpen
cabpencabpenabpenabpen
cbpencbpenbpenbpen
magepenagepen
smpenampenF
AA
AA
A
SA
αα
αα
αα
αααα
αααα
αα
ααmin
subject to: Ship
,1=∑
∈ spyQqspyqSPROC (1) YyPpSs s ∈∀∈∈∀ ;,
44

,SRETSPROCqcsprocvsinSINVy'y|Y'y
'syPp y'y Qq
q'spyy'y|Y'y
'syssys 'spy
∑∑∑ ∑∑−≤∈∈ ≤ ∈≤∈
−++=1
0
(2) YySs ∈∀∈∀ ;
,spYy Qq
spyq stotSPROCqspy
≤∑ ∑∈ ∈
(3) sPpSs ∈∈∀ ,
Aircraft
, (4) AP
aIiayi 1≤∑
∈
YyAa ∈∀∈∀ ;
,ayiayiayiayiayi APincAPROCAPinc ≤≤ (5) YyIiAa a ∈∀∈∈∀ ;,
,ay
Iiayiay
aprocAPROCaproca
≤≤ ∑∈
(6) YyAa ∈∀∈∀ ;
,0
atayt ainvAINV = (7) TtyAa ∈∀=∈∀ ;1;
),( )1()1( ∑∈
−− +∗=aIi
iyayaaayt APROCcaprocasurviveAINV
1;1; =>∈∀∈∀ tyYyAa (8)
,)1)(1( −−∗= tyaaayt AINVasurviveAINV
aarnettTtyYyAa ≤<∈∀>∈∀∈∀ 1;1; (9)
,)( )1)(1()1)(1( −−−− −∗= tyatyaaayt ARETAINVasurviveAINV
aarnettTt >∈∀;1yYyAa >∈∈∀ ; (10)
,aTt
ayt ainvAINV ≤∑∈
(11) YyAa ∈∀∈∀ ;
,a
Yy Iiayi atotAPROC
a
≤∑∑∈ ∈
(12) Aa ∈∀
Age
∑∑ ∗≤∗
taytaytay
tAINVtAINVavgage ),()( (13) YyAa ∈∀∈∀ ;
∑ ∑ ∗≤−∗
taytay
t
AGEayayt AINVavgageAINVt ),()( α (14) YyAa ∈∀∈∀ ;
45

∑∑∑∑∈∈
∗∗≤∗∗mm Aa
aytt
ataytatmyAa t
AINVaeffecttAINVaeffectavgmage ),()(
Mm A ∀∈∀ ;
(15) Yy ∈
∑ ∑∑∑∈ ∈
∗∗≤−∗∗m mAa
aytatmyAa t
MAGEmyayt
tat AINVaeffectavgmageAINVaeffectt ),()( α
(16) YyMm A ∈∀∈∀ ;
Retirements
,csretSRETcsret syy'y|Y'y
'sysy ≤≤ ∑≤∈
(17) YySs ∈∀∈∀ ;
,
''' ay
arnettTt yyYytayay caretARETcaret
a
≤≤ ∑ ∑≥∈ ≤∈
(18) YyAa ∈∀∈∀ ;
,ay
arnettTtaytay aretARETaret
a
≤≤ ∑≥∈
(19) YyAa ∈∀∈∀ ;
Mission Inventory
,)(∑
∈
∗=mSs
sysmy SINVseffectSMINV (20) YyMm S ∈∀∈∀ ;
,
mySMmymy smreqSMINV ≥α+ (21) YyMm S ∈∀∈∀ ;
,)(
myAMmy
Aaayt
tat amreqAINVaeffect
m
≥+∗∑∑∈
α (22) YyMm A ∈∀∈∀ ;
Budget
(
)'
spy'sp y' y-1
, ' '' |
'
'p P q Qy' Y y-SBa
(1 )
,
s spysp
y y y y
spq y y spy qs S p P y Y q Q
y y y SBb
spq,y- y' spy q
SBUDGET oscn frac ocscn csbudget
scostb SPROC
scosta SPROC≤ ≤
−∈ ∈ ∈ ∈
≤ ≤ +
∈ ∈∈
= + + + +
+∑∑ ∑ ∑
∑ ∑ss S∈
∑∑
(23)
Yy ∈∀
46

),coscos( ,,,,,,,, iABbyaiABbyaAa Ii
iABbyaiABbyamy aa
m a
aaAPtabAPROCtaaAMBUDGET ++
∈ ∈++ ∗+∗= ∑∑
(24) YyMm A ∈∀∈∀ ;
),()1( 5 ∑
∈
++∗++=AMm
myyyyy AMBUDGETcabudgetocapnapnoapnABUDGET
Yy ∈∀
(25)
,aytAa t
aytSs
sysyyy AINVomairSINVomshipoomOMBUDGET ∑∑∑∈∈
∗+∗+=
(26) Yy ∈∀
,yyyy OMBUDGETABUDGETSBUDGETBUDGET ++= (27) Yy ∈∀
, (28) BUDGETtoa yByy +α≤ − Yy ∈∀
, (29) toaBUDGET y
Byy ≤α− + Yy ∈∀
,BUDGETctoa
y'y|Y'y'y
CByy ∑
≤∈
− +α≤ (30) Yy ∈∀
,ctoaBUDGET yCBy
y'y|Y'y'y ≤α− +
≤∈∑ (31) Yy ∈∀
,y
AByy ABUDGETairtoa +≤ −α (32) Yy ∈∀
,y
AByy airtoaABUDGET ≤− +α (33) Yy ∈∀
,
'|''∑
≤∈
− +≤yyYy
yCAByy ABUDGETcairtoa α (34) Yy ∈∀
,
'|'' y
CABy
yyYyy cairtoaABUDGET ≤− +
≤∈∑ α (35) Yy ∈∀
,my
AMBmymy AMBUDGETairtoa +≤ −α (36) YyMm A ∈∀∈∀ ;
,my
AMBmymy airtoaAMBUDGET ≤− +α (37) YyMm A ∈∀∈∀ ;
,
'|''∑
≤∈
− +≤yyYy
myCAMBmymy AMBUDGETcairtoa α (38) YyMm A ∈∀∈∀ ;
47

,'|'
' myCAMBmy
yyYymy cairtoaAMBUDGET ≤− +
≤∈∑ α (39) YyMm A ∈∀∈∀ ;
Industrial
,SPROCsworka
SPROCsworkb
claborLABOR
ssp
'spy
ssp
'spy
Pp|Ssy'ySCay
|Y'y Qqq'spy'yy,spq
Pp|SsSCby'yy
|Y'y Qqq'spyy'y,spq
pypy
∑ ∑ ∑
∑ ∑ ∑
∈∈−≤≤−
∈ ∈−
∈∈+≤≤
∈ ∈− +
+=
1
(40) YyPp ∈∀∈∀ ;
, (41) LABORpcap pyLpypy
+α≤ − YyPp ∈∀∈∀ ;
, (42) pcapLABOR py
Lpypy ≤α− + YyPp ∈∀∈∀ ;
Non-negativity and bounds
,0≥aytAINV (43) TtYyAa ∈∀∈∀∈∀ ;;
,atayt ainvtAINV ≤ (44) TtYyAa ∈∀∈∀∈∀ ;;
, (45) vsinSINV ssy ≤≤0 YySs ∈∀∈∀ ;
,0≥mySMINV (46) YyMm s ∈∀∈∀ ;
, (47) sretSRETsret sysysy ≤≤ YySs ∈∀∈∀ ;
,0≥ySBUDGET (48) Yy ∈∀
,0≥yABUDGET (49) Yy ∈∀
,0≥myAMBUDGET (50) YyMm A ∈∀∈∀ ;
,0≥yOMBUDGET (51) Yy ∈∀
,0≥yBUDGET (52) Yy ∈∀
48

,0≥pyLABOR (53) YyPp ∈∀∈∀ ;
0α ≥ (54) Fixed variables
,0=ayiAPROC (55) aa ABby|Yy;Ii,Aa ≤∈∀∈∈∀
,10 =spySPROC (56) 1
}
−≤∈∀∈∈∀ }SCb,SBbmax{y|Yy;Pp,Ss spsps
,10 =spySPROC (57) max{1 spsps SCa,SBa|Y|y|Yy;Pp,Ss −+≥∈∀∈∈∀
Binary/Integer variables
,ZAPROCayi
+∈ (58) YyIiAa a ∈∀∈∈∀ ;,
,+∈ZARETayt (59) TtYyAa ∈∈∀∈∀ ;;
},1,0{∈ayiAP (60) YyIiAa a ∈∀∈∈∀ ;,
},1,0{∈spyqSPROC (61) spys QqYyPpSs ∈∀∈∀∈∈∀ ;;,
,+∈ZSRETsy (62) YySs ∈∀∈∀ ;
EQUATION DISCUSSION
The above equations (1) Enforce exactly one quantity of ships is procured for
delivery in a given year; (2) Calculate ship inventory; (3) Limit the number of ships per
plant over the horizon; (4) Procure aircraft in no more than one cost segment; (5) Limit
aircraft procurement each year in the chosen cost segment; (6) Limit aircraft procurement
in all cost segments; (7) Set the first year inventory equal to starting values; (8) Calculate
age 1 aircraft inventory after first year; (9) Calculate pre-retirement age aircraft inventory
after first year; (10) Calculate retirement age aircraft inventory after first year; (11) Limit
maximum aircraft inventory; (12) Limit the number of aircraft procured over the horizon;
(13) Limit minimum aircraft inventory average age; (14) Limit maximum aircraft
inventory average age (elastic); (15) Limit minimum mission inventory average age; (16)
49

Limit maximum mission inventory average age (elastic); (17) Limit cumulative ship
retirements; (18) Limit cumulative aircraft retirements; (19) Limit aircraft retirements;
(20) Calculate ship mission inventory; (21) Limit minimum ship mission inventory
(elastic); (22) Limit minimum air mission inventory (elastic); (23) Calculate ship budget
(SCN); (24) Calculate air mission budget (APN); (25) Calculate aircraft budget (APN);
(26) Calculate O&M budget; (27) Calculate total budget; (28) Limit minimum budget
(elastic); (29) Limit maximum budget (elastic); (30) Limit minimum cumulative budget
(elastic); (31) Limit maximum cumulative budget (elastic); (32) Limit minimum air
budget (elastic); (33) Limit maximum air budget (elastic); (34) Limit minimum
cumulative air budget (elastic); (35) Limit maximum cumulative air budget (elastic); (36)
Limit minimum air mission budget (elastic); (37) Limit maximum air mission budget
(elastic); (38) Limit minimum cumulative air mission budget (elastic); (39) Limit
maximum cumulative air mission budget (elastic); (40) Calculate labor per plant; (41)
Limit minimum labor (elastic); (42) Limit maximum labor (elastic). Equations (43)
through (54) are non-negativity constraints and bounds for inventories, retirements,
budgets, labor, and elastic variables. Equations (55) through (57) fix to zero, deliveries of
ships and aircraft for those years that require production and payment schedules before
the first year of the planning horizon. Equations (58) through (62) define procurement
and retirement binary and integer variables.
Equations (14), (16), (21), (22), (28) through (39), (41) and (42) use elastic
variables. The elastic variables take on a continuous non-negative value as each
associated constraint is violated. The CIPA APU objective function minimizes penalties
associated with violating the respective budget, mission inventory, average age, and labor
constraints.
50

LIST OF REFERENCES
AerospaceWeb.org, 2001, “Storm Shadow UCAV Cost Analysis,” [http://www.aerospaceweb.org/design/ucav/costs.shtml] Accessed August. Baker, S., 2001, “Unmanned Air Combat Vehicle 2010,” Air Force Materiel Command News Service, September 24. Baran, N., 2000, “Optimizing Procurement Planning of Navy Ships and Aircraft,” MS Thesis, Operations Research Department, Naval Postgraduate School, Monterey, California, December. Boeing, 2001, An artist’s rendition of the Boeing Unmanned Combat Air Vehicle (UCAV). [http://www.Boeing.com] Accessed August. Brooke, A., Kendrick, D., Meeraus, A. and Raman R., 1998, GAMS: A User’s Guide. GAMS Development Corporation. Brown, D., 2001, “Duct-Tape Aviation”, Navy Times, September 10.
Brown, G.G., Clemence, R.D., Teufert, W.R., and Wood, K.R., 1991, “An Optimization Model for Modernizing the Army’s Helicopter Fleet”, INTERFACES, v. 12, No. 4, pp. 39-52. Brown, G.G., Dell, R.F., Wood, R.K., 1997, “Optimization and Persistence.” Interfaces, 1997, Vol. 27, No. 5, pp. 15-37. Capaccio, T., 2001, “Emergency Defense Funds Going To Improve Military Intelligence”, [http://www.Bloomberg.com] Accessed September 27. Congressional Budget Office (CBO), 2001, “The Effects Of Aging On The Costs Of Operating And Maintaining Military Equipment”, August. Field, R. J., 1999, “Planning Capital Investments in Navy Forces,” MS Thesis, Operations Research Department, Naval Postgraduate School, Monterey, California, December. Fondersmith, M., 2001, “Duct-Tape Aviation” cover story photo, Navy Times, September 10. General Accounting Office (GAO) Report to Congressional Committees, 2001, “Military Transformation, Navy Efforts Should Be More Integrated And Focused”, August. Grossman, E. M., 2001, “Rumsfeld Changes Yardstick For Measuring And Shaping U.S. Forces”, Inside The Pentagon, July 26.
51

Holzer, R., 2001, “U.S. Navy Considers Aviation Cuts For Future Budgets”, [http://www.DefenseNews.com] Accessed September 5. ILOG, 2001, “CPLEX 6.6,” [http://www.cplex.com], Accessed October 30. Liang, J., 2001, “Sen. Warner: QDR Will Have Added Emphasis On Homeland Defense”, Inside The Pentagon, September 27. LockheedMartin, 2001, An artist’s rendition of the Lockheed Martin Joint Strike Fighter (JSF). Navy Public Affairs Library, 1997, “F/A-18 E/F Super Hornet”, The Navy Office of Information, Accessed August 2001. Navy Public Affairs Library, 2000, “At Least Six Sailors Killed in Small Boat Attack on USS Cole”, The Navy Office of Information, October 1. Navy Public Affairs Library, 2001, “Statement from U. S. Pacific Command on EP-3 Incident”, The Navy Office of Information, April 1. Paine, P. and Drohr, R., 2000, “Naval Aviation Force Structure Methodology”, Air Warfare Division (N78), January 6. Pasztor, A., Squeo, A. M. and Rogers, D., 2001, “Boeing Could Be First to Benefit From Growing Defense Spending”, Wall Street Journal, October 2. Rhem, K., 2001, “Bush: No Distinction Between Attackers and Those Who Harbor Them”, American Forces Press Service, September 11. Ruck, J., 2001, Interview between LCDR John Ruck, Assessment Division (N81) and the author, June. Scarborough, R., 2001a, “Bush's 'Strategy First' Vow Scrapped, Review Officials Say”, Washington Times, July 23. Scarborough, R., 2001b, “Defense Review To Feel Impact Of Terror Attacks”, Washington Times, September 27. Selinger, M., 2001, “Sen. Bond Pushing Proposal For Split Production Of Joint Strike Fighter,” Aerospace Daily, September 27. Systems Planning and Analysis (SPA), 2000, SPA Extended Planning Annex Model, November. Thomas, C., 2001, “Rumsfeld's New Defense Strategies”, Washington Times, August 1.
52

UAV Forum, 2001, [http://www.uavforum.com] Accessed September. Van Brabant, J., 2001, Interview between LCDR John Van Brabant, Assessment Division (N81) and the author, June. Weinberger, S., 2001, “Wolfowitz Promises Paradigm Shift With QDR, But Offers Few Details”, Aerospace Daily, August 9. Whittle, R., 2001, “Defense Bill May Force V-22 Production Cuts”, Dallas Morning News, September 8. Wolfe, F., 2001, “Navy To Submit Study On Incorporating Marine Corps Fixed-Wing Air”, Defense Daily, September 4.
53

THIS PAGE INTENTIONALLY LEFT BLANK
54

INITIAL DISTRIBUTION LIST
1. Defense Technical Information Center 8725 John J. Kingman Road, Suite 0944 Ft. Belvoir, VA 22060-6218
2. Dudley Knox Library Naval Postgraduate School 411 Dyer Road Monterey, CA 93943-5101
3. Chief of Naval Operations (N81)
Navy Department 2000 Navy Pentagon Washington, D.C. 20350
4. Chief of Naval Operations (N81) Attn: Robbin Beall Navy Department 2000 Navy Pentagon Washington, D.C. 20350
5. Chief of Naval Operations (N81) Attn: Chuck Werchado Navy Department 2000 Navy Pentagon Washington, D.C. 20350
6. Chief of Naval Operations (N81) Attn: CDR John Purnell Navy Department 2000 Navy Pentagon Washington, D.C. 20350
7. Chief of Naval Operations (N81) Attn: LCDR Mark Sullivan Navy Department 2000 Navy Pentagon Washington, D.C. 20350
8. Chief of Naval Operations (N70) Attn: Mark Mohler Navy Department 2000 Navy Pentagon Washington, D.C. 20350
9. Operations Analysis Code 30 Naval Postgraduate School Monterey, CA 93943-5000
55

10. Professor Robert F. Dell Code OR/DE Naval Postgraduate School Monterey, CA 93943-5000
11. Professor Javier Salmeron Code OR/SA Naval Postgraduate School Monterey, CA 93943-5000
12. Professor Gerald G Brown
Code OR/BW Naval Postgraduate School Monterey, CA 93943-5000
13. LCDR Ruben M. Garcia 2292 Windy Pines Bend Virginia Beach, VA 23456
56