Embed Size (px)
Citation preview

Thermo-Mechanical Treatment Effects on Stress Relaxation and Hydrogen Embrittlement of Cold-Drawn Eutectoid Steels
L. Caballero*, J. M. Atienza, and M. Elices
Dpto. de Ciencia de Materiales, CISDEM, Univ. Politécnica Madrid. Prof. Aranguren s/n, 28040 Madrid, Spain.
The effects of the temperature and stretching levels used in the stress-relieving treatment of cold-drawn eutectoid steel wires are evaluated with the aim of improving the stress relaxation behavior and the resistance to hydrogen embrittlement. Five industrial treatments are studied, combining three temperatures (330, 400, and 460 °C) and three stretching levels (38, 50 and 64% of the rupture load). The change of the residual stress produced by the treatments is taken into consideration to account for the results. Surface residual stresses allow us to explain the time to failure in standard hydrogen embrittlement tests.
Keywords: metals, eutectoid steel wires, thermomechanical processing, mechanical properties, tensile test
1. INTRODUCTION
Appropriate composition and thermal treatment provide the fine pearlitic microstructure necessary to produce wires for prestressing concrete by the cold-drawing process. During this manufacturing process, an intense plastic deformation is generated in the wires and the resulting microstructure is highly dislocated and meta-stable, with macro- and micro-residual stresses being present [1]. Some additional treatment is necessary to stabilize the microstructure, to avoid uncontrolled static strain aging, and to optimize the as-drawn wire properties. Initial thermal treatment and very short thermo-mechanical treatment are at present used at an industrial level. The thermal treatment takes advantage of the static strain aging (SSA) phenomena, and the thermomechanical treatment, called stabilization, is supposed to be based on dynamic strain aging (DSA). SSA has garnered more attention than DSA in the literature on pearlitic steel wires, and the effect of a few seconds of DSA on subsequent room temperature properties does not seem to have been systematically studied, in spite of its high industrial importance.
Yamada [2-4] carried out the first detailed work on the heat treatment effects on SSA of carefully cold-drawn eutectoid steel wires. He proposed three stages of strain aging: a first stage below 150 °C without noticeable consequence on the mechanical properties, a second stage from 150 °C to roughly 200 °C or 250 °C where yield stress and strength
increase, and a third stage for higher temperatures with a decrease of both mechanical properties, though accompanied by a better ductility. Recovery and recrystallization of the cold worked structure happen at temperatures of 400 °C and above. Other authors [5,6] confirmed the details put forth by Yamada with minor variations that were probably due to differences of composition or strain drawing intensity of the used wires. In their review of 2001, Phelippeau et al. [7] summarized the knowledge on the micro-structural mechanisms in the first stage of SSA (diffusion of interstitial C atoms to dislocations) and second stage (diffusion of C atoms liberated by the partial decomposition of cementite). Though the third stage was hardly included, they cited the decrease of ferrite micro-strains and the increase of cementite crystallite size in the 200-400 °C range [8], and the recrystallization of ferrite and spheroidization of cementite between 400 and 600 °C [5], as the main features of this stage.
The change in engineering mechanical properties for thermal treatments over 250 °C has also been an area of much research. Fracture toughness, threshold stress intensity factor for stress corrosion cracking (SCC) and elongation all increased for treatments over 250 °C, though yield strength and tensile strength decreased [9,10]. A window between 300 °C and 400 °C has been proposed as the point of optimum combination of strength and toughness [10]. Unfortunately, the treatments were of large duration, far from the short time treatments usual in industrial practice.
Information in the literature on short time treatments of pearlitic wires has been published infrequently and is usually restricted to thermal treatments without simultaneous stress-

ing [11-13], though evidence is provided of softening mechanisms such as the spheroidization of cementite lamellae after 30 s at 500 °C [11], or even at 450 °C, together with recovery at 425 °C [12,13]. The tensile strength seems to have a complex dependence on heating time, temperature, and silicon content.
DSA in pearhtic steels has been studied for cold-drawn [14] and undrawn wires [15]. The conclusion is similar in both cases: the decomposition of the cementite controls the dynamic strain aging in pearlitic steels, as formerly observed for the second stage of static strain aging. However, authors of the above studies did not examine the wire behavior after DSA treatment. Closer to industrial practice, Zeren and Zeren [16] carried out laboratory thermo-mechanical treatments (250 °C to 400 °C temperatures and stretching level between 20 % and 50 % of the RT strength, though during an unspecified time interval). They obtained a continuous increase in yield and tensile strengths, and a decrease of relaxation, with an increase of the temperature or the stretching level of the treatments.
The published literature is hardly representative of the current industrial practices, as can be inferred from the quoted references, which provide well accepted temperature windows for static treatments, and some understanding of the mechanisms of age hardening and age softening that are active in the appropriate temperature ranges. Nonetheless, quoting a conclusion of the cited review by Phelippeau et al. [7], "The high level of residual stresses measured, at different scales, must certainly be taken into account for better understanding, even though the links with the mechanical properties are not clearly evidenced". In this sense, the work on residual macro-stress in the ferrite phase has examined the stress distribution along the wire diameter [17] and the residual stress evolution during tensile loading and unloading [18] or as a result of thermo-mechanical treatments [19,20]. The aim of the present work is to explore the possibilities of optimizing the properties of prestressing wires by means of the modification of the residual stress by short thermo-mechanical treatments, not only the properties such as yield or ultimate strength and ductility, but also those of relaxation and hydrogen embrittlement. To this end, tensile, stress relaxation and hydrogen embrittlement tests were performed and residual stresses at the surface were also measured by X-ray diffraction. Information on the residual stress distribution in the bulk of the five materials, measured by neutron dif-
Table 1. Parameters of the stabilizing ta
Stretching stress (% <7„) Low: 330 Low: 38
Standard: 50 LT (low temperature) High: 64
fraction, has been published previously [20]. Those results will be taken into account.
2. MATERIALS AND EXPERIMENTAL METHODS
2.1. Materials and treatments Commercially cold-drawn eutectoid steel wires were used
in this study. Their chemical composition was: 0.815 C, 0.231 Si, 0.642 Mn, 0.012 P, 0.008 S, 0.044 V and 0.221 Cr (wt.%). The initial rods (12 mm diameter) were subjected to six drawing passes to reach a final diameter of 7.0 mm; thus, the accumulated true strain was 1.08. The drawing velocity was 44 m min , and the temperature, controlled during the process, reached a maximum value of 197 °C on the wire surface at the exit of the last die.
After drawing, the wires were subjected to an industrial thermo-mechanical stress relieving treatment. To ascertain the role of temperature and stretching in the stabilization, five treatments were selected for this research, combining three temperatures of 330, 400 and 460 °C and three stretching levels 38, 50 and 64 % of the RT nominal maximum tensile stress Rn(1860 MPa). The time duration was equal for all treatments and the concrete value was not precisely known, though this value was anticipated to be short as is usual in industrial practice, in the range of a half second, which is the time needed to reach the treatment temperature, to a few seconds [21]. These treatments and their notation are summarized in Table 1. The treatment S is a standard procedure in the cold-drawing industry. The microstructure was fine pearlite with the lamellae mainly oriented along the drawing axis; this structure did not seem to be affected by the treatment at a level that can be appreciated under scanning electron microscopy.
2.2. Residual stress measurements Residual stresses were measured at the surface of the wires
by X-ray diffraction. The interplanar lattice spacing between the (hkl) planes was calculated, using Bragg's Law, by measuring the 29 angle at which the reflection occurs for a fixed wavelength of the incident beam. From that, it was possible to obtain the residual stress in the ferrite phase from the gradient of the well known "d" vs. sin \|/ plot. The a-Fe reflection under study was (2,1,1), which produced a Bragg peak at 29=156.08° for the CrKa radiation employed (A=2.2909
íents and names of the resulting batches
Temperature (°C) Standard: 400 High: 460 LF (low force)
S (standard) HT (high temperature) HF (high force)
<T„ is the specified characteristic value of maximum stress (1860 MPa) at room temperature

200 200
-50
0 90 180 270
PLACE OF MEASUREMENT. Angle (»>
S STANDARD HT HIGH TEMPERATURE LT LOW/TEMPERATURE HF HIGH FORCE LF LOW FORCE
• • & -
Section average of inner axial residual stress in ferrite(MPa)
s 30
LF
20
HF
-60
LT
-150
HT
50
Dala from ref. [20]
Fig. 1. Surface axial residual stress after five different post-drawing thermo-mechanical treatments. Section average of inner axial residual stress, after [20], is included too.
A). Experiments were performed in Q-mode with parallel beam optics. In addition, the single crystal elastic constants for the (2,1,1) reflection of a-iron were used to calculate E=211 GPa, and v =0.25. More details about the method can be found elsewhere [22].
Measurements were performed with a Rigaku Strainflex analyzer (30 kV and 8 mA). A 5 mm diameter mask was used to focus the gauge volume. With the aim of improving the measurement precision, a special experimental set-up was designed for the wires. It consisted of an XY table (±0.01 mm precision) with two wire supports specially designed for turning the wire around its axis at 45° steps. This allowed the collection of measurements in large samples without having to cut them into small pieces. Samples were 550 mm in length, the required size for standardized hydrogen embrit-tlement tests. Residual stresses were measured on four points situated on the 0-90-180-270 degree orientations of the perimeter of the central cross section (see Fig. 1).
2.3. Tensile, stress relaxation and hydrogen embrittle-ment tests
The standard mechanical properties were obtained from tensile tests performed on treated wire specimens of 20 cm gauge length at an elongation rate of 3 mm min , in accordance with ISO 15630-3 [23]. A universal testing machine with a 100 kN load cell and a 12.5 mm resistive extensome-ter was used for this purpose, and a minimum of three valid
tests were carried out on each type of wire. Stress relaxation was measured as the loss of stress in a
material held at a constant strain during a conventional time interval after loading. All the tests were performed in the same electro-mechanical universal testing machine and in accordance with ISO 15630-3 [23]. Wires were initially loaded at 70, 80 and 90 % of the ultimate tensile load, maintained at constant load for 120 seconds, and held at constant elongation at room temperature (25±2 °C) for 120 hours. The load evolution was continuously measured with a load cell and the initial F0 and final F120 values of the 120 h interval were used to classify the stress relaxation behavior using as an index the percentage of initial load loss 100(/vFi2o)^o .
In 1978, the International Federation for Prestressing (FIP) proposed the ammonium thiocyanate test to control the susceptibility of such steels to hydrogen embrittlement. Nowadays, there is general agreement that hydrogen embrittlement plays an important role in environmentally assisted cracking of cold-drawn eutectoid steels [24]. The FIP test, now assumed by ISO 15630-3 [23], ranks the wire susceptibility to hydrogen embrittlement by the time to fracture of a steel wire loaded at a constant tensile force of 0.8 Fm (where Fm is the maximum tensile load) and immersed in an NFI4SCN solution (200 grams of NH4SCN in 800 ml of distilled water) at a constant temperature of 50=1=1 °C. The hydrogen susceptibility of the five batches of wires was measured following the FIP recommendations, though additional tests were performed in the same environmental conditions at a constant tensile force of 0.65 Fm, as this load is more representative of the working load of the prestressing wires and to achieve a better understanding of the stress effect. The HT material was also tested at a force level of 0.72 Fm to better determine its behavior. Four to eight samples per batch were tested at each load level. The test set-up and procedure are described in detail elsewhere [25].
3. RESULTS AND DISCUSSION
3.1. Residual stress The axial residual stress of the ferrite phase next to the sur
face was measured in two specimens per wire class, prior to test the wires for stress relaxation and hydrogen embrittlement. Four measurements were made on positions regularly distributed on the perimeter of a cross section in the central part of the specimen. The residual stress seemed to follow a wavy variation along the perimeter. This asymmetry may have been due to some coiling-straightening operation of the wires [26] or to a certain degree of asymmetry in the cold-drawn process. The positions were named 0°, 90°, 180° and 270° in reference to their angles, in relation to an arbitrary point on the cross section contour. The effect of the thermo-mechanical treatments on the residual stress as measured on the ferrite phase can be seen in Fig. 1, in which the repre-

sented values are affected by a standard deviation ranging from 16 to 32 MPa (not included in the figure for the sake of clarity).
Even though the adjusting lines are speculative and the stress peak may be higher than can be inferred from the figure as a result of the smoothing effect of the tested area extension, no significant differences can be expected given that the values compare well with near surface residual stresses measured with neutron diffraction [20]. It can be appreciated that after the milder treatments, in which load or temperature are low, the residual stresses are still locally high. The axial residual stress on the surface is clearly reduced by the standard treatment, though more aggressive treatments in force or temperature, such as HF and FIT, are necessary for higher reductions to be achieved. The inner axial residual stress in ferrite, averaged on the section of the wire, has been taken from [20] and is included in Fig. 1 to facilitate readability in the results discussion.
These surface stress results may be rationalized by considering how the tensile stress applied during stabilization is in relation to the yield stress at the treatment temperature. Taking into account the published tensile test results [27] for wires of the same manufacturer and with the same composition as the present wires (the composition reported in that paper is erroneous), it can be estimated that the yield strength of a cold drawn wire at 330, 400 and 450 °C, dropped to about 0.65, 0.53 and 0.43 of its RT ultimate strength (Rm), respectively. Then, the stabilization stress is in the elastic zone in the LT (330 °C, 0.50 Rm) and LF (400 °C, 0.38 Rm) cases; it is at the beginning of the plastic range in the S (400 °C, 0.50 Rm) treatment; and, for the HT (460 °C, 0.50 R ^ and HF (400 °C, 0.64 Rm) situation, the applied stress is higher than the yield stress. This would imply that the as-drawn dislocation density and distribution, hence the macro-stresses, would be nearly unchanged in the LT and LF treatments. However, the residual stress present in the as-drawn wire was tensile and ranged from 100 to 500 MPa at the surface (the residual stress radial profile can be seen in [20]). Its superposition to the applied stress increases the stress level at the wire surface and the Von Mises criterion is complied with at the surface zones of LT and LF material. This allows local plastic straining and a global residual stress reduction. When the applied stress is near or higher than the yield strength, as in the S, HF and HT cases, plastic deformation spreads to the inside of the wire. After cooling and unloading the wires, the residual stress obtained is reduced for the S treatment, or inverted to compressive stress for the HF and HT treatments.
In the former reasoning, the residual stress in ferrite and applied stress are not expressly distinguished, something which clearly merits justification. In the recent literature [18, 28], it has been shown that, during the axial elastic straining of cold-drawn pearlitic wires, ferrite and cementite follow a
linear Hooke's law of apparent Young's moduli close to the macroscopic moduli. Furthermore, it has also been shown that in the elastic range any applied stress produces an increase in phase strain in both phases that accumulates to their residual phase strain. In consequence it is an admissible simplification to add the applied stress and the residual stress to estimate the phase stress. In fact, a stress partitioning analysis using the iso-strain model does not substantially change the stress in the ferrite with regard to the value predicted with simple addition. A similar need for caution may also arise when associating the onset of macroscopic yielding with the fact that the ferrite stress is equal to the macroscopic yield strength; however, it has been a common assumption that pearlite yielding is controlled by the onset of plastic deformation in the ferrite [29,30] and the simultaneous beginning of specimen and ferrite yielding has been recently documented for pearlitic wires with residual stress and after stress relieving treatment [18].
An additional implicit assumption is that plastic straining of peripheral wire material with initial tensile residual stress promoted residual macro-stress reduction. Tomota et al. [18] tested the evolution of averaged ferrite lattice strain in the axial direction as a consequence of a loading-unloading program in the macroscopic plastic zone. They found that a compressive residual strain appeared in the ferrite after each unloading if the average initial residual strain was tensile or moderately compressive, and that the compressive residual strain increases in successive cycles until saturation. If the initial residual strain was high and compressive, it did not change significantly after unloading. Because of the force equilibrium requirement, cementite must result in tensile residual stress, something that in fact has been measured [31]. These results seem to support the present rationale, given that plastic straining reduces the tensile residual stress existing in the as-drawn surface. However, the results also seem to be in opposition to the evolution of the average values of axial residual stress for these materials, as published by Ruiz-Hervias et al. [20], in which a compressive averaged residual stress in the as-drawn wire is reduced or inverted to tensile average residual stress by simultaneous plastic straining and heating. The same discrepancy exists in the evolution of the residual stress in the center of the wire; this residual stress changes from highly compressive in the as-drawn wire to virtually null in the HT material. From the Tomota et al. results [18], a reduction of tensile surface stress or a compressive stress would be expected in the present materials, but without a change in the compressive stress at the wire center (that is to say, the smoothing of the radial distribution of the axial stress with the wire center compressive stress as base level). This smoothing would facilitate relaxation of the macro-stress by relaxation of the tensile ferrite and compressive cementite stresses, though that did not happen in the material studied by Tomota et al. [18]. A possible cause that

would explain this apparent discrepancy lies in the thermal part of the treatment that does not exist during the plastic straining studied by the above cited authors. Since raising the temperature in tensile tests lowered the yield strength of the wires (that is to say, it facilitated the dislocation mobility), the simultaneous heating and stressing would promote dislocation rearrangement to lower energy configurations, and this would be manifested as a residual macro-stress relaxation. In fact, a study of the reduction of ferrite micro-strain by thermal treatment in the present temperature range has been published [8], and this reduction was interpreted as a sign of dislocation rearrangement or destruction. A consideration of the evolution of the radial distribution of ferrite micro-strain could help in understanding the detailed mechanism of residual stress reduction, though such a study has not yet been performed due to the experimental difficulty.
Because heating also facilitated the diffusion of carbon to dislocations, it is expected that after cooling there will exist a variation of the grade of dislocation pinning as an effect of the temperature used in each treatment. This aspect will be considered in the interpretation of the results of the tensile tests.
3.2. Tensile properties Whereas the engineering stress-strain representative curves
of the five wire classes, together with the relevant mechanical parameters, are shown in the Fig. 2, the effect of stretch-
2000
STABILIZATION TEMPERATURE 400 °C
5 1600-
(5 5
1 2 0 0 -z o Af
800- ,
400 j
0 * —
S STANDARD HT HIGH TEMPERATURE LT LOW TEMPERATURE HF HISH FORCE LF LOW FORCE
Af
- i _ — 0.00 0.02 0.04 0.06
ENGINEERING STRAIN 00S 0.10
TREATMENT R0..,(MPa) R^MPa) RJMPa) EJV») Z (%)
s LF HF LT HT
1553 1560 1552 1650 1464
1585 1598 1562 1693 1493
1822 1826 1818 1841 1782
6.11 6.14 5.90 5.06 6.57
38 20 17 42 27
Strain under maximum load 2 : Reduction of area
Fig. 2. Stress-strain curves of steel wires after the five post-drawing thermo-mechanical treatments.
K 1600
6
5
- O TENSILE 5TBEMJTH
O -
o - =8: 8 0 1 CI
40 SO
% PROOF STRESS tb PROOF STRESS
7.0
AREA REDUCTION
5 0
h40 I >
- 3 0 3
D
20 j j -10 o - 0 ¡i
3U 40 5 0 6 0 7 0
STRETCHING S T R E S S (% of R m )
¿0
Fig. 3. Influence of stretching stress, at 400 °C, on the tensile properties.
ing stress and temperature are displayed in Figs. 3 and 4, respectively. To the naked-eye, the five materials showed a cup and cone type fracture, though the cone was a complete cone (shear lips began at the wire center) in the LF and HF wires, whereas it was a frustum of cone of medium height in the HT material and of shorter height (smallest shear lips) in the S and LT cases. The area reduction was in an inverse correspondence with the shear lip size of the fracture surfaces, namely higher lips implied a smaller area reduction.
From Fig. 3 it can be seen from the S, LF and HF results that the proof stress, tensile strength Rm and strain at maximum load are not affected by the stretching level at 400 °C, while the area reduction increases when stretching stress is raised from 0.36 Rm to 0.50 Rm and decreases further on at 0.65 Rm. Because the treatment temperature is the same in these materials, any difference in the mechanical behavior must be an effect of the stretching level. As the residual stresses in these three materials are different, whether surface stress or averaged values of axial residual stress, as seen in in Fig. 1, the results may indicate that not all the residual stress contributions (elastic interaction between surface and core zones, elastic interaction between phases, and phase micro-stress) are important in the first three mechanical parameters. An alternative interpretation is that residual stress does have not particular importance in considerations of proof stress, tensile strength or uniform strain since then-values are practically the same in S, LF and HF materials. It seems that the temperature level of the treatment, probably

STABILIZATION STRESS 0.5 FL
2000
| 1800
Pj 1600
1400
t r
i -
7 -
6 -
4 -
TENSILE STRENGTH
0 2 % PROOF STRESS
0 1 % PROOF STRESS
350 400 450 _Ü0£Q_
_1_
AREA REDUCTION
I
50 Í 40 3 30 I
o 20 Z
300 350 400 450 5000 550
TREATMENT TEMPERATURE (°C)
Fig. 4. Influence of temperature, at stretching stress of 0.5 Rm, on the tensile properties.
by controlling the pinning of dislocations, dominates the final behavior of the wires. Then, the grade of pinning of dislocations, controlled by the diffusion of interstitials and hence temperature dependent, may be more important than the dislocation density; alternatively, this density could be similar in the three materials, contrary to what could be anticipated due to the different plastic strain associated with the different stretching levels. The evolution of the area reduction is intriguing and it is difficult to explain why the critical conditions to failure, related to area reduction, are similar in the LF and HF cases and are different from those of the S material. Such a dependence on the stretching force merits future research.
The temperature of stabilization has an appreciable influence on proof stress, as shown in Fig. 4, giving rise to a systematic decrease as temperature increases; however, this has little influence on tensile strength except at 460 °C. A more marked effect is detected on area reduction and strain at maximum load, namely a monotonous decrease of the former and a continuous rising of the latter with the increase of the temperature of stabilization.
Some of the effects of the temperature on mechanical properties can be justified by considering that the heating of the wires during stabilization treatment affects the carbon diffusion and location and the dislocation mobility. Hinch-liffe and Smith [11] have located in a more precise way the
three exothermic reactions first envisaged by Yamada [4]. Given the reaction temperature ranges (estimated from their graphics) from 100 °C to 230 °C, 130 °C to 400 °C, and 270 °C to 610 °C, some degree of overlapping exists. The analysis of the reaction kinetics permitted Park et al. [22] to identify the apparent activation energy of each reaction. The second and third reactions are of interest in the present stabilization treatments, and are active during the treatments at 330 °C and at 400 °C, though only the third could operate in the 450 °C treatment. The second reaction is identified with the partial cementite dissolution [32] and the supply of carbon atoms to lock dislocations [11]. The third is associated with the re-precipitation of carbon and the spheroidization of cementite [32], together with the recovery of ferrite [4,12], with the consequence being a mechanical softening due to the decrease of obstacles to dislocation mobility. Bearing in mind the simultaneous application of stretching during stabilization, the sequence could be the following: pipe diffusion of carbon atoms swept by the moving dislocations to ferrite-cementite interface, their inhomogeneous re-precipitation to produce the cementite globulization and the rearrangement of dislocations to lower energy patterns. The constant decrease of proof stress is in accordance with the common experimental fact that the proof stress increases to a maximum at about 300 °C with static thermal treatments and decreases for higher temperatures, as in [9,10]. This indicates that the softening due to the third reaction predominated over the strengthening of the second reaction. With regard to the tensile strength, the 330 °C and 400 °C treatments produced nearly the same values, suggesting that there are no significant changes in the microstructure. The drop with the 460 °C temperature may be associated with the beginning of the cementite globulization, which has been documented as observable after short treatments at this temperature level [13]. This is probably linked to some degree of microstructure change made possible by a reaction rate that has increased due to the higher temperature. However, the effect is slight, especially if the true stress instead of engineering stress is considered.
The rise of the strain at maximum load with the temperature can be qualitatively analyzed with Considere 's criterion for necking onset that, supposing a strain-rate insensitive material of Hollomon's type, can be written as sm=n, where n is the strain-hardening exponent. From the data in Fig. 2 or by comparing the difference between the proof stress and the tensile strength in Fig. 4, it is clear that the work hardening increases, hence n, as the treatment temperature increases. The strain at maximum load also increases as predicted. With regard to the area reduction, dependence on the stabilization temperature again merits future research.
3.3. Stress relaxation The influence of the temperature and stress imposed dur-
12 i 1 .12
Q I I I I I | I I I I 0 300 350 400 450 500 30 40 SO 60 70
TREATMENT TEMPERATURE <"C) STRETCHING STRESS ( i t Of Rrl) (STRETCHING STRESS 0.50 R^) AT 400 °C
Fig. 5. Stress relaxation losses as a function of the stabilization treatment (stretching stress and temperature) and initial tensile loads (0.70 Rm, 0.80 Rm and 0.90 Rm).
ing the stabilization treatment on stress relaxation behavior is summarized in Fig. 5. At the left side of the figure can be seen the effect of the temperature when a simultaneous stretching stress of 0.50 Rm was used in the treatment. For an initial applied stress of 0.70 Rm, the stress loss is nearly the same as that for the three temperatures. On the contrary, the differences are clear if the initial applied stress is 80 % of the tensile strength; the stress loss increases suddenly when the temperature of stabilization increases from 400 °C to 450 °C. Some authors have also reported a remarkable increase of the stress relaxation on patented, cold-drawn wires after thermal treatments [33], or of the room temperature creep strain after thermo-mechanical treatments [34], if the heat treating temperature and the initial stress exceed certain values. The present results for the 0.90 Rm level show a clear tendency of the stress loss to decrease to lower values as the treatment temperature rises.
The dependence of the stress relaxation on the stretching level of the treatments at 400 °C is shown on the right side of Fig. 5. At an initial stress level of 70 % of tensile strength, the relaxation is low and nearly independent of the stretching level, and has a value similar to that in LT and HT materials at the same initial stress. For the level of 80 % of tensile strength, stress losses increase with regard to the results obtained at 0.70 Rm, as expected, and the higher values appear for the lower stretching stress (0.38 Rm). If a 0.90 Rm initial stress level is imposed, the relaxation increases again and appears to be slightly dependent on the stretching stress, decreasing when this increases.
It is known that residual stresses due to cold-drawing influence the stress relaxation losses in ferritic steel [35]. In a recent paper, Atienza and Elices [36] showed the dependence of
stress relaxation on post-drawing processes in pearlitic wires; the wires were tested as-drawn, with a thermo-mechanical treatment of stabilization alone, or were stabilized and surface rolled, with the intention of generating a small plastic surface deformation. Such processes produced different inner axial residual stress distributions, both in form and particularly in maximum value: high tensile residual stress at the subsurface region of the section and compressive stress at the central zone for the as-drawn wires, or low residual stress on the whole section in the stabilized wires, or high compressive stress at the subsurface region and moderately tensile stress at the remainder in the rolled wires. When these samples were tested for stress relaxation, the results were interpreted by the authors in considering the superposition of the applied and residual stresses and comparing this total stress with the yield strength. However, the residual stress distributions are not the sole difference among the wires because the stabilized wires were the only ones that were heat treated simultaneously with any plastic straining. In the as-drawn or rolled wires, the whole section or the subsurface zone was plastically deformed without concurrent or later heat treatment. Then, differences could be expected in the pinning of the dislocation population between the last two wires classes and the former ones, which were not taken into account and which could have increased the relaxation when the total stress was still lower than the yield strength. In the present work, all the materials were stabilized, that is to say dynamic strain aged, and the differences in residual stresses were not so marked; major differences in the microstructure, such as recovery, recrystallization and spheroidization, are possibly produced only in the higher temperature materials. The present results may serve as a more exigent test for the effect of residual stress on the relaxation behavior of pearlitic wires and will be analyzed with such an aim.
As a general trend, stress loss increases with the initial applied stress, but the amount is higher when the stress is raised from 0.80 Rm to 0.90 Rm than when it is raised from 0.70 Rm to 0.80 Rm. This may be because at the higher stress level, the applied stress is equal to the 0.1 proof stress in the LT material and is higher than the 0.2 proof stress in the other four cases. Then, all the materials were under plastic strain in their whole sections. It seems that the LT material might be an exception because the total stress, that is to say the stress with the inclusion of the section averaged residual axial stress (-150 MPa), is lower than 0.1 proof stress. However, there is no exception because the data in Fig. 2 were obtained from specimens with the same residual stress and the whole section must be under plastic flow if the applied stress exceeds the Ro.i value. In consequence, the initial residual macro-stress distributions of the five materials have been smoothed and the maximum stress in all of them is a function of the sub-microstructure, produced by the cold-drawing operation and by the stabilization treatment, and by

the plastic straining produced at the start of the relaxation test. Consequently, the residual macro-stress does not seem to be a cause of the differences in stress relaxation at the 0.90 Rm stress level.
The nearly null effect at 0.7 Rm initial stress of the temperature or stretching stress variations suggests that different residual macro-stresses do not produce significant differences in relaxation at this applied stress level. Moreover, the stress loss at the 0.80 Rm initial stress is clearly higher for the HT treatment than for the treatments at lower temperatures, despite the fact that the residual stress is very low in this material. The relaxation is also high for the LF treatment, though the residual stress is very high in the surface and it is tensile on average in the wire bulk. However, part of the section in the HT case must be plastically strained because, even though the applied initial stress is slightly under the onset of the plastic zone of the tensile behavior, there is enough tensile residual stress in the central part of the section (50 MPa of section averaged residual stress). This also happens in the case of the LF material if the residual stress is superposed to the applied one. Here a wide subsurface zone is plastically strained. On the contrary, the LT material, which shows a higher tensile residual stress at the surface and a highly compressive stress on average in the wire bulk, has a stress loss similar to those of S and HF materials. In this case, only a narrow ring below the surface could be under plastic flow, and its relaxation grade is similar to that shown by S and LT materials.
From the above analysis it is clear that the stress relaxation is increased over the normal value (calling as such the S, LT and HF values) for actual applied stress if the superposition of residual macro-stress and that applied stress overcome the local yield threshold. Determination of the quantitative relation between the stress loss increment and the section area under yielding will not be attempted here. Then, what remains is an examination of those so-called normal values of stress relaxation in relation to the applied stress. This will be addressed next.
Many phenomenological expressions have been proposed to relate the stress relaxation of cold-drawn pearlitic wires with time, though expressions for the effect of initial stress have been scarce. Stiissi [37], in a formula that included time and stress effects, has shown a complex dependence that Magura, Sozen and Siess [38] adapted to an expression that is linear on the time logarithm and on the quotient of initial stress by 0.1-offset stress, though their experimental results showed disagreement with such a law. Reynolds, quoted by O'Malley [33], introduced an exponential dependence that seems to show better agreement with the trend of the experimental fact of an accelerated increase of the stress relaxation as the initial stress is increased.
The results shown in Fig. 5, replotted in Fig. 6 in a semi-logarithmic representation, show a quite linear dependence
3.00
„ 2.50
Q 2 .00-
5 1.50 IE
If) 1.00 -LU
4 0.50
O s • HT • LT A HF A. LF
_L_ _ l _ _ l _ 1200 1300 1400 1500
APPLIED STRESS (MPa)
1S0D
Fig. 6. Stress relaxation as a function of the initial applied stress for the five stabilization treatments.
of the natural logarithm of the relaxation on the initial stress in the S, LT and HF materials. Furthermore, and of significant importance, their results may be represented by a unique curve, suggesting that the respective treatments are similarly effective for the relaxation behavior if this behavior is correlated with the absolute applied stress. Low force LF and high temperature HT materials depart from that trend for the lower stresses, though they return to the general trend when the initial test stress is higher than the conventional limit stress, that is to say when the whole section yields. Saturation of the relaxation may be expected at higher stresses, as it occurs with similar materials [36].
Then, it can be assumed that these relaxation results can be interpreted as the addition of a stress loss part, exponentially dependent on initial applied stress, and a stress loss increment in some way related with the area of the section zone under yielding by the contribution of the residual stress. The result for the HT material at the lower applied stress is somewhat higher than that anticipated with this guideline, since no part is expected to yield at that applied stress level. This suggests that the HT microstructure may introduce an additional contribution to the relaxation.
3.4. Hydrogen embrittlement The results of the hydrogen embrittlement tests are shown
in Fig. 7 in the form of time to failure as a function of the treatment of stabilization (stretching stress and temperature) and the applied tensile load (0.65 Rm and 0.80 Rm). It can be seen that the effect of treatment is more evident when the applied load was lower, whichever treatment parameter was considered. Time to failure seems to follow a linear dependence with the stretching load in the explored range. As for the temperature, the effect is moderately beneficial up to 400 °C, though a sudden increase happens between that temperature and 460 °C. Taking into account both figures, it is apparent that the test ranked the environment resistance produced by the treatments in the order LF, LT, S, HF and HT,

TREATMENT TEMPERATURETO (STRETCHING STRESS 0.50 R„)
40 SO 60 70
STRETCHING S T R E S S » of Rm) AT «0°C
Fig. 7. Time to failure in the hydrogen embrittlement test as a function of the stabilization treatment (stretching stress and temperatures) and applied tensile loads (0.65 Rm and 0.80 Rm).
with the last being the most resistant to the failure in the hydrogen producing environment. Fractographic observations of the fracture surfaces showed that, in all the cases, failure proceeded through the growth of a fissure on a slanting orientation to the wire axis and nucleated at the wire surface, in keeping with previously published results for similar materials [25].
There is no unanimously accepted microscopic mechanism of hydrogen assisted metal failure; however, at a macroscopic level, it is assumed that a critical couple of tensile stress and hydrogen concentration must occur at a finite size material zone for failure initiation or propagation [39], with the critical concentration decreasing if the stress is increased. According to this, a crack is initiated or its growth is promoted when the concentration of hydrogen at a pre-existing stressed defect exceeds some critical value.
Because the stress is constant for the FIP tests, the time to failure initiation depends on how the hydrogen concentration is built up and how high the critical concentration is at the initiation site. As the velocity of crack propagation is very high in these high strength materials (about 10" ms~ ) [40], time to initiation and time to failure are practically equal. Hence the results in Fig. 7 can be interpreted as the time to build up a critical concentration on a finite size initiation zone.
The question is where the hydrogen concentration may be higher. As the hydrogen is charged from the environment over the duration of the test (dynamic charging), a high hydrogen concentration is maintained constantly on the surface. However, the concentration distribution at the inner part of the wire depends on diffusion and trapping processes. The flux of hydrogen in metals is promoted by negative concentration gradients and by positive hydrostatic stress and
plastic strain gradients [41]. As the steel wires will have been charged dynamically, the concentration of hydrogen must be higher in the neighborhood of the surface at any time, and local accumulation is favored by the strain and residual stress distributions if these decrease from the surface to the axis, as is the case for S, LF and LT materials [20]. Then, a near surface location for the initiation zone is compatible with the hydrogen dynamic charging and the strain and residual stress distribution; this is confirmed by the fractographic observations cited above.
It is also known that increasing the axial stress applied to the wires decreases the time to failure in pre-cracked wires [42] and smooth wires [43,44]. This raises the issue of what stress is critical to the failure. The applied stress has a dual role: it increases the tensile stress at the initiation site over the axial residual stress, and it promotes the hydrogen location near the surface of the wire because it increases the hydrostatic stress over the hydrostatic residual stress level. In this analysis the hypothesis is made that, as for smooth wires, failure initiation happens at a subsurface site where the local axial stress is the highest. The results seem to confirm this, as will be discussed later. Because of residual stresses, the superposition of the surface residual axial stress and the externally applied axial stresses must be considered when analyzing these results. And, as was shown in section 3.1, this superposition can be carried out by adding the applied and residual stresses. Consequently, it seems appropriate to represent the time to rupture versus the maximum total local stress in the ferrite at the surface of the wire, calculated as the sum of the applied axial stress and the maximum measured residual axial stress in the ferrite at the wire surface.
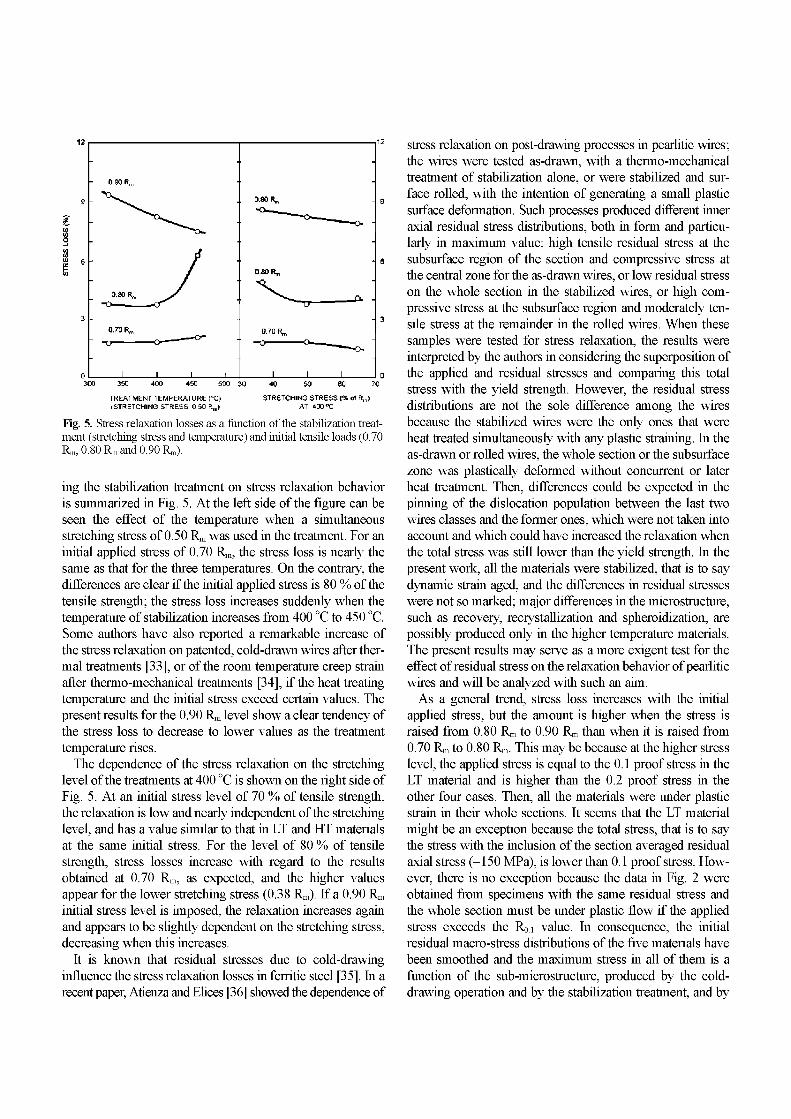
This has been done in Fig. 8, using the results from Figs. 1 and 7, and an additional result for the HT material at 0.72 Fm
load. Clearly, whereas the results for S, LF, LT and HF materials roughly define a unique curve, the HT results seem to be placed on a similar curve, shifted to longer lives. This behavior suggests that the main difference between most of these materials, excluding the HT material, and at least for the high range of stresses tested here (65 % to 80 % of tensile strength), is the maximum axial residual stress in the ferrite at the surface of the wires. At high stresses, some yielding of ferrite occurs because the flow stress has been surpassed on the surface and the actual total stress may be lower than the simple superposition of residual and applied stresses, though this fact would not significantly change the tendency shown in Fig. 8.
The results in Fig. 8 can be analyzed from the point of view of the dual role of stress components that was emphasized above (the hydrostatic component as a factor in the build-up of the local hydrogen concentration and the axial component as mechanical agent of the local break of the material). The correlation between the total stress at the sur-
Jl
Hi
1 -
y ÍT LL
O 1 -LU
i
35
30
25
20
III
lu
5 -
1000 1100 1200 1300 1500 1500 1700
TOTAL STRESS (APPLIED + RESIDUAL) (MPa)
Fig. 8. Time to fracture in hydrogen embrittlement tests as a function of the total maximum axial stress (sum of residual and applied stress) at the wire surface, for the five stabilization treatments.
face and the time to rupture, practically insensitive to the S, LF, LT and HF treatments, suggests the following: the axial component of stress is the controlling parameter, and the effects of the hydrostatic component are not so important because they are small or overshadowed by the proximity between the hydrogen source and the failure initiation site (this assures a high hydrogen concentration at the subsurface, whatever the hydrostatic stress level in the zone). Then, the results support the above hypothesis of failure initiation in smooth wires happening at a subsurface site where the local axial stress is the highest. It seems probable that the S, LF, LT and HF treatments affect the cold-drawn pearlitic microstructure in a mode that does not alter significantly the critical couple of tensile stress and hydrogen concentration needed for failure initiation.
In such a rationale, the atypical behavior of the material treated at 460 °C may be a consequence of changes in the microstructure, as was noted in the discussion of the tensile test results, which bring in other factors apart from the residual stress, such as the integrity of the cementite lamellae [13]. These changes could act to reduce the diffusion and the local hydrogen accumulation rates, or to increase the critical value of hydrogen concentration for a given axial stress.
The measured time to reach the saturation concentration of as-drawn pearlitic wires in standard FIP tests (0.8 Fm) is nearly 20 h [45]; it can be expected that this time would increase if the total stress were smaller. Then, the times to failure obtained here for all treatments are compatible with the failure happening while the mean hydrogen concentration is still increasing. Therefore, differences in hydrogen availability associated with dissimilarity in the diffusion process would be the cause of the improved efficiency of the HT treatment in increasing the lifetime of the wires. However, the local concentration depends also on the trapping
action of some microstructural sites, which increase the harmful hydrogen effect if the site is an easily fractured center or reduce the harmful hydrogen effect if the site is of an innocuous type [46]. Tramps in the cold-drawn pearlitic wires have been investigated by thermal desorption spectrometry and two peaks of desorption, in the range of 100-200 °C and 300-400 °C, have been detected by many authors. The first peak has been attributed first to harmful diffusible hydrogen, and the second peak to innocuous trapped hydrogen [47-49]. Takai and Nozue [50] found that, after 24 hours of charging, total and trapped hydrogen content decreased with the temperature of the post-drawn thermal treatments, but diffusible hydrogen has a maximum value at 400 °C, and, by interpolating their results, the value for 330 °C was similar to the one for 460 °C. Their results did not seem to support that harmful diffusible hydrogen availability, hence differences in the diffusion process, were the cause of the better behavior of HT wires and not of the LT wires. This would leave a change in the critical couple between hydrogen concentration and axial stress at failure initiation site as the reason for the longer survival time of the HT wires, that is to say, the need for a higher concentration for a given stress.
It is necessary once again to note that whereas treatments in the hterature are usually only thermal treatments, the present wires have been subjected to very short thermo-mechanical treatments and the sub-microstructural consequences that such treatments have have yet not been studied. The discussion of the present results through knowledge of thermal treatments effects may be plausible, though necessarily incomplete. It is clear that more work is needed on such an aspect for a better understanding of the behavior of thermo-mechani-cally treated pearlitic wires.
4. CONCLUSIONS
In this work the effects of temperature and stretching level, in the range of the commercial stress-relieving treatments of prestressing steel wire, have been evaluated, with the aim of reducing stress relaxation losses and increasing hydrogen embrittlement resistance, without reduction of tensile mechanical properties. From this research the following conclusions can be made:
1. Increasing the stretching force during the stabilization procedure has no effect on the proof stress, tensile strength, strain at maximum load, or stress relaxation at usual initial stress (0,7 Rm), though it improves the hydrogen resistance moderately.
2. Increasing the temperature during the stabilization procedure decreases the tensile properties of the wires, especially the proof stress. The strain at maximum load increases. The hydrogen resistance increases moderately with the stabilization temperature up to 400 °C and increases significantly

above this temperature. Temperature has little influence on relaxation at initial stress of 0.7 Rm and is harmful at the 0.8 Rm level if it approaches 460 °C.
3. These stress-relieving treatments seem to have a similar effect on relaxation, with the exceptions of the high temperature treatment and the low stretching treatment. Except in these cases, the relaxation appears to depend exponentially on the applied stress.
4. The effect of these stress-relieving treatments on time to failure in hydrogen promoting medium seems to be controlled by the total (applied plus residual) stress at the surface, at least for applied stresses higher than 0.65 Rm, with the exception of the high temperature treatment, which may induce changes in the pearlite microstructure that increase significantly its resistance to hydrogen.
ACKNOWLEDGEMENTS
The authors gratefully acknowledge the financial support of the Spanish Ministerio de Fomento through the grant entitled "Durability of Prestressed Concrete Tendons" and of the Spanish Ministerio de Ciencia e Innovación through the proyect BIA2008-06705-C02-01. The present work was conducted within the framework provided by the project SEDUREC (Ref CSD00C-06-14102) of the research program CON-SOLIDER-INGENIO 2010. Mr. Jose M. Martinez for help with drawing the figures, are also acknowledged.
REFERENCES
1. M. Elices, J. of Mater. Sci. 39, 3889 (2004). 2. Y. Yamada, Tetsu-to-Hagané 60,1624 (1974). 3. Y Yamada, Tetsu-to-Hagané 61,119 (1975). 4. Y. Yamada, Trans. ISIJ16, 417 (1976). 5. J. Languillaume, G Kapelski, and B. Baudelet, Mat. Let
ters 33, 241 (1997). 6. R Watté, J. Van Humbeeck, E. Aernoudt, and I. Lefever,
ScriptaMat. 34, 89(1996). 7. A. Phelippeau, S. Pommier, C. Pioul and M. Clavel, Nano-
structures: Syntesis, Functional Properties and Applications (T Tsakalakos et al. Eds.), p.251-270, NATO Series, Klu-wer Acad. Pub., Dordrecht, The Netherlands (2003).
8. J. Languillaume, G Kapelski, andB. Baudelet, Acta Mater. 45,1201 (1997).
9. B.-K. McGuinn and J. R. Griffiths, Br. Corros. J. 12, 152 (f977).
f0. C.-F. Bergsma, J. W. Boon, and C. F Etienne, Heron 22,46 (f977).
f f. C. E. Hinchliffe and G D. W. Smith, Mater. Sci. and Tech. 17, 148 (200f).
f2. W. J. Nam, H. R. Song, and K. T. Park, Sol. S Phenom. 118, 3 f (2006).
f 3. J. W. Lee, J. C. Lee, Y S. Lee, K. T Park, and W. J. Nam, J.
of Mat. Process. Tech. 209, 5300 (2009). f 4. R. H. U. Queiroz, E J. Fonseca, V T L. Buono, M. S. Andrade,
E. M. Paula e Silva, and B. M. Gonzalez, Wire J. Int. 32 (June), 76 (1999).
f 5. B. M. Gonzalez, L. A. Marchi, E. J. Fonseca, P. J. Moden-esi, and V T. L. Buono, ISIJInt. 43,428 (2003).
16. A. Zeren and M. Zeren, J. Mater. Proces. Tech. 141, 86 (2003).
f 7. K. Van Acker, J. Root, P. Van Houtte, and E. Aernoudt, Acta Mater. 44, 4039 (f996).
f 8. Y Tomota, P. Lukás, D. Neov, S. Harjo, and Y R. Abe, Acta Mater. 51, 805 (2003).
f 9. J. Ruiz-Hervias, V Luzin, H. Prask, T. Gnaeupel-Herold, and M. Elices, Mater. Sci. andEng. A 435-436,725 (2006).
20. J. Ruiz-Hervias, J. M. Atienza, M. Elices, and E. C. Oliver, Mater. Sci. andEng. A 480, 439 (2008).
21.1. Artuso, F. Dughiero, S. Lupi, S. Partisani, and P. Facchinelli, Installation for the Continuous Induction Heat Treatment of Wires, http://www.ate.it/pdf/ATE03_new.pdf (2010).
22.1. C. Noyan and J. B. Cohen, Residual stress: Measurement by Diffraction and Interpretation, Springer-Verlag, New York (1987).
23. ISO Standard 15630-3, Steel for reinforcement and pre-stressing of concrete. Test methods. Part 3: Prestressing steel. ISO Organization, Geneve, Switzerland (2002).
24. D. G Enos and J. R. Scully, Metal, and Mater. Trans. 33A, 1151 (2002).
25. M. Elices, L. Caballero, A. Valiente, J. Ruiz, and A. Martin, Corrosion 64, 164 (2008).
26. M. Martinez-Perez, C. R. Borlado, F. J. Mompean, M. García-Hernández, J. Gil-Sevillano, J. Ruiz-Hervias, J. M. Atienza, M. Elices, R. L. Peng, and M. R. Daymod, Acta Mater. 53, 4415 (2005).
27. J. M. Atienza and M. Elices, Construction and Building Materials 23, 2932 (2009).
28. Y Tomota, T. Suzuki, A. Kanie, Y. Shiota, M. Uno, A. Moriai, N. Minakawa, and Y Morii, Acta Materialia 53,463 (2005).
29. J. Gil-Sevillano, J. Phys. Ill 1, 967 (1991). 30. M. Dollar, I. M. Bernstein, and A. W. Thompson, Acta
Metall. 36, 311(1988). 31. A. Kanie,Y Tomota, S. Torii, and T. Kamiyama, ISIJInt,
44, 1952 (2004). 32. D. B. Park, J. W. Lee, Y. S. Lee, K. T. Park, and W. J. Nam,
Met. and Mater. Int. 14, 59 (2008). 33. M. O'Malley, Wirelnd. 55, 808 (1988). 34. Z. Zao, D. O. Northwood, Ch. Liu, and Y. Liu, J. Mater
Process. Tech. 89-90, 569 (1999). 35. J. M. Atienza and M. Elices, Mater, and Struct. 37, 301
(2004). 36. J. M. Atienza and M. Elices, J. of Mater, in Civil Eng. 19,
703 (2007). 37. F. Stussi, IABSEPublications 19, 273 (1959). 38. D. D. Magura, M. A. Sozen, and C. P. Siess, PCI J. 92,185
(1964).

39. S. Serebrinsky, E. A. Carter, and M. Ortiz, J. Mech. Phys. of Solids 52, 2403 (2004).
40. M. Elices, V Sánchez, I. Bernstein, A. Thompson, and J. Pinero, Hydrogen Effects in Metals, (I. M. Bernstein and A. W. Thompson eds), p. 971-978, IMS, Warrendale, USA, (1980).
41. J. Toribio, V Kharin, D. Vergara, J. A. Blanco, and J. G Ballesteros, Corr. Sci. 49, 3557 (2007).
42. M. Elices, G Maeder, and V Sánchez Gálvez, British Corr. J. 18, 80 (1983).
43. M. Elices, J. Ruiz, and J. M. Atienza, Mater, and Struct. 37, 315(2004).
44. J. M. Atienza, M. Elices, J. Ruiz-Hervias, L. Caballero, and A. Valiente, Met. and Mater. Int. 13, 139 (2007).
45. K Takai, J. Seki, and Y. Homma, Tetsu-to-Hagané 81,1025 (1995).
46.1. M. Bernstein, Hydrogen Effects in Materials (A. W. Thompson, and N. R. Moody eds.), p. 3-11, TMS, Warrendale, USA (1996).
47. J. S. Kim, Y H. Lee, D. L. Lee, K. Park, and Ch. S. Lee, Mater. Sci. Eng. A 505, 105 (2009).
48. M. Nagumo, K. Takai, and N. Okuda, J. Alloys Compd. 293-295,310(1999).
49. S. Yamasaki, S. Nishida, D. Hirakami, and T. Tarui, Wire J. Int. May, 58 (2009).
50. K. Takai and A. Nozue, Corr 2000, p. 468, NACE, Houston, USA (2000).