Embed Size (px)
Citation preview
Theory of Demand
Demand Demand refers to the quantities that people are or would be willing to buy at different prices during a given time period, assuming that other factors affecting these quantities remain the same.
Continue……
Law of demand The law of demand states that the quantity
demanded of a good or service is inversely related to the selling price, ceteris paribus (all other determinants remaining unchanged).
Symbolically, the law of demand may be summarized as
and
Continue……
1st Equation states that Qd, the quantity demanded of a good or service, is functionally related to the selling price P.
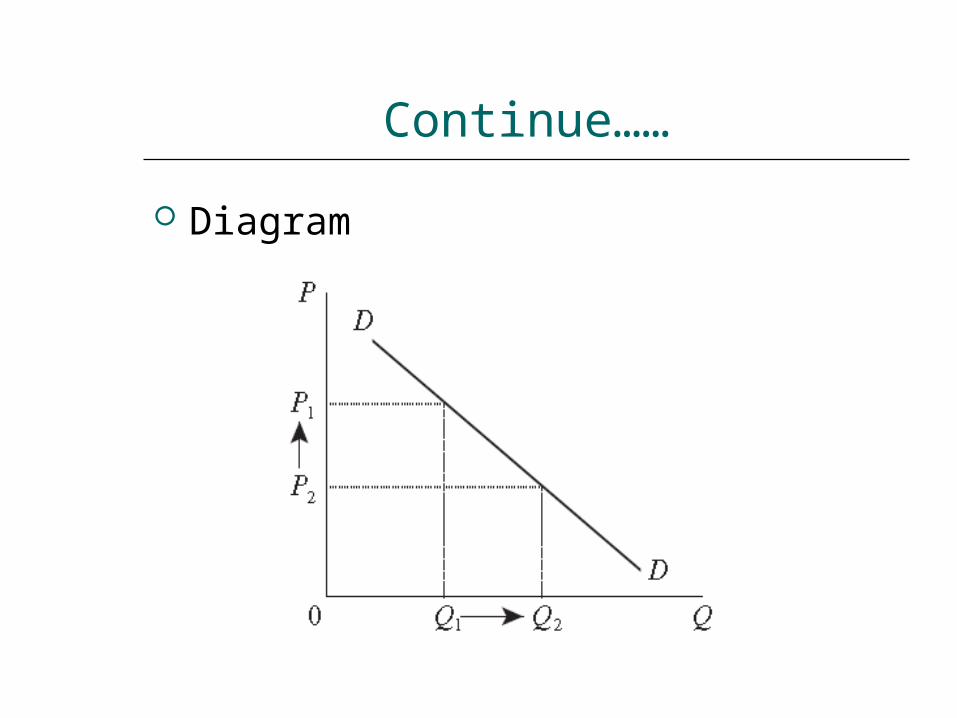
Inequality asserts that quantity demanded and price are inversely related. This relationship is illustrated in Figure.
The downward-sloping demand curve illustrates the inverse relationship between the quantity demanded of a good or service and its selling price.
Continue……
Diagram
Continue……
THE MARKET DEMAND CURVE The law of demand is a theoretical
explanation of the expected behaviour of individual economic units when confronted with a change in the price of a commodity.
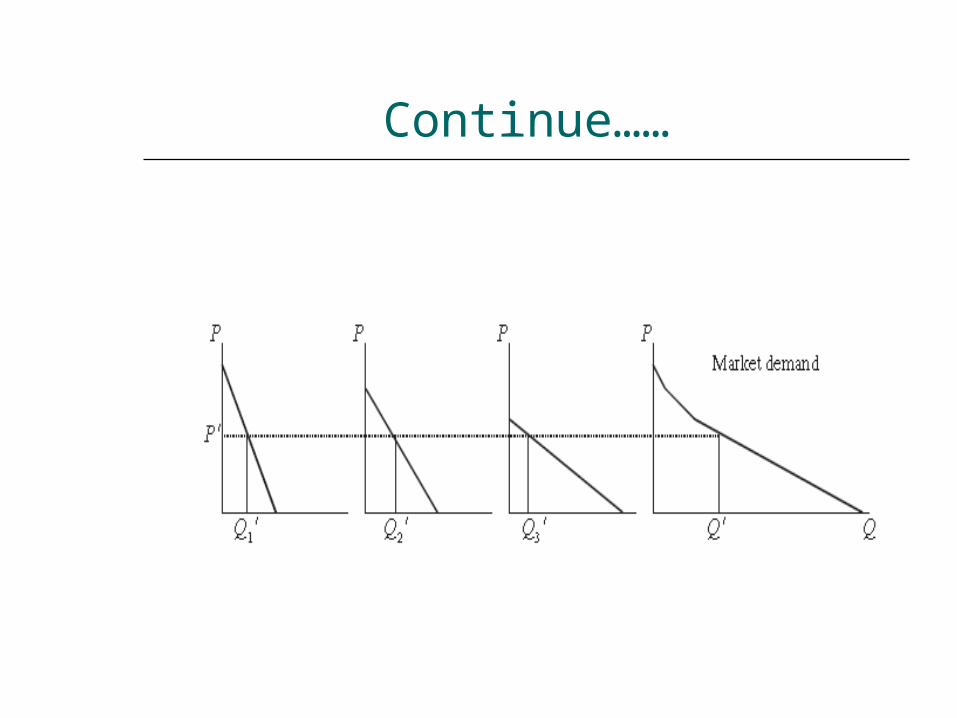
The market demand curve is the horizontal summation of the individual demand curves.
For any given price, the market demand curve is the sum of the horizontal distances from the vertical axis to each individual demand curve.
Continue……
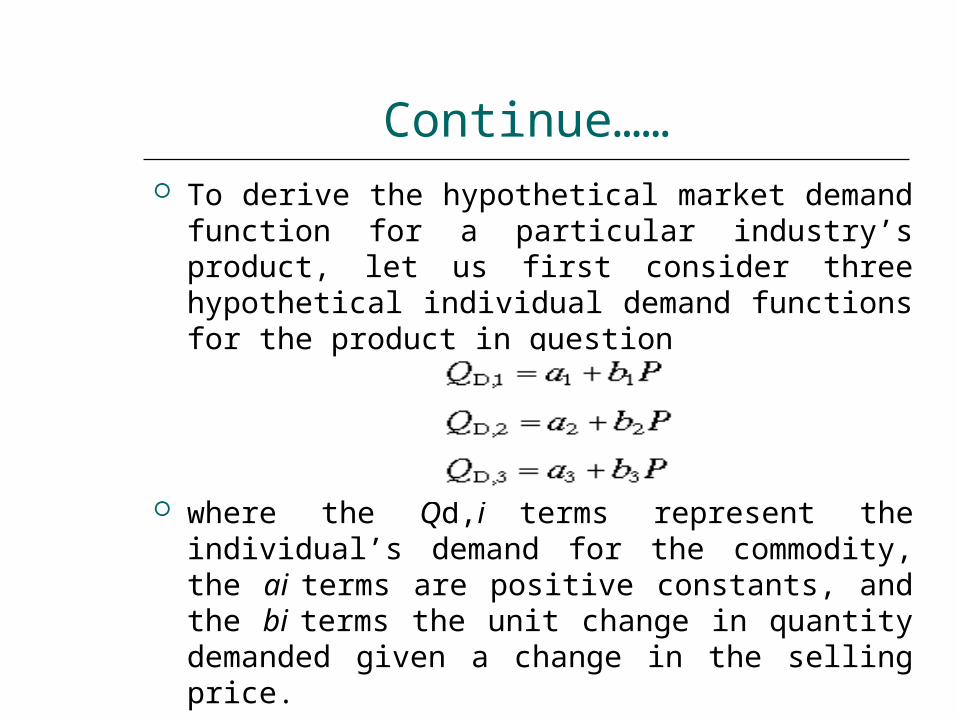
Continue…… To derive the hypothetical market demand
function for a particular industry’s product, let us first consider three hypothetical individual demand functions for the product in question
where the Qd,i terms represent the individual’s demand for the commodity, the ai terms are positive constants, and the bi terms the unit change in quantity demanded given a change in the selling price.
Continue……
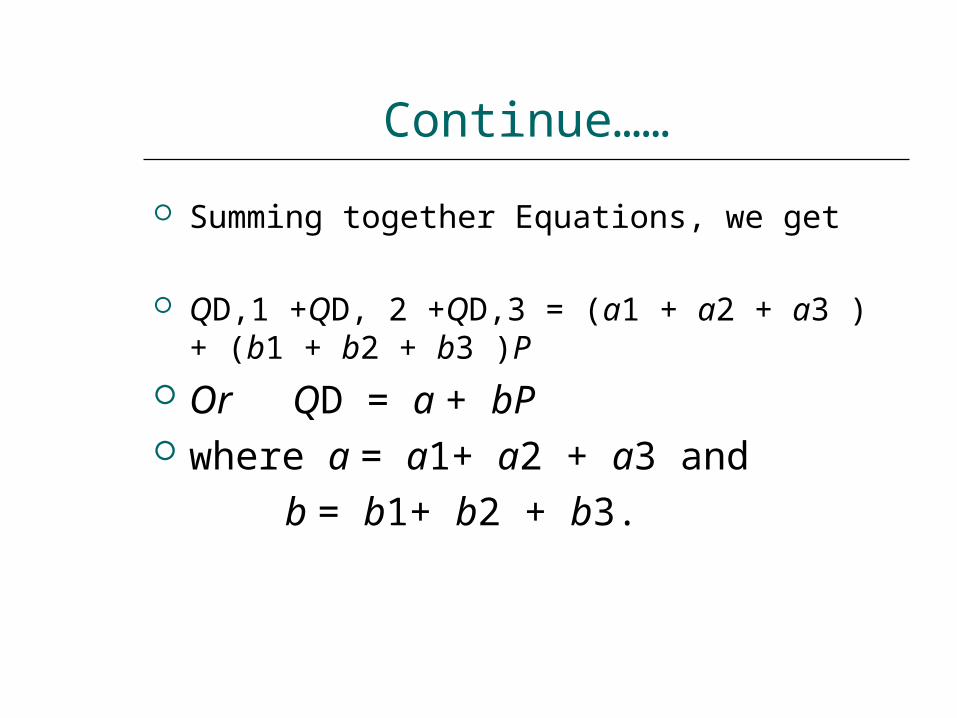
Summing together Equations, we get
QD,1 +QD, 2 +QD,3 = (a1 + a2 + a3 ) + (b1 + b2 + b3 )P
Or QD = a + bP where a = a1+ a2 + a3 and
b = b1+ b2 + b3.

Continue……
Problem. Suppose that the total market demand for a product comprises the demand of three individuals with identical demand equations.
QD,1 =QD, 2 =QD,3 = 50 - 25P What is the market demand equation
for this product?
Continue……
Difference between movement along the demand curve and shifts in the demand curve
The market demand curve establishes a relationship between the product’s price and the quantity demanded; all other determinants of market demand are held constant.
The relationship between changes in price and changes in quantity demanded are illustrated as movements along the demand curve.
Continue……
The change in demand which results when a determinant of demand, other than its selling price, is changed, is called shift in demand.
OTHER DETERMINANTS OF MARKET DEMAND
Other demand determinants include income, consumer preferences, the prices of related goods, price expectations, and population.
Theory of Supply
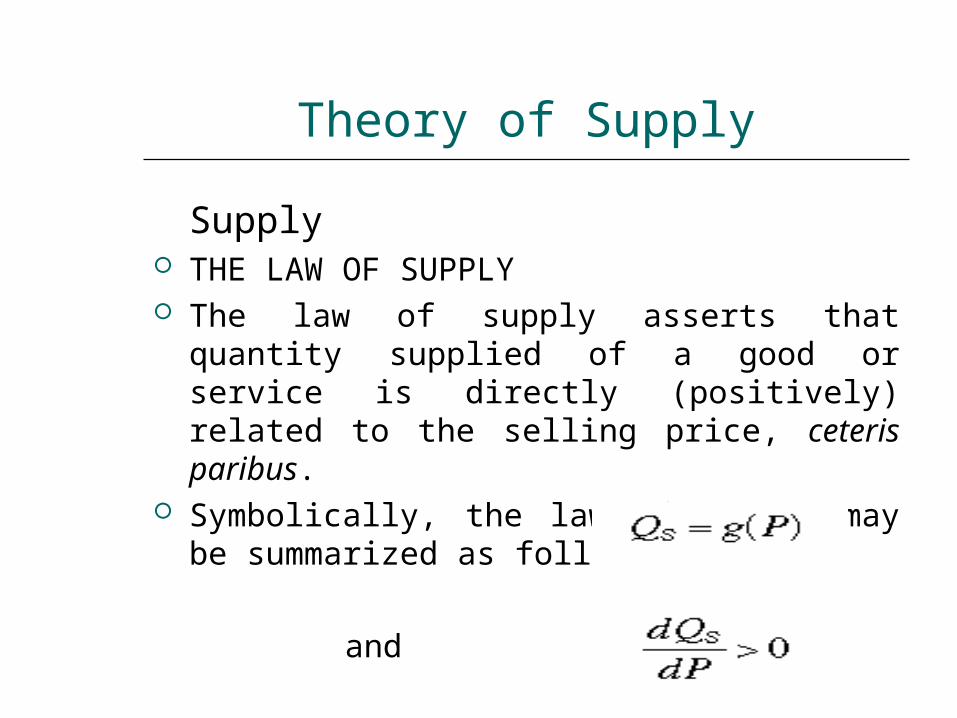
Supply THE LAW OF SUPPLY The law of supply asserts that quantity
supplied of a good or service is directly (positively) related to the selling price, ceteris paribus.
Symbolically, the law of supply may be summarized as follows:
and
Continue……
1st Equation states that the quantity supplied QS of a good or service is functionally related to the selling price P.
Inequality asserts that quantity supplied of a product and its price are directly related. This relationship is illustrated in Figure.
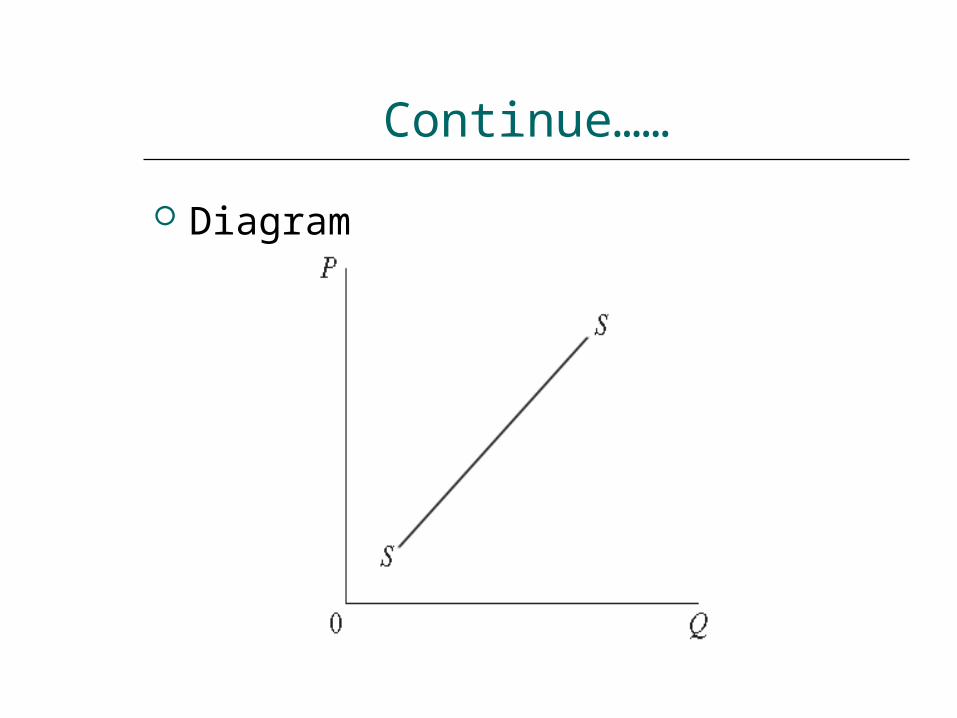
The upward-sloping supply curve illustrates the positive relationship between the quantity supplied of a good or service and its selling price.
Continue……
Diagram
Continue……
As with the market demand curve, the market supply curve is also the horizontal summation of the individual firms’ supply curves.
The market supply curve establishes a relationship between price and quantity supplied.
Changes in the price and the quantity supplied of a good or service are represented diagrammatically as a movement along the supply curve.
Continue……
Changes in supply determinants are illustrated as a shift in the entire supply curve.
DETERMINANTS OF MARKET SUPPLY Prices of inputs, technology, taxes and subsidies, prices of related goods and price expectations are the other determinants of market supply.
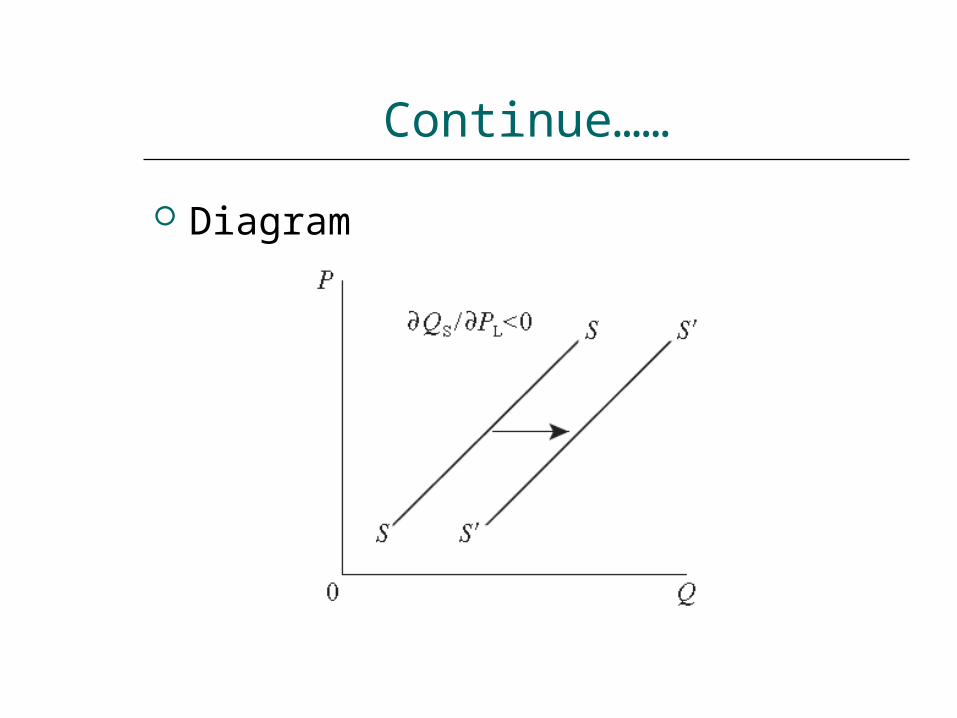
Continue……
Diagram
THE MARKET MECHANISM: THEINTERACTION OF DEMAND AND SUPPLY
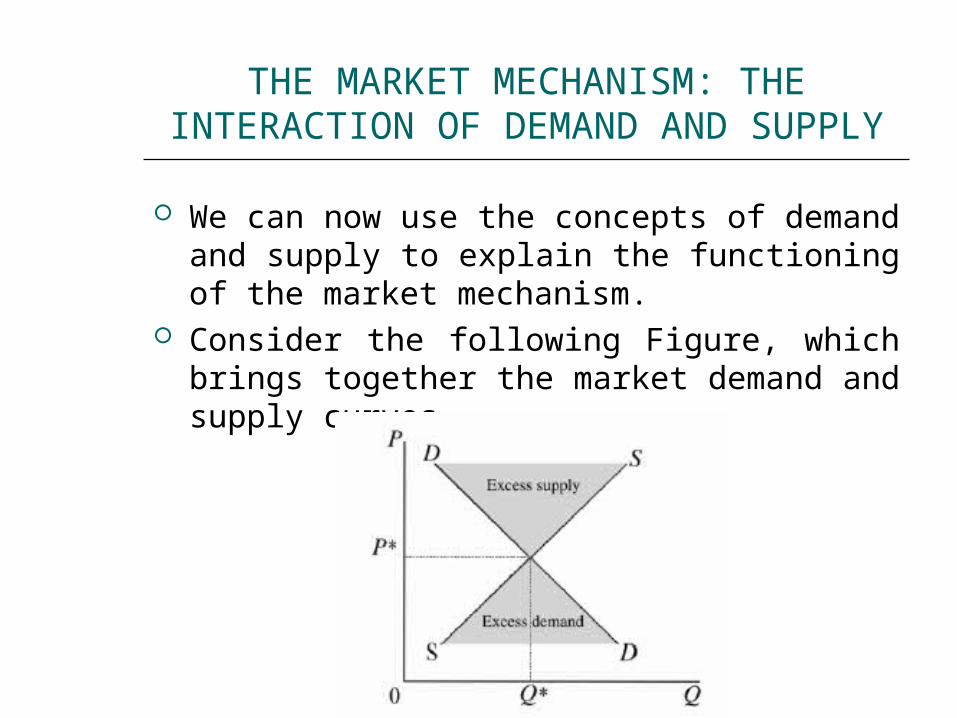
We can now use the concepts of demand and supply to explain the functioning of the market mechanism.
Consider the following Figure, which brings together the market demand and supply curves.
Continue……
In our hypothetical market, the market equilibrium price is P*. At that price, the quantity of a good or service that buyers are able and willing to buy is precisely equal to Q*, the amount that firms are willing to supply.
Assignment
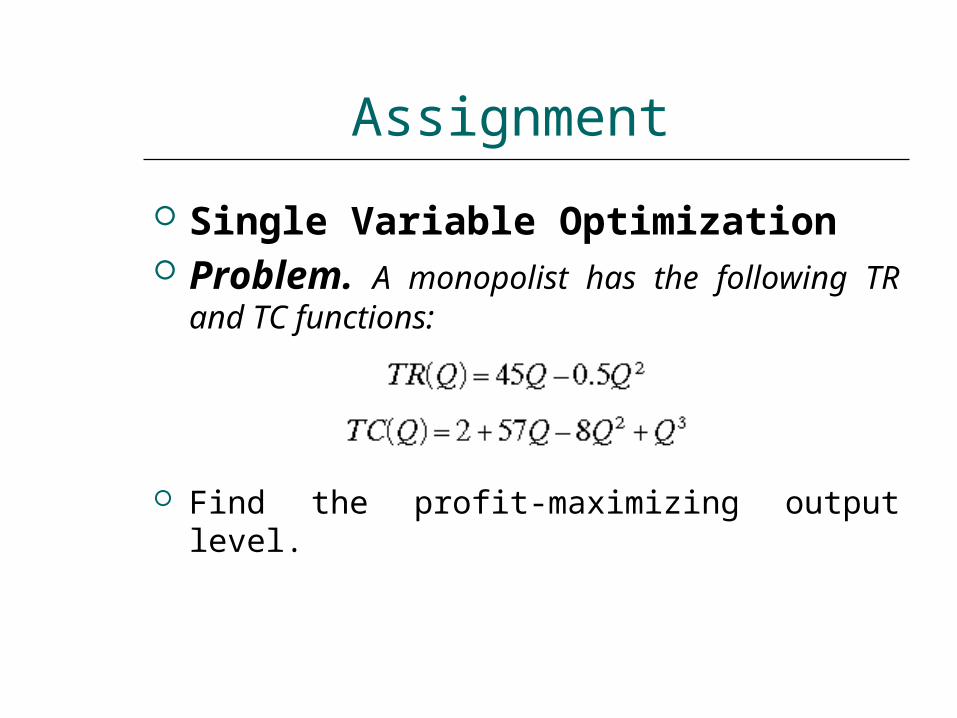
Single Variable Optimization Problem. A monopolist has the following
TR and TC functions:
Find the profit-maximizing output level.
Continue……
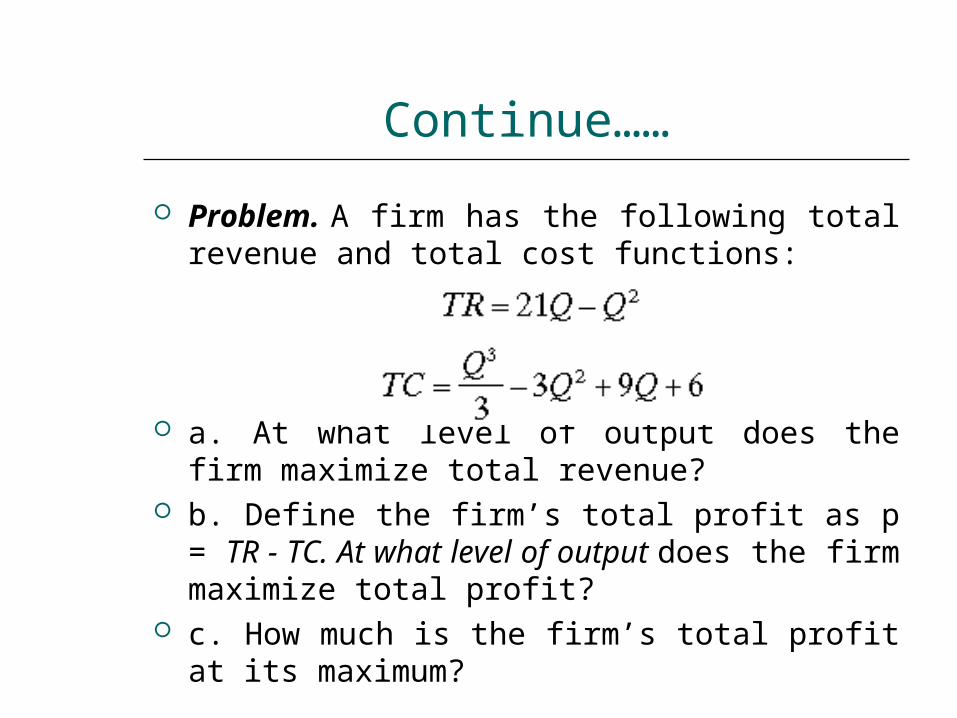
Problem. A firm has the following total revenue and total cost functions:
a. At what level of output does the firm maximize total revenue?
b. Define the firm’s total profit as p = TR - TC. At what level of output does the firm maximize total profit?
c. How much is the firm’s total profit at its maximum?
Continue……
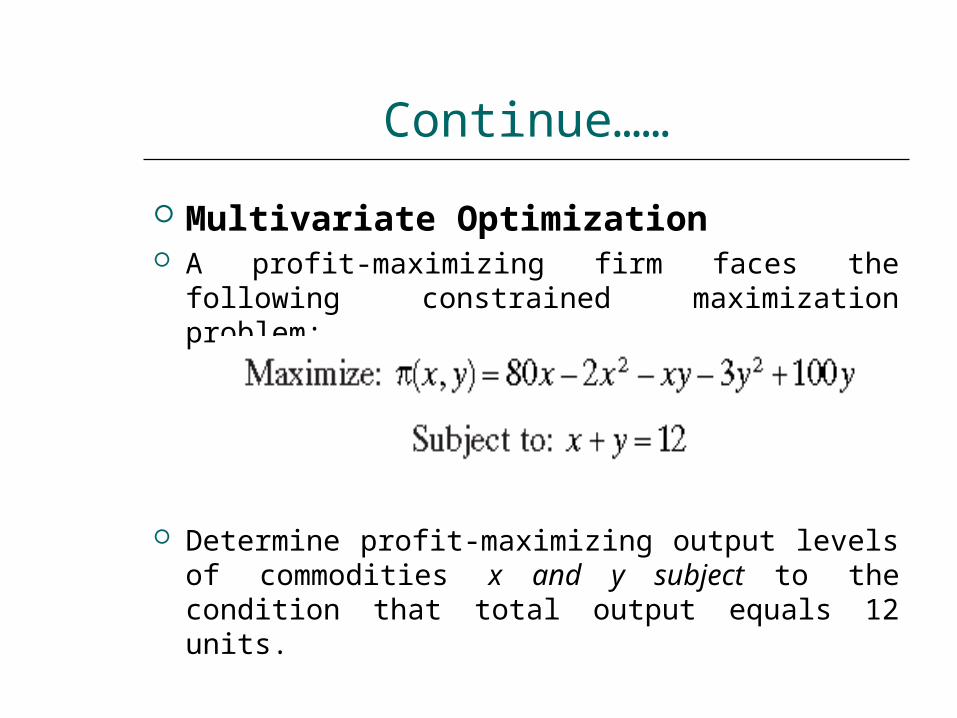
Multivariate Optimization A profit-maximizing firm faces the following
constrained maximization problem:
Determine profit-maximizing output levels of commodities x and y subject to the condition that total output equals 12 units.
Continue……
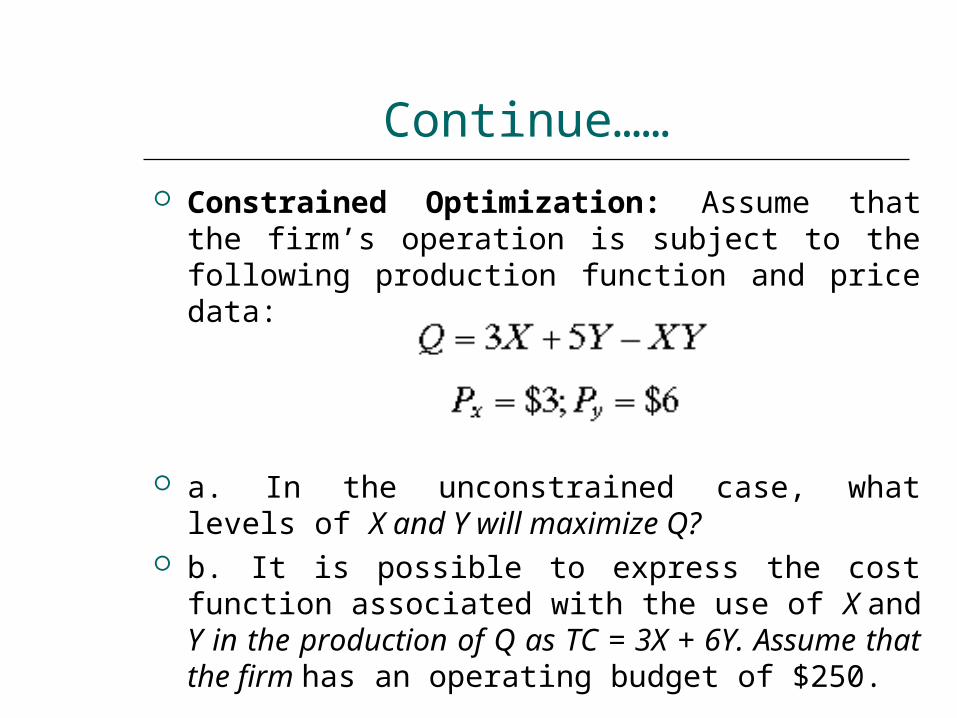
Constrained Optimization: Assume that the firm’s operation is subject to the following production function and price data:
a. In the unconstrained case, what levels of X and Y will maximize Q?
b. It is possible to express the cost function associated with the use of X and Y in the production of Q as TC = 3X + 6Y. Assume that the firm has an operating budget of $250.
Continue……
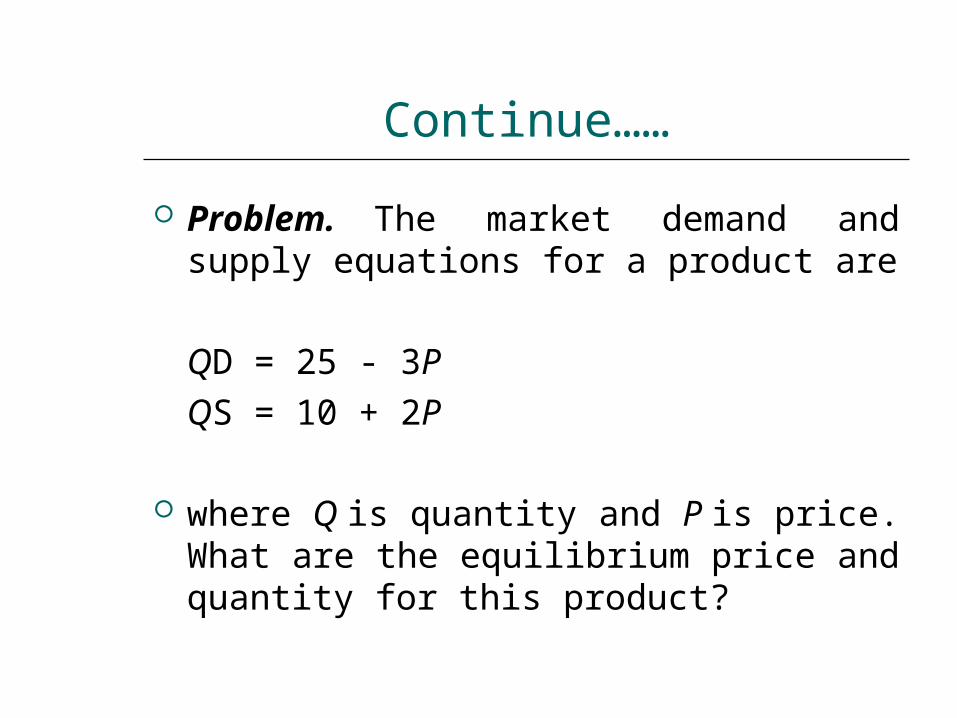
Problem. The market demand and supply equations for a product are
QD = 25 - 3PQS = 10 + 2P
where Q is quantity and P is price.
What are the equilibrium price and quantity for this product?
Continue……
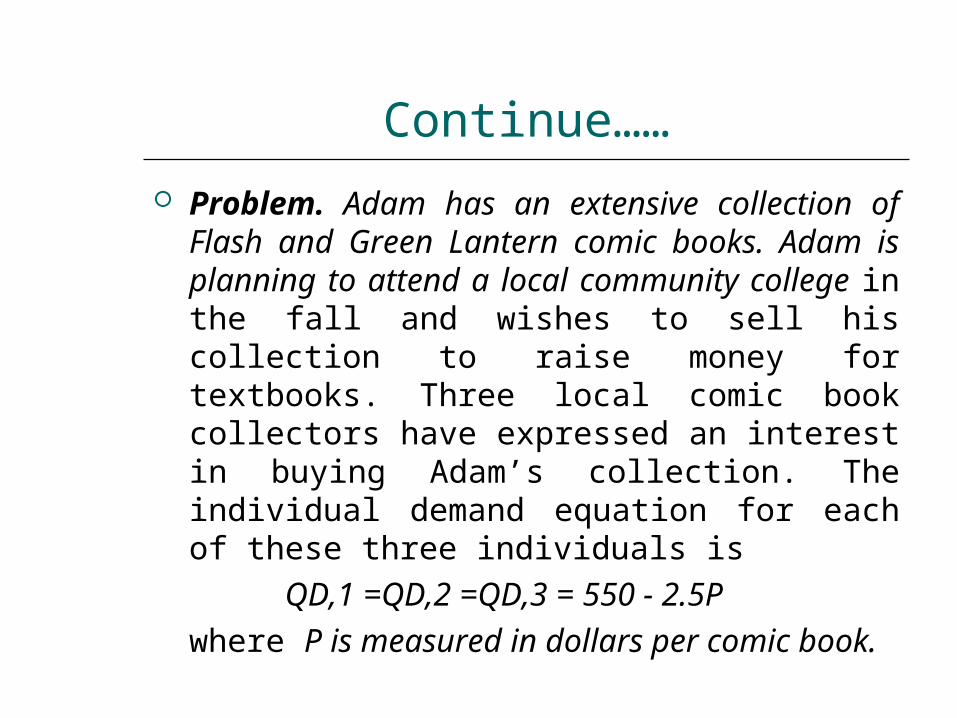
Problem. Adam has an extensive collection of Flash and Green Lantern comic books. Adam is planning to attend a local community college in the fall and wishes to sell his collection to raise money for textbooks. Three local comic book collectors have expressed an interest in buying Adam’s collection. The individual demand equation for each of these three individuals is
QD,1 =QD,2 =QD,3 = 550 - 2.5Pwhere P is measured in dollars per comic book.
Continue……
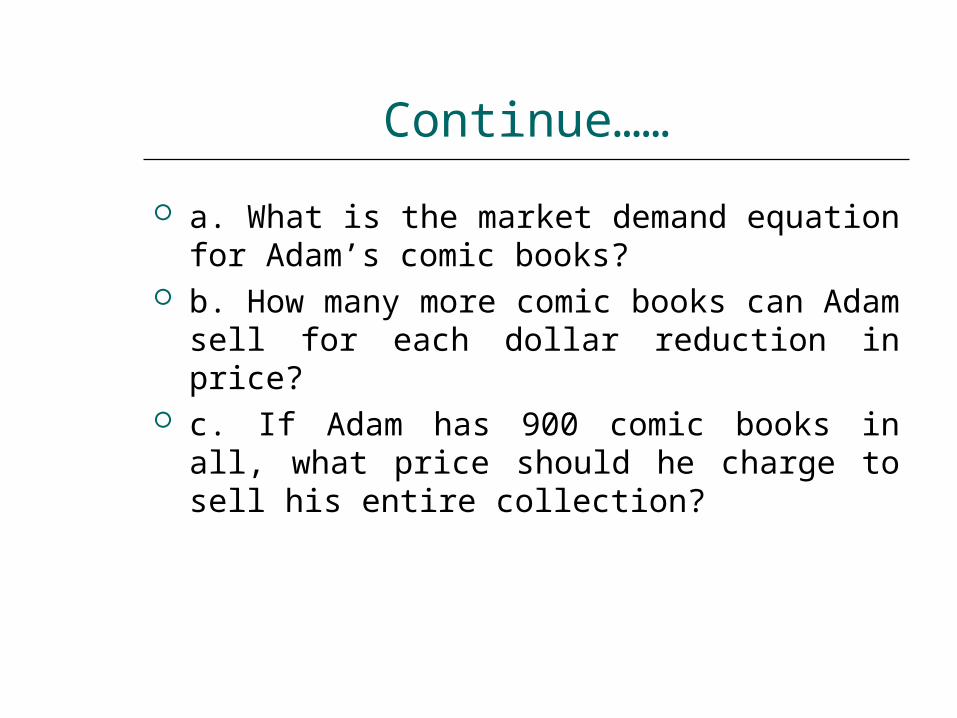
a. What is the market demand equation for Adam’s comic books?
b. How many more comic books can Adam sell for each dollar reduction in price?
c. If Adam has 900 comic books in all, what price should he charge to sell his entire collection?
Continue……
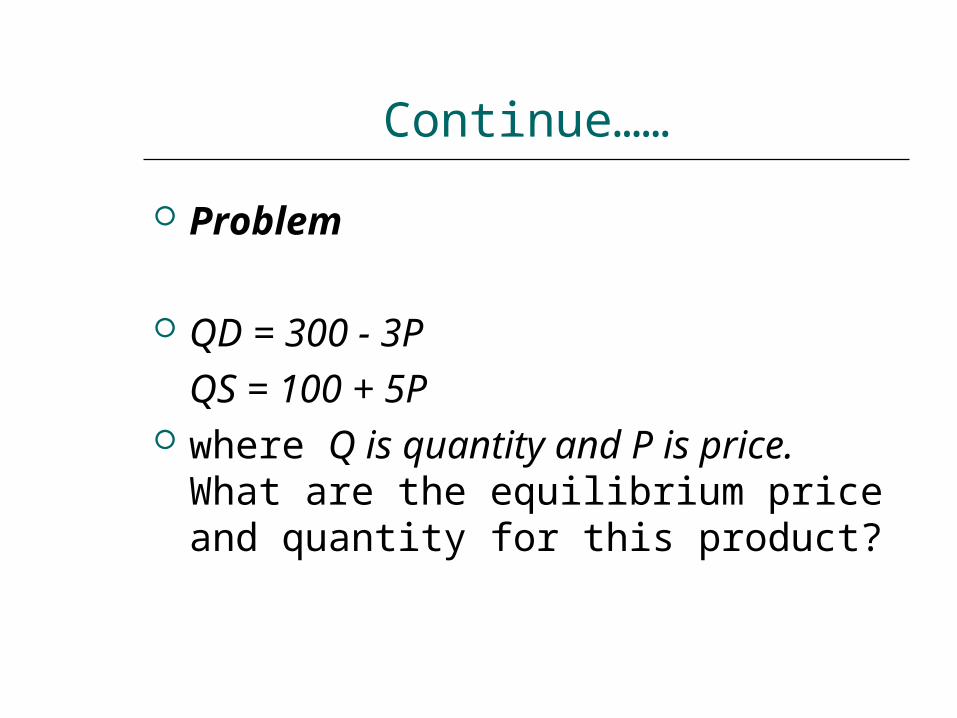
Problem
QD = 300 - 3PQS = 100 + 5P
where Q is quantity and P is price. What are the equilibrium price and quantity for this product?