Embed Size (px)
Citation preview
Supply and Demand
1
2

3

DEMAND DEFINEDWhat is Demand?
Demand is the different quantities of goods that consumers are willing and able to buy at different prices.(Ex: Bill Gates is able to purchase a Ferrari, but if
he isn’t willing he has NO demand for one)
What is the Law of Demand? There is an INVERSE relationship between
price and quantity demanded
4
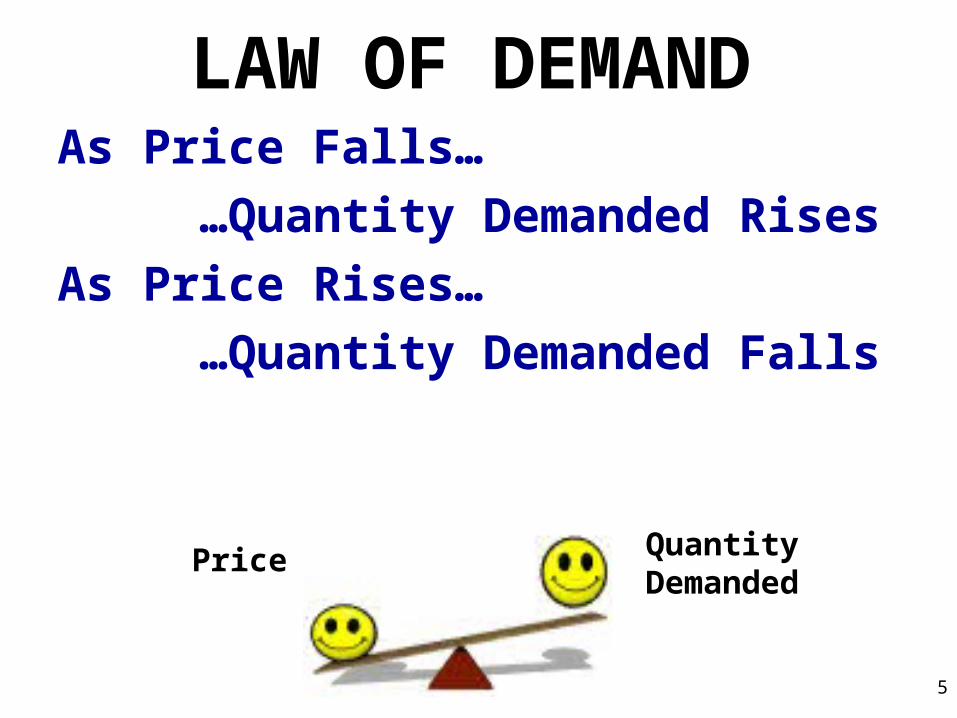
LAW OF DEMANDAs Price Falls…
…Quantity Demanded Rises
As Price Rises…
…Quantity Demanded Falls
Price Quantity Demanded
5
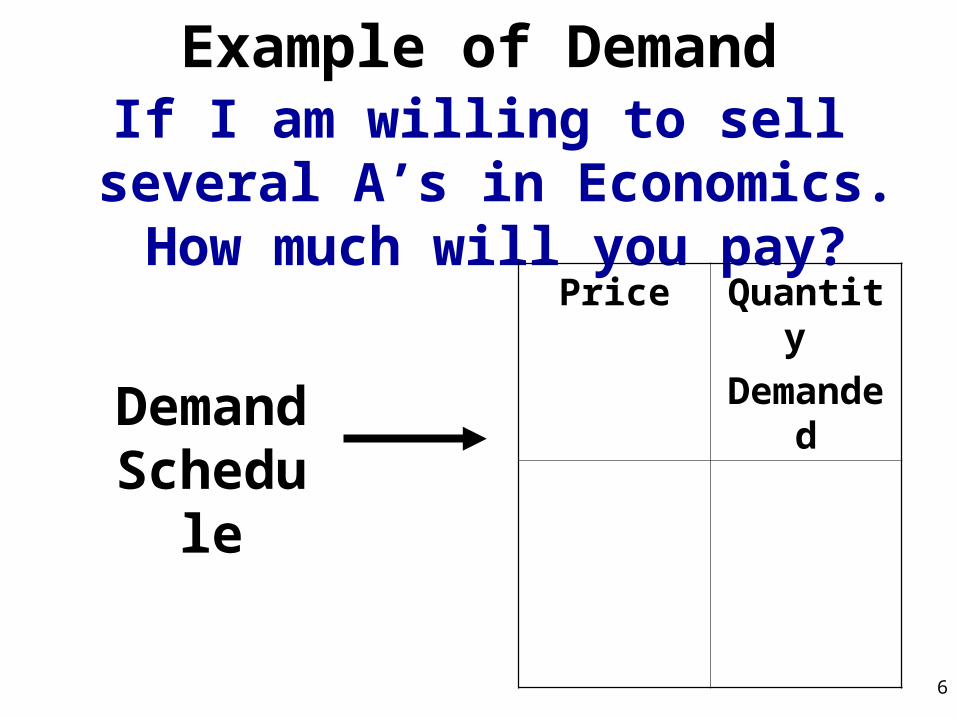
Example of DemandIf I am willing to sell several A’s in Economics. How much will you pay?
Price Quantity
Demanded
Demand Schedule
6

Why does the Law of Demand occur?
The law of demand is the result of three separate behavior patterns that overlap:
1.The Substitution effect
2.The Income effect
3.The Law of Diminishing Marginal Utility
We will define and explain each…
7

• If the price goes up for a product, consumer buy less of that product and more of another substitute product (and vice versa)
1. The Substitution Effect
• If the price goes down for a product, the purchasing power increases for consumers -allowing them to purchase more.
2. The Income Effect
Why does the Law of Demand occur?
8
• Utility = Satisfaction• We buy goods because we get utility from them• The law of diminishing marginal utility states that as you consume more
units of any good, the additional satisfaction from each additional unit will eventually start to decrease
• In other words, the more you buy of ANY GOOD the less satisfaction you get from each new unit.
Discussion Questions:1. What does this have to do with the Law of Demand?2. How does this effect the pricing of businesses?
3. Law of Diminishing Marginal Utility
Why does the Law of Demand occur?
U-TIL- IT-Y
9
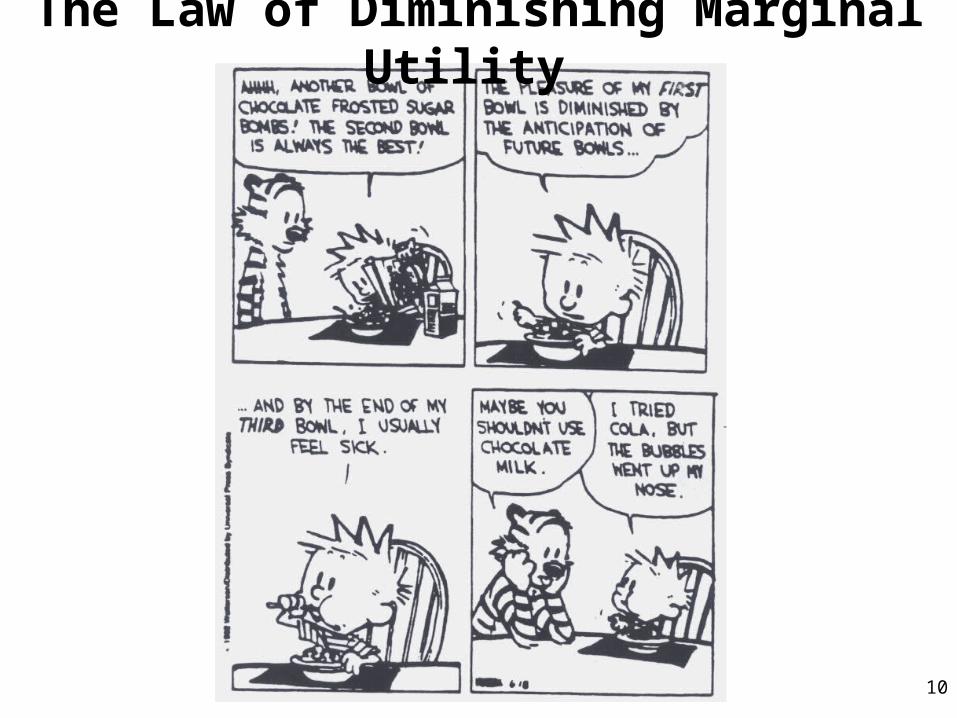
The Law of Diminishing Marginal Utility
10
Graphing Demand
11
The Demand Curve• A demand curve is a graphical representation of
a demand schedule.• The demand curve is downward sloping showing
the inverse relationship between price (on the y-axis) and quantity demanded (on the x-axis)
• When reading a demand curve, assume all outside factors, such as income, are held constant. (This is called ceteris paribus)
Let’s draw a new demand curve for cereal…
12
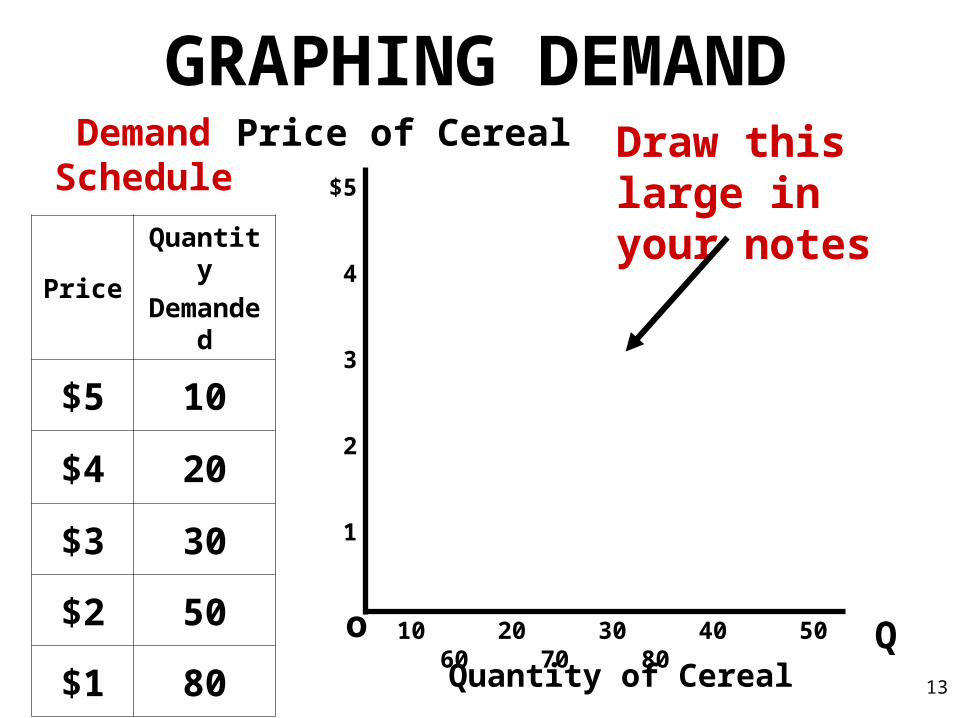
GRAPHING DEMAND
Qo
$5
4
3
2
1
Price of Cereal
Quantity of Cereal
Demand Schedule
10 20 30 40 50 60 70 80
Draw this large in your notes
13
PriceQuantity
Demanded
$5 10
$4 20
$3 30
$2 50
$1 80
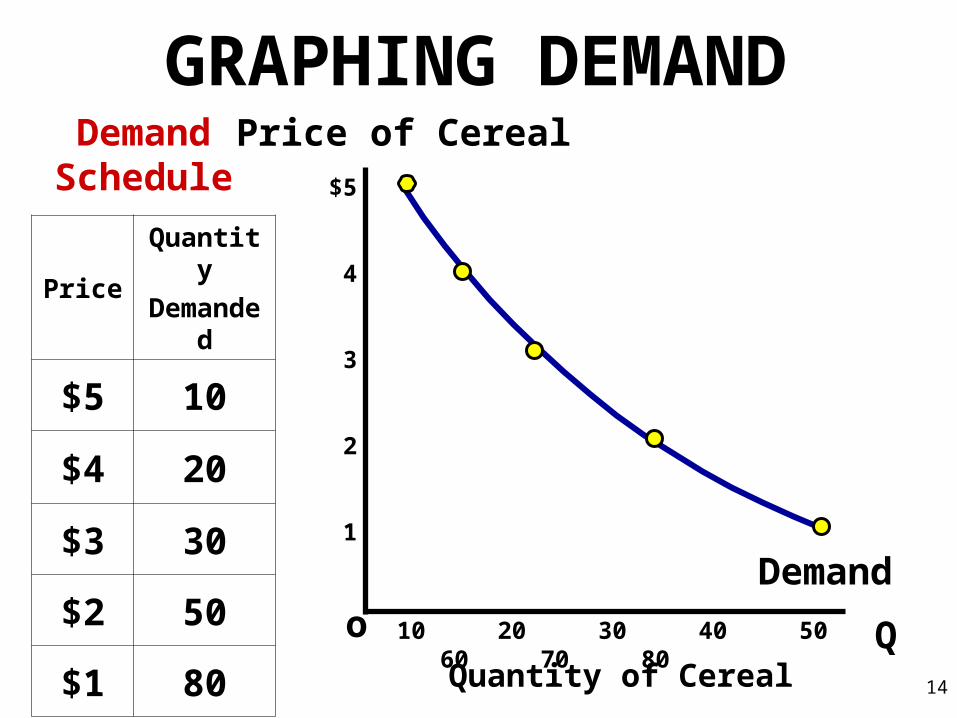
GRAPHING DEMAND
Qo
$5
4
3
2
1
Price of Cereal
Quantity of Cereal
Demand Schedule
10 20 30 40 50 60 70 80
14
PriceQuantity
Demanded
$5 10
$4 20
$3 30
$2 50
$1 80Demand
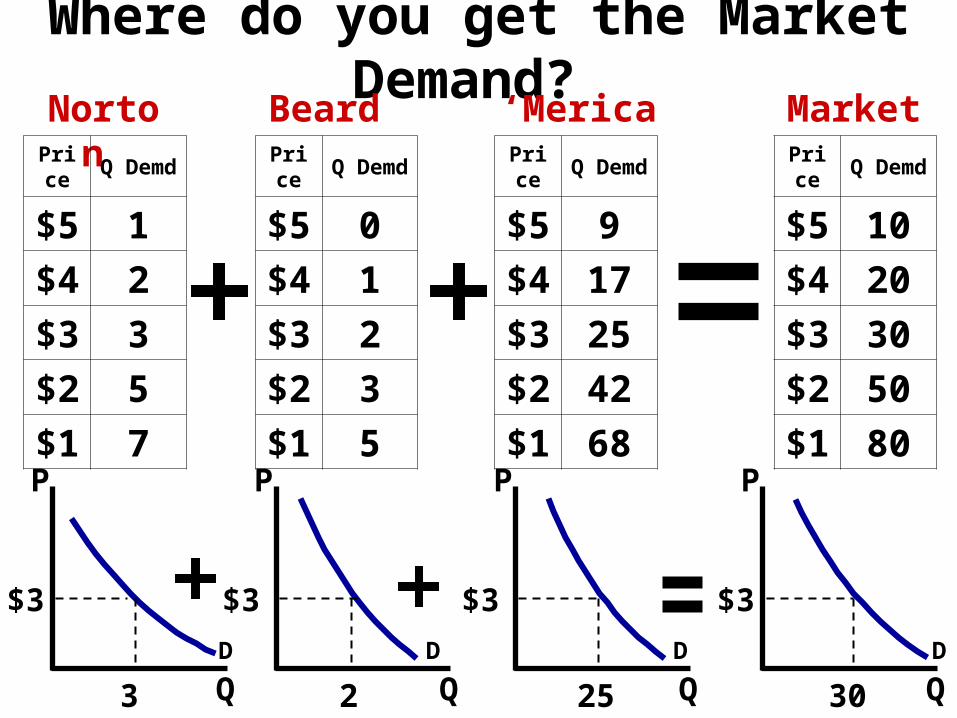
Where do you get the Market Demand?
Q
Norton Price Q Demd
$5 1
$4 2
$3 3
$2 5
$1 7
Beard ‘MericaPrice Q Demd
$5 0
$4 1
$3 2
$2 3
$1 5
Price Q Demd
$5 9
$4 17
$3 25
$2 42
$1 68
Price Q Demd
$5 10
$4 20
$3 30
$2 50
$1 80
Market
3
P
Q2
P
Q25
P
Q30
P
$3 $3 $3 $3
D DDD
16